Biases and debiasing Pat Croskerry MD, PhD. The Biases AffectiveCognitiveSocial/Cultural.
Upload
david-peeblesCategory
view
74download
0
A cognitive architecture-based modelling approach tounderstanding biases in visualisation behaviour
David Peebles
University of Huddersfield
November 8, 2014
David Peebles (University of Huddersfield) Cognitive architectures and visualisations November 8, 2014 1 / 16

Outline of the talk
Two aims of the research:
To understand at a very detailed level of analysis the processes bywhich people interact with external representations of information(cognitive science).
To develop artificial agents that can provide expert interpretations ofdata presented in external representations (AI).
Structure of the talk:
Human performance modelling.
Cognitive architectures.
ACT-R cognitive architecture.
A recent example: An ACT-R model of graph comprehension.
David Peebles (University of Huddersfield) Cognitive architectures and visualisations November 8, 2014 2 / 16
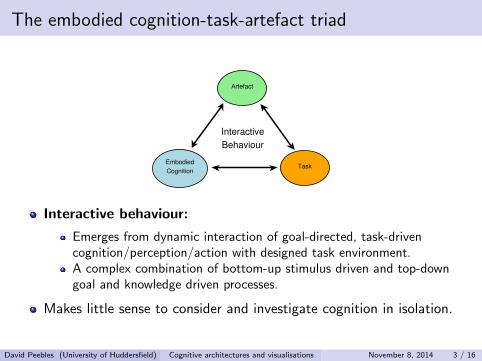
The embodied cognition-task-artefact triad
Embodied
CognitionTask
Artefact
Interactive
Behaviour
Interactive behaviour:
Emerges from dynamic interaction of goal-directed, task-drivencognition/perception/action with designed task environment.A complex combination of bottom-up stimulus driven and top-downgoal and knowledge driven processes.
Makes little sense to consider and investigate cognition in isolation.
David Peebles (University of Huddersfield) Cognitive architectures and visualisations November 8, 2014 3 / 16

Understanding behaviour with visualisations
Requires detailed understanding of the wide range of factors thataffect human performance.
Internal to the agent:
Domain and graphical representation knowledge (expertise)Working memory capacityStrategiesLearning/adaptation to task environment
External to the agent:
Computational affordancesEmergent/salient featuresGestalt principles of perceptual organisationTask and environment complexity
David Peebles (University of Huddersfield) Cognitive architectures and visualisations November 8, 2014 4 / 16
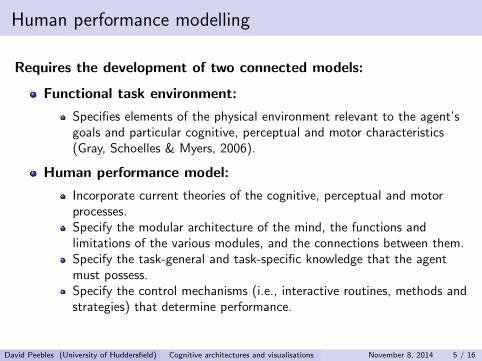
Human performance modelling
Requires the development of two connected models:
Functional task environment:
Specifies elements of the physical environment relevant to the agent’sgoals and particular cognitive, perceptual and motor characteristics(Gray, Schoelles & Myers, 2006).
Human performance model:
Incorporate current theories of the cognitive, perceptual and motorprocesses.Specify the modular architecture of the mind, the functions andlimitations of the various modules, and the connections between them.Specify the task-general and task-specific knowledge that the agentmust possess.Specify the control mechanisms (i.e., interactive routines, methods andstrategies) that determine performance.
David Peebles (University of Huddersfield) Cognitive architectures and visualisations November 8, 2014 5 / 16

Cognitive architectures
Theories of how the permanent computational structures andprocesses that underlie intelligent behaviour are organised.
“Unified theories of cognition” (Newell, 1990)
Three main symbolic cognitive architectures: Soar (Newell, 1990;Laird, 2012), Epic (Kieras & Meyer, 1997), ACT-R (Anderson, 2007)
All three based on production system architecture.
All can interact with simulated task environments to modelinteraction with external representations.
David Peebles (University of Huddersfield) Cognitive architectures and visualisations November 8, 2014 6 / 16
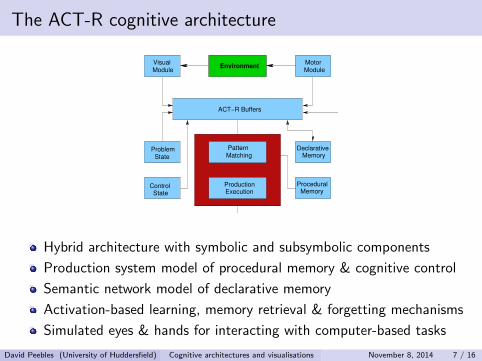
The ACT-R cognitive architecture
VisualModule
ACT−R Buffers
Environment
PatternMatching
ExecutionProduction
ModuleMotor
ProblemState
DeclarativeMemory
ProceduralMemory
ControlState
Hybrid architecture with symbolic and subsymbolic components
Production system model of procedural memory & cognitive control
Semantic network model of declarative memory
Activation-based learning, memory retrieval & forgetting mechanisms
Simulated eyes & hands for interacting with computer-based tasks
David Peebles (University of Huddersfield) Cognitive architectures and visualisations November 8, 2014 7 / 16

Graph comprehension
Initial familiarisation stage priorto other tasks involving:
Identification & classificationof variables into IV(s) and DVAssociation of variables withaxes and representationalfeatures (e.g., colours, shapes,line styles)Identification ofrelationship(s) depicted
May be an end in itself or aprerequisite for other tasks
David Peebles (University of Huddersfield) Cognitive architectures and visualisations November 8, 2014 8 / 16
Interaction graphs
Low High
10
20
30
40
50
60
70
80
90
100
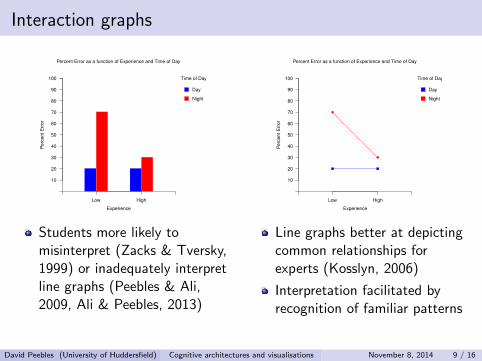
Percent Error as a function of Experience and Time of Day
Perc
ent E
rror
Experience
Time of Day
Day
Night
Students more likely tomisinterpret (Zacks & Tversky,1999) or inadequately interpretline graphs (Peebles & Ali,2009, Ali & Peebles, 2013)
Low High
10
20
30
40
50
60
70
80
90
100
●
●
Percent Error as a function of Experience and Time of Day
Perc
ent E
rror
Experience
Time of Day
Day
Night
Line graphs better at depictingcommon relationships forexperts (Kosslyn, 2006)
Interpretation facilitated byrecognition of familiar patterns
David Peebles (University of Huddersfield) Cognitive architectures and visualisations November 8, 2014 9 / 16
An example expert verbal protocol
High Low
0
25
50
75
100
125
150
175
200
225
250
●
●
●
●
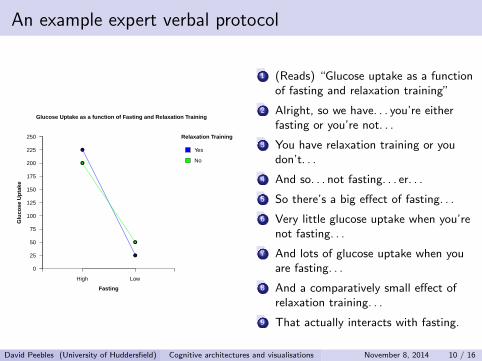
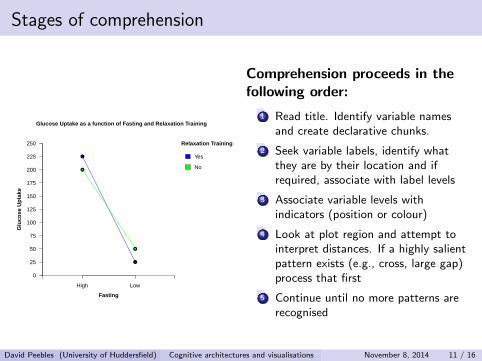
Glucose Uptake as a function of Fasting and Relaxation Training
Glu
cose
Upt
ake
Fasting
Relaxation Training
Yes
No
1 (Reads) “Glucose uptake as a functionof fasting and relaxation training”
2 Alright, so we have. . . you’re eitherfasting or you’re not. . .
3 You have relaxation training or youdon’t. . .
4 And so. . . not fasting. . . er. . .
5 So there’s a big effect of fasting. . .
6 Very little glucose uptake when you’renot fasting. . .
7 And lots of glucose uptake when youare fasting. . .
8 And a comparatively small effect ofrelaxation training. . .
9 That actually interacts with fasting.
David Peebles (University of Huddersfield) Cognitive architectures and visualisations November 8, 2014 10 / 16
Stages of comprehension
High Low
0
25
50
75
100
125
150
175
200
225
250
●
●
●
●
Glucose Uptake as a function of Fasting and Relaxation Training
Glu
cose
Upt
ake
Fasting
Relaxation Training
Yes
No
Comprehension proceeds in thefollowing order:
1 Read title. Identify variable namesand create declarative chunks.
2 Seek variable labels, identify whatthey are by their location and ifrequired, associate with label levels
3 Associate variable levels withindicators (position or colour)
4 Look at plot region and attempt tointerpret distances. If a highly salientpattern exists (e.g., cross, large gap)process that first
5 Continue until no more patterns arerecognised
David Peebles (University of Huddersfield) Cognitive architectures and visualisations November 8, 2014 11 / 16

Videos of the model
David Peebles (University of Huddersfield) Cognitive architectures and visualisations November 8, 2014 12 / 16

An example model protocol
Artificial Natural
0
5
10
15
20
25
30
35
40
45
50
●
●
●
●
Chick Weight as a function of Diet and Hormone Supplement
Chi
ck W
eigh
t
Diet
Hormone Supplement
MPE
GCE
text at top of display. . .[chickweight] [= variable][as] [a] [function] [of] [diet] [= variable][and] [hormonesupplement] [= variable]
text at bottom of display. . .[diet] at [bottom] [= IV]look to nearest text. . .[natural] is a level of [diet][natural] is [right][artificial] is a level of [diet][artificial] is [left]
text at far right of display. . .[hormonesupplement] at [far-right] [= IV]look to nearest text. . .[mpe] is a level of [hormonesupplement][gce] is a level of [hormonesupplement]
David Peebles (University of Huddersfield) Cognitive architectures and visualisations November 8, 2014 13 / 16

An example model protocol
Artificial Natural
0
5
10
15
20
25
30
35
40
45
50
●
●
●
●
Chick Weight as a function of Diet and Hormone Supplement
Chi
ck W
eigh
t
Diet
Hormone Supplement
MPE
GCE
objects in plot region. . .a [green] [line]no memory for [green] look to legend. . .[green] [rectangle]. look for nearest text. . .[green] represents [gce][blue] [rectangle]. look for nearest text. . .[blue] represents [mpe]
text at far left of display. . .[chickweight] at [far-left] [= DV]
look to pattern. . .substantial difference between legend levels. . .[0.2] diff [blue] = [small] effect [mpe][0.2] diff [green] = [small] effect [gce]
compare [blue] and [green] levels. . .[moderate] diff: [gce] greater than [mpe][moderate] [main] effect [hormonesupplement]
David Peebles (University of Huddersfield) Cognitive architectures and visualisations November 8, 2014 14 / 16
An example model protocol
Artificial Natural
0
5
10
15
20
25
30
35
40
45
50
●
●
●
●
Chick Weight as a function of Diet and Hormone Supplement
Chi
ck W
eigh
t
Diet
Hormone Supplement
MPE
GCE
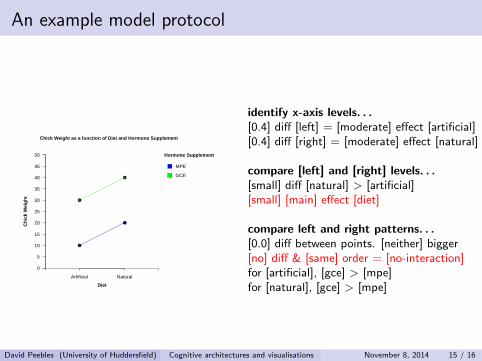
identify x-axis levels. . .[0.4] diff [left] = [moderate] effect [artificial][0.4] diff [right] = [moderate] effect [natural]
compare [left] and [right] levels. . .[small] diff [natural] > [artificial][small] [main] effect [diet]
compare left and right patterns. . .[0.0] diff between points. [neither] bigger[no] diff & [same] order = [no-interaction]for [artificial], [gce] > [mpe]for [natural], [gce] > [mpe]
David Peebles (University of Huddersfield) Cognitive architectures and visualisations November 8, 2014 15 / 16

Summary
ACT-R is a powerful, empirically verified, tool for creating models ofinteractive behaviour with complex task environments.
Model output (errors, task completion times, eye movements, verbalprotocols) can be compared with human data.
Contains learning mechanisms to model adaptation to taskenvironment and development of expertise.
Can be used as a platform for creating human-level artificial agents tointerpret graphical representations and visualisations.
David Peebles (University of Huddersfield) Cognitive architectures and visualisations November 8, 2014 16 / 16