Kernelized Discriminant Analysis and Adaptive Methods for Discriminant Analysis
Upload
jiwoong-kimCategory
view
212download
0
METHODOLOGY ARTICLE Open Access
A classification approach for genotyping viralsequences based on multidimensional scalingand linear discriminant analysisJiwoong Kim1,2, Yongju Ahn1,3, Kichan Lee1, Sung Hee Park1, Sangsoo Kim1*
Abstract
Background: Accurate classification into genotypes is critical in understanding evolution of divergent viruses. Herewe report a new approach, MuLDAS, which classifies a query sequence based on the statistical genotype modelslearned from the known sequences. Thus, MuLDAS utilizes full spectra of well characterized sequences asreferences, typically of an order of hundreds, in order to estimate the significance of each genotype assignment.
Results: MuLDAS starts by aligning the query sequence to the reference multiple sequence alignment andcalculating the subsequent distance matrix among the sequences. They are then mapped to a principal coordinatespace by multidimensional scaling, and the coordinates of the reference sequences are used as features indeveloping linear discriminant models that partition the space by genotype. The genotype of the query is thengiven as the maximum a posteriori estimate. MuLDAS tests the model confidence by leave-one-out cross-validationand also provides some heuristics for the detection of ‘outlier’ sequences that fall far outside or in-betweengenotype clusters. We have tested our method by classifying HIV-1 and HCV nucleotide sequences downloadedfrom NCBI GenBank, achieving the overall concordance rates of 99.3% and 96.6%, respectively, with the benchmarktest dataset retrieved from the respective databases of Los Alamos National Laboratory.
Conclusions: The highly accurate genotype assignment coupled with several measures for evaluating the resultsmakes MuLDAS useful in analyzing the sequences of rapidly evolving viruses such as HIV-1 and HCV. A web-basedgenotype prediction server is available at http://www.muldas.org/MuLDAS/.
BackgroundWe are observing rapid growth in the number of viralsequences in the public databases [1]: for example, HIV-1 and HCV sequence entries in NCBI GenBank havedoubled almost every three years. These viruses alsoshow great genotypic diversities and thus have beenclassified into groups, so-called genotypes and subtypes[2,3]. Consequently classifying these virus strains intogenotypes or subtypes based on their sequence similari-ties has become one of the most basic steps in under-standing their evolution, epidemiology and developingantiviral therapies or vaccines. The conventional classifi-cation methods include the following: (1) the nearestneighbour methods that look for the best match of the
query to the representatives of each genotype, so-calledreferences (e.g., [4]); (2) the phylogenetic methods thatlook for the monophyletic group to which the querybranches (e.g., [5]). Since the genotypes have beendefined originally as separately clustered groups, theseintuitively sound methods have been widely used andquite successful for many cases.However, with increasing numbers of sequences, we
are observing outliers that cannot be clearly classified(e.g., [6]) or for which these methods do not agree.A recent report that compared these different automaticmethods with HIV-1 sequences showed less than 50%agreement among them except for subtypes B and C[7]. One of the reasons for the disagreement was attrib-uted to the increasing divergence and complexity causedby recombination. It was also noted that closely relatedsubtypes (B and D) or the subtypes sharing commonorigin (A and CRF01_AE) showed poor concordance
* Correspondence: [email protected] of Bioinformatics & Life Sciences, Soongsil University, Seoul,156-743, KoreaFull list of author information is available at the end of the article
Kim et al. BMC Bioinformatics 2010, 11:434http://www.biomedcentral.com/1471-2105/11/434
© 2010 Kim et al; licensee BioMed Central Ltd. This is an Open Access article distributed under the terms of the Creative CommonsAttribution License (http://creativecommons.org/licenses/by/2.0), which permits unrestricted use, distribution, and reproduction inany medium, provided the original work is properly cited.

rate among those methods. We think what lies at thebottom of this problem is that the number of referencesequences per subtype was too small; these methodshave used two to four reference sequences. Having beencarefully chosen by experts among the high-qualitywhole-genome sequences, they are to cover the diversityof each subtype as much as possible [2]. However withintrinsically small numbers of references per subtype,they cannot address the confidence of subtype predic-tions; a low E-value of a pairwise alignment or a highbootstrap value of a phylogenetic tree indicates the relia-bility of the unit operation, but does not necessarilyguarantee a confident classification.Recognition of this issue of lacking a statistical confi-
dence measure, brought about the introduction of theprobabilistic methods based on either position-specificscoring matrix [8] or jumping Hidden Markov Models(jpHMM) [9-11] built from multiple sequence alignment(MSA) of each genotype. By using full spectra of
reference sequences, jpHMM was effective in detectingrecombination breakpoints. Recently, new classificationmethods based on nucleotide composition strings havebeen introduced [12]. It is unique in that it bypasses themultiple sequence alignment and still achieves highaccuracy. However, it uses only 42 reference sequencesand has been tested with 1,156 sequences. Consideringthe explosive increase in the numbers of these viralsequences, the test cases of these conventional methodswere rather small, an order of ten thousands at most. Itwould be desirable to measure the performance of anew classification method over all the sequences pub-licly available.It is critical to evaluate how well each genotype popu-
lation is clustered, before attempting to classify a querysequence. Consider a case where the referencesequences are mostly well segregated by genotype exceptfor two or more genotypes that overlap at least partially(see Figure 1 for an illustration); those methods that rely
Figure 1 A schematic diagram illustrating the concept of classification of a viral sequence. The filled spheres represent known sequencesthat have been clustered into four groups, a through d, the boundaries of which are depicted by black circles. Suppose the dark spheres ineach cluster represent the respective reference sequences and the red asterisk denotes a query sequence. Since the query is located at theinterface of b and d clusters, its genotype (or subtype) is elusive. On the other hand, a nearest neighbour method may assign it to the nearestreference sequence, which happens to be d in this example. If the classification method does not take into account the clustering patterns ofthe known sequences and relies on the distances to the nearest reference sequences, its result may not be robust to the choice of references.
Kim et al. BMC Bioinformatics 2010, 11:434http://www.biomedcentral.com/1471-2105/11/434
Page 2 of 18
on a few references may not notice this problem andmay assign an apparent genotype with a high score. Dueto varying mutation rate along the sequence range, thephylogenetic power of each gene segment may also vary[13]. This is particularly critical for relatively short par-tial sequences. In other words, even the well character-ized references that are otherwise distinctively clusteredmay not be resolved if only part of the sequence regionis considered in the classification. The nearest neighbourmethods do not evaluate this validity of the backgroundclassification models, since they concern the alignmentsof only query-to-reference, not reference-to-reference.REGA, one of the tree-based methods, concerns whetherthe query is inside or outside the cluster formed by agroup of references [5]. The branching index has beenproposed to quantify this and has been useful in detect-ing outlier sequences [14,15]. A statistical method,jpHMM, reports the posterior probabilities of the sub-types at each query sequence position; based on these,some heuristics is given to assess the uncertainty indetecting recombination region [11].Here we present a new method, MuLDAS, which
develops the background classification models based onthe distances among the reference sequences, re-evalu-ates their validity for each query, and reports the statis-tical significance of genotype assignment in terms ofposterior probabilities. As such, it is suited for the caseswhere many reference sequences are available. MuLDASachieves such goals by combining principal coordinateanalysis (PCoA) [16] with linear discriminant analysis(LDA), both of which are well established statisticaltools with popular usages in biological sciences. PCoA,also known as classical multidimensional scaling (MDS),maps the sequences to a high-dimensional principalcoordinate space, while trying to preserve the distancerelationships among them as much as possible. It hasbeen widely applied to the discovery of global trends ina sequence set, complementing tree-based methods inphylogenetic analysis [17,18]. Since genotypes have beendefined as distinct monophyletic groups in a phyloge-netic tree, each genotype should form a well separatedcluster in a MDS space if an appropriately high dimen-sion is chosen. In such cases, we can find a set of hyper-planes that separate these clusters and classify a queryrelative to the hyperplanes. For this purpose, MuLDASapplies LDA [19], a straightforward and powerful classi-fication method, to the MDS coordinates and assigns aquery to the genotype that shows the highest posteriorprobability of membership. This probability can be use-ful in detecting any ambiguous cases, for which carefulexamination is required. MuLDAS tests the LDA modelsthrough the leave-one-out cross-validation (LOOCV),which can be used to assess the model validity by exam-ining the misclassification rate. As the sequences are
represented by coordinates, a simple measure can bealso developed for detecting genotype outliers. We havetested the algorithm with virtually all the HIV-1 andHCV sequences available from NCBI GenBank and theresults are presented.
MethodsOverall ProcessA flowchart of the algorithm is shown in Figure 2. MuL-DAS starts the process by creating a multiple sequencealignment (MSA) of the query with the referencesequences. MuLDAS requires a large number of refer-ences, which should be of high quality and with care-fully assigned genotypes. Los Alamos NationalLaboratory (LANL) databases distribute such MSAs ofHIV-1 http://www.hiv.lanl.gov/ and HCV http://hcv.lanl.gov/ sequences. LANL also provides the genotype infor-mation on each sequence in the MSA. A total of 3,591nucleotide sequences were included in the 2007 releaseof HIV-1 MSAs (Supplementary Table 1 in AdditionalFile 1), while a total of 3,093 nucleotide sequences werein HCV MSAs (Supplementary Table 2 in AdditionalFile 1). It should be noted that for some genotypes,more than 100 sequences were found in the MSA, whilethere were rare genotypes for which only a few refer-ence sequences were included [20,21]. This imbalance insample sizes is a serious problem to MuLDAS but wepropose rather a heuristic solution that is based on theglobal variance (vide infra). For a fair comparison withother methods, we decided to honour the MSA of refer-ence sequences already available from the public data-bases by aligning the query to this reference MSA,rather than creating MSA by ourselves. This has theadvantage of saving the execution time, which is crucialfor a web server application (see the section ‘Web serverdevelopment’). The suit of programs, hmmbuild,hmmcalibrate, and hmmalign http://hmmer.janelia.org/are used for this step. After removing indels in the MSAusing a PERL script, the pairwise distance matrix amongthese sequences is calculated using distmat of EMBOSSpackage http://emboss.sourceforge.net/ with the Jukes-Cantor correction.The next step is so-called principal coordinate analysis
(PCoA), which turns the distance matrix to a matrixwhose components are equivalent to the inner productsof the sought coordinates. Through singular valuedecomposition of the resulting matrix, a set of eigenvec-tors and associated eigenvalues are obtained up to thespecified lower dimensions. The multidimensional coor-dinates of the sequences whose pairwise Euclidean dis-tances approximate the original distances, are thenrecovered from a simple matrix operation involving theeigenvectors and eigenvalues (for details see [16]). Eacheigenvalue is the amount of variance captured along the
Kim et al. BMC Bioinformatics 2010, 11:434http://www.biomedcentral.com/1471-2105/11/434
Page 3 of 18

Figure 2 A flowchart of the algorithm for a given gene segment. MuLDAS starts by aligning the query with the pre-maid MSA of referencesequences, which includes CRFs in HIV-1. Through this, the gene segments to which the query maps are identified and the whole process isrepeated over these gene segments. After distance matrix is obtained, MDS and LDA are performed to classify the query. In HIV-1, only themajor groups are used in this step. The genotype gives rise to the best posterior probability is reported as the major genotype. If nested analysisis not required as for HCV, the process stops here. Otherwise as for HIV-1, an additional process called nested analysis (shown in red) isperformed. For the major analysis, the genotypes that give rise to P > 0.01 and their associated CRFs are identified, and the subset of thedistance matrix corresponding to these genotypes is excised from the original matrix saved in the major analysis. After MDS and LDA, the bestgenotype is reported as the nested genotype. Once both nested and major genotypes are determined, a decision process outlined at the bottomproceeds from left to right and suggests the final outcome (see “a proposed process for subtype decision” section for details).
Kim et al. BMC Bioinformatics 2010, 11:434http://www.biomedcentral.com/1471-2105/11/434
Page 4 of 18

axis defined by the corresponding eigenvector, alsocalled as the principal coordinate (PC). For conveniencethe eigenvalues are sorted in descending order anddimensionality reduction is achieved by taking the topfew components. If the within-group variation is negligi-ble, the number of top PCs or the MDS dimensionality,k, should be at most N-1, where N is the number ofreference groups. However, depending on the sequence
region considered, a genotype might show a complexclustering pattern, splitting into more than one cluster.Consequently we took an empirical approach that sur-veyed the cross-validation error of the referencesequences for k ranging from 1 to 50 (see the next sub-section). This step is implemented with cmdscale in theR statistical system http://www.r-project.org/. See Figure3 for an exemplary plot of the MDS result.
Figure 3 An exemplary MDS plot of HIV-1 sequences along the first (V1), second (V2), and third (V3) principal coordinate axes. Thereference sequences were shown as small circles colour-coded according to their subtypes. For clarity the subtypes F-K were not labelled. Thequery was located in the middle of subtype B (’+’). The image was created with GGobi http://www.ggobi.org/.
Kim et al. BMC Bioinformatics 2010, 11:434http://www.biomedcentral.com/1471-2105/11/434
Page 5 of 18

The last step of MuLDAS is to develop the discrimi-nant models that best classify the references accordingto their genotypes and assign the genotype membershipto the query according to the models. Here one canenvisage applying various classification methods such asK-Nearest Neighbour (K-NN), Support Vector Machine(SVM), and linear classifiers, among others. If the refer-ences are well clustered according to their genotypemembership, then the simplest methods such as lineardiscriminant analysis (LDA) or quadratic discriminantanalysis (QDA) should work. Both of them work by fit-ting a Gaussian distribution function to each group cen-tre, while the difference between them is whether global(LDA) or group (QDA) covariance is used. Since it canbe expected that the within-group divergences may dif-fer from one group to another, QDA may be better sui-ted. However, the sample size imbalance issuementioned above prevents applying QDA as it becomesunstable with a small number of references for somegenotypes. On the other hand, LDA applies the globalcovariance commonly to all the genotypes and thus maybe more robust to this issue. Although it is not as rigor-ous as QDA, this heuristic approach works reasonablywell as long as the group divergences are not too differ-ent from one to another. Once the linear discriminantsare calculated based on the reference sequences, theposterior probability of belonging to a particular groupis given as a function of so-called Mahalanobis distancefrom the query to the group centre [19]. To the query,the maximum a posteriori (MAP) estimate, that is, thegenotype having the maximum probability is thenassigned. The posterior probability is scaled by the priorthat is proportional to the number of references foreach genotype. This step is implemented with lda ofMASS package in the R statistical system http://www.r-project.org/.
Cross-Validation of the Prediction ModelsThe validity of the linear discriminant models areassessed by LOOCV of the genotype membership of thereference sequences. For each one of the references, itsgenotype is predicted by the models generated from therest of the references. The misclassification error rate,which is the ratio of the number of misclassified refer-ences to the total number of references participated inthe validation, is a sensitive measure of the backgroundclassification power. Many viral sequences in the publicdatabases are not of the whole genome but cover only afew genes or a part of a gene, and thus their phyloge-netic signal may be variable [13]. Consequently we re-evaluate the classification power of each predictionusing LOOCV. If the reference sequences are not wellresolved in the MDS space for a given query, it would
be evident in LOOCV, resulting in a high misclassifica-tion rate.
Outlier DetectionEven if the references are well separated by genotypewith a low LOOCV error rate, it might be possible thatthe query sequence itself is abnormal: it could be a com-posite of two or more genotypes, located in the middleof several genotypes (a recombinant case); it might beclose to only one genotype cluster (having a posteriorP value close to 1 for that subtype) but far outside thecluster periphery (a divergent case). In the field of multi-variate analysis, it is customary to detect outliers by cal-culating Mahalanobis distance from the sample centreand by comparing it with a chi-square distribution [22].As the Mahalanobis distances have already been incor-porated into the calculation of the LDA posterior prob-ability, we propose a measure somewhat distinct,namely, outlierness, O, which is the Euclidian distancefrom the query to the cluster centre relative to the max-imum divergence of the references belonging to thatsubtype along that direction:
OXQ XC
R SXR XC XQ XC
=−
∈− ⋅ −⎡⎣ ⎤⎦
2
max ( ) ( )(1)
where XQ, XR, and XC are the MDS vectors of thequery, one of the references, and the centre of thereference group, S, respectively. The group, S, containsall the reference sequences belonging to the genotypeto which the query has been classified. If O is smallerthan 1.0, the query is well inside the cluster, and out-side otherwise. We can develop a simple heuristic filterbased on this: for example, a threshold can be set at2.0 in order to tolerate some divergence. A similarmeasure, the branching index, has been devised fortree-based methods to detect outlier sequences bymeasuring the relative distance from the node of thequery to the most recent common ancestor (MRCA)of the genotype cluster [14,15]. See SupplementaryNote 1 in Additional File 2 for the comparison of ‘out-lierness’ with the branching index. If a truly new geno-type is emerging, MuLDAS may classify suchsequences into one of the genotypes (a nominal geno-type). Their posterior probabilities may be very highbut the ‘outlierness’ values from the nominal groupwould be also very high. We simulated such a situationby leaving all the reference sequences of a given geno-type out and classifying them based on the referencesequences from the other groups only. Indeed O valueswere consistently large. See Supplementary Note 2 inAdditional File 2 for details.
Kim et al. BMC Bioinformatics 2010, 11:434http://www.biomedcentral.com/1471-2105/11/434
Page 6 of 18

Nested Analysis for Recombinant DetectionThere are a number of methods for characterizingrecombinant viral strains [23]. Similar to the tree-basedbootscanning method [24], MuLDAS can be run alongthe sequence in sliding windows to locate the recombi-nation spot. It is applicable to long sequences only andtakes too much time to be served practically throughweb for a tool such as MuLDAS that relies on largesample sizes unless a cluster farm having several hun-dred CPUs is employed. Rather than attempting todetect de novo recombinant forms by performing slid-ing-window runs, we classify the query to the welldefined common recombinant forms by the followingapproaches: (a) predicting genotypes gene by gene for aquery that encompass more than one gene; (b) re-itera-tion of the analysis in a ‘nested’ fashion that includesrecombinant reference sequences. HIV-1 and HCV con-tains an order of 10 genes and thus gene by gene analy-sis of a whole genome sequence may take 10 timeslonger than a single gene analysis. If different genotypesare assigned with high confidences to different gene seg-ments of a query, it may hint a recombinant case. Forsome recombinants, the breakpoint may occur in themiddle of a gene. In such cases, it is likely that the pos-terior probability of classification is not dominated byjust one genotype but the second or so would have anon-negligible P value. We re-iterate the prediction pro-cess in a ‘nested’ fashion by focusing on the genotypeshaving the P value greater than 0.01 and the associatedcommon recombinant genotypes. For example, thereferences in the ‘nested’ round of HIV-1 classificationwould include CRF02_AG group if the P value of eitherA or G group were greater than 0.01. We have imple-mented this procedure for classifying HIV-1 sequences,for which some common recombinant groups known ascirculating recombinant forms (CRFs) have beendescribed [2]. Although recombinant forms have beenknown for HCV, no formal definitions of commonforms are available at the moment [3].One may argue in favour of an alternative approach
where the reference CRF sequences are included intothe MSA of the major group sequences and do the clas-sification in a single operation. In multidimensional scal-ing, both divergent and close sequences are mapped tothe same space, the latter are not well resolved. As CRFsequences are often clustered near their ostensible non-recombinant forms, they are not resolved if they areincluded in the MSA with all the other major groupsequences.
Web Server DevelopmentApache web servers that accept a nucleotide sequence asa query and predicts the genotype for each gene seg-ment of the query has been developed, one for each of
HIV-1 and HCV. These are freely accessible at http://www.muldas.org/MuLDAS/. Each CGI program writtenin PERL wraps the component programs that have beendownloaded from the respective distribution web sitesof HMMER, EMBOSS, and R. As the calculation of dis-tance matrix consumes much of the run time, we splitthe task into several, typically four, computationalnodes, each of which calculates parts of the rows in par-allel, and the results are integrated by the master node.A typical subtype prediction of a 1000-bp HIV-1 nucleo-tide sequence takes around 20 seconds on an Intel XeonCPU Linux box. The web servers report the MAP geno-type of the query as well as the posterior P for eachgenotype, the leave-one-out cross-validation result ofthe prediction models, and the outlier detection result(see Supplementary Figure 1 in Additional File 3 forscreenshots). The 3 D plot of the query and the refer-ences in the top three PCs are given in PNG format andan XML file describing all the PCs of the query and thereferences can be downloaded for a subsequent dynamicinteractive visualization with GGobi http://www.ggobi.org/ (Figure 3). This is particularly useful for visuallyexamining the quality of clustering and for confirmingthe outlier detection result that may lead to the discern-ment of potential new types or recombinants. If thenumber of reference sequences for a particular geno-type, the classification by MuLDAS would be subopti-mal. In such cases, interactive visualization of theclustering pattern using GGobi may also be useful. ForHIV-1, the ‘nested’ analysis as described above is re-iter-ated and the result is reported as well.
Results and DiscussionThe MuLDAS algorithm was tested with the sequencedatasets of HIV-1 and HCV downloaded from NCBIGenBank. The genotype information of nucleotidesequences was retrieved from the LANL website for158,578 HIV-1 (including 6,203 CRFs) and 40,378 HCVsequences (non-recombinants only) that have not beenused as the reference sequences. For some of thesequences, the genotypes/subtypes were given by theoriginal submitters and otherwise they were assigned byLANL. We considered these datasets as ‘gold standards’for benchmarking the performance of MuLDAS.
Genotype/Subtype nomenclatures of the test datasetsHIV-1 sequences are grouped into M (main), N (non-main), U (unclassified) and O (outgroup) groups [2].Most of the sequences available belong to M group. AsN and O groups are quite distant from M group, thesubtypes of M group cannot be well resolved in theMDS plot that includes these remote groups. Conse-quently, we focused on classifying M group sequencesinto subtypes, A-D, F-H, J, and K. Among M group
Kim et al. BMC Bioinformatics 2010, 11:434http://www.biomedcentral.com/1471-2105/11/434
Page 7 of 18
subtypes, A and F are sometimes further split into sub-subtypes, A1 and A2, and F1 and F2, respectively [2].However, some new sequences were still being reportedat the subtype level in the LANL database. This was thecase even to the sequences included in MSA producedby LANL. Resolving sub-subtypes for relatively shortsequences using MuLDAS would require a ‘nested’ ana-lysis using the relevant subtype sequences only. Due tothese reasons, we did not attempt to distinguish sub-subtypes and classified them at the subtype level. Differ-ent subtypes of the M group sequences may recombineto form a new strain [1]. If these strains were found inmore than three epidemiologically independent patients,they are called circulating recombinant forms (CRFs).Among the CRFs, CRF01_AE was formed by recombina-tion of A and now extinct E strains, and constitutes alarge family that is distinct from subtype A [2]. We havecalled the M group and CRF01_AE subtypes as the‘major’ subtypes and the MuLDAS run against them asthe ‘major’ analysis. Supplementary Table 3(a) in Addi-tional File 1 lists the breakdown of the statistics by sub-types and gene segments of all the test nucleotidesequences that have been classified to the ‘major’ groupsby LANL. The distribution was far from uniform, repre-senting study biases: sequences belonged to subtypes H,J, and K were rare; especially for auxiliary proteins suchas vif and vpr, non-B strains were too rare to evaluatethe classification accuracy.HCV sequences are now classified as genotypes 1
through 6 and their subtypes are suffixed by a lowercase alphabet: for example, 1a, 2k, 6h and so on [3].The multiple sequence alignments downloaded from theLANL website included only a few sequences per sub-type that were to be used as references by MuLDAS,making it difficult to apply MuLDAS at the subtypelevel. Since these genotypes were roughly equidistantfrom each other [3], MuLDAS was applied at the geno-type level, and all the subtypes from a genotype werelumped together into a group. See SupplementaryTables 4(a) in Additional File 1 for the breakdown ofHCV nucleotide sequences, respectively.
Determination of MDS dimensionality and assessment ofmodel validityThe discriminant models are built solely from the refer-ence sequences and thus their validity is largely irrele-vant to the query sequence itself. On the hand, whatgene and which portion of the genome the query corre-sponds to are critical to the discriminatory power as thephylogenetic signal varies along the genome [13,25]. Weaddress this issue by using the LOOCV error rates,which are measured by counting the referencesequences that are misclassified from the class predic-tion based on the rest of the references. First we looked
for the optimum MDS dimensionality, k, by surveyingthe error rates for each whole gene segment. We, then,surveyed the error rates in sliding windows of each genesegment with that k. It is expected that the classificationpower of our discriminant models will increase byrepresenting the sequences in higher and higher k. Wesurveyed the misclassification error rate from LOOCVruns by varying k from 1 through 50. As shown in Fig-ure 4, the error rates dropped quickly, reaching a pla-teau for k > = 10. Except for HIV-1 5’-tat, excellentperformance (error rate < 5%) was observed with k > =10. For HIV-1, short gene segments generally showedpoorer performance. While there is no noticeableincrease in computational overhead in incrementing kfrom 10 to 50, higher k might fall into overfitting. Wetherefore use k = 10 throughout the analysis, while theprediction web server allows changing this parameter.We, then, measured the variation in discriminatory
power along the genome or for each gene segment bymeasuring LOOCV error rates in sliding windows (100bp windows in 10 bp step). Representative plots forHIV-1 env and HCV e2 are shown in Figure 5 (see Sup-plementary Figures 2 and 3 in Additional File 3 for fulllistings). In general, the error rates were fairly low alongthe gene segment, although some distinct peaks wereobserved. The dominant peak seen in HIV-1 env andHCV e2 corresponds to V3 loop and HVR1, respectively.If the query sequence is composed of primarily of theseregions, the high sequence variability is likely to causesuboptimal performance of MuLDAS or any other geno-typing tools. In tree-based methods, this will createbranches composed of mixed genotypes. In such cases,the assessment of the clustering quality would be ambig-uous. On the other hand, MuLDAS provides severalmeans for quality assurance: a LOOCV error rate, pos-terior probabilities of membership, and an ability toinspect distribution of the sequences in multidimen-sional space. Even for the cases where the LOOCV errorrate is around 10%, the classification can be still valid ifthe query is found in a region of the multidimensionalspace where the contaminations by the other genotypesare negligible. Our web-based genotype prediction servermasks by default these hyper-variable regions in thequery sequence.
Performance testsThe issue raised above would not be a serious problemas long as the major portion of the query contains goodphylogenetic signals. This can be best addressed by run-ning the MuLDAS classification for the entire real worldsequences that are not included in the reference paneland tabulating the LOOCV error rates. The shortestquery sequence included in our initial benchmark testwas 50 bp long. It would be informative to evaluate the
Kim et al. BMC Bioinformatics 2010, 11:434http://www.biomedcentral.com/1471-2105/11/434
Page 8 of 18

performance of MuLDAS with short sequences. Prob-ably the best way to assess this issue is to survey theleave-one-out cross-validation (LOOCV) error rate bysequence length. Since it is purely based on referencesequences only, it would be the optimal performance ofMuLDAS. The relevant scatter plots were created forboth HIV-1 and HCV nucleotide sequences (see Supple-mentary Figure 4 in Additional File 3). The LOOCVerror rate rises sharply below 100 bp, reaching to about0.20. Accordingly in the subsequent analysis we usedonly those sequences longer than 100 bp. Table 1 showsthe summary of such runs with all the non-recombinantnucleotide sequences greater than 100 bp. The LOOCVerror rates were very low: mean and median being lessthan 1%. For both HCV and HIV-1 nucleotidesequences, more than 99% of the cases had LOOCVerror rates of about 4% or less.Having demonstrated that the MuLDAS linear models
were well validated, we then surveyed the posteriorprobability of classification: more than 99% of the casesshowed the maximum a posteriori probability values of0.90 or higher, meaning unambiguous calls for mostcases (Table 1). The overall concordance rates of theMuLDAS predictions with those retrieved from LANLwere 98.9% and 96.7%, respectively for HIV-1 and HCVsequences (Table 1). See the next section for the plausi-ble explanation for the apparently low concordance forHCV.The concordance rates for each gene and genotype are
listed in Tables 2 and 3 for HIV-1 and HCV nucleotide
sequences, respectively (see Supplementary Tables 3 and4 in Additional File 1 for details). If only a few referencesequences are available for any gene-genotype combina-tion, the statistical model of genotype classification forthat category would be unreliable: for example, only twoto three references were available from each of subtypesH, J, and K (Supplementary Table 1 in Additional File1). The test sequences in these categories were alsoextremely rare (Supplementary Tables 3(a) and 4(a) inAdditional File 1). Unless more sequences are discov-ered from these subtypes, their classification using MuL-DAS remains to be a challenge.
Outlier filteringHaving proposed the outlierness value, O (Eq. 1), as anindicator of how well the query clustered with the corre-sponding references, we examined its distribution: thedensity plots of O showed a sharp peak centred around1.0 for the concordant predictions (bar), while a longtail up to 10.0 were observed for discordant cases (line)(Figure 6(a, b)). If one treats the discordant cases asfalse positives, we can survey the false discovery rate(FDR) over the entire range of O cutoff (Figure 6(c, d)).It appears that the cutoff at O = 2.0 would eliminatemuch of the misclassifications with a minimal sacrificeof concordant predictions. While noticeable improve-ment was observed with HIV-1 sequences, no improve-ment was observed with HCV sequences (Table 1). Acloser examination of the confusion table between HCVgenotypes before and after the filtering showed some
Figure 4 Surveys of LOOCV error rates by MDS dimensionality, k, for each gene segment. The LOOCV error rates of predicting genotypes(or subtypes) of references sequences were measured by varying the MDS dimensionality, k, from 1 through 50 for each gene segment of (a)HIV-1 and (b) HCV nucleotide sequences. Some gene segments showing distinctively higher error rates are labelled. Regardless of sequencetypes, the error rates reached plateaus after k = 10, which was used in the subsequent analyses.
Kim et al. BMC Bioinformatics 2010, 11:434http://www.biomedcentral.com/1471-2105/11/434
Page 9 of 18

specific patterns of discordance (Supplementary Table 4(e, f) in Additional File 1). It appears they were due tosystematic errors in LANL HCV genotype informationof these sequences. For example, most of these caseswere originated from a few studies that had submittedseveral hundreds to thousands of sequences. See
Additional File 2 Supplementary Note 3 for details.After removing all the sequences from those submis-sions of suspicious genotype information, the overallconcordance rate for HCV were 99.45 and 99.50, respec-tively before and after applying the cutoff at O = 2.0(Supplementary Table 5 in Additional File 1). Since the
Figure 5 Representative sliding window plots of LOOCV error rates along gene segments. The LOOCV error rates were plotted in slidingwindows of 100 bp in 10 bp step along the gene segment of (a) HIV-1 env and (b) HCV e2 nucleotide sequences. The MDS dimensionality wasset at k = 10 for both cases. Full listings are given in Supplementary Figures 2 and 3 in Additional File 3.
Kim et al. BMC Bioinformatics 2010, 11:434http://www.biomedcentral.com/1471-2105/11/434
Page 10 of 18

concordance was already extremely high, the outliernessfiltering showed only marginal improvement. Neverthe-less the revised histogram and FDR plots of showed thatthe cutoff at O = 2.0 would eliminate some of the mis-classifications (Supplementary Figure 5 in AdditionalFile 3).
Assessment of the HIV-1 nested analysis resultsMany HIV-1 sequences have been described as circulat-ing recombinant forms (CRFs) by LANL. For a total of9,000 nucleotide gene segments of 8,612 such sequenceentries, subtypes were assigned by MuLDAS by the‘nested’ analysis (see Methods). After the ‘major’ analysisof each gene segment, the subtypes having posteriorprobability greater than 0.01 were identified and thecorresponding reference sequences were collected into apool. The CRF references originated from these subtypeswere also added to the pool. The MuLDAS classificationmodel was, then, built based on the pool of references,and was applied to the query sequence. Note that thereference pool was re-collected for each query. A totalof 4,994 nucleotide gene segments (derived from 4,949sequence entries) passed the filtering step (O ≤ 2.0) andhad unambiguous calls (posterior probability ≥ 0.99),with an overall accuracy of 94.67% (SupplementaryTable 6 in Additional File 1). It should be noted thatthe number of reference sequences per gene segment orsubtype is not high for CRFs presently and consequentlythe accuracy reported here should be interpreted care-fully. The relatively high accuracy seen with polsequences (Supplementary Tables 6 Additional File 1)
Table 1 Summary statistics of the benchmarking results1
Virus HIV-12 HCV
# of test sequences 153,669 66,488
LOOCV error rate
mean 0.0100 0.0063
median 0.0068 0.0034
90% percentile 0.0286 0.0155
99% percentile 0.0395 0.0412
MAP3 (% of sequences higher than the cutoff)
P > = 0.99 97.5 99.6
P > = 0.90 99.1 99.8
P > = 0.50 100.0 100.0
LANL concordance (% of sequences higher than the cutoff)
All 98.9 96.7
O < = 2.0 99.3 96.61Data as of Jan. 20, 2009.2Major analysis (M-group and CRF01) only.3Maximum a posteriori
Table 2 The test results with HIV-1 sequences§
Category All Outlierness <2.0
No. of referencesequences
Total %acc.*
Total %acc.*
(a) by gene segment
Gag 14,915 97.85 14,570 98.65 1,142
pol 64,607 98.67 61,704 99.20 735
vif 1,330 99.62 1,324 100.00 945
vpr 1,713 99.71 1,702 99.71 810
tat 1,987 99.35 1,976 99.44 659
env 63,519 99.17 62,652 99.52 1,175
nef 5,598 99.59 5,572 99.82 1,559
(b) by subtype
A 11,907 95.44 11,317 97.74 259
B 112,997 99.53 111,396 99.64 1,750
C 12,785 99.1 12,586 99.52 908
D 3,743 95.99 3,526 98.24 158
F 1,321 96.14 939 97.12 37
G 2,379 94.33 1,800 95.89 65
H 214 71.03 47 51.06 11
J 124 54.84 15 0 3
K 39 69.23 11 54.55 3
01_AE 8,160 98.80 7,863 98.93 152
Total 153,669 98.86 149,500 99.32 3,346
*% accuracy given as 100 × Matched/Total, where Matched is the numbercases concordant between MuLDAS and LANL§Major analysis (M-group and CRF01) only.
Table 3 The test results with HCV nucleotide sequences
Class All Outlierness < 2.0 No. ofreferencesequences
Total % acc.* Total % acc.*
(a) by gene segment
arfp 4,333 99.7 4,167 99.78 289
core 4,453 99.73 4,412 99.77 463
e1 19,353 95.19 19,167 95.15 456
e2 16,025 93.32 15,462 93.27 194
p7 2,156 100 2,120 100 195
ns2 813 100 785 100 166
ns3 3,254 99.97 3,125 99.97 154
ns4a 950 99.58 796 99.75 253
ns4b 921 99.67 787 99.62 148
ns5a 5,870 99.98 5,794 99.98 298
ns5b 5,115 98.14 4,384 98.02 148
okamoto 3,245 97.13 3,240 97.13 2,203
(b) by genotype
1 49,574 99.15 49,462 99.19 1,709
2 3,544 98.87 3,452 98.99 354
3 6,043 99.7 5,810 99.76 473
4 4,026 66.57 2,875 53.25 346
5 1,182 66.75 641 40.72 72
6 2,119 99.76 1,999 99.9 139
Total 66,488 96.66 64,239 96.61 3,093
*% accuracy given as 100 × Matched/Total, where Matched is the numbercases concordant between MuLDAS and LANL
Kim et al. BMC Bioinformatics 2010, 11:434http://www.biomedcentral.com/1471-2105/11/434
Page 11 of 18

are encouraging in that the genes in this segment arethe targets of antiviral therapies and recent resistancescreenings to help guide treatment regimens frequentlysequence these genes [26].Even with this success, there were still many
sequences that failed to pass filtering steps. As a classifi-cation tool, MuLDAS has been developed to assign asubtype among a set of known subtypes, and thus notdesigned to detect a new subtype or recombination
pattern. However, MuLDAS may hint some importantclues for the analysis of these outlier sequences in termsof outlierness value and a set of posterior probabilitiesas well as the complex subtype pattern along thesequence. See Supplementary Note 4 in Additional File2 for the summary of the test runs of MuLDAS withartificial HIV-1 sequences interwoven with two sub-types. The MuLDAS runs displayed complex subtypepatterns that were generally congruent with the subtype
Figure 6 The density distributions of the outlierness value, O, and the corresponding false discovery rates from the benchmarkresults for HIV-1 and HCV nucleotide sequences. For all the HIV-1 (a) and HCV (b) sequences used in the benchmark tests (Table 1), the Ovalues were surveyed and plotted as the histograms that were separately normalized for the cases concordant with (bar) and discordant to (line)LANL genotypes/subtypes. After filtering out the cases having O > cutoff, the discordant ones were counted as false positives. The false positiverates and the proportion of the sequences retained (coverage) were plotted against the O cutoff for HIV-1 (c) and HCV (d) sequences. Thesuggested cutoff is shown by a dashed line. The revised plots after removing the HCV sequences of suspicious genotypes are available inSupplementary Figure 5 in Additional File 3.
Kim et al. BMC Bioinformatics 2010, 11:434http://www.biomedcentral.com/1471-2105/11/434
Page 12 of 18

composition. For the cases where either the recombina-tion spot or subtype composition of the query was sub-stantially different from the common CRFs, itsperformance were suboptimal. This implies that sliding-window analysis by MuLDAS along the sequence isnecessary. We plan to develop MuLDAS further toimplement such a feature, exploiting cluster farms withseveral hundred CPUs.
A proposed process for subtype decisionIt is evident from the previous sections that one has toaccept the prediction results if and only if the reportedparameters such as posterior probability (P) and outlier-ness (O) are reasonable. A working proposal for highlyconfident genotype assignment may be P better than0.99 and O less than 2.0. A straightforward applicationof such criteria to 100,654 HCV nucleotide gene seg-ment sequences achieved a false positive rate around2.6%, leaving about 13.9% as undecided (data notshown).The subtype decision for a HIV-1 sequence is not as
straightforward as the genotyping a HCV sequence, asthe former has to deal with the issue of recombinantforms. We showed that MuLDAS achieved high classifi-cation accuracies with HIV-1 sequence sets that hadbeen pre-segregated as non-recombinants or CRFs. Inreal situations, we do not know prior to the analysiswhether the query is recombinant or not. For HIV-1sequences, MuLDAS runs a ‘major’ analysis and subse-quently a ‘nested’ one (see Methods). An automateddecision process is, then, needed in order to summarizethose statistics in an orderly manner. For example, if theresults from the ‘major’ and ‘nested’ analyses are differ-ent, the user may be confused. Here the objective is tomaximize the accuracy without sacrificing the predictioncoverage too much. Based on the filtering criteria men-tioned above we propose the following strategy: (i)accept the result from ‘nested’ analysis only if its cluster-ing is tight (O ≤ 2.0) and the posterior probability isgreater than or equal to 0.99; (ii) otherwise, accept theresult only if the ‘major’ and ‘nested’ analyses agree witheach other and one of the outlierness values is less thanor equal to 2.0; (iii) or, accept the result from ‘major’analysis if its outlierness value is less than or equal to1.0 and the P value is greater than or equal to 0.99. Weapplied this strategy to 162,669 HIV-1 nucleotidesequences (gene segments), for which the subtype infor-mation were available from LANL (Table 4). A total of130,721 sequences passed the first step with 98.9% accu-racy, while the second step (ii) applied to the 31,948leftovers from the step (i) yielded 22,599 sequences with94.8% accuracy. The steps (i)-(iii) in this heuristic deci-sion scheme resulted in 98.1% overall prediction accu-racy for 94.9% of the total sequences, leaving out 8,274
sequences without subtype assignment (5.1%). By treat-ing the inaccurate ones as false discovery, we can surveythe false discovery rate (FDR) over the entire range of Ovalue cutoff for each decision step. See Additional File 3Supplementary Figure 6 for the plots of FDR overlaidwith coverage. For the first two steps, O cutoff at 2.0would lower FDR without sacrificing the coverage toomuch. On the other hand, the last step showed muchhigher FDR over the entire range. Therefore the cutoffat 1.0, the nominal minimum would be the only choicein this case.While an alternative strategy may maximize the pre-
diction coverage at the loss of the accuracy, ourapproach minimizes misclassification and leaves the‘twilight zone’ to the users’ discretion. The latterincluded some extreme cases such as those in-betweenmultiple subtypes (P < 0.6) or far outside the nearestcluster (O > 10). The lists constitute about 0.7% of thetotal HIV-1 nucleotide sequences (Table 4).
Comparison with other methodsWe have validated the performance of MuLDAS in gen-otyping HCV and subtyping HIV-1 sequences againstthe benchmark test dataset downloaded from LANLdatabases. As MuLDAS shows excellent performance, itwould be informative to compare with other automaticgenotyping (or subtyping) methods. Most publishedmethods report concordance rates with LANL similar tothose of MuLDAS, even though one of the tests showedquite discordant results among those methods [7]. How-ever, their test cases were quite limited, not as full scaleas those of MuLDAS. It should also be emphasized thatall those methods are based on well established corealgorithms in the fields of sequence alignment or phylo-genetics. As such, appropriate implementations of thosemethods should work well for the classification of thequery, as long as it is well clustered with only one of thegenotypes (or subtypes). Therefore it would be moreinformative to understand the difference of these meth-ods in dealing with a problematic query sequence that iseither divergent or recombinant. As there are no suchtest panels publicly available, we have devised our ownpanels: one panel of genome sequences (length > 9000bp) for each of HCV and HIV-1. We downloaded 1,218and 1,131 such genome sequences from GenBank,respectively for HCV and HIV-1. From LANL, the geno-types were retrieved for 1,116 and 1,086 of them,respectively. MuLDAS ran in the gene-by-gene mode. Ifall the gene segments of a genome sequence are ‘confi-dently’ genotyped by MuLDAS (O < 2.0 and P > 0.99)and agree with LANL, we count it as a concordant case,otherwise discordant.For HCV, 1,098 out of 1,116 were concordant, leaving
18 cases as discordant (98.4% accuracy). Since we did
Kim et al. BMC Bioinformatics 2010, 11:434http://www.biomedcentral.com/1471-2105/11/434
Page 13 of 18

not included any recombinant sequences into the refer-ence panels for HCV, all these concordant cases corre-sponded to ‘pure’, non-recombinant forms. On the otherhand, nine out of 18 discordant cases were designated asrecombinant forms by LANL. The gene-by-gene predic-tions by MuLDAS for these nine sequences were con-gruent with their recombination patterns. For example,LANL genotype was “1a/2a” for the sequence entryAX057088, while MuLDAS predicted ‘1’ and ‘2’ for sixand five segments, respectively. We labelled such casesas “Recombination inferable”. Including these ‘partialsuccess’ cases, the success rate goes up to 99.2% (Table5). Among the remaining nine cases, EU643835 wasdesignated as a pure genotype ‘6’ by LANL, while MuL-DAS displayed ‘2/6’ recombination pattern. NCBI Geno-typing Tool and REGA also indicated a similarrecombination pattern. The next eight cases weredescribed as non-recombinant forms of genotype 4 byLANL. There was no consensus among the three geno-typing methods: many segments were not genotyped
‘confidently’ by MuLDAS; NCBI Tool reported recombi-nant forms; REGA reported some as pure forms asLANL. The last one, EF108306, belonged to genotype 7,which has been defined recently and has not been repre-sented in the reference sets, yet. The full listing of thegenotype results of these genome sequences is availablein Additional File 4.For HIV-1, based on the strict criteria mentioned
above, 938 out of 1,086 were concordant with LANL,leaving 148 cases as discordant (86.3% accuracy). Sincewe classify a HIV-1 sequence into M-groups or CRFs(01~16). Any sequences that do not belong to thesegroups are bound to be discordant in this analysis.Indeed all 148 but seven discordant cases were of com-plex recombinant ones. The genotype compositionspredicted by MuLDAS for 103 such cases were con-gruent with their recombination patterns designated byLANL. For example, LANL genotype for a sequenceentry EU220698 was ‘AC’, a non-CRF recombinationof ‘A’ and ‘C’. Among nine segments, six were of ‘C’
Table 4 Accuracy and coverage of each subtype decision step for HIV-1 nucleotide gene segments
Sequence set* Description No. of sequences Accuracy (%) Coverage (%)
(1) Subtypes given by LANL 162,669 100
(2) [Nested analysis] Outlierness < 2.0 & Pval > 0.99 among (1) 130,721 80.4
Correctly classified among (2) 129,302 98.91
(3) (1)-(2) 31,948 19.6
(4) Outlierness < 2.0 & Subtype(major) = subtype(nested) among (3) 22,599 14.1
Correctly classified among (4) 21,429 94.82
(5) (3)-(4) 9,349 5.7
(6) [Major analysis] Outlierness < 1.0 & Pval > 0.99 among (5) 1,075 0.7
Correctly classified among (6) 781 72.65
(7) (5)-(6) 8,274 5.1
(8) Subtype assigned (2)+(4)+(6) 154,395 94.9
Correctly classified among (8) 151,512 98.13
(9) (1)-(8) 8,274 5.1
Pval < 0.6 among (9) 292 0.2
Outlierness > 10.0 among (9) 756 0.5
*The sequence sets (2), (4), and (6) correspond to the decision steps (i), (ii), and (iii) in the main text of the “A proposed process for subtype decision” section ofResults and Discussion, respectively
Table 5 Concordance between LANL and MuLDAS in genotypes for the genome sequences longer than 9,000 bp
Sequence set HCV HIV-1
(1) Genome sequences downloaded 1,218 1,131
(2) LANL genotypes known in (1) 1,116 1,086
(3) All confidently genotyped gene segments concordant with LANL genotypes 1,098 938
(4) Some confidently genotyped segments discordant to LANL genotypes 18 148
(5) Accuracy [(3)/(2)]% 98.4 86.3
(6) Recombination pattern ‘inferable’ from MuLDAS results among (4) 9 103
(7) Including ‘partial’ successes [(3)+(6)] cases 1,107 1,041
% 99.2 95.9
Kim et al. BMC Bioinformatics 2010, 11:434http://www.biomedcentral.com/1471-2105/11/434
Page 14 of 18
and three were of ‘A’ by MuLDAS. Including such‘partial success ’ cases, the success rate goes up to95.9% (Table 5).We validated the results for 148 discordant HIV-1
cases with independent runs of both NCBI GenotypingTool [4] and REGA [5]. NCBI Genotyping Tool offersan option to choose one from various reference sets.Since some of the genome sequences used in this testare included in more recent reference sets, NCBI Geno-typing Tool would immediately recognize them withperfect matches. For fair comparisons, we used so-called“2005 pure and CRFs” as the reference set in the testrun. Since NCBI Genotyping Tool does not summarizethe sliding window result into a single genotype, wedevise our own scheme as follows: for each window thebest scoring genotype is reported; among them infre-quent ones (<10%) were trimmed. When multiple geno-types are finally reported for a genome sequence, the
genotype composition is compared with that of LANL.If they are congruent, we label them ‘inferable’ (73cases). This scheme was successfully validated with the938 sequences for which MuLDAS showed concordancewith LANL (Sequence set (3) for HIV-1 in Table 5). Onthe other hand REGA summarizes the sliding windowresult and report a single genotype. However among148 sequences, REGA failed to report summarized geno-types for 107 sequences due to poor bootscanning sup-port values (we label them “Failed QC”). Thus wefocused on the comparison with NCBI Tool, whichshowed 97 and 102 cases (including ‘inferable’) thatwere concordant with LANL and MuLDAS, respectively.There were 79 cases for which all three agreed on. Theresults are summarized in Supplementary Table 7 inAdditional File 1, while the full listings of the test resultsare found in Additional File 5.
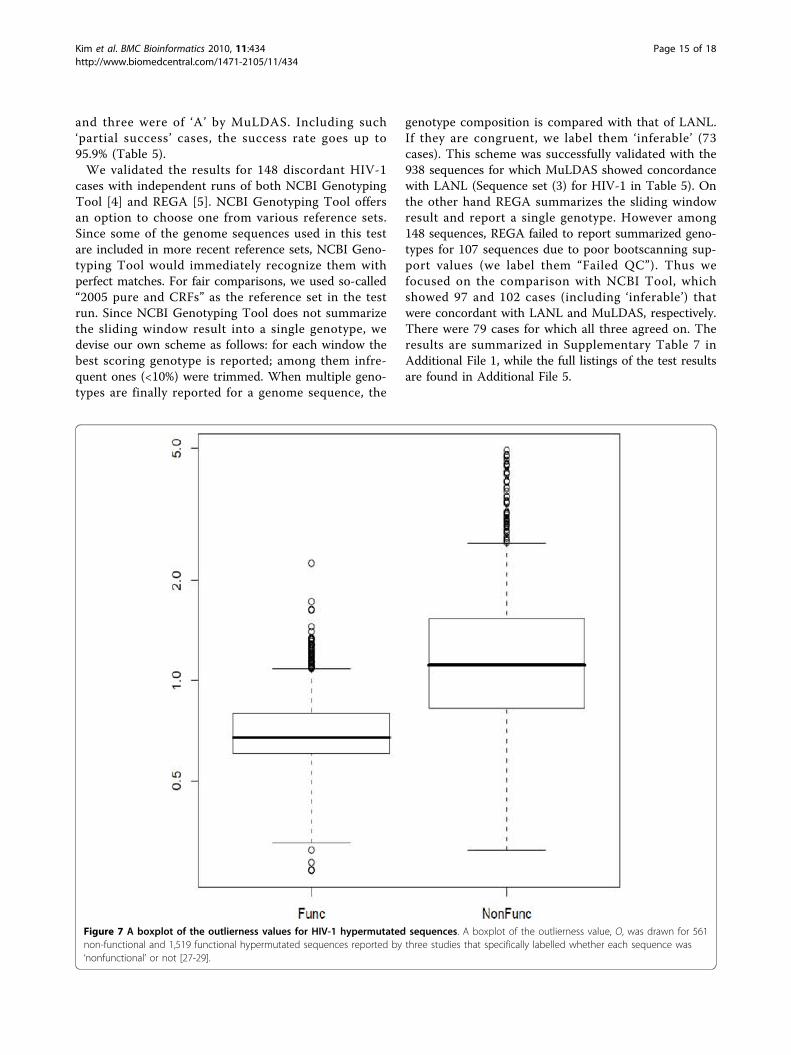
Figure 7 A boxplot of the outlierness values for HIV-1 hypermutated sequences. A boxplot of the outlierness value, O, was drawn for 561non-functional and 1,519 functional hypermutated sequences reported by three studies that specifically labelled whether each sequence was‘nonfunctional’ or not [27-29].
Kim et al. BMC Bioinformatics 2010, 11:434http://www.biomedcentral.com/1471-2105/11/434
Page 15 of 18

Hypermutation creates quasi-species that are distantfrom their ancestors and are often with loss of function inthe component genes. It would be interesting to see howMuLDAS behaves with such sequences. There were 14reports of HIV-1 hypermutations whose sequences hadbeen deposited with the public archives [27-40]. Among2,308 such sequences, 2,279 were identified from ourbenchmark results. Since the sequences with non-func-tional gene components are likely more divergent than theintact sequences, we would compare the degree of diver-gence between the two groups that have originated fromthe same studies. Among those 14 reports, three specifi-cally labelled whether the sequence was non-functional ornot [27-29]. We measured the outlierness, O, parameterfor 561 non-functional and 1,519 functional sequences. Asshown in Figure 7, the former had distinctively higher Ovalues than the latter. This demonstrates that MuLDASmay be useful in pre-screening hypermutation. Here weshow an example analysis of a hypermutated sequencewith other tools. Janini et al. [27] described a 297 bp HIV-1 pol gene coding a non-functional protease due to hyper-mutation (GenBank accession AY036374.1 and GI:15192372). The original GenBank record classified it tosubtype A. Although NCBI Genotyping Tool also classi-fied it as distinct subtype A, there was no obvious indica-tion of hypermutation. REGA HIV Subtyping Toolassigned it to subtype A with rather high bootstrap (74%),although the topological shape of the phylogenetic treewas unusual. MuLDAS also classified it to subtype A withhigh confidence (P = 1.0) but more than 10-fold divergentthan the known subtype A references (Ogroup = 10.56).Compared to the maximum radius encompassed by all735 reference sequences, it was almost four-fold divergent(Oall = 3.99).
ConclusionsHere we have demonstrated that MuLDAS is a novelapproach useful for classifying viral sequences based ona large sample population of reference sequences. As itreports several confidence measures, it is a particularlypowerful tool for detecting unusual, problematicsequences that often slip through unnoticed. Explosivegrowth in number coupled with complex divergence ofviral sequences, demands classification tools such asMuLDAS. It has been a while since the previous meth-ods were developed and their performances have notbeen comprehensively re-evaluated with the sequencesemerged since then. MuLDAS achieved remarkableaccuracy in the tests that included all HIV-1 or all HCVsequences currently available. As at the core of MuL-DAS is MDS of distance matrix followed by LDA, it isconceivable that in place of LDA other classificationalgorithms such as K-NN or SVM are applied. However,they may not be appropriate as they focus on either a
few nearest neighbours (K-NN) or solely on the decisionboundary without taking into consideration of the popu-lation distribution (SVM). In addition, K-NN may alsosuffer from the issue of sample size imbalance. MuLDASalgorithm is straightforward enough to be applied to theclassification of either nucleotide or peptide sequences.It can be even extended to classify individual subjectsinto population groups based on a distance matrix ofpolymorphic markers such as SNP. To sum it up, theapproach taken by MuLDAS has far reaching implica-tions for sequence classifications.
Note added in proofThe pre-computed genotype/subtype information isaccessible through LinkOut service from NCBI.
Additional material
Additional file 1: Supplementary Tables. Table 1. Number of HIV-1reference nucleotide sequences per gene segment for each subtype.Table 2. Number of HCV reference nucleotide sequences per genesegment for each genotype. Table 3. Summary statistics of thebenchmark test for HIV-1 M group and CRF01_AE nucleotide sequences.Table 4. Summary statistics of the benchmark test for HCV nucleotidesequences. Table 5. Re-analysis of the benchmark test for HCV nucleotidesequences after removing batches of 3,642 sequences that had beensubmitted by three studies of suspicious genotype information in LANLdatabase (see Additional File 2 Supplementary Note 3 for details). Table6. Benchmark results of HIV-1 CRF nucleotide sequences from ‘nested’analysis. Table 7. Comparison with other methods for 148 cases thatwere discordant between MuLDAS and LANL for HIV-1 genomesequences longer than 9,000 bp (Sequence set (3) in Table 5)
Additional file 2: Supplementary Notes. Additional analyses anddescriptions provided here include: Note 1. Comparison of ‘outlierness’with the branching index in tree-based methods. Note 2. Simulation ofnew genotype detection by leaving out entire reference sequences of agiven genotype and classifying them based on the other referencegroups. Note 3. Re-analysis of discordant cases of HCV nucleotidesequences. Note 4. Test results with artificial synthetic HIV-1 nucleotidesequences.
Additional file 3: Supplementary Figures. Figure 1. Screenshots ofMuLDAS web server for subtyping HIV-1 sequences. Figure 2. LOOCVerror rates in sliding windows for HIV-1 nucleotide sequences. Figure 3.LOOCV error rates in sliding windows for HCV nucleotide sequences.Figure 4. The scatter plots of LOOCV error rate by sequence length for(a) HIV-1 and (b) HCV nucleotide sequences. Figure 5. The densitydistributions of the outlierness value, O, and the corresponding falsediscovery rates from the benchmark results for HIV-1 and HCV nucleotidesequences after removing the HCV sequences of suspicious genotypes.Figure 6. The plots of false discovery rates at each step of the proposedprocess for HIV-1 subtype decision.
Additional file 4: Comparison with other methods for HCV genomesequences. The following spreadsheets are available: ■ Hcv.summary:summary page to navigate to other sheets. ■ Discordant: the sequencesdiscordant between LANL and MuLDAS. ■ noDiscordant: the sequencesconcordant between LANL and MuLDAS.
Additional file 5: Comparison with other methods for HIV-1genome sequences. The following spreadsheets are available: ■ Hiv1.summary: summary page to navigate to other sheets. ■ Discordant: thesequences discordant between LANL and MuLDAS. ■ noDiscordant: thesequences concordant between LANL and MuLDAS. ■ pivot noDiscord:confusion tables between methods for those sequences in thenoDiscord sheet. ■ pivot Discord: confusion tables between methods forthose sequences in the Discord sheet.
Kim et al. BMC Bioinformatics 2010, 11:434http://www.biomedcentral.com/1471-2105/11/434
Page 16 of 18
AcknowledgementsWe are grateful to Prof. Julian Lee and Kyu-Baek Hwang at SoongsilUniversity, and Dr. Sang Chul Kim at Yonsei University for helpful discussions.We also thank Dr. Joo Shil Lee and colleagues at Korea National Institute ofHealth for helpful discussion and encouragement. Generous allocation ofcomputer clusters for the benchmark tests and a web server system byKorea Bioinformation Center (KOBIC), Taejon, Korea, is greatly appreciated.This work has been supported by a grant from the Korea Science andEngineering Foundation (KOSEF) (R11-2008-062-03003-0) funded by theKorea government (MEST).
Author details1Department of Bioinformatics & Life Sciences, Soongsil University, Seoul,156-743, Korea. 2Current Address: Equispharm Co., Ltd, Suwon, 443-766, Korea.3Current Address: Macrogen Inc., Seoul, 153-023, Korea.
Authors’ contributionsJK developed the whole system, did the statistical analysis and helped todraft the manuscript. YA developed the prototype system using HIV-1nucleotide sequences. KL analyzed the results and helped to draft themanuscript. SHP analyzed the genome sequences and FDR calculations andhelped to draft the manuscript. SK conceived of the study, participated in itsdesign, analyzed the results and drafted the manuscript. All authors readand approved the final manuscript.
Received: 15 December 2009 Accepted: 21 August 2010Published: 21 August 2010
References1. Rambaut A, Posada D, Crandall KA, Holmes EC: The causes and
consequences of HIV evolution. Nat Rev Genet 2004, 5:52-61.2. Robertson DL, Anderson JP, Bradac JA, Carr JK, Foley B, Funkhouser RK,
Gao F, Hahn BH, Kalish ML, Kuiken C, Learn GH, Leitner T, McCutchan F,Osmanov S, Peeters M, Pieniazek D, Salminen M, Sharp PM, Wolinsky S,Korber B: HIV-1 nomenclature proposal. Science 2000, 288:55-56.
3. Simmonds P, Bukh J, Combet C, Deléage G, Enomoto N, Feinstone S,Halfon P, Inchauspé G, Kuiken C, Maertens G, Mizokami M, Murphy DG,Okamoto H, Pawlotsky JM, Penin F, Sablon E, Shin-I T, Stuyver LJ, Thiel HJ,Viazov S, Weiner AJ, Widell A: Consensus proposals for a unified systemof nomenclature of hepatitis C virus genotypes. Hepatology 2005,42:962-973.
4. Rozanov M, Plikat U, Chappey C, Kochergin A, Tatusova T: A web-basedgenotyping resource for viral sequences. Nucleic Acids Res 2004, 32:W654-W659.
5. de Oliveira T, Deforche K, Cassol S, Salminen M, Paraskevis D, Seebregts C,Snoeck J, van Rensburg EJ, Wensing AM, van de Vijver DA, Boucher CA,Camacho R, Vandamme AM: An automated genotyping system foranalysis of HIV-1 and other microbial sequences. Bioinformatics 2005,21:3797-3800.
6. Vidal N, Peeters M, Mulanga-Kabeya C, Nzilambi N, Robertson D, Ilunga W,Sema H, Tshimanga K, Bongo B, Delaporte E: Unprecedented degree ofhuman immunodeficiency virus type 1 (HIV-1) group M genetic diversityin the Democratic Republic of Congo suggests that the HIV-1 pandemicoriginated in Central Africa. J Virol 2000, 74:10498-10507.
7. Gifford R, de Oliveira T, Rambaut A, Myers RE, Gale CV, Dunn D, Shafer R,Vandamme AM, Kellam P, Pillay D: UK Collaborative Group on HIV DrugResistance: Assessment of automated genotyping protocols as tools forsurveillance of HIV-1 genetic diversity. AIDS 2006, 20:1521-1529.
8. Myers RE, Gale CV, Harrison A, Takeuchi Y, Kellam P: A statistical model forHIV-1 sequence classification using the subtype analyser (STAR).Bioinformatics 2005, 21:3535-3540.
9. Schultz AK, Zhang M, Leitner T, Kuiken C, Korber B, Morgenstern B,Stanke M: A jumping profile Hidden Markov Model and applications torecombination sites in HIV and HCV genomes. BMC Bioinformatics 2006,7:265.
10. Zhang M, Schultz AK, Calef C, Kuiken C, Leitner T, Korber B, Morgenstern B,Stanke M: jpHMM at GOBICS: a web server to detect genomicrecombinations in HIV-1. Nucleic Acids Research 2006, 34:W463-5.
11. Schultz AK, Zhang M, Bulla I, Leitner T, Korber B, Morgenstern B, Stanke M:jpHMM: Improving the reliability of recombination prediction in HIV-1.Nucleic Acids Research 2009, 37:W647-51.
12. Wu X, Cai Z, Wan XF, Hoang T, Goebel R, Lin G: Nucleotide compositionstring selection in HIV-1 subtyping using whole genomes. Bioinformatics2007, 23:1744-1752.
13. Leitner T, Escanilla D, Franzén C, Uhlén M, Albert J: Accurate reconstructionof a known HIV-1 transmission history by phylogenetic tree analysis.Proc Natl Acad Sci USA 1996, 93:10864-10869.
14. Wilbe K, Saminen M, Laukkanen T, McCutchan F, Ray SC, Albert J, Leitner T:Characterization of novel recombinant HIV-1 genomes using thebranching index. Virology 2003, 316:116-25.
15. Hraber P, Kuiken C, Waugh M, Geer S, Bruno WJ, Leitner T: Classification ofhepatitis C virus and human immunodeficiency virus-1 sequences withthe branching index. J Gen Virol 2008, 89:2098-107.
16. Cox TF, Cox MAA: Multidimensional Scaling CRC/Chapman and Hall 2001.17. Higgins DG: Sequence ordinations: a multivariate analysis approach to
analysing large sequence data sets. Comput Appl Biosci 1992, 8:15-22.18. Brown AJ, Lobidel D, Wade CM, Rebus S, Phillips AN, Brettle RP, France AJ,
Leen CS, McMenamin J, McMillan A, Maw RD, Mulcahy F, Robertson JR,Sankar KN, Scott G, Wyld R, Peutherer JF: The molecular epidemiology ofhuman immunodeficiency virus type 1 in six cities in Britain and Ireland.Virology 1997, 235:166-177.
19. Venables WN, Ripley BD: Modern Applied Statistics with S Fourth EditionSpringer, New York, NY 2002.
20. Leitner T, Foley B, Hahn B, Marx P, McCutchan F, Mellors J, Wolinsky S,Korber B, (Eds): HIV Sequence Compendium 2005 Theoretical Biology andBiophysics Group, Los Alamos National Laboratory, NM, LA-UR 06-06802005.
21. Kuiken C, Yusim K, Boykin L, Richardson R: The Los Alamos hepatitis Csequence database. Bioinformatics 2005, 21:379-384.
22. Hair JF, Tatham RL, Anderson RE, Black W: Multivariate Data Analysis FifthEdition Prentice Hall, Upper Saddle River, NJ 1998.
23. Links to Recombinant sequence Analysis/detection Programs. [http://www.bioinf.manchester.ac.uk/recombination/programs.shtml].
24. Salminen MO, Carr JK, Burke DS, McCutchan FE: Identification ofbreakpoints in intergenotypic recombinants of HIV type 1 bybootscanning. AIDS Res Hum Retroviruses 1995, 11:1423-1425.
25. Timm J, Roggendorf M: Sequence diversity of hepatitis C virus:implications for immune control and therapy. World J Gastroenterol 2007,13:4808-4817.
26. Johnson VA, Brun-Vézinet F, Clotet B, Günthard HF, Kuritzkes DR, Pillay D,Schapiro JM, Richman DD: Update of the drug resistance mutations inHIV-1: 2007. Top HIV Med 2007, 15:119-125.
27. Janini M, Rogers M, Birx DR, McCutchan FE: Human immunodeficiencyvirus type 1 DNA sequences genetically damaged by hypermutation areoften abundant in patient peripheral blood mononuclear cells and maybe generated during near-simultaneous infection and activation of CD4(+) T cells. J Virol 2001, 75:7973-7986.
28. Gandhi SK, Siliciano JD, Bailey JR, Siliciano RF, Blankson JN: Role ofAPOBEC3G/F-mediated hypermutation in the control of humanimmunodeficiency virus type 1 in elite suppressors. J Virol 2008,82:3125-3130.
29. Land AM, Ball TB, Luo M, Pilon R, Sandstrom P, Embree JE, Wachihi C,Kimani J, Plummer FA: Human immunodeficiency virus (HIV) type 1proviral hypermutation correlates with CD4 count in HIV-infectedwomen from Kenya. J Virol 2008, 82(16):8172-8182.
30. Vartanian JP, Henry M, Wain-Hobson S: Sustained G–>A hypermutationduring reverse transcription of an entire human immunodeficiency virustype 1 strain Vau group O genome. J Gen Virol 2002, 83(Pt 4):801-805.
31. Wang B, Mikhail M, Dyer WB, Zaunders JJ, Kelleher AD, Saksena NK: Firstdemonstration of a lack of viral sequence evolution in a nonprogressor,defining replication-incompetent HIV-1 infection. Virology 2003,312(1):135-150.
32. Wei M, Xing H, Hong K, Huang H, Tang H, Qin G, Shao Y: Biased G-to-Ahypermutation in HIV-1 proviral DNA from a long-term non-progressor.AIDS 2004, 18(13):1863-1865.
33. Pace C, Keller J, Nolan D, James I, Gaudieri S, Moore C, Mallal S: Populationlevel analysis of human immunodeficiency virus type 1 hypermutationand its relationship with APOBEC3G and vif genetic variation. J Virol2006, 80(18):9259-9269.
Kim et al. BMC Bioinformatics 2010, 11:434http://www.biomedcentral.com/1471-2105/11/434
Page 17 of 18

34. Kijak GH, Janini LM, Tovanabutra S, Sanders-Buell E, Arroyo MA, Robb ML,Michael NL, Birx DL, McCutchan FE: Variable contexts and levels ofhypermutation in HIV-1 proviral genomes recovered from primaryperipheral blood mononuclear cells. Virology 2008, 376(1):101-111.
35. Vartanian JP, Meyerhans A, Asjö B, Wain-Hobson S: Selection,recombination, and G——A hypermutation of humanimmunodeficiency virus type 1 genomes. J Virol 1991, 65(4):1779-1788.
36. Goodenow M, Huet T, Saurin W, Kwok S, Sninsky J, Wain-Hobson S: HIV-1isolates are rapidly evolving quasispecies: evidence for viral mixturesand preferred nucleotide substitutions. J Acquir Immune Defic Syndr 1989,2(4):344-352.
37. Fitzgibbon JE, Mazar S, Dubin DT: A new type of G–>A hypermutationaffecting human immunodeficiency virus. AIDS Res Hum Retroviruses 1993,9(9):833-838.
38. Simon JH, Southerling TE, Peterson JC, Meyer BE, Malim MH:Complementation of vif-defective human immunodeficiency virus type1 by primate, but not nonprimate, lentivirus vif genes. J Virol 1995,69(7):4166-4172.
39. Monken CE, Wu B, Srinivasan A: High resolution analysis of HIV-1quasispecies in the brain. AIDS 1995, 9(4):345-349.
40. Yoshimura FK, Diem K, Learn GH Jr, Riddell S, Corey L: Intrapatientsequence variation of the gag gene of human immunodeficiency virustype 1 plasma virions. J Virol 1996, 70(12):8879-8887.
doi:10.1186/1471-2105-11-434Cite this article as: Kim et al.: A classification approach for genotypingviral sequences based on multidimensional scaling and lineardiscriminant analysis. BMC Bioinformatics 2010 11:434.
Submit your next manuscript to BioMed Centraland take full advantage of:
• Convenient online submission
• Thorough peer review
• No space constraints or color figure charges
• Immediate publication on acceptance
• Inclusion in PubMed, CAS, Scopus and Google Scholar
• Research which is freely available for redistribution
Submit your manuscript at www.biomedcentral.com/submit
Kim et al. BMC Bioinformatics 2010, 11:434http://www.biomedcentral.com/1471-2105/11/434
Page 18 of 18