A Challenge for Society International Perspectives and ... · A Challenge for Society International...
25
A Challenge for Society International Perspectives and Energy Futures Pathways to Sustainable D.H. Marks – MIT Laboratory for Energy and the Environment October 2007 1 Energy Futures David H. Marks Goulder Family Professor of Engineering Systems and Civil and Environmental Engineering MIT
Transcript of A Challenge for Society International Perspectives and ... · A Challenge for Society International...
A Challenge for Society
International Perspectives and Energy Futures
Pathways to Sustainable
D.H. Marks – MIT Laboratory for Energy and the Environment October 2007 1
Pathways to Sustainable Energy Futures
David H. MarksGoulder Family Professor of Engineering Systems and
Civil and Environmental EngineeringMIT
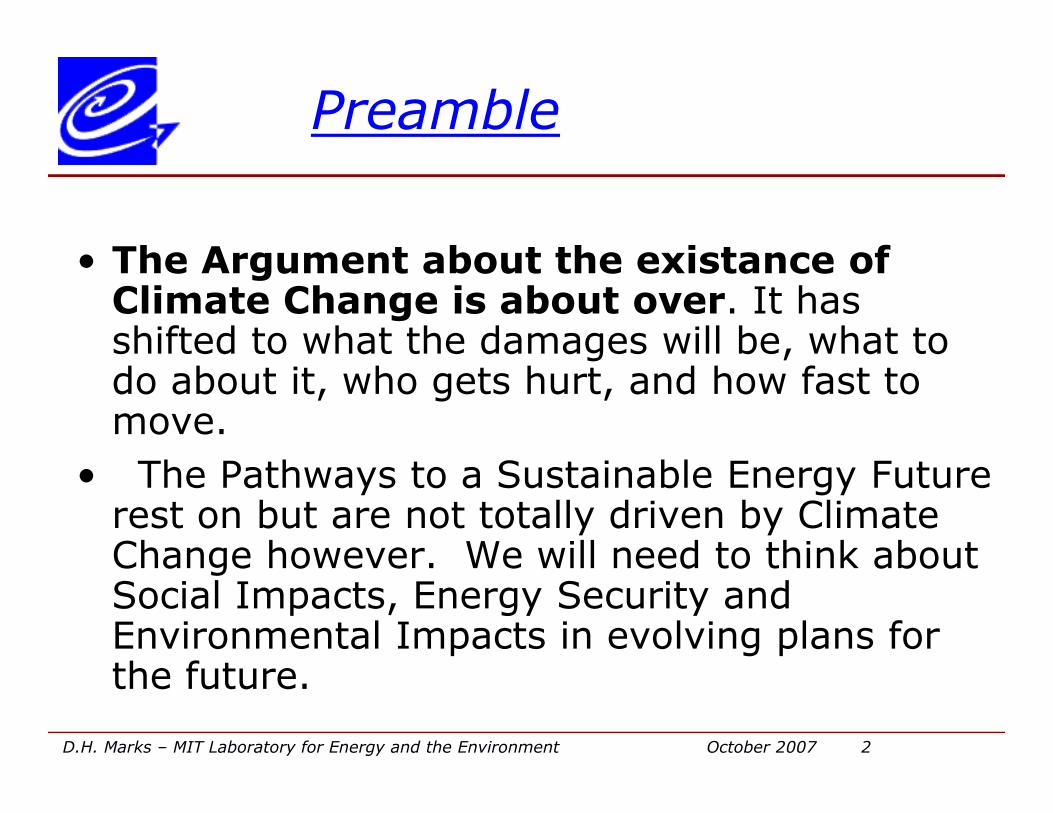
Preamble
• The Argument about the existance of Climate Change is about over. It has shifted to what the damages will be, what to do about it, who gets hurt, and how fast to move.
D.H. Marks – MIT Laboratory for Energy and the Environment October 2007 2
move.
• The Pathways to a Sustainable Energy Future rest on but are not totally driven by Climate Change however. We will need to think about Social Impacts, Energy Security and Environmental Impacts in evolving plans for the future.

What Do We Know about Climate Change?
- CO2 concentration is rising due to fossil fuel use
- The global temperature is increasing - other indicators of climate change
- There is a plausible causal connection - but the scientific case is not overwhelming (natural variability, forcings)
D.H. Marks – MIT Laboratory for Energy and the Environment October 2007 3
- Impacts of higher CO2 quite uncertain- ~ 2X pre-industrial is a widely discussed stabilization target (550 ppm)
- Reached by 2050 under BAU
- Precautionary action is warranted- What could the world do?
- Source Koonin BP
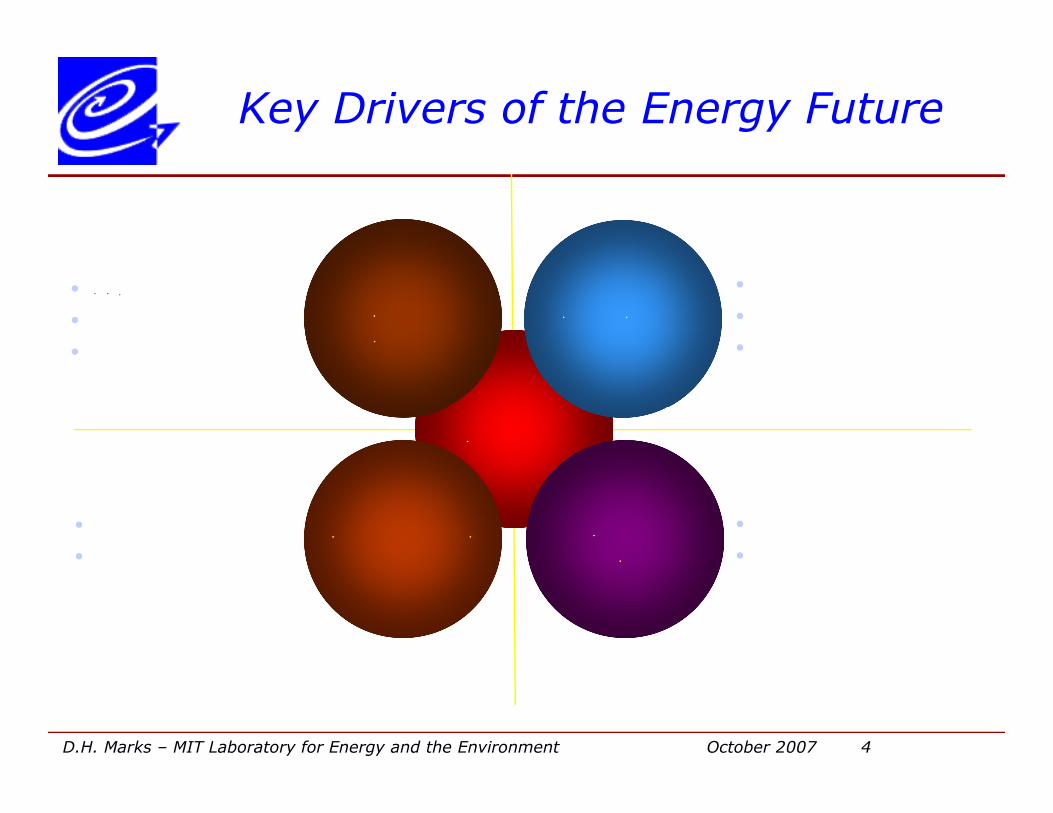
D����� D����� D����� D�����
G�����G�����G�����G�����
• GDP � ���� ������
• ������������
• ������ �����
S����� C������S����� C������S����� C������S����� C������
������������
• ����������� ���������
• ��������������
• �����������������
Key Drivers of the Energy Future
D.H. Marks – MIT Laboratory for Energy and the Environment October 2007 4
T���������T���������T���������T���������
S������� S������� S������� S�������
�� S������� S������� S������� S�����
• ������ ����������
• �����������
E������������ C�E������������ C�E������������ C�E������������ C�
������������������������������������
• ����� �������������� �������������� �������������� ���������
• ������� ������������� ������������� ������������� ������
250
300
350
400
Pri
ma
ry E
ne
rgy
pe
r c
ap
ita
(G
J)
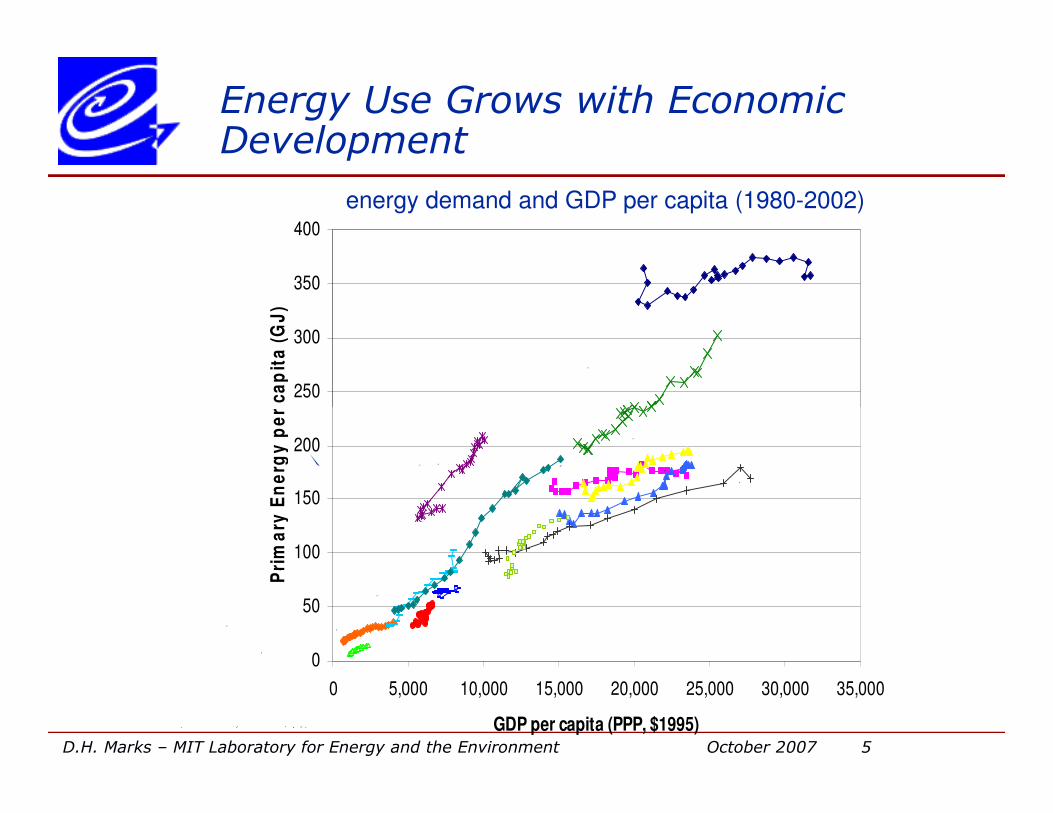
Energy Use Grows with Economic Development
US
A��������
energy demand and GDP per capita (1980-2002)
D.H. Marks – MIT Laboratory for Energy and the Environment October 2007 5
0
50
100
150
200
0 5,000 10,000 15,000 20,000 25,000 30,000 35,000
GDP per capita (PPP, $1995)
Pri
ma
ry E
ne
rgy
pe
r c
ap
ita
(G
J)
S������ UN ��� DOE EIA
R�����
B�����C����
I����
S� K����
M�����
I������
G�����
F�����
UK J����
M�������
40
50
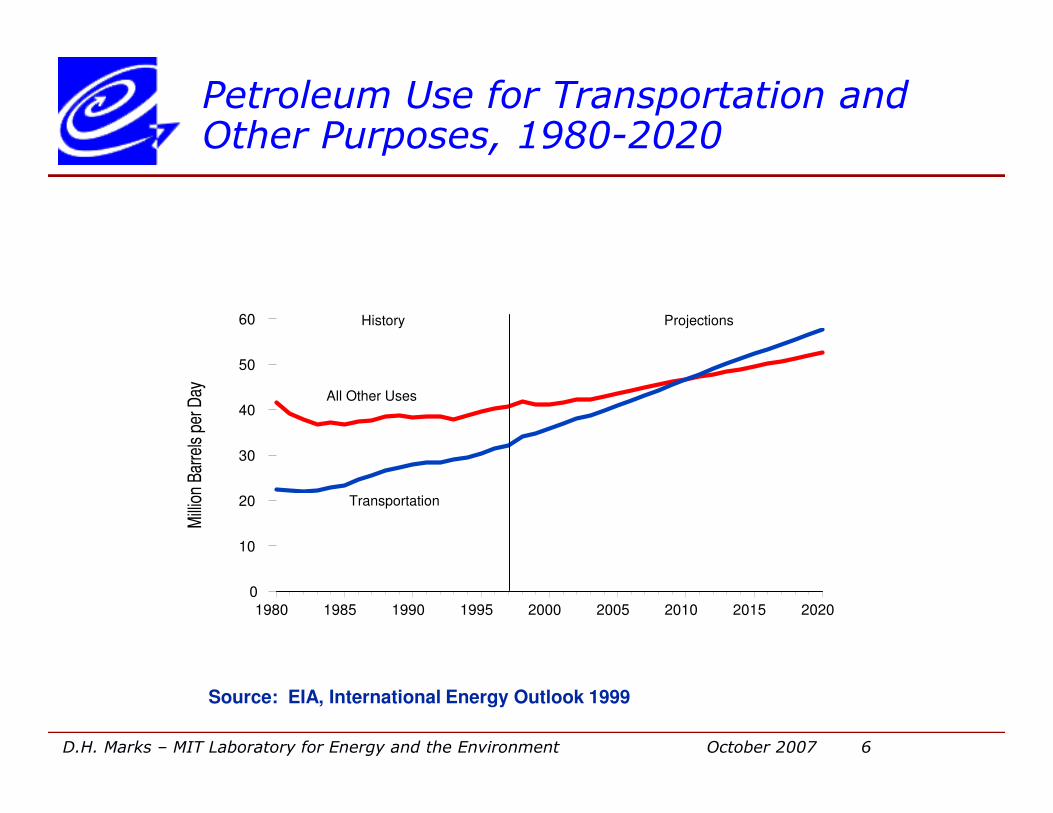
60 History Projections
All Other Uses
Petroleum Use for Transportation and Other Purposes, 1980-2020
D.H. Marks – MIT Laboratory for Energy and the Environment October 2007 6
1980 1985 1990 1995 2000 2005 2010 2015 2020
0
10
20
30
40
Transportation
Source: EIA, International Energy Outlook 1999
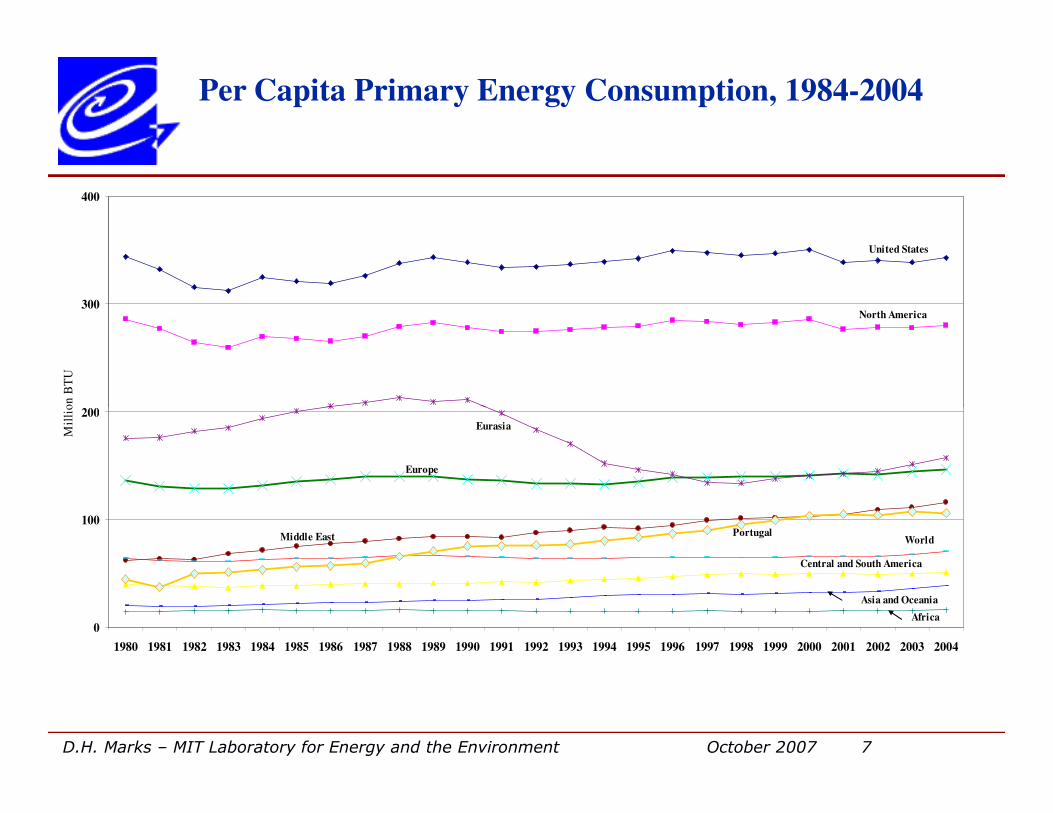
Per Capita Primary Energy Consumption, 1984-2004
200
300
400
Mil
lio
n B
TU
United States
North America
D.H. Marks – MIT Laboratory for Energy and the Environment October 2007 7
0
100
200
1980 1981 1982 1983 1984 1985 1986 1987 1988 1989 1990 1991 1992 1993 1994 1995 1996 1997 1998 1999 2000 2001 2002 2003 2004
Mil
lio
n B
TU
Portugal
Europe
Eurasia
Central and South America
Middle East
Africa
Asia and Oceania
World
0.4
0.5
0.6
0.7
0.8
# C
ars
/ P
erso
n
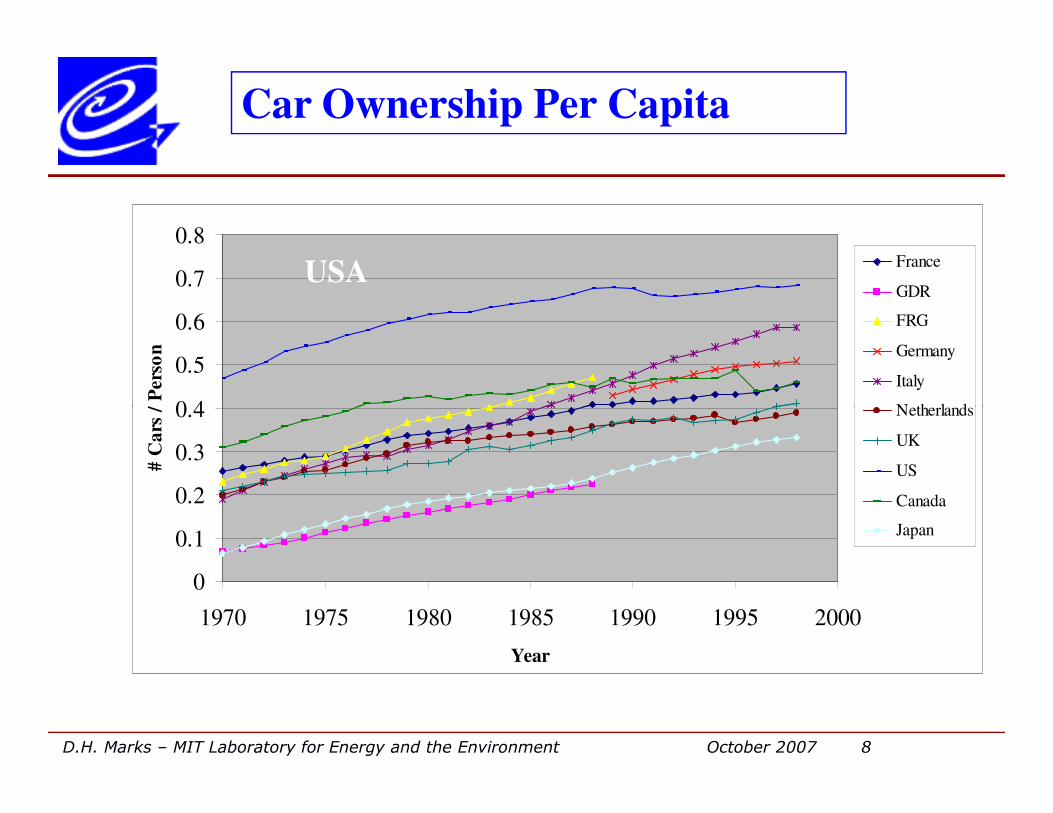
France
GDR
FRG
Germany
Italy
Netherlands
Car Ownership Per Capita
USA
D.H. Marks – MIT Laboratory for Energy and the Environment October 2007 8
0
0.1
0.2
0.3
0.4
1970 1975 1980 1985 1990 1995 2000
Year
# C
ars
/ P
erso
n
Netherlands
UK
US
Canada
Japan
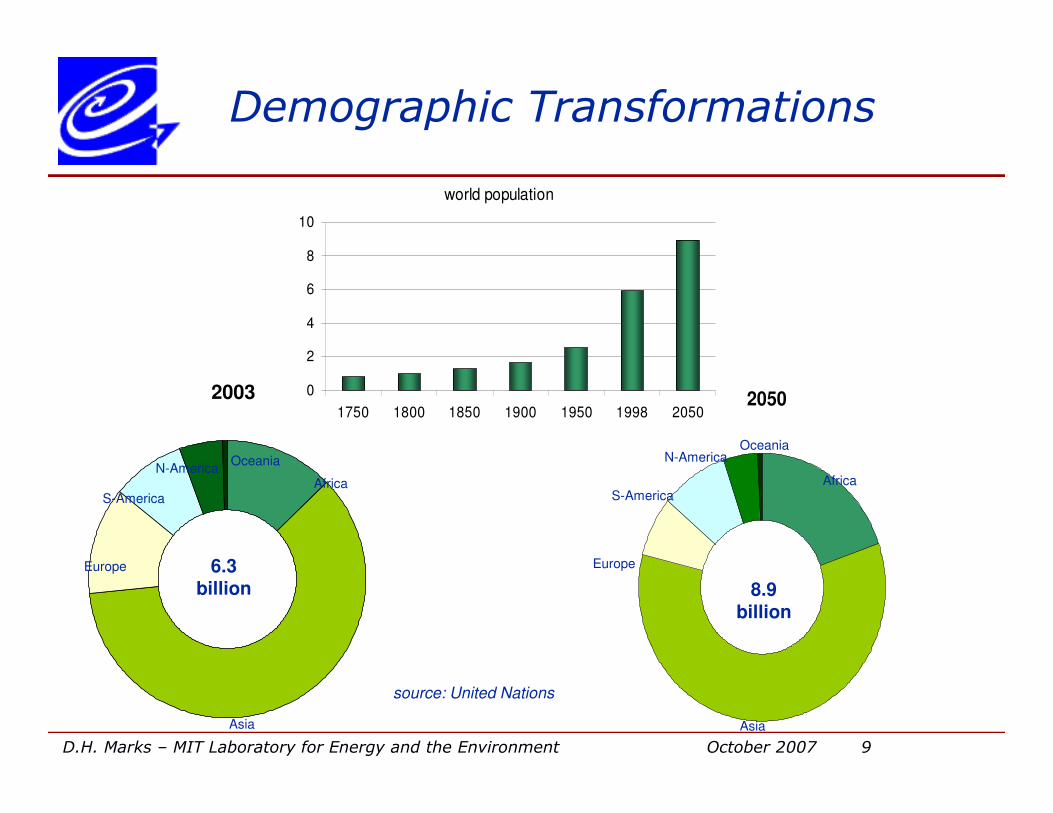
Demographic Transformations
world population
0
2
4
6
8
10
1750 1800 1850 1900 1950 1998 2050
2003 2050
D.H. Marks – MIT Laboratory for Energy and the Environment October 2007 9
1750 1800 1850 1900 1950 1998 20502050
source: United Nations
6.3billion 8.9
billion
Oceania
AfricaN-America
S-America
Europe
Asia
Oceania
Africa
N-America
S-America
Europe
Asia

Global Energy Inventory
28 TW (Hoffert, Nature 1998)
?
(35 TW)
30
25
20
200 yrs oil
why worry?
200 yrs methane12.8 TW
UN World Energy Assessment Report, 2000
Nate Lewis (Caltech) webpage
D.H. Marks – MIT Laboratory for Energy and the Environment October 2007 10
2050
?
15
10
5
0
~1900 yrs coal
cost
because...
environment
security
gas (2.70)
coal (2.96)
biomass (1.21)
nuclear (0.83)
hydro (0.29)
renewable (0.29)
oil (4.52)
12.8 TW
20000
5
10
15

Have We Had It Too Easy?
• What Direction Has Our/ShouldOur Energy Infrastructures be Headed?
D.H. Marks – MIT Laboratory for Energy and the Environment October 2007 11

The Public has Hidden Its Head in the Sand on Energy Issues
• Frequently Asked Questions from the Public
»When will the Oil Age end?
A Better Question Might be When will the Fossil Age End?
»Why not do a Project Apollo Approach on Renewables?
D.H. Marks – MIT Laboratory for Energy and the Environment October 2007 12
Renewables?
»Isn’t Hydrogen the Answer?
•Depends on What the Question is.
»Why isn’t there more Conservation?
•What Do You Drive? How Big is your House?
»Of Course I know Where My Electricity Comes From! From the Wall Plug.
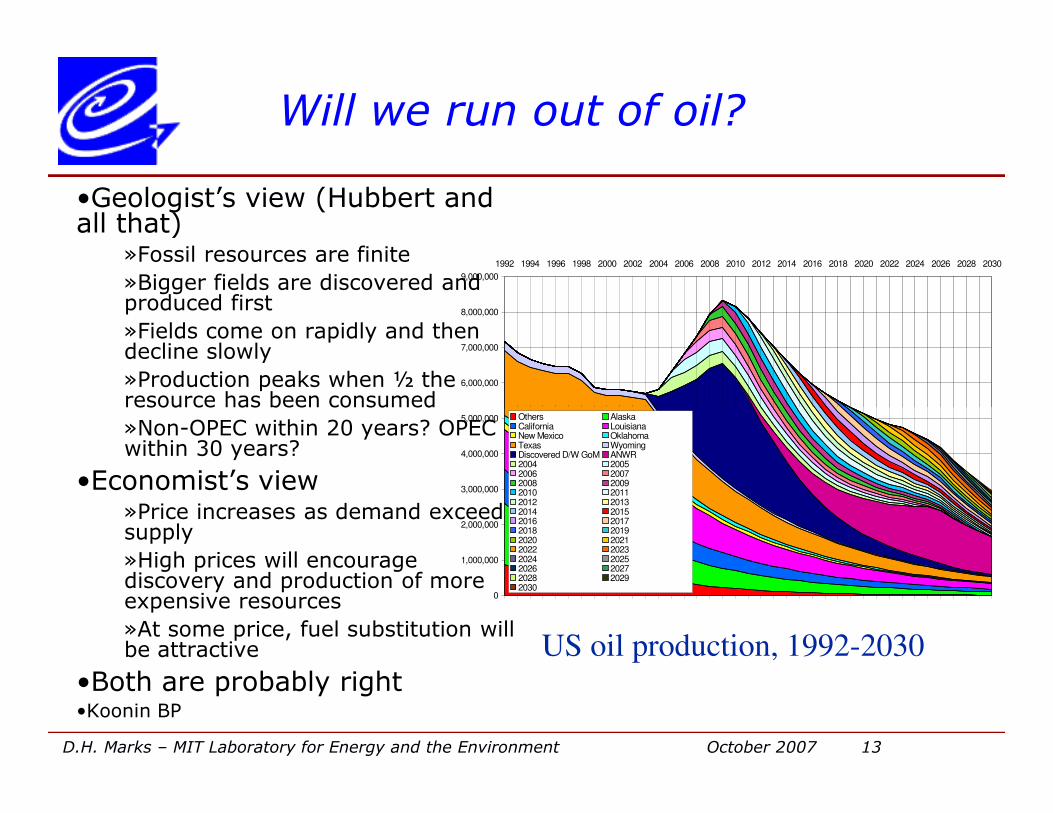
Will we run out of oil?
•Geologist’s view (Hubbert and all that)
»Fossil resources are finite
»Bigger fields are discovered and produced first
»Fields come on rapidly and then decline slowly
»Production peaks when ½ the resource has been consumed
6,000,000
7,000,000
8,000,000
9,000,000
1992 1994 1996 1998 2000 2002 2004 2006 2008 2010 2012 2014 2016 2018 2020 2022 2024 2026 2028 2030
D.H. Marks – MIT Laboratory for Energy and the Environment October 2007 13
resource has been consumed
»Non-OPEC within 20 years? OPEC within 30 years?
•Economist’s view»Price increases as demand exceeds supply
»High prices will encourage discovery and production of more expensive resources
»At some price, fuel substitution will be attractive
•Both are probably right •Koonin BP
0
1,000,000
2,000,000
3,000,000
4,000,000
5,000,000 Others AlaskaCalifornia LouisianaNew Mexico OklahomaTexas WyomingDiscovered D/W GoM ANWR2004 20052006 20072008 20092010 20112012 20132014 20152016 20172018 20192020 20212022 20232024 20252026 20272028 20292030
US oil production, 1992-2030

Substantial Global Fossil Resources
C���C���C���C���C���C���C���C���
������������������������������������������������������������������������������������������������
��� �� ������� �� ������� �� ������� �� ������� �� ������� �� ������� �� ������� �� ����
����������������������������������������������������������������������������������������������������������������
K���K���K���K���K���K���K���K���O��O��O��O��O��O��O��O��
R/P = 41 yrs
R/P > 200 yrs
D.H. Marks – MIT Laboratory for Energy and the Environment October 2007 14
G��G��G��G��G��G��G��G��
����� ���������� ���������� ���������� ���������� ���������� ���������� ���������� �����
����� ���������� ���������� ���������� ���������� ���������� ���������� ���������� �����
S������ BP ��������� K�����
����� ���������� ���������� ���������� ���������� ���������� ���������� ���������� �����
R/P = 67 yrs

Hydrocarbon Fungibility
Primary Energy Source
Syngas Step Conversion Technology Products
Fischer Tropsch
(FT)
Upgrading
Lubes
Naphtha
DieselSyngas to Liquids (GTL) Process
Natural Gas
D.H. Marks – MIT Laboratory for Energy and the Environment October 2007 15
Syngas(CO + H2)
Mixed Alcohols (e.g. ethanol, propanol)
Syngas to Chemicals Technologies
Methanol
Acetic Acid
Others (e.g. Triptane, DME, etc)
Coal
Biomass
Hydrogen
Extra
Heavy Oil

Hydrogen economy
Sustainable energy
markets
Constrained hydrocarbon
economy
hydrogen
tim
e
Hydrogen economy
Sustainable energy
markets
Constrained hydrocarbon
economy
hydrogen
tim
e
Hydrogen economy
Sustainable energy
markets
Constrained hydrocarbon
economy
hydrogen
tim
e
Pathways to more sustainable energy
D.H. Marks – MIT Laboratory for Energy and the Environment October 2007 16
hydrocarbons ….. oxygenates
fossilbiomass
solar, wind, ...
market sharetim
e
hydrocarbon fuels …..bio-fuels
hydrocarbons ….. oxygenates
fossilbiomass
solar, wind, ...
market sharetim
e
hydrocarbons ….. oxygenates
fossilbiomass
solar, wind, ...
market sharetim
e
hydrocarbon fuels …..bio-fuels

Renewables: A Small but Growing Share of Primary Energy
Total primary energy: 410 EJ/year Renewables: 4 EJ/year
Gas
Hydro
Nuclear
WindSolar
PV
Solar
thermal
D.H. Marks – MIT Laboratory for Energy and the Environment October 2007 17
Oil
Coal
Nuclear
Renewables
Bio-
mass
BiofuelsGeothermal

Significant hydrocarbon resource potential
0
200
400
600
800
1000
1200 N���� A������N���� A������N���� A������N���� A������
R������� P�������� �������
0
200
400
600
800
1000
1200
FSUFSUFSUFSU
O�� G�� C���
R������� P�������� �������
Gas E�����E�����E�����E�����
0
200
400
600
800
1000
1200
R������� P�������� �������
O�� G�� C���
1200
R������� P�������� �������
O��� G�� ��� C��� R�������� �� R����� �������
D.H. Marks – MIT Laboratory for Energy and the Environment October 2007 18
S������ BP D��� K�����
0
200
400
600
800
1000
1200
S���� A������S���� A������S���� A������S���� A������
0
O�� G�� C���
O�� G�� C���
R������� P�������� �������
0
200
400
600
800
1000
1200
A�����A�����A�����A�����
O�� G�� C���
R������� P�������� �������
0
200
400
600
800
1000 M����� E���M����� E���M����� E���M����� E���
O�� G�� C���
R������� P�������� �������
0
200
400
600
800
1000
1200
A���A���A���A���
P������P������P������P������
O�� G�� C���
R������� P�������� �������
Key:
- unconventional oil
- conventional oil - gas
- coal

…and dislocation of supply & demand
R������� S���� �� ���� C���������� �� R������� ��� O��� G�� � C���
O��O��O��O��
G��G��G��G��
C���C���C���C���
D.H. Marks – MIT Laboratory for Energy and the Environment October 2007 19
� R��� �� ������ � ������� ������ ������� �N� A������� E����� ��� A��� P�������K���K���K���K���
N���� ��� ������� ������� �� ���
������� �������������� ��������
���������
S������ BP D���� IEA �EO ����
������������
������������
C����������C����������C����������C����������R�������R�������R�������R�������
������������
������������
C����������C����������C����������C���������� R�������R�������R�������R�������
������������
������������
C����������C����������C����������C���������� R�������R�������R�������R�������
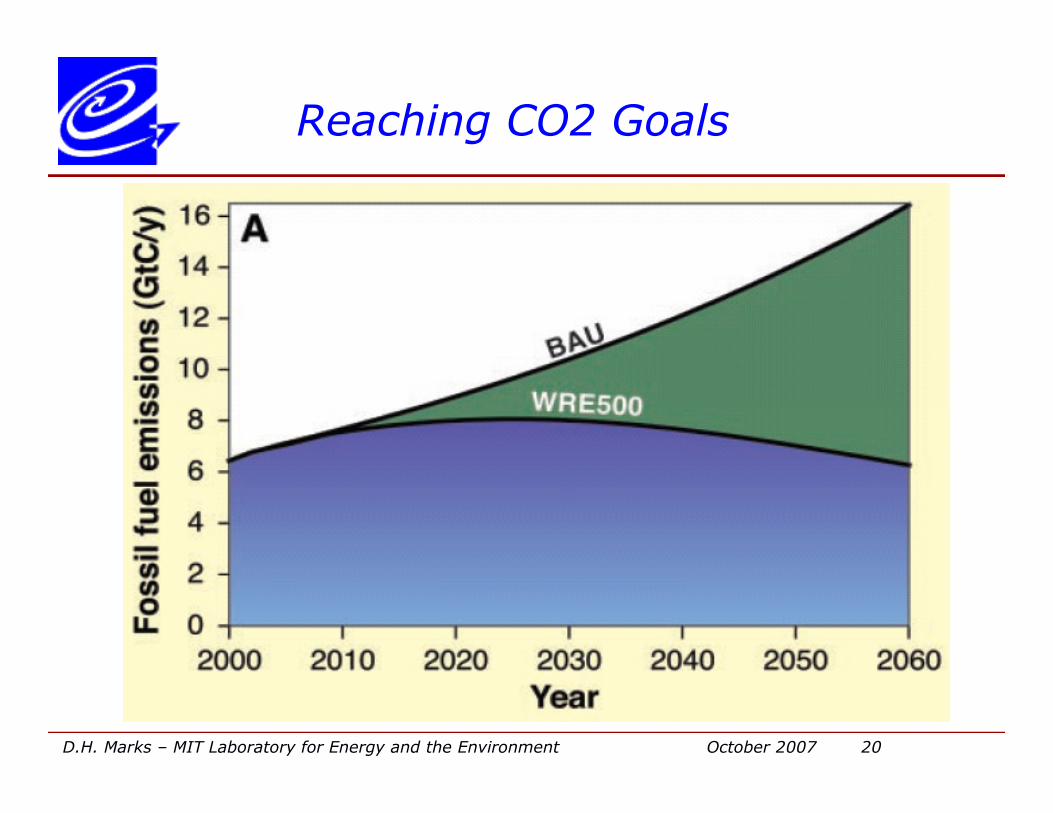
Reaching CO2 Goals
D.H. Marks – MIT Laboratory for Energy and the Environment October 2007 20

What Might We Do?
D.H. Marks – MIT Laboratory for Energy and the Environment October 2007 21
Efficiency and Conservation
• Increase the rate of decrease in energy use per unit of GDP
• Option 1 Increase Fuel Economy
› 2 Billion Cars from 30 to 60 miles per gallon
• Option 2 Reduce per car miles per year
»Drive 5000 miles instead of 10000 miles per year
D.H. Marks – MIT Laboratory for Energy and the Environment October 2007 22
»Drive 5000 miles instead of 10000 miles per year
• Option 3 More Efficient Buildings
»Cut energy use in future buildings by 25%
• Option 4 Improve power plant efficiency
»Produce twice today's coal power output at 60% instead of 40%
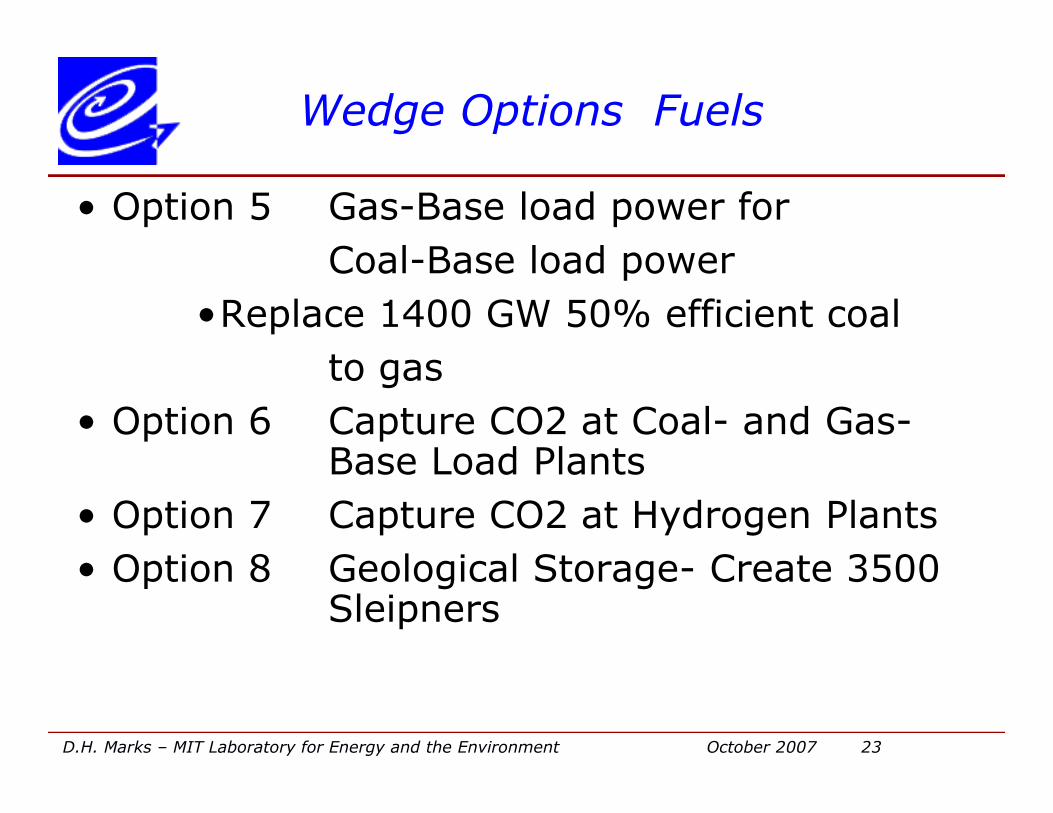
Wedge Options Fuels
• Option 5 Gas-Base load power for
Coal-Base load power
•Replace 1400 GW 50% efficient coal
to gas
• Option 6 Capture CO2 at Coal- and Gas-
D.H. Marks – MIT Laboratory for Energy and the Environment October 2007 23
• Option 6 Capture CO2 at Coal- and Gas-Base Load Plants
• Option 7 Capture CO2 at Hydrogen Plants
• Option 8 Geological Storage- Create 3500 Sleipners
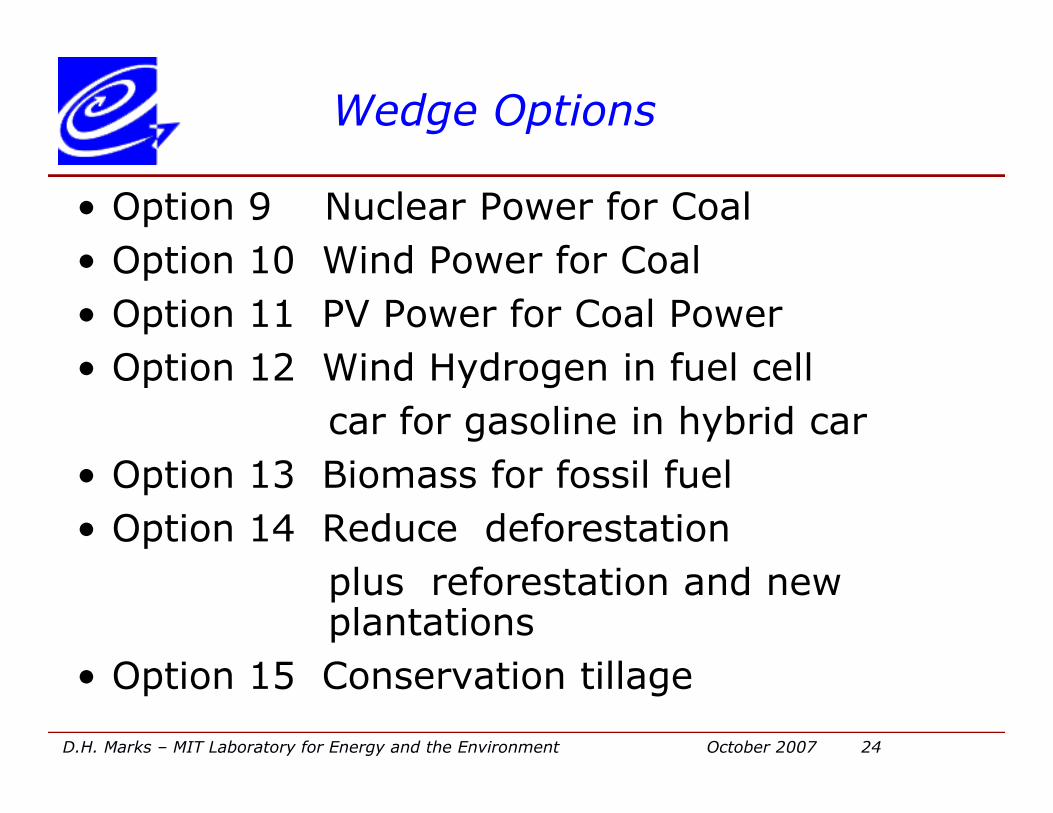
Wedge Options
• Option 9 Nuclear Power for Coal
• Option 10 Wind Power for Coal
• Option 11 PV Power for Coal Power
• Option 12 Wind Hydrogen in fuel cell
car for gasoline in hybrid car
D.H. Marks – MIT Laboratory for Energy and the Environment October 2007 24
car for gasoline in hybrid car
• Option 13 Biomass for fossil fuel
• Option 14 Reduce deforestation
plus reforestation and new plantations
• Option 15 Conservation tillage
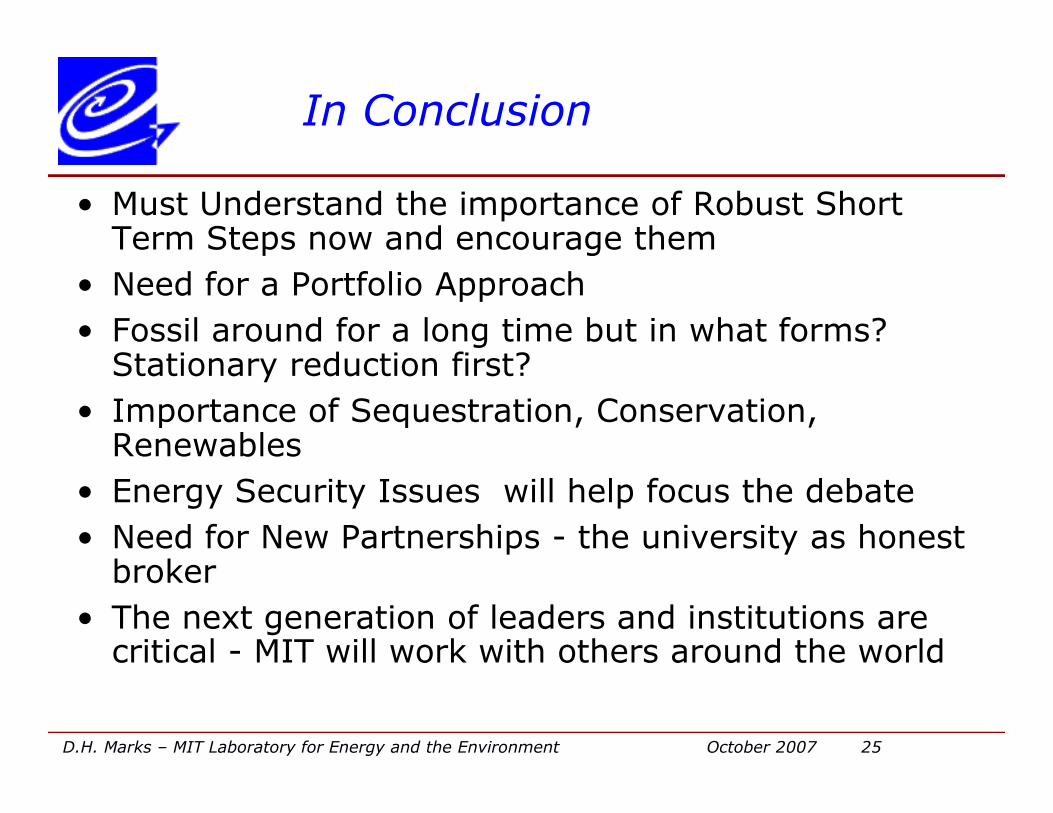
In Conclusion
• Must Understand the importance of Robust Short Term Steps now and encourage them
• Need for a Portfolio Approach
• Fossil around for a long time but in what forms? Stationary reduction first?
• Importance of Sequestration, Conservation,
D.H. Marks – MIT Laboratory for Energy and the Environment October 2007 25
• Importance of Sequestration, Conservation, Renewables
• Energy Security Issues will help focus the debate
• Need for New Partnerships - the university as honest broker
• The next generation of leaders and institutions are critical - MIT will work with others around the world