A CGE Analysis of Pakistan-Turkey Free Trade … CGE Analysis of Pakistan-Turkey Free Trade...
19
Munich Personal RePEc Archive A CGE Analysis of Pakistan-Turkey Free Trade Agreement Ashfaque Ali 14 April 2017 Online at https://mpra.ub.uni-muenchen.de/78318/ MPRA Paper No. 78318, posted 17 April 2017 09:29 UTC
Transcript of A CGE Analysis of Pakistan-Turkey Free Trade … CGE Analysis of Pakistan-Turkey Free Trade...
MPRAMunich Personal RePEc Archive
A CGE Analysis of Pakistan-Turkey FreeTrade Agreement
Ashfaque Ali
14 April 2017
Online at https://mpra.ub.uni-muenchen.de/78318/MPRA Paper No. 78318, posted 17 April 2017 09:29 UTC
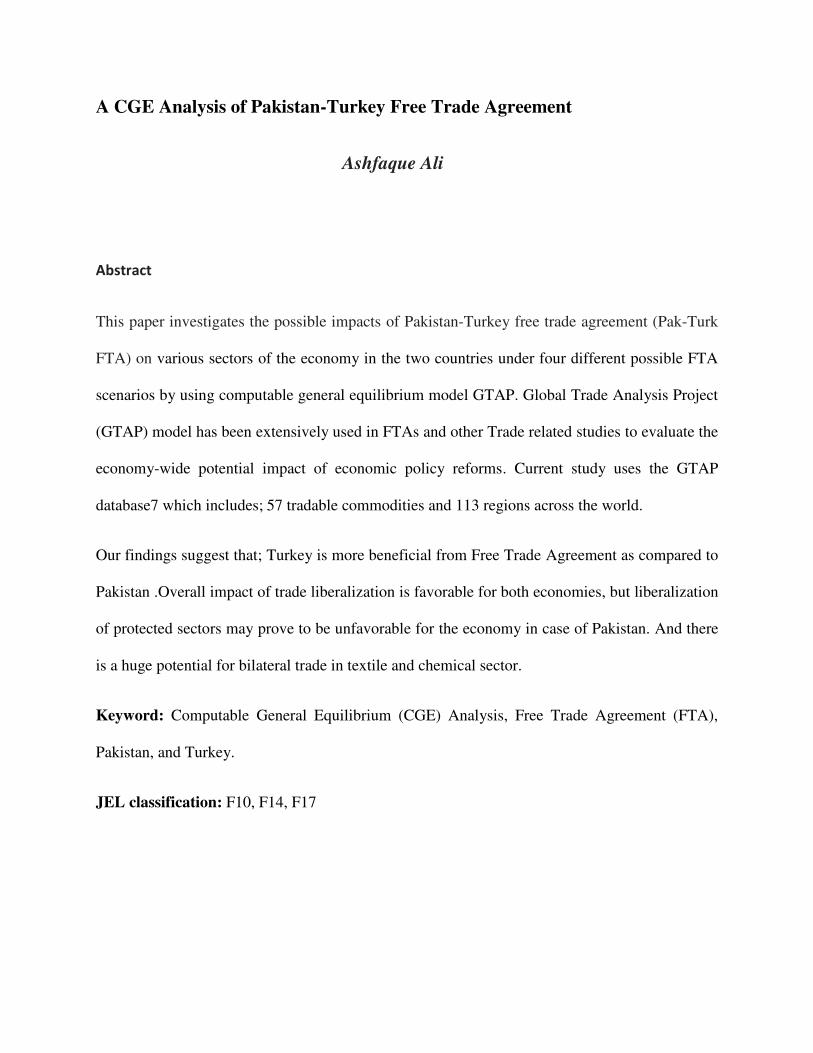
A CGE Analysis of Pakistan-Turkey Free Trade Agreement
Ashfaque Ali
Abstract
This paper investigates the possible impacts of Pakistan-Turkey free trade agreement (Pak-Turk
FTA) on various sectors of the economy in the two countries under four different possible FTA
scenarios by using computable general equilibrium model GTAP. Global Trade Analysis Project
(GTAP) model has been extensively used in FTAs and other Trade related studies to evaluate the
economy-wide potential impact of economic policy reforms. Current study uses the GTAP
database7 which includes; 57 tradable commodities and 113 regions across the world.
Our findings suggest that; Turkey is more beneficial from Free Trade Agreement as compared to
Pakistan .Overall impact of trade liberalization is favorable for both economies, but liberalization
of protected sectors may prove to be unfavorable for the economy in case of Pakistan. And there
is a huge potential for bilateral trade in textile and chemical sector.
Keyword: Computable General Equilibrium (CGE) Analysis, Free Trade Agreement (FTA),
Pakistan, and Turkey.
JEL classification: F10, F14, F17
1. Introduction;
Turkey and Pakistan have been enjoying friendly relationships since 1948. Both countries have
not only strong political, economic, cultural and religious ties but are also emotionally well
connected. Many Turks love Pakistan because Muslims of India financially helped Turkey’s war
of independence that took place just after WWI (Hussain, 2008).
Turkey is also conceived as a model of modern Muslim state in Pakistan. After Saudi Arabia,
Turkey is the most respected and popular country among Pakistani community because Turkey
proved itself as a true friend by helping out Pakistan in hard times and natural disasters. Turkey
helped Pakistan in 2005 and 2007’s earthquakes and in 2010’s flood victims. Turkey sent
US$150 million financial aid in 2005 and eight plans full of 244 tons humanitarian aid and $10
million as financial aid for flood victims in 2010. Former Turkish Prime Minster Davutoglu
announced $20 million aid for the internally displaced persons owing to the ongoing Operation
Zarb-e-Azb.
Turkey supports Pakistan’s stance on Kashmir issue and in turn, Pakistan also maintenance
Turkey’s stance with respect to northern Cyprus. Turkey and Pakistan have strong military and
strategic cooperation, with the provision of equipment and military training to soldiers. Pakistan
and Turkey have long experience of working together in different organizations and agreements.
Both countries are part organizations like Economic Cooperation Organization, D-8, and
Organization of Islamic Cooperation. They have done agreements include; Trade Agreement
1965, Economic and Technical Cooperation Agreement 1976, Prevention of Double Taxation
Agreement 1988 and Reciprocal Promotion and Protection of Investments 1997 (CIDOB, 2012).
Turkey-Pakistan Business Council was founded in order to build up strong relations between the
private sectors of the two countries and encourage trade. Turkey-Pakistan Business Council and
the Union of Chambers and Commodity Exchanges of Turkey are closely cooperating with the
Federation of Pakistan Chambers of Commerce and Industry to provide a common platform to
both side’s business communities to easily interact with each other and further enhance business
relations.
Despite of all Pakistan’s and Turkey’s efforts to enhance trade, the volume of trade remained
very low. One of the reasons of low trade is that both countries trade in similar products such as
cotton, rice, leather and textiles and have same target markets.
Many Pakistani and Turkish economists suggested that even though both countries have similar
products and same target markets, but they still can trade on basis of comparative advantages.
Pakistan can import Turkish dairy products and refrigerators, washing machines, electronic
goods, automobiles and other durable items, which are qualitatively better and cheaper than
Western, East Asian products. Likewise, Turkey can import dried fruit, handicrafts, rice, cotton
and textiles from Pakistan, because these products are comparatively cheaper in Pakistan than
any other place in the world (Business Council, 2015).
A High Level Cooperation Council (HLCC) at the prime ministerial level was established in
2009 and is expected to meet annually in both countries to review trade and economic
cooperation. The HLCC is mandated to oversee and steer the unique partnership and intensify
cooperation between the two countries at the first HLCC meeting held in Ankara in December
2010. 18 Memorandums of Understanding (MoUs) and agreements were signed between the two
countries. Another nine cooperation agreements relating to investment, energy, and
communications were finalized at the second HLCC meeting held in Pakistan in May 2012.
3rd high level cooperation council meeting held in Ankara on 17th September 2013, 12
memorandums of understanding (MOUs) and agreements signed relating intensify cooperation in
diverse fields, including trade, energy, infrastructure development, security, education, culture
and science and technology as well as enhanced efforts for peace in the region.
4th HLCC meeting held in Islamabad on 17th February 2015, 11 different MOUs signed relating
to fight against terrorism, security, trade, energy, transportation and other areas. Prime Minister
of Turkey Ahmet Davutoglu and Prime Minister Nawaz Sharif, which had decided to begin
negotiations of a comprehensive Free Trade Agreement between the two countries and Sat an
ambitious target of taking the bilateral trade from existing $3 billion to $5-10 billion in the next
few years.
Since 2015, three rounds of FTA talks have taken place, two in Ankara and one in Islamabad.
Both countries signed the Terms of Reference for negotiations on bilateral Free Trade
Agreement in the first round of talks.
During the second and the third round, the matters pertaining to tariffs, customs facilitation, and
safeguard measures, rules of origin, tariff reduction modality, bilateral investment mechanisms,
and services were discussed extensively.
The 4th Round of Pakistan-Turkey Free Trade Agreement negotiations held in Islamabad on 29th
August 2016, in which both countries have agreed to eliminate 85% percent tariffs, shall include
regulatory duties and additional duties in case of Pakistan; and additional duties and mass
housing fund duties in case of Turkey.
2. Objectives from FTA:
Turkey wants to expand its export market for products like vehicles, electrical equipment and
machineries in Pakistan. There is huge potential for these products. On the other hand, Pakistan
wants to remove anti-dumping duties that Turkish government has imposed on their top exports
in form of safeguard measures on average 20% to 25% (Business Council, 2015).
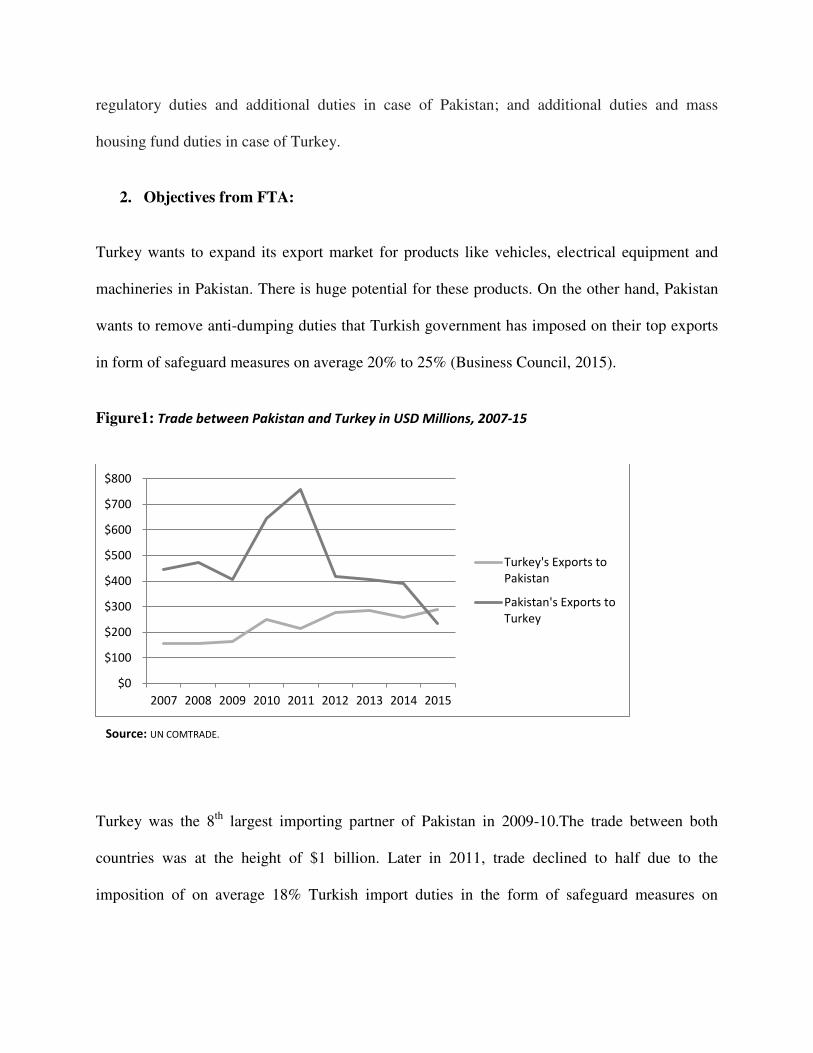
Figure1: Trade between Pakistan and Turkey in USD Millions, 2007-15
Turkey was the 8th largest importing partner of Pakistan in 2009-10.The trade between both
countries was at the height of $1 billion. Later in 2011, trade declined to half due to the
imposition of on average 18% Turkish import duties in the form of safeguard measures on
$0
$100
$200
$300
$400
$500
$600
$700
$800
2007 2008 2009 2010 2011 2012 2013 2014 2015
Turkey's Exports to
Pakistan
Pakistan's Exports to
Turkey
Source: UN COMTRADE.
imports from developing countries. Throughout 2007 to 2015, mostly trade remained in favor of
Pakistan and major exports to Turkey were garments, fabrics, and cotton.
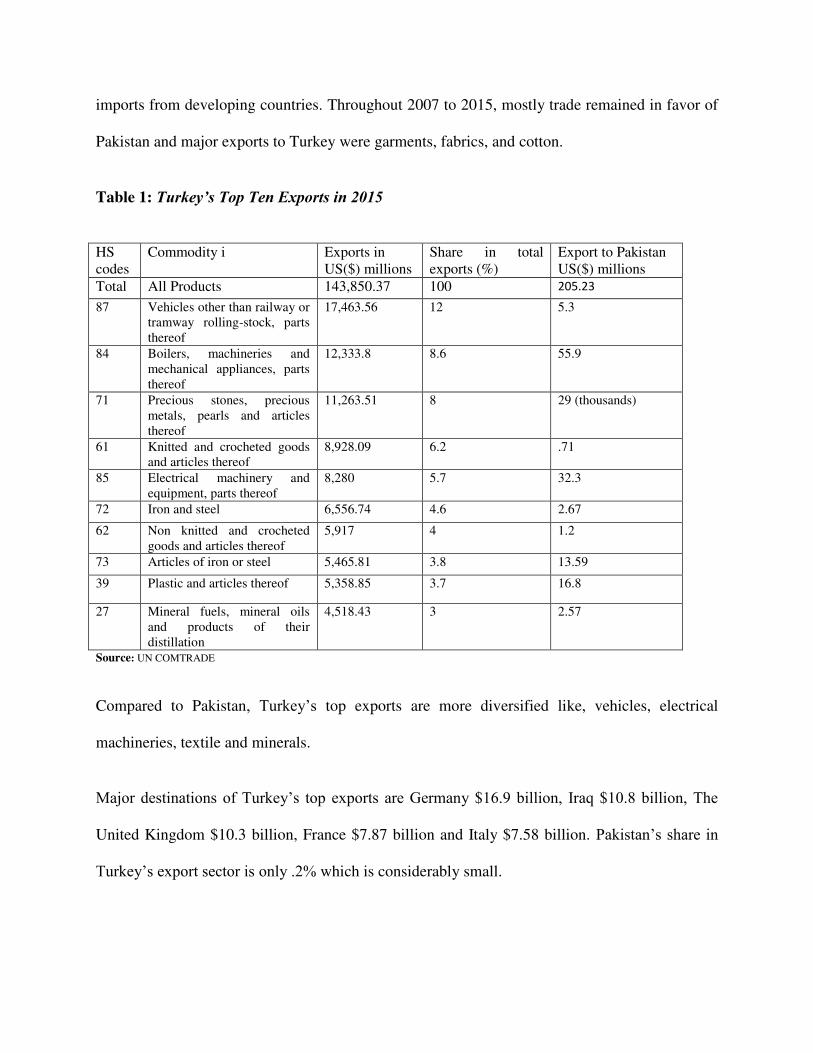
Table 1: Turkey’s Top Ten Exports in 2015
HS codes
Commodity i Exports in US($) millions
Share in total exports (%)
Export to Pakistan US($) millions
Total All Products 143,850.37 100 205.23
87 Vehicles other than railway or tramway rolling-stock, parts thereof
17,463.56 12 5.3
84 Boilers, machineries and mechanical appliances, parts thereof
12,333.8 8.6 55.9
71 Precious stones, precious metals, pearls and articles thereof
11,263.51 8 29 (thousands)
61 Knitted and crocheted goods and articles thereof
8,928.09 6.2 .71
85 Electrical machinery and equipment, parts thereof
8,280 5.7 32.3
72 Iron and steel 6,556.74 4.6 2.67
62 Non knitted and crocheted goods and articles thereof
5,917 4 1.2
73 Articles of iron or steel 5,465.81 3.8 13.59
39 Plastic and articles thereof 5,358.85 3.7 16.8
27 Mineral fuels, mineral oils and products of their distillation
4,518.43 3 2.57
Source: UN COMTRADE
Compared to Pakistan, Turkey’s top exports are more diversified like, vehicles, electrical
machineries, textile and minerals.
Major destinations of Turkey’s top exports are Germany $16.9 billion, Iraq $10.8 billion, The
United Kingdom $10.3 billion, France $7.87 billion and Italy $7.58 billion. Pakistan’s share in
Turkey’s export sector is only .2% which is considerably small.
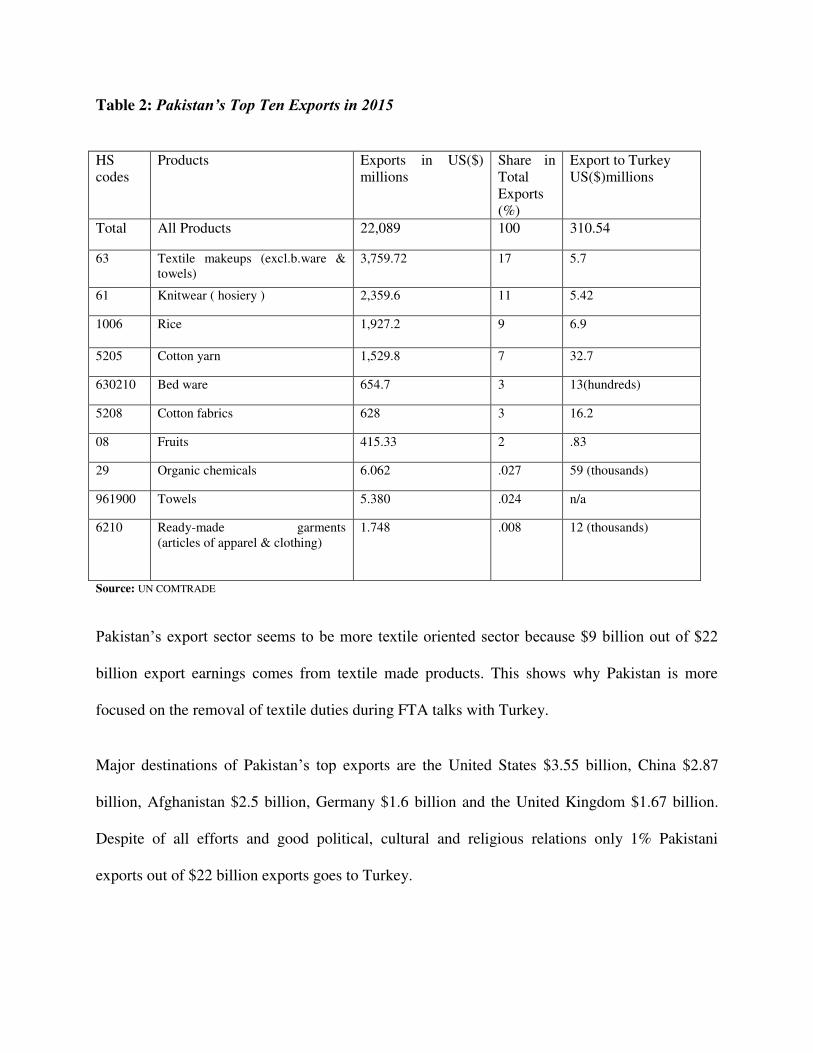
Table 2: Pakistan’s Top Ten Exports in 2015
HS codes
Products Exports in US($) millions
Share in Total Exports (%)
Export to Turkey US($)millions
Total All Products 22,089 100 310.54
63 Textile makeups (excl.b.ware & towels)
3,759.72 17 5.7
61 Knitwear ( hosiery ) 2,359.6 11 5.42
1006 Rice 1,927.2 9 6.9
5205 Cotton yarn 1,529.8 7 32.7
630210 Bed ware 654.7 3 13(hundreds)
5208 Cotton fabrics 628 3 16.2
08 Fruits 415.33 2 .83
29 Organic chemicals 6.062 .027 59 (thousands)
961900 Towels 5.380 .024 n/a
6210 Ready-made garments (articles of apparel & clothing)
1.748 .008 12 (thousands)
Source: UN COMTRADE
Pakistan’s export sector seems to be more textile oriented sector because $9 billion out of $22
billion export earnings comes from textile made products. This shows why Pakistan is more
focused on the removal of textile duties during FTA talks with Turkey.
Major destinations of Pakistan’s top exports are the United States $3.55 billion, China $2.87
billion, Afghanistan $2.5 billion, Germany $1.6 billion and the United Kingdom $1.67 billion.
Despite of all efforts and good political, cultural and religious relations only 1% Pakistani
exports out of $22 billion exports goes to Turkey.

Table 3&4: Pakistan’s Top Ten Exports to Turkey: Market Share and competitors
HS Code To Ten Product Export to Turkey
US($) Millions
Tariff
imposed by
Turkey %
Duties Other Than Tariff %
Total All products 310.54
520942 Denim fabrics of cotton,>/=85%,
more than 200 g/m2
56.42 6.5 38
520532 Cotton
yarn,>/=85%,multi,uncombed,714.29
>dtex>/=232.56,nt put up,nes
22.42 3.2 45
390760 polyethylene terephthalate 21.60 3 11
520819 Woven fabrics of cotton,>/=85%, not
more than 200 g/
m2,unbleached, nes
17.72 6.4 24.4
520512 Cotton
yarn,>/=85%,single,uncombed,714.29
>dtex>/=232.56, not put up
8.33 3.2 45
120740 Sesamum seeds, whether or not
broken
6.65 16.9
521142 Denim fabrics of cotton, <85% mixed
with m-m fib,
more than 200 g/m2
5.86 6.4 34.8
570110 Carpets of wool or fine animal hair,
knotted
5.51 4.9 50
100630 Rice, semi-milled or wholly milled,
2.44 45
220710 Undenaturd ethyl alcohol of an
alcohol strgth by vol of
80% vol/higher
2.29 27.2
HS Code Commodity i Top 5 Competitors Turkish Import
Market Share %
520942 Denim fabrics of cotton,>/=85%, more than 200 g/m2
Pakistan 26
Egypt 21
Italy 12
Turkmenistan 9
India 5
520532 Cotton yarn,>/=85%,multi,uncombed,714.29 >dtex>/=232.56,nt put up,nes
Pakistan 71
Ethiopia 14
Azerbaijan 6
India 4
Egypt 2
390760 polyethylene terephthalate China 17
Pakistan 12
India 9
Rep Of Korea 7
Germany 5
520819 Woven fabrics of cotton,>/=85%, not more than 200 g/ m2,unbleached, nes
China 49
Pakistan 44.7
Indonesia 4.5
Egypt 1
Thailand .8
520512 Cotton yarn,>/=85%,single,uncombed,714.29 >dtex>/=232.56, not put up
Turkmenistan 70
Vietnam 12
Pakistan 4
Uzbekistan 3
Kazakhstan 2 Source: UN COMTRADE
Source: PBC and UN COMTRADE

Table 5&6: Turkey’s Top Ten Exports to Pakistan: Market Share and competitors
HS Code Products Export to Pakistan US($)
Millions
Tariff Imposed By
Pakistan
Total All Products 205.23 n.a
730890 Structures& parts of structures ,i/s
(ex prefabbldgs of headg no.9406)
7.84 20
961900 Sanitary towels (pads) and tampons,
napkins and napkin liners for babies,
and similar arti
6.79 n.a
290121 Ethylene 4.48 5
290243 P-xylene 4.23
320290 Inorganic tanning subst; tanning
preps; enzymatic preps for pre-
tanning
4.12 15
390690 Acrylic polymers nes, in primary
forms
3.83 10.4
380991 Finish gagents ,dye carriers & oth
prep, nes ,for use in the textile indust
3.22 8
848310 Transmission shafts and cranks,
including cam shafts and crank shafts
2.97 31.3
200979 Apple juice, unfermented, Brix value >
20 at 20°C, whether or not cont
.77 25
300220 Vaccines, human use .52 6.7
HS Code Commodity i Top 5 Competitors Pakistani Import
Market Share %
730890 Structures& parts of structures ,i/s (ex prefabbldgs of headg no.9406)
China 50
Rep Of Korea 17
Turkey 12
Japan 7
UAE 6
961900 Sanitary towels (pads) and tampons, napkins and napkin liners for babies, and similar arti
Egypt 40
China 40
Saudi Arab 11
Turkey 6
Hungary 3
290121 Ethylene UAE 51
Italy 13
Turkey 6
Malaysia 6
Netherland 5
290243 P-xylene Kuwait 46
Saudi Arab 42
India 10
Turkey 1.5
Oman .004
320290 Inorganic tanning subst; tanning preps; enzymatic preps for pre-tanning
Turkey 43
South Africa 27
India 13
Germany 6
Argentina 2
Source: UN COMTRDE
Source: PBC and UN COMTRADE.
Turkey is not only a major textile exporter country, but it also imports textile products in large
quantities. In 2015, Turkey has imported approximately $3.734 billion’s worth textile products
from all over the world, and the most textile imports come from China, Bangladesh, India and
Vietnam.
The major challenge for Turkey is that, even though more than 100 Turkish firms are working in
Pakistan in the field of infrastructure and transport, but still they are less integrated in Pakistani
business community compared to their competitors.
Pakistan’s performance is comparatively better in Turkish imports market than its competitors
and this FTA will further provide an advantage to Pakistan over its competitors. Pakistan’s major
challenge is to make Turkey agree on removal of additional duties in the form of safeguard
measures on Pakistani products.
3. Literature Review
(Suvankulov & Ali, 2012) used gravity model to analyze the trends and prospects of bilateral
trade between Turkey and Pakistan. The findings of model revealed that, for Turkish exports to
Pakistan grew from $251.3 million in 1996 to $749.2 million in 2009, but the factual numbers
were substantially lower than the projected numbers. On the other hand in case Pakistani exports
to Turkey model projected growth was from $93.2 million in 1996 to $294.3 million in 2009, but
the actual performance of Pakistani exports were better than the projected. Authors concluded
that, there is an existence of extensive unexploited potential for Turkish exports in Pakistan and
FTA will facilitate the partnership and provide momentum for Turkish business in their efforts to
tap Pakistani market.

(Gul, 2014) used three different trade indices; Trade Complementary Index (TCI), Export
Similarity Index and Intra-Industry Trade Index. In her study to analyze Pakistan’s trade
potential with Turkey, the results of TCI were favoring Turkey. TCI for Turkish exports to
Pakistan imports was 26.89 and TCI for Pakistani exports to Turkish imports was 13.6.
The IIT for Pakistan and Turkey was 18.8% and according to results of export similarity index
almost 39% of both countries exports are similar.
Study conducted by (KCCI, 2015) to find out comparative advantages of both countries by using
Trade Specialization Index. Findings of the study revealed that, Pakistan has comparative
advantages over Turkey in 25 products and most of those were textile products. While, Turkey
has comparative advantage over Pakistan in 52 products.
From the above studies we can conclude that, there are great benefits for both countries to do
trade on the basis of FTA. However, Turkey is comparatively more beneficial from FTA than
Pakistan but despite of that fact, Turkey has failed to fully utilize its potential benefits form trade
for many years.
It is important to note that none of the above studies have taken into account the final tariff
schedule as agreed by the both countries. And also, no analysis has been made to assess the
overall impact of FTA on both economies because previous studies focused on partial
equilibrium models to evaluate the impact of trade agreement but partial equilibrium model
aren’t capable of capturing economy-wide impact of an FTA.
The objectives of the present study therefore was to fill this gap by applying a general
equilibrium methodology to help in assessing the possible impact of this trade agreement on the
both economies as well as on the sectors of their economy and find out the best tariff schedule
scenarios for both countries individually and mutually in the context of ongoing negotiations
between Pakistan and Turkey.
4. Methodology:
There are two different approaches to analyze the impacts of policy changes; a) partial
equilibrium and b) general equilibrium. Partial equilibrium models are comparatively simple and
evaluate the impacts of policy changes on few selected sectors of the economy. On the other
hand, general equilibrium models are comparatively complex and evaluate the economy-wide
impact of a policy change.
Since the objective of this study is to evaluate the economy-wide impact of FTA on both
countries, so for the purpose of analysis I selected the widely used general equilibrium model in
trade GTAP (Global Trade Analysis Project).
GTAP provides an economy-wide framework for analysis that includes the interdependencies
within and between countries. The model includes; industrial sectors, households and
governments across the countries.
Following are some important features of the GTAP model:
a) Economy is at equilibrium when, all firms have zero real profit, households are on their
budget constraints and global saving is equals to global investment.
b) Global Consumption equals to global production
c) Prices and quantities are simultaneously determined in both commodity and factor
market.
d) Factors of production; land, capital, skilled labor, unskilled labor and natural resources.
e) Firms operate under constant returns to scale, where technology described by Leontief
and CES functions.
f) Firms minimize cost of inputs given their level of output and fixed technology.
g) Domestically produced goods and imports are imperfectly substituted (based on
Armington elasticity).
h) Household’s behavior is determined from an aggregate utility function, which is modeled
by using Cobb-Douglas function with constant expenditure share.
5. Data and Aggregation
GTAP model uses the GTAP database, in this analysis we used GTAP database 7. The reference
year for this database is 2004 and database includes; 113 regions across the world and 57
tradable commodities of the World. The tariff data is mainly in the form of applied ad valorem
rates. The current study has aggregated 57 commodities into18, and 113 regions into 12.
Regions include; Turkey, Pakistan, EU, Sub-Saharan Africa, Latin America, North America,
MENA, South Asia, South East Asia, East Asia, Oceania and Rest of world.
Sectors include; Leather, Apparels, Textile, Agriculture, Processed Rice, Paddy rice, Minerals,
Chemicals, Electronics, Metal, Machinery, Vehicles, Extraction, Processed Food, Light
Manufacturing, Utility _construction, Transport & communication and other service.
We build four different scenarios to analyze the possible impacts of the PAK-TURK FTA, and in
order to make it more realistic model also takes into account, the protected sectors of the both
economies. In case of Pakistan textile and automobile are two protect sectors and in case of
Turkey, Rice and Agriculture sectors are considered as protected sectors.

Scenarios;
Simulation1. Full trade liberalization in all sectors
Simulation2. 85% trade liberalization in all sectors (based on agreement)
Simulation3. 85% trade liberalization in all sectors other than protected sectors.
Simulation4. 85% trade liberalization in other than protected sectors and 50% trade liberalization
in protected sectors.
6. Results of Simulations;
Table 7: Sectorial impacts of FTA
Sectors Simulation 1 Simulation 2 Simulation 3 Simulation 4
Turkey Pakistan Turkey Pakistan Turkey Pakistan Turkey Pakistan
Leather -0.14 -0.42 -0.11 -0.47 -0.06 -0.36 -0.08 -0.38
Apparels 0.14 -0.28 0.15 -0.34 0.16 -0.35 0.15 -0.32
Textile 0.19 1.07 0.16 0.76 0.06 0.79 0.11 0.81
Agriculture -0.15 0.50 -0.15 0.26 -0.10 -0.42 -0.10 -0.03
Processed Rice -0.05 -0.16 -0.06 -0.27 -0.08 -0.27 -0.06 -0.24
Paddy rice -0.28 -0.80 -0.24 -0.76 -0.21 -0.58 -0.21 -0.63
Minerals 0.53 -0.47 0.35 -0.48 0.44 -0.42 0.43 -0.42
Chemicals 0.50 1.00 0.36 0.72 0.41 0.79 0.40 0.79
Electronics 0.13 -0.37 0.05 -0.39 0.13 -0.37 0.12 -0.37
Metal 0.10 -0.24 0.04 -0.28 0.10 -0.24 0.08 -0.24
Machinery 0.46 -0.13 0.31 -0.17 0.39 -0.16 0.37 -0.16
Vehicles and parts
0.14 0.54 0.06 0.45 -0.11 0.08 -0.02 0.22
Extraction 0.23 0.45 0.13 0.35 0.16 0.31 0.15 0.31
Processed Food -0.02 -0.31 -0.05 -0.37 0.00 -0.27 -0.01 -0.27
Light Manufacturing
0.27 -0.22 0.17 -0.26 0.24 -0.23 0.23 -0.22
Utility & construction
-0.19 -0.37 -0.18 -0.40 -0.12 -0.32 -0.13 -0.32
Transport& Communication
-0.13 -0.30 -0.14 -0.35 -0.09 -0.27 -0.09 -0.27
Other Services -0.17 -0.39 -0.18 -0.45 -0.11 -0.34 -0.12 -0.34

Table 8: Summary of different simulations
Change Simulation 1 Simulation 2 Simulation 3 Simulation 4
Turkey Pakistan Turkey Pakistan Turkey Pakistan Turkey Pakistan
Terms of trade % 0.036 0.105 0.026 0.090 0.021 0.097 0.023 0.094
Allocative efficiency 10.49 -5.65 9.60 -1.38 8.56 3.16 9.12 1.92
Trade balance millions $
-42.79 -46.01 -32.62 -37.32 -27.11 -35.61 -29.48 -36.52
GDP millions $ 11.85 -5.85 9.59 -1.37 8.56 3.16 9.13 1.92
GDP% 0.0038 -0.0062 0.0032 -0.0015 0.0029 0.0033 0.0031 0.0020
Exports millions $ 68.00 42.00 53.32 29.06 48.28 15.80 50.49 21.11
Exports % 0.0800 0.2500 0.0637 0.1746 0.0577 0.0949 0.0603 0.1268
Welfare Effect millions $
47.17 11.50 36.21 14.92 29.35 22.12 32.42 19.88
Terms of trade (ToT) is the ratio of export price index of the region to its import price index and a
positive ToT is good for an economy because it shows; higher exports prices compares to its
imports prices.
In case of Pakistan and Turkey, liberalization seems to be positively related to the terms of trade,
as liberalization increases from 85% (Simulation2) to 100% (Simulation1) in Table 8, the terms of
trade of the both countries also improve.
Allocative efficiency represents the efficient allocation of scarce resources and allocative
efficiency increases when any change in the allocation of scarce resources improves the national
welfare. Increase in taxed activities and decrease in subsidized activities encourages the efficiency
because allocative efficiency is directly related to taxed activities and inversely related to
subsidized activities (Sikdar, 2011).
In case of Pakistan liberalization of all sectors other than protected sectors is positively related to
allocative efficiency and the liberalization of protect sectors is negatively related to efficiency. And
contributions of textile and chemical sectors are high in efficiency gains. Whereas, in Turkey
allocative efficiency improves with the increase in level of liberalization and the major

contributions in the efficiency gains come from the efficient allocation of unskilled labor and
capital.
Trade Liberalization is positively related to trade deficit for both countries; trade deficit increases
with the rise in level of liberalization.
In GTAP model, welfare effect is derived from aggregate utility function which allocates
household expenditure across three broad categories: private, government, and savings
expenditures (Huff & Hertel, 2000). Any change in aggregate utility function due to the policy
changes is called equivalent variation (EV). Turkey’s welfare rises with the increment in
liberalization; while Pakistan’s welfare is negatively related to the liberalization of protected sector
and positively to the liberalization of all other sectors. The liberalization of protected sectors in
Pakistan raises the efficiency losses and losses to producer welfare (due to increased competition)
are larger in comparison to gains in consumer welfare (due to decline in prices).
7. Conclusion:
For Pakistan scenario3 is favorable and scenrio1 is favorable in case of Turkey, because
Pakistan’s gains in GDP, welfare and efficiency are higher in scenrio3 compares to other three
scenarios and Turkey’s gain in GDP, welfare, export and efficiency are higher in scenrio1
compares to other scenarios. Scenrio-3 seems to be a point at which mutual gains from FTA are
higher to both economies compared to any other scenario.
This study also confirms the results of previous studies by (Suvankulov & Ali, 2012) and (Gul,
2014) that Turkey is more beneficial from FTA compared to Pakistan. Trade liberalization is
overall a beneficial choice for both economies but liberalization of protected sectors may prove
to be an unfavorable decision for Pakistani economy.
References
AYDIN, F., SAYGILI, H., & SAYGILI, M. (2007). Empirical Analysis of Structural Change in
Turkish Exports. Research and Monetary Policy Department. Ankra: The Central Bank of
the Republic of Turkey.
BROCKMEIER, M. (2001). A Graphical Exposition of the GTAP Model. GTAPTechnical
Paper No. 8.
Business Council, T. P. (2015). The Proposed Pakistan Turkey Free Trade Agreement, Pakistan
must not let emotions dictate this FTA! Karachi: The Pakistan Business Council.
CIDOB. (2012). Foreign Relations of Pakistan. CIDOB International Yearbook.
Estrada, G., Park, D., Park, I., & Park, S. (2012). The PRC’s Free Trade Agreements with
ASEAN, Japan,and the Republic of Korea: A Comparative Analysis. ADB Working
Paper Series on.
Gul, A. (2014). Analyzing Pakistan’s Trade Opportunity with Turkey. The Lahore Journal of
Economics, 349-370.
Hertel, T. W., & Tsigas, M. E. (1997). Structure of GTAP. Global Trade Analysis: modeling and
applications, 13-73.
Huff, K. M., & Hertel, T. W. (2000). Decomposing welfare changes in the GTAP model. GTAP
Technical Paper No. 5.
Hussain, M. (2008). PAK-TURKEY RELATIONS: On the Common Ties. Alternatives: Turkish
Journal of International Relations, 7, 67-85.

KCCI. (2015). Pakistan Turkey FTA In The Offing Learning From The China Experience.
Research & Development Cell. Karach: Karachi Chamber of Commerce & Industry.
McDonald, S., Robinson, S., & Thierfelder, K. (2007). Globe: A SAM Based Global CGE
Model using GTAP Data. Departmental Working Papers No.14, 108.
Memon, D. A. (2014). Denim Industry of Pakistan: New import duty on denim by Turkey. PTJ.
Plummer, M. G., Cheong, D., & Hamanaka, S. (Hamanaka). Methodology for Impact Assessment
of Free Trade Agreements. Philippines: Asian Development Bank.
Sikdar, C. (2011). Potential economic impact of India-Sri Lanka bilateral trade liberalization.
Presented at the 14th Annual Conference on Global Economic Analysis. Venice, Italy .
Sonmez, Y., McDonald, S., & Perraton, J. (2007). Turkey and Its Preferential TradeAgreements
(PTAs). 10th Global Economic Analysis Conference, “Assessing the Foundations of
Global Economic Analysis”. West Lafayette, USA: Purdue University.
Suvankulov, F., & Ali, W. (2012). Recent Trends and Prospects of Bilateral Trade between
Pakistan and Turkey: A Gravity Model Approach. Journal of International and Global
Economic Studies, 57-72.
Wing, I. S. (2004). Computable General Equilibrium Models and Their Use in Economy-Wide
Policy Analysis: Everything You Ever Wanted to Know (But Were Afraid to Ask). MIT
Joint Program on the Science and Policy of Global Change.