A Catalyst for ChangeThe Regional Transport Strategy for the west of Scotland 2008-2021: Summary The...
24
A Catalyst for Change The Regional Transport Strategy for the west of Scotland 2008-21
Transcript of A Catalyst for ChangeThe Regional Transport Strategy for the west of Scotland 2008-2021: Summary The...

A Catalyst for ChangeThe Regional Transport Strategy for the west of Scotland
2008-21

working in partnershipworking in partnership

1
Contents
2 - SPT in Context
3 - Foreword
4 - The Strategy on a Page
5 - The Strategy Vision and Shared Goals
6 - The Strategy Objectives
7 - The Strategy Outcomes
8 - How the RTS supports National Outcomes
10 - Strategic Priorities
14 - SPT Working in Partnership
15 - SPT’s Core Activities
16 - Measuring Success
19 - Developing the Strategy
20 - Next Steps
21 - Supporting Information
“A Catalyst for Change – The Regional Transport Strategy for the west of Scotland 2008-21” was approved by the Minister for Transport, Infrastructure and Climate Change, Stewart Stevenson MSP, on 15th June 2008.

Nestrans
HITRANS
Tactran
SEStranSPT
SWestrans
ZetTrans
Nestrans
HITRANS
Tactran
SEStranSPT
SWestrans
ZetTrans
Council boundary
N
50 100km0
2
© Crown copyright. All rights reserved. Strathclyde Partnership for Transport. 100023445, 2008
SPT is one of seven Regional Transport Partnerships in Scotland. There are 12 councils within the SPT area, these are: East Dunbartonshire, West Dunbartonshire, Glasgow, North Lanarkshire, South Lanarkshire, East Ayrshire, North Ayrshire, South Ayrshire, Inverclyde, East Renfrewshire, Renfrewshire and part of Argyll and Bute.
Regional Transport Partnerships
SPT in Context

3
ForewordA fast, efficient, accessible and reliable transport system is vital to economic growth in the west of Scotland since good transport systems support businesses and also play an important part in breaking down the barriers of poverty, promoting social inclusion and making real changes in people’s lives.
“A Catalyst for Change, the Regional Transport Strategy for the West of Scotland 2008 -2021” sets out Strathclyde Partnership for Transport’s (SPT) vision for transport, the goals we share with partner organisations, transport objectives, our strategic priorities for transport and the indicators we will use to measure delivery for the first 5 years of the Strategy’s implementation. The Partnership of the 12 west of Scotland councils supports the Scottish Government in taking forward the transport interventions that support national priorities for a wealthier, fairer, healthier, safer, stronger, smarter and greener Scotland. This Regional Transport Strategy (RTS) identifies the complementary regional transport outcomes and strategic priorities that set the scope for SPT’s role in working towards 4 key transport outcomes:
• Improved connectivity • Access for all • Reduced emissions • Attractive, seamless, reliable travel
Extensive consultation informed all stages of the development of the Strategy and in response our Strategy gives particular priority to improving bus services throughout the region, to improving integration between different services and types of transport, and between transport and land use planning. While SPT will address each of the 17 priorities we identify in the Strategy, our particular focus for the first Delivery Plan will be to:
• Plan and provide a “step change” for bus services, standards, and infrastructure • Revitalise the Subway network • Improve cross-city and cross-region links on strategic corridors • Improve access to services including health care and education • Plan for the provision of transport for the Commonwealth Games 2014, tourism and major events • Improve sustainable connectivity for business and freight
We believe we have an excellent Strategy that is fully aligned with National Outcomes and we are working closely with our member Councils to integrate SPT’s strategic priorities within their 12 Single Outcome Agreements. The Strategy must now be matched with the money, resources and commitment to make it happen and we look forward to working with our partners to deliver real benefits for the travelling public and businesses in the west of Scotland.
l-r: Ron Culley and Alistair Watson
Ron CulleyChief Executive, SPT
Alistair WatsonChair, SPT

The Regional Transport Strategy for the west of Scotland2008-2021: Summary
The Vision:“A world-class sustainable transport system that acts as a catalyst for an
improved quality of life for all”
Shared GoalsObjectives
Strategic Priorities
Strategy Outcomes
ImprovedConnectivity
Access for All ReducedEmissions
Attractive,Seamless, Reliable
Travel
Developing the masstransit network
Improving access tokey gateways
Improving cross-city and cross-region linkson strategic corridors
Improving sustainable connectivity for
business and freight
Planning for theprovision of transport
for the Commonwealth Games
2014, tourism, and major events
Planning and providingtransport for
regeneration areas
Improving access toservices, includinghealthcare and
education
Improving sociallynecessary public
transport, including Demand Responsive
Transport and Community Transport
Improving connectionsfor rural areas
Promoting equality,including making journeys safer and
addressing transportaffordability
Encouraging modal shift to sustainable
modes
Promoting 'Smarter Choices', travel
planning and activetravel
Plan and provide a 'step-change' for bus,and public transportservices, standards and infrastructure
Revitalising theSubway network
Improving interchangebetween modes
Improving travelinformation
Developingintegrated ticketing
4
StrategyVision
Wealthier &Fairer
HealthierSafer &Stronger
Smarter Greener
Develop theeconomy
Wealthier &Fairer
HealthierSafer &Stronger
Smarter Greener
Promote social inclusion &
equality
Improve health &
protect the environment
5
The Strategy Vision
“A world class sustainable transport system that acts as a catalyst for animproved quality of life for all”
The Shared Goals
Develop the economy: through improving connectivity for business and freight, making transport more effective and efficient, providing access to employment, education, shopping and leisure, by improving transport integration.
Promote social inclusion and equality: by providing a transport system that is safe, accessible, and affordable to all sections of the community.
Improve health and protect the environment: by minimising emissions and consumption of resources and energy, by promoting active travel, quality public transport and modal shift.
Contribution of Strategy Vision to Scottish Government Strategic Objectives.
Contribution of Shared Goals to Scottish Government Strategic Objectives.

Safety & Security
Wealthier &Fairer
HealthierSafer &Stronger
Smarter Greener
Modal Shift
Excellent TransportSystem
Effectiveness & Efficiency
Access for All
Environment& Health
Economy, Transport& Land-usePlanning
6
The Strategy Objectives
1. Safety and Security: To improve safety and personal security on the transport system.
2. Modal Shift: To increase the proportion of trips undertaken by walking, cycling and public
transport.
3. Excellent Transport System: To enhance the attractiveness, reliability and integration of
the transport network.
4. Effectiveness and Efficiency: To ensure the provision of effective and efficient transport
infrastructure and services to improve connectivity for people and freight.
5. Access for All: To promote and facilitate access that recognises the transport requirements
of all.
6. Environment and Health: To improve health and protect the environment by minimising
emissions and consumption of resources and energy by the transport system.
7. Economy, Transport and Land-use Planning: To support land-use planning strategies,
regeneration and development by integrating transport provision.
Contribution of Strategy Ojectives to Scottish Government Strategic Objectives.

7
The Strategy Outcomes
To provide focus, four Strategy Outcomes have been identified. Our indicators will measure achievement towards these outcomes.
Improvedconnectivity:
Access for All:
Reduced Emissions:
Attractive, Seamless, Reliable
Travel:
The west of Scotland has a transport system
that underpins a strong, sustainable economy.
The west of Scotland has a transport system that is
safe, secure and accessible to all.
The west of Scotland has a transport system that
promotes sustainable travel for a cleaner environment and
healthier lives.
The west of Scotland has a transport system that provides attractive, seamless, reliable
travel.

8
How the RTS supports the National Outcomes
The table on page 9 aligns Strategy Outcomes and Strategic Priorities to Scottish Government National Outcomes. Of the 15 National Outcomes, nine have close links with transport as shown below:
1. We live in a Scotland that is the most attractive place for doing business in Europe – Transport is a key factor in connecting businesses to markets, suppliers and staff.
2. We realise our full economic potential with more and better employment opportunities for our people – Lack of transport can be a significant barrier in getting to work, or getting back to work.
6. We live longer, healthier lives – Doing more walking and cycling can improve a person’s physical and mental health. Transport emissions can adversely affect people’s health.
7. We have tackled the significant inequalities in Scottish society – Equality groups, such as disabled people, can face significant difficulties when using the transport system e.g. physical access problems.
9. We live our lives safe from crime, disorder and danger – Safety and security improvements on transport systems and at stations can reduce crime, and fear of crime, on public transport (e.g. CCTV, lighting and presence of staff)
10. We live in well-designed, sustainable places where we are able to access the amenities and services we need – Transport plays a major role in ensuring people can access the services and amenities they need, such as a major healthcare facility. The provision of sustainable transport choices is part of a well-planned development.
12. We value and enjoy our built and natural environment and protect it and enhance it for future generations – Transport, particularly infrastructure, can have significant land-use impacts on a community, and on the natural and built environment.
14. We reduce the local and global environmental impact of our consumption and production – Transport is a major contributor of emissions that harm the environment e.g. air pollution. The use of fossil fuels contributes to global warming.
15. Our public services are high quality, continually improving, efficient and responsive to local people’s needs – Transport providers and government bodies, including SPT, need to ensure that services are provided in an effective, efficient, affordable manner, and that they continue to meet the changing needs of society.

Strategy Outcome: Improved Connectivity
1 2 6 7 9 10 12 14 15
Developing the mass transit network
Improving access to key gateways
Improving cross-city and cross-region links onstrategic corridors
Improving sustainable connectivity for businessand freight
Planning for the provision of transport for the Commonwealth Games 2014, tourism, andmajor events
Strategy Outcome: Access for All
Strategy Outcome: Reduced Emissions
Strategy Outcome: Attractive, Seamless,Reliable Travel
Planning and providing transport for regeneration areas
Improving access to services, including healthcare and education
Improving socially necessary public transport,including Demand Responsive Transport and Community Transport
Improving connections for rural areas
Promoting equality, including making journeys safer and addressing transport affordability
Encouraging modal shift to sustainable modes
Promoting 'Smarter Choices', travel planningand active travel
Plan and provide a 'step-change' for busservices,standards and infrastructure
Revitalising the Subway network
Improving interchange between modes
Improving travel information
Developing integrated ticketing
Scottish Government National Outcomes
9
Contribution of Regional Transport Strategy Outcomes and Strategic Priorities to Scottish Government National Outcomes.

SOUTH LANARKSHIRE
NORTH LANARKSHIRE
ARGYLL &BUTE
NORTHAYRSHIRE
SOUTH AYRSHIRE
EAST AYRSHIRE
INVERCLYDE
RENFREWSHIRE
EASTRENFREWSHIRE
EASTDUNBARTONSHIRE
WESTDUNBARTONSHIRE
SOUTH LANARKSHIRE
NORTH LANARKSHIRE
ARGYLL &BUTE
NORTHAYRSHIRE
SOUTH AYRSHIRE
EAST AYRSHIRE
INVERCLYDE
RENFREWSHIRE
EASTRENFREWSHIRE
EASTDUNBARTONSHIRE
WESTDUNBARTONSHIRE
TroonPrestwick Airport
GlasgowAirport GLASGOW
Helensburgh
Dumbarton
MilngavieGreenock
Paisley
NewtonMearns
Coatbridge
EastKilbride
Biggar
Ayr
Kilmarnock
Girvan
Irvine
Ardrossan
Brodick
Largs
Cumnock
Motherwell
Lanark
Kirkintilloch
Ardlui
TroonPrestwick Airport
GlasgowAirport
Cairnryan
Stranraer
- Subway - Rail - Ferry - Cycle - Road
Strategic Corridors:
Council boundarySPT boundary
N
0 10 20 30 40 50km
10
The Strategic Corridors referred to are:
• the current strategic transport network (as defined in the map)
• connections to and between the Strategic Corridors, connecting to the ‘Areas of Economic Development’, and the ‘Community Expansion Areas, Rural Area and Regeneration Areas’as defined in Appendices D and E of the Final Draft RTS (see section on ‘Supporting Information’, page 21, for more details)
The Delivery Plan, the five year implementation programme for the Strategy, will highlight the Strategic Corridors on which action will be focused for the first five years of the Strategy.
Strategic Priorities
The Strategic Priorities are key areas for action over the lifetime of the Strategy and create a framework for SPT and our stakeholders to help deliver transport improvements across the west of Scotland. They are grouped under each of the Strategy Outcomes. The Strategic Priorities will provide the context for prioritisation within the Delivery Plan, a five year programme of interventions.
While SPT will address each of the 17 priorities we identify in the Strategy, our particular focus for the first Delivery Plan will be:
• Plan and provide a “step change” for bus services, standards, and infrastructure.
• Revitalising the Subway network.
• Improving cross-city and cross-region links on strategic corridors.
• Improving access to services including health care and education.
• Planning for the provision of transport for Commonwealth Games 2014, tourism and major events.
• Improving sustainable connectivity for business and freight.

SOUTH LANARKSHIRE
NORTH LANARKSHIRE
ARGYLL &BUTE
NORTHAYRSHIRE
SOUTH AYRSHIRE
EAST AYRSHIRE
INVERCLYDE
RENFREWSHIRE
EASTRENFREWSHIRE
EASTDUNBARTONSHIRE
WESTDUNBARTONSHIRE
SOUTH LANARKSHIRE
NORTH LANARKSHIRE
ARGYLL &BUTE
NORTHAYRSHIRE
SOUTH AYRSHIRE
EAST AYRSHIRE
INVERCLYDE
RENFREWSHIRE
EASTRENFREWSHIRE
EASTDUNBARTONSHIRE
WESTDUNBARTONSHIRE
TroonPrestwick Airport
GlasgowAirport GLASGOW
Helensburgh
Dumbarton
MilngavieGreenock
Paisley
NewtonMearns
Coatbridge
EastKilbride
Biggar
Ayr
Kilmarnock
Girvan
Irvine
Ardrossan
Brodick
Largs
Cumnock
Motherwell
Lanark
Kirkintilloch
Ardlui
TroonPrestwick Airport
GlasgowAirport
Cairnryan
Stranraer
- Subway - Rail - Ferry - Cycle - Road
Strategic Corridors:
Council boundarySPT boundary
N
0 10 20 30 40 50km
11
© Crown copyright. All rights reserved. Strathclyde Partnership for Transport. 100023445, 2008

12
Improved Connectivity
Developing the mass transit network – The ‘Vision’ commits all stakeholders to creating a ‘world-class’ transport system. This will involve seeking innovative solutions to future transport issues, learning from best practice around the world, making best use of the public and private finance available, and ensuring partnership arrangements are in place to allow transport to continue to help meet the region’s needs. The delivery of recommendations from the West of Scotland Conurbation Transport Study will address this strategic priority.
Improving access to key gateways – The west of Scotland contributes 41% of Scotland’s GVA and maintaining and growing the economic competitiveness of the region requires the best internal transport connections to the rest of the UK and beyond, by all modes. Connecting the region’s Strategic Corridors to national and international networks by air, sea, rail or road is therefore a strategic priority.
Improving cross-city and cross-region links on strategic corridors – Improving the reliability, journey times and penetration of the transport network is important. There are strategic corridors (see map, p11) on which the Strategy is focusing for future action across all modes. Connections within and between the region’s Strategic Corridors are a key priority of the Strategy. Particular issues are connections between the rail networks north and south of the River Clyde, and connections between local, regional and national bus networks.
Improving sustainable connectivity for business and freight – Inefficient transport connections can damage business competitiveness and increase costs for businesses and consumers. Addressing congestion across all modes is therefore a major issue. The Strategy also seeks to encourage the transferral of freight from road to more sustainable modes. Connections to strategic business locations, connections for the sustainable transfer of freight, and measures to tackle congestion on the region’s strategic corridors are key priorities.
Planning for the provision of transport for the Commonwealth Games 2014, tourism and major events – The west of Scotland attracts many tourists every year, including visitors to major events, such as festivals or sporting events. Hosting the 2014 Commonwealth Games requires world class transport. It is vital that visitors have the best access to the west of Scotland, and that travel within the region allows them to make the most of their stay. Transport for the Commonwealth Games 2014 and connections for the region’s strategic corridors to tourism locations and major events are key priorities of the Strategy.
Access for All
Planning and providing transport for regeneration areas – Transport has a key role in supporting effective regeneration, for example, national regeneration areas such as Clyde Gateway, and for regeneration opportunities in town centres, harbour areas, former industrial areas, towns and other Structure Plan priority areas. Connecting the region’s strategic corridors to major regeneration areas and providing public transport to these are key priorities.
Improving access to services, including healthcare and education – Connecting the region’s strategic corridors to key services, including major healthcare facilities and educational establishments, transport provision for those accessing services (e.g. school transport, walking and cycling, and safety and security measures) and measures to address congestion and environmental issues arising from those accessing services are key priorities of the Strategy.
Improving socially necessary public transport, including Demand Responsive Transport and Community Transport – Social exclusion is a major issue in the west of Scotland. There are areas of severe deprivation, remote rural areas, and people and communities that are currently more excluded than others. Therefore, public transport provision for those without access to a car, connections to excluded communities, and transport for those who have difficulty using mainstream public transport are key priorities.

13
Improving connections for rural areas – Lack of transport is a major issue in rural areas. Service levels and distances to bus, ferry or rail can be poor. Bus services in rural areas can often be poor particularly in the evening and at weekends, and this can act as a barrier to social and economic activity. Service levels and public transport provision in rural areas are key priorities.
Promoting equality, including making journeys safer and addressing transport affordability – Issues regarding access and use of transport can severely restrict many people’s daily activities e.g. physical access, customer care, safety and security, and affordability. Transport provision for equality groups, safety and security measures on the region’s Strategic Corridors, and measures to address transport affordability on all modes across the region.
Reduced EmissionsEncouraging modal shift to more sustainable modes – Transport’s contribution to global warming and air quality is predicted to increase over the lifetime of the Strategy. Noise pollution, concerns about safety, severance and amenity also affect many communities. Key priorities include encouraging people to car-share and to make more use of active travel and public transport for at least part of their journeys. These changes will also be helped by standardised parking controls and shifts to more sustainable fuels.
Promoting ‘smarter choices’, travel planning and active travel – “Smarter Choices” are measures designed to support more sustainable travel by reducing dependence on the car. These measures include: travel planning, improving public transport information, marketing, travel awareness campaigns and reducing the need to travel. Promoting ‘Smarter Choices’ can encourage behavioural change and more active travel.
Attractive, Seamless, Reliable TravelPlan and provide a ‘step change’ for bus services, standards, and infrastructure – Bus is the main public transport mode in the west of Scotland, but there are significant challenges to be met. Quality, reliability, infrastructure, integration with other modes, information, availability (evenings/weekends) and service penetration all need to be improved. SPT’s agenda includes ensuring the bus industry meets its obligations to passengers, creating an optimum bus network, developing partnerships / contracts / performance improvement plans, and creating standards for new and existing infrastructure.
Revitalising the Subway network – The Subway is a core part of the urban rail network linking passengers across Glasgow to economic and social venues, and also to national rail and bus hubs. However, the Subway is now over 100 years old and is in need of modernisation. Proposals are being developed for refurbishment, including possible extensions and improved links with the urban rail network, improving operational flexibility, including longer opening hours, improved reliability, improved access and better integration.
Improving interchange between modes – The smooth transfer of passengers between transport services is an important element of the “seamless journey”. Efficient integration between bus, rail, ferry, Subway, car trips and walking and cycling is vital in keeping journey delays to a minimum and encouraging modal shift. The development and creation of interchanges on the region’s Strategic Corridors, and improved co-ordination of transport services for interchange is a priority.
Improving travel information – The ability to access clear, reliable information about transport services and infrastructure is a top priority for passengers. SPT will work with operators to roll-out improved information, including use of the internet, ‘real time’ information at bus stops, and developing standards for information.
Developing integrated ticketing – Lack of integrated ticketing causes considerable inconvenience for passengers, and discourages modal shift to public transport. Working with national agencies and operators to improve this, and introducing new ticketing technologies (e.g. Smartcards) are priorities.

14
SPT Working in Partnership
While SPT is responsible for producing the Strategy, a wide range of organisations will be involved in its delivery. Through partnership working, primarily with member councils and community planning partners, SPT will promote delivery of the Strategy. The key stakeholders for delivery of the Strategy include:
• SPT
• SPT’s member councils
• Community planning partners in the west of Scotland, including the Police and Health Boards
• The enterprise and tourism network
• Active travel organisations e.g. Cycling Scotland
• Scottish Government / Transport Scotland
• Transport operators
• Network Rail
• Strategic Development Planning Authorities (Structure Plans)

15
SPT’s Core Activities
SPT is committed to making the Strategy a success. The continuous improvement of SPT’s core activities provides the foundation for this. SPT’s core activities are:
• Planning the regional transport network - analysing and planning the transport network across modes to ensure it meets the region’s needs
• Delivering regional projects - the project management and delivery of projects across the transport network
• Operating the Subway network - operation, maintenance and future development
• Providing ferries - provision of existing services, and planning of potential new services
• Delivering school transport - acting as an agent for member councils
• Promoting developments on the rail network - promotion and development of rail projects, in conjunction with Transport Scotland
• Developing integrated ticketing initiatives - administering and developing a range of integrated tickets
• Addressing transport affordability - through working with Transport Scotland in administering free transport for people with disabilities and people over 60, through supporting the implementation of other national concessionary travel schemes for specific users, and through developing regional initiatives
• Making journeys safer - planning and providing safety and security initiatives on the transport network
• Providing bus infrastructure - operating, managing and developing bus stations and maintaining the network of bus shelters and stops
• Giving travel information to the public - through marketing and education, through providing a network of travel centres and travel points, through timetables, and through using innovative technology
• Supporting bus services - provision and management of services where deemed socially necessary
• Providing Demand Responsive Transport - for those with mobility problems (including Dial-a-Bus) and those in rural areas (including Ring’n’Ride)
• Promoting “Smarter Choices” - encouraging more sustainable travel
• Promoting equality - developing transport initiatives to assist those who experience difficulties more than most when using the transport network
• Developing walking and cycling initiatives - working with member councils and partners to increase use of walking and cycling modes
• Connecting freight - through the Freight Quality Partnership, encouraging more sustainable transfer of freight
• Integrating transport - across modes, and through timetabling, and with land-use and community plans.

Contributesto National Outcome
StrategyOutcomes
Indicators Frequency/Type/Source
Baseline (at June 2008)
Target(directionof travel)
We live in aScotland thatis the mostattractive placefor doing business inEurope. (NO1)
Improvedconnectivity
Proportion of passengers satisfied with public transport information provision
Annual SHSoutputs/ SPT (Subway)
89% rail (2006)81% bus (2006)60% Subway (2007)
We realise our fulleconomic potentialwith more and better employment opportunities forour people. (NO2)
Improvedconnectivity
Proportion of working age population within a given public transport journey time of a strategic employment centre
SPT models 73% (30 minutes) [2008]
Increase
We live longer, healthier lives. (NO6)
Reducedemissions
Carbon output by the transport sector (Annual) DEFRA report
4080 Kt CO2 (2006)
Annual SHS outputs / SPT(Subway)
Annual SHSoutputs
Annual SHSoutputs/ SPT (Subway)
89% rail (2006)74% bus (2006);51% Subway (2007)
7% of car drivertrips affected by congestion (2006)
85% rail (2006)75% bus (2006)86% Subway (2007)
Proportion of passengers satisfied withpublic transport reliability
Time lost on (all) roads due to congestion
Proportion of passengers satisfied withthe public transport system
Modal share of adults undertaking activetravel to work or education
AQMA numbers
Annual SHS outputs
Annual SHS outputs
Member councils
75% (incl. publictransport) [2006]
35% travel to work (incl. public transport) [2006]
8 (2008)
Reduce
Reduce
Increase
Increase
Increase
Reduce
Increase
Increase
Modal share of children undertakingactive travel to school
16
Measuring success
SPT will publish an annual monitoring report, and will refine and quantify targets and timescales for each indicator. We look forward to working with the Scottish Government and member councils in developing an appropriate framework to monitor transport as part of the west of Scotland’s contribution to National Outcomes.
The table below shows the current indicators in place for monitoring the Strategy, and aligns these to National Outcomes.
Separate processes are in place for monitoring the Strategic Environmental Assessment and the Equality Impact Assessment.
Key: SHS - Scottish Household SurveySPT (Subway) - reference to NOVA international benchmarking surveys(Annual) DEFRA report - indicative estimates of ‘end user emissions’ published by the Department for the Environment, Food and Rural AffairsAQMA - (local) Air Quality Management AreasDRT - Demand Responsive Transport (SPT’s Dial-a-Bus and Ring‘n’Ride services)SG - Scottish GovernmentORR - Office of Rail RegulationBTP - British Transport Police

Contributesto National Outcome
StrategyOutomes
Indicators Frequency/Type/Source
Baseline (at June 2008) Target(directionof travel)
We live ourlives safe from crime, disorder anddanger. (NO9)
road accidents 4125 (cars); bus 276;2182 (other modes); rail and Subway24 [all 2007]
illustrative daily trip rates - male 2.42; female 2.47; 31-45 year olds 2.56, over 75s 2.27; without disability 2.51,with disability 2.24 etc. (2006)
86% bus; 82% rail (both 2006); 59% Subway (2007)
2408 Bus; 3601 Rail; Subway 81 (all2007/08)
Annual SHS outputs; SPT (NOVA) for Subway
Annual reports (BTP and Strathclyde Police)
Satisfaction with safety and personalsecurity on public transport
Crime incidence on public transport Reduce
Increase
Increase
Increase
Increase
Increase
50% (2008)
64% (30 minutes) [2008]
79% (2008)
We havetackled thesignificantinequalitiesin Scottishsociety.(NO7)
Access forAll
Proportion of accessible rural populationwithin 400m of a bus stop with an hourlyor better service between 7am and 7pmon an average weekday
SPT models
Proportion of 15% most deprived population within 400m of a bus stop with at least 6 buses an hour between 7am and 7pm on an average weekday
SPT models
Proportion of total population within a given public transport journey time of a hospital
SPT models
Proportion of total population within a given public transport journey timeof a GP
81% (15 minutes) [2008]SPT models
IncreaseProportion of 16-19 year olds within a given public transport journey time of a further education establishment
82% (30 minutes) [2008]SPT models
Proportion of rail, Subway and bus stations and vehicles DDA-compliant
(Annual) SPT and operators
local bus fleets: approx. 26%; rail: onlyclass 334s; rail stations 68% [2008]
Increase
DRT patronage (Annual) SPT 428,018 (2007/08) Increase
Differences in trip frequency and time forequality groups
Annual SHS outputs
illustrative daily trip rates - male 2.42; female 2.47; 31-45 year olds 2.56, over 75s 2.27; without disability 2.51,with disability 2.24 etc. (2006)
Reduce
Attractive,seamless,reliabletravel
Number of transport-related accidents Annual reports (Road Accidents Scotland (SG); Railway Safety (ORR))
Reduce
Differences in trip frequency and time for equality groups
Annual SHS outputs
Reduce
We live inwell-designed,sustainableplaces wherewe are able to access theamenities and serviceswe need. (NO10)
Access forAll
Access forAll
Improvedconnectivity
Proportions of working age populationwithin a given public transport journey time of a strategic employment location
SPT models 73% (30 minutes) [2008] Increase
Differences in trip frequency and time for equality groups
Annual SHS outputs
illustrative daily trip rates - male 2.42; female 2.47; 31-45 year olds 2.56, over 75s 2.27; without disability 2.51,with disability 2.24 etc. (2006)
Reduce
Proportion of passengers satisfied withpublic transport information provision
Annual SHS outputs; SPT(Subway)
89% rail; 81% bus (both 2006); 60%Subway (2007)
Increase
Proportion of passengers satisfied withthe public transport system
Annual SHS outputs; SPT(Subway)
85% rail; 75% bus (both 2006); 86%Subway (2007)
Increase
Proportion of passengers satisfied withpublic transport reliability
Annual SHS outputs; SPT(Subway)
89% rail; 74% bus (both 2006); 51%Subway (2007)
Increase
Time lost on (all) roads due to congestion Annual SHS outputs
7% of car driver trips affected by congestion
Reduce
17

Contributesto National Outcome
StrategyOutcomes
Indicators Frequency/Type/Source
Baseline Target(direction of travel)
We reduce the localand global environmental impact of our consumption and production (NO14)
Number of trips undertaken by walking,cycling, public transport and car
Annual SHSoutputs
1427 walking; 63 cycling; 2076 public transport; 7788 car (based on sample of - singleday - travel diary entries) [2006]
Our public servicesare high quality, continually improving, efficientand responsive to local people’s needs.(NO15)
Attractive, seamless,reliabletravel
Proportion of passengers satisfied withpublic transport information provision
89% rail; 81% bus (both 2006); 60% Subway (2007)
Annual SHSoutputs
12.5% walking; 0.6% cycling;18.1% public transport (all2006)
Proportion of trips undertaken bywalking, cycling, public transport
Proportion of passengers satisfied withpublic transport reliability
Proportion of passengers satisfied withthe public transport system
Annual SHSoutputs; SPT(Subway)
89% rail; 74% bus (both 2006); 51% Subway (2007)
85% rail; 75% bus (both 2006); 86% Subway (2007)
Reduce
Increase
Increase active and PTtravel;reducecar
Carbon output by the transport sector (Annual) DEFRA report
4080 Kt CO2 (2006)
Modal share of adults undertaking active travel to work or education
AQMA numbers
Annual SHSoutputs
Member councils
35% travel to work (incl. public transport) [2006]
8 (2008)
Reduce
Reduce
Increase
Increase
Access forAll
Annual SHS outputs/SPT (Subway)
Annual SHS outputs/SPT (Subway)
Increase
Increase
Differences in trip frequency and timefor equality groups
Annual SHSoutputs
illustrative daily trip rates - male 2.42; female 2.47; 31-45year olds 2.56, over 75s 2.27; without disability 2.51, with disability 2.24 etc. (2006)
We value and enjoyour built and natural environment and protect it and enhance it for future generations (NO12)
Reducedemissions
Index of residents rating their neighbourhood as a good place to live in terms of public transport
Annual SHS outputs
4.2 (ratio of ‘good’ to ‘poor’public transport references)[2006]
Increase
Proportion of total population within 400m of a bus stop with at least 6 buses an hour between 7am and 7pm on an average weekday
SPT models 63% (2008) Increase
Proportion of total population within a given public transport journey timeof a hospital
SPT models 64% (30 minutes) [2008] Increase
Proportion of total population within a given public transport journey timeof a GP
SPT models 81% (15 minutes) [2008] Increase
Proportion of total population within agiven public transport journey time ofa major retail centre
SPT models 49% (15 minutes) [2008] Increase
Proportion of 16-19 year-olds within agiven public transport journey time of a further education establishment
SPT models 82% (30 minutes) [2008] Increase
(continued from p15)
Reducedemissions
Modal share of children undertakingactive travel to school
Annual SHSoutputs
75% (incl. public transport)[2006]
Increase
Time lost on (all) roads due to congestion
Annual SHSoutputs
7% of car driver trips affected by congestion (2006)
Reduce
18

19
Developing the Strategy
The Strategy has been prepared in line with Scottish Government Guidance and sets out SPT’s strategic direction to 2021. A full description of our analysis of the issues, challenges and opportunities for transport, the strategic fit of our strategy with relevant policy documents, the strategy development process and the optioneering and appraisal processes are described in the ‘Final Draft’ version of the Strategy, prepared in March 2007 (see below under ‘Supporting Documents’ for more details). Appendix J of that report explains how the Strategy is fully compliant with Scottish Government Guidance.
We have rationalised the presentation of the Strategic Priorities, previously included in the March 2007 report under separate headings of core activities, target programme and action plans. This work was undertaken in response to a request from the Cabinet Secretary for Finance and Sustainable Growth in January 2008. The redrafting to present this high level strategy allows us to set out our Strategic Priorities within the same framework of Vision, Shared Goals, Objectives and Outcomes. Redrafting has been considered necessary to improve the linkage between the Strategy and the separate Delivery Plan and the changes are simply presentational to provide a more streamlined Strategy.
The Strategy Context
The Strategy provides the context for prioritisation within the Delivery Plan, a five year implementation programme setting out specific projects, initiatives or operational activities to be delivered by SPT. It will also contain interventions to be promoted and delivered by SPT, member councils and others. On approval by Ministers, the Strategy will also inform development plans and decision making on the transport aspects of new developments. The scale of the issues facing the west of Scotland means that there is a need for effective strategies at national, regional and local transport levels. Interventions must be complementary and delivered in the most effective way.
Consultation
SPT was keen to ensure that as many people as possible were involved in the development of the Strategy:
• Over 250 formal responses received
• Over 1000 contributions noted from attendees at workshops, seminars and meetings
• Regular reference group meetings with councils and other stakeholders at each stage of strategy development
• RTS website created and kept up to date with progress reports and documents for downloading
• 800 copies of the Consultative Draft RTS sent to stakeholders and libraries across the west of Scotland
• Advertising and publicity in local and national papers reached up to 1.3 million people
• Press and radio reports further raised awareness
20
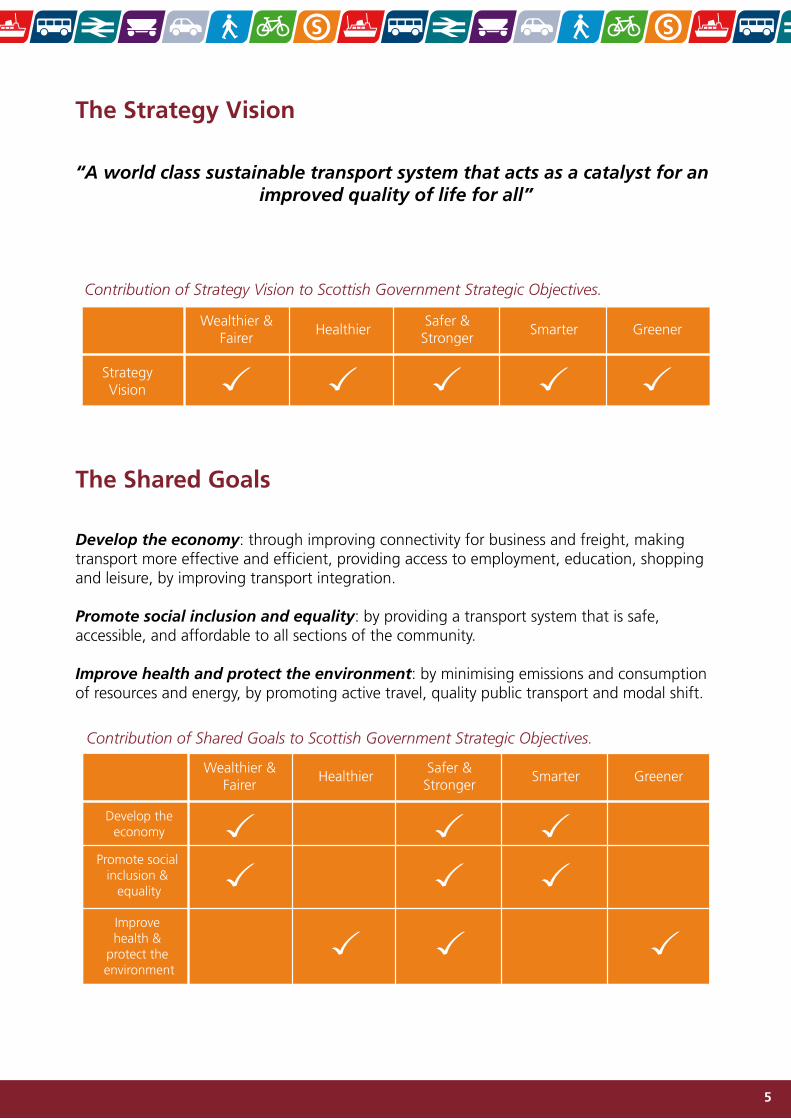
Next Steps
The successful delivery of the Strategy will be influenced by:
• Effective partnership working within the context of member Councils’ Single Outcome Agreements, SPT’s Delivery Plan, related Capital and Operating Plans, Community Plans, and future national transport delivery plans
• Appropriate and effective travel demand management tools
• Continuous improvement in the delivery of SPT’s core activities
• The legislative context (including emerging legislation) and
• Sourcing funding packages
On approval of this Strategy by Scottish Ministers, SPT will seek to ensure the integration of its Strategic Priorities within wider planning and economic development strategies for the west of Scotland. SPT will take forward specific transport interventions under each Strategic Priority within its Delivery Plan through working in partnership with key stakeholders. Work is continuing to improve the quality and responsiveness of core SPT functions and to address shared agendas with our member councils and community planning partners.

21
Supporting InformationFull documentation supports this Strategy and is available on SPT’s website at www.spt.co.uk/rts including:
• A Catalyst for Change: the Regional Transport Strategy for the west of Scotland 2007 - 2021 Final Draft for submission to Scottish Ministers, March 2007. (Note that the following Appendices have been superseded: Appendix C: RTS projects and target programme; Appendix F: Target Programme – map of interventions; Appendix G: Mass Transit and Appendix H: Detailed Table of RTS Projects.)
• The 5 Year Delivery Plan – interventions arising from Strategic Priorities
• A Catalyst for Change – Scottish Transport Appraisal Guidance (STAG) Report, April 2007
• A Catalyst for Change – Modelling Report, March 2007
• A Catalyst for Change – Equality Impact Assessment, March 2007
• A Catalyst for Change – Information for an Appropriate Assessment, June 2007
• The Environmental Report ( Strategic Environmental Assessment) Non Technical Summary, March 2007
• The Environmental Report ( Strategic Environmental Assessment) Main Report, March 2007
• Various reports throughout 2006
A Strategic Environmental Assessment Post Adoption Statement is being prepared for publication.

Strathclyde Partnership for TransportPolicy and Strategy Department
Consort House12 West George Street
Glasgow G2 1HN
phone: 0141 332 3219email: [email protected]
www.spt.co.uk/rts
Produced on Evolution Satin 75 paper - using 75% recycled fibre and 25% virgin fibre of which 70% is FSC Certified