A CASE STUDY OF SAN FRANCISCO BAY - Pacific Institute
97
Transcript of A CASE STUDY OF SAN FRANCISCO BAY - Pacific Institute

97

The Pacific InstituteThe Pacific Institute is dedicated to protecting our natural world, encouraging sustainabledevelopment, and improving global security. Founded in 1987 and based in Oakland, California,we provide independent research and policy analysis on issues at the intersection ofdevelopment, environment, and security. The Pacific Institute currently has five main areas ofresearch: Water and Sustainability, Environment and Security, Community Strategies forSustainability and Justice, Economic Globalization and the Environment, and Global Change. Tolearn more, visit us online at www.pacinst.org
The Stockholm Environment Institute (SEI)SEI is an independent, international research institute specializing in sustainable development andenvironment issues. It works at local, national, regional and global policy levels. The SEI researchprogrammes aim to clarify the requirements, strategies and policies for a transition tosustainability. These goals are linked to the principles advocated in Agenda 21 and theConventions such as Climate Change, Ozone Layer Protection and Biological Diversity. SEIalong with its predecessor, the Beijer Institute, has been engaged in major environment anddevelopment issues for a quarter of a century. It seeks to be a leader in the creation of a new fieldof sustainability science aimed at understanding the fundamental character of interaction betweennature and society, and to contribute to the capacities of different societies to build transitions tomore sustainable futures.

ASSESSING THE COSTS OF ADAPTING TO SEA-LEVEL RISEA CASE STUDY OF SAN FRANCISCO BAY
Peter H. GleickEdwin P. Maurer
Originally Published on April 18, 1990Reformatted on February 17, 2004
Pacific Institute for Studies inDevelopment, Environment, and Security
654 13th Street, Preservation Park Oakland, California 94612, USA
Stockholm Environment Institute Järntorget 84
S-103 14 Stockholm, Sweden

1
ACKNOWLEDGEMENTS
This research was supported by a grant from the Stockholm Environment Institute, Stockholm,Sweden.
Assistance and information were provided by Jeffrey Blanchfield, Bill Davoren, Kent Dedrick,Leslie Ewing, Gary Griggs, Andrew Gunther, Bob Halinger, Jeffrey Haltiner, Gary Hershdorfer,Michael Josselyn, Tom Kendall, Don Kingery, John Maljidi, David Minehart, Scott Miner, LindaSpar, Leonard Sklar, Rebecca Tuden, David Valkenaar, Robert Weigel, and others.
An earlier draft was reviewed by:
Jeffrey Blanchfield (San Francisco Bay Conservation and Development Commission)Andrew Gunther (Aquatic Habitat Institute)Jeffrey Haltiner (Philip Williams and Associates, San Francisco)Michael Josselyn (San Francisco State University)Leonard Sklar (University of California, Berkeley)Pier Vellinga (Ministry of Housing, Physical Planning and Environment, the Netherlands)Robert Weigel (University of California, Berkeley)
All errors of fact and judgement are, of course, the responsibility of the authors.

2
EXECUTIVE SUMMARY
Atmospheric concentrations of carbon dioxide (CO2), methane (CH4), nitrous oxide (N2O),
tropospheric ozone (O3), chlorofluorocarbons (CFCs), and other trace gases are growing due to
human activities. These trace gases are transparent to incoming solar radiation and trap
outgoing infrared (heat) radiation, acting like a blanket to warm the Earth. Without any of these
gases in the atmosphere, the surface of the Earth would be about 35 �C (70 �F) colder than at
present, and life, if any could exist, would be quite different. This natural greenhouse effect is
being intensified by human activities that accelerate the emission of these trace gases, such as the
combustion of fossil fuels and deforestation.
One of the direct consequences of climatic changes will be a rise in sea level due to the
melting of land ice and the expansion of the upper layers of the ocean as they warm. This study
presents a method for assessing the costs to society of protecting against an increase in sea
level, and applies this method to the San Francisco Bay area -- a region of great ecological
diversity, economic importance, and vulnerability. Hydrodynamic effects around the margin of
San Francisco Bay are evaluated, structural options for protecting property are identified and
chosen for threatened areas, and estimates of costs of protection are determined. For the
purposes of this study, a one-meter sea-level rise was assumed, and all development below the
future 100-year high tide elevation in San Francisco Bay was considered to be at risk. The types of
shoreline protection proposed include constructing new levees and seawalls, raising existing
levees and bulkheads, raising buildings, freeways and railroads where necessary, and
replenishing beaches. The costs described here are not the total costs of protection -- for
example, no estimates are available for evaluating costs of protecting natural ecosystems. Other

3
costs left out are described in detail in the text.
Any economic estimates of the costs to society of the impacts of climatic change or the
costs of adapting to such changes must be regarded with caution. The actual costs will depend on
the speed and amount of rise, societal choices about what to protect and what to abandon, the
form of existing protection, the lifetime of that protection, who will pay (federal, state, or local
governments, corporations, private individuals), and a wide range of unquantified or
unquantifiable variables -- many impacts can not be compared using standard economic
measures.
The risks of global climate change and the impacts faced by society are uncertain. There
are uncertainties about future emissions of greenhouse gases, about how the climate will
respond to those gases, and about the many impacts to society. These uncertainties will greatly
complicate policy responses, but they should not be used as an excuse for inaction. This report
tackles one small piece of the problem: how can we evaluate the costs of protecting a particular
region against future sea-level rise, and what policy responses might be appropriate. Many
uncertainties remain, but the magnitude of the problems of climate change and sea-level rise
requires that we begin to understand the threats that we face and the responses available to us.
GENERAL CONCLUSIONS
• Absolute sea level has risen 0.1 to 0.15 meters (4 to 6 inches) in the last century -- an
average rate of 1.0 to 1.5 millimeters per year (mm/yr). The local rate of increase in some
regions has been greater due to local land subsidence.

4
• The magnitude of the observed rise is consistent with the changes expected from
increases in atmospheric trace gases and the greenhouse effect, but it is not yet possible
to unambiguously attribute this rise to the greenhouse effect.
• Plausible projections of the magnitude of future sea-level rise due to the greenhouse
effect range from 0.5 meters to over 3.0 meters (20 to 120 inches) by 2100. The
frequency of damaging storms will increase long before these much higher levels are
reached.
• Projections of the rrate of future sea-level rise over the next century range from 7 to 50
mm per year (0.3 to 2 inches per year), substantially above the historical rates of the last
century. This rate is expected to increase exponentially if no efforts are made to reduce
greenhouse gas emissions.
• Such a sea-level rise will inundate developed and natural areas, accelerate coastal
erosion, cause salinity contamination of groundwater aquifers and rivers, damage port
facilities, erode recreational beaches, and disrupt wetlands and natural habitats.
• The cost of protecting against sea-level rise is large, but often below the value of the
property protected. Defensive actions taken today can prevent large damages in the
future.
• Many of the economic impacts of sea-level rise are not yet adequately quantified; ssome of
the impacts of sea-level rise may never be quantifiable. These include the societal changes

5
needed for coastal response, the social costs of migration away from affected areas, the
psychological pressures of living behind coastal protection in threatened areas, the value
of lost or altered ecosystem services, and the risks of international or inter-regional
conflicts.
• The initially slow rate of increase of sea level will complicate political and economic
responses. No advanced planning, or inadequate response, will be followed by a set of
severe, damaging flood events.
A CASE STUDY OF SAN FRANCISCO BAY: CONCLUSIONS
• TThe value of property threatened by sea-level rise in San Francisco Bay is extremely high
because of past development. Around the perimeter of the Bay, existing commercial,
residential, and industrial structures threatened by a one-meter (3.3 foot) sea-level rise
is valued at $48 billion.
• MMajor damaging storms will occur more frequently in San Francisco Bay due to a sea-level
rise. This increase will occur long before sea level rises one meter. A sea-level rise of
only 15 centimeters (5.9 inches) will change the frequency of the 1-in-100 year storm
into a 1-in-10 year storm at the entrance to the Bay.
• TThe cost of protecting just existing development from a one-meter (3.3 foot) sea-level
rise by building new defenses or modifying existing protection around San Francisco Bay

6
will exceed $940 million (in 1990 dollars), not including the costs of protecting or
restoring wetlands, or the need for any active structures such as pumps, drainage
systems, and navigation locks. These costs could exceed an additional one billion dollars.
The costs of maintenance for these defenses are also not included and could approach
$100 million per year.
• WWe think it unlikely that the status quo around the Bay can be maintained under conditions
of expected sea-level rise, even with extensive efforts to build protective structures.
Indeed, implementing all of the measures evaluated here would, by themselves, change
the character of the Bay.
• LLoss of some of the remaining natural wetlands in San Francisco Bay appears inevitable. In
particular, large tracts of wetlands in the northern stretches of the Bay will be impossible
to maintain in their present form, and intertidal wetland habitat in the southern stretches
of the Bay may be lost entirely. Options include providing some artificial protection,
which converts natural ecosystems into partially managed ecosystems; trying to restore
wetlands on adjacent, higher, undeveloped land; or abandoning existing wetlands to try
to adapt through natural processes.
• DDeterioration of groundwater quality in some basins around the Bay will accelerate as sea
level rises. No way to prevent this deterioration, other than by preventing sea-level rise,
was identified.
• GGiven the uncertainties about the magnitude and rate of future sea-level rise, there is a

7
value in attempting to slow the rate of rise. The slower the rate of sea-level rise, the
more time to plan (and pay for) appropriate responses.
• SSufficient money or political consensus is unlikely to be made available to protect all
resources on the margins of the Bay before damaging storm events occur. As a result,
difficult decisions about what to move or abandon will have to be made, and damages from
flooding will increase.
• SSubstantial additional -- and unpredictable -- changes in the biological and chemical
nature of the Bay region are likely due to changes in freshwater inflow to the Bay, new
development, changes in water and ecosystem management in the Delta, and other effects
that cannot now be anticipated. All of these additional effects are beyond the scope of the
present study.
RECOMMENDATIONS
1. Future development should be prohibited in waterfront areas likely to be subjected to
higher sea level . The cheapest option to protect against future sea-level rise is to
prohibit development in regions that are likely to be subjected to the greater future risk
of flooding.
2. Future development should be prohibited on natural lands immediately upslope of or
adjacent to existing wetlands . These buffer lands may be the only areas to which present
wetlands can slowly migrate, and future wetlands restoration projects will require this
land.
8
3. All present activities to construct, maintain, or modify any structure likely to be affected
by sea-level rise should assume a future increase in that level . The cost of modifying these
structures in the design stage is considerably below the costs of both later
reconstruction and flood-damage from unanticipated storm surges. Modification in the
design stage can include either the capacity to accommodate higher sea levels or
provisions for future retrofitting.
4. Natural ecosystems are undervalued or ignored in traditional economic analyses. A
method for incorporating them into future studies is needed. Large tracts of wetlands,
such as those in the San Francisco Bay, are vulnerable to sea-level rise. No satisfactory
method for incorporating their environmental values has been developed, and we thus
risk ignoring them when we make policy decisions. This would be a serious mistake.
5. Detailed surveys of the economic value of land and services at risk in specific regions
should be done . The study here provides initial estimates of the costs of adapting to a
one-meter sea-level rise, but not the long-term value of property threatened. Such
additional information is required for appropriate public policy decisions to be made.
6. Existing flood insurance programs should be modified or phased out in areas likely to be
subjected to future flooding caused by sea-level rise.
7. Detailed regional responses are needed . The effects of sea-level rise in one area will have
spill-over effects in other areas. Coordinated regional strategies will be necessary to

9
account for these effects. For example, intrusion of salt water into groundwater aquifers
will require the development of alternative fresh water supplies. In regions such as
California, alternative fresh water resources may not be readily available at reasonable
economic or environmental cost.
8. Additional research on the physical and environmental effects of sea-level rise is needed
on a regional basis . More case studies to identify specific effects of a rising sea-level are
needed. No general analysis can replace individual regional studies.

10
PART 1: ASSESSING THE COSTS OF ADAPTING TO SEA-LEVEL RISE
I. INTRODUCTION
Atmospheric concentrations of carbon dioxide (CO2), methane (CH4), nitrous oxide (N2O),
tropospheric ozone (O3), chlorofluorocarbons (CFCs), and other trace gases are growing due to
human activities. These trace gases are transparent to incoming solar radiation and trap
outgoing infrared (heat) radiation, acting like a blanket to warm the Earth. Without any of these
gases in the atmosphere, the surface of the Earth would be about 35 �C colder than at present,
and life, if any could exist, would be quite different. This natural greenhouse effect is being
intensified by human activities that accelerate the emission of these trace gases, such as the
combustion of fossil fuels and deforestation.
The growing concern over the societal consequences of large-scale climate changes has
led policy-makers to consider two possible responses. The first is to try to reduce the
emissions of greenhouse gases. The second is to evaluate the likely impacts to society of
possible climate changes and to try to mitigate the worst of them and adapt to the rest.1 These
two responses, often referred to as pprevention and aadaptation, are not mutually exclusive.
Indeed, it is often argued that "prevention" is a misnomer and that some climate changes are
inevitable due to the concentrations of greenhouse gases already emitted and the tremendous
inertia in the way society produces and uses energy. As a result, attention is increasingly
focusing on evaluating the impacts to society of climate changes and the methods and costs of
reducing those impacts.
����1 The issues raised by these two different responses are discussed in many detailed
assessments. Two comprehensive analyses of both greenhouse gas emissions reductionsand the impacts of climate change were recently completed by the U.S. EnvironmentalProtection Agency (U.S. EPA 1989a, 1989b). See also Bolin et al. (1986) and Berger et al. (1989).

11
This study is presented in two sections: in Part 1, a method for assessing the costs to
society of protecting against an increase in sea level is developed and presented. Coastal
protection strategies and costs are reviewed and the limitations of economic analyses
summarized. In Part 2, the method developed in Part 1 is applied to the San Francisco Bay area --
a region of great economic importance and vulnerability.
Any economic estimates of the costs to society of the impacts of climatic change or the
costs of adapting to such changes must be regarded with caution. The actual costs will depend on
the speed and amount of rise, societal choices about what to protect and what to abandon, the
form of existing protection, the lifetime of that protection, who will pay (federal, state, or local
governments, corporations, private individuals), and a wide range of unquantified or
unquantifiable variables -- many impacts can not be compared using standard economic
measures. These problems are discussed in Section V.

12
II. FUTURE CLIMATE CHANGE AND PROJECTIONS OF SEA-LEVEL RISE
The most widely discussed implication of the greenhouse effect is a rise in the average
temperature of the Earth. The best estimates now available suggest that a doubling of the
atmospheric concentration of carbon dioxide could lead to an average increase in the Earth's
temperature of between 1.5 and 4.5° Celsius (C) (Dickinson 1989). Maximum warming is
expected in winter and in the higher latitudes. The precise timing of this warming is uncertain,
largely because of the role of the oceans in absorbing trace gases and cycling heat. If only the
upper layer of the oceans is affected, global warming will be relatively rapid; if the entire ocean
depth is affected, a lag in warming of as much as a century may be possible as much of the
additional heat goes into the oceans instead of the atmosphere.
Other uncertainties that can worsen or lessen the magnitude and rate of climate change
include the effects of clouds, which are poorly parameterized in the climate models, and other
physical feedbacks. Clouds can either slow the warming by reflecting sunlight away from the
earth or increase it by trapping additional heat. The net effect of clouds depends on cloud type,
location, and behavior. Other feedbacks include the possible sudden release of large volumes of
methane frozen in high-latitude regions, changes in ocean circulation patterns and the
distribution of heat from one region of the world to another, and chemical interactions within
the atmosphere that could alter the sinks for many greenhouse gases.
One of the most widely recognized effects of global climatic changes will be a rise in sea
level due to the thermal expansion of the oceans and increased melting from land ice. Heat
trapped by greenhouse gases will raise the temperature of the atmosphere and oceans, which in

13
turn will affect sea level. If the oceans absorb the increased heat slowly, higher air temperatures
will quickly melt land ice. If the oceans rapidly absorb the excess heat, sea level will rise more
rapidly due to thermal expansion. If precipitation in high latitudes increases, snow buildup in
Greenland and Antarctica may slow the rate of sea-level rise. At present we cannot accurately
determine how the oceans will react, even for well-defined rates of greenhouse gas emissions,
and we cannot therefore accurately predict future climate or sea level (Thomas 1986).
Nevertheless, we can estimate plausible rates of rise by evaluating a wide range of climate
scenarios.
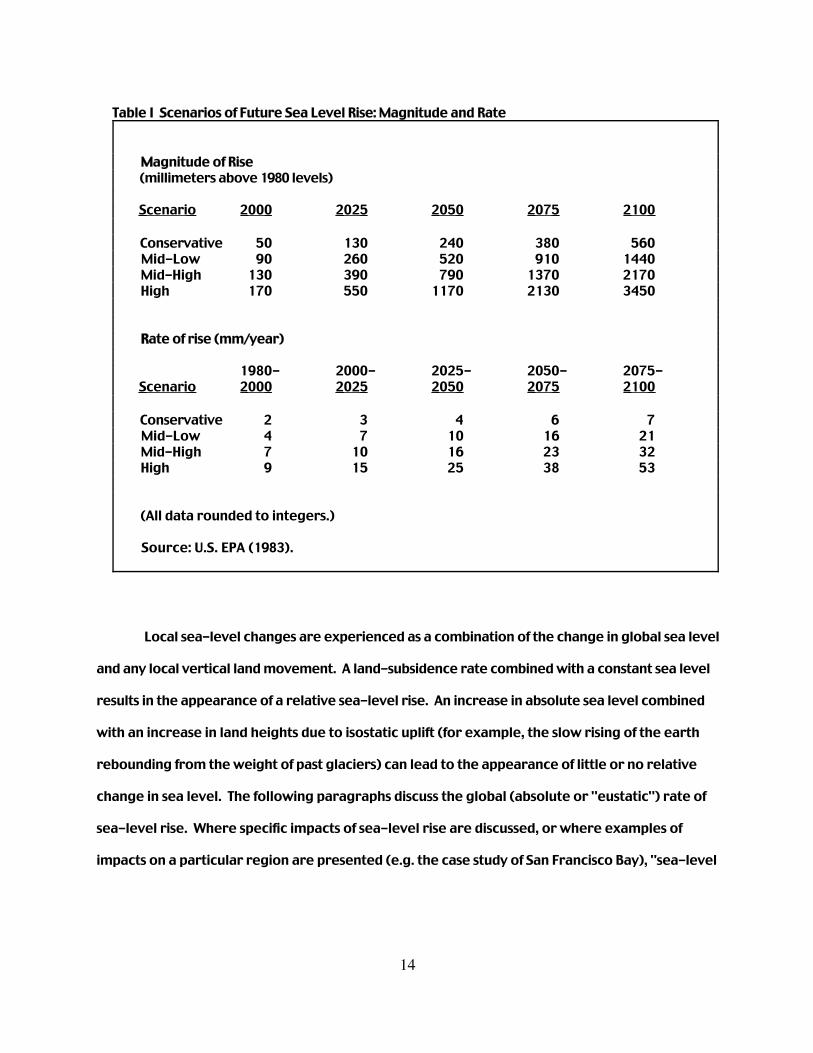
Table I and Figure 1 show some of the most recent projections for sea-level rise. This
paper is not the place to resolve the uncertainties in these projections. The assumptions and
uncertainties involved in this study are explicitly set out in the methodology section, but it is our
belief that the uncertainties about human actions and conditions over the next decade far exceed
the uncertainties about future sea level.
14
Local sea-level changes are experienced as a combination of the change in global sea level
and any local vertical land movement. A land-subsidence rate combined with a constant sea level
results in the appearance of a relative sea-level rise. An increase in absolute sea level combined
with an increase in land heights due to isostatic uplift (for example, the slow rising of the earth
rebounding from the weight of past glaciers) can lead to the appearance of little or no relative
change in sea level. The following paragraphs discuss the global (absolute or "eustatic") rate of
sea-level rise. Where specific impacts of sea-level rise are discussed, or where examples of
impacts on a particular region are presented (e.g. the case study of San Francisco Bay), "sea-level
Table I Scenarios of Future Sea Level Rise: Magnitude and Rate
MMagnitude of Rise (millimeters above 1980 levels)
Scenario 2000 2025 2050 2075 2100
Conservative 50 130 240 380 560 Mid-Low 90 260 520 910 1440 Mid-High 130 390 790 1370 2170 High 170 550 1170 2130 3450
RRate of rise (mm/year)
1980- 2000- 2025- 2050- 2075- Scenario 2000 2025 2050 2075 2100
Conservative 2 3 4 6 7 Mid-Low 4 7 10 16 21 Mid-High 7 10 16 23 32 High 9 15 25 38 53
(All data rounded to integers.)
Source: U.S. EPA (1983).

15
rise" refers to the locally experienced relative rise.
Estimates of rates of change in sea-level over the last century range from 1 to 3 mm/yr,
with most recent and detailed evaluations centering on an increase of 1 to 1.2 mm/year (Barnett
1983, Gornitz and Lebedeff 1987, Woodworth 1987). This increase is attributed to thermal
expansion of a warming ocean (Gornitz et al. 1982), melting of ice (Etkins and Epstein 1982, Meier
1984), and coastal subsidence (Pirazolli 1986). The current consensus is that this increase can be
explained by both melting of land ice and thermal expansion (Thomas 1986, Wind 1987).
There is now some evidence that the rate of sea-level rise is increasing; in the last 50
years, the rate of global sea-level rise has increased by 0.6 mm/year--nearly double the
previous rate (Gornitz and Lebedeff 1987). It is tempting to ask whether this recent increase is an
indication of global warming, and some analysts have correlated global sea-level rise with global
temperature. While this increase is consistent with the projected sea-level rise due to thermal
expansion of the surface waters of the oceans and net melting of land ice associated with the
greenhouse effect, it is not yet possible to unambiguously attribute the observed sea-level rise
with global warming. If climate change projections are correct, this trend can be expected to
continue.
The future increase in the rate of sea-level rise is expected to be very slow for the next
few decades, contributing to policy confusion over the proper response. This increase will
probably not be unambiguously detected until 2020 or later (Thomas 1986). The rate of rise will
increase progressively, however, leading to more rapidly rising sea level toward the middle of
the 21st century. While this gives us time to develop appropriate policy responses, it also may

16
permit policy makers to become complacent about the problem, which could lead to extensive
and expensive development in coastal regions that should be protected or left undeveloped.

17
III. PREVIOUS REGIONAL CASE STUDIES
Numerous studies have been done of the impacts of sea-level rise on different regions of
the world, and many more are underway. These studies use a variety of approaches and methods
for analyzing the regional effects of a range of increases in sea level. Some insights into methods
for analysis can be gained by reviewing these approaches. Several general assessments and
discussions of impacts also provide good background for this problem (see, especially, Vellinga
and Leatherman 1989, Wind 1987, Barth and Titus 1984, National Research Council 1987)
Kyper and Sorensen (1985) look at the physical effects of sea-level rise on a section of
shoreline in New Jersey, United States. They limit themselves to evaluating beach erosion rates,
Figure 1 Projections of Future Sea-Level Rise

18
shoreline recession, and flooding probabilities under new, higher sea levels. This information is
then used to evaluate possible structural responses. No discussion of economic costs is included.
Titus (1985) presents a similar study for Ocean City, Maryland that includes a brief discussion of
the costs of maintaining the beachfront.
Several detailed studies on the effects of sea-level rise on Bangladesh have been done
(see, for example, Broadus et al. 1986, Mahtab 1989), though no economic analyses have yet been
done. Mahtab (1989) describes in great detail the physical environment, the agricultural system,
and the vulnerability of Bangladesh to climatic changes. Responses to rising sea level include
extensive embankments or levees along the coast and rivers, an increase in fresh water releases
from reservoirs upstream to reduce the penetration of salt water into the Ganges delta, and the
development of disaster response plans.
A similar study was done for the Republic of Maldives -- a chain of coral atolls in the Indian
Ocean (Edwards 1989). The study focused on identifying the greatest risks to the Maldives from
plausible sea-level rise scenarios. Recommendations for future research are included, but no
discussion of economic risks or benefits is presented.
Early efforts to protect populations from coastal flooding can be traced back to the 3rd
century B.C. in what is now the Netherlands. At that time, dikes and elevated developments and
roads were built (Goemans 1986). By the 1200s, active programs were underway to reclaim land
from the sea and defend land from damaging storms. Today, if the country were not protected
from the sea, more than 50 percent of the land area would be underwater--a region holding 8
million people.

19
In response to damaging storms, the Dutch have embarked on a massive program of
building sea defenses. In those regions with high economic value, such as the central part of the
country with major industrial and agricultural areas and high populations, protection was
considered essential. Among the problems the Dutch face is how to choose the level of
protection, given storm surges, wave runup, wind effects, sea-level rise, and land subsidence.
For example, a dike that has to resist a water level of +5 meters must be much higher than 5
meters. The final report of the Dutch committee to review the 1953 flood disaster concluded that
to protect against a 5-meter storm surge would require a dike over 15 meters high (Goemans
1986). The Netherlands presently has about 400 kilometers (km) (250 miles) of sea dikes and 200
km (125 miles) of dunes, which require an annual maintenance cost of approximately $35 million.
All previous protection strategies in the Netherlands have focused on the present threat.
To protect against a future sea-level rise will require substantial additional economic outlays. In
a simple calculation, Goemans (1986) estimates that a 1.0-meter (3.3 feet) rise would require
$4.4 billion over current planned outlays; a 2.0 meter (6.6 feet) rise would require $8.8 billion.
About 60% of these expenditures would go to dikes and dunes, 30% for water management, and
10% to rivers and ports.
Perhaps the most detailed attempt to evaluate the costs of protecting against sea-level
rise was done by Weggel and others (1988) for the United States Environmental Protection
Agency. In this study the effects of sea-level rise were evaluated for six diverse sites in the
United States. The costs were determined based on the assumptions that low-lying areas with
little development would be abandoned, structures would be raised where appropriate, some

20
structures would be moved to higher elevations, and other economically valuable areas would be
protected with dikes, drainage facilities, and pumps. Unit costs for each response were
developed using standard engineering designs. After the costs for the six index sites were
determined, total costs for protecting the entire U.S. shoreline were calculated by
extrapolating.
While this approach has advantages for evaluating regional costs, small errors introduced
into calculating the costs at the index sites have the potential to lead to enormous errors during
the extrapolation to the entire U.S. coast. Indeed, one of the index sites of this EPA study is
within the case study area for the current project, and it appears that Weggel et al. (1988) greatly
underestimated the costs of protection by incorrectly measuring the shoreline lengths needing
protection.
In another study done for the U.S. EPA (1989a), Yohe (1988) developed a methodology
for evaluating the cost of threatened resources. The three areas of focus are: the value of
threatened structures; the value of threatened property; and the social value of the threatened
coastline. This analysis is limited to developed areas, without consideration of ecosystems,
wetlands, and indirect social costs such as the cost of relocation or the risks of environmental
refugees -- people forced to flee a country or region for environmental reasons.
Titus et al . (1987) summarize many recent studies on the effects of sea-level rise on
coastal drainage systems. Responses include retrofitting existing systems, improving gravity
drainage systems to include pumping, and adapting to increased flooding. The specific case
studies of LaRoche and Webb (1987) and Waddell and Blaylock (1987) include estimates of costs

21
associated with different scenarios. LaRoche and Webb (1987) conclude that incorporating sea-
level rise into current designs is considerably less expensive than retrofitting systems in the
future. Waddell and Blaylock (1987) conclude that the appropriate response depends on the
watershed of interest, the characteristics and adequacy of the existing systems, and the sea-level
rise scenarios assumed.
Day (1987) evaluates the response of the Mississippi Delta to relative sea-level rise -- in
this case due to land subsidence rather than a rise in absolute sea level. Several insights are
gained into the impacts of sea-level rise on natural and social systems, including details on the
deterioration of wetlands, saltwater intrusion, and disruption of sedimentation patterns.
Although important implications for institutions are outlined, no evaluation of the costs of
responses is included.
The Charleston, South Carolina area is examined by Gibbs (1986). The study evaluates the
economic impact of various sea-level rise scenarios depending on when different responses are
implemented. Uncertainties in predicting government and individual responses are emphasized.
Reducing this uncertainty, as well as uncertainties about the rate and level of sea-level rise, is
shown to be crucial to the evaluation of response options. Gibbs' approach is applicable for
regions where good estimates of economic activities and values of threatened areas are
available.
Several studies have been done for San Francisco Bay area. In one of the earliest studies,
Williams (1985) provides a good summary of the types of impacts to expect from sea-level rise.
This report outlines areas of vulnerability and issues of critical importance, although no cost

22
analysis is provided. This work was expanded in 1988 to look in detail at the impacts of climate
change on the Sacramento/San Joaquin Delta and water quality in San Francisco Bay. Among the
most important findings were dramatic effects on the volume and area of the Delta assuming both
the protection and loss of the levee system, and the need for large volumes of "carriage water" -
- freshwater released from upstream reservoirs -- to maintain water quality in the Bay (Williams
1988).
Also in 1988, the San Francisco BCDC (1988a) summarized the expected impacts of sea-
level rise in San Francisco Bay and made recommendations affecting wetlands and general
planning along Bay shorelines. Although a summary of predictions of accelerated sea-level rise
was provided, no rise over the historical rate was considered and no estimate of the costs to the
region was included.
The California Coastal Commission (1989) prepared a comprehensive draft report
summarizing possible effects of sea-level rise along the entire California coast. Included are
estimates of the magnitudes of various effects for different regions along the coast, as well as the
relative economic loss for the regions. No actual dollar figures were provided.
One detailed study for a site in San Francisco Bay was conducted by URS (1988). The town
of Corte Madera is presently threatened by storms, and requested a study of alternative flood
protection alternatives. Included in the analysis is consideration of a scenario of sea-level rise
and the costs associated with incorporating the ability to retrofit protection into designs.

23
IV. METHODS FOR ANALYZING THE COSTS OF RESPONDINGTO SEA-LEVEL RISE
There are four steps to analyzing the costs of protecting against a given sea-level rise for
any region:
1. Determine the physical and hydrodynamic effects.
A wide variety of physical and hydrodynamic effects will accompany a rise in sea level,
including changes in tidal ranges to which a shore is exposed, changes in currents, changes in
wave heights generated by winds, and the rise in water level associated with storm surge. Each
of these factors should be considered when evaluating the implications of climate change for
coastal developments. Other factors may impact the water quality of estuaries, particularly
changes in currents and greater upstream progression of the salt water-fresh water interface.
2. Identify the societal resources threatened by the physical and hydrodynamic effects.
In any given area, many different types of resources would be threatened by rising
oceans. There could be transportation facilities such as roadways, bridges, and subways, electric
utility systems, storm and sanitary sewers, sewage treatment plants, harbors, groundwater
supplies, wetlands, fisheries, species habitats, coastal vegetation, and many other human and
natural systems. Evaluating the resources at risk in a region is a prerequisite to choosing the
appropriate response and level of protection.
3. Determine the protective responses appropriate for the region.
There are many possible structural responses to sea-level rise, including building or
improving coastal defenses such as dikes and dunes, seawalls, bulkheads, beach nourishment, and

24
other structures. Non-structural responses include abandoning property and land and moving
to less threatened areas. Perhaps the most effective non-structural response is to prohibit
development in regions likely to be threatened in the future. This choice, however, requires the
most forethought and planning. The costs of different responses can also be determined given
local circumstances.
4. Choose a level of protection for threatened resources given economic and societal
values.
Each of the resources and facilities identified in (3) can be protected by some combination
of the alternatives identified in (2). Details about what level of protection to choose are a function
of the perception of the value of the threatened property, the cost of alternative measures, and
numerous political and societal factors. Physical and hydrodynamic effects may, in turn, change
with the level and type of protection chosen. They should be periodically re-evaluated. The
effects of sea-level rise, responses, and threatened resources must all be evaluated at a local
level, but broader regional effects must be incorporated into final protection strategies.
IV.1. PHYSICAL AND HYDRODYNAMIC EFFECTS OF SEA-LEVEL RISE
Various physical and hydrodynamic effects will accompany a rise in sea level. These
include changes in tidal ranges, changes in currents, changes in wind-driven wave heights, and
the rise in water level associated with storm surge. Each of these factors plays a role in
determining the implications of climate change for coastal developments.
As a first estimate of the impact of sea-level rise on a region, a direct increase in the mean
sea level equal to the rise can be assumed. The greater area submerged by the greater depth of

25
water can then be estimated based on the regional topography.
The "drowned-valley" concept may be used to estimate the shoreline profile where the
coast can be considered nonerodible or where wave action is limited. The area inundated is
estimated using current topographical information with the assumed sea-level rise. Slope is the
controlling variable with steep-sloped areas experiencing little horizontal shoreline
displacement with water level rise, while gently-sloping shores undergo much greater flooding
for a given sea-level rise (National Research Council, 1987).
Where the coast erodes easily, sea-level rise will lead to shoreline recession in addition
to general inundation. The amount of erosion can be estimated by several methods. Because of
the generally concave-upward slope of a shoreline of sand material, a rise in sea level results in
wave energy being dissipated in a smaller area. This causes more turbulence in the surf zone and
an increase in the rate of sediment transport. The extent of the shoreline retreat due to this
process can be estimated using the so-called Bruun rule, a dynamic-equilibrium model, or a
historical-trend analysis.
The most widely applied method of predicting shoreline recession based on a sea-level
rise was developed by Bruun in 1962. This is based on the concept that the depth of water near the
coast remains constant with a sea-level rise, that the basic beach profile will remain the same, and
that there is a well defined offshore limit of sediment transport. The sediment required to
maintain the beach profile through water-level changes is derived from erosion of the shore
material. Based on this, a rough estimate of the shoreline recession due to readjustment of the
beach profile to an equilibrium state is 1.0 to 1.5 meter of shore recession per centimeter of sea-

26
level rise.
Despite its widespread application, many problems exist with the Bruun rule. The
formulation is based on a two-dimensional concept, while the sediment transport along a
shoreline is a three-dimensional process. The Bruun rule assumes a shoreline profile in
equilibrium (a condition difficult to confirm at any site). Another problem is that this approach
always predicts shoreline recession with offshore sediment transport as sea level rises. There
are several cases cited (National Research Council 1989) where during a rise in sea level
shorelines have accreted due to movement of sand onshore from offshore deposits. Depending
on local sources and sinks of sediment, wave climate, topography, and other conditions
governing sediment transport mechanisms, the predictions of shoreline recession obtained
using the Bruun rule can significantly overestimate or underestimate the future recession.
More specific methods are possible for particular sites, and should be conducted to better
evaluate the impact of sea-level rise on a region. One possibility is a sediment-budget approach
such as that developed by Everts (1985). This extends the Bruun rule to account for changes in
sand volume along a shoreline reach. The dynamic-equilibrium model uses a similar concept, but
includes a numerical estimate of the dynamic response of the shoreline due to short-term
events, such as storms. A historical-trend analysis incorporates the development of a
relationship of shoreline response over time based on historical data. These are useful where a
local sediment budget is difficult to quantify (U.S. Department of Energy, 1988). Dean (1990)
presents a method for evaluating shoreline erosion (and subsequent nourishment requirements)
in the presence of onshore sediment transport, and a model is presented that may assist in
evaluating the vulnerability of various shoreline systems to increased rates of sea-level rise.

27
Tidal Ranges
In addition to the rise in mean sea-level discussed above, the tidal range (the difference
between mean high and low tides) will be affected by the change in water level. Two different
types of systems are discussed here to demonstrate the effects of sea-level rise on tidal ranges:
friction-dominated systems and resonance-dominated systems.
For an estuary that can be considered infinitely long (i.e. the amplitude of the incoming
tide wave is not significantly affected by wave reflections from a closed end), the system can be
considered as friction dominated. In a friction-dominated system, a rise in sea level results in
deeper water and a reduction in the effect of bottom friction. When the system is friction
dominated, the principal wave form is progressive, and the effect of bottom friction decreases as
the tide wave progresses. The ratio of tidal frequency to natural frequency is very small for this
type of system. The effect of sea-level rise on the tidal range of a progressive wave is depth
dependent, varying with depth to the minus one-third power (U.S. Department of Energy, 1988):
Rangenew = [Depthnew/Depthold]1/3 * Rangeold
For an estuary that is closed at one end, reflection of the advancing progressive tide wave
occurs at the closed end. As the frequency of the tide wave approaches a natural frequency of the
system, resonance occurs that amplifies the tidal range toward the closed end, and the system
can be considered resonance-dominated. As mentioned by Ippen (1966), of greatest interest in
practice are cases of channel length approximating one quarter wavelength.

28
Sea-level rise can result in either an increase or a decrease in tidal range in such
resonance-dominated systems. For instance, an increase in water depth can increase the
wavelength of the natural frequency, shifting the system to a less resonant condition. This will
have the effect of decreasing the tidal range observed at the closed end of the basin. The ratio, R
of the amplitude at the closed end to the amplitude at the mouth (for a frictionless channel of
length L*) is:
R = 1/[cos(2πL*/L)].
As a ratio of L*/L approaches 0.25 the above ratio increases, simulating the amplification
effect. As the ratio of the length of the channel, L*, to the length of the tide wave, L, becomes very
small, i.e. approaches zero, the ratio approaches unity. The assumptions that bottom friction can
be neglected and that complete wave reflection occurs at the closed end interfere with applying
this relationship to a natural system. Adapting a relationship given in Ippen (1966), the ratio, R
can be expressed:
R = 1/[0.5(cos2kL* + cosh2_L*)]0.5
or R = 1/[0.5(cos4πL*/L + cosh2_L*)]0.5
where k is the wave number = 2π/L, and _ is a damping coefficient. This allows the inclusion of
both the damping of the tide wave, and the change in the length of the wave due to the increase in
water depth associated with sea-level rise.

29
Storm Surge
Storm-surge level is the response of mean water level to high winds, pressure
differentials, and rainfall associated with storms. Storm surge is a function of water depth; as such
it will be affected by a rise in long-term sea level. For the situation where the continental shelf is
uniform in depth, the storm-surge level will decrease with an increase in water depth. This is
also the case where the shoreline is fixed, since set-up is inversely related to water depth.
For steady-state conditions, the storm-surge height (amplitude) at the shoreline for the
case of a uniform depth of the continental shelf is:
H = (h02 + 2*B*x)0.5 - h0
where h0 is the original water depth, x is the distance from the shoreline to the edge of the
continental shelf, and B is a factor that includes the wind-induced shear stress. The derivative of
this with respect to h0 gives a result that is always negative, indicating that sea-level rise will
result in a decreased wind-induced storm-surge height.
For geometries other than a uniform shelf depth, such as a uniform slope of the
continental shelf, the descriptive equations for set-up due to storm surge do not yield general
conclusions regarding the effect of a rise in mean sea level. To estimate the effect for a particular
site, several sophisticated numerical models have been developed. In general, storm surge will
be most affected by sea-level rise in areas of mild offshore slopes (U.S. Department of Energy,
1988), for example, the shores of the U.S. along the Atlantic ocean and the Gulf of Mexico.

30
Wind-Generated Waves
The effect of a sea-level rise on wind-generated waves depends on local geometry. The
two effects that a sea-level rise can have on the height of a wave experienced at the shore are: (1)
changes in the height of the generated wave; and (2) changes in the damping of the wave as it
propagates toward the shore. The cumulative damping due to bottom friction governs whether
the result will be an increase or decrease in observed wave heights.
Wind-generated waves in deep water are not expected to change in response to sea-
level rise. If the fetch length -- the length of water surface over which the wind acts -- does not
change, waves generated over the continental shelf and shallower water will be higher due to
reduced effects of bottom friction. This is shown by the relationship given by the National
Research Council (1987) for the case of a long fetch and shallow water:
_H/S = 0.75*H/h
where _H is the change in the generated wave height, H is the original wave height, S is the water
level increase, and h is the depth. It can be seen from this equation that one can expect a higher
wave generation height due to sea-level rise.
Assuming the shelf length does not change significantly with an increase in water depth,
the generated waves will decay less, because of decreased damping due to bottom friction. If a
wider shelf results from a sea-level rise, wave height may be reduced due to a greater extent of
bottom friction (U.S. Department of Energy, 1988). This can be shown by the relationship:

31
H(x) = H(0)/(1+_)
where H(x) is the wave height at a location x, H(0) is the initial wave height, and _ is a relationship
defined by:
_ = f_3H(0)x/[3πgCgsinh3kh]
where f is a coefficient that accounts for bottom stress, _ is wave angular frequency, g is
gravitational acceleration, Cg is the wave group velocity, and k is the wave number. For the case
of the wide shelf resulting from sea-level rise, _ may increase, resulting in a decreased wave
height, H(x) at the shore.
As with storm-surge, detailed numerical models exist that can be used to predict the
response of wave height with sea-level rise for a particular geometry.
IV.2. RESOURCES THREATENED BY SEA-LEVEL RISE
The resources at risk from a rise in sea level vary greatly in any area affected by
hydrodynamics and physical effects. This area can be below the expected highest tide for the
design period or the area within the expected extent of shoreline erosion. Any effects on
resources within the affected area may lead to secondary impacts elsewhere. Determining the
types of resources threatened by sea-level rise is a crucial step toward choosing an appropriate
level and method of protection.
32
Residential
Because of the scenic value of coastal and other waterfront property, extensive
residential development has occurred in areas already threatened by erosion and storm tides. An
increase in sea level will increase the severity of possible damages in threatened areas and will
expand the size of flood zones. Many homes in coastal zones are protected by non-engineered
levees and revetments, or are not protected at all.
Commercial, Industrial, and Transportation
High-value commercial, industrial, and transportation facilities are also located on
waterfront property. Such facilities make use of the waterfront for waste disposal, movement of
goods or people, or commercial activities. Among the most common facilities are airports,
railroad tracks and terminals, highways, power plants, waste-disposal sites, waste-treatment
plants, ports and docks, warehouses, salt ponds, and marinas. Existing forms of protection for
these facilities vary greatly, from bulkheads and engineered seawalls to riprap and non-
engineered levees.
Natural Resources
The zone between land and water often hosts extremely rich natural ecosystems. The
intertidal zone is one of the most diverse and sensitive coastal ecosystems. The brackish water
interface between fresh water and salt water in bays and marshes produces special conditions
conducive to certain species. Saltwater and freshwater marshes support countless species of
invertebrates, fish, and mammals, and provide food and habitat for migrating birds. Many
endangered and threatened species are found in these habitats. Little protection is usually
provided for these resources; some may have levees.

33
IV.3. RESPONSES TO SEA-LEVEL RISE
There are three main responses to rising sea levels: (1) reduce or prevent sea-level rise;
(2) reduce the impacts of sea-level rise through coastal defenses and remedial measures; and (3)
retreat from threatened areas and move or abandon existing developments. Included in the last
response is the option of "No Action", where no response is taken to rising sea level and land is
eventually inundated, property destroyed, and ecosystems lost. Each of these strategies has
advantages and disadvantages. Actual responses to sea-level rise are likely to include
combinations of all three options.
In this analysis, no attention is given to methods for reducing or preventing climate-
induced sea-level rise. While there is strong support for active measures to reduce the rate of
climatic change, there is evidence to suggest that some rise may be unavoidable due to the
greenhouse gases already put into the atmosphere. We therefore believe that it is valuable to
analyze the costs to society of adaptation measures. For the purpose of this study, we assume
that a substantial sea-level rise is plausible (if not inevitable), and we assess strategies for
preventing or eliminating the worst negative impacts of that rise.
There are many structural responses to sea-level rise, including building or improving
coastal defenses such as dikes and dunes, seawalls, bulkheads, beach nourishment, and other
structures. This section briefly reviews the most common physical responses to problems of
coastal flooding.

34
Beach Nourishment
The addition of beach sand to a shoreline has been used to construct beaches where none
had previously existed, and to replenish eroded sand. As a response to the expected increase in
erosion due to sea-level rise, the purpose of beach nourishment is to restore an eroding beach
on a temporary basis, although nourishment can also provide long-term restoration in certain
types of areas. The rate at which the replenished beach erodes is a function of wave action, the
uniformity of placement of the sand, and the grain size (U.S. Army Corps of Engineers, 1984a).
The sand used for a beach nourishment project usually comes from offshore dredging and
pumping to the desired site; less frequently material is imported from an off-site location. The
cost of the material can vary greatly depending on its origin.
The use of beach replenishment for shore protection has the advantage of being
compatible with the existing processes, and has few negative effects on other areas. The placed
sand, however, has a tendency to erode more quickly than the original sand for two reasons.
First, by adding sand to the beach and not to offshore areas, beach nourishment throws the slope
of the beach out of equilibrium with adjacent underwater areas, steepening the profile of the
shoreface. The steeper profile is less stable in storms and the waves move sand offshore to
restore the original slope. Second, sand used for beach nourishment often includes many fine
particles of silt and clay, which will be washed away by the force of the waves, reducing the net
volume of material added to the beach (Lowenstein, 1985).
The addition of sand to an eroding shore is a temporary restoration, and is particularly
vulnerable to increased erosion due to sea-level rise. The maintenance costs associated with
periodic additions of material determine the cost of this response. A method to roughly

35
approximate increases in beach nourishment volumes due to a sea-level rise is presented by the
National Research Council (1987) where the increase is proportional to wave height to the 2.5
power. The increase in wave height for a particular location can be determined using the
equations presented in Section IV.1.
Another method for estimating the required increase in sand quantity needed to restore
a beach eroding due to sea-level rise is used by Leatherman (1988). This method uses previously
established closure depths (the seaward limit of significant offshore sand transport) for regions,
and the scaled distance to this depth, to obtain the beach profile to be nourished. The area to be
nourished is also obtained from maps and the volume of required material can be calculated.
The costs for beach nourishment are a function of the cost of the material and the
availability of local supplies. Costs generally range from $4 to $10 per cubic yard. The higher
costs apply where the sand is either pumped from a long distance offshore, or imported from a
remote source. These costs are not easily translated to a linear foot basis, but individual cases
have yielded costs from $50 (for a beach on a bay) to over $600 per linear foot.
Groins
One type of structure designed to lessen the impact of coastal processes on a shoreline is
a groin -- a structure oriented perpendicular to the shore that serves to reduce the flow of
sediment along a shore (the local littoral drift rate). Sand collects on the updrift side of the groin
until it is filled to capacity, when longshore drift is allowed to pass. Groins are often used in fields
(sets of more than one groin) to protect a long section of coastline. Immediately downfield of
the groin field, however, is often subjected to accelerated erosion, especially when the groins

36
are not filled with sand during construction (National Research Council, 1987).
Groins can be classified by permeability, height, and length. Common types are
constructed using timber or steel sheet piles, concrete or rubble mounds, or asphalt groins. The
selection of the type is based on the quality of the foundation material that will support the groin.
A good foundation can accommodate a sheet pile type design; a poor foundation better utilizes a
gravity type of structure. As with all of the alternate responses, the availability of materials is an
important consideration in the selection of the response (U.S. Army Corps of Engineers, 1984a).
Sea-level rise can affect a groin by reducing its effectiveness due to "flanking" or
"submergence". A groin typically extends landward to the dune line, and the dune line may
retreat due to sea-level rise, leaving the groin susceptible to flanking during high or storm
tides, allowing sand to bypass the groin. Submergence of the groin can lead to overtopping by
the longshore current, further decreasing the structures' efficiency at stabilizing the area
(National Research Council, 1987).
The use of groins together with beach nourishment increases the effectiveness of either
technique alone (National Research Council, 1987). An analysis of the cost of beach nourishment
projects and an evaluation of the conditions for justification of additional structures to retain the
sand are presented by Weggel (1986) and discussed below.
The general costs of groins varies depending on the type of foundation material on the
site, the materials used, and the design dimensions and strength. Costs range from under $100
to over $1000 per linear foot. The lower estimates are for minor projects in a relatively mild

37
wave climate, while the higher costs represent extensively engineered groins in a severe wave
climate.
Bulkheads, Seawalls, and Revetments
There are three principal forms of vertical shoreline walls used to protect upland areas
from storm surges and high tides: bulkheads, seawalls, and revetments. The differences between
seawalls, revetments, and bulkheads are in their protective function. Seawalls are designed to
resist the forces of storm waves; bulkheads are to retain the fill; and revetments are to protect
the shoreline against the erosion associated with light waves (U.S. Army Corps of Engineers,
1984a).
Bulkheads and seawalls are typically constructed as solid vertical walls above the mean
high-water line. These structures can be modified after construction to respond to a sea-level
rise. Revetments are either loose or interlocking units laid on a slope, from the upland to some
point on the profile. The purpose of revetments is also to protect the upland. Because of the
slope of the revetment and the roughness of its surface, erosion at the fronting beach area can be
reduced. These can also be modified after construction (National Research Council, 1987).
A wide variety of possible effects and processes relating to the impact of seawalls on a
shoreline are summarized by Tait and Griggs (1990). These include erosion of the fronting beach,
sand accretion, adjustment of the profile to a steeper or flatter slope, scouring at the end of the
wall, and an assortment of other erosion and deposition patterns. There is a wide range of
opinion on the processes explaining shore response to the presence of a seawall (or other type
of coastal armoring), and due to the lack of field information, many explanations remain

38
speculative. For example, it has been proposed that the loss of a beach in front of a seawall is
because, on an open beach, waves expend much of their energy moving across the beach.
Structures such as seawalls, revetments, and bulkheads cut the process short, reflecting the wave
force seaward, where they can cause significant erosion (Lowenstein 1985). The observed
erosion at a beach, however, cannot generally be attributed to the presence of a particular
structure without extensive field data.
One of the major observations of Tait and Griggs (1990) is that the most important factor
affecting the impact of a seawall on a shoreline is whether there is long-term shoreline retreat.
The majority of field studies indicates that most of the direct effects of seawalls on beaches are
temporary or seasonal in nature, and that the most prominent lasting impact is sand
impoundment at the upshore end of the wall, and erosion at the downshore end. To evaluate the
impact of a seawall on a shore, a site-specific assessment of the potential impact should be
conducted. This should allow the evaluation of the possible impacts of the structure on upcoast
and downcoast areas, and the implications of sediment movement on the functioning of the
structure to protect upland areas.
Careful attention must be paid to the details of the structure during design and
construction, since rigid structures can fail as a result of many factors including loss of foundation
support, inadequate penetration of the structure into the supporting material, scouring at the
base, outflanking, inadequate height, and the loss of fill behind the structure (Fulton-Bennett and
Griggs, 1986).
Non-rigid structures such as rip-rap revetments can fail for similar reasons, such as

39
scouring at the base of the revetment and outflanking. The typical modes of failure for
revetments on sand involve settling of the protective material into the sand due to scouring and
fluidization of underlying sand, or collapsing of the revetment into a configuration of a lesser and
more stable slope (Fulton-Bennett and Griggs, 1986).
A rise in sea level will have the effect of exacerbating these processes, increasing the
possibilities for failure of the structure. For example, increased overtopping will result in
greater forces behind the structure and an increased loss of backfill, and increased loss of
foundation support and toe scour will result from greater wave energy dissipation at the
structure. Sea-level rise can be incorporated into the design of a structure by either
constructing it for an anticipated increase in sea level, or by making provisions for future
modifications to accommodate the rise.
Typical construction costs for bulkheads and seawalls range from $750 to over $4000 per
linear foot. Costs for revetments are similar to those of bulkheads and seawalls where the
revetment is engineered. These costs can range from about $750 to $1500 per linear foot. For
non-engineered revetments, consisting of concrete or rock rubble simply dumped at a location,
the costs of material and construction are very low, consisting primarily of material
transportation costs. Very simple rubble-mound walls along a bay shoreline have costs as low as
$60 per linear foot (San Francisco BCDC 1988b). The higher costs will be representative of large-
scale projects where the wave climate is severe and the intended protection considered
essential.

40
Breakwaters
Offshore breakwaters are above-water structures parallel to the shore that reduce both
wave heights at the shoreline and littoral drift. Sea-level rise will reduce the protective
capacities of breakwaters in two ways: rising water levels will effectively move the shoreline
father from the breakwater, increasing the ability of the waves to diffract behind the structure
and reducing the sheltering and efficacy of the device; and the increased frequency of
overtopping will diminish the ability of the breakwater to reduce the wave energy in the
sheltered region (National Research Council 1987).
As with the other structures mentioned previously, to accommodate sea-level rise
breakwaters should either be designed with a sea-level rise taken into account or with
capabilities for future adaptation. The costs of breakwaters are similar to those of groins, with a
high variation in the cost, reflecting the wide variety of materials and construction techniques
that can be used. A rough range would cover from under $100 to over $1000 per linear foot,
with average costs closer to $750 per foot. The local conditions of both wave climate and
foundation material will determine the costs of breakwaters.
Dikes/Levees
Dikes or levees are embankments to protect low-lying land. A sea-level rise can result in
reduced stability and increased overtopping of existing levees. New levees may be constructed
to protect developed areas (National Research Council 1987). Whether existing levees can be
modified for a rise in sea level depends on the availability of material for raising the levee, the
suitability of the foundation material to support the additional weight of the material, the stability
of the levee with the increased water level, and the accessibility of additional area for widening

41
the base of the levee. Considerations for new levees include the above, as well as issues such as
land condemnation and interference of the levee with navigation (National Research Council
1987).
Another important factor is the possibility that sea-level rise will lead to additional
drainage problems. For existing levees, a higher sea level will result in increased seepage
beneath the levees, causing increased drainage and pumping requirements. For both new and
existing levees, the drainage of precipitation, flood waters, and water from overtopping of the
levees often necessitates a drainage system. As sea level rises, a gravity drainage system will
become increasingly less suitable, resulting in the need for either pumping facilities or systems
for storing excess water until drainage by gravity is possible. Discussions of these drainage
systems is included in Titus et al . (1987) and Weggel et al . (1988). The increased seepage beneath
a levee is also of concern where the levee is protecting agricultural land or water-supply areas.
In these areas the increase in seepage can cause problems related to an increased salt load on the
soil and water quality.
Costs of construction of new levees vary widely, depending on the cost of the material
used, the suitability of the foundation soil, and the design standards required for the location.
For an engineered levee, costs range from $250 to $800 per linear foot. The lower costs might
reflect the cost for a levee along a small slough, while the higher costs could include greater
slope protection and greater dimensions. Extensively designed levees in areas where
construction is difficult can significantly exceed the upper end of the cost given above.
The costs to raise an existing levee depend on the cost of the material which will be added

42
to the levee. The costs can vary from about $2.50-$5 per cubic yard for material dredged from a
channel adjacent to the levee, to more than $10 per cubic yard where material is not available
locally. These costs neglect the costs of modifying levees to allow it to be raised. Such costs can
be substantial.
Other Structures
A perched beach is a sill constructed offshore of and parallel to the beach to be protected.
The function is to collect longshore material being transported offshore, as compared with the
function of groins, which attempt to retain a portion of the material being transported along the
shore (U.S. Army Corps of Engineers, 1984a). As sea level rises, the sand retention of the sill will
become less efficient, and the beach front will be farther from the structure, reducing its overall
effectiveness.
Storm-surge barriers are barriers designed with heights to exceed the surge elevations
of certain design storms. The factor of safety of these structures will be reduced as sea level
rises. (National Research Council, 1987)
Maintenance Considerations
In addition to the costs of construction of the various structures given above,
maintenance costs are often significant. In general, the greater the engineering employed in the
construction of a shore protection scheme, the lower will be the proportion of maintenance
costs. The maintenance cost of engineered riprap-revetment, for example, can amount to 2 to 4
percent of the construction cost per year over the life of the project. This can be compared with
the maintenance cost for a non-engineered revetment of 5 to 15 percent of the construction cost

43
per year (Fulton-Bennett and Griggs, 1986). Average maintenance costs for levees are about 10
percent per year of the costs of construction. The estimated maintenance costs for seawalls run
from 1 to 4 percent per year, reflecting the higher level of engineering that goes into their
construction.
IV.4. SELECTION OF RESPONSE STRATEGIES
In the long run, a comprehensive approach to evaluating the costs of sea-level rise and
possible response strategies in a given region needs to be developed. One example of a possible
approach is the ISOS (Impact of Sea-Level Rise on Society) framework developed in the
Netherlands in 1986. Two versions are discussed by Wind (1987) -- an "ideal" ISOS model, and a
simplified ISOS model programmed into a spreadsheet.
The main components of the "ideal" model are the amount of sea-level rise, details of the
impact areas, impact mechanisms, response measures, and societal effects, as discussed earlier in
this section. Sea-level rise is considered as a projected rate of rise that can vary over time. The
input data for sea-level rise for the working model consists of a current rate of rise plus an
acceleration of the rise over the period of interest.
The impact area can be separated into the natural system (including estuaries, lagoons,
and wetlands), the existing protection system (both natural and structural), and human activities
and facilities (the population and economic activity). The ISOS spreadsheet model allows the
division of the region being studied into a maximum of three segments, based on characteristics
pertaining to the above area types. The impact characteristics for each segment are described as
input to the spreadsheet model and include population, land and capital values, physical

44
characteristics of the land, the flood protection system, the water resources management
system, and the shipping and port system.
The impact mechanisms describe the impact of sea-level rise on various components in
each area. The most important mechanisms in the model relate to: 1) land losses (area and capital);
2) safety against flooding; 3) salt load (salt-water seepage into water supplies and agricultural
areas); and 4) damages related to the water resources management system and the shipping and
port system. Land types are divided into intertidal, urban/industrial, agricultural, and
environmental, and the area of losses are calculated for each type based on the specified slopes.
Also specified as input are monetary values for each land type, which are used to calculate
monetary losses. These monetary losses are adjusted based on the capital value growth rate and
the social discount rate, both of which are specified as input. Safety against flooding is based on a
relationship correlating frequency of overtopping to height above mean sea level, which is
specified as input. Likewise, a relationship showing the variation of salt load with sea-level rise,
and another showing the damages to the water resources management system (under various
investment scenarios) with sea-level rise must be developed for input to the model.
The spreadsheet model produces information on impacts for the population at risk, land
loss, safety against flooding, total salt load, damages to the water resources management
system and the shipping/port system, and the cost of response measures. Many effects are not
shown by the model, such as the effect on ecosystems, administrative costs, social costs, or
public health costs. The difficulty in quantifying these makes their incorporation into a model
such as the ISOS model unlikely. Despite the weaknesses of this type of model, it can be useful for
exploration of involved problems, mechanisms, and trade-offs, and for analysis of actual
45
strategies to determine the relative values of different responses (Hekstra 1988). Extensive
research will be required to determine the many values and relationships for input to the model,
prior to applying the model to any region.
Another approach for evaluating costs to a region due to sea-level rise is presented by
Gibbs (1984). Methods were developed to estimate what may be at stake in decisions of various
responses to sea-level rise. Two issues were targeted: the impact on society if no action is taken;
and by how much this impact can be reduced through preparation. To address these, two
quantities were investigated: the economic impact of a sea-level rise; and the value of anticipating
and preparing for it.
As with the ISOS model, the method of analysis outlined by Gibbs (1984) is helpful in
understanding some of the potential impacts of sea-level rise, and the effects that different
responses might have on these. The inability to quantify certain inputs, and a lack of detailed
information about vulnerable regions places significant limitations on the use of the models.
Particular regions must base their selection of response strategies on regional characteristics,
the availability and types of regional data, and the economic and institutional resources available
for responding.

46
V. LIMITATIONS OF ECONOMIC ANALYSES
The direct physical effects of a rising ocean will have major economic and environmental
effects on our coasts, development, and natural ecosystems. Determining what response to
make to rising sea level requires evaluating and balancing a wide range of uncertain costs and
risks. Many of these costs are not yet quantified; some will be unquantifiable in classic economic
terms. This section discusses the difficulties, uncertainties, and limitations of economic
assessments of the costs and benefits of adapting to climatic change, specifically protecting
against sea-level rise.
Many different "costs" to society from climate change can be assessed. These include:
• The costs of reducing greenhouse gas emissions;
• The costs of increasing the rate of removal of greenhouse gases from the atmosphere;
• The costs of adapting to climate changes, such as building sea walls or developing newcrop types; and
• The costs of the impacts of climate changes on society.
Some of these costs are immediate; some are delayed in time. Some can be measured in
dollars; some cannot be measured in economic terms. All of these characteristics complicate
complete assessments. Given these problems, it is nevertheless important to begin to provide
some of this information as long as the limitations and assumptions of any study are clearly
stated.
Two important questions can be asked. First, what is the impact to society if we take nno
actions to prepare for sea-level rise? And second, what is the cost and value of taking actions to
reduce the impact of sea-level rise? Previous analyses have suggested that the impacts of sea-

47
level rise will be extensive and that there is great value in preparing for that rise (Gibbs 1984,
Wind 1987). For example, the U.S. EPA has concluded that in Charleston, South Carolina and
Galveston, Texas, the economic consequences of taking no actions could be in the billions of
dollars, while preparing for sea-level rise could reduce these impacts by over 60 percent in some
cases (Gibbs 1984, U.S. EPA 1989a).
If no actions are taken to prepare for or anticipate future sea-level rise, a variety of
unanticipated costs to society will result from inundation of shoreline developments, loss of
business activities and property, and wetlands destruction. These costs -- the "no action"
alternative -- must be compared with the costs of taking a set of actions that would anticipate
sea-level rise.
Sea-level rise will affect both services and structures. Structural costs include the costs
of physical property such as building, repairing, or moving a house, dockyard facilities that must
be raised, levees that need to be built or strengthened, and industrial, commercial, or residential
facilities that need to be protected.
Economic services include the value of land, capital, labor, and non-market amenities.
Because land and capital are fixed in location, they can be directly affected by sea-level rise. The
supply and productivity of labor can also be directly affected. The problem of non-market
amenities is much more difficult to assess and is often ignored in classic economic analyses.
Other services include activities in the affected zone, values associated with beachfront property,
and so on.

48
Our goal here is not develop methods to estimate the total value of property in a region
at risk from sea-level rise. Such an estimate would require a determination of the net economic
services in the regions at risk, the gross services and returns, the value of new investment, the
value of the capital stock at the end of the period of analysis, and so forth. For many regions, such
data are not available and subject to enormous uncertainties. In addition, we believe that
decisions about the appropriate responses to sea-level rise will depend on details about
particular sites and societal choices about the value of areas at risk.
We also note that most analyses of the economic activities affected by sea-level rise
exclude important costs that are difficult to quantify. These include the loss of recreational
activities, distributional or equity effects, the loss of natural ecosystems and the environmental
functions and services that they provide, the sometimes severe psychological costs of living
behind protective structures (Goemans 1987), losses outside the immediate study area, effects
on groundwater quality due to salt-water intrusion, effects on freshwater river quality due to
salt-water intrusion.
Costs to protect coastal properties from sea-level rise will not be incurred all at once.
Rather they will be imposed over time as decisions are made to reduce the risk of damage; or to
prevent additional damages after storm events occur. The values presented in Part 2 for the San
Francisco Bay area are the costs that would result from taking actions today to reduce the risk of
damages at some unspecifiable future time. An additional problem is that the future rate of sea-
level rise is uncertain. A one-meter rise may result by the year 2050 under some scenarios;
under others it may be delayed until 2100. If sea-level rise is rapid, the costs described here may
be incurred relatively quickly. The slower the rate of sea-level rise, the more time to plan (and

49
pay for) appropriate responses. There is a value, therefore, in slowing the rate of change.
Structural responses can be made relatively insensitive to the rate of sea-level rise by
high expenditures at the beginning of the life cycle, or they can be adjusted on an ad-hoc basis
during the period of increasing threat.
Unquantified or Unquantifiable Ecological Effects
A change in local sea level will change the environmental conditions of natural
ecosystems adapted to a particular region, with particularly profound effects on coastal
wetlands, brackish-and freshwater marshes in estuaries, bays, and lagoons. If the change is
sufficiently large, the tolerance limits of plant and animal species may be exceeded and dramatic
ecosystem shifts may occur, including local extinctions.
Wetlands are important to the ecology and economy of coastal regions; they have
extremely high biological productivity, serve as nurseries for commercially significant fish,
provide habitat for waterfowl and mammals, remove pollutants from sewage effluent and surface
water, and provide protection from coastal storms and high tides (Park et al. 1986). These
valuable ecosystems could be lost with accelerating sea-level rise. Wetlands along undeveloped
coastlines without protective engineering structures can migrate onto adjacent lowlands only if
land is available. Unfortunately, very few regions have undeveloped adjacent land, and the
presence of structures will preclude wetlands migration.
Whether or not wetlands are able to adapt to a rising sea level is a function of several
variables, including the rates of sedimentation and vegetation growth, changes in salt and

50
freshwater balances, and decisions about how to manage these lands. If mean sea-level rises at a
rate faster than the rate of sedimentation, tidal marshes will be submerged and converted to
deeper water habitats.
Sedimentation rates are highly sensitive to local conditions. Geologic evidence suggests
that wetlands can adapt to low rates of sea-level rise (≈1-2 mm/year) and are inundated at higher
rates (≈10 to 20 mm/year). Diked wetlands do not have any sources of sediments and would be
particularly vulnerable to inundation from sea-level rise.
Over geologic time, large increases and decreases in sea level have occurred, with
maximum rates over the last ten thousand years of 5 to 10 mm/year--about 2 to 5 times larger
than present rates of change. During these periods of rapid change, significant modifications of
coastal ecosystems have occurred, including inland migration of wetlands and changes from
fresh-water systems to salt-water systems. In past periods, however, suitable habitat existed
for such shifts; today extensive shoreline and wetland development will directly interfere with
the redistribution of coastal ecosystems.
Few good data are available on sedimentation rates within marshes or on mudflats, and
much of these data are site specific. Estimates of the normal marsh accretion rate in bay
ecosystems range from 1 to 8 mm per year when satisfactory inflow of sediments from rivers is
available (Martindale 1987, Josselyn and Callaway 1988), though in some types of rich subtidal
waters subject to large sediment inflow from rivers, rates as high as 70 mm/year have been
observed (Nolan and Fuller 1986). In deltaic areas with extensive marshes and sediment inflow,
more typical accretion rates of 10 mm/year are observed; in areas of moderate wetland extent, 5

51
mm/year is typical, while under 2 mm/year is average in areas with little wetland extent
(Armentano et al. 1988). Under these conditions, adverse effects on coastal marshes would be
widely observable by 2050, and would be noticeable in vulnerable ecosystems by the year 2000,
even under the low sea-level rise scenario of Table I and Figure 1. Non-linearities and sudden
events such as storm surges and a change in storm frequency and intensity could lead to damages
even earlier.

52
PART 2. A CASE STUDY OF THE SAN FRANCISCO BAY REGION
SUMMARY OF RESULTS AND CONCLUSIONS
The San Francisco Bay region, in northern California, is one of the most economically
important and ecologically rich bays in the United States (see Figure 2). Future sea-level changes
will affect human developments around the Bay and will dramatically alter ecosystem types and
functions. For that reason, an analysis of the costs of adapting to an increase in sea level would
provide valuable information for policy makers. This section describes the approach taken to
determine these costs, the uncertainties involved in making such an assessment, and the results
of the study. We also discuss the implications for future policy.
• The value of property threatened by sea-level rise in San Francisco Bay is extremely highbecause of past development. For San Mateo, Alameda, and Santa Clara counties alone,existing commercial, residential, and industrial structures in the area threatened arevalued at nearly $30 billion. For the entire Bay Area, over $48 billion of structures isthreatened.
• There is considerable value in incorporating future sea-level rise into planning for newdevelopments.
• The cost of protecting just eexisting development from a one-meter (3.3 foot) sea-levelrise by building new defenses or modifying existing protection around San Francisco Baywill exceed $940 million (in 1990 dollars), nnot including the costs of protecting orrestoring wetlands, or the need for any active structures such as pumps, drainagesystems, and navigation locks. These costs could exceed an additional one billion dollars. The costs of maintenance for these defenses are also not included and could approach$100 million per year.
• We think it unlikely that the status quo around the Bay can be maintained under conditionsof expected sea-level rise, even with extensive protective measures. Indeed,implementing all of the protective measures evaluated here would, by themselves,change the character of the Bay.
• Loss of some of the remaining natural wetlands in San Francisco Bay appears inevitable. Inparticular, large tracts of wetlands in the northern stretches of the Bay will be impossibleto maintain in their present form, and intertidal wetland habitat in the southern stretchesof the Bay may be lost entirely. Options include providing some artificial protection,which converts natural ecosystems into partially managed ecosystems; trying to restorewetlands on adjacent, higher, undeveloped land; or abandoning existing wetlands to tryto adapt through natural processes.

53
• Deterioration of groundwater quality in some basins around the Bay will accelerate as sealevel rises. No way to prevent this deterioration, other than by preventing sea-level rise,was identified.
• We believe it unlikely that sufficient money or political consensus will be available toprotect all resources on the margins of the Bay before damaging storm events occur. Asa result, difficult decisions about what to move or abandon will have to be made, anddamages from flooding will increase.
• Substantial additional -- and unpredictable -- changes in the biological and chemicalnature of the Bay region are likely due to changes in freshwater inflow to the Bay, newdevelopment, changes in water and ecosystem management in the Delta, and other effectsthat cannot now be anticipated. All of these additional effects are beyond the scope of thepresent study.
RECOMMENDATIONS
Future development should be prohibited along the margins of the Bay likely to be subjected tohigher sea level .
The cheapest option to protect against future sea-level rise impacts is to prohibit development inregions that are likely to be subjected to the higher future risk of coastal flooding. Someprogress in this direction has been made by the San Francisco Bay Conservation and DevelopmentCommission, which has recommended that future sea-level be taken into account in futuredevelopment along Bay margins. This study assumed no increase in the rate of sea-level riseabove the current rate of rise. Periodic review of the state of the art estimates on future sea-level rise should be undertaken.
Future development should be prohibited on undeveloped lands immediately upslope ofthreatened areas or adjacent to existing wetlands .
These lands are the only areas to which present wetlands can slowly migrate, and future wetlandsrestoration projects will require this land.
Present activities to maintain or modify existing bulkheads and levees around the Bay shouldassume a future increase in sea level .
The cost of modifying these structures in the design stage is considerably below the cost of laterreconstruction or flood-damage from unanticipated storm surges.
Detailed surveys of the economic value of land and services at risk in specific regions should bedone .
The study here provides initial estimates of the costs of adapting to a one-meter sea-level rise,but not the long-term value of property threatened. Such additional information is required forappropriate public policy decisions to be made.
Natural ecosystems are undervalued or ignored in traditional economic analyses. A method for

54
incorporating them into future studies is needed.
Large tracts of wetlands in the San Francisco Bay area are vulnerable to sea-level rise. Nosatisfactory method for incorporating their environmental values has been developed, and wethus risk ignoring them when we make policy decisions. This would be a serious mistake.
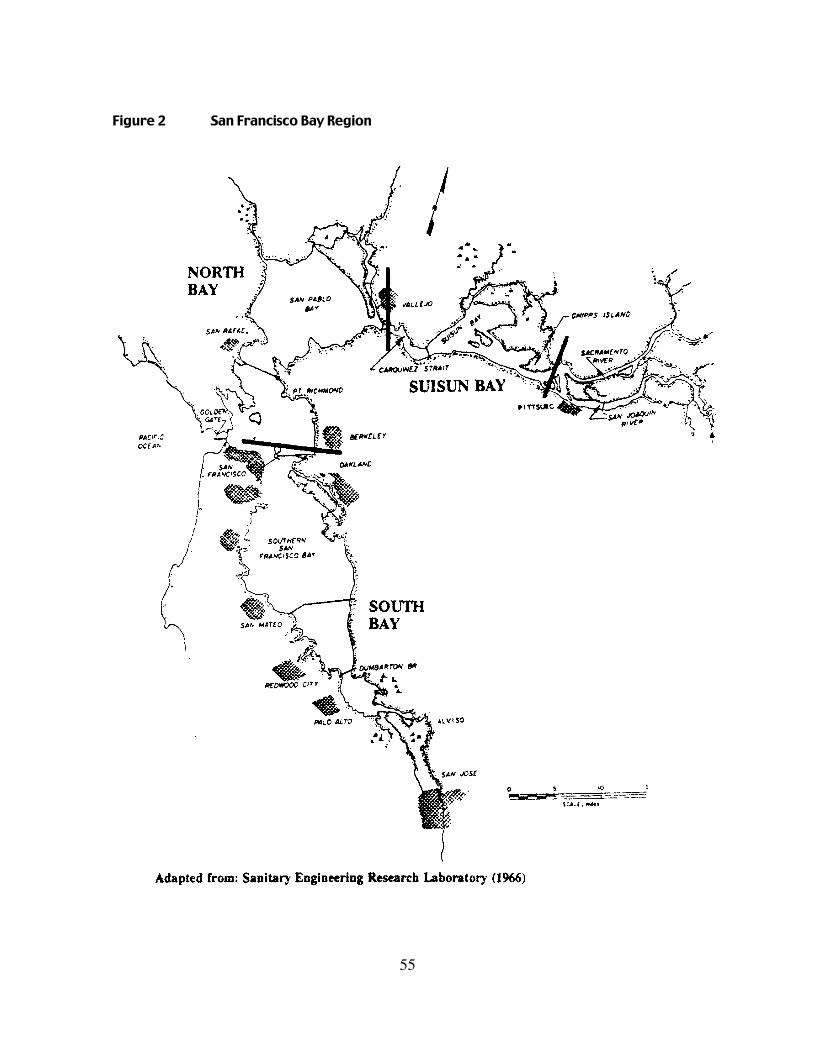
55
Figure 2 San Francisco Bay Region
56
I. INTRODUCTION: THE SAN FRANCISCO BAY REGION
San Francisco Bay is the second largest bay on the Pacific Coast of the United States.
Located in central California, San Francisco Bay is home to over 6 million people, extensive
industry and commercial development, and the richest bay/delta ecosystem remaining on the
west coast. The Bay has a surface area of approximately 450 square miles, 300 miles of shorelines,
and 130 square miles of tidal flats and marshes. The counties of San Mateo, Santa Clara, Alameda,
Napa, Sonoma, San Francisco, Contra Costa, Marin, and Solano border the Bay. Excluded from this
study was the Sacramento-San Joaquin Delta and the coast outside of the Golden Gate.
Freshwater inflow to the Bay comes primarily from the Sacramento and San Joaquin
rivers, which drain the Central Valley and part of the Sierra Nevada. Other highly seasonal inflow
comes from small streams draining the hills around the perimeter of the Bay itself.
Tidal range in the Bay, measured as the height between high and low tide, seldom exceeds
eight feet; the mean range at the entrance of the Bay to the Pacific Ocean (the "Golden Gate") is
four feet. In the southern reaches of the Bay, the mean tidal range is amplified to seven and a half
feet. In the northern reaches the tidal wave is dampened to just over three feet (Figure 3).

57
Diverse natural habitats, flora, and fauna are found in the region. Along the Pacific coast of
the United States, only about 10 percent of the coast is suitable for wetlands and less than 10
percent of the total original wetlands in California remain undeveloped or undestroyed
Table II Area and Types of Remaining Wetlands in San Francisco Bay
AREA (acres) MUDFLAT TIDAL MARSH DIKED WETLAND SALT POND
South Bay below 6,800 3,000 2,400 13,000Dumbarton Bridge
South Bay north 24,500 5,600 6,400 15,000of Dumbarton Bridge
North Bay 27,600 17,000 9,000 9,000
Suisun Bay and 5,000 10,500 45,000 <100Carquinez Straits
TOTAL 63,900 36,100 62,800 37,000
Notes
There are many different categories of wetland habitats. This table breaks down SanFrancisco habitat types into four: Mudflats, Tidal Marshes, Diked Wetlands, and SaltPonds. For a more detailed and accurate breakdown and distribution, see Josselyn etal. in press. All figures in this table are rounded.
Mudflats are unvegetated tidal areas.Tidal Marshes are vegetated tidal areas.Diked Wetlands are non-tidal wetland areas.Salt Ponds are commercially developed non-tidal wetland areas.
(Sources: San Francisco BCDC 1988; Josselyn et al. (in press).

58
(California Coastal Commission 1989, p.36).2 A large fraction of the remaining west coast
wetlands are in the reaches of San Francisco Bay -- the largest estuary on the west coast of the
United States (Josselyn and Callaway 1988). Within San Francisco Bay area only about 20 percent
of the original wetlands remain (U.S. Army Corps of Engineers 1981). Table II lists the
distribution and type of wetlands in San Francisco Bay Estuary. Despite extensive human
modifications, the remaining wetlands of the Bay are vital to migratory birds on the Pacific Flyway
and to commercial and recreational striped bass and salmon fisheries. Large numbers of
endangered and threatened species are found in these natural ecosystems.
����2 Coastal wetlands are defined by the California Coastal Act of 1976 as "lands within the coastal
zone which may be covered periodically or permanently with shallow water and includesaltwater marshes, freshwater marshes, open or closed brackish water marshes, swamps,mudflats, and fens."

59
Figure 3 San Francisco Bay Tidal Ranges

60
Flooding problems already exist in various locations around the Bay, even without the
threat of sea-level rise. Developments around the Napa River are occasionally flooded, portions
of Suisun City are vulnerable, the towns of Corte Madera and Foster City are at risk, and many
commercial and government facilities are in the 100-year event floodplain (see Table III). Suisun
Marsh, in the northern part of the Bay, is of particular concern due to a poor levee system.
Significant improvements in the existing levees, or non-structural alternatives, will be needed to
maintain this valuable marsh system, even under existing flooding conditions.
In the south Bay, ad-hoc protection is provided by a series of levees built and regularly
maintained by the Leslie Salt Company as containment dikes for evaporators. These shoreline
levees are not designed to protect other commercial, residential, or industrial developments,
and there is no guarantee that the levees will be maintained in the future. Even under existing
conditions, these levees are threatened with failure by major storms or extreme high tides.

61
Table III Major Government, Transportation, and Commercial Facilities in San Francisco BayThreatened by Sea-Level Rise
Commercial and Private Airports Oakland International AirportSan Francisco International AirportFremont Sky Sailing FieldPalo Alto AirportSonoma Valley AirportSan Carlos Airport
Freeways Highway 880 in south Oakland; north of Albany; south of Fremont; north of MilpitasHighways 24, 84, and 92, leading to the San Francisco-Oakland bridge,
the Dumbarton Bridge, and the San Mateo BridgeHighway 237 between Alviso and Mountain ViewHighway 101 in Palo Alto; and between San Bruno and Redwood CityHighways 37, 29, and 12 in Solano and Sonoma CountiesHighway 121 in Sonoma CountyInterstate 680 in Solano County
Railroad Facilities Southern Pacific Railroad tracks around Bay perimeterSouthern Pacific staging yards, San Mateo CountyNorthwestern Pacific tracks in Sonoma County
Waste Disposal and Treatment Sites Major landfill sites in every countyMajor sewage treatment and disposal plants in every county
Military and Government Facilities Oakland Army TerminalOakland Naval Supply CenterAlameda Naval Air StationAlameda Naval ReservationAlameda Coast Guard BaseU.S. Coast Guard ReservationCoyote Hills Military ReservationNASA Ames Research CenterMoffett Field Naval Air StationMare Island Naval BaseSkaggs Island Naval InstallationHunters Point Naval YardConcord Naval Weapons Station
Other Facilities Hetch Hetchy AqueductNumerous yacht clubs and harborsMunicipal golf courses in Alameda, Santa Clara, MarinExtensive transmission towers

62
II. FUTURE SEA-LEVEL RISE IN SAN FRANCISCO BAY
For the purpose of this study, an increase in relative sea level of one meter (3.28 feet) was
assumed and the costs of defending against such an increase evaluated. We are not ppredicting that
sea level will rise by this amount at any given time; rather we are evaluating the implications of
protecting against such an increase in sea level. While there is a wide range in estimates of future
sea-level changes because of extensive uncertainties over the physical behavior and dynamics of
the oceans, this paper is not the place to resolve these uncertainties. Table I and Figure 1 show
some of the most recent sea-level rise scenarios. As these data show, a one-meter rise is a
plausible outcome of the greenhouse effect. We also note that the marginal costs of protecting
against a sea-level rise of 0.5 meters are likely to be only slightly less than the costs of defending
against a one-meter rise because of the large capital and labor expenditures associated with
deploying and operating the necessary equipment, and the engineering costs associated with
design.
The discussion of sea-level rise in this section refers to a "relative" rise -- that is the
combined change in absolute sea-level and the change in level of land due to subsidence and
uplift. Williams (1985) notes that "the public's perception of sea level rise will probably only be
formed in the aftermath of infrequent but devastating storm-surges rather than as a result of the
gradual increase in mean sea level." This point is dramatically illustrated in Figure 4, which shows
the increase in frequency of the current 100-year highest estimated tide (HET) elevation with
various increases in sea level.3 For a sea-level rise of only 3.5 centimeters (1.4 inches), the
frequency of the current 100-year highest tide doubles -- i.e. the present 100-year storm will
now occur once in 50 years, on average. By the time sea level rises 15 centimeters (5.9 inches),
����3 Based on the tide and storm-surge data presented in U.S. Army Corps of Engineers (1984b).

63
the once-in-100-year storm will have become a once-in-10-year storm. Major disruptive
storms will thus occur far more frequently long before sea level actually rises one meter.
A one-meter sea-level rise will have several hydrodynamic effects such as those
described in Part 1, Section IV. Estimates of these effects for San Francisco Bay are described
below.
Figure 4 Effect of Sea-Level Rise on the Frequency of the 100-Year Highest EstimatedTide
64
Tidal Ranges
Sea-level rise will affect the tidal range (the range between high and low tides) of San
Francisco Bay differently in different areas. The current tidal range at the Golden Gate, the
entrance to the Bay, is about 1.2 meters (4 feet). It can be expected that the northern portions of
the Bay will experience an increase in tidal range, since the geometry of this portion of the Bay
results in a progressive tide wave. The governing formula to estimate this increase is given
above in Part 1, Section IV.1.
An application of this formula to the northern reaches of San Francisco Bay can be
illustrated using the observed tidal range approximately 2 kilometers (1.25 miles) north of the
Richmond-San Rafael Bridge in San Francisco Bay. The present tidal range is 1.2 meters (4 feet)
and the average hydraulic depth through the area is about 8.5 meters (28 feet). For a one-meter
(3.3 feet) sea-level rise it is estimated that the tidal range will increase by only 4 percent.
Another effect produced by the sea-level rise will tend to cancel this predicted increase. The
deeper water will result in a greater tidal velocity, causing increased energy losses and a
potential decrease in the change. Williams (1988) states that the reaction of the tidal range in the
North Bay depends highly on the assumptions regarding failure of levees in the delta.
The southern portion of San Francisco Bay approaches a length equal to approximately
one-quarter of the natural wavelength for the tidal oscillation, and is closed at one end. This
creates a situation of a resonance-dominated system, described above. An example using this
relationship for the southern San Francisco Bay follows. Appendix 1 shows the detailed
calculation of the ratio of the length of the estuary to the wavelength of the tidal wave for both

65
the present conditions and the conditions with a one-meter sea-level rise. The method used to
calculate this ratio for the South Bay is derived in the report of the Sanitary Engineering Research
Laboratory (1966). This ratio is about 0.23 for the present conditions, and it decreases to 0.20
under conditions of a one-meter sea-level rise, assuming that an increase in width or length of
the Bay did not accompany the increase in depth. This assumption is consistent with assuming
that the shoreline will be protected by some rigid method, e.g. dikes or bulkheads.
The above ratios can be applied to estimate the ratio of the tidal amplitude at the mouth
(the Golden Gate) to amplitude at the closed end (southern end of Bay). For the present condition
the ratio of amplitudes, R, is approximately 1.85. Using the relationship previously described for
tidal range amplitude prediction for a resonance-dominated system with damping, the ratio of
amplitudes reduces to 1.64. This is calculated using the assumptions that the length of the estuary
and the damping coefficient remain constant with a sea-level rise. This would correspond to an
experienced increase in high tide of about 0.88 meter with a rise in sea level of one meter at the
Golden Gate, assuming the tidal range at the Golden Gate does not change. It can be expected,
however, that damping due to bottom friction will decrease with a rise in sea level. As a result,
the decrease in the value of R is likely to be slightly less than predicted above.
Qualitatively, it seems reasonable to expect that a sea-level rise would move the southern
San Francisco Bay to a state less resonant than presently occurs. This will result in less tidal range
amplification from the present ratio at the southern end of the Bay of approximately twice the
range at the Golden Gate.

66
Wind-Generated Waves and Storm-Surge
The impact of a sea-level rise on wind waves in San Francisco Bay cannot be determined
for general use in this study. It is expected that the effects mentioned above for wind waves will
result in increased wave energy along the shore of the Bay. The local conditions will determine
the magnitude of the change in wave height and resulting run-up.
As with wind waves, the impact of a sea-level rise on storm-surge in San Francisco Bay is
not possible to determine in a general manner for the Bay. As pointed out by Williams (1985),
studies have not been carried out on storm surges within the Bay. The possible increase in
storm-surge level due to increased fetch length, and potential decrease due to increased shallow
water area, have a net effect which is impossible to determine.
Elevations Adopted for This Study
For this study, to determine design water elevations with sea-level rise, we have adopted
the approach used by Laroache and Webb (1987), and by Waddell and Blaylock (1987). This
approach adds projected sea-level rise to the present design tide elevation for the region of
interest. The 100-year Highest Estimated Tide (HET) elevations are used for the present design
tide elevations for San Francisco Bay. To these are added the one-meter relative sea-level rise to
obtain the future HET elevations. The final design height for a particular site depends on design
freeboard, local land subsidence, and wave run-up, which depends on factors such as wave
climate, characteristics of the structure, and local bathymetry. For this study, an approximate
design elevation is obtained by designing structures to be three feet higher than HET elevations
to account for these factors. These design heights are consistent with the assumptions used by
the U.S. Army Corps of Engineers (1981) for San Francisco Bay. The future 100-year HET

67
elevations are shown in Figure 5 and these elevations with the design levee heights are listed in
Table IV.

68
Figure 5 New 100-Year Highest Estimated Tides in San Francisco Bay with a One-MeterSea-Level Rise

69
Table IV 100-Year tide and levee design levels for this study
Present Future Design Design 100-Year 100-Year Levee Height
Level Level Elevation UsedLocation ( ft ,NGVD) ( ft,NGVD) (ft) (ft)
Pittsburg 6.5 9.8 12.8 13.0Benecia 6.5 9.8 12.8 13.0Sonoma Creek 6.5 9.8 12.8 13.0Point Orient 6.4 9.7 12.7 13.0Sausalito 6.1 9.4 12.4 13.0Presidio 6.0 9.3 12.3 13.0Alameda 6.7 10.0 13.0 13.0Hunters Point 6.7 10.0 13.0 13.0San Mateo Bridge 7.1 10.4 13.4 15.0Dumbarton Bridge 7.5 10.8 13.8 15.0Alviso Slough 8.2 11.5 14.5 15.0
Notes:
• The 100-Year level is the highest estimated tide level including storm-surgeeffects.
• Still water levels are obtained from U.S. Army Corps of Engineers (1984b).• Relative sea level rise at all locations is assumed to be one meter.• The design levee height is based on the assumption that the new levee is
constructed at the margin of the bay.

70
III. METHODOLOGY FOR ASSESSING THE COSTS OF RESPONDING TO SEA-LEVEL RISE FOR SAN FRANCISCO BAY
This section evaluates the present costs of adapting to a one-meter sea-level rise in San
Francisco Bay. Our goal here is not to estimate the total societal costs in a region at risk from
sea-level rise. Such an estimate would require a determination of the net economic services in
the regions at risk, the gross services and returns, the value of new investment, the value of the
capital stock at the end of the period of analysis, ecosystem values, any human health effects, and
many other unquantified variables. For the San Francisco Bay as a whole -- indeed for any region
of the world -- such data are not available and subject to enormous uncertainties. In addition, we
believe that decisions about the appropriate responses to sea-level rise will depend on details
about particular sites and societal choices about the value of areas at risk.
In the growing debate over the appropriate response to make today to future climatic
changes, the information provided here can help identify some present and future societal costs
of relying solely on the option of trying to adapt to future changes.
This study focuses on providing a methodology for evaluating the cost of implementing a
set of measures to protect against a rising sea. Methods of protection are described in detail and
average costs are presented. Consistent assumptions about how to choose response strategies
were made. These are:
• Do not protect low-lying areas with little development.
• Raise existing structures where the cost of raising them is less than the cost of otherprotection.
• Protect areas with passive structures such as new or improved levees, dikes, seawalls, orbulkheads where appropriate.

71
• No active measures such as pumps, drainage systems, navigation locks, and so on wereassumed. These will raise the overall costs of responding to sea-level rise.
Since the assumed increase in relative sea level is a combination of global change and local
land subsidence or rebound, certain assumptions regarding these processes are also implied. No
particular time projection is assumed for the one-meter relative sea-level rise, not only due to
the uncertainties associated with global rise predictions, but also due to varying land movement
rates within the region of interest. The one-meter rise will be experienced at different locations
around the Bay at different times, depending on the local land movement. For example, given a
one-meter rise in global sea level in 100 years in San Francisco Bay, the experienced rise at
Pittsburg, California would be about 1.27 meters, assuming the current rate of land subsidence of
-0.0027 meters/year for Pittsburg. This would mean that a one-meter relative rise there would
occur in less than 100 years. Most of the shoreline of San Francisco Bay is currently stable or
subsiding, although some uplifting, or rebound, has been observed at Sausalito.
The methodology developed here and applied to the San Francisco Bay can be used to
evaluate costs of protection elsewhere. We recommend that such studies be done for a diversity
of other sites, including regions in less-developed parts of the world, low-lying atolls,
particularly valuable ecosystems, and other important ports and cities.

72
IV. STUDY LIMITATIONS AND UNQUANTIFIED EFFECTS
In analyses such as this one, what has been left out is often as important as what has been
included. We have not calculated the costs of protecting the wetlands in the Bay, any costs of sea-
level rise in the Sacramento/San Joaquin Delta or outside the Golden Gate along the coasts, the
costs of protecting threatened groundwater or freshwater resources, or the costs of "active"
protection such as navigation locks, drainage facilities, or pumps. As mentioned earlier, we also
find no satisfactory method for evaluating the relative values of different ecosystem types. For
example, the 44,000 acres of wetlands of Suisun Bay are presently used for recreational hunting
and fishing. One study valued these uses at over $150 million annually (Meyer 1987) -- excluding
non-market factors such as wildlife habitat, pollutant filtering, heritage values, and so on. No
adequate way was found to incorporate such non-market factors into the present study.
Valuable ecosystems in San Francisco Bay could be lost with accelerating sea-level rise.
Wetlands without protective engineering structures can migrate onto adjacent lowlands only if
land is available. Unfortunately, very few regions have undeveloped adjacent land, and structures
will preclude wetlands migration. In San Francisco Bay, tidal marshes have evolved over time
with a gradual inundation of low-lying areas combined with an inflow and buildup of sediments.
If mean sea level rises at a rate faster than the rate of sedimentation, tidal marshes will be
submerged and converted to deeper water habitats. Because of a reduction in sediment
transport due to upstream dams and diversions, it appears likely that a large portion of the area's
tidal marshes would be submerged by sea-level rise (San Francisco BCDC 1988a). This would
threaten a number of endangered species.
Substantial portions of Bay historic wetlands are presently diked. Over time, these can be

73
restored to tidal action and hence to wetlands, but there is probably a threshold size and depth at
which tidal sedimentation cannot restore former marsh elevations. This will limit the areas that
can ultimately be restored to marsh. Sedimentation rates are highly sensitive to local conditions.
Geologic evidence in San Francisco Bay suggests that wetlands have flourished under low rates
of sea-level rise (≈1-2 mm/year) and were inundated at higher rates (≈10 to 20 mm/year).
In addition to the rate of sediment accretion in wetlands, sedimentation patterns
throughout the Bay will be affected by a sea-level rise. This can be due to an increase in the tidal
prism (the volume of water carried into a bay during a tidal cycle) and changes in currents,
sediment inflow, and areas that are inundated. The complexity of the processes of sedimentation
causes difficulty in predicting their response to a rise in water level. As recommended by the San
Francisco BCDC (1988a), a study of sedimentation in the Bay needs to be conducted, and
alternative management of diked wetlands to allow their adaptation to sea-level rise should be
investigated.
The region of the Sacramento/San Joaquin River Delta ("the Delta") is also not included in
this study. This area is highly susceptible to damages from an increase in mean sea level, and
effects in the Delta will be felt throughout the state of California. The major impact of sea-level
rise on the Delta would be the inundation of many of the "islands" that are currently protected by
levees. According to Williams (1988), the area of the Bay could triple and the volume double if
existing levees are not maintained and improved. Such changes in the Delta would dramatically
alter the circulation of water in both the Bay and Delta, the movement of sediment, and the level of
salinity in the Delta. Since a large portion of California's population receives fresh water from the
Delta, this impact would be widely felt.

74
Water quality in the San Francisco Bay would be affected by the changes in circulation and
mixing patterns caused by sea-level rise, and by the flooding of areas around the margin of the
Bay containing landfills and sources of toxic wastes. Sea-level rise would increase the risk of
these pollutants entering Bay waters. Since the extent of this risk has not been established, no
quantitative assessment of water quality degradation is included here.

75
V. RESULTS FOR SAN FRANCISCO BAY: THE COSTS OF PROTECTION
Options available for protection of coasts, and general ranges of costs have been
described in Part 1, Section IV.3., above. For California and San Francisco Bay, costs have been
compiled by Fulton-Bennett and Griggs (1986), by the San Francisco Bay Conservation and
Development Commission (San Francisco BCDC, 1988b), and by Leatherman (1989) and Weggel, et
al. (1988). The specific unit cost assumptions used for this study are based on those in the above
references and on costs from local authorities and contractors. These are shown in Table V.
Topography around the case study region was analyzed using United States Geological
Survey 7.5 minute series quadrangle maps at 1:24,000 scale. Twenty-four maps cover the region
between the south Bay and the city of Pittsburg in the north Bay. Shoreline lengths were
measured, and present levels and types of shoreline protection were determined by site visits,
map analysis, and existing surveys. It was assumed that existing protection, such as levees and
Table V Unit Costs Used in this Study
Item Unit Cost per Unit
New Levee - 15 feet high linear foot (l.f.) $500New Levee - 13 feet high l.f. $450Raised Levee l.f./ft.of height $25New Seawall - 13 feet high l.f. $1,500Raise Freeway - 1 meter vert. l.f./lane $100Raise Railroad - 1 meter vert. l.f./track $100Raise Structure each $20,000Beach Nourishment l.f. $50Raise Bulkhead - 1 meter vert. l.f. $150
Note:
• The above costs were determined based on cost information pertaining to the SanFrancisco Bay region. Costs for other areas can vary depending on local conditions andavailable materials.

76
bulkheads, could be raised to meet the 100-year high tide under conditions of higher sea level.
In regions with extensive bayside levees, and interior levees protecting developments, all levees
were assumed to be raised. In regions where bayside levees were able to protect interior
developments, only the outer levees were assumed to be raised.
The majority of the Bay shoreline and its tidal sloughs are protected against flooding by
some form of levee. Many of these levees are privately managed and owned, and the flood
protection benefits provided are incidental. For the purposes of this study, all existing levees are
assumed to be structurally sound enough to be raised. In fact, according to the U.S. Army Corps
of Engineers (1988), 33 percent of the levees in the South Bay are in poor condition; only 28
percent are in good condition. Many levees may, therefore, have to be completely rebuilt to
provide adequate protection under future conditions. Such additional costs are not included
here.4 All costs in this study are treated without consideration for whether incurred costs are
public or private.
For each USGS map, the length of levees to be raised is divided into three categories of
existing heights based on percentages of these categories established from detailed maps of
levee elevations in the region. The new heights for the levees are determined from Table IV, and
the total quantities of length of levee, multiplied by height to be raised, are calculated for each
map. Areas not presently protected are given protection determined to be appropriate,
generally new levees, or if the region has little development, no protection is allotted and any
����4 In one study (URS 1988), new levees designed with the capacity to be raised 2.5 feet cost
about 20 percent more than levees without this feature. The costs for later modifyinglevees to accommodate the added height would, however, be substantially greater thanthis.

77
small structures are raised.
Where a bulkhead or seawall presently exists, it is assumed to be raised by one meter.
Any railroads or freeways within the future 100-Year HET elevation contour line are assumed to
be raised by one meter, unless they can be protected by a less-expensive levee system.
Table VI Quantities and Costs for Protection of the Shoreline of San Francisco Bay
South Bay North Bay Suisun BayGolden Gate Golden Gate Vallejo toto Alviso to Vallejo Pittsburg
Item (feet) (feet) (feet)
New Levee - 15 feet high 198,900 0 0New Levee - 13 feet high 65,000 111,700 63,000New Seawall - 13 feet high 23,400 0 0Raise Roadway - 1 meter vert. 107,600 78,200 93,400Raise Railroad - 1 meter vert. 103,500 151,300 174,700Beach Nourishment 10,200 0 0Raise Bulkhead - 1 meter vert. 515,800 311,700 116,800Raise Levee - varying heights 1,586,000 568,700 409,200
Raise Structure (no. of structures) 66 69 179
Notes:
• All units are in linear feet, except raising of structures, which are numbers ofstructures affected. Values are rounded.
• The units presented in this table are not in the form of the unit costs presentedseparately. For example, the linear footage of raised roadway shown above includes 2through 8 lane roads, while the unit cost used varies for each width.
REGION OF BAY TOTAL COST
South Bay - Golden Gate to Alviso $564,400,000North Bay - Golden Gate to Vallejo $219,100,000Suisun Bay - Vallejo to Pittsburg $158,800,000
Total Cost of Protection for San Francisco Bay: $942,300,000

78
Using this approach, we estimate the cost of protecting existing development in San
Francisco Bay from a one-meter sea-level rise to exceed $940 million. The costs for the three
sections of the Bay are listed in Table VI. We also reiterate that these costs do not include any
costs for protecting wetlands, active structures such as navigation locks, pumps, and drainage
systems, or periodic costs of maintaining protective structures.
In order to check our approach, we compared our method of determining costs of
protection with detailed studies of two regions within the Bay -- the towns of Corte Madera and
Foster City. Engineering studies have already been completed for these towns because of their
locations in low-lying, vulnerable Bay lands (URS 1988, Valkenaar, personal communication).
Table VII shows the results of comparing the general method used in the present study with the
more accurate engineering approach required for any particular site. Given the uncertainties and
simplifying assumptions described in Part 1, Section V, these methods give quite similar answers.
Table VII Comparison of Assessment Methods: This Study and Two Detailed Case Studies in SanFrancisco Bay
Site This Study Detailed Engineering Study
Foster City, San Mateo Co. $12,300,000 $12,000,000 - $14,000,000(raise existing levees, (raise levees, or add wallssome new levees) where space is limited)
Corte Madera, Marin Co. $5,800,000 $6,500,000(raise existing levees, (levee improvements, some new levees) navigation lock, offshore
tidal barrier
Note:
• Each study uses different assumptions and approaches. For Corte Madera details,see URS (1988); Foster City details provided by Valkenaar (personal communication).
79
To compare the above costs for improving the existing shore protection with some
measure of the value of property threatened for the San Francisco Bay shoreline, we include
Figure 6. This shows the approximate value of structures within certain elevations around the
south Bay. It can be seen that about $29 billion (1990 dollars) worth of structures lie below the
10-foot N.G.V.D. (National Geodetic Vertical Datum) contour in three counties around the Bay.
The area within this contour represents the approximate area at risk from flooding from the 100-
year high tide with a one-meter sea-level rise. This area is illustrated on Figures 7 and 8. The
data used to derive these values were obtained from file reports of the U.S. Army Corps of
Engineers for the economic inventory of the San Francisco Bay Shoreline Study and brought to
current 1990 values. These figures were then extrapolated using the cost per unit area for
developed portions of the South Bay for which data were available and applying this to developed
areas in the entire Bay within the 10-foot N.G.V.D. contour. We estimate that structures valued at
$48 billion (1990 dollars) are at risk of flooding.

80
It should be noted that these values are total values of threatened structures, not the
actual value of that portion of property that would be damaged by a flood to the shown elevation.
The U.S. Army Corps correlates the amount of damage to a structure with its level of inundation,
which is based on a first-floor elevation of an individual structure, the ground elevation in the
area, the flood elevation, and an estimate of contents. This type of calculation produces an
estimated value of damaged property from a certain flood elevation less than the total value of the
property.
Figure 6 Value of Structures versus Elevation in South San Francisco Bay

81
Despite the difficulty of determining the economic value of ecosystem functions, one
estimate suggests that marshes provide an annual return equivalent to $5500 per acre (1983
dollars) (Thurman 1983). Another estimate is that the cost of "restoring" marsh in San Francisco
Bay on suitable land averages about $15,000 per acre (1984 dollars) (Barth and Titus 1984), but
costs can be as high as $100,000 per acre where extensive work is required (Haltiner, personal
communication). We note that restored wetlands rarely replace all of the natural functions of
natural ecosystems; nevertheless, marsh restoration is increasingly seen as a possible response
to development. A massive effort to protect or restore half of the present amount of wetlands in
the Bay could easily cost one billion dollars, assuming adequate methods and land was available.
Other costs not included above are the costs of maintaining protective measures.
Assuming an average figure of 10 percent per year of the construction costs -- as described in
Part 1 -- could add around $100 million per year to the total costs.

82
Figure 7 Area of San Francisco Bay Threatened by a 1-meter Sea-Level Rise:Southern Portion

83
Figure 8 Area of San Francisco Bay Threatened by a 1-meter Sea-Level Rise:Northern Portion

84
VI. CONCLUSIONS
Coasts have always been threatened by severe storms, which lead to loss of life,
destruction of property, and the construction of expensive coastal protection measures. Many
coastal regions have high economic real estate value, and hence justify expensive engineering
solutions. But now, a new threat to waterfront property is emerging -- global climate change
and sea-level rise. Global climatic changes will increase the risks to society by raising sea level
and changing the frequency and intensity of storms.
Despite scientific and social uncertainties, public agencies responsible for coastal
protection and development must begin now to consider the effects of future sea level in current
planning. Even under a scenario of slow rise in sea level, the damaging effects of storms will
increase rapidly, and one-meter rise could erode coastal shorelines by over 100 meters. In San
Francisco Bay, a sea-level rise of only 15 centimeters (5.9 inches) would change a 1-in-100 year
storm into a 1-in-10 year storm.
A one-meter sea-level rise in San Francisco Bay would threaten a wide area with
commercial, industrial, and residential development, valued at nearly $48 billion for just existing
buildings. The resources at risk include ports and docks, factories, residential sub-divisions,
transportation facilities such as airports, freeways, and railroads, wastewater treatment plants
and waste disposal sites, military facilities, and a wide variety of natural ecosystems. Possible
responses include constructing new levees, bulkheads, or seawalls in unprotected areas, raising
and improving levees and bulkheads where they already exist, raising or moving other
structures, freeways, and railroads where necessary, replenishing beaches with sand, and
protecting or restoring wetlands.

85
For the San Francisco Bay, the costs of protecting just existing developments would
exceed $940 million (1990 dollars), excluding the costs of protecting natural ecosystems, active
structures such as drainage systems and navigation locks, and hard-to-quantify social costs.
Such costs could easily exceed an additional $1 billion. Also not included are any costs of
regularly maintaining protective structures, which could run to $100 million per year. No
attempt was made here to evaluate the costs of protecting the Sacramento/San Joaquin Delta or
the coast outside of the Golden Gate.
Despite the limitations to this type of economic analysis and the many things that are
poorly quantified or unquantifiable, we conclude that sea-level rise will pose great economic and
environmental threats to San Francisco Bay. Taking no actions runs the risk of loss of life,
increased property damage, and wetlands loss due to more frequent, damaging storms.
Selective protection could somewhat reduce, but not eliminate, the greater risks of damage.
Extensive protection would have high immediate costs, but would significantly reduce the long-
term economic risks to developed areas. Complete protection is not possible, particularly for
the valuable remaining natural ecosystems of San Francisco Bay. The magnitude of the problem of
sea-level rise requires that we begin to understand the threats that we face and the responses
available to us.

86
REFERENCES
Armentano, T.V., R.A. Park, and C.L. Cloonan. 1988. "Impacts on Wetlands Throughout the UnitedStates". In J. G. Titus (editor), Impact of Sea Level Rise on Coastal Wetlands in the United States . U.S. Environmental Protection Agency, Washington, D.C. pp. 87-149.
Barnett, T.P. 1983. "Recent Changes in Sea Level and Their Possible Causes". Climatic Change 5 ,pp. 15-38.
Barth, M.C. and J.G. Titus (editors). 1984. Greenhouse Effect and Sea Level Rise . (Van NostrandReinhold Company, Inc.)
Berger, A., S. Schneider, and J.Cl. Duplessy (editors). 1989. Climate and Geo-Sciences: AChallenge for Science and Society in the 21st Century . (Kluwer Academic Publishers, Dordrecht,the Netherlands.)
Bolin, B., B.R. Döös, J. Jäger, and R.A. Warrick (editors). 1986. The Greenhouse Effect, ClimaticChange, and Ecosystems. SCOPE 29. (John Wiley and Sons, Chichester, England.)
Broadus, J.M., J.D. Millman, S.F. Edwards, D.G. Aubrey, and F. Gable. 1986. "Rising Sea Level andDamming of Rivers: Possible Effects in Egypt and Bangladesh." In J.G. Titus (editor), Effects ofChanges in Stratospheric Ozone and Global Climate, Volume 4: Sea Level Rise . U.S. EnvironmentalProtection Agency, Washington, D.C. pp. 165-190.
California Coastal Commission. 1989. Draft Report "Planning for an Accelerated Sea Level Risealong the California Coast". San Francisco, California, USA. 83 p.
Day, J.W., Jr. 1987. "Consequences of Sea Level Rise: Implications from the Mississippi Delta." InH.G. Wind (editor), Impact of Sea Level Rise on Society . (A.A. Balkema, Rotterdam, theNetherlands.) pp. 146-152.
Dean, R.G. 1990. "Equilibrium Beach Profiles: Characteristics and Applications". Coastal andOceanographic Engineering Department, University of Florida, Gainsville, Florida.
Dickinson, R.E. 1989. "Uncertainties of Estimates of Climatic Change: A Review". Climatic Change15 , No. 1/2, pp. 5-13.
Edwards, A.J. 1989. "The Implications of Sea-Level Rise for the Republic of Maldives". Report tothe Commonwealth Expert Group on Climate Change and Sea Level Rise. CommonwealthSecretariat, June.
Etkins, R. and E.S. Epstein. 1982. "The Rise of Global Mean Sea Level as an Indication of ClimateChange. Science 215 , pp. 287-289.
Everts, C.H. 1985. "Sea Level Rise Effects on Shoreline Position". Journal of Waterway, Port,Coastal, and Ocean Engineering 111. pp. 985-999.
Fulton-Bennett, K. and G.B. Griggs. 1986. Coastal Protection Structures and Their Effectiveness .

87
Marine Sciences Institute, University of California at Santa Cruz, and State of California,Department of Boating and Waterways, Sacramento, California. 48 pp.
Gibbs, M.J. 1984. "Economic Analysis of Sea Level Rise: Methods and Results". In M.C. Barth andJ.G. Titus (editors), Greenhouse Effect and Sea Level Rise . (Van Nostrand Reinhold Company, Inc.) pp. 215-252.
Gibbs, M.J. 1986. "Planning for Sea-Level Rise under Uncertainty: A Case Study of Charleston,South Carolina." In J.G. Titus (editor), Effects of Changes in Stratospheric Ozone and GlobalClimate, Volume 4: Sea Level Rise . U.S. Environmental Protection Agency, Washington, D.C. pp.57-72.
Goemans, T. 1986. "The Sea Also Rises: The Ongoing Dialogue of the Dutch with the Sea". In J.G.Titus (editor), Effects of Changes in Stratospheric Ozone and Global Climate, Volume 4: Sea LevelRise . U.S. Environmental Protection Agency, Washington, D.C. pp. 47-56.
Goemans, T. 1987. "Some Policy-Oriented Observations Concerning Sea Level Rise". In H.G. Wind(editor), Impact of Sea Level Rise on Society . (A.A. Balkema, Rotterdam, the Netherlands.) pp.156-158.
Gornitz, V., L. Lebedeff, and J. Hansen. 1982. "Global Sea-level Trend in the Past Century". Science 215 , pp. 1611-1614.
Gornitz, V., and L. Lebedeff. 1987. "Global Sea-Level Changes during the Past Century". in D.Nummedal, O.H. Pilkey, and J.D. Howard (editors), Sea-Level Change and Coastal Evolution . SEPMPubl. No. 41, p. 3-16.
Haltiner, J. 1990. Personal communication. Philip Williams and Associates, San Francisco,California.
Hekstra, G.P. 1988. "Prospects of Sea Level Rise and its Policy Consequences." Discussion paperfor Controlling and Adapting to Greenhouse Warming -- A Workshop to Explore AlternativeStrategies with Special Emphasis on Renewable Resources. Resources for the Future. June 1988,Washington, D.C.
Ippen, A.T. 1966. Estuary and Coastline Hydrodynamics . McGraw-Hill, New York. pp. 493-521.
Josselyn, M. and J. Callaway. 1988. "Ecological Effects of Global Climate Change: WetlandResources of San Francisco Bay". U.S. Environmental Protection Agency, Corvallis, Oregon, 39pp.
Josselyn, M., L. Handley, M. Quammen, and D. Peters. "The Distribution of Wetland Habitats in theSan Francisco Bay Region." United States Fish and Wildlife Service, Washington, D.C. (in press).
Kyper T.N. and R.M. Sorensen. 1985. "The Impacts of Selected Sea Level Rise Scenarios on theBeach and Coastal Structures at Sea Bright, N.J." Coastal Zone '85 . pp. 2645-2661.
Laroache, T.B. and M.K. Webb. 1987. "Impact of Sea Level Rise on Stormwater Drainage Systemsin the Charleston, South Carolina Area". Report for the Office of Policy Analysis, Environmental

88
Protection Agency, Washington, D.C.
Leatherman, S.P. 1988. "National Assessment of Beach Nourishment Requirements Associatedwith Accelerated Sea Level Rise." U.S. Environmental Protection Agency. Washington, D.C. 30 pp.
Lowenstein, F. 1985. "Beaches or Bedrooms - The Choice as Sea Level Rises". Oceanus 28: pp. 20-29.
Mahtab, F.U. 1989. "Effect of Climate Change and Sea-Level Rise on Bangladesh". Report to theCommonwealth Expert Group on Climate Change and Sea Level Rise, Commonwealth Secretariat,July.
Martindale, M. 1987. " Salicornia Europea L. and Salicornia virginica L. on a San Francisco Bay SaltMarsh: A Study of Factors Contributing to their Zonation Pattern". M.A. Thesis, San FranciscoState University, San Francisco, California, 52 pp.
Meier, M.F. 1984. "The Contribution of Small Glaciers to Global Sea Level. Science 226 , pp. 1418-1421.
Meyer, P.A. 1987. "The Value of Wildlife in San Francisco Bay". State Water Resources ControlBoard 1987 Water Quality/Water Rights Proceedings on the San Francisco Bay/Sacramento SanJoaquin Delta. Exhibit 38. Bay Institute of San Francisco, Sausalito, California. 22 pp.
National Research Council. 1987. Responding to Changes in Sea Level - Engineering Implications .National Academy Press, Washington, D.C. 148 pp.
National Research Council. 1989. Managing Coastal Erosion through the National Flood InsuranceProgram. National Academy Press, Washington, D.C. (in press.)
Nolan, K.M. and C.C. Fuller. 1986. "Sediment Accumulation in San Leandro Bay, Alameda Country,California, During the 20th Century". U.S. Geological Survey Water Resources InvestigationsReport 86-4057. U.S. Geological Survey, Sacramento, California, 25 pp.
Park, R.A., T.V. Armentano, and C.L. Cloonan. 1986. "Predicting the Effects of Sea Level Rise onCoastal Wetlands". In J.G. Titus (editor), Effects of Changes in Stratospheric Ozone and GlobalClimate, Volume 4: Sea Level Rise . U.S. Environmental Protection Agency, Washington, D.C. pp.129-152.
Pirazolli, P.A. 1986. "Secular Trends of Relative Sea-level (RSL) Changes Indicated by Tidal-gaugeRecords". Journal of Coastal Research 1 , pp. 1-26.
San Francisco Bay Conservation and Development Commission (BCDC). 1988a. Sea Level Rise:Predictions and Implications for San Francisco Bay. San Francisco, California, USA. 100 pp.
San Francisco Bay Conservation and Development Commission (BCDC). 1988b. ProtectingShoreline from Tidal Erosion , San Francisco, California, USA. 86 pp.
Sanitary Engineering Research Laboratory. 1966. A Comprehensive Study of San Francisco Bay -

89
Volume IV . College of Engineering and School of Public Health, University of California atBerkeley, California, USA. pp. 1-36.
Tait, J.F. and G.B. Griggs. 1990. "Beach Response to the Presence of a Seawall: A Comparison ofField Observations". Shore and Beach April 1990.
Thomas, R. 1986. "Future Sea Level Rise and its Early Detection by Satellite Remote Sensing". InJ.G. Titus (editor), Effects of Changes in Stratospheric Ozone and Global Climate, Volume 4: SeaLevel Rise . U.S. Environmental Protection Agency, Washington, D.C. pp. 19-36.
Thurman, H.V. 1983. Essentials of Oceanography . Columbus Ohio, Charles E. Merrill Publ.)
Titus, J.G. 1985. "Rising Sea Level, Storms, and Coastal Erosion at Ocean City, Maryland". CoastalZone '85 . pp. 2538-2557.
Titus, J.G. (editor). 1986. Effects of Changes in Stratospheric Ozone and Global Climate, Volume 4:Sea Level Rise , U.S. Environmental Protection Agency, Washington, D.C. 193 p.
Titus, J.G., C.Y. Kuo, J.J. Gibbs, T.B. LaRoche, M.K. Webb, and J.O. Waddell. 1987. "GreenhouseEffect, Sea Level Rise, and Coastal Drainage Systems". Journal of Water Resources Planning andManagement 113 , pp. 216-227.
URS. 1988. Corte Madera Tidal Protection Study , URS Corporation, San Francisco, California,(June). 139 pp.
U.S. Army Corps of Engineers. 1981. File Data. Draft Report: San Francisco Bay ShorelineReconnaissance Report, Stage 1 . San Francisco, California.
U.S. Army Corps of Engineers. 1984a. Shore Protection Manual, Volumes 1 & 2 , WaterwaysExperiment Station, Coastal Engineering Research Center, Vicksburg, Mississippi.
U.S. Army Corps of Engineers. 1984b. San Francisco Bay Tidal Stage vs. Frequency Study . SanFrancisco District, California.
U.S. Army Corps of Engineers. 1988. File Data, Assessment of Levees in the South Bay,September. San Francisco, California.
U.S. Department of Energy. 1988. Workshop on Sea Level Rise and Coastal Processes . Mehta, A.J.and R.M. Cushman, editors. Palm Coast Florida, March 1988. 289 pp.
U.S. Environmental Protection Agency (U.S. EPA). 1983. Projecting Future Sea Level Rise: Methodology, Estimates to the Year 2100, and Research Needs . EPA 230-09-007. Washington,D.C. 121 pp.
U.S. Environmental Protection Agency (U.S. EPA). 1989a. The Potential Effects of Global ClimateChange on the United States . EPA-230-05-89-050. Office of Policy, Planning, and Evaluation.Washington, D.C.

90
U.S. Environmental Protection Agency (U.S. EPA). 1989b. Policy Options for Stabilizing GlobalClimate . Draft Report to Congress, Office of Policy, Planning, and Evaluation. Washington, D.C.
Valkenaar, D. 1990. Personal communication. City Engineer, Foster City.
Vellinga, P. and S.P. Leatherman. 1989. "Sea Level Rise, Consequences and Policies". ClimaticChange 15 , No. 1/2, pp. 175-190.
Waddell, J.O. and R.A. Blaylock. 1987. "Impact of Sea Level Rise on Gap Creek Watershed in theFort Walton Beach, Florida Area". Report for the Office of Policy Analysis, EnvironmentalProtection Agency, Washington, D.C.
Weggel, J.R. 1986. "Economics of Beach Nourishment under Scenario of Rising Sea Level".Journal of Waterway, Port, Coastal, and Ocean Engineering 112 , pp. 418-426.
Weggel, J.R., S. Brown, J.C. Escajadillo, P. Breen, and E.L. Doheny. 1988. "The Cost of DefendingDeveloped Shorelines Along Sheltered Waters of the United States from a Two-Meter Rise inMean Sea Level". U.S. Environmental Protection Agency, Washington, D.C. 90 pp.
Williams, P.B. 1985. "An Overview of the Impact of Accelerated Sea Level Rise on San FranciscoBay," Philip B. Williams & Associates, San Francisco, California, USA. 19 pp.
Williams, P.B. 1988. "The Impacts of Climate Change on Salinity of San Francisco Bay," Philip B.Williams & Associates, San Francisco, California, USA. 29 pp.
Wind, H.G. 1987. Impact of Sea Level Rise on Society , (A.A. Balkema, Rotterdam, the Netherlands),191 p.
Woodworth, P.L. 1987. "The Data Acquisition of and Trends Observed in Global Mean Sea Level". In H.G. Wind (editor), Impact of Sea Level Rise on Society . (A.A. Balkema, Rotterdam, theNetherlands.) pp. 131-140.
Yohe, G.W. 1988. "The Cost of Not Holding Back the Sea - Phase 1: Economic Vulnerability." U.S.Environmental Protection Agency, Washington, D.C. 22 pp.

91
APPENDIX 1
CALCULATION OF SOUTH BAY RESONANCE
The following calculations are based on the assumptions described in SanitaryEngineering Research Laboratory (1966) used in developing the relationships. The theoreticalpropogation of a frictionless long-wave in a channel of constant cross section is equal to (gD)1/2,where g is gravitational acceleration, and D is water depth. The length of the tidal wave is thenT(gD)1/2, where T is the wave period.
The time that it takes for the wave to travel the length of the reach (i.e. the distance fromthe Golden Gate to the south end of the Bay at Alviso) is L*/(gD)1/2, where L* is the length of thereach. The ratio of the length of the reach to the wave length is then:
L*/L = t*/T = L*/T(gD)1/2
The time of travel of the frictionless tidal wave through each of the sections shown in thefollowing calculations is then:
t* ≈ _ _xi/(gDi)1/2
where _xi is the incremental length of the section, Di is the average hydraulic depth of thesection, and the sum is taken over all sections in the reach.
The calculations for the present and for the scenario of a one-meter water level rise areshown on the attached spreadsheet. The attached figures show the locations of the stations andsections.

92
Figure 9 South Bay Tidal Resonance Calculations

93
Figure 10 San Francisco Bay Sections: Above San Mateo Bridge

94
Figure 11 San Francisco Bay Sections: Below San Mateo Bridge