A Case Study of Nitrogen Loading - WordPress.com · A Case Study of Nitrogen Loading Background...
6
Name: _______________________ February 21, 2011 A Case Study of Nitrogen Loading Background Information British Columbia's Lower Fraser Valley is an important agricultural region that produces meat, dairy products, berries, vegetables, fruit, and mushrooms. The area is unique because it has a high rate of agricultural production even though its farms are about 10 percent the size of typical farms in the province. However, run-off from agriculture and lawn fertilizers and leaching from septic systems are placing excess nitrogen into the environment. This is referred to as nitrogen loading. In this activity, you will investigate the sources of nitrogen and the trends in nitrogen loading in a Fraser Valley study area. You will then make recommendations to reduce nitrogen loading in this area. Question How can the excess levels of nitrogen be reduced in the Fraser Valley? Procedure 1. Table A shows the number of kilograms of nutrients required by corn and grass crops for each hectare planted each year: Table A: Nutrients Required for Corn and Grass Crops Crop Amounts of Nutrients Required per Hectare Nitrogen (kg) Phosphorus (kg) Potassium (kg) Corn 140 40 79 Grass 230 22 50 Table B shows the number of kilograms of nutrients from manure and chemical fertilizer applied to each hectare of these crops every year: Table B: Nutrients Applied to Corn and Grass Crops Application Method Amounts of Nutrients Applied per Hectare Nitrogen (kg) Phosphorus (kg) Potassium (kg) Fertilizer 68 17 34 Manure 205 67 131 Total 273 84 165 Study these tables, and then answer the following questions:
Transcript of A Case Study of Nitrogen Loading - WordPress.com · A Case Study of Nitrogen Loading Background...

Name: _______________________February 21, 2011
A Case Study of Nitrogen Loading
Background Information
British Columbia's Lower Fraser Valley is an important agricultural region that produces meat, dairy products, berries, vegetables, fruit, and mushrooms. The area is unique because it has a high rate of agricultural production even though its farms are about 10 percent the size of typical farms in the province. However, run-off from agriculture and lawn fertilizers and leaching from septic systems are placing excess nitrogen into the environment. This is referred to as nitrogen loading.
In this activity, you will investigate the sources of nitrogen and the trends in nitrogen loading in a Fraser Valley study area. You will then make recommendations to reduce nitrogen loading in this area.
Question
How can the excess levels of nitrogen be reduced in the Fraser Valley?
Procedure
1. Table A shows the number of kilograms of nutrients required by corn and grass crops for each hectare planted each year:
Table A: Nutrients Required for Corn and Grass Crops
Crop Amounts of Nutrients Required per Hectare
Nitrogen (kg) Phosphorus (kg) Potassium (kg)
Corn 140 40 79
Grass 230 22 50
Table B shows the number of kilograms of nutrients from manure and chemical fertilizer applied to each hectare of these crops every year:
Table B: Nutrients Applied to Corn and Grass Crops
Application Method
Amounts of Nutrients Applied per Hectare
Nitrogen (kg) Phosphorus (kg) Potassium (kg)
Fertilizer 68 17 34
Manure 205 67 131
Total 273 84 165
Study these tables, and then answer the following questions:
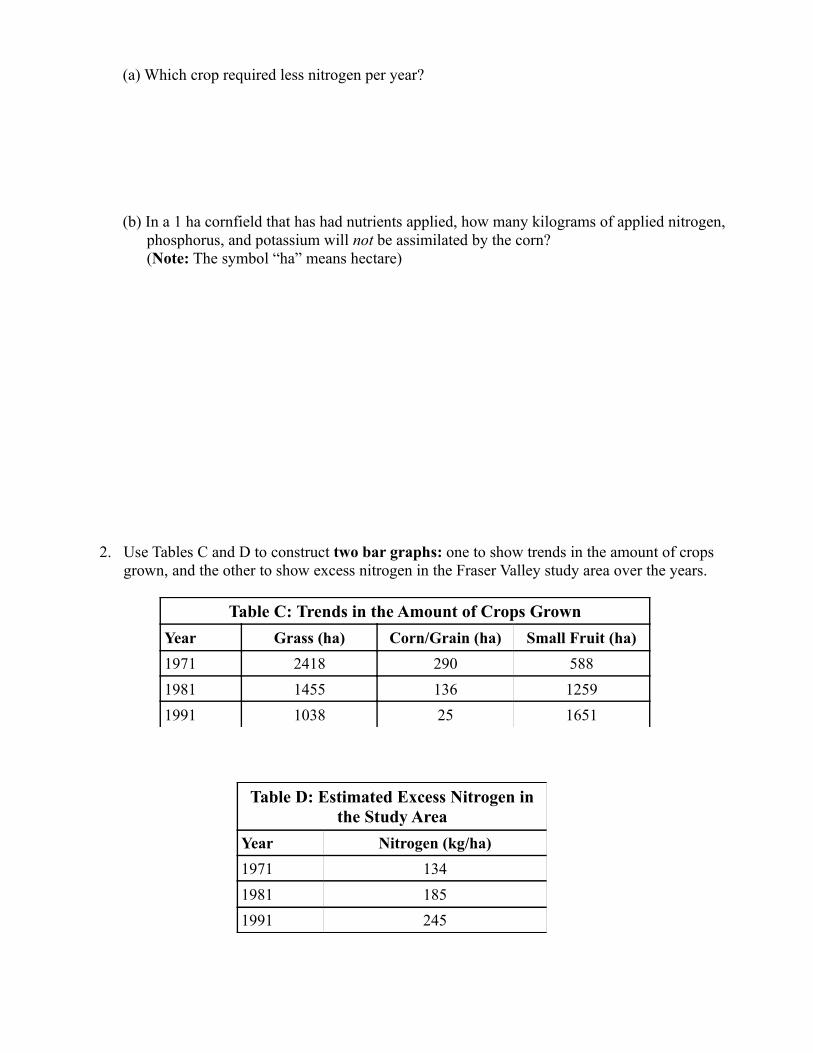
(a) Which crop required less nitrogen per year?
(b) In a 1 ha cornfield that has had nutrients applied, how many kilograms of applied nitrogen, phosphorus, and potassium will not be assimilated by the corn? (Note: The symbol “ha” means hectare)
2. Use Tables C and D to construct two bar graphs: one to show trends in the amount of crops grown, and the other to show excess nitrogen in the Fraser Valley study area over the years.
Table C: Trends in the Amount of Crops Grown
Year Grass (ha) Corn/Grain (ha) Small Fruit (ha)
1971 2418 290 588
1981 1455 136 1259
1991 1038 25 1651
Table D: Estimated Excess Nitrogen in the Study Area
Year Nitrogen (kg/ha)
1971 134
1981 185
1991 245

Title: ______________________________________________________________________________
Title: ______________________________________________________________________________
0
500
1000
1500
2000
2500
3000
Year
Are
a of
Cro
ps (
ha)
0
50
100
150
200
250
300
Year
Exc
ess
Nitr
ogen
per
Cro
p A
rea
(kg/
ha)

3. Looking at your bar graphs, what relationships do you see between the crops grown and excess nitrogen in the study area? Which crop appears to need less nitrogen?
4. Analyze Table E, and then answer the questions below.
Table E: Trends in the Number of Livestock Raised
Year Pigs Dairy/Beef Cattle Chickens
1971 444 5049 212 200
1981 9508 4276 Not available
1991 6015 2199 1 346 600
(a) What changes have occurred from 1971 to 1991 in the numbers of livestock raised?
(b) How might these changes affect the level of excess nitrogen? (Look at your nitrogen cycle chart to see the role of animals in the cycle.)

(c) Concentrated animal protein (which contains nitrogen) is used to feed chickens on poultry farms to make them grow quickly. How might this type of food add to excess nitrogen?
(d) The human population in the area is also growing rapidly. How could rapid population growth lead to excess nitrogen?
Analyze
1. On the copy of the nitrogen cycle below, indicate how human activity in the Fraser Valley has affected the nitrogen cycle.

Conclude and Apply
1. Is it possible for humans to avoid disrupting nutrient cycles? Explain.