A Case Study of a Worksite Wellness Program that ...
173
University of St. omas, Minnesota UST Research Online Education Doctoral Dissertations in Organization Development School of Education Spring 5-20-2019 A Case Study of a Worksite Wellness Program that Incorporates Physical Activity Rebecca Leigh Wilson University of St. omas, [email protected] Follow this and additional works at: hps://ir.shomas.edu/caps_ed_orgdev_docdiss Part of the Education Commons , and the Organization Development Commons is Dissertation is brought to you for free and open access by the School of Education at UST Research Online. It has been accepted for inclusion in Education Doctoral Dissertations in Organization Development by an authorized administrator of UST Research Online. For more information, please contact [email protected]. Recommended Citation Wilson, Rebecca Leigh, "A Case Study of a Worksite Wellness Program that Incorporates Physical Activity" (2019). Education Doctoral Dissertations in Organization Development. 68. hps://ir.shomas.edu/caps_ed_orgdev_docdiss/68
Transcript of A Case Study of a Worksite Wellness Program that ...
University of St. Thomas, MinnesotaUST Research OnlineEducation Doctoral Dissertations in OrganizationDevelopment School of Education
Spring 5-20-2019
A Case Study of a Worksite Wellness Program thatIncorporates Physical ActivityRebecca Leigh WilsonUniversity of St. Thomas, [email protected]
Follow this and additional works at: https://ir.stthomas.edu/caps_ed_orgdev_docdiss
Part of the Education Commons, and the Organization Development Commons
This Dissertation is brought to you for free and open access by the School of Education at UST Research Online. It has been accepted for inclusion inEducation Doctoral Dissertations in Organization Development by an authorized administrator of UST Research Online. For more information, pleasecontact [email protected].
Recommended CitationWilson, Rebecca Leigh, "A Case Study of a Worksite Wellness Program that Incorporates Physical Activity" (2019). Education DoctoralDissertations in Organization Development. 68.https://ir.stthomas.edu/caps_ed_orgdev_docdiss/68

A Case Study of a Worksite Wellness Program that Incorporates Physical Activity
A DISSERTATION
SUBMITTED TO THE FACULTY OF THE OPUS COLLEGE OF BUSINESS,
ORGANIZATION DEVELOPMENT AND CHANGE, UNIVERSITY OF ST. THOMAS
By Rebecca Wilson
IN PARTIAL FULFILLMENT OF THE REQUIREMENTS
FOR THE DEGREE OF
DOCTOR OF EDUCATION
April 2019


i
ACKNOWLEDGEMENTS
My sincere gratitude goes out to everyone who has supported me throughout my doctoral
coursework, the obstacles and disappointments I experienced securing a site location for this
study, and the writing of my dissertation. I encountered many personal challenges as I managed
my education requirements along with dual careers, as a Soldier in the Army National Guard and
as a Human Resources Specialist in the public sector. These hardships also placed a significant
burden on my family and others. I am overwhelmingly thankful to be surrounded by an
understanding and supportive community.
I am most grateful to my parents and daughter Madeline, who endured and sacrificed the
most when my time and energy went towards coursework and other obligations. Supporting my
goals included recognizing and understanding when my stress level was high, then providing
encouragement and emotional support when I needed it the most.
I would also like to thank my Minnesota Army National Guard family for their support as
I strived to manage the demands of my studies and continue to meet mission requirements. A
special thank you to Master Sergeant Amy Hansen for her support, mentoring, understanding and
most of all, friendship.
Thank you to my dissertation chair and advisor, Dr. David Jamieson for his dedication,
motivation and guidance. Dr. Jamieson’s confidence in my work gave me perseverance to keep
going after each setback I encountered. To my other committee members, Dr. Jean Davidson and
Dr. Deborah Lindh, thank you so much for your time, encouragement and feedback. Your
enthusiasm for my dissertation topic has inspired me to continue my research in this area and
implement the program in a larger organization.

ii
This research would not have been possible without the support of Big Brothers Big
Sisters of the Greater Twin Cities and their willingness to allow me into their organization and
access to all employees to conduct this research. A special thanks to Sunita Evenson, who had
faith in my research design and me. This dissertation would not have been possible without her
initiative and continual support from the start to the finish. Finally, to all those who participated,
thank you for your enthusiasm and commitment. I wish you all well as you continue your health
and fitness journey.

iii
ABSTRACT
The purpose of this study was to expand the body of knowledge of organizational
wellness programs through the exploration of improving the rate of physical activity by
providing the incentives of time and choice. The results of this study may help broaden how
organizations view wellness and inspire greater creativity in developing a program that is
effective and economical. This study explored the impacts of time and choice on participation in
physical activity and the effects of engaging in regular physical activity on presenteeism.
Participants engaged in physical activity as part of their regular work schedule for a four-
month period. Data were collected through interviews and survey instruments. Results indicate
that providing time may influence participation in physical activity and contribute towards
maintaining or improving the health of employees. Results also support studies in behavior
change, which suggest that the success of an organization’s wellness program may be
strengthened with strong leadership involvement and support.
The outcome of this study warrants application to a larger population and for a longer
duration to validate results and possibly strengthen the outcome in other areas of behavior
change and presenteeism.

iv
TABLE OF CONTENTS
Acknowledgments……………………………………………………………………………………………….. i Abstract……………………………………………………………………………………………………………..... iii Table of Contents……………………………………………………………………………………………….... iv List of Tables……………………………………………………………………………………………………….. vi Chapter 1: Introduction to the Research……………………………………………………………….. 1
Physical Activity……………………………………………………………………………………….. 1 Worksite Wellness…………………………………………………………………………………….. 2
Wellness through Health Insurance………………………………………………… 3 Internal Initiatives………………………………………………………………………….. 4
Organization Development (OD) Intervention……………………………………………. 4 Problem Statement…………………………………………………………………………………… 5 Purpose of the Research……………………………………………………………………………. 8
Research Questions………………………………………………………………………… 8 Significance of the Study……………………………………………………………………………. 8 Dissertation Layout…………………………………………………………………………………... 10 Definition of Terms…………………………………………………………………………………… 11 Limitations of the Study…………………………………………………………………………….. 15 Researcher Bias………………………………………………………………………………………… 15
Chapter 2: Literature Review……………………………………………………………………………….. 17 Introduction……………………………………………………………………………………………… 17 Financial Strain…………………………………………………………………………………………. 19
Historical Perspective…………………………………………………………………….. 19 Direct Costs……………………………………………………………………………………. 20 Economic Impact……………………………………………………………………………. 23 Cost of Healthcare…………………………………………………………………………... 23 Cost of an Unhealthy Workforce……………………………………………………… 25
Absenteeism and Presenteeism…………………………………………………………………. 28 Costs Associated with Presenteeism………………………………………………... 29
Sedentary Behavior…………………………………………………………………………………… 31 Costs Associated with Sedentary Behavior………………………………………. 31
System Approach………………………………………………………………………………………. 32 Return on Investment…………………………………………………………………….. 34 Wellness Program for Physical Activity…………………………………………… 36 Workplace Opportunities in OD………………………………………………………. 38
Summary………………………………………………………………………………………………….. 40 Chapter 3: Research Methodology………………………………………………………………………… 42
Intervention Overview………………………………………………………………………………. 42 Research Design………………………………………………………………………………………... 42
Privacy and Confidentiality……………………………………………………………... 43 Participant Selection…………………………………………………………………………………. 44
Organization…………………………………………………………………………………... 44 Organization’s Health and Wellness Program…………………………………... 45 Participant Eligibility……………………………………………………………………… 45

v
Participant Selection………………………………………………………………………. 45 Participant Requirements……………………………………………………………….. 46
Data Collection………………………………………………………………………………………….. 47 Questionnaire………………………………………………………………………………… 47 Survey……………………………………………………………………………………………. 48 Interview……………………………………………………………………………………….. 51 Activity Report……………………………………………………………………………….. 52 Sampling………………………………………………………………………………………... 52
Data Analysis and Reporting……………………………………………………………………… 52 Researcher Bias………………………………………………………………………………………… 53 Ethical Considerations………………………………………………………………………………. 53
Chapter 4: Data Analysis and Results……………………………………………………………………. 54 Introduction……………………………………………………………………………………………… 54 Participants………………………………………………………………………………………………. 54 Activity Plan……………………………………………………………………………………………… 56 Physical Activity Readiness Questionnaire (PAR-Q)……………………………………. 56 Barriers to Being Active…………………………………………………………………………….. 56 Survey Results…………………………………………………………………………………………... 57
Overall Health………………………………………………………………………………… 58 Presenteeism…………………………………………………………………………………. 58 Productivity and Presenteeism……………………………………………………….. 60 Physical Activity……………………………………………………………………………... 64 Changes from Pre and Post Survey………………………………………………….. 66 Interview Data……………………………………………………………………………….. 68 Summary……………………………………………………………………………………….. 70
Chapter 5: Discussion and Conclusion…………………………………………………………………... 72 Introduction……………………………………………………………………………………………… 72
Chapter Format……………………………………………………………………………… 72 Summary of the Study…………………………………………………………………….. 73
Discussion………………………………………………………………………………………………… 73 Recommendation for Further Research……………………………………………………… 76
Leadership Support………………………………………………………………………... 77 Group Events…………………………………………………………………………………. 78
Concluding Statement……………………………………………………………………………….. 79 References…………………………………………………………………………………………………………... 80 Appendix A: Participant Consent………………………………………………………………………….. 95 Appendix B: Physical Activity Readiness Questionnaire (PAR-Q)…………………………… 100 Appendix C: Physical Activity Plan………………………………………………………………………... 103 Appendix D: Pre-Study Survey……………………………………………………………………………… 105 Appendix E: Physical Activity Barriers Questionnaire……………………………………………. 118 Appendix F: Weekly Activity Report……………………………………………………………………... 124 Appendix G: Post Study Survey…………………………………………………………………………….. 126 Appendix H: CDC Barriers to Being Active…………………………………………………………….. 142 Appendix I: Summary of Survey Instruments………………………………………………………... 145 Appendix J: SF 36………………………………………………………………………………………………… 147 Appendix K: HPQ…………………………………………………………………………………………………. 149

vi
TABLES
Table 1: Demographics
Table 2: Pre-study – general\physical emotional health as determined by participant
Table 3: Productivity at work over the past thirty-days as determined by participant
Table 4: Assessment of difficulty at work with focus on the past thirty-days
Table 5: Problems with work or regular activities as a result of health in past thirty-days
Table 6: Experience of any work success/achievement or failure/mistake in past thirty-days
Table 7: Participant perception of self, supervisor and co-workers of their efficiency at
work, and amount of work in the past week
Table 8: Perception of current exercise
Table 9: Exercise sessions in the past month and average week
Table 10: Most frequent physical activities
Table 11: Energy and emotions
Table 12: Presenteeism
Table 13: Presenteeism factors of efficiency, quality and volume

1
Chapter 1: Introduction to the Research
Poor health and associated healthcare costs are increasing at an alarming rate. Ill health
and unhealthy behaviors can no longer be perceived as simply an individual problem nor can it
be isolated to a public health concern for the government to resolve. Past initiatives have
typically been implemented from the individual and/or public health perspectives, which have
had at best, minimal success with no long-term or significant impact. Poor health is a social
problem, impacting everyone, all ages, all ethnicities, and every economic status. No matter what
personal state of health a person is in, he or she may be affected by unhealthy behaviors and the
declining health in the United States.
As a social problem, organizations have a vested interest and stake in the health status of
the community and as such, a corporate responsibility to act. Not only is it a responsibility, it
also makes good business sense (Goetzel et al., 2004; Lee, Blake, & Lloyd, 2010; Scherrer,
Sheridan, Sibson, Ryan, & Henley, 2010). The literature in Chapter 2 shows that organizations
are facing economic challenges related to healthcare. These financial burdens of direct and
indirect costs are both on the rise (Patel, 2011; Sari, 2009).
Physical Activity
Being obese or overweight has significant adverse health effects that are well
documented, and the rate of these conditions is on the rise to the point of being considered an
epidemic. When looking at the combined conditions of individuals being overweight and obese,
those having a Body Mass Index of 25 or greater, 70.8% of men and 61.8% of women are
impacted with adverse health worldwide (Wilmore, 2007). In 2017, the Centers for Disease
Control (CDC) confirmed the rate of these conditions was not decreasing despite greater efforts
on awareness and education (Ogden, Carroll, Fryar, & Flegal, 2015).
2
A significant contributor to being overweight or obese is not being physically active. The
effects of inactivity, however, extend beyond weight management with the risk factors being
similar to the impacts of smoking and alcohol use, increasing the risk of many chronic conditions
(Scherrer et al., 2010). Those who are physically active on a regular basis have better physical
health as well as improved cognitive function and emotional wellbeing, which also contributes to
greater effectiveness in the work environment (Heath & Brown, 2009; Kenworthy & Hrivnak,
2012). That being said, the health benefits of being physically active have a positive impact even
when body weight is above the normal range.
Worksite Wellness
Organizations have been facing challenges with the rising costs of healthcare, which have
been increasing at twice the rate of inflation, becoming the single most expensive benefit. This
can have a significant impact to the bottom line. Instead of increasing benefits to improve the
health of the employees, some employers have reduced benefits, increased the amount
employees contribute, or both (Baicker, Cutler, & Song, 2010; Chiappetta, 2005; Emanuel &
Wyden, 2008; Kumar, McCalla, & Lybeck, 2009; Reddick, 2009). The rising rates for
organizations and employees are attributed to multiple factors, such as, technology, the growing
population, longer life expectancy, cost of goods and services, etc. However, costs can be
mitigated by improving overall health of the individual. The cost of services will continue to
increase, but the impact to organizations can be minimized with improved health that can reduce
use of services.
The cost of healthcare will continue to rise with inflation as any other product or service,
but the financial strain to employers extends beyond direct healthcare expenses. Other, and more
significant losses associated with poor health, include decreases in productivity. Presenteeism,

3
the suboptimal function of people on the job, is estimated to cost an organization more than
absenteeism with on-the-job productivity losses estimated as high as 60% of the total healthcare
costs for an employee (Bray, 2009; Hemp, 2004; Scherrer et al., 2010).
Wellness through health insurance. Organizations often rely solely on the wellness
options provided by, or offered through their selected insurance plan, which may provide
incentives designed to promote healthy behaviors. Examples include various health assessments;
discounts on fitness or other wellness activities; diet, health, and stress reduction coaching; and
health behavior counseling, such as smoking cessation (Healthy living with Medica; Health
rewards and perks.; Wellness programs and incentives.; Serxner, 2013). Incentives offered by an
insurance plan, however, limit participation to those employees who chose to enroll and opt in to
the offered plan. Additionally, options are often limited to those who need the service. For
example, smoking cessation programs only benefit those who smoke. There are other such
programs for diabetes, cholesterol, and high blood pressure. In addition to limitations on
participation, the insurance company establishes other rules of the program(s). Examples of such
rules include additional cost, frequency of use, and specified locations. These options, while
beneficial, rely on the individual for behavior change, which has shown to not be as effective as
other behavior change models (2018 Physical Activity Guidelines Advisory Committee, 2018).
Specific to physical activity and exercise, one common and popular insurance incentive is
reimbursement of a percentage or specific dollar value towards a health club membership fee
payable to the participant. To receive the benefit, the employee is often limited to membership at
a specified location(s) and they are required to use their membership a minimum number of days
each month. Organizations and/or employees often pay a higher premium to have this benefit
and similar incentives added to their program, so if premium rates rise, the organization and/or

4
employees may elect to reduce or eliminate extra benefits (Abraham, Barleen, Feldman, &
Nyman, 2011).
Internal initiatives. With healthcare costs increasing at twice the rate of inflation and
becoming the single most expensive benefit there is a growing interest by employers to explore
ways to improve health while lowering costs (Emanuel & Wyden, 2008). To mitigate the
increasing healthcare rates, some organizations have developed their own wellness programs that
offer health benefits in addition to medical insurance. These programs are aimed at improving
the health of employees to decrease medical expenditures and lower the annual insurance rate of
increase by reducing use (Baicker et al., 2010; Chiappetta, 2005; Kumar et al., 2009; Sari, 2009).
In fact, studies have shown that employers will gain three dollars from every one-dollar invested
into a wellness program (Baicker et al., 2010).
Organization Development (OD) Intervention
Health is a human value, a business value and a value for employees. For society as a
whole, health is essential for keeping people productive and mitigating costs associated with
healthcare. For organizations, a healthy workforce is vital for productivity and a condition for
continuous learning required for innovative capacity (G. Zwetsloot & Pot, 2004). Developing a
meaningful, effective wellness program involves change, which requires research and analysis of
needs, resources, and capabilities. Organization Development (OD) is a holistic approach to
change with theories founded in pedagogy, psychology, and sociology. OD Consultants are
neither health practitioners nor experts in wellness, but they are skilled in analyzing, diagnosing,
and developing action plans to resolve or improve a large variety of problems, which includes
inefficiencies, morale, attrition, performance and attracting talent. Practitioners are
knowledgeable in behavior change, problem diagnosis, data collection and analysis, as well as
5
development of effective action plans. These qualifications place them in a position to be able to
successfully guide the development of an effective wellness program or incorporate a wellness
component into a larger change initiative. It is important for OD practitioners to be
knowledgeable in the economic effects of healthcare and the multiple direct and indirect benefits
of an effective wellness program.
Zwetsloot and Pot (2004) proposed that an interest in healthy products and services is
increasing among customers and consumers, which places health as a potential business value of
strategic importance. The closely related concepts of healthy organizations and corporate social
responsibility include healthy people, a healthy environment, and a financially healthy
organization. With respect to all stakeholders, the Integral Health Management (IHM) approach
was developed, which forms a strategic approach for reducing the costs of absence due to
sickness and disability while increasing productivity and resilience (G. Zwetsloot & Pot, 2004).
When viewed as strategic resources, health and vitality need to be developed through a
robust health and wellness program, which may improve the organization’s value and other
organizational climate factors that will reduce barriers to achieving excellence (Lee et al., 2010;
G. I. J. M. Zwetsloot, van Scheppingen, Dijkman, Heinrich, & den Besten, 2010).
Problem Statement
Employers and employees both desire to keep costs associated with healthcare as low as
possible. With poor health continuing to rise, however, so will the use of healthcare services,
which correlates to increased costs. Many health conditions are preventable, particularly those
associated with an unhealthy body weight. Chronic diseases, such as heart disease, diabetes,
arthritis, cancer, and depression have been linked to weight and obesity. 300,000 deaths each
year are associated with these chronic illnesses and a study collecting data from 2003-2004

6
found the number of obese adults in the United States increased from 23% to 32% (Hill, Sallis,
& Peters, 2004; Keeler, Manning, Newhouse, Sloss, & Wasserman, 1989; Kumar et al., 2009;
Turner, Thomas, Wagner, & Moseley, 2008). Current data shows the trend continuing with an
obesity rate of 39.8% in 2015 (Ogden et al., 2015). This increase in obesity has a significant
impact on the nation’s economy. In 2007, the Department of Health and Human Services
published data from 2000, which estimated costs to be $117 billion (Motivation, behavior
change, and weight management: Motivation-enforced weight loss programs conducted via the
internet may be the silver bullet for the nation's obesity epidemic.2011; Turner et al., 2008). In
2009, it was estimated the U.S. spent more than $2 trillion on healthcare, half of which is
privately funded (Ott, 2010). This is a cost everyone contributes to directly and indirectly (Sari,
2009). As a public health problem and with individuals spending over half of their waking hours
each week at work, it is in the best interest of organizations to accept responsibility and take
action by championing interventions aimed at decreasing the obesity rate (Lee et al., 2010).
Fewer than half of U.S. adults meet the recommended weekly guidelines for physical
activity, which is an exasperating problem as the work environment becomes increasingly
sedentary (Anderson et al., 2009; Carlson, Fulton, Pratt, Yang, & Adams, 2015; Pronk, 2009).
Studies have been published that demonstrate significant healthcare savings related to physical
activity programs in the workplace. Studies that yielded results of greatest significance were
those focused on policy and environment, such as, encouraging the use of stairs and active
commuting (Marshall, 2004). The goal of this study is to contribute to this body of knowledge by
incorporating a wellness program focused on policy and the environment that is aimed at
increasing physical activity.

7
Physical activity has been shown to be an effective weight management tool, contribute
to prevention or reduction in the severity and effects of health problems associated with being
overweight, and prevent other health conditions (Barwais, 2013; Hagberg & Lindholm, 2006;
Heath & Brown, 2009; Keeler et al., 1989; Lemon et al., 2009; Patel, 2011; Scherrer et al., 2010;
van Dongen et al., 2012). For example, an overweight individual who is physically active may
not be as susceptible to diabetes as someone of the same weight who is not active. Despite this
knowledge, most adults tend to not meet the physical activity levels that are sufficient to achieve
and sustain these benefits (Conn, Hafdahl, Cooper, Brown, & Lusk, 2009; Dishman, Oldenburg,
O’Neal, & Shephard, 1998; Schwetschenau, O'Brien, Cunningham, & Jex, 2008; van Dongen et
al., 2012). Initiatives aimed at increasing physical activity provide an opportunity for
organizations to make an impact on behavior change and improve health as well as improving
the financial health of the organization.
Research on health and wellness programs often focuses on what is offered by insurance
plans. These programs have limitations, restrictions and boundaries to what is offered and who is
eligible. Internal programs designed and managed by the organization have limitations as well,
often having a narrow focus on specific initiatives that do not accurately meet the needs and
desires of the entire organization or even a majority (Farrell & Geist-Martin, 2005). Examples
are smoking cessation, weight management, and health screening. Another barrier to
participation is the lack of privacy or perception that their medical conditions will become
known. Physical activity however, is a component of health and wellness that is universal.
Everyone, regardless of gender, age, ethnicity, body composition etc., benefits from regular
physical activity.

8
Purpose of the Research
The purpose of this study is to expand the body of knowledge of organizational wellness
programs through exploring the concept of improving the rate of physical activity by providing
the incentives of time and choice. The results of this study may help broaden how organizations
view wellness programs and inspire greater creativity in developing programs that are effective
and economical.
Research questions. The research questions of this study are as follows:
1. Is time a barrier to engaging in regular physical activity?
2. What effect does providing employees thirty-minutes, two to three times each week
as part of their regular work schedule to engage in a physical activity have on
behavior change?
3. What effect does providing employees thirty-minutes, two to three times each week
as part of their regular work schedule to engage in a physical activity have on
presenteeism?
4. What effect does providing employees thirty-minutes, two to three times each week
as part of their regular work schedule to engage in a physical activity have on the
work environment?
Significance of the Study
A healthy workforce not only affects the economic health of an organization through a
decrease in direct expenditures, but there are also hidden costs associated with attrition,
recruitment, absenteeism, job satisfaction, and efficiency. Too often, worksite wellness programs
are reactive, focusing on employees who are sick or incapacitated, ignoring those who are
currently healthy. Being reactive instead of proactive increases the potential for those who are

9
low-risk now to progress into medium and high-risk categories later (Beauregard & Henry, 2009;
Wolf, 2010).
Physical activity is a component of achieving and maintaining good health. Many health
conditions and diseases are associated with being overweight and physical activity is a
component of many weight loss programs. A wellness program focusing on physical activity
may contribute to improving health, weight reduction, and reducing chronic diseases and other
health conditions related to a sedentary life-style. Physical activity has also been shown to
improve cognitive functions of memory, reasoning, attention, problem solving, recall, and
abstract thinking, the results of which are consistent across all ages. Emotional health, which
includes depression and negative emotional states also improve with physical activity by
improving mood, reducing anxiety, improving sleep, and increasing the ability to handle stress
(Falkenberg, 1987; Kenworthy & Hrivnak, 2012).
While workplace wellness interventions have the potential to make a significant impact
on behavior change, current evidence on promotion of physical activity around the workplace
through walking and cycling have shown only small and short-term positive effects. This has led
to support for more robust research on workplace interventions. The United Kingdom (UK) and
U.S. Governments have encouraged the use of incentives for promoting healthy life-styles, but
financial incentives have been met with some skepticism, and financial incentives specific to
physical activity have shown primarily short-term benefits mainly with respect to structured
programs versus free-living physical activity, affording choice. Further, effects achieved have
been shown to deteriorate when incentives are withdrawn (Hunter et al., 2016). Some
organizations provide fitness equipment for employees, but lack of use is a major problem. An
estimated 35% of employers with 50 or more employees provide at least one exercise facility,

10
but less than half of the employees take advantage of this benefit and of those who do, only one-
third to a half of them use it regularly (Dishman et al., 1998; Schwetschenau et al., 2008).
This study differs from current published research by providing the benefit of time, which
is often noted as a barrier to engaging in regular physical activity (Overcoming barriers to
physical activity.2017). The wellness program of this study also supports free-living physical
activity by providing choice in activities, which is also beneficial to those with health conditions
that result in physical limitations.
Findings in this study extend beyond the costs of healthcare. Results may also provide
insight into benefits to the organization that are not directly tangible, but rather more indirect
costs with respect to the various aspects of presenteeism when employees are more active. This
study also explores the impact to the organization’s culture, or social condition of the work
environment, specifically, job satisfaction, engagement, morale, collaboration, and support.
Results of this study may be of interest to an organization wanting to initiate, change, or
expand their wellness program. OD, Human Resources, or other consultants working with
organizations on wellness or other activities such as, recruitment, retention, commitment, or
engagement may find the results and concept beneficial.
Dissertation Layout
Chapter 2 provides an extensive review of current literature on health and wellness
programs within organizations. Chapter 3 provides an explanation of the research methodology
and methods outlined in this study. Chapter 4 presents the collected data and research findings
and Chapter 5 includes a discussion of the data and findings along with suggestions for further
research.
Definition of Terms

11
Absenteeism. The practice or habit of being away from work.
Anxiety. An unpleasant high activation state characterized by feelings of apprehension,
worry, and physical sensations arising from activation of the autonomic nervous system. In the
extreme, these feelings can become a clinical disorder.
Brain Health. The optimal functioning of behavioral and biological measures of the
brain and the subjective experiences arising from brain function, e.g. mood.
Depression. An unpleasant low activation state characterized by sadness, or feelings of
hopelessness or guilt. In the extreme, these feelings can become a clinical disorder.
Cancer. A collection of related diseases in which some of the body’s cells begin to
divide without stopping and spread into surrounding tissues.
Cardiovascular Disease. Diseases of the heart, brain, and blood vessel system (arteries,
capillaries, veins) within the entire body. Cardiovascular disease encompasses coronary heart
disease, ischemic heart disease, coronary artery disease, stroke, and heart failure. It does not
include congenital heart disease.
Diabetes. A disease characterized by high blood glucose levels caused by either a lack of
insulin or the body’s inability to use insulin efficiently. The extent that blood glucose is
persistently elevated is commonly assessed by measuring glycated hemoglobin, abbreviated as
HbA1C.
Disease Progression. A chance or worsening of a disease over time.
Employee Morale. Description of the emotions, attitude, satisfaction, and overall
outlook of employees during their time in a workplace environment.

12
Employee Wellness. An attitude characterized by a strong sense of personal
responsibility that is also characterized by the intentional choice of a healthier life and balance of
physical, mental, emotional, and spiritual health (Thompson, 1997).
Exercise. Physical activity that is planned, structured, repetitive, and designed to improve
or maintain physical fitness, physical performance, or health. Exercise encompasses all
intensities.
Free-Living Physical Activity. Independent, not part of a structured, prescribed
program, allowing choice.
Hard Return on Investment (ROI). A profitability ratio and performance measure.
Used to determine the efficiency of an investment by measuring the financial return on an
investment compared to the relative cost of that investment, calculated with definitive dollar
figures.
Health. A human condition with physical, social, and psychological dimensions, each
characterized on a continuum with positive and negative poles. Positive health is associated with
a capacity to enjoy life and to withstand challenges; it is not merely the absence of disease.
Negative health is associated with morbidity, and in the extreme, with premature mortality.
Health Management Programs. Long-term organizational activities designed to
promote the adoption of organizational practices and personal behavior conducive to maintaining
or improving employee physiological, mental, and social well-being (Thompson, 1997).
Hypertension. A condition in which blood pressure remains elevated over time.
Light Activity. Actively requiring 1.6 to less than 3.0 METs, such as walking at a slow
pace of 2 mph or less.

13
MET. A unit of measure of the rate at which the body expends energy, also called
metabolic equivalent.
Meta-analysis. A review of a focused question that follows rigorous methodological
criteria and uses statistical techniques to combine data from studies on that question.
Moderate Activity. Actively requiring 3.0 to less than 6.0 METs, such as walking
briskly at 3 to 4 mph, mopping or vacuuming, or raking the yard.
Obesity. A condition characterized by the excessive accumulation and storage of fat in
the body.
Overweight. Excessive, or extra weight. A weight above what is considered normal or
desirable.
Premium. The total amount paid to the insurance company for health insurance
coverage. This is typically a monthly charge. Within the context of group health insurance
coverage, the premium is paid in whole or in part by the employer on behalf of the employee or
the employee's dependents.
Presenteeism. Employees are physically present, but due to a physical or emotional
issue, distracted to the point of reduced productivity.
Physical Activity. Bodily movement produced by skeletal muscles that results in energy
expenditure. The term does not require or imply any specific aspect or quality of movement and
encompasses all types, intensities, and domains.
Return on Investment (ROI). A profitability ratio and performance measure. Used to
determine the efficiency of an investment by measuring the financial return on an investment
compared to the relative cost of that investment.

14
Sedentary Behavior. Any waking behavior characterized by an energy expenditure of
1.5 or fewer METs while sitting, reclining, or lying. Most office work, driving a car, and sitting
while watching television are examples of sedentary behaviors. Sedentary behavior and
sedentary activity are similar but not synonymous; both are limited to energy expenditures 1.5 or
fewer METs, but sedentary activity includes standing.
Soft Return on Investment. A profitability ratio and performance measure. Used to
determine the efficiency of an investment by measuring the financial return on an investment
compared to the relative cost of that investment but is not quantifiable or measurable in specific
dollar amounts and does not show up as a bottom-line savings. Manifests itself as an increase in
intangible elements, such as, customer service, efficiency, productivity, morale, satisfaction, etc.
Systematic Review. A review of a clearly defined question that uses systematic and
explicit methods to identify, select, and critically evaluate relevant research, and to collect and
analyze data from the studies included in the review.
Vigorous Intensity. Activity requiring 6.0 or greater METs, such as walking very fast at
4.5 to 5 mph, running, mowing grass with hand-push mower, or participating in an aerobics
class.
Wellness. A conscious, self-directed and evolving process of achieving full potential.
Wellness is more than being free from illness, it is a dynamic process of change and growth. It is
a way of life oriented toward optimal health and wellbeing, in which body, mind and spirit are
integrated to live life more fully.
Wellness Program. Coordinated and comprehensive set of health promotion and
protection strategies implemented at the worksite that includes programs, policies, benefits,
15
environmental supports, and links to the surrounding community designed to encourage the
health and safety of all employees.
Limitations of the Study
This is a single-site case study conducted at the Big Brothers Big Sisters (BBBS) of the
Greater Twin Cities, Minnesota. The foundation of this study being time, is only an incentive if
an employee works a structured or semi-structured schedule with a specific number of hours per
week or pay period. The study was therefore limited to administrative personnel at the BBBS
whose work schedule is 40 hours per week and compensation is based on the hours worked. The
outcome cannot be generalized and may only be relevant to similarly situated organizations.
Results may provide rationale and support for additional research or applying this same
methodology to other sites. Organizations that are not structured in the same way may still find
results beneficial in developing a similar program with modifications.
The sample size of this study is a notable limitation. BBBS is a small organization,
employing approximately 65 personnel, which includes 14 supervisors. All 65 employees were
invited to participate in the study. Twenty-four consented to participate and completed the initial
survey, however, only 17 participants completed all study requirements.
Participants were authorized time to participate in a physical activity of their choice and
at any location. They were required to log their time and activity, but there was no validation;
participants were entrusted to provide accurate information.
This study was limited to four months and was not longitudinal. A more vigorous study
with a larger sample group and longer in duration may yield results of greater significance.
Researcher Bias
16
The researcher has experience working for an organization that provides time for physical
activity as part of the work-schedule. The organization is military in nature, requiring employees
to maintain a prescribed level of fitness, which is the impetus for the physical activity benefit.
The researcher experienced personal benefits from this program resulting in increased
enthusiasm about fitness and physical activity. However, the views, experiences, and habits of
others is unknown. Benefits and hindrances that may exist for the selected organization of this
study also remains unknown to the researcher.

17
Chapter 2: Literature Review
Introduction
The prevalence of obesity and overweight adults has been significantly increasing in the
United States (U.S.) over the past thirty years. In 2003, the World Health Organization (WHO)
reported there are more than a billion overweight adults and at least 400 million obese adults
world-wide (Robroek, van Lenthe, van Empelen, & Burdorf, 2009). In the United States, recent
publications report 34% of adults are overweight and that same percent is obese (Anderson et al.,
2009; Kumar et al., 2009; Ogden & Carroll, 2010; van Dongen et al., 2012), which has reached a
level considered to be an epidemic (Hill et al., 2004). The increase exists throughout the entire
population to include all age groups, all racial and ethnic backgrounds, and both genders. Large
health organizations have estimated that over 60% of the adult population is overweight and
almost half of the full-time workforce is either overweight or obese (Abraham et al., 2011;
Ogden, Carroll, Kit, & Flegal, 2012).
An objective of Healthy People 2010 is to decrease the overweight population by 15%,
but instead of getting closer to that goal, the United States is getting further away (Abraham et
al., 2011; Anderson et al., 2009; Baskin, Ard, Franklin, & Allison, 2005; Marcason, 2007;
Ogden, Carroll, Kit, & Flegal, 2012; Roberts, 2002). The results of a Centers for Disease Control
(CDC) and Prevention, National Centers for Health Statistics report published in 2017 on the
prevalence of obesity, confirmed the obesity rate is not decreasing despite emphasis on programs
designed to bring awareness and education on the importance of maintaining a healthy weight.
The obesity rate has increased by approximately 6% in seven years (Ogden & Carroll, 2010;
Ogden et al., 2012; Ogden et al., 2015).
18
The adverse health effects of being overweight are well documented. People who are at
an unhealthy weight are at an increased risk of developing chronic diseases; such as,
hypertension, diabetes, heart disease, and several forms of cancer (Barwais, 2013). Depression
has also been linked to weight (Anderson et al., 2009; Ogden et al., 2012; Robroek et al., 2009;
Tryon, 2013).
Physical inactivity and associated health risks are at an all-time high in the developed
world and according to the WHO, those risk factors are similar to those of smoking and alcohol
use (Scherrer et al., 2010). In the United States, physical inactivity and poor nutrition are among
the leading causes of disease and death by increasing the risk for chronic conditions of cancer,
diabetes and cardiovascular diseases. Inactivity causes an estimated 1.9 million premature deaths
worldwide and a report from the U.S. Surgeon General concluded that those who are physically
active have a lower mortality rate (Sari, 2009). Physical inactivity also contributes significantly
to being overweight and obesity. In fact, the WHO proclaims inactivity as the main cause of
obesity, which, as previously stated, has become an epidemic in the United States and also
increases the risk of the same and other health conditions as being sedentary (Physical activity
fact sheet.February 2017; Heath & Brown, 2009; Hill et al., 2004; Scherrer et al., 2010).
In addition to contributing to weight management and reduction in the risk of developing
chronic conditions, those who engage in physical activity report less illness, better mental health,
and have a longer life expectancy (Carlson et al., 2015; Heath & Brown, 2009; Patel, 2011; Sari,
2009; Schwetschenau et al., 2008). The benefits of physical activity improve more than physical
health; regular exercise has also been shown to improve cognitive function, which includes
improved memory, reasoning, attention, problem solving and contribute to a positive and stable
emotional state (Heath & Brown, 2009; Kenworthy & Hrivnak, 2012). In their study on

19
decreasing sedentary behavior, Barwais et al. found the intervention group not only increased
their physical activity, but there was also a significant increase in total wellness scores (Barwais,
2013). Despite the growing knowledge on the benefits of physical activity, people are spending
more time in sedentary activities and the U.S. Department of Health and Human Services
estimates only 23% of American adults are active enough to maintain cardiorespiratory and
muscular fitness (Physical activity fact sheet.February 2017; Conn et al., 2009; Sari, 2009).
Financial Strain
Chronic diseases translate into significant direct and indirect costs to the economy,
organizations, and society as a whole (Patel, 2011; Sari, 2009; Scherrer et al., 2010).
Improvements in health lead to a decreased use of health services and an increase in job
productivity, which have positive effects on the economy (Conn et al., 2009; Keeler et al., 1989).
With the economic burden on everyone, society must accept a level of responsibility and act to
reverse this devastating trend. Americans spend 50% of their lives and up to 60% of their waking
hours at work, which gives employers and the work site an opportunity to be an ideal location for
initiatives aimed at reducing this overwhelming trend and making a significant impact (Anderson
et al., 2009; Dishman et al., 1998; Farrell & Geist-Martin, 2005; Schwetschenau et al., 2008; van
Dongen et al., 2012).
Historical perspective. Approximately sixty years ago, employers began offering health
benefits to employees. The genesis of this movement was to avoid the World War II wage and
price controls, which prevented employers from offering high salaries to attract employees;
providing health insurance was an indirect way of offering a financial incentive. The Internal
Revenue Service (IRS) eventually added rules that gave employers a tax advantage for providing

20
medical insurance, making this benefit more attractive for organizations to maintain (Emanuel &
Wyden, 2008).
The system of employer-sponsored health insurance from the 1940s continued and
expanded to becoming common practice. It is still a strong recruiting and retention tool, and
often an expectation of employees working full-time for organizations of medium to large size.
Not all insurance plans are equal; there is a wide range in coverage and cost. In making a
decision to accept a job offer, prospective employees may evaluate not only what their own
financial contribution will be, but also if the plan meets their expectations and health needs
(Reddick, 2009).
Direct costs. The cost of health insurance, referred to as a premium, is often a shared cost
between the employer and employee, so keeping them low and relatively stable is a common
goal. As a previous small business owner, the researcher has experience evaluating insurance
plans and having to make difficult decisions each year that would affect employees and the
profitability of the company. Premium rates increase as the costs associated with general medical
care rise; improving the health of employees, thus reducing use of services, is a way to keep the
rate of the increase to the lowest level. Insurance rates are affected by medical spending;
insurance providers annually evaluate the amount paid in claims for a particular employer group
compared to what they received in premiums. The analysis determines premium rates for the
following year. In general, there is a positive correlation to unhealthy employees and how much
is spent on health care; as spending increases, premium rates rise. Conversely, when employee
health improves, medical claims will decrease, which will lower the amount at which the
premium rate increases (Bray, 2009; National Association of Health Underwriters, 2013).

21
Organizations have developed various interventions and programs with the goal of
lowering costs associated with healthcare and mitigating future increases. These initiatives, often
referred to as wellness programs, vary significantly from organization to organization (Lee et al.,
2010). Some are quite robust, while others are minimal. Comprehensive plans often provide
education and access to a variety of resources and/or incentives, but many have nothing specific
to physical activity. Of those that do have a physical activity component, the program is often
unstructured and relies on the individual to be self-motivated to select and participate. Examples
include having onsite fitness equipment or subsidizing fees and memberships to fitness facilities.
A limited meta-analysis of worksite health promotion programs involving diet, physical
activity, or both, indicates a moderate reduction in weight as a result of these programs and noted
there can be a more significant impact when applied to a substantial proportion of the working
population. This analysis also indicates structured programs are more effective than unstructured
approaches (Anderson et al., 2009). These interventions have good intentions, but often result in
minimal impact on behavior change. Despite the variety and breadth of programs, no research
could be found on the effects of providing employees time to engage in physical activity.
The financial resources organizations are putting towards health programs also vary
significantly with some placing a high priority on wellness, investing significant resources, while
other organizations limit their program to offering basic medical insurance and contributing
towards the monthly premium. Organizations that view health as an investment, allocating
sufficient resources, and implementing well designed and managed programs have had
noticeable and measurable returns on their investment. The financial benefits include lower
healthcare expenditures as well as soft returns on investment, such as decreases in absenteeism,

22
presenteeism, and disability as well as increases in efficiency, accuracy, morale, and employee
satisfaction (Baicker et al., 2010; Goetzel et al., 2004; Kumar et al., 2009).
There has been general agreement on the need for behavior modification to improve
health. However, current behavior change models typically used in research centers on
education, motivation, and skills training that are focused on the individual, generated only
modest success and the limitations are now becoming evident. Maintaining the changes these
programs generate are particularly poor (Hill et al., 2004; Shain & Kramer, 2004).
A program that approaches behavior change as an individual responsibility will have
interventions that require each employee to have the internal desire and motivation to participate
and extend effort. A significant component of this method is self-efficacy. As defined by Higgins
et al., the theory of self-efficacy is focused on the individual and the level of confidence each
person has in their ability to perform the action required for desired results (Higgins, Middleton,
Winner, & Janelle, 2014). Having, low self-efficacy, or doubts about success may be a barrier to
taking action or even forming an intention to change. Those with greater self-efficacy, or a
stronger belief in their ability to succeed, are also apt to invest more effort in the process
(Kreausukon, Gellert, Lippke, & Schwarzer, 2012). An example of an individual focused
intervention is contributing towards or paying for a fitness center membership. This wellness
program is dependent on the employee feeling the need for and having the desire to use a fitness
center as well as having confidence in being able to perform activities at a center. Some
programs also rely on individuals to have the resources and aptitude required for success. For a
fitness center membership, the employee requires convenient access to an approved fitness
center.

23
Economic impact. “Economics is the study of how people and societies achieve
desirable goals within the limitations of available resources.” This includes making choices on
how to utilize resources in order to maximize results or gains (Hill et al., 2004). An organization
has limits on funding and will achieve greater financial success when it is able to achieve the
mission and meet or exceed the standards of established goals and objectives within funding
limitations. To sustain profitability, the income must exceed operating expenses. Many general
operating expenses are relatively fixed, stable, or predictable, such as supplies, equipment,
insurance, rent, utilities, licensing, marketing, etc., with significant increases having a level of
predictability and therefore easier to manage or mitigate. For example, finding another supplier
or relocating to a lower cost building or location.
The expenses relevant to this study are those most associated with personnel. Unlike the
operating expenses previously discussed that have some predictability with increases and even
some ability to mitigate, costs associated with personnel can be more variable and the associated
flexibility comes with decisions that have risks, which makes management of these expenses
more challenging. The cost of personnel includes those that are tangible, direct costs, meaning
they can be projected and accounted for on financial reports. These include salaries, bonuses,
training and health care benefits. Other costs, however, are intangible, being indirect costs that
are not easily calculated nor documented on financial reports. These costs are associated with
absenteeism, presenteeism, and disability. Unlike the direct costs, these abstract expenses are not
easily predicted or measured. Changes in health impact these costs, but they are not easily
forecasted and planned for (Goetzel et al., 2004).
Cost of healthcare. According to eHealth, an independent agent selling health insurance
policies for multiple companies, in 2016 the average family on a non-subsidized healthcare plan
24
paid $833 per month for medical coverage. In addition to the monthly premium, there is the
average annual deductible of another $18,000. This eighteen-thousand-dollar average annual cost
does not include co-insurance or co-pay amounts for services (How much does health insurance
cost without a subsidy? 2016).
With 53% of employers offering a subsidized medical insurance plan, more than 60% of
Americans get their health insurance through an employment-based plan (Baicker et al., 2010;
Claxton et al., 2017). The Henry J. Kaiser Family Foundation is a non-profit organization
focused on health through policy analysis and communication. Their goal is to be a trusted
source of information in health care. One of the Foundation’s initiatives is an annual health
benefits survey to provide current information on employer sponsored health insurance. As
reported in their 2017 survey of 2,100 non-federal public and private firms, the average premium
for employer plans increased 4% for an individual and 3% for a family plan. For most employer-
based plans, in addition to paying deductibles and co-payments, employees contribute towards
the premium, the ratio of which varies by organization, but on average, employees contributed
18% for an individual plan and 31% for family coverage. In 2007, the average employee
contribution towards premiums was $660 per year for single coverage and $3,533 for a family
plan (Claxton et al., 2017). Employers contributed an average of $3,615 for single coverage and
$8,508 for a family (Goetzel & Ozminkowski, 2008). These amounts have risen each year and in
2017 were $1,160 for single coverage and $6,039 for a family plan, which is a 70-75% increase
in just 10 years. Employees are also responsible for any deductibles and/or co-payments when
they receive medical services, the amounts of which vary by plan (Claxton et al., 2017).
According to Business Insider and the U.S. Census Bureau, the median household
income in 2016 was $59,000 per year (Loudenback, 2017). For a family on a non-subsidized

25
plan, medical costs could be more than 30% of their household budget compared to 9-10% for
those on an employer subsidized plan. These figures demonstrate the high value employees may
likely place on health benefits offered by a current or future employer. Decisions an employer
makes with regards to health insurance plans and benefits could therefore affect recruitment and
retention, which both financially impact an organization.
In a 2003 study on medical spending associated with being overweight and obese, the
economic burden was estimated to be $92 billion per year in the United States. In a 2008 study,
the cost to U.S. employers was estimated at $45 billion per year. With the rapid increase in
childhood obesity and type 2 diabetes, this rate was expected to rise and lead to economic
burdens significant enough to make paying for healthcare unsustainable (Hill et al., 2004; Kumar
et al., 2009). The prediction in 2003 is proving to be correct. In 2009, the United States spent
more than $2 trillion on healthcare, about half of which is privately funded (Ogden et al., 2012;
Ott, 2010). In 2016, the CDC reported that the U.S. spends $117 billion per year on health care
costs associated with inadequate physical activity alone (Nutrition, physical activity, and obesity:
Keeping Americans healthy at every state of life.2016). This rate is not sustainable, so
organizations must explore ways to improve employee health, utilizing minimal resources that
will achieve maximum results to remain highly competitive and maintain economic health.
Cost of an unhealthy workforce. While healthcare can be a significant financial
hardship to individuals, it is also a critical expense to employers. Benefits accounted for only
about 5% of the total compensation 60 years ago, but today, that amount is 30-50%, the rate of
which is increasing faster than direct pay and becoming one of the largest expenses (Carraher &
Buckley, 2008; Williams, Brower, Ford, Williams, & Carraher, 2008). As previously stated, 53%
of organizations in the U.S offered health benefits in 2017, but this has been slowly declining. In

26
2016, 56% offered health insurance, in 2012 it was 61% and in 2007 it was 59%. Smaller
organizations with under 200 employees are significantly less likely to offer benefits, citing cost
as their most important reason (Claxton et al., 2017; Eisenberg, 2016).
The majority of large employers offer a subsidized healthcare plan, but costs continue to
rise making healthcare a top priority for many employers in the U.S. The eight physical and
mental health conditions costing U.S. employers the most through direct medical expenditures
are cardiovascular disease, musculoskeletal disorders, ear, nose and throat conditions,
hypertension, diabetes, and depression-related illness (Claxton et al., 2017; Goetzel et al., 2004).
The costs associated with medical care will continue to rise for various and numerous reasons,
such as, the aging population, advances in technology, cost of goods, and inflation, but costs to
individuals and organizations are mitigated when use of services decreases. The financial
burdens of an unhealthy workforce also extend beyond the rising costs of healthcare and
insurance, it is multi-faceted with additional losses through absenteeism and presenteeism. In
fact, improving productivity and presenteeism in most other regions of the world, is the number
one strategic objective for a health promotion program and reducing employee absence is
consistently among the top three objectives from around the globe (Wolf, 2010). Studies have
shown, of the costs associated with health, less than half is direct medical expenses; the majority
being productivity related expenditures (Goetzel et al., 2004).
Offering a subsidized healthcare plan is significantly more prevalent than a
comprehensive wellness program, however, simply providing access to medical care is not
improving health. The rates of insurance continue to climb, yet many organizations are still not
offering more robust wellness programs aimed at prevention. In 2004, the National Worksite
Health Promotion Survey reported only 7% of employers offered a comprehensive program as

27
recommended by the Healthy People 2010 report, which includes education, worksite screenings,
and program integration into the organizational structure (Baicker et al., 2010).
Considering healthcare an operating expense and viewing health behaviors as personal
choices and not employer business creates a barrier to recognizing wellness as an investment that
has a positive return on investment. Adding difficulty to a change in this perspective is being
able to measure and show the return on investment (ROI) with one of the only hard ROIs being
the cost of medical insurance. Wellness, however, has many soft ROIs, which can have a
significant impact on the financial bottom line of a company through increases in productivity,
efficiency, morale, and customer satisfaction as well as decreases in absenteeism, presenteeism
and disability. These facets are gaining more recognition through increased awareness and with
more effective instruments being developed for measuring gains and losses associated with these
factors (Baicker et al., 2010; Goetzel et al., 2004; Lee et al., 2010). While still challenging to
evaluate the full impact, organizations and practitioners seeking interventions with a high rate of
return to increase soft ROIs should look to wellness as a priority that can have a significant
impact in multiple areas (Lee et al., 2010).
A joint National Business Group on Health and Fidelity Investments survey in 2010
showed only one third of employers have measurable health improvement goals and many
business leaders question the value of these investments (Barlow & Weber, 2012). Methods for
calculating the ROI of wellness programs are not empirical, but there have been some significant
studies in recent years that have produced similar results. A meta-analysis of 32, peer reviewed
original publications of well-defined studies on the cost savings of wellness programs found that
medical costs fall by $3.27 for every one-dollar spent on wellness. This analysis further found
that costs associated with absenteeism fell by $2.73 for every dollar spent. Characteristics of
28
these programs included health risk assessments; self-help education materials and counseling;
on-site workout facility; and onsite group activities, classes, or seminars (Baicker et al., 2010).
Another study found that a well-funded and well managed program can have a return rate of $5
for every $1 invested, and in some cases this is found to be even higher (Kumar et al., 2009).
Absenteeism and Presenteeism
Employees being absent from work due to illness is a significant problem, with an
estimated cost of $46 billion per year (Cullen, Praveen, & Addae, 2005). The costs related to
absenteeism are substantial, but estimates have been much greater for losses associated with
presenteeism (Hemp, 2004; Lee et al., 2010; MacGregor, Caverley, & Barton Cunningham,
2008; Strömberg, Aboagye, Hagberg, Bergström, & Lohela-Karlsson, 2017; Wolf, 2010). The
Cornell University Institute for Health and Productivity Studies along with MEDSTATE, a
health information firm, estimate on-the-job productivity losses are as high as 60% of the total
healthcare costs for an employee, which exceeds the costs of absenteeism and disability benefits
(Hemp, 2004; Lang, 2004). The Harvard Business Review estimates the cost of presenteeism
through lost productivity is 7.5 times greater than absenteeism and 3 times more than direct
medical costs (Wolf, 2010). The Journal of American Medical Association in 2003 estimated
depression alone costs U.S. employers $35 billion a year and pain conditions nearly $47 billion
in reduced performance. Another study linked obesity and work limitations showing obese
employees experience a much higher rate of work limitations compared to those who are normal
weight (Hemp, 2004).
Cary Cooper, a psychologist specializing in organizational management at Manchester
University in the UK originally coined the term presenteeism (Brown, Gilson, Burton, & Brown,
2011). The phenomenon occurs when employees are present at work, but are limited in their
29
performance due to health conditions that are physical, mental, or emotional. Productivity is
reduced in both quantity and quality (Brown et al., 2011; Hemp, 2004; G. I. J. M. Zwetsloot et
al., 2010). Health conditions contributing to presenteeism include allergies, migraines, back pain,
arthritis, gastrointestinal disorders, chronic fatigue, anxiety, and depression. Unlike more
complex, progressive conditions like cardiovascular disease, diabetes and cancer, the conditions
most associated with presenteeism do not generally have a significant impact on healthcare
spending and subsequent premium rates. These health conditions do, however, have a significant
financial impact through loss of productivity, which includes volume of work and quality of
work. Presenteeism influences others in the workplace and may affect their work as well. When
someone is not functioning at full capacity, in addition to a decrease in their capacity, their
ability to effectively reason and communicate can be impaired, having a negative effect on
colleagues. There is strong indication that more time is lost when employees are not performing
at full capacity than if they stay home (Brown et al., 2011; Hemp, 2004).
Research on presenteeism is constructed on the belief that people have a desire to do their
job, they want to be productive and contribute despite their symptoms, but when they do not feel
well and are distracted by pain or other stress, they are not able to perform at their best (Hemp,
2004). Methods for measuring presenteeism continue to improve with validated, self-report
surveys, which is leading to more research that is showing the significant impact of presenteeism
and the impact wellness programs have on reducing it (Wolf, 2010).
Costs associated with presenteeism. Dow Chemical conducted a survey in 2005, which
showed the cost associated with presenteeism significantly exceeded the costs of absenteeism
and medical treatment combined. Several studies of call center employees at Bank One used
objective data to evaluate the level of presenteeism. They measured the amount of time spent on

30
each call, time employees do paperwork between calls, and the amount of time the employee is
logged into the system. This data was then compared to results of a presenteeism questionnaire
and revealed a strong correlation. Another study used the same objective time measurements and
compared it to disability claims, which showed a relationship between workers with known
illnesses and lower productivity scores (Hemp, 2004; Wolf, 2010).
In tougher, more uncertain economic conditions, presenteeism may escalate with
employees being anxious or even fearful of losing their job. These are the same circumstances
that often prompt organizations to reduce healthcare expenses, but the savings might be
deceptive in that it is offset through reduced productivity. Productivity includes pace and volume
of work along with accuracy and general performance. Being distracted by cognitive or
psychological challenges, pain, sleep deprivation, discomfort, exhaustion, or various stressors
can significantly affect an individual’s energy and ability to focus and engage in their work,
often resulting in accomplishing less and making more errors (Hemp, 2004).
Brown et al. (2011) conducted a review of the research on presenteeism and physical
activity to examine the impact of physical activity on employee well-being and presenteeism.
Most studies, however, measured absenteeism, not productivity or other elements of
presenteeism. Other factors, while positive, were inconclusive, because of multi-approach
designs; results could have been attributed to other actions, such as improved nutrition or
smoking cessation. They did find positive relationships between physical activity and a range of
psychosocial well-being indicators as well as aerobic exercise and exercise along with relaxation
reducing anxiety and burnout. This study suggests the need for more well-designed studies with
robust and valid measures of both physical activity and presenteeism (Brown et al., 2011).

31
Sedentary Behavior
The health benefits associated with physical activity have been well documented.
Physical activity has a direct impact to and reduction in cardiovascular disease, stroke, type 2
diabetes, colon cancer, breast cancer, osteoporosis, and depression (Carlson et al., 2015; Keeler
et al., 1989; Patel, 2011). Being physically active has also been shown to reduce the health risks
associated with other unhealthy behaviors, such as smoking and being overweight (Patel, 2011).
Despite known benefits, according to the WHO, physical inactivity, or sedentary behavior, is the
main contributor to obesity and is now comparable to the risk factors of smoking and alcohol use
(Scherrer et al., 2010). National guidelines recommend weekly physical activity of at least 150
minutes of moderate intensity aerobic activity, 75 minutes of aerobic activity at a vigorous
intensity, or an equivalent combination. This is less than 30 minutes a day, yet, fewer than half of
adults in the United States meet this minimum guideline and almost one third are physically
inactive. A recent study used leisure-time physical activity data from the National Health
Interview Survey and merged it with health care expenditures for inactive and insufficiently
active adults. With the use of an econometric model, the results determined 11.1% of combined
health care expenditures were associated with inadequate physical activity (Carlson et al., 2015).
Costs associated with sedentary behavior. As previously discussed, there are two
measures for return on investment, hard and soft. The cost of inactivity also has two parts, which
are internal and external. The internal costs are those the individual is burdened with and
presumably have an impact on their health decisions to include amount of physical activity. The
external costs are those associated with programs, which include group health insurance, sick-
leave, group life insurance, and disability insurance. These costs impact more than the sedentary

32
individual. With the premiums and taxes that fund these programs, those who have a healthy
lifestyle and are physically active are subsidizing the cost to care for those who are not (Keeler et
al., 1989; Patel, 2011; Sari, 2009).
Although not structured to show complete causality, in their study of external costs on a
sedentary life-style, Keeler, et. al (1989) found the external costs of a sedentary life-style to be
almost double the external costs of smoking. More active individuals live longer, which could be
viewed as possibly increasing costs, but when viewed more broadly the costs are reduced. Active
individuals consume fewer medical resources, they have fewer absences from work, are able to
retire later, and are less likely to require disability (Lee et al., 2010). The costs associated with
medical resources, absences from work, and early retirement due to medical and/or disability
more than cover the costs associated with a longer life-span (Keeler et al., 1989). This study
estimated $1,900 in benefits per active person, which if approximately correct, a small additional
percent of exercising would be enough to justify a subsidy. These costs and the rate at which
they are increasing have made inactivity a social problem, which is different from other
behaviors associated with poor health such as smoking and drinking, which can offset external
costs by increasing internal costs through increased taxes (Keeler et al., 1989; Patel, 2011).
System Approach
Health behaviors and making decisions on what to eat and the level of physical activity to
engage in each day is an individual decision (Lee et al., 2010). These decisions however, make a
financial impact to organizations that is becoming more and more evident and significant enough
to where improving the health and wellbeing of the workforce is not just a public health
initiative, but also a business agenda that is a key strategy. The World Health Organization
identified the workplace as a target setting for health promotion and has initiated a Global Plan

33
of Action to respond to the health needs of the working population (Baxter et al., 2015). The
World Business Council for Sustainable Development supports health and wellness as a
corporate responsibility, whereby employers must have systems in place that provide opportunity
for employees to make informed choices about their health (Lee et al., 2010). Beyond the benefit
to individual organizations, business and industry are an integral component to the success to
broadly improving health and changing behavior with access to working adults and their families
as well as their involvement and influence in creating and changing public policy (Pronk, 2009;
Wolf, 2010). Places of employment are an ideal setting, reaching a large audience and having an
influence over a significant amount of an individual’s time, but the organization also benefits
through increased productivity (Kohler, 2016; Lee et al., 2010). In a study conducted by Blue
Cross and Blue Shield, a major healthcare provider in the United States, 80% of employees
believe healthy lifestyle and weight management programs belong in the workplace (Kumar et
al., 2009). In Australia for example, where only 29% of the population regularly engages in
physical activity more than twice a week, government campaigns promoting physical activity
guidelines have increased awareness, but have failed to have an impact on behavior change.
Physical activity programs in the workplace, however, which provide social support has been
beneficial (Scherrer et al., 2010).
Too often, healthcare is viewed as an operating expense, a benefit for personnel. Human
capital, however, is an asset and in general, organizations view things like training as an
investment into that asset. Wellness should have a similar approach, as an investment into a very
important asset. To ensure the greatest return on that investment, there needs to be a priority
placed on providing quality health and wellness program (Hemp, 2004; Kumar et al., 2009; Lee
et al., 2010; Ul Haq, 2014; G. I. J. M. Zwetsloot et al., 2010). Wellness programs not only

34
contribute to improving the health of employees, but they also demonstrate employees are
valued, which in turn, increases customer, shareholder, and social value at the same time (Ul
Haq, 2014).
An organization’s strategy for health management should be a pro-active, preventative,
and inclusive approach, whereby the programs or interventions apply to everyone vs. having a
focus on those that are or have a specific condition. Employees who are low-risk today can move
into medium and high-risk categories at any time (Kumar et al., 2009; Wolf, 2010). A successful
workplace wellness program becomes a part of the culture by focusing on the whole system and
not the individual. A health risk assessment, for example, while having some benefit, is focused
and reliant upon the individual and will not contribute to a healthy culture and changing the way
people think about the workplace (Serxner, 2013; G. Zwetsloot & Pot, 2004). Creating an
environment with nutritious meals and snacks, sponsoring regular events that incorporate healthy
nutrition and fitness to generate awareness, and creating competitions with physical activity to
gain participation are just a few examples of a system approach. Leaders need to be actively
engaged by promoting and participating in events, and knowing and talking about the various
health plan benefits that may not be well known or are under-utilized (The business benefits of
employee wellness programs.2018).
Return on investment (ROI). Accurately and efficiently calculating the return on
investment and cost effectiveness of wellness programs is a topic of much debate in the literature
(Baicker et al., 2010; Kohler, 2016). However, past efforts from a public health perspective and
those of individual responsibility have had poor results. When an organization invests in health,
impacting the culture and environment, the return on investment is not quick or easily calculated,
but in 2010, the American Journal of Health Promotion published a rigorous systemic review of

35
the literature on wellness programs in the workplace and concluded that for every dollar invested
in a wellness program there is a return of over three dollars (The business benefits of employee
wellness programs. 2018; Bray, 2009). Other studies have shown a higher ROI; the Citibank
Health Management Program, for example, reported a savings of $4.50 in medical expenses for
every dollar spent on the program and similar results have been reported by the California Public
Employees Retirement System, Bank of America, and Johnson and Johnson (Baicker et al.,
2010).
A meta-analysis of literature on costs and savings associated with employer wellness
promotion in 2010 found a substantial positive return on investment for large employers. More
specifically, medical costs fall about $3.27 for every dollar spent on wellness and absentee costs
fall by about $2.73 for every dollar spent. Other similar studies have reported higher rates of
return. However, these studies had more lenient inclusion criteria of studies and in one case less
than half the number of studies included (Baicker et al., 2010). This analysis is supported by the
Gallop Management Journal, which began an initiative in 2000 to reduce healthcare costs
through the creation of a robust culture of healthy living and preventative wellness. Gallup’s
efforts reduced their medical premium inflation rate from 20% in 2003 to just 8% in 2004. Since
2004, their rate has averaged just over 2%. As a comparison, the average healthcare cost inflation
across the country is 11-15%. Gallop’s annual savings has ranged from 8.5% to 12% (Ott, 2010;
Reddick, 2009).
In the mid-1980s, organizations started promoting physical activity as a component of
their wellness program, which ranged from payment towards fitness center memberships to full,
on-site fitness centers (Falkenberg, 1987). Organizations reported several indirect returns on
investment, which include an increased ability to attract competent employees, improved

36
attitudes, increased loyalty, indirect increase in productivity, and improved image (Falkenberg,
1987; Lee, Lee, & Lum, 2008).
Wellness program for physical activity. Fewer than half of U.S. adults meet the
recommended weekly guidelines for physical activity (Carlson et al., 2015). With more
automation and the popularity of optimizing efficiency, the work environment has become
increasingly more sedentary, which is exasperating the problem (Anderson et al., 2009; Pronk,
2009). The physical health benefits associated with physical activity have been well documented,
but in addition to improving physical health, cognitive function is also improved with physical
activity. Cognitive functions shown to improve with physical activity include memory,
reasoning, attention, problem solving, recall, and abstract thinking, the results of which are
consistent across all ages. Emotional health, which includes depression and negative emotional
states also improve with physical activity by improving mood, reducing anxiety, improving
sleep, and increasing the ability to handle stress (Falkenberg, 1987; Kenworthy & Hrivnak, 2012;
Pronk, 2009). All of these benefits improve health and lower healthcare costs, but also result in
happier, effective, productive employees, which supports the importance of incorporating
physical activity into a workplace wellness plan.
In 2008, a study of employees found 80% believe healthy lifestyles and weight
management programs belong in the workplace. In a study conducted by Blue Cross & Blue
Shield, 67% of employees desired the ability to participate in physical activity during working
hours (Kumar et al., 2009). The Institute for Health and Productivity Studies at the Johns
Hopkins Bloomberg School of Public Health published a guide for employers on incorporating
physical activity in the workplace. This guide was developed using evidence-based literature
reviews and interviews with leading experts. The first step is to build a culture of health, which

37
means incorporating physical activity into day-to-day operations without asking permission.
Physical activity should be encouraged with support from all levels of leadership. Steven N.
Blair, P.E.D, professor in the Departments of Exercise Science and Epidemiology and
Biostatistics at the Arnold School of Public Health, University of California, noted that research
shows the use of onsite fitness centers are often low, frequently engaging only those who are
already active and not facilitating behavior change. The guide also recommends collaborations
with the community, which can be especially useful for smaller employers with fewer resources.
Some examples include improving the walkability of the neighborhood, active transportation,
walking clubs, and group exercise activities. Tailoring the program to meet employee needs and
that will fit into the existing culture, may have stronger emphasis on the social benefits of fitness
activities. The final recommendation is to set realistic goals, goals for individuals and the
organization (Physical activity in the workplace: A guide for employers).
Several studies have been published that demonstrate significant healthcare savings
related to physical activity. A study conducted in the United Kingdom found a reduction in
absenteeism by 20% when the organization promoted physical activity (Lee et al., 2010). A
study of employees at General Motors showed lower annual healthcare costs of approximately
$250 for those who engaged in moderately active exercise 1-2 times per week and very active 3
or more times per week compared to their inactive counterparts. These results were regardless of
weight or body mass index. When analyzing against the obese subpopulation, the savings rose to
$450. The researchers determined a 1.5% savings in healthcare costs could be achieved if all
obese sedentary employees became active. In 2011, O’Neal Industries introduced a program that
included health coaches and on-site physical fitness facilities. In 2014, they found that just over
13% of their employees had initiated or improved their exercise level. The percent does not seem

38
significant, however, this contributed to an overall net savings of $556,100, producing a return
on investment of $1.52 for every dollar spent (Physical activity in the workplace: A guide for
employers).
A meta-analysis of worksite physical activity interventions included studies with various
intervention categories, which included onsite fitness facilities, onsite fitness programs,
educational workshops, motivational self-help printed materials, and policy and environmentally
focused interventions. Of the various types, the only studies that yielded positive results of
significance were those focused on policy and environment, examples of which were
encouraging to use the stairs and active commuting. Although the effects were short-term, the
results indicate that more effort and innovative thought could yield long term results (Marshall,
2004).
Workplace opportunities and OD. Evidence showing how environments and policy
influence behavior change related to eating and physical activity through supportive efforts is
growing and leading to alternatives to psychosocial approaches. Environmental and policy
changes are complex and take time, but substantial improvements in the areas of nutrition and
physical activity may not be possible without creating major changes in these constructs. This
approach has been proven through its application to smoking cessation, which has reduced the
rate by over 50% since the 1960s (Hill et al., 2004; Lemon et al., 2009). Providing time for
employees to engage in physical activity is an example of an intervention that is a change to
local policy and the environment that could have a positive change on behavior.
With employees spending up to 60% of their waking hours at the worksite, workplace
interventions have the potential to make a significant impact on behavior change, which not only
have a positive influence on the physical and mental health of the employee, but also the

39
organization and society through a reduction in healthcare spending, reduced rate of sickness
absenteeism, increased productivity, extension of the retirement age, and a reduction in the
number of disability claims (Baicker et al., 2010; Hunter et al., 2016; Kruger, Yore, Bauer, &
Kohl, 2007; Lemon et al., 2009; van Dongen et al., 2012).
The Centers for Disease Control (CDC) conducted a comprehensive review on physical
activity and the report published in 2018, reaffirmed the models focused on the individual have
not been a success. This report brought attention to behaviors not being limited to
personal/individual choice but are also determined by social and cultural factors as well as
environmental barriers and opportunities (2018 Physical Activity Guidelines Advisory
Committee, 2018). With people spending a substantial amount of their time in the work
environment, organizations are in a favorable position to have a significant impact on behavior
change through social and cultural norms that can be incorporated through comprehensive
wellness programs (Baicker et al., 2010; Shain & Kramer, 2004).
The success of wellness programs has been shown to increase when there is social
support and environmental change. The workplace can provide these elements (Kruger et al.,
2007; Lee et al., 2010). A wellness program, to include physical activity, that is implemented
broadly, communicated effectively, and actively supported from all levels of leadership, has the
greatest opportunity for success (Kruger et al., 2007; Röttger et al., 2017; Schwarzer, 2008).
OD Practitioners are concerned with the overall health of the organization to which
employee engagement contributes. Employee engagement includes effectiveness, efficiency, and
morale. Participants in wellness programs are more engaged employees who are more satisfied
with their job and are more loyal to the company, all of which contributes towards the health of
an organization. There is potential for an organization to have a broader impact through wellness

40
when employee health behaviors change, those changes, may then be transferred into their
family and community environments (Kumar et al., 2009), which conforms to the sociology and
environmental components of OD. Implementing a wellness program through an OD change
initiative can lead to greater success, achieving behavior change, through effective
implementation, which includes communication and leadership support.
Summary
In summary, the research is clear that the rates of obesity and inactivity continue to
increase, which is having a significant economic impact to individuals, organizations, and the
government through increases in medical expenditures and other health related costs. It is also
well documented that increasing physical activity helps maintain a healthy weight, thus
decreasing the risk of many health conditions associated with being overweight or obese.
Regular physical activity has also been shown to improve overall health and wellness, decreasing
the impact of many health, mental and emotional conditions and improving overall wellbeing,
which has a positive impact on individuals, employers, and the government. This research study
is designed to add to the body of knowledge on increasing participation in physical activity and
behavior change. The design supports much of the research on improving participation in health
and wellness activities and suggestions for further exploration, such as, limited variables,
worksite implementation, supportive culture, broad eligibility, and flexibility. Lee et al. (2010)
stated time is considered one of the largest resources of an organization and as such, is viewed as
something that should be accounted for when calculating the cost of workplace wellness. They
further explain that physical activity is viewed as leisure time, which is done for an individual’s
enjoyment and improving one’s personal health. They also suggest that providing an opportunity

41
for physical activity while at work is an investment in future productivity, health, morale, and
commitment.
Dishman et al. (1998) conducted a meta-analysis of worksite physical activity
interventions and found most programs focused on reducing the risk of cardiovascular disease
and neglected resistance training and other physical activities. They concluded that more
attention was needed on varying the mode and amounts of physical activity to improve success.
In a study of perceptions of wellness at work, Farrell and Gest (2005) found cost, difficulty
integrating into the workday, and having to spend more time at the worksite to be significant
barriers to participating in worksite wellness programs. The flexibility of this study, allowing
people to engage in physical activity of their choice and during their workday, at a time and
location of their choice, and at no cost, will reduce and even eliminate these barriers (Farrell &
Geist-Martin, 2005; Nöhammer, Stummer, & Schusterschitz, 2014).

42
Chapter 3: Research Methodology
Intervention Overview
This study explored the experiences of employees engaging in an employer-sponsored
wellness program that provided time as part of their regular work schedule for such physical
activity of their choice. Data collection occurred in a real world setting where a program does not
currently exist. Participants provided data to the researcher on what activities they participated in
and their personal experiences of their participation in the program; not opinions and
assumptions based on a proposed idea or concept.
Participants were provided thirty minutes, at least two times per week as part of their
regular work schedule to engage in a physical activity. Participants chose the type and location of
the activity; such as the gym, outside, community center, studio, pool, etc. The specific days and
time of participation also varied and were determined in coordination with respective
supervisors, taking into consideration what was most desired by the employee as well as current
operations and work commitments, such as pre-scheduled meetings, or other work-coverage
requirements. The general time options were the first thirty minutes of the scheduled work
period, thirty minutes before or after the scheduled lunch period, or the last thirty minutes of the
scheduled work period. Participants provided a weekly report of any activity they performed
along with the time, date, location and an assessment of how it went using a one to five-star
rating.
Research Design
This study is an interpretive examination grounded in the ontology of social
constructionism using a single-site case study methodology, to gain an in-depth understanding of
a workplace wellness program. More specifically, it is to understand if providing employees time

43
to engage in physical activity impacts the number of employees who participate in regular
physical activity and/or the amount of time committed to engaging in physical activity. Elements
of presenteeism and the work environment are also examined for any changes occurring during
program participation.
Data collected is quantitative and qualitative in nature based on participant interpretations
and perceptions of their personal experiences. Participants quantified the strength or degree of
their thoughts, feelings and attitudes based on their experiences. Data collection was through
electronic survey and interview conducted at the workplace during normal duty hours.
Privacy and confidentiality. There was a requirement for participants to coordinate with
their supervisor, so full anonymity of participation was not possible. Qualtrics, the electronic
survey platform used, had the email and IP address collection function turned off to ensure
privacy and that no personally identifiable information was associated with responses.
Confidentiality of the information participants provided in surveys and interviews was
maintained by the researcher. Information that could identify an individual will not be published
in any document. All records were maintained on a password protected OneDrive account to
which only the lead investigator has access. Hand-written notes were destroyed once transcribed
onto the electronic device. In compliance with the University of St. Thomas Institutional Review
Board (IRB), all signed consent forms will be maintained for a minimum of three years upon
completion of the study then destroyed by shredding.
Participant Selection
This study used a single-site, or organization. Within the organization, multiple
employees from all departments participated and provided data.

44
Organization. The researcher sought an organization that met certain criteria to sponsor
this study. The organization, or segment of an organization, had to employ at least 50 employees
but no more than 1,000. Of those employees, all or a segment of at least 50, are either
compensated for their work on an hourly basis, or their pay is based on a 40-hour work week.
Work performed in excess of 40 hours entitles the employee to additional compensation of pay
or time.
The organization hosting this study is Big Brothers Big Sisters (BBBS) of the Greater
Twin Cities, located in St. Paul Minnesota. This 501 (c) (3) not for profit charitable organization
that started in 1920 has become the largest and oldest mentoring organization in the area. The
mission of Big Brothers Big Sisters is to provide children facing adversity with strong and
enduring, professionally supported one-to-one relationships that change their lives for the better
and forever. They accomplish this mission through a variety of programs designed to match a
Big (brother or sister) with an appropriate Little (brother or sister). Training is provided to
mentors, and in addition to any activities each mentorship pair plan and participate in, BBBS has
scheduled and coordinated events every month.
With 65 employees, BBBS of the Greater Twin Cities is considered a small employer.
The organization has three departments and of the 65 employees, 14 are managers. The average
tenure is 3.8 years.
Organization’s health and wellness program. Currently, the only wellness program
offered to employees of BBBS is contribution towards health insurance. Every employee
receives approximately $450 towards health insurance premiums.
Participant eligibility. Participants must be employed by BBBS of the Greater Twin
Cities and expect to continue employment for a minimum of six months following the start of the

45
study. Eligibility also requires a work schedule of at least 32 hours per week and a maximum of
40 hours per week without additional compensation. Compensation for performing job duties
must be based on the number of hours worked per pay period, not on a set salary or per project
basis.
Participant selection. All employees meeting the eligibility requirements were able to
participate, regardless of position, and participation was voluntary. All eligible participants were
given an opportunity to receive an on-site introduction and overview of the study by the
researcher. Those who chose to participate signed a Consent Form (Appendix A), which outlines
the parameters of the study and the voluntary nature of participation including the right to
withdraw at any time during the study. It also informed participants of any risks and benefits,
safety considerations, and the procedures used to protect privacy and confidentiality. This
absolved the researcher and the University of St. Thomas of any liability if an injury occurred
while participating in a physical activity.
Eligible employees from every division and all echelons of the organization were asked
to participate to gain a broad perspective and more diverse and comprehensive data. Leadership
participation was encouraged to demonstrate support for the study and program, however, this
was not achieved. Managers who supervise eligible employees could also participate if they met
eligibility criteria. Managers and supervisors who did not participate were asked to participate in
an interview to gain data on their experience as a supervisor of a participant, but no supervisors
volunteered to participate.
Participant requirements. Employees who volunteered to participate in the program
had ten requirements:

46
1. Sign a letter of consent which will explain the voluntary nature of the study and the right
to withdraw (Appendix A). The consent outlines the program parameters and the
requirements as a participant. Privacy and confidentiality procedures were provided along
with statements on safety, risks and benefits. Contact information for the researcher was
disclosed to anyone with questions or concerns. Participants agreed to provide the
researcher with an email address for communication and survey dissemination purposes.
2. Complete the Physical Activity Readiness Questionnaire (PAR-Q) (Appendix B).
3. Discuss results of the PAR-Q and any planned activity with a medical provider.
4. In consultation with their supervisor, participants completed a Physical Activity Plan
(Appendix C). This activity plan described the participant’s normal work schedule, the
days of the week and time of day they plan to participate in their physical activity, and
the activities they plan to participate in.
5. Complete a Pre-Study Survey to get baseline data before participating in planned
activities (Appendix D).
6. Complete a Physical Activity Barriers Questionnaire (Appendix E).
7. Participate in a physical activity for thirty minutes, 2-3 times a week for approximately 5
months.
8. Complete an activity log and submit weekly activity reports to the researcher with the
activities participated in along with the date and time and any relevant notes they would
like to communicate, such as, changes to their plan, how they felt, what went well, etc.
(Appendix F).
9. Participate in a one-on-one interview with the researcher about their experiences with
behavior change and physical activity.

47
10. Complete a Post-Study Survey (Appendix G).
Data Collection
Data collection occurred through the administration of one electronic questionnaire, three
electronic survey instruments, and one individual interview with the researcher. Participants also
provided a weekly activity report, which informed the researcher of the date, time, and types of
activities in which they participated.
Questionnaire. There was one questionnaire conducted electronically after receiving a
signed consent form. The online platform Qualtrics was used to administer the questionnaire. To
ensure privacy, email and IP address collection features were disabled within the software
program and no personally identifiable information was associated with responses. No
individuals are identified on any reports. Data are password protected, to which only the
researcher has access.
The Physical Activity Readiness Questionnaire (PAR-Q) is a self-assessment used for
discussion with a medical provider prior to participating in any activity (Appendix B). The PAR-
Q was created by the British Columbia Ministry of Health and the Multidisciplinary Board on
Exercise. This self-directed questionnaire is designed to uncover potential health risks associated
with exercise, which includes heart, circulatory, balance, medication, emotional, and joint
problems that could make exercise more difficult or possibly dangerous for some people. The
PAR-Q is typically used as a self-assessment to determine if discussion with a medical provider
is necessary, however, participants were required to gain approval from a medical provider
before participating (Quinn, 2018). An estimated time to complete this questionnaire was three
minutes.

48
Survey. Three different surveys were administered electronically during the study
utilizing Qualtrics as the online survey platform. Responses were analyzed and documented as a
group with no individuals identified on any reports. Survey data are password protected, to
which only the researcher has access.
Two surveys were administered prior to the start of the program. The first survey,
Physical Activity - Barriers Questionnaire (Appendix E) was adapted from the Centers for
Disease Control (CDC) Barriers to Being Active (Appendix H). This instrument provides an
assessment of the following barriers to participating in regular physical activity: lack of time,
social influence, lack of energy, lack of willpower, fear of injury, lack of skill, and lack of
resources. The CDC developed this quiz as a method for individuals to assess their personal
barriers to engaging in regular physical activity (Overcoming barriers to physical activity.2017).
As a survey however, responses to the twenty-one-question assessment were consolidated and
analyzed to assess for any commonality with the study group. Demographic questions were
added to further analyze for any similarities or differences based on age, gender, relationship
status, household size, and number of dependents. The assessment is a four-point matrix rating
scale, which asks respondents how likely they are to say 21 different statements. Each statement
represents one of the five barriers. Response choices were: very likely, somewhat likely,
somewhat unlikely, and very unlikely. The researcher calculated the responses to see if any
categories are more predominant for the group and if any other trends exist among different
demographic categories. An estimated time to complete this survey was three-minutes.
The second Pre-Study Survey (Appendix D) collected data for an initial assessment of
general physical health, emotional health, presenteeism, and productivity. No existing survey
instrument was found that would be most appropriate for this study; however, various

49
instruments designed to evaluate these factors do contain relevant questions and were therefore
used to create the pre- and post-intervention surveys (Appendix I). Three questions from the SF-
36 (Appendix J) were used to gain an assessment of the overall physical and emotional health.
To assess presenteeism, questions were used from the Health and Work Performance
Questionnaire (HPQ) (Appendix K), the Work Limitations Questionnaire (WLQ) (Lerner et al.,
2001), the Health and Work Questionnaire (HWQ) (Shikiar, Halpern, Rentz, & Khan, 2004) and
the SF-36 (Appendix J). An additional seven questions were added to determine the current level
of physical activity, which includes assessing how important physical activity is to the
participants and what activities they most often engage in. Questions are categorical, interval
scales of five or six points, and a ten-point semantic differential scale. Respondents were also
invited to provide open ended comments about the program and their experience.
The second Pre-Study Survey (Appendix D) was administered within two weeks of the
start of the program. It consists of 25 questions in four categories. The first set of questions are
demographic in nature asking age, gender, relationship status, household size and number of
dependents in the household. These questions were used for comparison and any similarities that
may or may not exist. The second category pertains to general health to establish pre-
intervention status on how participants perceive their overall health status. The first two
questions in this category are on a five-point rating scale of excellent, very good, good, fair and
poor and ask participants to rate their physical health and their mental or emotional health. The
third question on health is again a five-point rating scale of not at all, slightly, moderately, quite
a bit, and extremely. This question asks participants to rate if, or to what degree, their physical or
emotional health has interfered with their normal social activities in the past thirty days. The
final question in this category, derived from the SF-36 (Appendix J) consists of nine sub-

50
questions focusing on energy and mood, such as, feeling full of pep, feeling tired, feeling worn
out, having lots of energy, feeling calm and peaceful, and feeling down in the dumps.
Participants rated each question on a six-point matrix scale ranging from all the time to none of
the time.
The next area focused on work activities to assess baseline presenteeism. The first
question, from the HPQ survey (Appendix K), is a six-point matrix rating from all of the time to
none of the time, for seven questions. These questions focus on productivity, efficiency, and
accuracy. The second question, from the SF-36 (Appendix J), has four questions requiring a
response of yes or no. These questions asked participants if they have reduced the amount of
time spent on work or other activities, accomplished less than they would like, were limited in
the kind of work they did or had difficulty performing work or other activities in the past thirty-
days. The next question, a six-point matrix scale, comes from the WLQ (Lerner et al., 2001).
This has four questions, which are rated from all of the time to none of the time or does not
apply. The questions relate to requiring rest breaks, managing work load, ability to stick to
routine or schedule, and being able to keep the mind focused. The next two questions, from the
HPQ, required a yes, no or don’t know response and asked participants if they have experienced
any special work success or achievement in the past 30 days, or any failure, or big mistake in the
past 30 days. The final three questions in this category are on a ten-point rating scale from the
HWQ (Shikiar et al., 2004). These questions asked respondents to rate their work efficiency,
overall quality, and overall volume of work for the past 30 days. The questions require a rating
from a personal perspective and speculation on how their supervisor and co-workers would rate
their performance.

51
The last category is physical activity. The first question assesses how participants value
exercise, by asking them to rate the level of importance from extremely important to not at all
important. The second question asks the participant to assess their current activity level on a
seven-point scale ranging from too much to too little. The third question asks respondents to
provide how many days they have exercised for at least thirty minutes in the past thirty days. The
options are not at all, 1 to 4 times, 5 to 8 times, 9 to 12 times, or more than 12. The next three
questions are on five-point scales asking the average number of times per week they engaged in
strenuous, moderate, and light activity thirty-minutes or more. The final question lists 16
common physical activities, such as, walking, swimming, biking, running, yoga, etc. and asks
respondents to select up to four of what they do most often. Options also included none and other
with an opportunity to provide something that is not on the list. This survey is estimated to take
twelve minutes to complete.
At the end of the study, the third survey was administered (Appendix G). This survey was
the same twenty-five questions as the previous survey to assess for any changes. It also included
five additional questions to gain an understanding of participant experiences and any perceived
changes that may or may not have occurred. Participants were invited to provide open ended
comments as well as request further contact with the researcher.
Interview. Interviews supplemented the surveys to improve the significance of this
study by acquiring richer, more meaningful data. The questions were low risk with no
anticipation of generating strong emotion, distress, embarrassment or stress. The date and time of
the interview with each participant was coordinated in advance and took place in a private room
at the work-site. With a small sample size, all participants were invited to participate in an
interview. Interview sessions were conducted in a private room at the BBBS office on University

52
Avenue, St. Paul, Minnesota. No respondents requested a different location. Interviews were
conducted with fifteen participants.
Supervisors of participants were invited to participate in an interview to gain an
understanding of any benefits they observed or challenged they experienced, but none
volunteered. Eligible employees who chose not to participate in the program were also invited to
participate in an interview to gain an understanding of their decision and any barriers or
challenges associated with their decision, however, no volunteers were obtained.
Activity Report. Each participant submitted a Weekly Activity Report (Appendix F) to
the researcher. Participants received an activity report every Monday via Qualtrics, which asked
for the date and time of the activity, the type of activity performed; such as, walking, swimming,
biking, yoga, etc., the location of the activity; such as, outside, gym, studio, pool, etc., and an
assessment of the activity using a five-star rating scale to indicate how they felt. Information
from these reports support data form surveys and interviews. Any trends, similarities, and
differences in days, times, and activity types may be of interest and significance as well.
Sampling. All employees of Big Brothers Big Sisters of the Greater Twin Cities were
eligible to participate in the study and participation was voluntary. The researcher had no
personal or professional relationship with an eligible employee, which eliminated potential for
researcher bias.
Data Analysis and Reporting
Data from all sources was consolidated and analyzed as a group. Quantitative and
qualitative data was analyzed for themes, similarities and trends within the whole group and any
sub-groups. Similarities and/or differences within the large group or sub-groups that are of
interest or significance will be reported. Pre-intervention survey data was compared to post-
53
intervention survey data. Both change and little to no change will have significance to better
understand behavior change with physical activity and any effect physical activity may or may
not have on presenteeism.
Researcher Bias
As the sole researcher, I did all the data collections including qualitative data through
interviews groups. I have experience and knowledge about physical fitness and workplace
wellness programs that provided a similar program from which I benefited. Personally, I am very
passionate about fitness and have likes and dislikes with physical fitness programs. I
acknowledge my passion for health and fitness and the bias I bring to this study, which have the
potential to influence my role as researcher and interviewer. To mitigate my bias, I was mindful
of other opinions and values and ensured my questioning technique did not influence responses.
I accomplished this through peer review of the questions, rehearsing the process, and doing
practice sessions with individuals from a different organization. Before asking additional/probing
questions, I was mindful of pausing first to ensure my question would not be leading or judging,
but was for the purpose of gaining more clarifying information.
Ethical Considerations
Participation was voluntary. This is a case study using a single site and the researcher did
not anticipate any ethical matters.

54
Chapter 4: Data Analysis and Results
Introduction
The purpose of this study was to expand the body of knowledge of organizational
wellness programs; specifically, physical activity and if providing the opportunity of time has an
impact on the decision to engage in physical activity. Through various survey instruments and
interviews, this study explored barriers to engaging in physical activity, effects of physical
activity on presenteeism and if providing time for physical activity has any effect on the work
environment.
Participants
Twenty-four personnel signed and submitted the consent form, completed the activity
plan and participated in initial surveys. Of the twenty-four, seventeen completed all study
requirements and final survey. For the seven who did not complete the study, two individuals left
employment with the organization, one individual changed their status to part-time and another
employee felt their current workload was too much and they could not prioritize physical activity
into their schedule. The status of the other three is unknown. The following data do not include
early information provided by the seven individuals who did not complete all of the study
requirements.
The average tenure at Big Brothers Big Sisters, according to the Director of Human
Resources is 3.8 years. The sample population is a good representation of this demographic with
an average tenure of 3.6 years.
Of the total sample (N = 17), 82% are within the age range of 25 to 44. The sample
consisted of two men and fifteen women working in various administrative roles and

55
departments. Tables below summarize data received from a questionnaire, surveys and interview.
Table 1 illustrates the demographic results.
Table 1
Percentages of Demographics (N=17)
Demographics N %
Gender Male 2 11.76 Female 15 88.24
Age
18-24 1 5.88 25-34 9 52.94 35-44 5 29.41 45-54 1 5.88 55-64 1 5.88
Relationship Status Never Married 3 17.65 Married 11 64.71 Divorced 1 5.88 Single, but cohabitating with significant other 2 11.76
Dependents None 11 64.71 One 3 17.65 Two 2 11.76 Three 1 5.88
All participants were age 18 or older and no participants exceeded age 64. No participants have more than 3 dependents
As Table 1 shows, the majority of the participants are female. The sample population,
however, is representative of the BBBS staff, which is 79% female. With 82% of participants
within the age range of 25-44, the sample is also a good representation of the average age of the
BBBS staff, which is 35.

56
Activity Plan
Participants provided an activity plan, which included two personal goals for the physical
activity program, the days of the week and time of day they plan to participate, the location(s)
they anticipate using, and activities they plan to participate in. Participants were informed by the
researcher this is only a plan, or intention and they can deviate from it as needed or desired.
The goals varied, but there were ones mentioned by multiple participants, which were to
improve flexibility, improve strength, lose weight, increase distance and increase pace. The days
of the week also varied, with Monday and Wednesday at 59% or Tuesday and Thursday at 30%
being the most common. For intended location(s), many participants stated outside with weather
permitting. Some individuals indicated participation at a gym or fitness studio. Selected activities
varied as well with yoga and walking being the most common, followed by lifting weights and
running.
Physical Activity Readiness Questionnaire (PAR-Q)
Participants completed the Physical Activity Readiness Questionnaire (PAR-Q), which is
a self-assessment of health and their ability to engage in physical activity. The assessment is
designed to uncover potential health risks associated with exercise. In addition to this self-
assessment, participants were required to gain approval from their medical provider, which they
indicated on their activity plan. All participants indicated they received approval by a medical
provider to engage in their planned physical activity.
Barriers to Being Active
The Barriers to Being Active quiz was developed by the Centers for Disease Control
(CDC) (Appendix H). This twenty-one-question quiz is an assessment of the barriers to
participating in regular physical activity that includes the categories of time, social influence,

57
energy, willpower, fear, skills and resources. This self-assessment instrument was adapted and
administered as a Physical Activity Barriers survey (Appendix E) to determine any
commonalities and identify any opportunities for an organization to improve the effectiveness of
their wellness program by mitigating barriers. Participants were asked to describe statements on
a four-point matrix scale of very likely, somewhat likely, somewhat unlikely, or very unlikely.
Results of this survey did not reveal any common themes by demographic categories of
age, gender, marital status, household size, or number of dependents. With a small sample size of
seventeen, this is not unexpected.
Two barriers were rated very unlikely by all respondents, namely (a) not being able to
make time for physical activity in their regular schedule because the day is so busy already and
(b) no family or friends like to do anything active, which eliminates the chance to exercise. The
barriers of getting older and therefore exercise being risky and being afraid of injury or heart
attack were rated unlikely by almost 90% of respondents, which is not unexpected with an
average age of the sample population being approximately 30 years old.
No statements had an average rating of very likely, but three had an average rating of
somewhat likely. Two of the statements described barriers to regular physical activity, which are
being too tired after work to get any exercise done and usual social activities do not include
physical activity. The third statement with an average rating of somewhat likely was that of
having exercise facilities and showers at work would increase the likelihood of exercise,
indicating the lack of on-site facilities as a potential barrier.
Survey Results
A survey was administered at the beginning of the study for an initial assessment of
general physical health, emotional health, components of presenteeism, and current level of

58
physical activity (Appendix D). There was no existing survey found that would meet the
requirements of this study; however, various validated instruments designed to evaluate these
same factors do contain relevant questions and were therefore used to create the pre- and post-
intervention surveys (Appendix I).
The tables below summarize the results of pre-study assessment for the same seventeen
participants who completed all study requirements.
Overall health.
Table 2 summarizes the participants’ self-determination of their physical and emotional
health prior to starting the study. No participants rated their physical or emotional health as poor.
Table 2
Pre-Study – General\ physical and emotional health as determined by participant
Participant Rating of Health N %
Overall physical health Poor (5) 0 0.00 Fair (4) 3 17.65 Good (3) 10 58.82 Very Good (2) 2 11.76 Excellent (1) 2 11.76
Overall mental/emotional health Fair (4) 0 0.00 Good (3) 12 70.59 Very Good (2) 4 23.53 Excellent (1) 1 5.88
Presenteeism.
Pre-study assessment of physical and emotional health factors related to presenteeism Health interfered with normal social activities during past 30-days
Moderately (3) 0 0.00 Slightly (2) 11 64.71 Not at all (1) 6 35.29

59
Felt full of pep during past 30-days
None of the time (6) 0 0.00 A little of the time (5) 2 11.76 Some of the time (4) 7 41.18 A good bit of the time (3) 4 23.53 Most of the time (2) 4 23.53 All of the time (1) 0 0.00
Been very nervous during past 30-days None of the time (6) 5 29.41 A little of the time (5) 4 23.53 Some of the time (4) 6 35.29 A good bit of the time (3) 2 11.76 Most of the time (2) 0 0.00 All of the time (1) 0 0.00
Felt so down, nothing could cheer you up during past 30-days None of the time (6) 11 64.71 A little of the time (5) 6 35.29 Some of the time (4) 0 0.00 A good bit of the time (3) 0 0.00 Most of the time (2) 0 0.00 All of the time (1) 0 0.00
Felt calm and peaceful during past 30-days None of the time (6) 0 0.00 A little of the time (5) 2 11.76 Some of the time (4) 4 23.53 A good bit of the time (3) 9 52.94 Most of the time (2) 2 11.76 All of the time (1) 0 0.00
Had a lot of energy in the past 30-days None of the time (6) 1 5.88 A little of the time (5) 1 5.88 Some of the time (4) 8 47.06 A good bit of the time (3) 5 29.41 Most of the time (2) 2 11.76 All of the time (1) 0 0.00
Felt downhearted and blue in the past 30-days None of the time (6) 5 29.41 A little of the time (5) 12 70.59 Some of the time (4) 0 0.00 A good bit of the time (3) 0 0.00

60
Most of the time (2) 0 0.00 All of the time (1) 0 0.00
Felt worn out in the past 30-days None of the time (6) 1 5.88 A little of the time (5) 5 29.41 Some of the time (4) 7 41.18 A good bit of the time (3) 3 17.65 Most of the time (2) 1 5.88 All of the time (1) 0 0.00
Been a happy person in the past 30-days None of the time (6) 0 0.00 A little of the time (5) 0 0.00 Some of the time (4) 3 17.65 A good bit of the time (3) 4 23.53 Most of the time (2) 10 58.82 All of the time (1) 0 0.00
Felt tired in the past 30-days None of the time (6) 0 0.00 A little of the time (5) 3 17.65 Some of the time (4) 7 41.18 A good bit of the time (3) 5 29.41 Most of the time (2) 2 11.76 All of the time (1) 0 0.00
Table 3
Tables 3 through 7 summarize participant reporting of their efficiency, effectiveness and
other factors of presenteeism in the work environment prior to participating in the study.
Productivity and presenteeism.
Productivity at work over the past thirty-days as determined by participant
Participant Rating of Productivity and Emotional Health N %
Speed of work/productivity higher than expected None of the time (6) 1 5.88 A little of the time (5) 4 23.53 Some of the time (4) 7 41.18 About half of the time (3) 4 23.53 Most of the time (2) 1 5.88

61
All of the time (1) 0 0.00
Speed of work/productivity lower than expected None of the time (6) 0 0.00 A little of the time (5) 6 35.29 Some of the time (4) 8 47.06 About half of the time (3) 3 17.65 Most of the time (2) 0 0.00 All of the time (1) 0 0.00
Did not work when supposed to be working None of the time (6) 0 0.00 A little of the time (5) 12 70.59 Some of the time (4) 5 29.41 About half of the time (3) 0 0.00 Most of the time (2) 0 0.00 All of the time (1) 0 0.00
Did not work as carefully as should None of the time (6) 4 23.53 A little of the time (5) 6 35.29 Some of the time (4) 7 41.18 About half of the time (3) 0 0.00 Most of the time (2) 0 0.00 All of the time (1) 0 0.00
Day-dreaming, not concentrating on work None of the time (6) 2 11.76 A little of the time (5) 8 47.06 Some of the time (4) 6 35.29 About half of the time (3) 0 0.00 Most of the time (2) 0 0.00 All of the time (1) 1 5.88
Trouble controlling emotions around others at work None of the time (6) 7 41.18 A little of the time (5) 8 47.06 Some of the time (4) 2 11.76 About half of the time (3) 0 0.00 Most of the time (2) 0 0.00 All of the time (1) 0 0.00
Got along well with others at work None of the time (6) 0 0.00 A little of the time (5) 1 5.88 Some of the time (4) 0 0.00
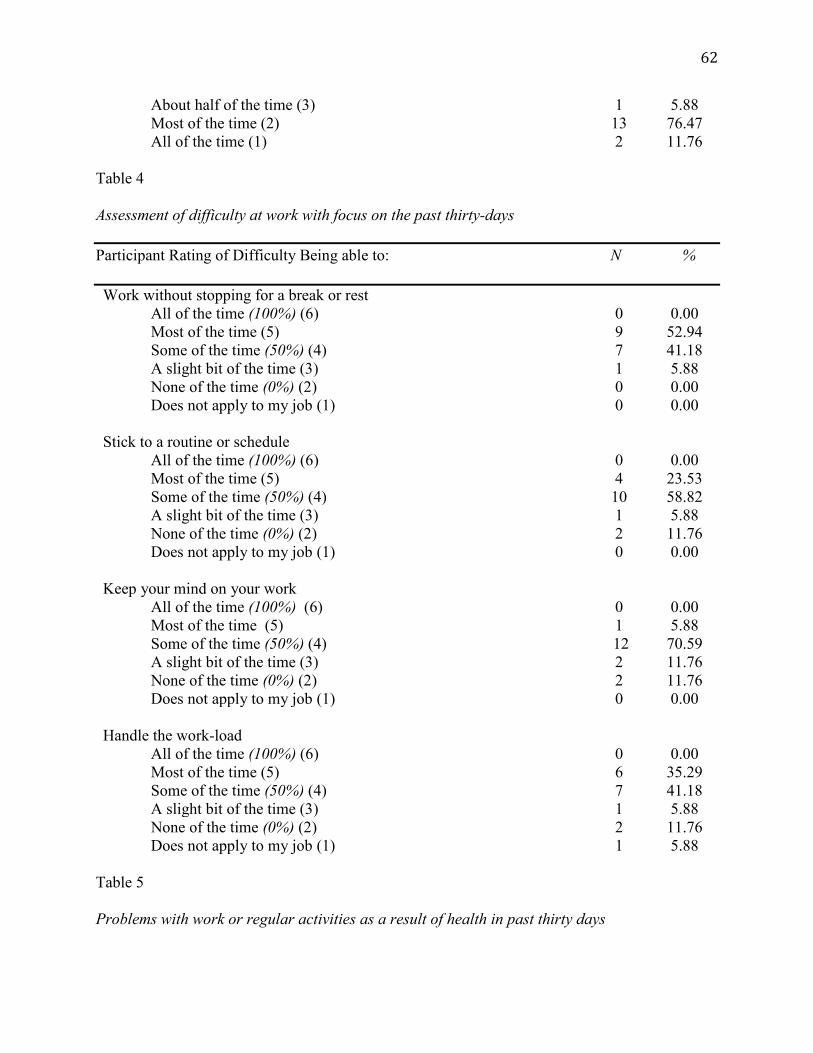
62
About half of the time (3) 1 5.88 Most of the time (2) 13 76.47 All of the time (1) 2 11.76
Table 4 Assessment of difficulty at work with focus on the past thirty-days Participant Rating of Difficulty Being able to: N %
Work without stopping for a break or rest All of the time (100%) (6) 0 0.00 Most of the time (5) 9 52.94 Some of the time (50%) (4) 7 41.18 A slight bit of the time (3) 1 5.88 None of the time (0%) (2) 0 0.00 Does not apply to my job (1) 0 0.00
Stick to a routine or schedule All of the time (100%) (6) 0 0.00 Most of the time (5) 4 23.53 Some of the time (50%) (4) 10 58.82 A slight bit of the time (3) 1 5.88 None of the time (0%) (2) 2 11.76 Does not apply to my job (1) 0 0.00
Keep your mind on your work All of the time (100%) (6) 0 0.00 Most of the time (5) 1 5.88 Some of the time (50%) (4) 12 70.59 A slight bit of the time (3) 2 11.76 None of the time (0%) (2) 2 11.76 Does not apply to my job (1) 0 0.00
Handle the work-load All of the time (100%) (6) 0 0.00 Most of the time (5) 6 35.29 Some of the time (50%) (4) 7 41.18 A slight bit of the time (3) 1 5.88 None of the time (0%) (2) 2 11.76 Does not apply to my job (1) 1 5.88
Table 5 Problems with work or regular activities as a result of health in past thirty days

63
Participant Reporting of Problems with Work or Regular Activities N %
Cut down on the amount of time spent on work or other activities Yes (1) 1 5.88 No (2) 16 94.11
Accomplished less than would like to Yes (1) 5 29.41 No (2) 12 70.59
Limited in kind of work or activities Yes (1) 1 5.88 No (2) 16 94.11
Had difficulty performing work or other activities Yes (1) 3 17.65 No (2) 14 82.35
Table 6 Experience of any work success/achievement or failure/mistake in past thirty days Participant Experience with Success and Failure at Work N %
Experience any special work success or achievement Yes – Several (1) 2 11.76 Yes – One (2) 7 41.18 No (3) 8 47.06
Experience any special failure, mistake, missed deadline Yes – Several (1) 2 11.76 Yes – One (2) 3 17.65 No (3) 12 70.59
Table 7 Participant perception of self, supervisor and co-workers of their efficiency at work, quality of work, and amount of work in past week: Rating on a 1-10 scale with 1 being the worst and 10 being the best Participant perception of efficiency, quality and amount of work Mean Scale of 1-10 (1=worst, 10=best) Efficiency of work as perceived by:
Supervisor 7.53

64
Self 7.59 Co-workers 7.71
Quality of work as perceived by: Supervisor 7.88 Self 7.35 Co-workers 7.94
Amount of work as perceived by: Supervisor 8.53 Self 7.59 Co-workers 7.81
Physical Activity.
Tables 8 through 10 summarize the pre-study results of participant beliefs and habits
related to exercise.
Table 8 Perception of current exercise Importance of and Volume of Exercise N %
How important is exercise to you? Extremely important (1) 2 11.76 Very important (2) 7 41.18 Somewhat important (3) 8 47.06 Not so important (4) 0 0.00 Not at all important (5) 0 0.00
Do you get too much, too little or the right amount of exercise? Much too much (1) 0 0.00 Somewhat too much (2) 0 0.00 Slightly too much (3) 0 0.00 About the right amount (4) 2 11.76 Slightly too little (5) 4 23.53 Somewhat too little (6) 8 47.06 Much too little (7) 3 17.65
As summarized in Table 8, over half, 53% of participants rated exercise as extremely or
very important. However, almost 65% also feel they get somewhat or even much too little
exercise.

65
Table 9 Exercise sessions in the past month and average week Amount and level of exercise sessions in the past 30-days or average week N %
Exercise at least 30-minutes in the past 30-days Not at all (1) 0 0.00 1-4 times (2) 6 35.29 5-8 times (3) 4 23.53 9-12 times (4) 1 5.88 More than 12 times (5) 6 35.29
30-minutes or more of strenuous activity in average week 0 (1) 5 29.41 1 (2) 4 23.53 2 (3) 3 17.65 3 (4) 3 17.65 4 (5) 0 0.00 5 or more (6) 2 11.76
30-minutes or more of moderate activity in average week 0 (1) 1 5.88 1 (2) 5 29.41 2 (3) 2 11.76 3 (4) 2 11.76 4 (5) 4 23.53 5 or more (6) 3 17.65
30-minutes or more of light activity in average week 0 (1) 0 0.00 1 (2) 2 11.76 2 (3) 5 29.41 3 (4) 2 11.76 4 (5) 3 17.65 5 or more (6) 5 29.41
Table 10 Most frequent physical activities Participants were asked what exercise activities they engaged in the most; they could select up to four. The exercises selected most:

66
Activity Percent Walking 81.25 Running 62.50 Weight/resistance training 37.50 Biking 31.25 Yoga 18.75 Changes from pre and post study.
A post program survey was administered, which duplicated the questions from the initial,
pre-program survey for comparison and included additional questions specific to experiences in
the physical activity program. Data in this analysis is from the seventeen-participant sample
completing both surveys and other program requirements.
There was no statistical difference in how participants rated their overall physical and
emotional health between the initial and post program surveys. On both the initial and post
survey, 100% of respondents reported their overall health to be fair to excellent with over 50%
reporting their physical health as good to very good. On the rating scale, a score of 2 is very
good health and a score of 3 is good health. The mean scores were 2.82, which is closer to an
average of good health on the initial survey and 2.65 on the post-program survey, also indicating
an average of good health, but closer to very good. Similar to physical health, 100% of
respondents reported their overall mental or emotional health to be fair to excellent on both the
initial and post survey with similar percentages in each category. The mean of 2.47 on the post is
again closer to a rating of very good when compared to the pre-program survey, which had a
mean of 2.65. The positive change, however, was minimal and not statistically significant. A
larger sample group as well as a longer duration could result in a more meaningful change.
A statistical change between the initial and post survey did occur when asked the extent
to which physical health or emotional problems interfered with normal social activities. On the

67
initial survey, the range was moderate to not at all with two respondents reporting moderately.
The mean score of 1.65 on the initial survey, a score closer to slightly, compared to the post-
program survey mean of 1.35, which is closer to not at all, had a p-value of .045. Six of the
respondents who reported their health having a slight impact on social activities, then reported
none at all on the post-program survey. Only one respondent had a decrease from not at all on
the initial survey to slightly on the post-program survey.
The following tables provide comparative data between the initial and post-program
surveys that indicated a statistical difference with p-values of .05 or less.
Table 11 Energy and Emotions How often did you experience at work in the past 30-days Mean Mean p-value Initial Post Have a lot of energy 3.65 3.06 .035 Feel tired 3.65 4.18 .03
Table 12 Presenteeism How often did you experience at work in the past 30-days Mean Mean p-value Initial Post Speed of work or productivity higher than expected
4 3.18 .02
Did not work at times when you were supposed to be doing work
4.71 5.25 .00
Did not work as carefully as you should 4.82 5.24 .04 Daydreaming and not concentrating on work 4.53 5.06 .05 Have difficulty controlling emotions around people at work
5.29 5.65 .05
The above table indicates participants perceived an increase in their productivity during
the program, a decrease in the frequency of not working at times when they should be, a decrease
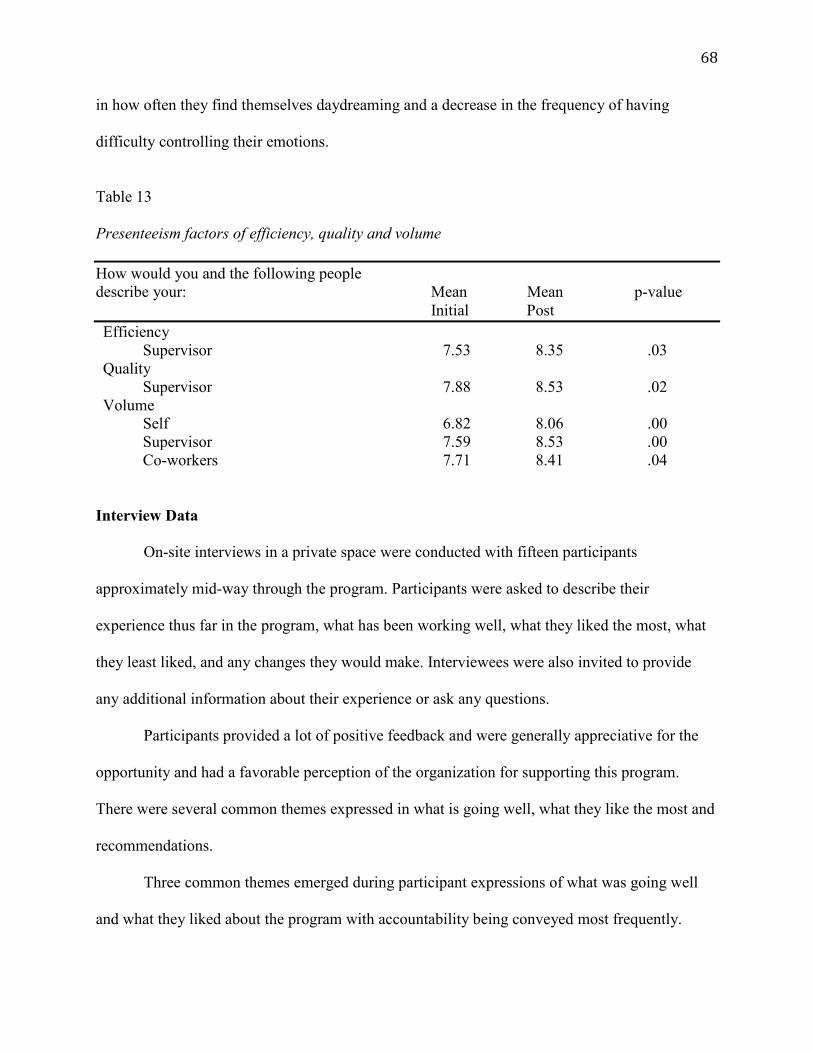
68
in how often they find themselves daydreaming and a decrease in the frequency of having
difficulty controlling their emotions.
Table 13 Presenteeism factors of efficiency, quality and volume How would you and the following people describe your: Mean Mean p-value Initial Post Efficiency Supervisor 7.53 8.35 .03 Quality Supervisor 7.88 8.53 .02 Volume Self 6.82 8.06 .00 Supervisor 7.59 8.53 .00 Co-workers 7.71 8.41 .04
Interview Data On-site interviews in a private space were conducted with fifteen participants
approximately mid-way through the program. Participants were asked to describe their
experience thus far in the program, what has been working well, what they liked the most, what
they least liked, and any changes they would make. Interviewees were also invited to provide
any additional information about their experience or ask any questions.
Participants provided a lot of positive feedback and were generally appreciative for the
opportunity and had a favorable perception of the organization for supporting this program.
There were several common themes expressed in what is going well, what they like the most and
recommendations.
Three common themes emerged during participant expressions of what was going well
and what they liked about the program with accountability being conveyed most frequently.

69
Participants expressed accountability through the weekly activity reports, partnering with other
participants, and putting the time on their work schedule. Another theme was having the
opportunity to schedule physical activity during their workday, which improved their motivation,
allowed more time to devote to physical activity, gave them permission to be more active/move
during the day, and an opportunity to be able to engage in activity at a more reasonable time.
Program flexibility was also mentioned by several participants. They liked the flexibility the
program gave them to make changes to their schedule based on work priorities. Each month
during the four-month period, BBBS also coordinated monthly group events. These activities
were a group walk, an onsite yoga class, tennis, and indoor wall climbing. The group events were
favorably mentioned by several participants during the interviews with the recommendation for
more of them. Improvements participants experienced include more energy, better focus,
walking longer and faster, more steps, and greater motivation. Several discussed benefitting from
a walk in the middle of the day, which helped them gain more focus and energy for the
afternoon.
The primary challenge expressed by participants also corresponds with two of the
common recommendations. The challenge of heavy workload was expressed by many, finding it
difficult to take the thirty minutes. To overcome this barrier, it was recommended greater
leadership support and more coordinated group activities. Leadership encouragement and
support was discussed along with giving them permission without the feeling of guilt to take the
time, even when workload is high. Leadership support was described as their leaders
participating in the program, asking participants about how they are doing, and being a
motivator, encouraging participation. Engaging in an activity with their team was also discussed
as a way to make time for physical activity without feeling like they are abandoning their team.
70
One participant stated she would feel guilty leaving early on a regular non-activity day even
though she arrived before her team members.
Other recommendations included increasing the frequency to three to four times per
week, having occasional meetings for participants to share their experiences and ideas, structured
group events that focus on healthy eating or other healthy habits, and a more formalized
approached with more structure and ongoing support.
The post-program survey asked similar questions from the interview, specifically, what
they liked the most about the program, what they did not like, challenges or barriers, and
recommended changes. Responses to these questions were very similar to those in the
interviews, with accountability, flexibility, group activities, support, and the time incentive being
most favorable. Similarly, lack of engagement from leadership, making this a priority and
helping give permission even when workload is higher was noted as a barrier and area for
improvement. Group activities were mentioned again by several participants as a positive and a
recommendation for more of them.
Changes in participant volume and intensity of physical activity were not significant.
With the small sample size and short duration of this study, this is not surprising. All categories,
however, did increase, showing improvement during the study period.
Summary
The purpose of this case study was to add to the body of knowledge on organizational
wellness by exploring the impact of time and choice on engagement of physical activity and the
effects of engaging in physical activity on presenteeism.
This study was a short duration of four months and the sample size was small,
predominately female and from the same organization. Although results cannot be generalized

71
and are not significant, there are areas of positive change that will be discussed further in
Chapter 5, which support the need for further study using a similar methodology with a larger
group and for a longer duration.

72
Chapter 5: Discussion and Conclusions
Introduction
The worksite has become more sedentary, requiring a purposeful, self-motivated effort by
individuals to be physically active. This has contributed to fewer than half of adults meeting the
recommended guidelines of physical activity that will reduce the risk of poor health. With the
amount of time individuals spend at work and commuting to and from the workplace,
organizations are in an optimal position to implement programs that will influence physical
activity to reverse the increasing sedentary trend. The health benefits associated with physical
activity are also advantageous to the organization, but it is necessary to implement an effective
program that will deliver a return on investment. To be successful, it is important to understand
what elements will remove or reduce barriers to participating in regular physical activity and
those that will contribute to long-term behavior change. This study indicates that providing time
to employees as part of their work-schedule to engage in physical activity could contribute to
participation in regular physical activity and decrease the magnitude of presenteeism.
Chapter format. The format of this chapter will summarize the study and then discuss
the results specific to each research question. Based on the results and discussion,
recommendations for incorporating physical activity into an organization’s wellness program
will be posited along with future research in the area of workplace physical activity. The research
questions for this study are as follows:
1. Is time a barrier to engaging in regular physical activity?
2. What effect does providing employees thirty-minutes, two-three times each week as
part of their regular work schedule to engage in a physical activity have on behavior
change?
73
3. What effect does providing employees thirty-minutes, at least two times each week as
part of their regular work schedule to engage in a physical activity have on
presenteeism?
4. What effect does providing employees thirty-minutes, two to three times each week
as part of their regular work schedule to engage in physical activity have on the work
environment?
Summary of the study. For a four-month period, employees were provided 30 minutes
of their regular work schedule, at least two times a week to engage in a physical activity of their
choice and at a location of their choosing. Participants were able to arrive to work thirty minutes
later than scheduled, add 30 minutes to their lunch break, or leave work 30 minutes prior to the
end of their scheduled work-period.
Discussion
Question 1: Is time a barrier to engaging in regular physical activity?
On the Barriers to Being Active survey, respondents all rated not being able to make time
for physical activity in their regular schedule because the day is so busy already as very unlikely,
which suggests participants feel they are able to make time for physical activity. Responses to
other barrier questions, however, may indicate why participants may not be making the time
during their day for physical activity. Being too tired after work to get exercise done, for
example, had an average rating of somewhat likely with only two respondents ranking this
barrier as very unlikely and eight responding with somewhat likely. Survey and interview data
also suggest the time was valued by participants with a few mentioning they would like to have
the number of opportunities during the week increased.

74
During interview discussions, one of the common themes of what was going well was
that of having the opportunity to put physical activity on their work schedule, which improved
motivation, provided them more time, gave them permission to be more active, and being able to
engage in physical activity at a more reasonable time. Flexibility was also discussed during
interview sessions, which could also be associated with time. With flexibility, not having a strict
schedule, affords greater opportunity for individuals to get time for physical activity. Narrative
comments on the post-program survey reiterated the benefit of the time. When asked what they
liked most, one respondent stated, “being able to count an hour of activity each week toward
work hours.” A couple respondents stated having more time to focus on exercise and health as
something they liked the most, and another respondent stated, “did a better job of making sure to
fit activity in my every day, instead of sitting and talking with co-workers, we would go for a
walk and talk.”
Providing the element of time appears to facilitate overcoming other barriers.
Participants stated the program gave them more motivation, a sense of accountability, and
reminders. On the narrative portion of the post-program survey, one participant stated they
started running again and another stated “I found myself working out more often because I had
more time to do so.”
Workload was a strong theme during interviews as being a challenge or barrier to
participating in the program. This is related to time in that participants sometimes felt they could
not make the time because of their workload. Providing time alone may not be effective in
overcoming this barrier, however, when combined with stronger leadership support, providing
time may then indicate a stronger positive correlation to increasing level of activity.

75
Question 2: What effect does providing employees thirty-minutes two to three times each
week as part of their regular work schedule to engage in a physical activity have on
behavior change?
Discussion points in question 1 above are also relevant to question 2. Providing time had
an impact on behavior by increasing motivation, giving a sense of accountability, and
functioning as a reminder to engage in physical activity.
This study did not show any change in how participants perceive the importance of
exercise, nor was there significant change in the amount of exercise participants are getting.
Some participants indicated the need for stronger support from their leadership to overcome the
reluctance to participate, especially when work level is higher. The emphasis and encouragement
from leadership could also contribute to a change in the culture, which may then strengthen the
importance employees place on exercise.
Interview and narrative data indicate some participants did get more active during their
workday by taking the stairs and walking more. One respondent stated “overall, I realized how
easy it can be to weave fitness into my daily life” and another stated “got me on a schedule and
allowed me more time to work out.”
Question 3: What effect does providing employees thirty-minutes, two to three times
each week as part of their regular work schedule to engage in a physical activity have
on presenteeism?
The survey data indicates physical activity as part of a workplace wellness program may
positively affect elements of presenteeism. Positive change occurred in all areas from the initial
to post survey, however, not all are statistically significant. Limitations in significance could be
attributed to the sample size and the short duration of the study. Despite limitations, there were

76
meaningful changes in participants’ feeling of calmness, level of energy, feeling worn out,
feeling tired, level of productivity, working when they are supposed to, being careful while
working, daydreaming while working, maintaining control of emotions at work, efficiency,
quality of work, and volume of work.
Question 4: What effect does providing employees thirty-minutes, two to three times
each week as part of their regular work schedule to engage in physical activity have
on the work environment?
The most significant data for this question was acquired through interview and survey
narratives. Participants enjoyed being active with their colleagues and the coordinated group
events, which suggests incorporating physical activities in the workplace could have a positive
impact on the work environment. One respondent valued learning more about colleagues in other
departments while participating in group events and for recommended changes, several
participants suggested more group activities. In fact, one participant during the interview stated
they had hoped this program would provide more opportunities to interact with others and
another stated they wanted more colleagues to participate. During an interview session, it was
suggested to have a coordinated monthly meeting to hear what others are doing, learn from one
another and possibly find a partner or develop a group with others interested in the same
activities. A regular meeting or check-in could also increase accountability and help to sustain
motivation.
Recommendations and Further Research This study had a small sample and a short duration; however, areas of positive change
with statistical significance were found. These changes indicate that giving employees time for
physical activity may contribute to adults getting the recommended amount of physical activity

77
to improve and maintain their health and wellbeing. The results support further research in this
area and the need to apply this concept to a larger sample and extend the duration beyond four
months.
Leadership support. The results of this study indicate future research should include
greater emphasis on leadership support with a program champion in an influential leadership
position with the ability to impact all levels of the organization. This individual should be an
advocate for the program and hold subordinate leaders accountable for authorizing and
encouraging participation. Incorporating a strong champion will also make it possible to gain
valuable data from the perspective of a supervisor, such as, any complications with managing
staff participating in the program. They could also provide perspective on elements of
presenteeism with their employees, both participants and non-participants.
The importance of active leadership involvement is supported in the literature on health
behavior change. In the Theory of Reasoned Action, intentions to change are formed by attitude
and the subjective norm. The attitude is how an individual views or evaluates the behavior as
either positive or negative and the subjective norm is formed by the individual’s perception of
social pressure to act or not act on the behavior. Leadership support can make a significant
contribution to increasing awareness, creating a positive attitude, and developing a positive
perception through positive social pressure to participate (Dzewaltowski, Noble, & Shaw, 1990).
Similar to the Theory of Reasoned Action, the Theory of Planned Behavior (TPB), suggests that
behavior is primarily influenced by intention as the motivation that directs and individual’s
efforts. Intention is determined by attitude, perceived social pressure as in Theory of Reasoned
Action, however, the TPB includes perceived behavioral control. With perceived behavior
control, similar to self-efficacy, the individual feels they can succeed by evaluating both internal

78
and external factors. The worksite can contribute to external elements and foster positive
behavioral control by affording time and flexibility to facilitate participation, reduce associated
costs, and encouragement through leadership support. In their study using TPB for a worksite
wellness program, Röttger et al., 2018, participants were able to participate in program activities
two hours each week during their scheduled work-period. Although the organization supported
the study, the expected and desired number of participants was not achieved. The lack of
participation was strongly linked to lack of leadership participation, which gave the perception of
low support, which further perpetuated into the perception that participation would not be
advantageous and viewed negatively (Röttger et al., 2017; Schwarzer, 2008).
Leadership support has a broad, multi-faceted impart. Being a champion effectively
promotes the program and gains participation, but there is also a domino effect. Their advocacy
will strengthen intention in themselves, which then influences the intention in their subordinate
leaders, who will then be influencing their subordinates. Over time, this can have a significant
contribution to cultural change.
Group events. The results of this study also indicate that structured group events
featuring a physical activity may increase program participation, motivation, and morale. These
activities may serve multiple purposes. In addition to getting employees active, these are
opportunities for employees to network and develop relationships that will facilitate other
communications and collaborations within the workplace. One participant stated these activities
were an opportunity for her to get to know co-workers in other departments. Another participant
indicated it helped learn more about one another and strengthen relationships. A
recommendation was for the program to include a periodic gathering for participants to check in,
share ideas and maybe discuss other health related topics.

79
Concluding Statement
This study indicates that providing employees time for engaging in physical activity may
influence participation in regular physical activity and contribute towards improving the health
of employees, which may further influence the rising costs of healthcare and the negative effects
of poor health. More research is needed however to determine if the positive effects achieved in
this study are valid and of greater significance. The validity of results will be strengthened by a
larger sample population and when conducted for a longer duration. Incorporating strong
leadership support and collecting data from the supervisor perspective may increase participation
and provide additional, valuable data that will be beneficial in designing a more effective
program if data shows this model is effective and can deliver desired results.

80
References
2018 Physical Activity Guidelines Advisory Committee. (2018). 2018 physical activity
guidelines advisory committee scientific report. (). Washington, DC:
Abraham, J. M., Barleen, N., Feldman, R., & Nyman, J. A. (2011, Fall; 2013/6). What factors
influence participation in an exercise-focused, employer-based wellness program?48, 221+.
Retrieved from
http://go.galegroup.com/ps/i.do?id=GALE%7CA273900939&v=2.1&u=clic_stthomas&it=r
&p=ITOF&sw=w
Anderson, L. M., Quinn, T. A., Glanz, K., Ramirez, G., Kahwati, L. C., Johnson, D. B., . . . Katz,
D. L. (2009). The effectiveness of worksite nutrition and physical activity interventions for
controlling employee overweight and obesity: A systematic review. American Journal of
Preventive Medicine, 37(4), 340-357. doi:10.1016/j.amepre.2009.07.003
Baicker, K., Cutler, D., & Song, Z. (2010). Workplace wellness programs can generate savings.
Health Affairs, 29(2), 1-8.
Barlow, R. G., & Weber, D. (2012). Determining the value of wellness programs. Brookfield,
WI :
Barwais, F. A. (2013). Physical activity, sedentary behavior and total wellness changes among
sedentary adults: A 4-week randomized controlled trial.(report). London] :
Baskin, M. L., Ard, J., Franklin, F., & Allison, D. B. (2005). Prevalence of obesity in the united
states. The International Association for the Study of Obesity, 6, 5-7.

81
Baxter, S., Campbell, S., Sanderson, K., Cazaly, C., Venn, A., Owen, C., & Palmer, A. J. (2015).
Development of the workplace health savings calculator: A practical tool to measure
economic impact from reduced absenteeism and staff turnover in workplace health
promotion. BMC Research Notes, 8 Retrieved from
http://link.galegroup.com.ezproxy.stthomas.edu/apps/doc/A541620360/HRCA?u=clic_sttho
mas&sid=HRCA&xid=a69848f5
Beauregard, T. A., & Henry, L. C. (2009). Making the link between work-life balance practices
and organizational performance. Human Resource Management Review, 19(1), 9-22.
doi:10.1016/j.hrmr.2008.09.001
Bray, I. (2009). Healthy employees, healthy business; easy, affordable ways to promote
workplace wellness (1st ed.). Berkely, CA: Nolo.
Brown, H. E., Gilson, N. D., Burton, N. W., & Brown, W. J. (2011). Does physical activity
impact on presenteeism and other indicators of workplace well-being? Sports Medicine, 41,
249+. Retrieved from
http://link.galegroup.com.ezproxy.stthomas.edu/apps/doc/A250824397/HRCA?u=clic_sttho
mas&sid=HRCA&xid=5694b9b4
The business benefits of employee wellness programs. (2018). Retrieved from
https://www.americanexpress.com/us/content/GiftCards-MySiteProject/page-level-
components/corporate-programs/corporate-programs-
hub/The_Business_Benefits_of_Wellness_Programs.pdf

82
Carlson, S. A., Fulton, J. E., Pratt, M., Yang, Z., & Adams, E. K. (2015). Inadequate physical
activity and health care expenditures in the united states doi:https://doi-
org.ezproxy.stthomas.edu/10.1016/j.pcad.2014.08.002
Carraher, S. M., & Buckley, M. R. (2008). Attitudes towards benefits and behavioral intentions
and their relationship to absenteeism, performance, and turnover among nurses. Academy of
Health Care Management Journal, 4, 89+. Retrieved from
http://link.galegroup.com.ezproxy.stthomas.edu/apps/doc/A202701465/ITOF?u=clic_sttho
mas&sid=ITOF&xid=91f89834
Chiappetta, T. O. (2005). Managing healthcare costs. Public Personnel Management, 34(4), 313.
Retrieved from
http://stthomas.summon.serialssolutions.com/2.0.0/link/0/eLvHCXMwrV3NS8MwHP0xJ4x
d_JhO6wf04LWuSbM0OYgMsbjTLvNckjSdwtjG0v3_Jt3SDVHw4KWXhFB-
SV_z0tf3ABL8GEffMIFJTkVKiSoYl0xpS54LjqXdnghKRB2qsHdvakGTduW07w4p9784i
NXKDIqlGowQdSsUJ2Qwnk6y54NAjc2Tmn-
q3FRVLbI5gmNkaYVz1h9PsganHQ_belRaQo3p76CcOITNTsEffXmJiR__Z-
31_9z7GZzsdqbhaLuUzqGlFz3oeGF8D7r7WN4LCHy-
UfjRCMhCtTSVuYT37HX68hbtUhaimfPqi0rLaWKdpkzLmEiOhJ0XEkstEqmlfVsJyqTlH
UKlpSIYWQKE1JCLFJWcKcbjpA_txXKhryG0LWpIOeJEIVKW1PYq3IdTMuQlkqQI4M
EVJN_la9qLcScQZiY2xuRNTQK4qru5R6xaC3XY0vdzkxfzec4J4Y5xopu_jXwL3a31Ko4
wvoN2td7oe-j4Yn8B40zNbQ
Claxton, G., Rae, M., Long, M., Damico, A., Foster, G. & Whitmore, H. (2017). 2017 employer
health survey. Retrieved from www.kff.org

83
Conn, V. S., Hafdahl, A. R., Cooper, P. S., Brown, L. M., & Lusk, S. L. (2009). Meta-analysis of
workplace physical activity interventions doi:https://doi-
org.ezproxy.stthomas.edu/10.1016/j.amepre.2009.06.008
Cullen, J. B., Praveen, P. K., & Addae, H. M. (2005). National culture and absenteeism: An
empirical test. The International Journal of Organizational Analysis., 13(4), 343-343-361;
361.
Dishman, R. K., Oldenburg, B., O’Neal, H., & Shephard, R. J. (1998). Worksite physical activity
interventions. American Journal of Preventive Medicine, 15(4), 344-361.
doi:http://dx.doi.org.ezproxy.stthomas.edu/10.1016/S0749-3797(98)00077-4
Dzewaltowski, D. A., Noble, J. M., & Shaw, J. M. (1990). Physical activity participation: Social
cognitive theory versus the theories of reasoned action and planned behavior. Journal of
Sport & Exercise Psychology, 12(4), 388. doi:10.1123/jsep.12.4.388
Eisenberg, A. (2016). ACA: Small employers dropping health benefits. McLean, VA :
Emanuel, J. E., & Wyden, R. (2008, December 10, 2008). Why tie health insurance to a job? The
Wall Street Journal Retrieved from
http://online.wsj.com/article/SB122887085038593345.html
Falkenberg, L. E. (1987). Employee fitness programs: Their impact on the employee and the
organization. Academy of Management.the Academy of Management Review, 12(3), 511.
Retrieved from
http://stthomas.summon.serialssolutions.com/2.0.0/link/0/eLvHCXMw1V09T8MwED1Bh4

84
oFQQFBAckTC0pFPurESAwFNWLogKDMVWI7UkRIpDb9__gjjkPIH2B1EsvRs975fO_
uAHxv9uD0OCFKCU5CHFAWkTSiXDjPjHipOJ4kOEhUUwVbvcn0Gzf9mXoVnf4t8Ka
H732c14rH3rQEa9cILPKtLAmsUiO1xLH9wIgpu_mZ3cPrwmafWNXMTIk2Bh_1Ag9xU
nxZPdmqkinkS3vrIO8lWoVqs0-GZu1Ql4wOC6dbx6u5plbiy0q-
usdty71eZ4_5HSKdNxT8uxa2K_ulkTtZFf2b5bR-4qXz-XEoXO5IOeHP79YKh1q-
albyx9Yqe7k-
gePm5I8WGrFTOODlBMYm8eAMVgYH1ACHDHCPSMGGNGyoKpFACbWvC9jUQB
e2c5jGy_XLq2NWs2FFsdE_5l_AqKxKfgkIu5TOMXFJQN0gyzBJQiZj0MGcZG4asCuYD
EwwHRy9hiML4Q2M6u2e38J4V9dKg_YDfjktxA
Farrell, A., & Geist-Martin, P. (2005). Communicating social health: Perceptions of wellness at
work. Management Communication Quarterly, 18(4), 543-592.
doi:10.1177/0893318904273691
Goetzel, R. Z., Long, S. R., Ozminkowski, R. J., Hawkins, K., Wang, S., & Lynch, W. (2004).
Health, absence, disability, and presenteeism: Cost estimates of certain physical and mental
health conditions affecting U.S. employers. Journal of Occupational and Environmental
Medicine, 46(4), 398-412.
Goetzel, R. Z., & Ozminkowski, R. J. (2008). The health and cost benefits of work site health-
promotion programs. Annual Review of Public Health, 29(1), 303-323.
doi:10.1146/annurev.publhealth.29.020907.090930

85
Hagberg, L. A., & Lindholm, L. (2006). Cost-effectiveness of healthcare-based interventions
aimed at improving physical activity. Scandinavian Journal of Public Health, 34(6), 641.
doi:10.1080/14034940600627853
Health rewards and perks. Retrieved from www.healthpartners.com
Healthy living with medica. Retrieved from www.medica.com
Heath, G. W., & Brown, D. W. (2009). Recommended levels of physical activity and health-
related quality of life among overweight and obese adults in the united states, 2005. Journal
of Physical Activity & Health, 6(4), 403. doi:10.1123/jpah.6.4.403
Hemp, P. (2004). Presenteeism: At work--but out of it. Harvard Business Review, 82(10), 49.
Higgins, T. J., Middleton, K. R., Winner, L., & Janelle, C. M. (2014). Physical activity
interventions differentially affect exercise task and barrier self-efficacy: A meta-analysis.
Health Psychology, 33(8), 891-903.
doi:http://dx.doi.org.ezproxy.stthomas.edu/10.1037/a0033864
Hill, J. O., Sallis, J. F., & Peters, J. C. (2004). Economic analysis of eating and physical activity:
A next step for research and policy change. American Journal of Preventive Medicine,
27(3), 111-116. doi:10.1016/j.amepre.2004.06.010
How much does health insurance cost without a subsidy? (2016). Retrieved from
https://resources.ehealthinsurance.com/affordable-care-act/much-health-insurance-cost-
without-subsidy

86
Hunter, R. F., Brennan, S. F., Tang, J., Smith, O. J., Murray, J., Tully, M. A., . . . Kee, F. (2016).
Effectiveness and cost-effectiveness of a physical activity loyalty scheme for behaviour
change maintenance: A cluster randomised controlled trial. BMC Public Health, 16
Retrieved from
http://link.galegroup.com.ezproxy.stthomas.edu/apps/doc/A468888780/HRCA?u=clic_sttho
mas&sid=HRCA&xid=a0df7584
Keeler, E. B., Manning, W. G., Newhouse, J. P., Sloss, E. M., & Wasserman, J. (1989). The
external costs of a sedentary life-style. American Journal of Public Health, 79(8), 975-981.
Retrieved from
http://ezproxy.stthomas.edu/login?url=http://search.ebscohost.com/login.aspx?direct=true&
db=s3h&AN=4684956&site=ehost-live
Kenworthy, A. L., & Hrivnak, G. A. (2012). Do sweat it: Using a fitness session as an
introduction to research on the relationship between physical and mental states. Journal of
Management Education, 36(2), 264-289. doi:10.1177/1052562911432847
Kohler, S. (2016). Workplace health promotion of large and medium-sized businesses: The
relationship between and predictors of activities in two german states. Intl J of Workplace
Health Mgt, 9(2), 184-201. doi:10.1108/IJWHM-11-2015-0066
Kreausukon, P., Gellert, P., Lippke, S., & Schwarzer, R. (2012). Planning and self-efficacy can
increase fruit and vegetable consumption: A randomized controlled trial. Journal of
Behavioral Medicine, 35(4), 443-451. doi:10.1007/s10865-011-9373-1

87
Kruger, J., Yore, M. M., Bauer, D. R., & Kohl, H. W. (2007). Selected barriers and incentives for
worksite health promotion services and policies. American Journal of Health Promotion,
21(5), 439-447. Retrieved from
https://login.ezproxy.stthomas.edu/login?url=https://search.ebscohost.com/login.aspx?direct
=true&db=s3h&AN=24993423&site=ehost-live
Kumar, S., McCalla, M., & Lybeck, E. (2009). Operational impact of employee wellness
programs: A business case study. International Journal of Productivity and Performance
Management, 58(6), 581-597. doi:10.1108/17410400910977109
Lang, S. S. (2004). Economists coin new word, 'presenteeism,' to describe worker slowdowns
that account for up to 60 percent of employer health costs. Retrieved from
www.news.cornell.edu
Lee, S., Blake, H., & Lloyd, S. (2010). The price is right: Making workplace wellness financially
sustainable. Intl J of Workplace Health Mgt, 3(1), 58-69. doi:10.1108/17538351011031948
Lee, S., Lee, T. W., & Lum, C. (2008). The effects of employee services on organizational
commitment and intentions to quit
Lemon, S. C., Zapka, J., Li, W., Estabrook, B., Magner, R., & Rosal, M. C. (2009). Perceptions
of worksite support and employee obesity, activity, and diet. American Journal of Health
Behavior, 33, 299+. Retrieved from
http://link.galegroup.com.ezproxy.stthomas.edu/apps/doc/A209477229/HRCA?u=clic_sttho
mas&sid=HRCA&xid=137139f5Lerner, D., Amick, B. C., Rogers, W. H., Malspeis, S.,

88
Bungay, K., & Cynn, D. (2001). The work limitations questionnaire. Medical Care, 39(1),
72-85. Retrieved from http://www.jstor.org.ezproxy.stthomas.edu/stable/3767701
Loudenback, T. (2017). Middle-class americans made more money last year than ever before.
Retrieved from www.businessinsider.com
MacGregor, J. N., Caverley, N., & Barton Cunningham, J. (2008). Factors in absenteeism and
presenteeism: Life events and health events. Management Research News, 31(8), 607-615.
doi:10.1108/01409170810892163
Marcason, W. (2007). What are the latest figures for state-specific prevalence of obesity in the
united states? Journal of the American Dietetic Association, , 168.
doi:10.1016/j.jada.2006.11.030
Marshall, A. L. (2004). Challenges and opportunities for promoting physical activity in the
workplace. Journal of Science and Medicine in Sport, 7(1), 60-66. doi:10.1016/S1440-
2440(04)80279-2
Motivation, behavior change, and weight management: Motivation-enforced weight loss
programs conducted via the internet may be the silver bullet for the nation's obesity
epidemic. (2011, 06; 2016/1). Duke Medicine Health News Retrieved from
http://ezproxy.stthomas.edu/login?URL=http://go.galegroup.com.ezproxy.stthomas.edu/ps/i.
do?id=GALE%7CA258242393&sid=summon&v=2.1&u=clic_stthomas&it=r&p=ITOF&s
w=w&asid=aa6e0be15f46797d64f39a645d5c5e18

89
National Association of Health Underwriters. (2013, ). Consumer guide to group health
insurance. Retrieved from http://www.nahu.org/consumer/GroupInsurance.cfm
Nöhammer, E., Stummer, H., & Schusterschitz, C. (2014). Employee perceived barriers to
participation in worksite health promotion. Journal of Public Health, 22(1), 23-31.
doi:http://dx.doi.org.ezproxy.stthomas.edu/10.1007/s10389-013-0586-3
Nutrition, physical activity, and obesity: Keeping americans healthy at every state of life. (2016,
At a Glance 2016: Centers for Disease Control and Prevention, , 11-21.
Ogden, C. L., & Carroll, M. D. (2010). Prevalence of overweight, obesity, and extreme obesity
among adults: United States, trends 1960-1962 through 2007-2008. ().National Center for
Health Statistics.
Ogden, C. L., Carroll, M. D., Fryar, C. D., & Flegal, K. M. (2015). Prevalence of obesity among
adults and youth: United states, 2011-2014 (NCHS data brief, no 219 ed.). Hyattsville, MD:
National Center for Health Statistics.
Ogden, C. L., Carroll, M. D., Kit, B. K., & Flegal, K. M. (2012). Prevalence of obesity in the
united states, 2009-2010. National Center for Health Statistics Data Brief, 82, 1-8.
Ott, B. (2010, 03/10; 2016/1). The real way to reform healthcare; how to change employee
behaviors and improve americans' wellness, one company at a time. Retrieved from
http://ezproxy.stthomas.edu/login?URL=http://go.galegroup.com.ezproxy.stthomas.edu/ps/i.
do?id=GALE%7CA221362956&sid=summon&v=2.1&u=clic_stthomas&it=r&p=ITOF&s
w=w&asid=66d6d7c38e86eeadc4539bcdea05f567

90
Overcoming barriers to physical activity. (2017). Retrieved from
https://www.cdc.gov/physicalactivity/basics/adding-pa/barriers.html
Patel, D. (2011). Participation in fitness-related activities of an incentive-based health
promotion program and hospital costs: A retrospective longitudinal study. Royal Oak, MI :
Physical activity fact sheet. (February 2017). Retrieved from http://www.who.int/news-
room/fact-sheets/detail/physical-activity
Physical activity in the workplace: A guide for employers Johns Hopkins Bloomberg School of
Public Health.
Pronk, N. P. (2009). Physical activity promotion in business and industry: Evidence, context, and
recommendations for a national plan. Champaign, IL :
Quinn, E. (2018). PAR-Q (physical activity readiness questionnaire) for safe exercise. Retrieved
from www.verywellfit.com
Reddick, C. G. (2009). The importance of employee health benefits to public and private sector
organizations. Public Personnel Management, 38(2), 49. Retrieved from
http://stthomas.summon.serialssolutions.com/2.0.0/link/0/eLvHCXMwrV1JawIxFH5YC9JL
F7vZBXLodaqJmczkUMpQlHrorZ6HTBYRrCNm_P9NZlFb6q2XwDALw9v4XvLe-
wCG5HkQ_IoJccaZiBiVKuZZLLVLnhUnmYMnglFRkirspje1YMt25WvffaTctTiI1cr2VS7
7CfHwmDsj7Y-
SycfrHqHG5kUu5jK1RVEW2RzBsZ_65YkdJqNkG6d9HlbNqHQJNWGHg3IZecdn0Gx9
NSUmzff_rr3-

91
n38_h9MamaKkMqULaOllFzpNYXwXTna0vO7Cg9RqxvMlTJ2toflXieSdDaHcIF0TCaO
qzxJlLqSaeWFRkaNqsjYSS4VWa0-uppEtzw5Qvt8YegXT8ejz7T2o6RqCmW-
XC6giKjaYhTgSzs2V4RmhKuKcRoZL7bxRhpIIwt3CqSYRH3DphJDRoQm9Oq6hvcyX-
hYQw1KGjGNOJabGMC4i5U9gacgNzqjqwZOXbFoTdbrF-
q0MOxMba9OtcHtwUz7mfbVYC_njTqPkVC0WKY4cDHZgkuK7g-
_cw0l1lMQCQh6gXaw3-hE6jaa-ASUu4mc
Roberts, S. (2002). More employers see risks, costs of obesity. Business Insurance, 36(16), 1-2.
Robroek, S. J. W., van Lenthe, F.,J., van Empelen, P., & Burdorf, A. (2009). Determinants of
participation in worksite health promotion programmes: A systematic review. The
International Journal of Behavioral Nutrition and Physical Activity, 6, 26-26.
doi:10.1186/1479-5868-6-26
Röttger, S., Maier, J., Krex-Brinkmann, L., Kowalski, J. T., Krick, A., Felfe, J., & Stein, M.
(2017). Social cognitive aspects of the participation in workplace health promotion as
revealed by the theory of planned behavior. Preventive Medicine, 105, 104-108.
doi:10.1016/j.ypmed.2017.09.004
Sari, N. (2009). Physical inactivity and its impact on healthcare utilization. Oxford, UK] :
Scherrer, P., Sheridan, L., Sibson, R., Ryan, M. M., & Henley, N. (2010). Employee engagement
with a corporate physical activity program: The global corporate challenge. International
Journal of Business Studies: A Publication of the Faculty of Business Administration, Edith
Cowan University, 18(1), 125-139. Retrieved from
http://stthomas.summon.serialssolutions.com/2.0.0/link/0/eLvHCXMw1V1LS8NAEF5KD8
92
WL-H5V2JMXiSTZJLsRPGixeBGKrVfDvgKFGoutSP-
9u9lHk1a8e84GNjsfszOTb74BAMU3YbDhEzhKKGGU8CRkiQyZpFjdg5LnNJRI1JyatXp
Tp-Pmaf2q6PRvDe9m-
GqpQctssR1s1062WNYjb4x5uB0fMTJErSYLo64ruDcGbupKM5zdrifa4Nbz6S1P0TTAN2
qEjpswpFr7Y9V6py3oW3tr3TqiNvOtvNGaSrL-
iaT1JQ32RnTBqWeNaOHJqbDtFauqog2u79iPTtcsf__jaWVWP1NlIFsqtkURS4w1Hly3hO
PIqJVvu3gPZeOvI9N1ba_-
yOgqtVW5N25Lz2FMdWaJchViERX2oCst1f4upnx5J6vgdaxVDVTurAP0hxdfAlDBc-
b61vUmW3lNQ8LBZDWTPbBrTQfvDZ72QUdWB6DnTHII3hys4BpWUMMKUuhBAh2
soIMVtLC6hQpU0ICqsd6D6ghMho-
TwVNgZ3ME8zRCQZSpr0eExzhkuj1ZZallznEZ8zIKaUYZYwkRHNE44VQQmeWJCs0x
ESSVOc8lOgbd6qOSpwBiloskE1la5io1J5QixnmCkRBZJgnmZ-
DEHVEhZrNCBbTqngljHJ2Bvj6xYm50WYoNi5z__fgC7BgmiC6n9UF3-
fklL0FvsVzWzLwf86SHnw
Schwarzer, R. (2008). Modeling health behavior change: How to predict and modify the
adoption and maintenance of health behaviors. Applied Psychology, 57(1), 1-29.
doi:10.1111/j.1464-0597.2007.00325.x
Schwetschenau, H. M., O'Brien, W. H., Cunningham, C. J. L., & Jex, S. M. (2008). Barriers to
physical activity in an on-site corporate fitness center. Journal of Occupational Health
Psychology, 13(4), 371-380. doi:10.1037/1076-8998.13.4.371
Serxner, S. A. (2013). A different approach to population health and behavior change: Moving
from incentives to a motivation-based approach. Royal Oak, MI :

93
Shain, M., & Kramer, D. M. (2004). Education: Health promotion in the workplace: Framing the
concept; reviewing the evidence. Occupational and Environmental Medicine, 61(7), 643-
648. Retrieved from http://www.jstor.org.ezproxy.stthomas.edu/stable/27732309
Shikiar, R., Halpern, M. T., Rentz, A. M., & Khan, Z. M. (2004). Development of the health and
work questionnaire (HWQ): An instrument for assessing workplace productivity in relation
to worker health. Work (Reading, Mass.), 22(3), 219.
Strömberg, C., Aboagye, E., Hagberg, J., Bergström, G., & Lohela-Karlsson, M. (2017).
Estimating the effect and economic impact of absenteeism, presenteeism, and work
Environment–Related problems on reductions in productivity from a managerial perspective
doi:https://doi-org.ezproxy.stthomas.edu/10.1016/j.jval.2017.05.008
Thompson, J. (1997). Employee health programmes: A model designed for a local company.
Journal of Workplace Learning, 9(2), 83-87. doi:10.1108/13665629710164986
Tryon, K. (2013). Healthy people benefit everyone. Occupational Health, 65(1), 9. Retrieved
from
http://search.proquest.com.ezproxy.stthomas.edu/docview/1283344313?accountid=14756
Turner, S. L., Thomas, A. M., Wagner, P. J., & Moseley, G. C. (2008). A collaborative approach
to wellness: Diet, exercise, and education to impact behavior change. Journal of the
American Academy of Nurse Practitioners, 20(6), 339-344. doi:10.1111/j.1745-
7599.2008.00325.x

94
Ul Haq, I. (2014). How well is your organisation? Business Strategy Review, 25(1), 76-76.
doi:10.1111/j.1467-8616.2014.01034.x
van Dongen, J.,M., Proper, K. I., van Wier, M.,F., van der Beek, A.,J., Bongers, P. M., van
Mechelen, W., & van Tulder, M.,W. (2012). A systematic review of the cost-effectiveness
of worksite physical activity and/or nutrition programs. Scandinavian Journal of Work,
Environment & Health, 38(5), 393-408. Retrieved from
http://www.jstor.org.ezproxy.stthomas.edu/stable/23558213
Wellness programs and incentives. Retrieved from www.cigna.com
Williams, M. L., Brower, H. H., Ford, L. R., Williams, L. J., & Carraher, S. M. (2008). A
comprehensive model and measure of compensation satisfaction. Journal of Occupational
and Organizational Psychology, 81(4), 639-668. doi:10.1348/096317907X248851
Wilmore, J. H. (2007). The obesity epidemic. Philadelphia, PA] :
Wolf, K. (2010). Making the link between health and productivity at the workplace - a global
perspective. Kawasaki, Japan] :
Zwetsloot, G. I. J. M., van Scheppingen, A. R., Dijkman, A. J., Heinrich, J., & den Besten, H.
(2010). The organizational benefits of investing in workplace health. International Journal
of Workplace Health Management, 3(2), 143-159. doi:10.1108/17538351011055032
Zwetsloot, G., & Pot, F. (2004). The business value of health management. Journal of Business
Ethics, 55(2), 115-124. Retrieved from
http://www.jstor.org.ezproxy.stthomas.edu/stable/25123376

95
Appendix A
Participant Consent
Consent Form
Wellness Program for Physical Activity
I invite you to participate in a research study designed to gain understanding of a wellness program that focuses on physical activity such as exercise during scheduled work periods. You were selected as a possible participant because you are employed full-time by Big Brothers Big Sisters (BBBS) of the Greater Twin Cities and are compensated for your time based on a forty (40) hour per week work schedule. You are eligible for participation if you are authorized to participate in at least low-level physical activity by your medical provider. The following information is provided in order to help you make an informed decision whether or not you would like to participate. Please read this form and ask any questions you may have before agreeing to be in the study. This study is being conducted by myself, Rebecca Wilson, Doctoral Candidate at the University of St. Thomas, Minneapolis, Minnesota along with my Research Advisor, Dr. David Jamieson, Associate Professor in the Organization Development and Change Program. Background Information Work-sites are increasingly interested in developing programs that contribute to improving the health of their employees. Physical activity is an extremely important component of achieving and maintaining good health, but work-site programs incorporating physical activity are limited and often have minimal impact. No studies could be found that evaluated the effect of time on participation in physical activity. The purpose of this study is to explore the effects of providing employees time for physical activity, i.e. exercise, as part of their scheduled work period. The results could help organizations make more informed decisions related to their wellness program and incorporate what is most beneficial.

96
Procedures If you agree to participate in this study, I will ask you to do the following: 1. Read and sign this consent form and provide an email address, and provide the original consent form to researcher; 2. Consult and coordinate with your supervisor about the most appropriate days and times for your participation based on your preference and the needs of the organization; 3. Complete the Physical Activity Readiness Questionnaire and discuss the results and confirm your activity plan with your medical provider; 4. Complete and sign the Activity Plan, confirming completion of the Physical Activity Readiness Questionnaire and authorization from your medical provider; 5. Participate in a physical activity for at least 30 minutes 2 days a week; 6. Complete 3 electronic surveys within the time-frames provided with honest responses; 7. Participate in a one-on-one interview with the researcher; 8. Maintain a log with the date, time, and type of activity you participate in and provide this to the researcher; 9. Give permission to the researcher to access days missed from work in the past year from Human Resources; 10. In addition to 30 minutes, 2 days a week for physical activity, commit approximately 2½ hours of time to complete the questionnaire, surveys, interview and activity log
a. Questionnaire and Surveys: 1 hour b. Activity Plan: 15 minutes c. Interview: 30 minutes d. Activity log: 30 minutes
Risks of Being in the Study There is no risk associated with the data collection portions of this study; however, there is the risk of injury while engaging in a physical activity. The activity(s) you participate in are your choice. It is your responsibility, therefore, to engage in those activities that are safe for you. You will be taking a Physical Activity Readiness Questionnaire, which you will discuss with your medical provider along with your planned activity(s) for their approval or recommendation. If your medical provider recommends a modification to your activity plan, you may still

97
participate. If however, your medical provider does not approve physical activity, you may not participate. Direct Benefits of Being in the Study Direct benefits for participating in the study may include better or improved health. Compensation Neither the researcher nor research advisor is being compensated. There is no cost to participate and participants will not be compensated. Participants will be entered into a drawing for prizes at the conclusion of the study. You will still be entered into the drawings if you choose to withdraw at any point during the study. In the event that this research activity results in an injury, treatment and costs of medical care will be the responsibility of the participant. The University of St. Thomas is not able to offer financial compensation nor absorb the costs of medical treatment should you be injured as a result of participating in this research. Safety As described above, you must select and participate in activities that are within any physical or medical limitation you may have and which your medical provider has approved, such as, walking, jogging, swimming, yoga, Pilates, biking, resistance training, lifting weights, etc. Privacy Your privacy will be protected as much as possible while you participate in this study. Because of the nature of this study, you will be required to inform your supervisor of your participation and therefore will not have anonymity. Others at your workplace may also recognize that you are a participant. In addition to your activity plan, data will be received from you through surveys and an interview. Your email address is requested only for the purpose of administering on-line surveys and will be known only to myself. No identifiable, sensitive information (such as date of birth or social security number) will be requested. All data will be stored electronically on a password protected computer and my UST OneDrive account, which only I have access to and which automatically encrypts all data. Written notes from interviews and observation will have general characterizations and will not include names or any other personal identifiers. Written notes will be destroyed once transcribed onto an electronic device. Only I will have information on participant responses to surveys and interview questions and this information will not be shared.

98
There will be three surveys, which will all be administered electronically using the Qualtrics platform. You will provide me with an email address for receiving the survey link; however, the email and IP addresses will not be collected by the software program. Confidentiality The records of this study will be kept confidential. In any sort of report I publish, I will not include information that will make it possible to identify you. Any hand-written notes will destroyed after they are transcribed onto the electronic device described above. Personal, identifiable information will not be given to your employer; only aggregate findings or themes may be reported to BBBS. All signed consent forms will be kept for a minimum of three years upon completion of the study. Institutional Review Board officials at the University of St. Thomas reserve the right to inspect all research records to ensure compliance. Data obtained through one-on-one interviews will remain confidential. Interviews will be conducted at a time and location of your choosing to ensure comfort and privacy. Voluntary Nature of the Study Your participation in this study is entirely voluntary. Your decision whether or not to participate will not affect your current or future relations with Big Brothers Big Sisters of the Greater Twin Cities, the Big Brothers Big Sisters organization, or the University of St. Thomas. There are no penalties or consequences if you choose not to participate. If you decide to participate, you are free to withdraw at any time without penalty or loss of any benefits to which you are otherwise entitled. You can withdraw by contacting me directly via phone or email. You are also free to decline to answer any questions I may ask. Contacts and Questions You may ask me any questions you have now and any time during or after the research procedures. If you have questions later, you may contact me at (218) 851-1812, or [email protected]. My advisor for this study is Dr. David Jamieson, who can be reached at (612) 757-3373 or [email protected]. You may also contact the University of St. Thomas Institutional Review Board at 651-962-6035 or [email protected] with any questions or concerns. Statement of Consent
99
I have read the above information and have had a conversation with the researcher about this study. My questions have been answered to my satisfaction. I consent to participate in the study. I am at least 18 years of age. I agree to be audio recorded during the interview. You will be given a copy of this form to keep for your records. ________________________________________________________________________ Signature of Study Participant Date ________________________________________________________________________ Print Name of Study Participant ________________________________________________________________________ Preferred Email Address: ________________________________________________________________________ Preferred Phone Contact: ________________________________________________________________________ Signature of Researcher Date
100
Appendix B
Physical Activity Readiness Questionnaire (PAR-Q)
Physical Activity Readiness Questionnaire (PAR-Q) This questionnaire is part of a study I am conducting for a graduate program at the University of St. Thomas. You are receiving this questionnaire because you are employed by Big Brothers Big Sisters (BBBS) at the Greater Twin Cities and you have volunteered to participate in the study which BBBS is hosting. In Institution Research Board (IRB) at the University of St. Thomas has approved this project as part of a doctoral program. Background Information: This questionnaire is designed for you to use in developing an appropriate activity plan to discuss with your medical provider. Please discuss the results of this questionnaire and your planned activity(s) with your medical provider and follow any guidance he/she may have for a safe and healthy experience. Procedures: This is an anonymous questionnaire about your current state of wellness and activity. I am providing you assurance of anonymity. Email and IP addresses will not be collected by this software program; these data collection features are disabled. No personally identifiable information will be associated with your responses. The questionnaire will take approximately 3 minutes to complete. Please complete this questionnaire by August 15. Thank you for your participation and time. Please contact me if you have any comments, concerns, or questions. Rebecca Wilson [email protected] (218) 851-1812

101
If you haven't been active recently, or you are looking to add a new or more intense exercise to your current routine, the PAR-Q can help you decide if you are ready to exercise safely. Being physically active is safe for most people, but you and your medical provider will need to discuss what activities are best for you and the most appropriate intensity level. The PAR-Q is a simple screening tool created by the British Columbia Ministry of Health and the Multidisciplinary Board on Exercise. This form has been adopted directly from the ACSM Standards and Guidelines for Health and Fitness Facilities. All the questions are designed to help uncover any potential health risks associated with exercise. The questions aim to uncover heart, circulatory, balance, medication, emotional, and joint problems that could make exercise difficult, or even dangerous for some people. The most serious potential risk of intense exercise is that of a heart attack or other sudden cardiac event in someone with an un-diagnosed heart condition. I consent to the terms and conditions of this questionnaire.
o Yes (1)
o No (2) Skip To: End of Survey If I consent to the terms and conditions of this questionnaire. = No Has your doctor ever said that you have a heart condition OR high blood pressure?
o Yes (1)
o No (2) Do you feel pain in your chest at rest, during daily activities of living, or when you do physical activity?
o Yes (1)
o No (2) In the past month, have you had chest pain when you were not doing physical activity?
o Yes (1)
o No (2)

102
Do you lose balance because of dizziness OR have you lost consciousness in the past 12 months?
o Yes (1)
o No (2) Do you currently have (or have you had within the last 12 months) a bone, joint, or soft tissue (muscle, ligament, or tendon) problem that could be made worse by a change in your physical activity?
o Yes (1)
o No (2) Is your doctor currently prescribing drugs (for example, water pills) for your blood pressure or heart condition?
o Yes (1)
o No (2) Do you know of any reason why you should not do physical activity?
o Yes (1)
o No (2) Has your doctor ever said that you should do only medically supervised physical activity?
o Yes (1)
o No (2)

103
Appendix C
Physical Activity Plan
Big Brothers Big Sisters of the Greater Twin Cities Physical Activity/Exercise Plan
August XX, 2018
Name:
Section/Department:
Goals: (Provide at least 1) (Examples: Improve Flexibility, Improve Balance, Improve Strength, Try 5 new activities, Increase walking speed, Increase walking distance)
Goal 1:
Goal 2:
Plan Specifications: (Include: time, days, activity(s), and location)
Example:
Activity Plan Time: (i.e. 30 minutes before scheduled work-day; 30 minutes end of scheduled work-day) Days of the week (i.e. Monday and Wednesday; Thursday and Friday)
Location (i.e. home, gym, studio, outside)

104
Planned Activities: (i.e. walk, swim, weight lifting, boxing, yoga, run, etc.)
Approval
I certify that I have taken the Physical Activity Readiness Questionnaire (PAR-Q). I have shared the results of the PAR-Q and my activity plan with my medical provider. My medical provider has approved my activity plan.
Participant Name: ______________________________________________ Participant Signature and Date: ___________________________________
Supervisor Name: _____________________________________________ Supervisor Signature and Date: ____________________________________
105
Appendix D
Pre-Study Survey
Physical Activity - Initial Survey Thank you for participating in my survey. Your feedback is important. This survey is part of a study I am conducting for a graduate program at the University of St. Thomas. You are receiving this survey because you are employed by Big Brothers Big Sisters (BBBS) of the Greater Twin Cities and you have volunteered to participate in this study which BBBS is hosting. The Institution Research Board (IRB) at the University of St. Thomas has approved this project as part of a doctoral program. Background Information: This survey is designed to collect initial data prior to starting a wellness program for physical activity. It is intended to gain baseline information about your current health status, current activity level, and performance at work. Privacy and Confidentiality: Your responses will be confidential. The IP and email addresses will not be collected by this software program. The security of the Qualtrics survey platform for administering and storing survey data has been approved by the University of St. Thomas for all research activity. No identifiable, sensitive information (such as date of birth, or social security number) will be requested. Time: The survey will take approximately 15 minutes. Please complete the survey by (Date) Thank you for your participation. Please contact me if you have any comments, concerns or questions. Rebecca Wilson [email protected] (218) 851-1812 I consent to the terms and conditions of this survey
o Yes (1)
o No (2)
Skip To: End of Survey If I consent to the terms and conditions of this survey = No

106
The following questions will ask for basic demographic information in order to accurately analyze and report study findings What is your age?
o Under 18 (1)
o 18 - 24 (2)
o 25 - 34 (3)
o 35 - 44 (4)
o 45 - 54 (5)
o 55 - 64 (6)
o 65 - 74 (7)
o 75 - 84 (8)
o 85 or older (9) What is your gender?
o Male (1)
o Female (2)

107
Which of the following best describes your current relationship status?
o Married (1)
o Widowed (2)
o Divorced (3)
o Separated (4)
o In a domestic partnership or civil union (5)
o Single, but cohabitating with a significant other (6)
o Never married (7) Including yourself, how many people currently live in your household?
__________________________________
How many dependents are you the primary caregiver for that live in your household?
o None (1)
o 1 (2)
o 2 (3)
o 3 (4)
o 4 (5)
o More than 4 (6) About how long have you been in your current position at BBBS?
▢ Years (1) ________________________________________________
▢ Months (2) ________________________________________________

108
The following questions will ask you about your health to establish baseline data In general, how would you rate your overall physical health?
o Excellent (1)
o Very Good (2)
o Good (3)
o Fair (4)
o Poor (5)
In general, how would you rate your overall mental or emotional health?
o Excellent (1)
o Very Good (2)
o Good (3)
o Fair (4)
o Poor (5)
During the past 30 Days, to what extent has your physical health or emotional problems interfered with your normal social activities with family, friends, neighbors, or groups?
o Not at all (1)
o Slightly (2)
o Moderately (3)
o Quite a bit (4)
o Extremely (5)
The following questions will ask information about your health as it relates to work activities These questions are about how you have felt during the past 30 Days. For each question, please give the one answer that comes closest to the way you have been feeling.

109
All of the Time (1)
Most of the Time (2)
A good Bit of the Time
(3) Some of the
Time (4) A Little of
the Time (5) None of the
Time (6)
Have you felt full of pep? (1) o o o o o o
Have you been a very
nervous person? (2)
o o o o o o Have you
felt so down in the dumps that nothing could cheer you up? (3)
o o o o o o
Have you felt calm
and peaceful?
(4) o o o o o o
Did you have a lot of energy? (5) o o o o o o Have you
felt downhearted
and blue? (6)
o o o o o o
Did you feel worn out?
(7) o o o o o o Have you
been a happy
person? (8) o o o o o o
Did you feel tired? (9) o o o o o o
The following questions are about the time you spent at work over the past 30 Days. How often during that time did you have each of the following experiences? (Check one in each row)

110
All of the Time (1)
Most of the Time (2)
About Half of the Time
(3) Some of the
Time (4) A Little of the Time
(5) None of the
Time (6)
How much of the time was your speed of work or
productivity higher than
expected? (1)
o o o o o o
How much of the time was your speed of
work productivity lower than
expected? (2)
o o o o o o
How much of the time
did you NOT work at times
when you were
supposed to be doing work? (3)
o o o o o o
How much of the time
did you find yourself
NOT working as carefully as you should?
(4)
o o o o o o
How much of the time
did you find yourself
daydreaming and not
concentrating on your
work? (5)
o o o o o o

111
How much of the time
did you have trouble
controlling your
emotions when you
were around people at work? (6)
o o o o o o
How much of the time did you get along well
with others at work? (7)
o o o o o o
During the past 30 Days, have you had any of the following problems with your work or other regular daily activities as a result of your health?
Yes (1) No (2)
Cut down on the amount of time you spent on work or other
activities (1) o o Accomplished less than you
would like (2) o o Were limited in the kind of work
or other activities (3) o o Had difficulty performing the
work or activities (for example, it took extra effort) (4) o o

112
In the past 30 Days, how often did your physical health or emotional problems make it difficult for you do the following:
All of the
time (100%) (1)
Most of the time (2)
Some of the time (About
50%) (3)
A slight bit of the time
(4)
None of the time (0%)
(5)
Does not apply to my
job (6)
Work without
stopping to take breaks or rest (1)
o o o o o o
Stick to a routine or
schedule (2) o o o o o o Keep your mind on
your work (3)
o o o o o o Handle the workload
(4) o o o o o o Over the past 30 Days, did you experience any special work success or achievement?
o Yes - Several (1)
o Yes - One (2)
o No (3)
o I don't know (4) Over the past 30 Days, did you experience any special work failure, make any big mistakes, or miss a deadline?
o Yes - Several (1)
o Yes - One (2)
o No (3)
o I don't know (4)
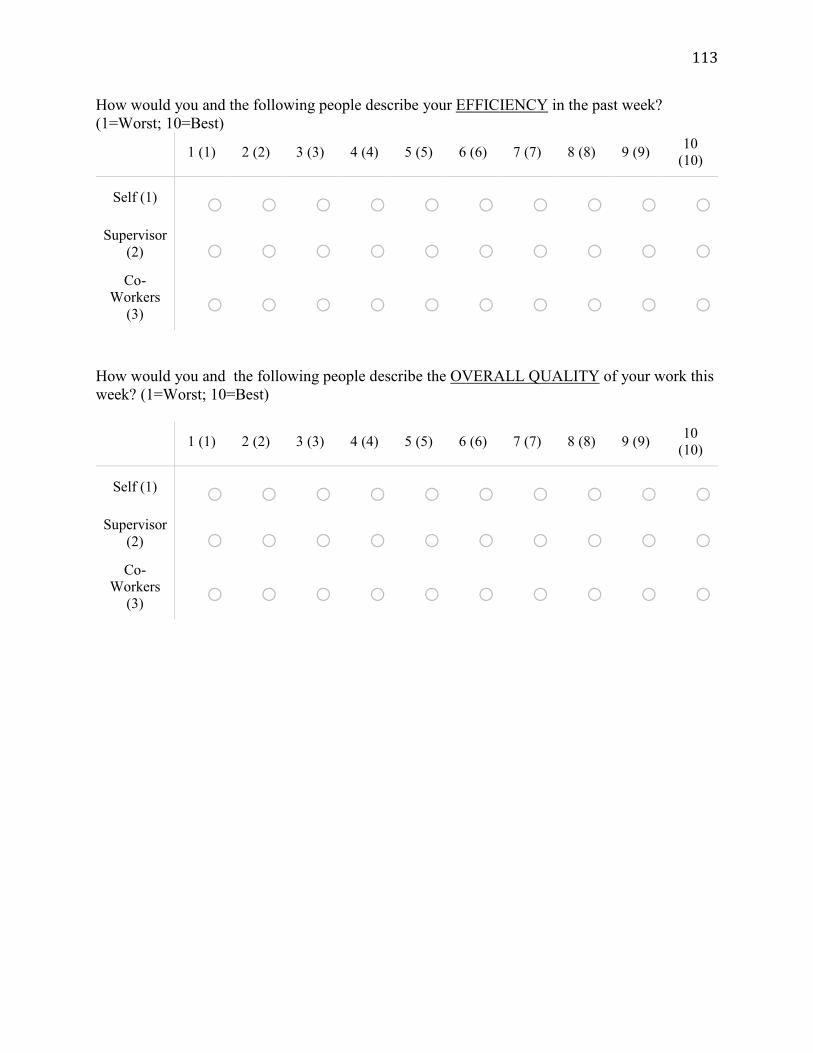
113
How would you and the following people describe your EFFICIENCY in the past week? (1=Worst; 10=Best)
1 (1) 2 (2) 3 (3) 4 (4) 5 (5) 6 (6) 7 (7) 8 (8) 9 (9) 10 (10)
Self (1) o o o o o o o o o o Supervisor
(2) o o o o o o o o o o Co-
Workers (3) o o o o o o o o o o
How would you and the following people describe the OVERALL QUALITY of your work this week? (1=Worst; 10=Best)
1 (1) 2 (2) 3 (3) 4 (4) 5 (5) 6 (6) 7 (7) 8 (8) 9 (9) 10 (10)
Self (1) o o o o o o o o o o Supervisor
(2) o o o o o o o o o o Co-
Workers (3) o o o o o o o o o o
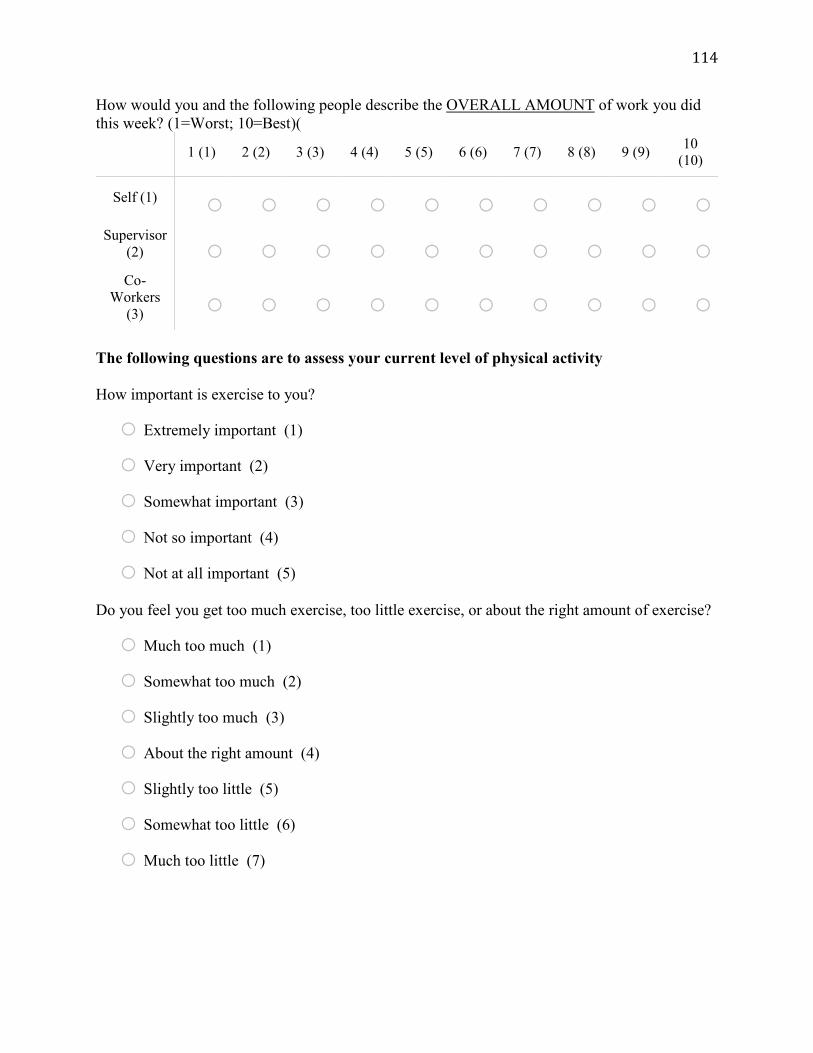
114
How would you and the following people describe the OVERALL AMOUNT of work you did this week? (1=Worst; 10=Best)(
1 (1) 2 (2) 3 (3) 4 (4) 5 (5) 6 (6) 7 (7) 8 (8) 9 (9) 10 (10)
Self (1) o o o o o o o o o o Supervisor
(2) o o o o o o o o o o Co-
Workers (3) o o o o o o o o o o
The following questions are to assess your current level of physical activity How important is exercise to you?
o Extremely important (1)
o Very important (2)
o Somewhat important (3)
o Not so important (4)
o Not at all important (5)
Do you feel you get too much exercise, too little exercise, or about the right amount of exercise?
o Much too much (1)
o Somewhat too much (2)
o Slightly too much (3)
o About the right amount (4)
o Slightly too little (5)
o Somewhat too little (6)
o Much too little (7)

115
In the past 30 Days, how many times did you exercise for at least 30 Minutes?
o Not at all (1)
o 1 to 4 times (2)
o 5 to 8 times (3)
o 9 to 12 times (4)
o More than 12 times (5) About how many times in the average week do you engage in 30 minutes of strenuous activity (i.e. running or jogging)?
o 0 (1)
o 1 (2)
o 2 (3)
o 3 (4)
o 4 (5)
o 5 or more (6) About how many times in the average week do you engage in 30 minutes or more of moderate activity (i.e. brisk walking, light bicycling)?
o 0 (1)
o 1 (2)
o 2 (3)
o 3 (4)
o 4 (5)
o 5 or more (6)

116
About how many times in the average week do you engage in 30 minutes or more of light activity (i.e. leisurely walking, gardening, cleaning around the house)?
o 0 (1)
o 1 (2)
o 2 (3)
o 3 (4)
o 4 (5)
o 5 or more (6)
What do you do most often for exercise? (Select up to 4)
▢ Walk (1)
▢ Running (2)
▢ Bike (3)
▢ Swim (4)
▢ Spin (5)
▢ Weight Lifting/Resistance Training (6)
▢ Dance (7)
▢ Aerobics (8)
▢ Pilates (9)
▢ Martial Arts (10)
▢ Play a team sport (11)
▢ Boxing (12)
▢ Tennis (13)
▢ Golf (without cart) (14)
▢ Cross-Fit (15)
▢ Yoga (16)
▢ None (17)
▢ Other (18) ________________________________________________
▢ Other (19) ________________________________________________
▢ Other (20) ________________________________________________

117
Please provide any comments or concerns. Please include contact information if you have a question or would like to discuss anything with me.
________________________________________________________________
________________________________________________________________
________________________________________________________________
________________________________________________________________
________________________________________________________________ Contact Information (Optional)
▢ Name (1) ________________________________________________
▢ Email (2) ________________________________________________
▢ Phone (3) ________________________________________________ Thank you again for your time and participation. I look forward to meeting with many of you to discuss your experiences, successes, challenges, and goals for health and physical activity.

118
Appendix E
Physical Activity Barriers Questionnaire
Thank you for participating in my survey. Your feedback is important. This survey is part of a study I am conducting for a graduate program at the University of St. Thomas. You are receiving this survey because you are employed by Big Brothers Big Sisters (BBBS) of the Greater Twin Cities and you have volunteered to participate in this study which BBBS is hosting. The Institution Research Board (IRB) at the University of St. Thomas has approved this project as part of a doctoral program. Background Information: This survey is designed to collect initial data prior to starting a wellness program for physical activity. It is intended to gain baseline information about current barriers to physical activity. Privacy and Confidentiality: Your responses will be confidential. The IP and email addresses will not be collected by this software program. The security of the Qualtrics survey platform for administering and storing survey data has been approved by the University of St. Thomas for all research activity. No identifiable, sensitive information (such as date of birth or social security number) will be requested. Time: The survey will take approximately 2 minutes to complete. Please complete the survey by (Date). Thank you for your participation. Please contact me if you have any questions or comments. Rebecca Wilson [email protected] (218) 851-1812 I consent to the terms and conditions of this questionnaire.
o Yes (1)
o No (2) Skip To: End of Survey If I consent to the terms and conditions of this questionnaire. = No

119
What is your age?
o Under 18 (1)
o 18 - 24 (2)
o 25 - 34 (3)
o 35 - 44 (4)
o 45 - 54 (5)
o 55 - 64 (6)
o 65 - 74 (7)
o 75 - 84 (8)
o 85 or older (9) What is your gender?
o Male (1)
o Female (2) Which of the following best describes your current relationship status?
o Married (1)
o Widowed (2)
o Divorced (3)
o Separated (4)
o In a domestic partnership or civil union (5)
o Single, but co-habituating with a significant other (6)
o Single, never married (7) Including yourself, how many people currently live in your household?
________________________________________________________________
120
How many dependents are you the primary caregiver for that live in your household?
o None (1)
o 1 (2)
o 2 (3)
o 3 (4)
o 4 (5)
o More than 4 (6)

121
How likely are you to say?
Very Likely (1) Somewhat Likely (2)
Somewhat Unlikely (3)
Very Unlikely (4)
My day is so busy now, I just don't think I can make the time to include physical activity in my
regular schedule (1)
o o o o
None of my family members or friends like to
do anything active, so I don't have a chance to
exercise (2)
o o o o
I'm just too tired after work to get
any exercise done (3)
o o o o I've been
thinking about getting more
exercise, but I just can't seem
to get started (4)
o o o o
I'm getting older, so
exercise can be risky (5)
o o o o

122
How likely are you to say?
Very Likely (1) Somewhat Likely (2)
Somewhat Unlikely (3)
Very Unlikely (4)
I don't get enough exercise because I never
learned the skills for any sport or
activity (1)
o o o o
I don't have access to jogging trails, swimming
pools, bike paths, etc. (2)
o o o o
Physical activity takes too much time away from
other commitments -
time, work, family, etc. (3)
o o o o
I'm embarrassed about how I will
look when I exercise with
others (4)
o o o o
I don't get enough sleep as
it is. I just couldn't get up early or stay up late to get more
exercise (5)
o o o o

123
How likely are you to say?
Very likely (1) Somewhat Likely (2)
Somewhat Unlikely (3)
Very Unlikely (4)
My usual social activities with
family or friends do not include
physical activity (1)
o o o o
I'm too tired during the week and I need the
weekend to catch up on my
rest (2)
o o o o
I want to get more exercise, but I just can't seem to make myself stick to anything (3)
o o o o
I'm afraid I might injure
myself or have a heart attack (4)
o o o o I'm not good
enough at any physical activity to make it fun
(5)
o o o o
If we had exercise
facilities and showers at work, then I would be more likely to exercise (6)
o o o o

124
Appendix F
Weekly Activity Report
Weekly Activity Report
Please complete your weekly activity report. What did you do? How did it go? Thank you for your time and have another great week! Session 1: Date and Time
o Date (1) ________________________________________________
o Duration (2) ___________________________________________ Session 1: Activity
________________________________________________________________ Session 1: Location
________________________________________________________________ Q6 How did it go?
Just lucky I
did something (1)
Was better than nothing
(2) So-So (3) Pretty good
(4)
Felt Great! Ready for more! (5)
How did it go? (1) o o o o o
Session 2: Date and Time
o Date (1) ________________________________________________
o Time (2) ________________________________________________ Session 2: Activity
________________________________________________________________

125
Session 2: Location
________________________________________________________________ How did it go?
Just lucky I
did something (1)
Was better than nothing
(2) So-So (3) Pretty Good
(4)
Felt Great! Ready for more! (5)
How did it go? (1) o o o o o

126
Appendix G
Post Study Survey
Thank you for participating in my survey. Your feedback is important. This survey is part of a study I am conducting for a graduate program at the University of St. Thomas. You are receiving this survey because you are employed by Big Brothers Big Sisters (BBBS) of the Greater Twin Cities and you have volunteered to participate in this study which BBBS is hosting. The Institution Research Board (IRB) at the University of St. Thomas has approved this project as part of a doctoral program. Background Information: This survey is designed to collect data after participating in a wellness program for physical activity. Responses will be used to understand experiences of participants during their participation and if there are any common or shared events among participants. Privacy and Confidentiality: Your responses will be confidential. The IP and email addresses will not be collected by this software program. The security of the Qualtrics survey platform for administering and storing survey data has been approved by the University of St. Thomas for all research activity. No identifiable, sensitive information (such as date of birth, or social security number) will be requested. Time: The survey will take approximately 15 minutes. Please complete the survey by (Date) Thank you for your participation. Please contact me if you have any comments, concerns or questions. Rebecca Wilson [email protected] (218) 851-1812 I consent to the terms and conditions of this survey
o Yes (1)
o No (2) Skip To: End of Survey If I consent to the terms and conditions of this survey = No

127
The following questions will ask for basic demographic information in order to accurately analyze and report study findings What is your age?
o Under 18 (1)
o 18 - 24 (2)
o 25 - 34 (3)
o 35 - 44 (4)
o 45 - 54 (5)
o 55 - 64 (6)
o 65 - 74 (7)
o 75 - 84 (8)
o 85 or older (9) What is your gender?
o Male (1)
o Female (2) Which of the following best describes your current relationship status?
o Married (1)
o Widowed (2)
o Divorced (3)
o Separated (4)
o In a domestic partnership or civil union (5)
o Single, but cohabitating with a significant other (6)
o Never married (7)

128
Including yourself, how many people currently live in your household? How many dependents are you the primary caregiver for that live in your household?
o None (1)
o 1 (2)
o 2 (3)
o 3 (4)
o 4 (5)
o More than 4 (6) About how long have you been in your current position at BBBS?
▢ Years (1) ________________________________________________
▢ Months (2) ________________________________________________ The following questions will ask you about your health In general, how would you rate your overall physical health?
o Excellent (1)
o Very Good (2)
o Good (3)
o Fair (4)
o Poor (5)
o Average (6)
o Poor (7)

129
In general, how would you rate your overall mental or emotional health?
o Excellent (1)
o Very Good (2)
o Good (3)
o Fair (4)
o Poor (5)
o Average (6)
o Poor (7) During the past 30 Days, to what extent has your physical health or emotional problems interfered with your normal social activities with family, friends, neighbors, or groups?
o Not at all (1)
o Slightly (2)
o Moderately (3)
o Quite a bit (4)
o Extremely (5)

130
The following questions will ask information about your health as it relates to work activities These questions are about how you have felt during the past 30 Days. For each question, please give the one answer that comes closest to the way you have been feeling.

131
All of the Time (1)
Most of the Time (2)
A good Bit of the Time
(3) Some of the
Time (4) A Little of
the Time (5) None of the
Time (6)
Did you feel full of pep?
(1) o o o o o o Have you
been a very nervous
person? (2) o o o o o o
Have you felt so down in the dumps that nothing could cheer you up? (3)
o o o o o o
Have you felt calm
and peaceful?
(4) o o o o o o
Did you have a lot of energy? (5) o o o o o o Have you
felt downhearted
and blue? (6)
o o o o o o
Did you feel worn out?
(7) o o o o o o Have you
been a happy
person? (8) o o o o o o
Did you feel tired? (9) o o o o o o

132
The following questions are about the time you spent at work over the past 30 Days. How often during that time did you have each of the following experiences? (Check one in each row)

133
All of the Time (1)
Most of the Time (2)
About Half of the Time
(3) Some of the
Time (4) A Little of the Time
(5) None of the
Time (6)
How much of the time was your speed of work or
productivity higher than
expected? (1)
o o o o o o
How much of the time was your speed of
work productivity lower than
expected? (2)
o o o o o o
How much of the time
did you NOT work at times
when you were
supposed to be doing work? (3)
o o o o o o
How much of the time
did you find yourself
NOT working as carefully as you should?
(4)
o o o o o o
How much of the time
did you find yourself
daydreaming and not
concentrating on your
work? (5)
o o o o o o

134
How much of the time
did you have trouble
controlling your
emotions when you
were around people at work? (6)
o o o o o o
How much of the time did you get along well
with others at work? (7)
o o o o o o
During the past 30 Days, have you had any of the following problems with your work or other regular daily activities as a result of your health?
Yes (1) No (2)
Cut down on the amount of time you spent on work or other
activities (1) o o Accomplished less than you
would like (2) o o Were limited in the kind of work
or other activities (3) o o Had difficulty performing the
work or activities (for example, it took extra effort) (4) o o

135
In the past 30 Days, how often did your physical health or emotional problems make it difficult for you do the following:
All of the
time (100%) (1)
Most of the time (2)
Some of the time (About
50%) (3)
A slight bit of the time
(4)
None of the time (0%)
(5)
Does not apply to my
job (6)
Do you work
without stopping to take breaks or rest (1)
o o o o o o
Stick to a routine or
schedule (2) o o o o o o Keep your mind on
your work (3)
o o o o o o Handle the workload
(4) o o o o o o Over the past 30 Days, did you experience any special work success or achievement?
o Yes - Several (1)
o Yes - One (2)
o No (3)
o I don't know (4) Over the past 30 Days, did you experience any special work failure, make any big mistakes, or miss a deadline?
o Yes - Several (1)
o Yes - One (2)
o No (3)
o I don't know (4)

136
How would you and the following people describe your EFFICIENCY in the past week? (1=Worst; 10=Best)
1 (1) 2 (2) 3 (3) 4 (4) 5 (5) 6 (6) 7 (7) 8 (8) 9 (9) 10 (10)
Self (1) o o o o o o o o o o Supervisor
(2) o o o o o o o o o o Co-
Workers (3) o o o o o o o o o o
How would you and the following people describe the OVERALL QUALITY of your work this week? (1=Worst; 10=Best)
1 (1) 2 (2) 3 (3) 4 (4) 5 (5) 6 (6) 7 (7) 8 (8) 9 (9) 10 (10)
Self (1) o o o o o o o o o o Supervisor
(2) o o o o o o o o o o Co-
Workers (3) o o o o o o o o o o
How would you and the following people describe the OVERALL AMOUNT of work you did this week? (1=Worst; 10=Best)(
1 (1) 2 (2) 3 (3) 4 (4) 5 (5) 6 (6) 7 (7) 8 (8) 9 (9) 10 (10)
Self (1) o o o o o o o o o o Supervisor
(2) o o o o o o o o o o Co-
Workers (3) o o o o o o o o o o

137
The following questions are to assess your current level of physical activity How important is exercise to you?
o Extremely important (1)
o Very important (2)
o Somewhat important (3)
o Not so important (4)
o Not at all important (5) Do you feel you get too much exercise, too little exercise, or about the right amount of exercise?
o Much too much (1)
o Somewhat too much (2)
o Slightly too much (3)
o About the right amount (4)
o Slightly too little (5)
o Somewhat too little (6)
o Much too little (7) In the past 30 Days, how many times did you exercise for at least 30 Minutes?
o Not at all (1)
o 1 to 4 times (2)
o 5 to 8 times (3)
o 9 to 12 times (4)
o More than 12 times (5)

138
About how many times in the average week do you engage in 30 minutes of strenuous activity (i.e. running or jogging)?
o 0 (1)
o 1 (2)
o 2 (3)
o 3 (4)
o 4 (5)
o 5 or more (6) About how many times in the average week do you engage in 30 minutes or more of moderate activity (i.e. brisk walking, light bicycling)?
o 0 (1)
o 1 (2)
o 2 (3)
o 3 (4)
o 4 (5)
o 5 or more (6) About how many times in the average week do you engage in 30 minutes or more of light activity (i.e. leisurely walking, gardening, cleaning around the house)?
o 0 (1)
o 1 (2)
o 2 (3)
o 3 (4)
o 4 (5)
o 5 or more (6)

139
What do you do most often for exercise? (Select up to 4)
▢ Walk (1)
▢ Running (2)
▢ Bike (3)
▢ Swim (4)
▢ Spin (5)
▢ Weight Lifting/Resistance Training (6)
▢ Dance (7)
▢ Aerobics (8)
▢ Pilates (9)
▢ Martial Arts (10)
▢ Play a team sport (11)
▢ Boxing (12)
▢ Tennis (13)
▢ Golf (without cart) (14)
▢ Cross-Fit (15)
▢ Yoga (16)
▢ None (17)
▢ Other (18) ________________________________________________
▢ Other (19) ________________________________________________
▢ Other (20) ________________________________________________ The following questions are related to your experience as a participant in the physical activity program Please describe what you liked most about the physical activity program you participated in.
________________________________________________________________
________________________________________________________________
________________________________________________________________
________________________________________________________________
________________________________________________________________

140
Please describe what you liked least about the physical activity program you participated in.
________________________________________________________________
________________________________________________________________
________________________________________________________________
________________________________________________________________
________________________________________________________________ Please describe any changes you would recommend to the physical activity program.
________________________________________________________________
________________________________________________________________
________________________________________________________________
________________________________________________________________
________________________________________________________________ Please describe any challenges or barriers you had with your participation in the physical activity program.
________________________________________________________________
________________________________________________________________
________________________________________________________________
________________________________________________________________
________________________________________________________________ Please describe any successes you experienced while participating in the physical activity program.
________________________________________________________________
________________________________________________________________
________________________________________________________________
________________________________________________________________

141
________________________________________________________________ (Optional) Please provide any additional comments. Provide contact information if you would to discuss anything directly with me.
________________________________________________________________
________________________________________________________________
________________________________________________________________
________________________________________________________________
________________________________________________________________ Thank you again for your time and participation. I look forward to meeting with many of you to discuss your experiences, successes and challenges over the past few months.

142
Appendix H
CDC Barriers to Being Active
Barriers to Being Active What keeps you from being more active?
Directions: Listed below are reasons that people give to describe why they do not get as much physical activity as they think they should. Please read each statement and indicate how likely you are to say each of the following statements:
How likely are you to say? Very likely Somewhat
likely Somewhat
unlikely Very
unlikely 1. My day is so busy now, I just don’t think I can make the time to include physical activity in my regular schedule.
3 2 1 0
2. None of my family members or friends like to do anything active, so I don’t have a chance to exercise.
3 2 1 0
3. I’m just too tired after work to get any exercise. 3 2 1 0 4. I’ve been thinking about getting more exercise, but I just can’t seem to get started 3 2 1 0
5. I’m getting older so exercise can be risky. 3 2 1 0 6. I don’t get enough exercise because I have never learned the skills for any sport. 3 2 1 0
7. I don’t have access to jogging trails, swimming pools, bike paths, etc. 3 2 1 0
8. Physical activity takes too much time away from other commitments—time, work, family, etc.
3 2 1 0
9. I’m embarrassed about how I will look when I exercise with others. 3 2 1 0 10. I don’t get enough sleep as it is. I just couldn’t get up early or stay up late to get some exercise.
3 2 1 0
11. It’s easier for me to find excuses not to exercise than to go out to do something. 3 2 1 0
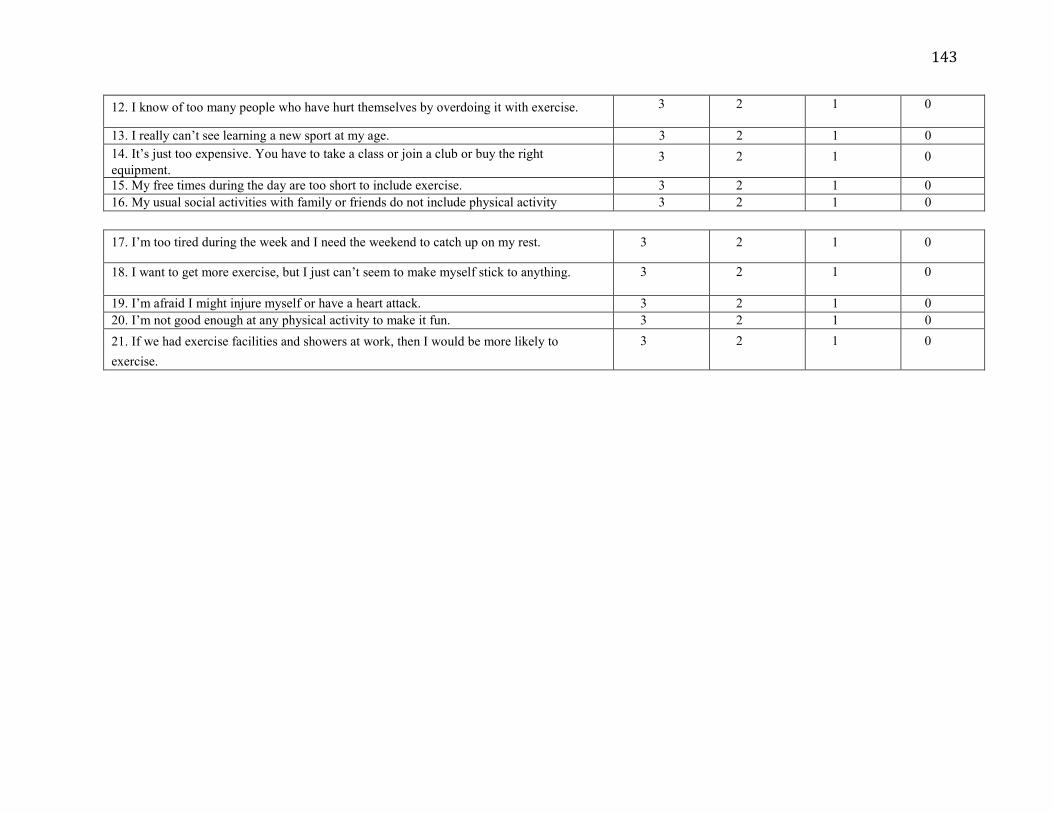
143
12. I know of too many people who have hurt themselves by overdoing it with exercise. 3 2 1 0
13. I really can’t see learning a new sport at my age. 3 2 1 0 14. It’s just too expensive. You have to take a class or join a club or buy the right equipment.
3 2 1 0
15. My free times during the day are too short to include exercise. 3 2 1 0 16. My usual social activities with family or friends do not include physical activity 3 2 1 0
17. I’m too tired during the week and I need the weekend to catch up on my rest. 3 2 1 0
18. I want to get more exercise, but I just can’t seem to make myself stick to anything. 3 2 1 0
19. I’m afraid I might injure myself or have a heart attack. 3 2 1 0 20. I’m not good enough at any physical activity to make it fun. 3 2 1 0 21. If we had exercise facilities and showers at work, then I would be more likely to exercise.
3 2 1 0

144
Follow these instructions to score yourself: • Enter the circled number in the spaces provided, putting together the number for statement 1 on line 1, statement 2 on line
2, and so on. • Add the three scores on each line. Your barriers to physical activity fall into one or more of seven categories: lack of time,
social influences, lack of energy, lack of willpower, fear of injury, lack of skill, and lack of resources. A score of 5 or above in any category shows that this is an important barrier for you to overcome.
+ + =
1 8 15 Lack of time
+ + =
2 9 16 Social influence
+ + = 10 17 Lack of energy
3 + + =
4 11 18 Lack of willpower
+ + = 12 19 Fear of injury
5 + + =
13 20 Lack of skill 6 + + =
14 21 Lack of resource

145
Appendix I
Summary of Survey Instruments
Various questions from the following survey instruments were consolidated and used in the development of the pre and post program surveys.
Name Abbreviation Description Reference/Sponsor Short Form 36 SF-36 Health related quality of life,
measuring different aspects of health status regardless of age, gender, disease, or treatment group
Ware, John E.; Sherbourne, Cathy D.
Health and Work Performance Questionnaire
HPQ Workplace productivity and employee health
World Health Organization (WHO); The American College of Occupational and Environmental Medicine, Kessler, Barber, etc.
Work Limitations Questionnaire
WLQ Measuring degree chronic health conditions interfere with ability to perform job roles (ref Lerner)
New England Medical Center, Glaxo Wellcome Inc.
Health and Work Questionnaire
HWQ Assessment for workplace productivity related to health
Glaxo Smith Kline Shikiar, Richard, et. al
The following table provides the specific questions adopted from each survey
Survey Questions in Study Survey SF-36
• In general, how would you rate your overall physical health? • In general, how would you rate your overall mental or emotional health? • During the past 30-days, to what extent has your physical or emotional problems
interfered with your normal social activities with family, friends, neighbors, or groups?
• In the past 30-days, how often have/did you feel: o Full of pep o You have been a nervous person o So down in the dumps nothing could cheer you up o Calm and peaceful o You have a lot of energy o Downhearted and blue o Worn out o Happy o Tired
• In the past 30-days, have you had any of the following problems with work or other regular daily activities as a result of your health:
o Cut down on the amount of time you spent on work or other activities o Accomplished less than you would like o Were limited in the kind of work or other activities

146
o Had difficulty performing the work or activities, took extra effort HPQ
• Over the past 30-days, how often did you have each of the following experiences: o Your speed of work or productivity was higher than expected o Your speed of work or productivity was lower than expected o You did not work at times when you were supposed to be doing work o You were not working as carefully as you should o Found yourself daydreaming and not concentrating on work o Had trouble controlling emotions when around people at work o Got along well with others at work
• Over the past 30-days, did you experience any special work success or achievement? • Over the past 30-days, did you experience any special work failure, make any big
mistake, or miss a deadline? WLQ
• In the past 30-days, how often did your physical health or emotional problems make it difficult to do the following:
o Work without stopping to take breaks or rest o Stick to a routine or schedule o Keep your mind on your work o Handle the workload
HWQ • How would you, your supervisor and your co-workers describe your efficiency in the
past week? • How would you, your supervisor and your co-workers describe the overall quality of
your work this week? • How would you, your supervisor and your co-workers describe the overall amount of
work you did this week?
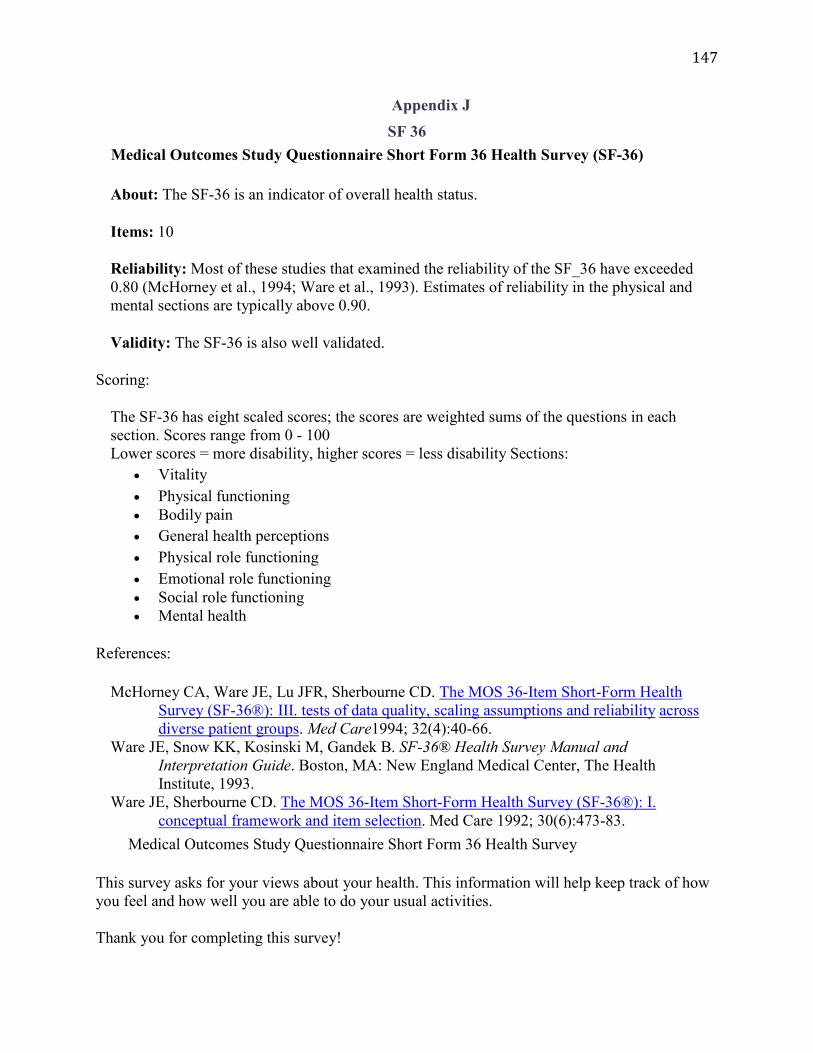
147
Appendix J SF 36
Medical Outcomes Study Questionnaire Short Form 36 Health Survey (SF-36)
About: The SF-36 is an indicator of overall health status.
Items: 10
Reliability: Most of these studies that examined the reliability of the SF_36 have exceeded 0.80 (McHorney et al., 1994; Ware et al., 1993). Estimates of reliability in the physical and mental sections are typically above 0.90.
Validity: The SF-36 is also well validated.
Scoring:
The SF-36 has eight scaled scores; the scores are weighted sums of the questions in each section. Scores range from 0 - 100 Lower scores = more disability, higher scores = less disability Sections:
• Vitality • Physical functioning • Bodily pain • General health perceptions • Physical role functioning • Emotional role functioning • Social role functioning • Mental health
References:
McHorney CA, Ware JE, Lu JFR, Sherbourne CD. The MOS 36-Item Short-Form Health Survey (SF-36®): III. tests of data quality, scaling assumptions and reliability across diverse patient groups. Med Care1994; 32(4):40-66.
Ware JE, Snow KK, Kosinski M, Gandek B. SF-36® Health Survey Manual and Interpretation Guide. Boston, MA: New England Medical Center, The Health Institute, 1993.
Ware JE, Sherbourne CD. The MOS 36-Item Short-Form Health Survey (SF-36®): I. conceptual framework and item selection. Med Care 1992; 30(6):473-83.
Medical Outcomes Study Questionnaire Short Form 36 Health Survey
This survey asks for your views about your health. This information will help keep track of how you feel and how well you are able to do your usual activities. Thank you for completing this survey!

148
For each of the following questions, please circle the number that best describes your answer.
1. In general, would you say your health is:
Excellent 1 Very good 2 Good 3 Fair 4 Poor 5 2. Compared to one year ago, Much better now than one year ago 1 Somewhat better now than one year ago 2 About the same 3 Somewhat worse now than one year ago 4 Much worse now than one year ago 5
3. The following items are about activities you might do during a typical day. Does your health
now limit you in these activities? If so, how much? (Circle One Number on Each Line)
Yes,
Limited a
Lot (1)
Yes, Limited
a Little
(2)
No, Not limited
at All (3)
a. Vigorous activities, such as running, lifting heavy objects, participating in strenuous sports
1 2 3
b. Moderate activities, such as moving a table, pushing a vacuum cleaner, bowling, or playing golf
1 2 3
c. Lifting or carrying groceries 1 2 3 d. Climbing several flights of stairs 1 2 3 e. Climbing one flight of stairs 1 2 3 f. Bending, kneeling, or stooping 1 2 3

149
Appendix K: HPQ
Excellent Very Good Good Fair Poor A1. In general, how would you rate your
overall health now? A2. In general, how would you rate your
overall mental health now?
A3. Do you have any of the following conditions? If your answer is YES, mark whether you never, previously, or currently receive professional treatment. (Professional treatment is any treatment supervised by a health professional.) If you are unsure if you have a condition, please mark the NO response option.
NO, I
don't have this condition
YES, but I never received
professional treatment
YES, I previously received (but don't currently receive)
professional treatment
YES, and I currently receive professional
treatment
A3a. Arthritis? A3b. Chronic back/neck pain?
A3c. Migraine headaches? A3d. Other frequent or
severe headaches?
A3e. Any other chronic pain?
A3f. High blood pressure or hypertension?
A3g. Congestive heart failure?
A3h. Coronary heart disease?
A3i. High blood cholesterol?
CHECKPOINT: If R HAS ARTHRITIS (A3a = ANY OF THE THREE “YES” RESPONSES), GO TO A4. OTHERWISE, GO TO A7.
A4. You mentioned having arthritis. Most people with arthritis have osteoarthritis, which is caused by the cartilage in joints wearing down until bones rub against each other and cause pain. When a doctor tells you that you have “arthritis,” he means osteoarthritis unless he explicitly says otherwise. The other kind of arthritis is rheumatoid arthritis. This is a relatively rare auto-immune disease that causes inflammation of the tissues that line joints. Rheumatoid arthritis usually begins in early adulthood. With these definitions in mind, which of the two do you have: osteoarthritis or rheumatoid arthritis?
Osteoarthritis Rheumatoid Arthritis
A7. Do you have any of the following conditions? If your answer is YES, mark whether you never, previously, or currently receive professional treatment. (Professional treatment is any treatment supervised by a health professional.) If you are unsure if you have a condition, please mark the NO response option.
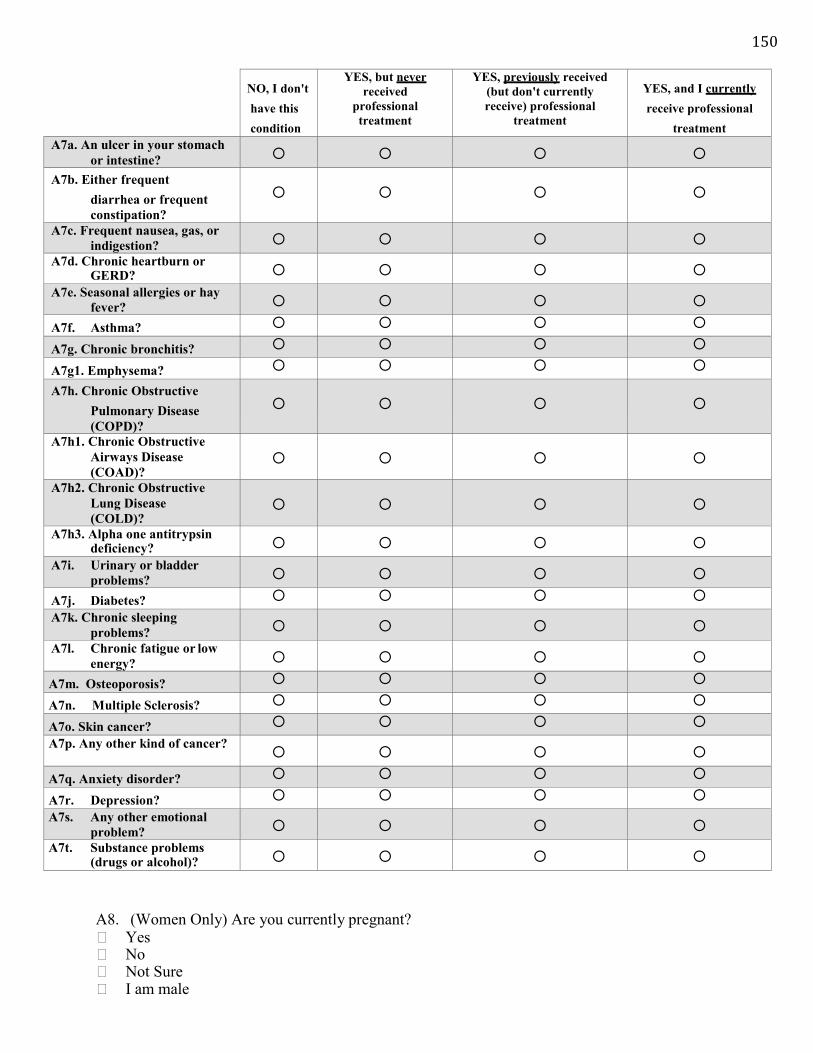
150
NO, I don't have this condition
YES, but never received
professional treatment
YES, previously received (but don't currently receive) professional
treatment
YES, and I currently receive professional
treatment A7a. An ulcer in your stomach
or intestine?
A7b. Either frequent diarrhea or frequent constipation?
A7c. Frequent nausea, gas, or indigestion?
A7d. Chronic heartburn or GERD?
A7e. Seasonal allergies or hay fever?
A7f. Asthma?
A7g. Chronic bronchitis?
A7g1. Emphysema?
A7h. Chronic Obstructive Pulmonary Disease (COPD)?
A7h1. Chronic Obstructive Airways Disease (COAD)?
A7h2. Chronic Obstructive Lung Disease (COLD)?
A7h3. Alpha one antitrypsin deficiency?
A7i. Urinary or bladder problems?
A7j. Diabetes? A7k. Chronic sleeping
problems? A7l. Chronic fatigue or low
energy?
A7m. Osteoporosis?
A7n. Multiple Sclerosis?
A7o. Skin cancer? A7p. Any other kind of cancer?
A7q. Anxiety disorder?
A7r. Depression? A7s. Any other emotional
problem? A7t. Substance problems
(drugs or alcohol)?
A8. (Women Only) Are you currently pregnant?
Yes No Not Sure I am male

151
A9. Do you smoke cigarettes? Currently Ex-smoker Only smoked a few times GO TO A10 Never GO TO A10
A9.1. Have you ever in your life smoked cigarettes on a daily basis?
Yes No GO TO A9a IF CURRENT SMOKER (SEE A9) AND IF EX-SMOKER GO TO A10
A9.2. How many years, in total, did you smoke cigarettes on a daily basis?
YEARS SMOKING
A9.3. How many cigarettes did you smoke on an average day during the time in your life when you smoked most often?
(PLEASE ANSWER IN NUMBER OF CIGARETTES RATHER THAN NUMBER OF PACKS. A PACK WOULD BE CONSIDERED 20 CIGARETTES.)
NUMBER OF CIGARETTES PER DAY
A9a. How many cigarettes do you currently smoke a day? 10 or less 11 – 20 21 – 30 31 or more
A9b. How soon after you wake do you smoke your first cigarette? Within 5 minutes 6 – 30 minutes 31 – 60 minutes After 60 minutes
A9c. Which cigarette would you hate most to give up? The first one in the morning All others
A9d. Do you find it difficult to refrain from smoking in places where it is forbidden, such as the library,
theater, or doctor's office? Yes No
A9e. Do you smoke more frequently during the first hours after waking than the rest of the day?
Yes No
A9f. Do you smoke when you are so ill that you are in bed most of the day?
Yes No

152
A10. How often do you usually have at least one drink of alcohol?
Nearly everyday Several days per week 1 – 2 days a week 1 – 3 days a month Less than once a month Never GO TO A11
A10a. On the days you drink, about how many drinks do you usually have per day? 1 – 2 drinks 3 – 4 drinks 5 – 10 drinks 10+ drink
A10b. How often do you drink 5 or more drinks per day?
Nearly everyday Several days a week 1 – 2 days a week 1 – 3 days a month Less than once a month Never
A11. Some people have periods lasting several days or longer when they feel much more excited and
full of energy than usual. Their minds go too fast. They talk a lot. They are very restless or unable to sit still or need very little sleep. They sometimes do things that are unusual for them, such as driving too fast or spending too much money. Have you ever in your life had a time like this lasting several days or longer?
Yes GO TO A13 No
A12. Have you ever had a time lasting several days or longer when most of the time you were so
irritable or grouchy that you either started arguments, shouted at people, or hit people?
Yes No GO TO A15
A13. People who have episodes like this often have changes in their thinking and behavior at the same time, like being more talkative, needing very little sleep, being very restless, going on buying sprees, and behaving in ways they would normally think are inappropriate. Did you ever have any of these changes during your episodes of being (IF A11=YES: excited and full of energy/IF A12=YES: very irritable or grouchy)?
Yes No GO TO A15

153
A14. Think of an episode when you had the largest number of changes like these at the same time. During that episode, which of the following changes did you experience
CHECKPOINT: IF 0-1 OF A14a- A14i = YES GO TO A15
CHECKPOINT: IF A11 = YES GO TO A14.1. IF A12 YES
GO TO A14.2
A14.1. About how many weeks out of 52 in the past year did you have an episode of feeling much more excited, full of energy, or hyper than usual with some of the other problems that we just reviewed? You can use any number between 0 and 52 to answer.
NUMBER OF WEEKS (00-52)
CHECKPOINT: GO TO A15
A14.2. About how many weeks out of 52 in the past year did you have an episode of being much more irritable than usual with some of the other problems that we just reviewed? You can use any number between 0 and 52 to answer.
NUMBER OF WEEKS (00-52)
Yes No
A14a. Were you so irritable that you either started arguments, shouted at people, or hit people?
A14b. Did you become so restless or fidgety that you paced up and down or couldn’t stand still?
A14c. Did you do anything else that wasn’t usual for you – like talking about things you would normally keep private, or acting in ways that you’d usually find embarrassing?
A14d. Did you try to do thing that were impossible to do, like taking on large amounts of work?
A14e. Did you constantly keep changing your plans or activities?
A14f. Did you find it hard to keep your mind on what you were doing?
A14g. Did your thoughts seem to jump from one thing to another or race through your head so fast you couldn’t keep track of them?
A14h. Did you sleep far less than usual and still not get tired or sleepy?
A14i. Did you spend so much more money than usual that it caused you to have financial trouble?

154
A15. The next questions are about problems you may have with attention or concentration.
A16. The next questions are about how often you got tired over the past twelve months. How often
did you become very tired, weak, or exhausted while performing each of the following kinds of activities?
Never Rarely Sometimes Often Very Often A16a. ....... minor everyday physical tasks
like working, shopping, housekeeping, and walking?
A16b. …minor everyday mental tasks like reading, writing, and doing paperwork?
CHECKPOINT: IF R checked “SOMETIMES,” “OFTEN,” or “VERY OFTEN” TO ONE OR BOTH OF A16a or A16b, GO TO A17. OTHERWISE, GO TO A18.
A17. During the times you became very tired while performing minor everyday tasks, what would happen when you tried to rest or relax? Would you… …fully regain your energy and strength? GO TO A18 …still feel tired or weak?
A17a. When this problem was most severe over the past 12 months, how often did you get tired? Nearly everyday Several days a week 1 – 2 days a week
Never Rarely Sometimes Often Very Often
A15a. How often do you have trouble wrapping up the final details of a project, once the challenging parts have been done?
A15b. How often do you have difficulty getting things in order when you have to do a task that requires organization?
A15c. How often do you have problems remembering appointments or obligations?
A15d. When you have a task that requires a lot of thought, how often do you avoid or delay getting started?
A15e. How often do you fidget or squirm with your hands or feet when you have to sit down for a long time?
A15f. How often do you feel overly active and compelled to do things, like you were driven by a motor?

155
1 – 3 days a month Less than once a month
A17b. How often were you too tired to carry out your daily activities?
Never Rarely Sometimes Often Very often
A18. During the past twelve months, have you had at least one week each month when you had
frequent pain or discomfort in your stomach or lower abdomen that was relieved when you had a bowel movement? No Yes, but I never received any professional treatment Yes, I previously received (but don’t currently receive) professional treatment Yes, and I currently receive professional treatment
A19. The next few questions are about problems with your sleep. During the past twelve months, how
many weeks did you have problems …
0
Weeks
1-2
Weeks
3-4
Weeks
5-8
Weeks
9-12
Weeks
12-26
Weeks
27-51
Weeks
52
Weeks
A19a. …getting to sleep, when nearly every night it took you two hours or longer before you could fall asleep?
A19b. …staying asleep, when you woke up nearly every night and took an hour or more to get back to sleep?
A19c. …waking too early, when you woke up nearly every morning at least two hours earlier than you wanted to?
A19d. …feeling sleepy during the day?
A20. Have you been repeatedly short of breath over the past 12 months?
Yes No GO TO 23
A21. For how many months out of 12 in the past year have you had bronchitis or chronic
coughing with phlegm/sputum from your chest?
NUMBER OF MONTHS (0-12)
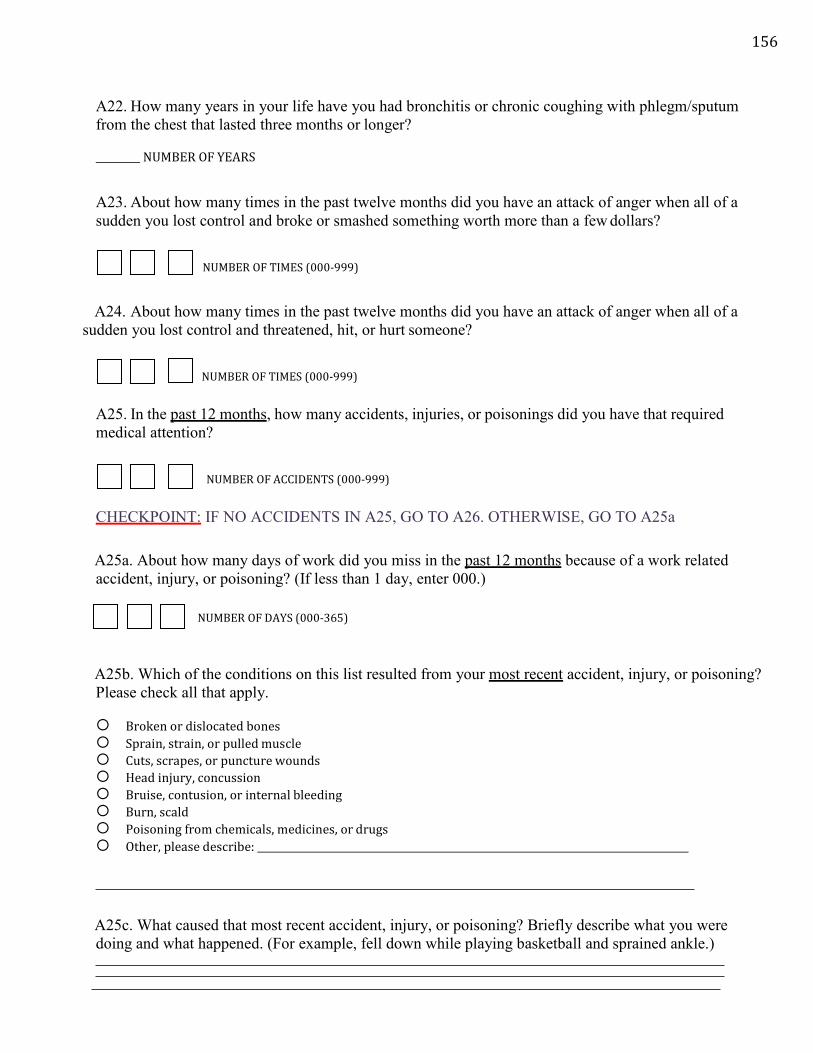
156
A22. How many years in your life have you had bronchitis or chronic coughing with phlegm/sputum from the chest that lasted three months or longer?
NUMBER OF YEARS
A23. About how many times in the past twelve months did you have an attack of anger when all of a sudden you lost control and broke or smashed something worth more than a few dollars?
NUMBER OF TIMES (000-999)
A24. About how many times in the past twelve months did you have an attack of anger when all of a sudden you lost control and threatened, hit, or hurt someone?
NUMBER OF TIMES (000-999)
A25. In the past 12 months, how many accidents, injuries, or poisonings did you have that required medical attention?
NUMBER OF ACCIDENTS (000-999)
CHECKPOINT: IF NO ACCIDENTS IN A25, GO TO A26. OTHERWISE, GO TO A25a
A25a. About how many days of work did you miss in the past 12 months because of a work related accident, injury, or poisoning? (If less than 1 day, enter 000.)
NUMBER OF DAYS (000-365)
A25b. Which of the conditions on this list resulted from your most recent accident, injury, or poisoning? Please check all that apply.
Broken or dislocated bones Sprain, strain, or pulled muscle Cuts, scrapes, or puncture wounds Head injury, concussion Bruise, contusion, or internal bleeding Burn, scald Poisoning from chemicals, medicines, or drugs Other, please describe:
A25c. What caused that most recent accident, injury, or poisoning? Briefly describe what you were
doing and what happened. (For example, fell down while playing basketball and sprained ankle.)

157
A25d. In what month did the most recent accident, injury, or poisoning occur?
(MONTH)
A26. In the past 12 months, how many work-related accidents did you have that either damaged company property, led to a work delay, or otherwise had a financial cost to your company?
NUMBER OF ACCIDENTS (000-999)
CHECKPOINT: IF NO ACCIDENTS IN A26, GO TO A27. OTHERWISE, GO TO A26a
A26a. What is your best estimate of the financial loss to your company caused by your accident(s) over the past 12 months?
$ (DOLLAR AMOUNT)
A27. During the past 4 weeks (28 days), how much were you bothered by each of the following
conditions?
Not at all A little Some A lot
A27a. Feeling dizzy
A27b. Feeling tired or having low energy
A27c. Trouble sleeping
A27d. Headaches
A27e. Back or neck pain A27f. Pain in your arms, legs, or joints (knees,
hips, etc.)
A27g. Muscle soreness A27h. Watery eyes, runny nose, or stuffy head
A27i. Cough or sore throat A27j. Fever, chills, or other cold/flu
symptoms A27k. Constipation, loose bowels, or
diarrhea
A27l. Nausea, gas, or indigestion
A28. During the past 4 weeks (28 days), how much of the time did you feel...
All of the time
Most of the time
Some of the time
A little of the time
None of the time
A28a. ..... so sad nothing could cheer you up?
A28b. ..... nervous?
A28c. ..... restless or fidgety?
A28d. ..... hopeless?
A28e. ...... that everything was an effort?
A28f ....... worthless?

158
A28g. …unable to relax?
A28h. …impatient or irritable?
A29.How many times did you see each of the following types of professionals in the past 12 months? Include only visits regarding your own health, not visits when you took someone else to be examined.
Number of times (000-365)
A29a. A doctor, hospital, or clinic for a routine physical check-up or gynecological exam (not counting pregnancy related care)
A29b. (Women Only) A doctor, hospital, or clinic for pregnancy related care (If male, enter 000.)
A29c. A dentist or optician for a routine check-up or exam
A29d. A doctor, emergency room, or clinic for urgent care treatment (for example, because of new symptoms, an accident, or something else unexpected)
A29e. A doctor, hospital, clinic, orthodontist, or ophthalmologist for scheduled treatment or surgery
A29f. A psychiatrist, psychologist, or other mental health professional
A30. How many nights did you stay in a hospital during the past 12 months (not including nights
associated with childbirth)?
NUMBER OF NIGHTS (000-365)
A30a. (Women Only) How many nights did you stay in a hospital during the past 12 months for nights associated with childbirth? (If male, enter 000.)
NUMBER OF NIGHTS (000-365)
A31. What is the name of your health plan(s)? (Please refer to your Health Plan Card. Check all that
apply.)
Local List #1 Local List #2 Some other plan (Please print the name of the plan)
YOU R WOR K
B1. Please choose the category that best describes your main job. If none of the categories fits you exactly, please respond with the closest category to your experience. (Select only one.)
Executive, administrator, or senior manager
(e.g., CEO, sales VP, plant manager)
Professional
Example: If you visited a dentist 2 times in the past year and an optician once, your answer to A29c would be 003.

159
(e.g., engineer, accountant, systems analyst)
Technical support (e.g., lab technician, legal assistant, computer programmer)
Sales
(e.g., sales representative, stockbroker, retail sales)
Clerical and administrative support (e.g., secretary, billing clerk, office supervisor)
Service occupation
(e.g., security officer, food service worker, janitor)
Precision production and crafts worker (e.g., mechanic, carpenter, machinist)
Chemical/Production Operator
(e.g., shift supervisors and hourly employees)
Laborer (e.g., truck driver, construction worker)
B2. Is your work schedule best described as a regular schedule (roughly the same hours every day), a
rotating schedule (e.g., working a day shift some days and a night shift other days), or an irregular schedule (e.g., unpredictable hours controlled by situations or workload)?
Regular schedule GO TO B4 Rotating schedule Irregular schedule
B3. What percent of your total work hours in an average week are in each of the following times of day? (The sum should add up to 100%)
%
Morning (6:00AM-12:00PM) Afternoon (12:00PM-6:00PM)
Evening (6:00PM-12:00AM)
Nights (12:00AM-6:00AM)
Total 100
CHECKPOINT: GO TO B6 IF RESPONDENT ANSWERED B3
B4. What time do you usually begin work?
: AM/PM (CIRCLE ONE)
B5. What time do you usually end work?
: AM/PM (CIRCLE ONE)

160
B6. How many people do you personally supervise on your job? (If more than 97, enter 97.)
NUMBER OF PEOPLE (00-97)
B7. About how many hours altogether did you work in the past 7
days? (If more than 97, enter 97.)
NUMBER OF HOURS (00-97)
B8. How many hours does your employer expect you to work in a typical 7-day week? (If it varies, estimate the average. If more than 97, enter 97.)
NUMBER OF HOURS (00-97)
B9. Now please think of your work experiences over the past 4 weeks (28 days). In the spaces
provided below, write the number of days you spent in each of the following work situations.
In the past 4 weeks (28 days), how many days did you...
Number of days (00-28)
B9a. ....... miss an entire work day because of problems with your physical or mental health? (Please include only days missed for your own health, not someone else’s health.)
B9b. ....... miss an entire work day for any other reason (including vacation)?
B9c. ........ miss part of a work day because of problems with your physical or mental health? (Please do not include entire work days missed. Please include only days missed for your own health, not someone else’s health.)
B9d. ....... miss part of a work day for any other reason (including vacation)? (Please do not include entire work days missed.)
B9e. ........ come in early, go home late, or work on your day off?
CHECKPOINT: IF R HAS NOT MISSED AN ENTIRE DAY OR A PARTIAL DAY (R ANSWERED “00” FOR ALL QUESTIONS IN B9 SERIES) GO TO B10. OTHERWISE GO TO B9f.
B9. Think of (all) the (insert exact number if possible) days in the past four weeks (28 days) when you missed either a full day of work or a partial day of work. Count partial days as whole days.
How many of these (insert exact number if possible) days did you …
Number of days (00-28)
B9f. …not receive pay?
B9g. …get paid as part of regular salary?

161
B9h. …use earned sick leave (while receiving regular pay)?
B9i. …use earned vacation time (while receiving regular pay)?
B9j. …get paid as short-term or long-term disability?
B9k. …get paid as a result of an injury at work?
B10. About how many hours altogether did you work in the past 4 weeks (28 days)? (See examples below.)
NUMBER OF HOURS IN THE PAST 4 WEEKS (28 DAYS)
B10a. In the past 4 weeks (28 days), did you have any special work success or achievement?
Yes No GO TO B11a
B10b. If you answered YES to the above question, please describe what happened.
B11a. In the past 4 weeks (28 days), did you have any special work failure?
Yes No GO TO B12
B11b. If you answered YES to the above question, please describe what happened.
B12.The next questions are about the time you spent during your hours at work in the past 4 weeks (28 days).
Examples for Calculating Hours Worked in the Past 4 Weeks
40 hours per week for 4 weeks = 160 hours 35 hours per week for 4 weeks = 140 hours 40 hours per week for 4 weeks with 28-hour days missed = 144 hours 40 hours per week for 4 weeks with 34-hour partial days missed = 148 hours 35 hours per week for 4 weeks with 28-hour days missed and 34-hour partial days missed = 112 hours

162
Select the one response for each question that comes closest to your experience.
All of the time
Most of the time
Some of the time
A little of the time
None of the time
B12a. How often was your performance higher than most workers on your job?
B12b. How often was your performance lower than most workers on your job?
B12c. How often did you do no work at times when you were supposed to be working?
B12d. How often did you find yourself not working as carefully as you should?
B12e. How often was the quality of your work lower than it should have been?
B12f. How often did you not concentrate enough on your work?
B12g. How often did health problems limit the kind or amount of work you could do?
B13. On a scale from 0 to 10 where 0 is the worst job performance anyone could have at your job and 10 is the performance of a top worker, how would you rate the usual performance of most workers in a job similar to yours?
Worst Performance
Top Performance
0 1 2 3 4 5 6 7 8 9 10
B14. Using the same 0-to-10 scale, how would you rate your usual job performance over the past year or two?
Worst Performance
Top Performance
0 1 2 3 4 5 6 7 8 9 10
B15. Using the same 0-to-10 scale, how would you rate your overall job performance on the days you worked during the past 4 weeks (28 days)? Worst Performance
Top Performance
0 1 2 3 4 5 6 7 8 9 10

163
B16. How would you compare your overall job performance on the days you worked during the past 4 weeks (28 days) with the performance of most other workers who have a similar type of job? (Select only one.)
You were a lot better than other workers You were somewhat better than other workers You were a little better than other workers
You were about average
You were a little worse than other workers You were somewhat worse than other workers You were a lot worse than other workers
D E MO GR AP H IC S
C1. How old are you?
YEARS OLD (00-99)
C2. Are you male or female?
Male Female
C3. What is your current marital status?
Married or Cohabiting Separated Divorced Widowed Never Married
C4. How many children do you have?
None One Two Three Four or more
C5. What is the highest grade or level of school that you have completed?
8th grade or less Some high school, but did not graduate

164
High school graduate or GED Some college or 2-year degree 4-year college graduate More than 4-year college degree
C6. What is your height?
INCHES (00-11) (PLEASE ROUND TO THE NEAREST INCH)
C7. How much do you weigh?
POUNDS (PLEASE ROUND TO THE POUND 000-999)
C8. Are you salaried or are you paid hourly? (“Salaried” means that you're paid the same amount each week or month no matter how many hours you work. “Hourly” means that you're paid a different amount each week or month depending on how many hours you work.)
Salaried GO TO C8.1 Paid hourly GO TO C8.2
C8.1. What is your annual income from your job, before taxes?
$1 - $999 $11,000 - $11,999 $30,000 - $34,999 $1,000 - $1,999 $12,000 - $12,999 $29,000 - $39,999 $2,000 - $2,999 $12,000 - $12,999 $40,000 - $44,999 $3,000 - $3,999 $14,000 - $14,999 $45,000 - $49,999 $4,000 - $4,999 $15,000 - $15,999 $50,000 - $74,999 $5,000 - $5,999 $16,000 - $16,999 $75,000 - $99,999 $6,000 - $6,999 $17,000 - $17,999 $100,000 - $149,999 $7,000 - $7,999 $18,000 - $18,999 $150,000 - $199,999 $8,000 - $8,999 $19,000 - $19,999 $200,000 - $299,999 $9,000 - $9,999 $20,000 - $24,999 $300,000 - $499,999 $10,000 - $10,999 $25,000 - $29,999 $500,000 - $999,999 $1,000,000 or more
C8.2. How much are you paid per hour, before taxes?
$5.00 - $8.00 $18.01 - $20.00 $32.01 - $35.00 $55.01 - $60.00 $8.01 - $10.00 $20.01 - $22.00 $35.01 - $38.00 $60.01 - $70.00 $10.01 - $12.00 $22.01 - $24.00 $38.01 - $41.00 $70.01 - $80.00 $12.01 - $14.00 $24.01 - $26.00 $41.01 - $45.00 $80.01 - $90.00 $14.01 - $16.00 $26.01 - $29.00 $45.01 - $50.00 $90.01 - $100.00 $16.01 - $18.00 $29.01 - $32.00 $50.01 - $55.00 More than $100
That completes the survey. Thanks very much for your participation