A case study: Crop (lettuce, spinach, and carrots) uptake ...
29
Method development and application to determine potential plant uptake of 1 antibiotics and other drugs in irrigated crop production systems 2 3 4 Tammy L Jones-Lepp *1 , Charles A Sanchez 2 , Thomas Moy 3 , Reza Kazemi 4 5 1 U.S. Environmental Protection Agency, Research Chemist, Office of Research and 6 Development, National Exposure Research Laboratory-Environmental Sciences Division, 7 Las Vegas, NV 89119, (702) 798-2144, [email protected]; 2 University of 8 Arizona, Department of Soil, Water, and Environmental Sciences, Yuma Agricultural 9 Center, Yuma, AZ; 3 Senior Environmental Employee Program, U.S. Environmental 10 Protection Agency, 944 E. Harmon Ave., Las Vegas, NV 89119; 4 Student Services 11 Contract, U.S. Environmental Protection Agency, 944 E. Harmon Ave., Las Vegas, NV 12 89119 13 14 15 16 17 18
Transcript of A case study: Crop (lettuce, spinach, and carrots) uptake ...

Method development and application to determine potential plant uptake of 1
antibiotics and other drugs in irrigated crop production systems 2 3
4
Tammy L Jones-Lepp*1
, Charles A Sanchez2, Thomas Moy
3, Reza Kazemi
4 5
1U.S. Environmental Protection Agency, Research Chemist, Office of Research and 6
Development, National Exposure Research Laboratory-Environmental Sciences Division, 7
Las Vegas, NV 89119, (702) 798-2144, [email protected]; 2University of 8
Arizona, Department of Soil, Water, and Environmental Sciences, Yuma Agricultural 9
Center, Yuma, AZ; 3Senior Environmental Employee Program, U.S. Environmental 10
Protection Agency, 944 E. Harmon Ave., Las Vegas, NV 89119; 4Student Services 11
Contract, U.S. Environmental Protection Agency, 944 E. Harmon Ave., Las Vegas, NV 12
89119 13
14
15
16
17
18

Abstract 19 20
Studies have shown the detection of emerging contaminants (ECs), of which 21
pharmaceuticals are a subset, in surface waters across the United States. The objective of 22
this study was to develop methods, and apply them, to evaluate the potential for food 23
chain transfer when EC-containing waters are used for crop irrigation. Greenhouse 24
experiments were performed where select food crops were irrigated with water spiked 25
with three antibiotics. Field experiments, at two different sites, were conducted. Select 26
crops were irrigated with wastewater effluent known to contain ECs, EC-free well water, 27
and Colorado River water containing trace-level ECs. The results of the greenhouse 28
studies show the potential for uptake of one or more of the antibiotics evaluated, albeit at 29
very low levels. In those food crops watered with wastewater effluent only an industrial 30
flavoring agent, n,n’-dimethylphenethylamine (DMPEA) was consistently found. None 31
of the evaluated contaminants were found in crops irrigated with Colorado River water. 32
33
34
35
Keywords: emerging contaminants; crop uptake; pressurized liquid extraction; liquid 36
chromatography-electrospray-ion trap mass spectrometry/mass spectrometry; LC-MS/MS 37
38

Introduction 39
In the southwestern part of the United States, increasing demands on scarce water 40
resources has forced water authorities to look for alternative water resources. Some 41
water authorities use treated wastewater effluent for injection into ground water aquifers 42
for the purpose of pumping it out later and re-use, with further treatment, as drinking 43
water (1). Other municipalities use treated wastewater effluent for non-potable water 44
reuse, e.g., watering of golf courses and municipal green spaces, as well as a source of 45
irrigation water for crops (2). Of concern are the reports of numerous pharmaceuticals 46
and other emerging contaminants (ECs) found in these groundwaters. Rowe et al. (3) 47
reported that at least one EC was present in 76% of shallow urban wells sampled in the 48
Great and Little Miami River Basins in Ohio and found that the number of ECs detected 49
increased with increasing urban land use. 50
51
Although pharmaceuticals designed for human or veterinary use have a specific 52
biological mode of action, the impact on non-target species is rarely known. Since 53
pharmaceuticals are released into the environment as complex mixtures, and not as 54
individual compounds, there exists the possibility for synergistic, or antagonistic, 55
interactions resulting in unexpected biological effects. The concentrations of 56
pharmaceuticals in drinking water supplies are likely to be below any level of direct risk 57
to humans. However, it is the persistence and presence of antibiotics in the environment 58
that could pose a serious threat to human health. (4-7). The principal existing concern 59
with antibiotics is the identification of growing resistance in microbial populations (7-60
10). Resistance has been found in bacteria isolated from the innards of animals treated 61

with antibiotics, in their corresponding manure (11), and in agricultural soils receiving 62
manure (12, 13). There is concern that non-pathogenic bacteria can serve as a platform 63
for gene transfer to pathogenic organisms as a result of promiscuous exchange of genetic 64
material among microbes (5, 14). Antibiotic-resistant bacteria have been found in surface 65
water (6, 7), sediments (15, 16), and ground water (10, 17). 66
67
Recent studies have shown that human-use antibiotics (azithromycin, 68
clindamycin, and roxithromycin) are environmentally available in wastewaters, source 69
waters, and biosolids (18-21). Several researchers have demonstrated that certain 70
veterinary antibiotics (e.g., florfenicol, trimethoprim, sulfamethazine, enrofloxacin, etc.) 71
can be taken up into food crops (e.g., wheat, corn, lettuce, barley, and potato) produced 72
on manure-amended soils (22-25). Recently, Herklotz et al. (26) published a study of the 73
uptake of human pharmaceuticals (e.g. carbamazepine, salbutamol, sulfamethoxazole, 74
and trimethoprim ) into cabbage (Brassica rapa var. pekinensis) and Wisconsin Fast 75
plants (Brassica rapa) in a hydroponic garden setting. 76
77
At the Imperial Diversion Dam (IDD) near Yuma, AZ almost 5 billion m3 of 78
water are diverted from the Colorado River to irrigate the approximately 400,000 ha of 79
agricultural crops that are shipped nationally and internationally. Previous research has 80
shown that the Colorado River is contaminated with low levels of perchlorate and this 81
contaminant can be detected in most agricultural commodities irrigated with this water 82
(27, 28). Macrolide antibiotics, pseudoephedrine, and illicit drugs have been identified in 83
several municipal wastewater streams that discharge into the Colorado River (29). There 84

is a probability that the drugs present in water could potentially reach food crops. The 85
research presented in this paper will focus on the development and ground-truthing of 86
analytical methods for determining the fate of ECs (e.g., antibiotics, illicit drugs, over-87
the-counter (OTC) drugs) into food crops via a three-part study. There was an emphasis 88
on method development for detecting three antibiotics - azithromycin, roxithromycin and 89
clindamycin. Azithromycin and clindamycin due to their wide-spread usage in the US 90
(18), 91
http://drugtopics.modernmedicine.com/drugtopics/data/articlestandard//drugtopics/2520192
0/674976/article.pdf, and roxithromycin due to its surreptitious usage. Roxithromycin is 93
not prescribed in the US, but has been detected in wastewaters and biosolids in the US 94
(18, 20). 95
96
MATERIALS AND METHODS 97 98
Chemicals. Clarithromycin was obtained from U.S. Pharmacopeia (Rockville, 99
MD). Azithromycin, roxithromycin, clindamycin, and n,n’-dimethylphenethylamine 100
(DMPEA), were obtained from Sigma-Aldrich (St. Louis, MO). Methamphetamine, 101
MDMA, d5-MDMA, and pseudoephedrine were obtained from Cerilliant Corporation 102
(formerly Radian Corp., Round Rock, TX). HPLC-grade methanol was obtained from 103
varying sources [e.g., Burdick and Jackson (Muskegon, MI); EK Industries (Joliet, IL); 104
JT Baker (Phillipsburg, NJ)]. Acetic acid, glacial ACS reagent grade (VWR, West 105
Chester, PA); acetonitrile (Burdick and Jackson, Muskegon, MI); formic acid ACS 106
reagent grade (Anachemia, Rouses Point, NY); methyl tertbutyl ether (MTBE) (VWR, 107
West Chester, PA); and deionized water (NANOpureTM
, Barnstead, Dubuque, IA). 108

109
Stock standard solutions were individually prepared in HPLC-grade methanol and 110
stored in the dark at 4oC. A high-level standard mix (containing the macrolide antibiotics 111
and the other drugs/chemicals), at concentrations of 10 or 20 ng µL-1
, was prepared 112
monthly in methanol, and a calibration standard mix was prepared weekly at 113
environmentally relevant concentrations (0.5 to 1 ng µL-1
) in 99% methanol:1% acetic 114
acid. 115
116
Samples 117
Multiple samples, e.g., soils, waters, plants, were collected and processed during the three 118
phases of the study. A brief summary of the samples collected and their sources are 119
listed in Table 1. 120
121
Phase I - Greenhouse study, plant materials and growth conditions. The first 122
phase of the study was a controlled greenhouse experiment. Three crops, lettuce 123
(Lactuca sativa), spinach (Spinacia oleracea), and carrots (Daucus carota sativus), were 124
initially germinated in potting soil and irrigated with unspiked Colorado River water. At 125
approximately the four-leaf stage, the plants were transplanted into 1.5 L pots filled with 126
1.5 kg of washed silica sand. From transplanting through harvest, the plants were 127
irrigated with Colorado River water spiked with varying concentrations of three 128
antibiotics: azithromycin, clindamycin, and roxithromycin. The antibiotics were 129
dissolved in a small amount of methanol, and then diluted to 1000 ng L-1
with Colorado 130
River water. All concentrations were achieved by serial dilutions with Colorado River 131

water. The dosing concentrations were selected relative to concentrations found in 132
wastewater effluent streams (29) and were dosed at 0 (control), 0.1, 1, 10, 100, and 1000 133
ng L-1
. It was observed that the concentrations of the macrolide antibiotics in the 134
prepared irrigation water declined with time, perhaps due to photodegradation, microbial 135
degradation, or adhesion to the walls of the plastic container. Thus, solutions were 136
prepared weekly to maintain the target concentrations. Four replicates, at each 137
concentration, were performed. Plant selection per treatment was done following a 138
complete randomized design. After harvest, the crop plants were partitioned into leaves 139
and roots and then frozen. The frozen samples were freeze-dried, and weights before and 140
after freeze-drying were recorded. The freeze-dried samples were ground and stored in 141
vials for later extraction. 142
143
Phase II - Field studies UA-CAC. The second phase of the study was to ground-144
truth the methods developed during the first phase. This phase of the study was 145
conducted at the University of Arizona Campus Agricultural Center (UA-CAC), Tucson, 146
AZ. This was accomplished by applying the developed methods to field-grown crops 147
irrigated with treated City of Tucson wastewater effluent that contained known amounts 148
of ECs and, as a control, irrigated with well water known to be EC-free (Table 2). The 149
growing field consisted of loam-textured soils and was split into two separate sections. 150
The first half was irrigated by furrows filled with treated wastewater effluent and the 151
other section, the control, was irrigated by furrows filled with well water (Table 3). On 152
March 10, 2008, peppers (Capsicum annuum), tomatoes (Lycopersicon esculentum), 153
melons (Cucumis melo), lettuce, and watermelon (Citrullus lanatus) transplants were 154

planted in raised beds on 1-m centers. Spinach and carrots were seeded in these same 155
beds. Identical crops were established in each of the two sections. The crops were 156
fertilized and pests were controlled using standard practices. The crops were irrigated as 157
needed and harvested as each crop species matured. The final harvest was June 15, 2008. 158
After harvest, the crop plants were partitioned into leaf and root segments, and where 159
appropriate fruit, and frozen. The frozen samples were subsequently freeze-dried, and 160
weights before and after freeze-drying were recorded. The freeze-dried samples were 161
ground and stored in vials for later extraction. 162
163
Phase III - Field studies UA-YAC. During the third phase of the study, the 164
same crops as used in the Tucson studies were grown and collected at the University of 165
Arizona-Yuma Agricultural Center (UA-YAC), Yuma, AZ. All crops were grown on 166
loam-textured soils and irrigated with Colorado River water diverted at the IDD, north of 167
Yuma (Table 3). An opportunity arose to sample Bermuda hay grass from a field, close 168
to UA-YAC, that had a long-term history of application (several years’ worth) of EC-169
containing biosolids. The biosolids used on the field were obtained from Hyperion 170
wastewater treatment plant (WWTP), Orange County, CA, whose biosolids had 171
previously been characterized for ECs (20). The Bermuda grass samples were sampled 172
for the purpose of studying the possible migration of ECs from the biosolids into 173
Bermuda grass grown as feedstock for livestock. 174
175
Water samples. Phase I. Colorado River water, used in the greenhouse studies, 176
was sampled during each collection period. Phase II. Well water and treated wastewater 177

effluent used in the UA-CAC field study were sampled approximately every other 178
irrigation period. These water samples were kept on ice, or refrigerated, until processing. 179
Phase III. Water, which was diverted at the IDD for agricultural use in the Yuma region 180
of the lower Colorado River, was sampled monthly at the main Yuma conveyance siphon 181
during the crop-growing period of the field crops being sampled. 182
183
Water extractions. Water samples were prepared for analysis using solid phase 184
extraction (SPE) Oasis MCX cartridges (Waters Corp., Milford, MA) with an automated 185
extractor (AutoTrace, Caliper Life Sciences, Hopkinton, MA). Oasis MCX cartridges 186
were prepared for use by loading at a rate of 1mL min-1
, 5 mL each of methanol, 187
deionized water, and 95:5 water:methanol. All water samples were pH adjusted to < pH 188
3, with 12 N HCl, and 500 mL were passed through the prepared Oasis MCX cartridges 189
at a rate of 7 mL min-1
. The cartridges were then dried for 15 minutes (using N2), then 190
extracted with 5 mL of 90:10 MTBE/methanol, followed by 10 mL 191
methanol/4%ammonium hydroxide. The resultant extracts were reduced to 0.5 mL using 192
4 to 10 psi of nitrogen, via an automated evaporator (TurboVap, Caliper Life Sciences, 193
Hopkinton, MA). Sample extracts were analyzed by liquid chromatography-194
electrospray-ion trap mass spectrometry/mass spectrometry (LC-ESI-ITMS/MS). 195
196
Plant and soil extractions. Crop samples were freeze-dried for 48 hours, or 197
longer, until moisture was no longer present. The freeze-dried samples were ground to a 198
semi-fine state, such that they passed through a sieve size of 300 μm, and stored in vials 199
until extraction. 200

201
Test plot and field soil samples were poured into clean 2-liter beakers and air-202
dried. The dried soils were ground to ~ 300 μm using a high impact ball mill (Mixer Mill 203
301, Retsch Inc, Newtown, PA). 204
205
Pressurized liquid extraction (PLE) of plant and soil samples. One gram each 206
of prepared plant and soil samples was extracted using an Accelerated Solvent Extraction 207
(ASE) system (Model ASE 200 Accelerated Solvent Extractor, Dionex Corporation, 208
Sunnyvale, CA) in 22-mL stainless steel extraction cells according to the following 209
procedures. 210
211
Extraction cell preparation. A glass microfiber filter, 2 cm (Ahlstrom, Helsinki, 212
Finland) was placed at the bottom of the extraction cell. Dependent upon whether soils 213
or plants were to be extracted the extraction cell(s) were prepared as follows: 214
215
Soil sample extraction cell preparation. Three grams of fluorosil were added to the 216
cell, followed by a layer of 3 g of alumina. 217
218
Plant sample extraction cell preparation. Three grams of alumina were added to the 219
cell, followed by a layer of 3 g fluorosil. 220
221
The final sample cell preparation, whether soil and plant samples, was the same. 222
A mixture of 1 g of sample (soil or plant) and 1-g of HydromatrixTM
was added to the 223

extraction cell, followed by 3 g alumina. HydromatrixTM
was filled to top and the 224
extraction cell was capped with another glass microfiber filter and sealed. 225
226
PLE extraction procedure. A two solvent extraction regime was necessary in 227
order to fully extract the analytes from the solid matrices. The prepared cells were placed 228
into the ASE and initially extracted with a mixture of MTBE:methanol (90:10) and 229
flushed at 80% of cell volume. Temperature and pressure were kept steady at 50oC and 230
1500 psi, respectively. After a static period of 15 minutes, the eluant was purged into a 231
clean collection vial. The cells were left in situ, and further extracted with a mixture of 232
methanol/1%acetic acid and flushed at 80% of cell volume. The temperature and 233
pressure were maintained at 80oC and 2800 psi, respectively. After a static period of 15 234
minutes, the eluant was purged into a clean collection vial. 235
236
PLE extract concentration and cleanup. The MTBE/methanol extract was 237
placed into a TurbovapTM
tube and reduced to 5 mL, using 4 to 10 psi of nitrogen, via an 238
automated evaporator (TurboVapTM
, Caliper Life Sciences, Hopkinton, MA). The 239
methanol/acetic acid extract was then combined with the reduced MTBE/methanol 240
extract and evaporated until a combined extract sample volume of 5 mL was reached. 241
The 5-mL extracts were removed from the TurboVapTM
and washed with 1 to 2 mL of 242
hexane. The number of hexane washes varied from one sample to another, but typically 243
washes were done as many times as necessary to clean the sample of any undesirable 244
compounds, such as chlorophyllic compounds, fatty and waxy materials. The cleaned 245

extracts were placed back into the TurboVapTM
, further concentrated to 0.5 mL and 246
solvent exchanged with methanol/1% acetic acid before analysis by LC-ESI-ITMS/MS. 247
248
Validation of plant extraction method. The PLE method was validated by using 249
a modified extraction technique that had previously been published for extracting ECs 250
from biosolids (20). The spiked plant materials were extracted and analyzed by LC-ESI-251
ITMS/MS. The resultant accuracy and precision data are shown in Table 5. 252
253
LC-ESI-ITMS/MS analysis. 254
Liquid chromatography. Chromatographic separations were performed using an 255
Ascentis Express C18 (Supelco-Aldrich, Bellefonte, PA) 2.7 μm particle size, 3 cm x 2.1 256
mm column, coupled with a Varian guard column (MetaGuard 2.0 mm Pursuit XRs 3µm 257
C18). Compositions of the mobile phases were as follows: (A) deionized water/0.5% 258
formic acid and (B): 82% methanol/18% acetonitrile/0.5% formic acid. The flow rate 259
through the column was 200 μL min-1
, with the following gradient elution conditions: 260
mobile phase A 100%, hold for 2 min; 3 min gradient to 30% A:70% B, hold for 5 min; 3 261
min gradient to 100% A, hold for 2 min; end run, 5 min equilibration time between 262
analyses. 263
264
Mass spectrometry. Mass spectrometric data were acquired with an iontrap 265
mass spectrometer, Varian 500MS (Walnut Creek, CA USA), configured with a liquid 266
chromatograph and an electrospray ion source. The 500MS was run in the positive 267
ionization mode under the following conditions: 268

ES needle was 5 kV 269
Drying gas was set at 20 psi and 350°C 270
Housing chamber at 50oC 271
Nebulizer gas at 40 psi 272
Spray shield at 600V 273
Capillary voltages were set dependent upon the optimized response of the 274
product ions of interest. 275
276
The molecular weight of the ECs of interest, the precursor and product ions 277
formed under LC-ESI-ITMS conditions, and the mass spectrometric limits-of-278
detection of the ECs are listed in Table 4. Due to the large amounts of interfering 279
materials co-extracted with the ECs, the analyses were performed using the 280
collision induced dissociation (CID) mode for both identification and quantitation 281
of the analytes of interest (18). 282
283
RESULTS AND DISCUSSION 284
The steps in environmental method development involved: (1) the ability to 285
extract the analytes of interest with some degree of precision and accuracy from an 286
environmental matrix; and (2) the ability to accurately identify and measure at low 287
(environmentally relevant) concentrations the analytes of interest. The focus of the 288
results and discussion section is on the plant extraction procedures and the results of the 289
finalized plant extraction method as applied to the various plant samples. 290
291

Analytical challenges. During the development and execution of this 292
methodology for plants, various analytical difficulties were encountered, both in the 293
extraction phase and the detection phase. For example, chlorophyll, waxy and fatty 294
materials were co-extracted from plant materials, but they were not fully removed during 295
the hexane cleanup phase, even after multiple (4x) washes. Injection of plant and root 296
extracts into the mass spectrometer built up deposits on the inner spray shield, causing 297
loss of sensitivity and necessitating cleanup of spray shield after every second injection 298
of sample extracts into the mass spectrometer. 299
300
Injection of some plant and root extracts temporarily bound non-dissolvable 301
materials to the column, even with a guard column in place, resulting in poor 302
chromatography. This problem necessitated reversing the flow into the chromatographic 303
column. The column was flushed first with methanol/0.5% formic acid and then with 304
deionized water/0.5% formic acid before the column was usable again. 305
306
Results of water analysis. Phase I. All contaminants evaluated were below 307
detection in the Colorado River water collected for spiking in the greenhouse studies. 308
Phase II. The treated Tucson wastewater effluent, used at UA-CAC field studies, 309
contained the macrolide antibiotic azithromycin, the OTC drug pseudoephedrine, the 310
illicit drug methamphetamine, and an industrial compound, n,n’-DMPEA (an isomeric 311
compound to methamphetamine), Table 1. All contaminants evaluated were below 312
detection in the control well water used during the Phase II experiments at UA-CAC. 313
Phase III. Previous studies have found a number of ECs in wastewater discharged at 314
various points along the Colorado River (29). However, almost all ECs were below 315
levels of detection for Colorado River water that was collected at the IDD (main Yuma 316
irrigation siphon). The one exception was Ecstasy (MDMA), which was detectable but 317
not quantifiable during the warmer months (June through September). 318
319
Validation of PLE method. It is difficult to compare the recoveries of ECs from 320
crops in this study to the few other studies on plant uptake that have been published (22, 321
24, 26) because those studies did not indicate findings of percent recovery of spiked ECs. 322
Boxall (22) does briefly mention, “Although recoveries for most determinands were 323
good, low but reproducible recoveries were obtained for selected substances in soil 324
and/or plant material, so all measured values were recovery corrected. These low 325
recoveries were observed for the highly sorptive study substances.” The actual spiked 326
recovery data, however, was not published. Most recently, Herklotz et al. (26) reported 327
percent recoveries of spiked ECs from carrots and cabbages. Their method, similar to the 328
one reported in this paper, used PLE, and they reported > 70% recoveries of 6 different 329
ECs. However, their methodology used either a mass labeled internal standard 330
calibration or a combination of standard addition and mass labeled internal standard 331
calibration, to calibrate and calculate the percent recoveries. 332
333
In comparison to Herklotz et al.’s method(26) the method presented in this 334
research used external standard calibration with no corresponding mass labeled 335
compounds, for calibration and quantitation. The best recoveries of ECs (i.e., 336
azithromycin, roxithromycin, and clindamycin) from the plant materials were generated 337

by packing the extraction cell with a layer of alumina, followed by a layer of fluorosil. 338
With the PLE method reported in this article, the percent recoveries of the spiked ECs 339
were low, on average 25%-30% recovery, but reproducible, as measured by percent 340
relative standard deviation (RSD), most were < 17% RSD, Table 5. The EC amounts 341
detected in the non-spiked plant materials were spike-corrected using an equivalent 342
spiked matrix. 343
344
While the use of labeled compounds will give a sense of higher recoveries, in 345
truth, the labeled compound is correcting for the low recovery of the native compound. 346
One downside to the use of mass labeled compounds in these types of studies is the 347
usually higher costs (compared to non-labeled standards) associated with their purchase 348
and the lack of many of the ECs with an accordingly matched mass-labeled compound. 349
350
Results of plant uptake studies. Phase I Greenhouse - Above ground dry 351
matter production averaged 1.5, 3.3, and 1.9 g for the spinach, lettuce, and carrots, 352
respectively, and 2.0 g for carrot roots. There were no statistically significant differences 353
in dry matter production among the macrolide treatment rates indicating no phytotoxocity 354
to these macrolide antibiotics up to 1000 ng L-1
in irrigation water. The greenhouse study 355
indicated that there were traces of uptake of clindamycin into the spinach roots, lettuce 356
roots and carrot roots, Table 6. Trace amounts of roxithromycin were also detected in 357
lettuce roots and carrot roots. Carrots showed the greatest amount of uptake of 358
roxithromycin, an average of 110 ng g-1
, from the 1000 ng L-1
treatment. Neither 359
clindamycin nor roxithromycin were detected at the lower than 1000 ng L-1
treatments. 360

The greenhouse study demonstrates potential for EC uptake from contaminated irrigation 361
water. 362
363
Phase II – Field studies UA-CAC. The field study at UA-CAC was a side-by-364
side comparison and it did not include true replication so statistical evaluations of 365
production were not possible. However, the observed production was generally lower in 366
the plot receiving effluent compared to that receiving well water. Most of the crops 367
evaluated are sensitive to salinity; therefore, the high salinity (1.2 dS m-1
) in the effluent, 368
as compared to the well water (0.2 dS m-1
), may have caused the limited production. 369
370
Although several of the ECs studied were constantly present in the Tucson treated 371
wastewater effluent, Table 2, only n,n’-DMPEA was consistently found in the UA-CAC 372
food crops irrigated with wastewater effluent. No uptake of azithromycin was seen in 373
any of the plant/root samples from Tucson effluent field crops. No detectable levels of 374
the study pharmaceuticals were found in the soils collected from the root zones of the 375
crops sampled in the Tucson effluent field crops. 376
377
The results of the greenhouse study, and the field study with treated effluent 378
wastewaters, indicate a potential for uptake of pharmaceuticals from contaminated water, 379
albeit at very low levels. At present, it seems that the pharmaceuticals tested are 380
sufficiently diluted, or degraded, within the main channel of the Colorado River and that 381
risks of uptake by crops irrigated downstream of municipal waste discharges are minimal. 382
383

Phase III – UA-YAC and biosolids amended field. None of the ECs evaluated 384
were found in spinach crops grown in the UA-YAC fields irrigated with Colorado River 385
water. This was not surprising considering no detectable levels of these contaminants 386
were present in the Colorado River water diverted for irrigation at the IDD. However, in 387
previous studies, perchlorate accumulation has been found in plants where the 388
contaminant was not detectable in irrigation water (27), perhaps due to soil accumulation 389
or plant bioconcentration. No detectable levels of the study pharmaceuticals were found 390
in the soils collected from the root zones of the crops sampled in the Yuma area. 391
392
From a field nearby to UA-YAC, soils and Bermuda grass were collected. This 393
field had been treated for several years with biosolids from the Hyperion WWTP (Orange 394
County, California), and the Bermuda grass was being used for animal fodder. While 395
none of the ECs evaluated were detected in either the soils or Bermuda grass grown in 396
those soils, azithromycin, clarithromycin, and n,n’-DMPEA were detected in the roots of 397
the bermuda grass, Table 7. Both azithromycin and clarithromycin had been previously 398
detected in Hyperion biosolids (20). 399
400
The final analysis of data from Phase I, II, and III has shown the possibility, 401
although small, of transfer of specific ECs into select crops. The amount of ECs that 402
were transferred was minimal, part-per-trillion levels, but the likelihood does exist. 403
404
Although this study was designed to look at the possibility of transfer of human-405
use pharmaceuticals and other ECs into crops, the possibility exists for other avenues of 406

crop contamination via animal husbandry practices. Animal manures and composts are 407
widely used on both feed and food crops in irrigated desert production systems to 408
increase organic matter and improve overall soil fertility and tilth. Due to concerns of 409
microbial food risks, state programs such as the Arizona and California Leafy Greens 410
Marketing Agreements prohibit the application of raw manures for a one-year period 411
preceding the production of leafy vegetables. However, the programs do allow for 412
composted manure applications immediately before production, provided that testing 413
shows the food systems are free of coliform indicators. Composts are widely used by 414
organic producers as the principal forms of N and P fertilizers, and are also widely used 415
by conventional growers due to soil quality improvements and production benefits. 416
Therefore, further work with other pharmaceutical contaminants potentially present in 417
irrigation waters and animal husbandry waste composts (i.e., combined animal feed lots), 418
is warranted. 419
420
NOTICE: The United States Environmental Protection Agency through its Office of 421
Research and Development funded and managed the research described here. It has been 422
subjected to Agency’s administrative review and approved for publication. Mention of 423
trade names or commercial products does not constitute endorsement or recommendation 424
for use. 425

References
1. Wu, L.; Chen, W.; French, C.; Chang, A. Safe application of reclaimed water reuse in the
southwestern United States. ; 2009.
2. Bryck, J.; Prasad, R.; Davis, T. L. S.; Carpenter, G. National Database of Water Reuse
Facilities Summary Report; WaterReuse Foundation: Alexandria, VA, 2008.
3. Rowe, G. L.; Reutter, D. C.; Runkle, D. L.; Hambrook, J. A.; Janosy, S. D.; Hwang, L. H. Water
Quality in the Great and Little Miami River Basins, Ohio and Indiana, 1999-2001;
Circular 1229; Reston, VA, 2004.
4. Josephson, J., The Microbial "Resistome". Environmental Science & Technology 2006,
40, (21), 6531-6534.
5. Kümmerer, K., Resistance in the environment. Journal of Antimicrobial Chemotherapy
2004, 54, (2), 311-320.
6. Schwartz, T.; Kohnen, W.; Jansen, B.; Obst, U., Detection of antibiotic-resistant bacteria
and their resistance genes in wastewater, surface water, and drinking water biofilms.
FEMS Microbiology Ecology 2003, 43, (3), 325-335.
7. Schwartz, T.; Volkmann, H.; Kirchen, S.; Kohnen, W.; Schon-Holz, K.; Jansen, B.; Obst,
U., Real-time PCR detection of Pseudomonas aeruginosa in clinical and municipal
wastewater and genotyping of the ciprofloxacin-resistant isolates. FEMS Microbiology
Ecology 2006, 57, (1), 158-167.
8. Zhang, Y.; Marrs, C. F.; Simon, C.; Xi, C., Wastewater treatment contributes to selective
increase of antibiotic resistance among Acinetobacter spp. Science of the Total
Environment 2009, 407, 3702-3706.
9. Gilchrist, M. J.; Greko, C.; Wallinga, D. B.; Beran, G. W.; Riley, D. G.; Thorne, P. S.,
The potential role of concentrated animal feeding operations in infectious disease
epidemics and antibiotic resistance. Environmental Health Perspectives 2007, 115, (2),
313-316.
10. Batt, A. L.; Snow, D. D.; Aga, D. S., Occurrence of sulfonamide antimicrobials in private
water wells in Washington County, Idaho, USA. Chemosphere 2006, 64, (11), 1963-
1971.
11. Berger, K.; Petersen, B.; Buening-Pfaue, H., Persistence of drugs occurring in liquid
manure in the food chain. Archives fuer Lebensmittelhygeine 1986, 37, (4), 99-102.
12. Esiobu, N.; Armenta, L.; Ike, J., Antibiotic resistance in soil and water environments.
International Journal of Environmental Health Research 2002, 12, (2), 133-144.
13. Vaclavik, E.; Halling-Sorensen, B.; Ingerslev, F., Evaluation of manometric respiration
tests to assess the effects of veterinary antibiotics in soil. Chemosphere 2004, 56, (7),
667-676.
14. Baquero, F.; Martínez, J.-L.; Cantón, R., Antibiotics and antibiotic resistance in water
environments. Current Opinion in Biotechnology 2008, 19, (3), 260-265.
15. Andersen, S. R.; Sandaa, R. A., Distribution of Tetracycline Resistance Determinants
among Gram-Negative Bacteria Isolated from Polluted and Unpolluted Marine
Sediments. Applied and Environmental Microbiology 1994, 60, (3), 908-912.

16. Samuelsen, O.; Torsvik, V.; Ervik, A., Long-range changes in oxytetracycline
concentration and bacterial resistance towards oxytetracycline in a fish farm sediment
after medication. Science of the Total Environment 1992, 114, 25-36.
17. McKeon, D. M.; Calabrese, J. P.; Bissonnette, G. K., Antibiotic resistant gram-negative
bacteria in rural groundwater supplies. Water Research 1995, 29, (8), 1902-1908.
18. Loganathan, B.; Phillips, M.; Mowery, H.; Jones-Lepp, T. L., Contamination profiles and
mass loadings of select macrolide antibiotics and illicit drugs from a small urban
wastewater treatment plant. Chemosphere 2009, 75, (1), 70-77.
19. Jones-Lepp, T. L.; Alvarez, D. A.; Petty, J. D.; Huckins, J. N., Polar Organic Chemical
Integrative Sampling and Liquid Chromatography–Electrospray/Ion-Trap Mass
Spectrometry for Assessing Selected Prescription and Illicit Drugs in Treated Sewage
Effluents. Archives of Environmental Contamination and Toxicology 2004, 47, (4), 427-
439.
20. Jones-Lepp, T. L.; Stevens, R., Pharmaceuticals and personal care products in
biosolids/sewage sludge: the interface between analytical chemistry and regulation.
Analytical and Bioanalytical Chemistry 2007, 387, (4), 1173-83.
21. USEPA Targeted National Sewage Sludge Survey Report.
http://earth1.epa.gov/waterscience/biosolids/tnsss-fs.html,
http://www.epa.gov/waterscience/biosolids/tnsss-overview.html,
http://www.epa.gov/waterscience/biosolids/
22. Boxall, A. B.; Johnson, P.; Smith, E. J.; Sinclair, C. J.; Stutt, E.; Levy, L. S., Uptake of
veterinary medicines from soils into plants. Journal of Agricultural and Food Chemistry
2006, 54, (6), 2288-97.
23. Migliore, L.; Cozzolino, S.; Fiori, M., Phytotoxicity to and uptake of enrofloxacin in crop
plants. Chemosphere 2003, 52, (7), 1233-1244.
24. Grote, M.; Schwake-Anduschus, C.; Michel, R.; Stevens, H.; Heyser, W.; Langenkamper,
G.; Betsche, T.; Freitag, M., Incorporation of veterinary antibiotics into crops from
manured soil. Landbauforschung Volkenrode 2007, 57, (1), 25-32.
25. Dolliver, H.; Kumar, K.; Gupta, S., Sulfamethazine Uptake by Plants from Manure-
Amended Soil. Journal of Environmental Quality 2007, 36, (4), 1224-1230.
26. Herklotz, P. A.; Gurung, P.; Vanden Heuvel, B.; Kinney, C. A., Uptake of human
pharmaceuticals by plants grown under hydroponic conditions. Chemosphere 2010, In
Press.
27. Sanchez, C. A.; Barraj, L. M.; Blount, B. C.; Scrafford, C. G.; Valentin-Blasini, L.;
Smith, K. M.; Krieger, R. I., Perchlorate exposure from food crops produced in the lower
Colorado River region. Journal of Exposure Science and Environmental Epidemiology
2008, 19, 359-368.
28. Sanchez, C. A.; Blount, B. C.; Valentin-Blasini, L.; Lesch, S. M.; Krieger, R. I.,
Perchlorate in the Feed Dairy Continuum of the Southwestern United States. Journal
Agricultural and Food Chemistry 2008, 56, 5443-5450.

29. Sanchez, C. A.; Jones-Lepp, T.; Wilson, D.; Alvarez, D. In Pharmaceuticals in Waste
Streams and Surface Waters of the Colorado River Basin, Lake Mead Science
Symposium, Las Vegas, NV, 2009; Las Vegas, NV, 2009.

Tables
1. Chart of samples collected.
2. Tucson wastewater effluent ECs concentrations.
3. Chemical and physical properties of loam soil used in field experiment Phase II (UA-CAC)
and Phase III (UA-YAC).
4. Emerging contaminants, MW, precursor and product ions, and LODs.
5. Accuracy and precision spiked recovery parameters (0.5 μg g-1
and 1 μg g-1
) from Bermuda
grass, lettuce, spinach, carrots (roots and leaf).
6. Phase I – Results from greenhouse study.
7. Phase II and III – Results from UA-CAC field study and UA-YAC field study.
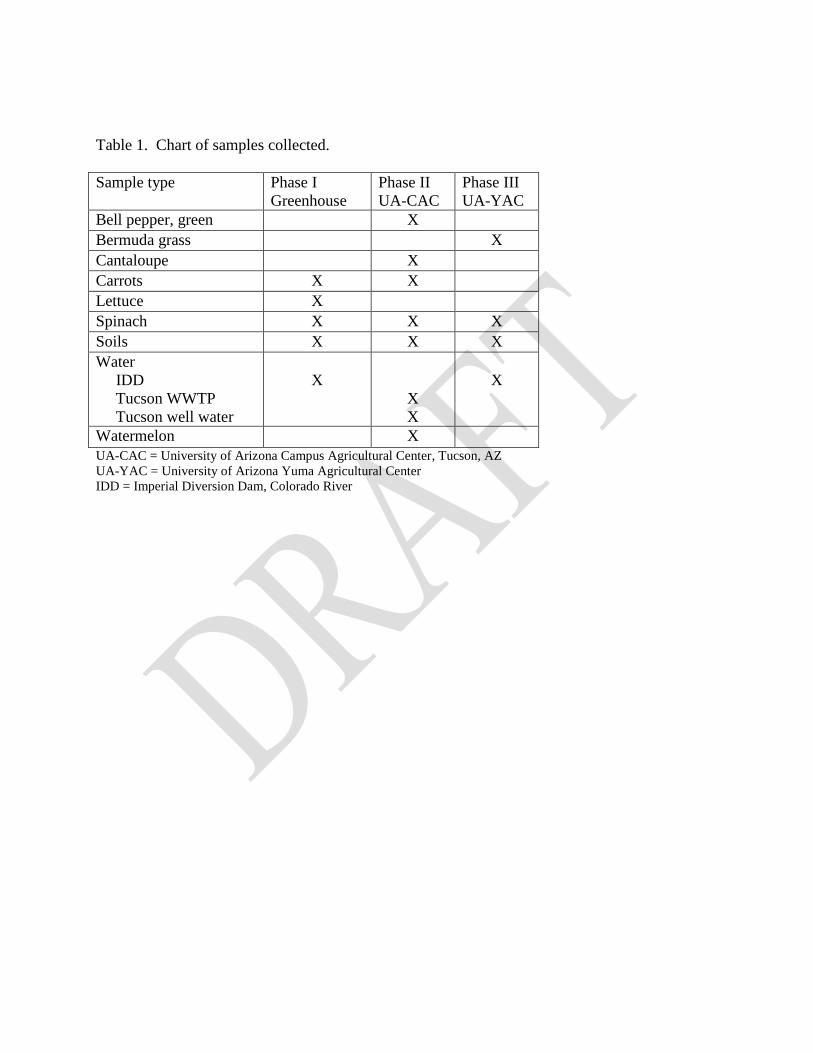
Table 1. Chart of samples collected.
Sample type Phase I
Greenhouse
Phase II
UA-CAC
Phase III
UA-YAC
Bell pepper, green X
Bermuda grass X
Cantaloupe X
Carrots X X
Lettuce X
Spinach X X X
Soils X X X
Water
IDD
Tucson WWTP
Tucson well water
X
X
X
X
Watermelon X
UA-CAC = University of Arizona Campus Agricultural Center, Tucson, AZ
UA-YAC = University of Arizona Yuma Agricultural Center
IDD = Imperial Diversion Dam, Colorado River

Table 2. Tucson wastewater effluent ECs concentrations.
collection
date
ng L-1
azithromycin roxithromycin clarithromycin methamphetamine n,n'-DMPEA pseudoephedrine
Tucson effluent 02/28/08 255 ND ND 144 ND 566
Tucson dup 02/28/08 255 ND ND 222 ND 713
Tucson well 03/24/09 ND ND ND ND ND ND
Tucson effluent 04/01/08 686 ND ND 288 ND 680
Tucson effluent 04/10/08 162 880 ND 155 21 229
Tucson effluent 04/29/08 323 ND ND 99 ND 86
Tucson effluent dup 04/29/08 285 ND ND 135 ND 76
Tucson effluent 05/29/08 259 ND ND 309 ND 158
Tucson effluent dup 05/29/08 267 ND ND 289 ND 216
Tucson well 05/29/08 ND ND ND ND ND ND
Tucson effluent 07/02/08 176 ND ND 568 ND 608 ND = not detected. n,n’-DMPEA = n,n’-dimethylphenethylamine

Table 3. Chemical and physical properties of loam soil used in field experiment Phase II & Phase III.
Parameter (unit) Value
Phase II Phase III
pH 8.2 7.8
EC (dS m-1
) 2.2 1.8
ESP (%) 3.3 4.1
Organic C (%) 0.7 1.2
Sand (%) 50 9
Silt (%) 38 53
Clay (%) 12 38
Nitrate-N (mg kg-1
) 42 20
Bicarbonate Soluble Phosphate (mg kg-1
) 24 27
EC=electrical conductivity and ESP=exchangeable sodium percentage.

Table 4. Emerging contaminants, molecular weight, precursor and product ions, and LODs. Analyte
CAS #
Molecular
weight (amu)
Precursor ions Product ion
(confirmation ions)
LOD
ng,
on-column
Azithromycin
(83905-01-5)
748.5 749.5 (M+H)+ 591.4 (M+H-C8H16O2N)
+ 0.5
Roxithromycin
(80214-83-1)
836.5 859.5 (M+Na)+ 755.4 (M+Na-C4H9O3)
+ 1
Clarithromycin
(81103-11-9)
747.5 748.4 (M+H)+ 590.1 (M+H-C8H16O2N)
+ 1
Clindamycin
(18323-44-9)
424.2 425.2 (M+H)+ 377.2 (M+H-SH-CH3)
+ 1
Methamphetamine
(537-46-2)
149.3 150 (M+H)+ 119 (M+H-CH3NH2)
+ 1.5
MDMA
(69610-10-2)
193 194 (M+H)+ 163.0 (M-CH3NH2+H)
+ 1
Pseudoephedrine
(90-82-4)
165.2 166 (M+H)+ 148.2 (M+H-H2O)
+ 0.5
n,n-dimethylphenethylamine
(1126-71-2)
149.2 150 (M+H)+ 105 (M-N(CH3)2)
+ 0.5
MW = molecular weight; LOD = limit-of-detection

Table 5. Accuracy and precision spiked recovery parameters (0.5 μg g-1
and 1 μg g-1
) from Bermuda grass, lettuce, spinach, carrots.
% Recovery (standard deviation; % relative standard deviation) †
Sample type
Compound
Bermuda
Roots
Lettuce leaf Lettuce
root Spinach leaf Spinach root Carrot root Carrot tops
Azithromycin 20 (± 4; 20%) 22 (± 2; 10%) 2 (± 1) 45 (± 9; 20%) 5 (± 1; 20%) 19 (± 6; 32%) 19 (± 1; 5%)
Roxithromycin 40 (± 3; 8%) 32 (± 5; 16%) 26 (± 2) 29 (± 4; 14%) 48 (± 4; 8%) 76 (± 17; 23%) 35 (± 5; 13%)
Clarithromycin 22 (± 6; 25%) 20 (± 2; 11%) 10 (± 1) 22 (± 4; 20%) 16 (± 3; 17%) 32 (± 9; 28%) 21 (± 3; 12%)
Clindamycin 33 (± 7; 22%) 30 (± 8; 26%) 22 (± 1) 23 (± 6; 26%) 38 (± 9; 24%) 35 (± 5; 15%) 32 (± 4; 12%)
Methamphetamine 44 (± 6; 14%) 24 (± 4; 16%) 15 (± 0) 21 (± 2; 7%) 33 (± 9; 28%) 30 (± 4; 15%) 36 (± 5; 13%)
MDMA 45 (± 8; 17%) 23 (± 1; 6%) 11(± 0) 23 (± 4; 18%) 22 (± 15; 69%) 26 (± 6; 21%) 26 (± 1; 4%)
n,n'-dimethylphenethylamine 47 (± 10; 21%) 29 (± 1; 5%) 17 (± 2) 22 (± 3; 13%) 23 (± 6; 28%) 29 (± 5; 16%) 38 (± 1; 2%)
Pseudoephedrine 50 (± 3; 6%) 27 (± 0; 0%) 17 (± 1) 24 (± 2; 8%) 20 (± 15; 74%) 23 (± 6; 28%) 28 (± 1; 4%) †n=3 for all sample types, except lettuce roots: n= 2; and carrot roots: n=6

Table 6. Phase I – Results from greenhouse study.
ng g-1
, n = 2
Spiked
Compound
Lettuce
leaf
Lettuce
Root
Spinach
leaf
Spinach
root
Carrot
greens
Carrot
root
Azithromycin ND ND ND ND ND ND
Roxithromycin ND < 10 ng g-1
LOQ ND ND ND 115
Clindamycin ND < 10 ng g-1
LOQ ND < 10 ng g-1
LOQ* ND 53
ND = not detected; *not enough sample for duplicate extraction.
Table 7. Phase II and III – Results from UA-CAC* field study and UA-YAC** field study. ng g
-1
Sample type
Analyte
Detected
Bermuda
Grass**
Bermuda
roots**
Cantaloupe*
Carrot
Roots*
Green bell
pepper*
Spinach*
Spinach**
Watermelon*
n,n'-DMPEA ND 125 53 ND 58 48 ND 180
Azithromycin ND 90 ND ND ND ND ND ND
Clarithromycin ND 135 ND ND ND ND ND ND ND = not detected; n,n’-DMPEA = n,n’-dimethylphenethylamine