The Dollar's Influence in East Asia: Benevolent or Overbearing?, by Gloria Koo

PRAGUE ECONOMIC PAPERS, 3, 2010 195
Articles
A CARDIOGRAPH OF THE DOLLAR´S QUALITY: QUALITATIVE EASING AND THE FEDERAL RESERVE BALANCE SHEET DURING THE SUBPRIME CRISIS
Philipp Bagus, Markus H. Schiml*
Abstract:In this article we argue that the balance sheet of a central bank contains valuable information for the quality of a currency. As an illustration we analyze the balance sheet of the Federal Reserve System (FED) during the subprime crisis between June 2007 and December 2008. Until September 2008 the balance sheet of the FED did not expand strongly. However, the structure of the FED assets varied pronouncedly. Starting in September 2008 the balance sheet expanded dramatically. The calculation of certain balance sheet ratios supports the assessment of an important decrease of the quality of the currency. Our analysis shows that the analysis of central bank balance sheet policies should not rely solely on quantitative issues but rather include qualitative issues.
Keywords: central banks‘ balance sheet, quality of money, qualitative easing, balance sheet analysis, subprime crisis
JEL Classifi cation: E 31, E 52, E 58, E 59, M 40
1. Introduction
During the subprime crisis the Federal Reserve acted as a “lender of the last resort” in an unprecedented scale. This dimension of the new monetary policies manifests itself in the balance sheet of the Federal Reserve System (FED). Consequently, the developments on the balance sheet of the FED have recently been analyzed in the light
* Philipp Bagus, Unversity Rey Juan Carlos, 28032 Madrid, Spain ([email protected]); Markus H. Schiml, University of Bayreuth, 95440 Bayreuth, Germany. Authors would like to thank Thomas DiLorenzo, Hans-Hermann Hoppe, David Howden, Juliusz Jablecki and Mateusz Machaj for helpful comments and suggestions.
DOI: 10.18267/j.pep.372

196 PRAGUE ECONOMIC PAPERS, 3, 2010
of the recent economic turmoil (Cecchetti, 2009; Carlson and Lindner, 2009; Bagus and Schiml, 2009; Brunnermeier, 2009). We will use a more thorough approach by applying the theory of balance sheet analysis used in business. The theory of balance sheet analysis used in business and resultant ratios thereof will prove to be helpful concerning the analysis of the Federal Reserve actions during the recent fi nancial crisis.1
We combine this theory with a qualitative approach to money, showing that the balance sheet of a central bank contains important information concerning the quality of a currency. We will, thus, show that qualitative easing reduced the quality of the dollar.
When we compare the asset side of the balance sheet in June 2007 before the crisis broke out with the more recent position of December 2008 we can observe important changes.
At fi rst sight, we see that a dramatic expansion of the balance occurred. Furthermore, there have arisen three completely new positions:
Term Auction Credit (TAC) (Loans of 28 to 84 days with a broad range of collateral)Net Portfolio of Maiden Lane LCC I-III (Assets purchased by the FED as a conse-
quence of the bail out of Bear Stearns and AIG)Commercial Paper Funding Facility (CPFF) (Funds a special purpose vehicle that
purchases three-month unsecured and asset-backed commercial paper)
In addition, the relative proportions of the different positions have changed substantially. Thus, the share of the position “Other assets“ containing foreign reserves and currency swaps climbed from 4 % to 27.44 % and the position “Other loans“ with the discount activities increased from almost 0 % to 8.26 %. At the same time the share of the position “Securities held outright“ containing U.S. Government bonds fell from 90.98 % to 22.00 %.
On the liability side of the balance sheet we see equally drastic changes. The share of deposits by depository institutions increased from 1.87 % to 36.27 %. The accounts of the Treasury also increased. The Treasury opened a supplementary account that rose to a share of 12.80 %. At the same time total capital fell from 3.81% to 1.88 %.
1 McKean (1949) provides an early exposition of the need to delve into the compositional holdings affecting the liquidity positions of central bank assets. Mishkin (1978) and Kiyotaki and Moore (2002) have provided more recent evidence that fi nancial calamities are propagated and transmitted through balance sheet compositional shifts.
DOI: 10.18267/j.pep.372

PRAGUE ECONOMIC PAPERS, 3, 2010 197
Table 1Asset Side of the Balance Sheet of the Federal Reserve System at the Beginning of the Crisis in June 2007 and in December 2008
Asset side of the FED balance sheet
June 2007 December 2008
Change
Absolute in %
Gold certi fi cate account 11,037(1.27%)
11,037(0.49%)
0 0.00%
Special drawing rights certi fi cate account
2,200(0.25%)
2,200(0.10%)
0 0.00%
Coins938
(0.11%)1,680
(0.07%)742 79.10%
Securities held outright790,497(90.98%)
496,892(22.00%)
-293,605
-37.14%
Repurchase agreements20,000(2.30%)
80,000(3.54%)
60,000 300.00%
Term auction credit0
(0%)450,219(19.93%)
450,219-
Other loans187
(0,0 %)186,630(8.26%)
186,443 99,702.14%
Net portfolio of Maiden Lane LLC0
(0%)75,206(3.33%)
75,206-
Commercial Paper Funding Facility 0
(0%)331,686(14.68%)
331,686-
Items in process of collection3,686
(0.42%)1,203
(0.05%)-2,483 -67.36%
Bank premises2,039
(0.23%)2,186
(0.10%)147 7.21%
Other assets
38,291(4%)
619,807(27.44%)
581,516
1,518.68%
Total 868,876 2,258,746 1,389,870 159.96%
DOI: 10.18267/j.pep.372

198 PRAGUE ECONOMIC PAPERS, 3, 2010
Table 2Liability Side of the Balance Sheet of the Federal Reserve System at the Beginning of the Crisis in June 2007 and in December 2008
Liability side of the FED‘s balance sheet
June 2007
December 2008
Change
Absolute in %
Federal Reserve notes775,052(89,2%)
849,716(37.61%)
74,664 9.63%
Reverse repurchase agreements30,134(3.47%)
88,317(3.91%)
58,183 193.08%
Deposits20,574(2.3%)
1,241,984(54.98%)
1,221,410 5,936.66%
Depository institutions16,221(1.87%)
819,404(36.27%)
803,183
4,951.50%
U.S. Treasury, general account4,039(0.4%)
118,058(5.23%)
114,019 2,822.95%
U.S. Treasury supplementary account0
(0%)289,247(12.80%)
289,247-
Foreign of fi cial97
(0,01 %)1,190
(0.05%) 1,093 1,126.04%
Other218
(0,02%)14,085(0.62%)
13,867 6,361.00%
Deferred availability cash items 3,838(0,4%)
2,537(0.11%)
-1,301 -33.89%
Other liabilities and accrued dividends6,131
(0.71%)33,673(1.49%)
27,542 449.22%
Total liabilities835,73
(96.18%)2216,227(98.11%)
1,380,497 165.84%
Total capital
33,145(3,81%)
42,517(1.88%)
9,372
28.27%
Total 868,875 2,258,744 1,389,869 159.96%
While these changes are dramatic, they beg the question of what their true relevance is. In this article, we answer this question by analyzing the evolution of the balance sheet of the FED pointing out its economic implications. First, we explain the economic signifi cance of the balance sheets of central banks concerning the quality of money. Second, we give a historical account of the subprime crisis in terms of changes in the balance sheet and balance sheet policies of the Federal Reserve. Third, we calculate and interpret certain balance sheet ratios for the FED, in order to shed light on where these qualitative effects have manifested. Fourth, we discuss the effects of the FED´s policies upon the aggregate balance sheet of commercial banks.
DOI: 10.18267/j.pep.372

PRAGUE ECONOMIC PAPERS, 3, 2010 199
2. The Economic Signifi cance of Central Bank´s Balance Sheets
The analysis of balance sheets and balance sheet policies is an established research fi eld in business studies and a practice conducted by investors, auditors, rating agencies, and stock exchange supervisors. While the theory of balance sheet analysis in business is well developed, the analysis of central banks´ balance sheets has been widely neglected in economic theory. The theory of balance sheet analyses in business and resultant ratios thereof is helpful for the analysis of the FED‘s actions during the subprime crisis. Specifi cally, the connection between the balance sheet analyses of business studies with a theory of the quality of money is useful.
The theory of the quality of money claims that the value of money is determined by its quality. Thereby the quantity of money is merely one of several factors that infl uence the quality of money.2 The quality of money can be defi ned as the capacity of a good, subjectively perceived by an actor to fulfi l money´s main functions, i.e., to serve as a medium of exchange, as a store of value and as a unit of account.3 Some of the factors that affect the function of money as a store of value are recorded in the central bank´s balance sheet. However, there are other important factors that affect the quality of a currency such as the current stage of the business cycle, government policies and the macroeconomic situation in general. Ultimately, the government and the whole economy stand behind a currency. This is so, because the government can subsidize and support its currency. Last, but not least, a government could recapitalize its central bank and the banking system improving the average quality of assets backing the currency. In order to support its currency, the government needs resources. For its support and, consequently, the quality of a currency, the government´s taxation capacity and the general state of the economy are essential.
An interesting example of a weak government that could not back up its currency is provided by Henry Hazlitt (1978, p.76). Hazlitt describes the case of a currency issued by the Japanese on the Philippines during World War II. As American forces pushed Japanese troops out of the Philippines the currency issued by the Japanese lost in value even though there was no increase in its supply.
In our further analysis of the quality of the dollar we will therefore incorporate and deal with standard macroeconomic variables that indicate the strength of the economy and infl ationary potentials.4 In fact, by constructing a link between the quality of money and the balance sheet of a central bank one may obtain misleading information if the current economic situation and macroeconomic variables are not taken into account. For instance, a central bank may expand its balance sheet by sterilizing foreign direct investments without leading to deterioration of the quality of a currency. In this manner the Czech National Bank has increased its balance sheet over the past several years. In a catching up process involving
2 Economists who have emphasized the quality of money are Mariana (1609), Menger (1871), Jevons (1875), Hazlitt (1978), Cunningham (1992).
3 For an intensive account on the quality of money and balance sheets, see Bagus (2009) and Bagus and Schiml (2008). For a case study concerning the quality of money see Bagus (2008).
4 There exists an extensive literature analyzing the effects of macroeconomic fundamentals on foreign exchange rates. See, for instance, Taylor (1995), Frankel and Rose (1996), MacDonald (1999), Ehrmann and Fratzscher (2004).
DOI: 10.18267/j.pep.372
200 PRAGUE ECONOMIC PAPERS, 3, 2010
high economic growth spurred by foreign direct investment, the Czech currency appreciated.5
Due to the importance of the general macroeconomic picture we must include macroeconomic variables into our analysis of the widely neglected relationship of the quality of money with the balance sheet of a central bank. Without looking on the macroeconomic development, the changes on the balance sheet of a central bank may be misinterpreted.
The evolution of the balance sheet of the central bank is important in understanding shifts in the perceived quality of money – in particular, changes on the asset side of the balance sheet. The central bank´s assets face and back the liability side of the balance sheet. In fact, assets represent the means that the central bank can use to defend the value of its currency internally and externally by selling them against their liabilities, i.e. the monetary base.
By analyzing the asset side of the central bank´s balance sheet we investigate the quality of the monetary base. Yet, for the quality of a currency we must also consider broader defi nitions of the money supply, i.e. M2 or M3, which are much larger and more important in economic transactions. Only a fraction of M2 or M3 is backed by assets of the central bank. These broader supplies of money are mainly backed by the assets of commercial banks. Therefore, we will also analyze the balance sheets of commercial banks. Nevertheless, in this article we concentrate on the balance sheet of the central bank out of several reasons. First, the balance sheet of the central bank sheds light upon changes in the balance sheets of commercial banks as the central bank interacts with them. Changes in the fi nancial system are concentrated on the balance sheet of the central bank. In fact, a deterioration of the balance sheet of the central bank is an indicator of problems of the banking system. Second, the evolution of the balance sheet of the central bank is more transparent and instructive than the evolution of the balance sheets of commercial banks. This is so, because it is easier to determine the quality of assets of a central bank. The balance sheets of central banks are clearer defi ned, less aggregated and more reliable than commercial banks´ balance sheets. Third, broader money supplies rest upon the monetary base. The quality of the monetary base, thus, infl uences also the quality of the broader money supplies.
When the central bank uses its assets to defend its currency, this procedure represents a de facto redemption. The holders of the currency “redeem“ it against the sold assets. The better the assets a central bank owns, the better it can guarantee the long-term value of its currency and its function as a store of value. Hence, the evolution of the assets of a central bank determines the quality of a currency and, consequently, its purchasing power.
Thus, the analysis of central bank balance sheets is very important for the evaluation of the quality of the currency. In fact, it is possible that the balance sheet total as well as monetary aggregates do not change, while the composition of the balance sheet deteriorates substantially. This can cause infl ationary pressure, as the assets backing the currency and consequently the currency´s quality deteriorate. Even in the face of quantitatively similar situations, qualitative changes can make remarkable difference
5 In fact, a balance sheet expansion must not involve a deterioration of the average quality of assets backing the liabilities of the central bank. In the case of sterilizing foreign direct investments, the central bank is buying liquid foreign currency adding assets of high quality to its balance sheet.
DOI: 10.18267/j.pep.372

PRAGUE ECONOMIC PAPERS, 3, 2010 201
in the overall value of a currency. In this context, quantitative easing may be defi ned as an expansion of the balance sheet of a central bank. Qualitative easing, however, is the deterioration of the average quality of the assets backing the liabilities of a central bank.6
Moreover, a deterioration in the quality of central bank assets may indicate the future development of monetary aggregates. Thus, it is possible to read from the balance sheet the limits for swaps of good assets against bad assets to stabilize the banking system. When the amount of good assets shrinks, it becomes at some point necessary to expand the balance sheet to lend additional support to the banking system. The expansion in turn can infl uence monetary aggregates. Furthermore, a deterioration of a central bank balance sheet can indicate an imminent recapitalization of the central bank by the government. The recapitalization entails the possibility of increases in the quantity of money to fi nance it, which also negatively affects the quality of money.
3. An Historical Account of the Current Crisis as Refl ected in the FED Balance Sheet Policies
The theoretical foundation we developed in the last section is especially useful in times when traditional tools to analyze monetary policy are limited. In fact, central banks of the world are reaching what economists call “the zero-bound” of interest rates – that point below which interest rates cannot be reduced below. The FED has already reached the zero-bound which makes an analysis of the FED balance sheet even more important in order to assess the FED's future monetary policy. In the following we analyze the balance sheet of the FED during the subprime crisis from June 2007 to December 2008 drawing on tools developed by Bagus and Schiml (2008). The most important qualitative changes occurred on the asset side of the FED balance sheet.
If we look upon the development of the asset side of the FED balance sheet as shown in Graph 1 we can roughly identify four different stages. During the fi rst stage of the crisis from June to December 2007 the structure and size of the balance sheet almost remained unchanged.
In December 2007 the second stage started in which we can see already a moderate change in the composition of the balance sheet indicating a qualitative easing. This can be seen in Graph 2 which shows development of the asset side in percentage terms.
6 Buiter (2009) defi nes qualitative easing differently. He defi nes qualitative easing as “a shift in the composition of the assets of the central bank towards less liquid and riskier assets, holding constant the size of the balance sheet.” The advantage of our defi nition is that it encompasses all deteriorations of the quality of a currency. Also quantitative easing may imply qualitative easing in our sense, when the expansion of the balance sheet deteriorates the average quality of the assets backing the liabilities.
DOI: 10.18267/j.pep.372

202 PRAGUE ECONOMIC PAPERS, 3, 2010
Graph 1Asset Side of the FED Balance Sheet from 06/2007 to 12/2008 (weekly, in million USD)
Source: FED (2008).
Graph 2Asset Side of the FED Balance Sheet from 06/2007 to 12/2008 (in %, weekly)
Source: FED (2008)
This stage ends between March and April 2008 when the collapse of Bear Stearns triggered more rapid changes in the composition of the balance sheet. In September 2008 and with the bankruptcy of the investment bank Lehman Brothers the compositional changes accelerated and were accompanied for the fi rst time by a signifi cant expanding of the balance sheet until December 2008. In the following we will look in detail on the monetary policy decisions of the FED that brought about these particular changes in the balance sheet.
DOI: 10.18267/j.pep.372
PRAGUE ECONOMIC PAPERS, 3, 2010 203
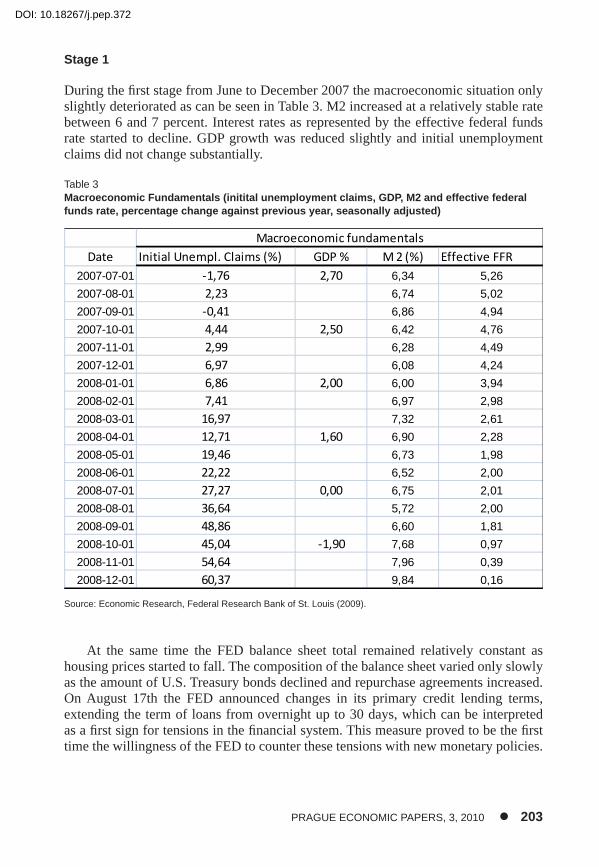
Stage 1
During the fi rst stage from June to December 2007 the macroeconomic situation only slightly deteriorated as can be seen in Table 3. M2 increased at a relatively stable rate between 6 and 7 percent. Interest rates as represented by the effective federal funds rate started to decline. GDP growth was reduced slightly and initial unemployment claims did not change substantially.
Table 3Macroeconomic Fundamentals (initital unemployment claims, GDP, M2 and effective federal funds rate, percentage change against previous year, seasonally adjusted)
Source: Economic Research, Federal Research Bank of St. Louis (2009).
At the same time the FED balance sheet total remained relatively constant as housing prices started to fall. The composition of the balance sheet varied only slowly as the amount of U.S. Treasury bonds declined and repurchase agreements increased. On August 17th the FED announced changes in its primary credit lending terms, extending the term of loans from overnight up to 30 days, which can be interpreted as a fi rst sign for tensions in the fi nancial system. This measure proved to be the fi rst time the willingness of the FED to counter these tensions with new monetary policies.
Date Initial Unempl. Claims (%) GDP % M 2 (%) Effective FFR
2007-07-01 -1,76 2,70 6,34 5,26
2007-08-01 2,23 6,74 5,02
2007-09-01 -0,41 6,86 4,94
2007-10-01 4,44 2,50 6,42 4,76
2007-11-01 2,99 6,28 4,49
2007-12-01 6,97 6,08 4,24
2008-01-01 6,86 2,00 6,00 3,94
2008-02-01 7,41 6,97 2,98
2008-03-01 16,97 7,32 2,61
2008-04-01 12,71 1,60 6,90 2,28
2008-05-01 19,46 6,73 1,98
2008-06-01 22,22 6,52 2,00
2008-07-01 27,27 0,00 6,75 2,01
2008-08-01 36,64 5,72 2,00
2008-09-01 48,86 6,60 1,81
2008-10-01 45,04 -1,90 7,68 0,97
2008-11-01 54,64 7,96 0,39
2008-12-01 60,37 9,84 0,16
Macroeconomic fundamentals
DOI: 10.18267/j.pep.372

204 PRAGUE ECONOMIC PAPERS, 3, 2010
Stage 2
In December 2007 the fi nancial crisis gained momentum. Macroeconomic fundamentals started to deteriorate and with it the quality of the dollar (Table 3). While GDP growth remained positive, initial unemployment claims increased by 7% in December 2007. M2 growth remained stable and effective federal funds rates continued to decrease indicating the expansionary policy of the FED. As a consequence of the deteriorating macroeconomic conditions, problems for banks increased. Citigroup was forced to support its off-balance entities, i.e. structured investment vehicles (SIVs), it had sponsored and that had suffered refi nancing problems. As a consequence, during the second stage the sale of government bonds accelerated and was sterilized by the acceptance of new loans to offset the transactions. These loans were granted to the troubled banking system mainly via the newly installed “term auction facility“ (TAF). The term auction credits are 28 day to 35 day loans to a broader range of counter parties and against a broader range of collateral than the more conventional open market operations.7 The term auction credits have continuously increased throughout the current crisis. One characteristic of the TAF is its low transparency, which negatively affects the quality of these credits. In fact, the exact quality of the accepted collateral remains unclear and names of borrowers have, to date, still not been released. The TAF has, consequently, lead to complaints about the insuffi cient transparency of FED policies.8 Similar problems have also occurred with other new credit programs that will be discussed below. The lack of transparency of FED policies increases the uncertainty concerning the quality of the assets backing the currency and contradicts the basic principle of accountability.9,10
Stage 3
In 2008 the situation in the real economy and, especially, in the housing sector worsened. In August 2008 the increase in initial unemployment claims soared to 36%. GDP growth fell to zero in the second quarter 2008. While monetary growth remained stable, the effective federal funds rate decreased at a faster rate to 2% (Table 3). The deterioration of macroeconomic fundamentals implied a deterioration of the quality of the dollar.
The macroeconomic situation increased banks´ problems further. The fi nancial crisis entered a new stage in March 2008 when Bear Stearns found itself in refi nancing problems and was subsequently saved by the FED. As a consequence of the rescue of Bear Stearns, the FED acquired the dubious and illiquid assets of Bear Stearns that JP Morgan Chase did not want to acquire and add on its own balance sheet. These assets can be found on the FED balance sheet in the position “Net portfolio of Maiden
7 Additionally, on August 11th 2008 the FED started to grant term auction credits of 84 days.
8 See Pittman, Ivry and Fitzgerald (2008). Also Pittman (2008).
9 In contrast to the FED, the European Central Bank claims to adhere to the principles of transparency and accountability. See Issing (2005).
10 Hayek (1925) criticizes accounting practices of the FED regarding their transparency as early as 1924. Rothbard (2008) advances a similar critique in regard to the accounting practices during the Hoover administration.
DOI: 10.18267/j.pep.372

PRAGUE ECONOMIC PAPERS, 3, 2010 205
Lane LLC.” Moreover, concurrent with the measures to rescue Bear Stearns, starting from March 16th the term of primary credit lending was again increased from 30 to 90 days. On March 17th the primary credit dealer facility (PCDF) was installed. This facility enables primary dealers to use the discount window while accepting as collateral mortgage backed securities. This was the fi rst time that the FED lent directly to investment banks. These measures had the goal of injecting liquidity into a perceived illiquid interbank-market.
Beginning on March 27th the “Term Securities Lending Facility” (TSLF) was installed.11 In this facility primary dealers can borrow U.S. Treasury bonds from the FED by pledging as collateral securities of lower quality. Thus, the banking system was provided with U.S. Treasury bonds that banks could themselves offer as collateral. This measure further deteriorated the position of the central bank (replacing high quality with lower quality assets), even though the lending does not appear in the balance sheet itself but as a memorandum item.
Graph 3“Term Securities Lending Facility“ (TSLF) and “Securities Held Outright” (SHO) (January 2008 to December 2008, weekly in million USD)
Source: FED (2008).
As can be seen in Graph 3, the amount of U.S. Treasury bonds the FED could use for its policies has been reduced signifi cantly throughout the crisis. The FED not only sold Treasury bonds, it also increasingly lent them out. As a result, in September 2008 it became foreseeable that the FED would soon run out of liquid assets like Treasury bonds. Thus, lacking the required offsetting assets, the sterilization of the increase of the new loans to the banking system by the sale of good assets was coming to a necessary end. The FED capacity to support the fi nancial system by changes in the composition of its balance sheet and the lending of its most liquid assets had reached
11 The Term Securities Facility appears on the balance sheet the fi rst time on March 27th 2008. Before that date, they had been called ”Securities Lend to Dealers“ which had, to that point, been a fairly small position on the FED balance sheet.
DOI: 10.18267/j.pep.372
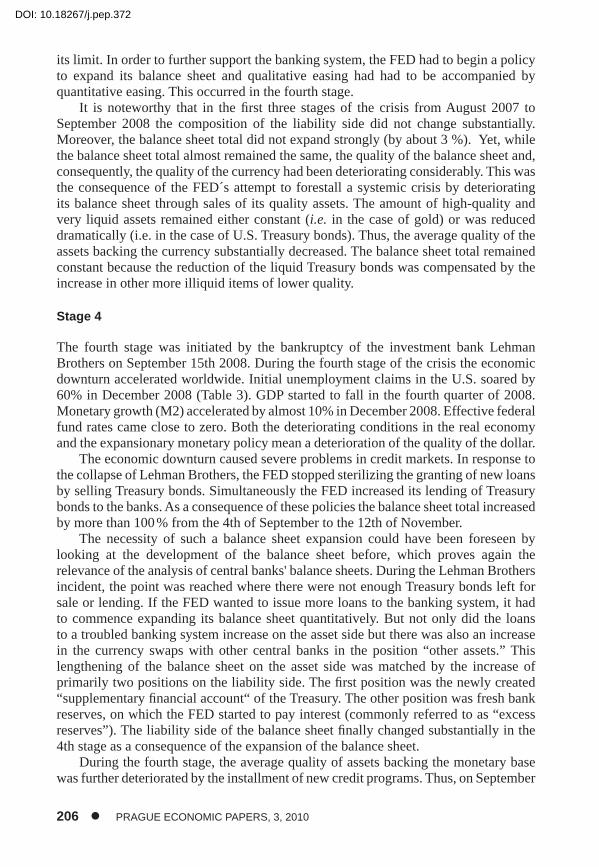
206 PRAGUE ECONOMIC PAPERS, 3, 2010
its limit. In order to further support the banking system, the FED had to begin a policy to expand its balance sheet and qualitative easing had had to be accompanied by quantitative easing. This occurred in the fourth stage.
It is noteworthy that in the fi rst three stages of the crisis from August 2007 to September 2008 the composition of the liability side did not change substantially. Moreover, the balance sheet total did not expand strongly (by about 3 %). Yet, while the balance sheet total almost remained the same, the quality of the balance sheet and, consequently, the quality of the currency had been deteriorating considerably. This was the consequence of the FED´s attempt to forestall a systemic crisis by deteriorating its balance sheet through sales of its quality assets. The amount of high-quality and very liquid assets remained either constant (i.e. in the case of gold) or was reduced dramatically (i.e. in the case of U.S. Treasury bonds). Thus, the average quality of the assets backing the currency substantially decreased. The balance sheet total remained constant because the reduction of the liquid Treasury bonds was compensated by the increase in other more illiquid items of lower quality.
Stage 4
The fourth stage was initiated by the bankruptcy of the investment bank Lehman Brothers on September 15th 2008. During the fourth stage of the crisis the economic downturn accelerated worldwide. Initial unemployment claims in the U.S. soared by 60% in December 2008 (Table 3). GDP started to fall in the fourth quarter of 2008. Monetary growth (M2) accelerated by almost 10% in December 2008. Effective federal fund rates came close to zero. Both the deteriorating conditions in the real economy and the expansionary monetary policy mean a deterioration of the quality of the dollar.
The economic downturn caused severe problems in credit markets. In response to the collapse of Lehman Brothers, the FED stopped sterilizing the granting of new loans by selling Treasury bonds. Simultaneously the FED increased its lending of Treasury bonds to the banks. As a consequence of these policies the balance sheet total increased by more than 100 % from the 4th of September to the 12th of November.
The necessity of such a balance sheet expansion could have been foreseen by looking at the development of the balance sheet before, which proves again the relevance of the analysis of central banks' balance sheets. During the Lehman Brothers incident, the point was reached where there were not enough Treasury bonds left for sale or lending. If the FED wanted to issue more loans to the banking system, it had to commence expanding its balance sheet quantitatively. But not only did the loans to a troubled banking system increase on the asset side but there was also an increase in the currency swaps with other central banks in the position “other assets.” This lengthening of the balance sheet on the asset side was matched by the increase of primarily two positions on the liability side. The fi rst position was the newly created “supplementary fi nancial account“ of the Treasury. The other position was fresh bank reserves, on which the FED started to pay interest (commonly referred to as “excess reserves”). The liability side of the balance sheet fi nally changed substantially in the 4th stage as a consequence of the expansion of the balance sheet.
During the fourth stage, the average quality of assets backing the monetary base was further deteriorated by the installment of new credit programs. Thus, on September
DOI: 10.18267/j.pep.372

PRAGUE ECONOMIC PAPERS, 3, 2010 207
19th 2008 the FED started the “Asset Backed Commercial Paper Money Market Mutual Fund Liquidity Facility” (AMLF). This program may be located under the heading of “Other Loans“. In this program “Asset Backed Commercial Papers” were accepted as collateral, in order to sustain the liquidity of money market mutual funds. Hence, securities were accepted as collateral that were not traded anymore on the market or only traded at considerable discounts. “Other Credit Extensions” in “Other Loans” also contained rescue loans to the insurance company American International Group (AIG). On October 27th another credit program started, the “Commercial Paper Funding Facility” (CPFF), accepting unsecured commercial paper as collateral. Finally, on November 24th the “Money Market Investor Funding Facility“ was established in order to increase liquidity in money markets. This allowed money market mutual funds to receive indirect funding from the FED. The funds, in turn, set up a special purpose vehicle, which could obtain loans by the FED by pledging asset backed commercial paper as collateral.
On 25th of November 2008 the president of the FED Ben Bernanke announced further unconventional policies. These policies included the direct purchase of debt by Fannie Mae, Freddie Mac and the Federal Home Loan Banks. As a result, the position “Federal Agency” under securities held outright increased from $12 billion on the 26th of November to $19 billion on the 24th of December 2008. Bernanke also announced the plan to purchase mortgage backed securities issued by Fannie Mae, Freddie Mac and Ginnie Mae which became effective on January 15th 2009. By these purchases, the FED assumed additional direct credit risk. Bernanke also mentioned the possibility of acquiring long-term government debt that came into effect in spring 2009.
On November 28th some technical changes of the balance sheet occurred. For the fi rst time the “Money Market Investor Funding Facility” (MMIFF) appeared. Moreover, the accounting method relating to the loans made to AIG was changed. Thus, “other credit extensions” containing the loans to AIG was substituted by the item “Credit extended to AIG.” Furthermore, “Maiden Lane III” was instituted to buy collateralized debt obligation (CDOs), that AIG had insured by credit default swaps (CDS). On December 18th, “Maiden Lane II” followed suit representing mortgage backed securities bought from AIG.
4. An Analysis of the Funds Statement
A funds statement is a tool of business balance sheet analysis that can help to reveal and summarize the origins of the changes in the FED balance sheet resulting from the described policies. We have calculated the differentials of the positions on both the asset and liability sides between June 28th 2007 and December 29th 2008. Positive changes or increments on the asset side are investments. Negative changes on the asset side are disinvestments. Positive changes on the liability side mean fi nancing through equity or debt. Negative changes at the liability side represent defi nancing defi ned as paying off loans. All these differentials are represented by a differential balance. We split the differentials into two categories: statement of sources and application of funds. The sources stem from fi nancing and disinvestment activities, while the application of funds is for investment and defi nancing. The following table shows the FED funds statement throughout the crisis:
DOI: 10.18267/j.pep.372

208 PRAGUE ECONOMIC PAPERS, 3, 2010
Table 4Funds Statement between June 2007 and December 2008 (in million USD)
Application of funds Statement of sources
Investment Disinvestment
Coin 742 Securities held outright 293.605
Repurchase agreements 60.000 Items in process of collection 2.483
Term auction credit 450.219
Other loans 186.443 Financing
Maiden Lane I-III 75.206 FED notes, net of FR Bank holdings 74.664
Commercial Paper Funding Facility (CPFF)
331.686 Reverse repurchase agreements 58.183
Bank premises 147 Depository institutions 803.183
Other assets 581.516 U.S. treasury, general account 114.019
U.S. Treasury, supplementary fi nancing account
289.247
Defi nancing Foreign offi cial 1.093
Deferred availability cash items
1.301 Other 13.867
Other liabilities and accrued dividends 27.542
Surplus 1.448
capital paid in 4.960
other capital accounts 2.964
Total 1.687.258 Total 1.687.258
Source: FED (2008), own calculations
We see that the majority of the balance sheet´s expansion was fi nanced by debt. The debt mainly stems from two sources. First, the Treasury´s general account as well as the new “Supplementary Financing Account” increased sharply. The supplementary fi nancing account was explicitly established in order to allow the FED to fi nance its new credit programs. Second, the bank reserves (reserves of depository institutions) grew strongly as banks received new reserves out of the new credit programs. Banks did not use the (excess) reserves to grant loans as they feared the credit-worthiness of borrowers, and additionally tried to improve their own balance sheets and received interest on these excess reserves held at the FED starting in October 2008. In addition funds were released by the sale of U.S. Treasury bonds (“Securities Held Outright”) in the form of disinvestments.
This enormous infl ow of funds was mainly used for investments in low-quality assets like “Term auction credits,” discount activities “Other Loans,” the CPFF, as
DOI: 10.18267/j.pep.372

PRAGUE ECONOMIC PAPERS, 3, 2010 209
well as currency swaps in the position “Other Assets.” As a consequence, the fi nancing by increasing the government debt and the monetary base negatively affected the quality of money. Moreover, the disinvestment in Treasury bonds deteriorated the average quality of the FED assets. The application of funds also infl uenced the quality of money negatively by acquiring low-quality credits. Thus, the sources of funds as well as the application of funds deteriorated the quality of money. This development directly resulted from the strategy of the FED to alleviate the credit crunch and save the fi nancial system from a possible collapse. Hence, the funds statement summarizes vividly the deterioration of the balance sheet and, consequently, the quality of money.
5. An Analysis of the FED Balance Sheet Ratios
The changes in the balance sheet can also be analyzed calculating certain central bank balance sheet ratios as developed by Bagus and Schiml (2008). These ratios concentrate important characteristics of the balance sheet. They help to display changes in the balance sheet and can, consequently, assist with the analysis. One of these ratios is the “Defense ratio I.” This ratio portrays the capacity of a central bank to defend its own currency in the international currency markets by selling foreign reserves. It is calculated by dividing the amount of foreign reserves by the balance sheet total. The higher the amount of foreign reserves in relation to the balance sheet total, the better the exchange rate can be defended. In calculating this ratio for the FED we did not count foreign currency swaps as foreign reserves. “Defense ratio II” puts the amount of foreign reserves into relation to the U.S. gross external debt in foreign currency. It shows to which extent the central bank could substitute foreign denominated debtors with its own reserves stabilizing the economic system. The evolution of the defense ratios is depicted in the following graph:
Graph 4Defense Ratio I and II (June 2007 to December 2008, in %, monthly and quarterly)
Source: FED (2008).
DOI: 10.18267/j.pep.372

210 PRAGUE ECONOMIC PAPERS, 3, 2010
While defense ratio I had remained stable between 6 and 7 %, in September 2008 it collapsed to below 3 %. As a consequence, it became more diffi cult for the FED to support its currency by intervening in the foreign exchange markets. Defense ratio II did not change substantially. It shows that the FED accomplished to stabilize the economy.
One important group of central bank balance sheet ratios are liquidity ratios that indicate the portion of liquid assets of the balance sheet compared to the total assets of a central bank. The fi rst-degree liquidity ratio can be defi ned as the sum of gold and foreign reserves divided by the balance sheet total. The second-degree liquidity ratio adds liquid and high-quality government bonds to the gold and foreign reserves dividing them again by the balance sheet total. The adjusted second-degree liquidity ratio subtracts from the numerator of the second-degree liquidity ratio the amount of lent government bonds, as they are not in the direct possession of the central bank.
The rationale of liquidity ratios is to show how high the portion of high quality assets is in relation to the whole of the balance sheet. These good assets tend to be liquid in times of crisis and can be used to maintain the value of the currency. The more liquid a central bank is, the easier it can sterilize infl ationary measures in support of the banking system and exit expansionary policies. Liquidity ratios can change due to variations of the numerator and the denominator. This implies that even with a constant balance sheet total the liquidity ratio and consequently also the quality of a currency can change. The development of the liquidity ratios is depicted in the following Graph 5:
Graph 5Liquidity Ratios (June 2007 to November 2008, monthly)
Source: FED (2008).
All liquidity ratios have been continuously declining throughout the crisis. They declined in the beginning due to a reduction in the numerator. Later, in the fourth stage with the expansion of the balance sheet, they declined mainly due to an increase in
DOI: 10.18267/j.pep.372

PRAGUE ECONOMIC PAPERS, 3, 2010 211
the denominator. The most striking and descriptive liquidity ratio in this crisis is the adjusted second-rate liquidity, which deteriorated substantially. It portrays vividly the capacities of the FED to intervene in favour of its currency and, thus, illustrates the overall condition of the fi nancial system and the currency. It also shows that an exit from the expansionary policies is diffi cult as illiquid assets cannot be sold easily to the market.
A last important ratio is the equity ratio which indicates the leverage of a central bank. Its importance lies in the function of equity to cushion losses. When the central bank suffers losses on its assets, equity can absorb and offset them. A low or negative equity ratio makes a recapitalization by the government likely. This recapitalization would lead to an increase in the government defi cit and enhances the probability of the monetization of this debt. The monetization of government debts increases the quantity of money and, thereby, affects negatively the quality of money.
Graph 6Equity Ratio of the FED during the Subprime Crisis (6/2007-12/2008)
Source: FED (2008).
As we can see the equity ratio of the FED increased slightly during the fi rst two stages of the crisis and started to consolidate in March 2008. In the fourth stage the equity ratio dropped due to the expansion of the balance sheet. As a consequence, the leverage increased from about 20 to over 50. If the FED suffers only losses of 2% of its assets, a recapitalization will become necessary.12 As we have seen, the quality of the assets of the FED decreased substantially, which increases the risk of losses on their assets. The development of the equity ratio is problematic in relation to the value and the trust in the dollar. In fact, the Basel II regulation would not have allowed for such a low equity ratio as low equity ratios are known to endanger the stability of the fi nancial system.
12 On the possibility of insolvency of central banks see Buiter (2008).
DOI: 10.18267/j.pep.372

212 PRAGUE ECONOMIC PAPERS, 3, 2010
Yet, the balance sheet of the FED includes hidden reserves in the gold position held by the FED. These hidden reserves would enhance the equity ratio if revalued from their offi cial position. The gold reserves are still valued at $42.44 per troy ounce. Counting on 8.134 tons of gold and a market price substantially higher than 800 USD implies an important amount of hidden reserves. The adjusted equity ratio as depicted in Graph 8 would then be about 15% and indicates a much higher quality of the currency, based upon true market values. While the solvency of the FED deteriorated there is no imminent danger of balance sheet insolvency.
Graph 7Adjusted Equity Ratio of the FED during the Subprime Crisis (6/2007-12/2008)
Source: FED (2008).
7. Effects upon the Balance Sheet of the Banking System
Our analysis would not be complete without an analysis of the balance sheet of the banking system. In fact, the aggregate balance sheet of all banks in a country plays a key factor for the quality of a currency. An illiquid or insolvent banking system makes a bail out by the government or the central bank more likely. These bail outs are often fi nanced by an increase in the money supply or qualitative easing, deteriorating the quality of the currency. In fact, qualitative easing is often a response to problems of the whole banking sector.
We will now analyze if the qualitative easing of the FED was successful. The FED deteriorated its balance sheet in order to support the banking system. Therefore, the balance sheet of the banking system should mirror the policies of the FED. Indeed, the aggregate balance sheet of commercial banks improved throughout the crisis as can be seen in Table 5 and 6.
DOI: 10.18267/j.pep.372

PRAGUE ECONOMIC PAPERS, 3, 2010 213
Table 5Asset Side of the Aggregate Balance Sheet of Commercial Banks at the End of the 2 nd Quarter
2007 and at the End of the 4th Quarter 2008 (billions of dollars, not seasonally adjusted)
Asset side of the aggregate balance sheet of commercial banks
Q2 2007 Q4 2008 Change
Absolute in %
Cash in vault43.5
(0,41%)55.6
(0.41%)12.1 27.81%
Reserves at Federal Reserve15
(0.14%)819.7
(6.11%)804.7 5364.66%
Treasury securities95.9
(0.91%)93.5
(0.69%) -2.4 -2.50%
Agency- and GES-backed securities institutions
1124.3(10.75%)
1168.2(8.70%)
43.9 3.90%
Other securities1038.8(9.94%)
1204.2(8.97%)
165.4 15.92%
Mortgages3472
(33.22%)3841.3
(28.63%)369.3 10.36%
Consumer credit737.7
(7,06 %)878.5
(6.54%)140.8 19.086%
Security credit300.2
(2,87%)220.9
(1.64%) -79.3 -26.41%
Other bank loans 1769.5
(16.93%)2238.9
(16.68%) 469.4 26.52%
Other assets1853.4
(17.73%)2895.9
(21.58%)1042.5 56.247%
Total assets 10450.3 16416.7 2966.4 28.38%
Source: FED (2009), own calculations.
DOI: 10.18267/j.pep.372
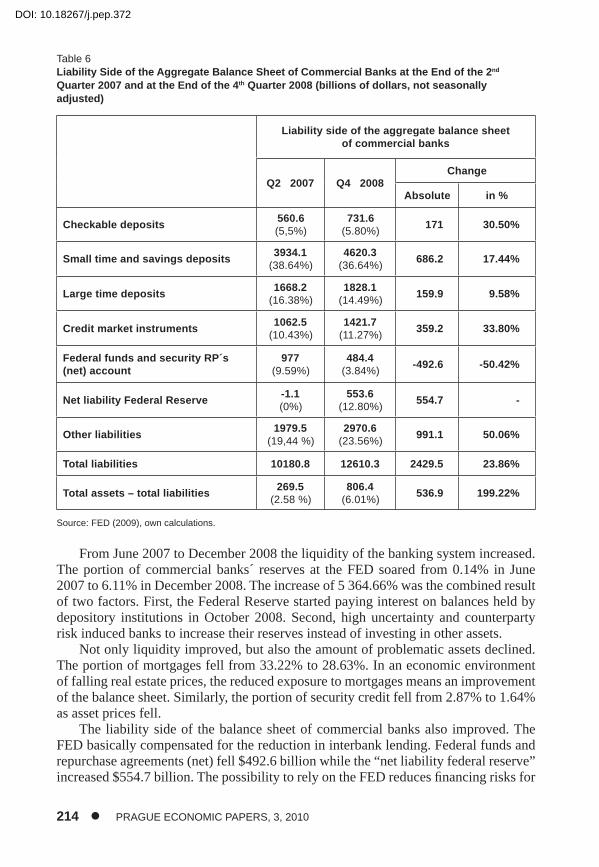
214 PRAGUE ECONOMIC PAPERS, 3, 2010
Table 6Liability Side of the Aggregate Balance Sheet of Commercial Banks at the End of the 2 nd
Quarter 2007 and at the End of the 4 th Quarter 2008 (billions of dollars, not seasonally adjusted)
Liability side of the aggregate balance sheet of commercial banks
Q2 2007 Q4 2008 Change
Absolute in %
Checkable deposits560.6(5,5%)
731.6(5.80%)
171 30.50%
Small time and savings deposits3934.1
(38.64%)4620.3
(36.64%) 686.2 17.44%
Large time deposits1668.2
(16.38%)1828.1
(14.49%) 159.9 9.58%
Credit market instruments1062.5
(10.43%)1421.7
(11.27%) 359.2 33.80%
Federal funds and security RP´s (net) account
977(9.59%)
484.4(3.84%)
-492.6 -50.42%
Net liability Federal Reserve-1.1(0%)
553.6(12.80%)
554.7 -
Other liabilities1979.5
(19,44 %)2970.6
(23.56%) 991.1 50.06%
Total liabilities 10180.8 12610.3 2429.5 23.86%
Total assets – total liabilities269.5
(2.58 %)806.4
(6.01%) 536.9 199.22%
Source: FED (2009), own calculations.
From June 2007 to December 2008 the liquidity of the banking system increased. The portion of commercial banks´ reserves at the FED soared from 0.14% in June 2007 to 6.11% in December 2008. The increase of 5 364.66% was the combined result of two factors. First, the Federal Reserve started paying interest on balances held by depository institutions in October 2008. Second, high uncertainty and counterparty risk induced banks to increase their reserves instead of investing in other assets.
Not only liquidity improved, but also the amount of problematic assets declined. The portion of mortgages fell from 33.22% to 28.63%. In an economic environment of falling real estate prices, the reduced exposure to mortgages means an improvement of the balance sheet. Similarly, the portion of security credit fell from 2.87% to 1.64% as asset prices fell.
The liability side of the balance sheet of commercial banks also improved. The FED basically compensated for the reduction in interbank lending. Federal funds and repurchase agreements (net) fell $492.6 billion while the “net liability federal reserve” increased $554.7 billion. The possibility to rely on the FED reduces fi nancing risks for
DOI: 10.18267/j.pep.372

PRAGUE ECONOMIC PAPERS, 3, 2010 215
commercial banks. Lastly, the improvements of balance sheets involved a deleveraging. The difference between total assets and total liabilities increased from 2.58% to 6.01% of the balance sheet total. Thereby, the risk of balance sheet insolvency of the banking system was reduced.
In sum, while the balance sheet of the FED deteriorated the balance sheet of the commercial banking system improved slightly. Thus, the FED accomplished the stabilization of the fi nancial system. Nevertheless, problems remain. There may still be bad assets on the balance sheet of the banking system. Moreover, when the FED took bad assets from the U.S. banks balance sheets on its balance sheet, it was just a shift in the assets´ owner. The bad assets did not disappear. They were exchanged against good assets. This shift implies a deterioration of the quality of the currency, because further support of the banking system has become more diffi cult. The FED has already given great part of its good assets to the banking system via qualitative easing. Additional support would require highly infl ationary quantitative measures as sterilization options are exhausted.
8. Concluding Remarks
Recent developments in monetary policy make the qualitative analysis of central banks’ balance sheets very important. New analytical tools are necessary for the evaluation of monetary policy. One such tool is the balance sheet analysis, such as is undertaken in this article. An analysis of the balance sheet of the FED from the beginning of the crisis in June 2007 to December 2008 has illustrated our points and provided important insights pertaining to the quality of the dollar.
During the fi rst three stages the FED limited its balance sheet policies to swap liquid and low-risk assets against relatively more illiquid and riskier ones. New credit programs appeared while U.S. Treasury bonds were sold, supporting the banking system. Thus, the granting of credits to the troubled banking system did not expand the balance sheet but was sterilized by the sale of Treasury bonds. As a consequence, banks’ balance sheets improved and the central banks’ balance sheet deteriorated.
The average quality of the assets backing the dollar deteriorated in the fourth stage of this current (and ongoing) credit crisis, i.e. there was qualitative easing. This was accompanied by a substantial expansion of the balance sheet, i.e. quantitative easing, and an increase in the monetary base. The funds statement shows that the increase in emergency credit programs was fi nanced mainly by (excess) bank reserves and by the Treasury. Several ratios, like defense ratio I, the liquidity ratios and the equity ratio deteriorated considerably indicating the deterioration of the FED's balance sheet. As a strong central bank balance sheet is essential for the quality of a currency, the quality of the dollar deteriorated as a result.
Beside the balance sheet policies of central banks there are other factors that affect the value of a currency such as the current stage of the business cycle, the liquidity situation of the banking system and the macroeconomic situation in a country. We have seen that the macroeconomic situation of the U.S. deteriorated during the crisis reducing the quality of the dollar. Further research may provide comparative analyses of different monetary zones and combine them with the analysis of qualitative easing
DOI: 10.18267/j.pep.372

216 PRAGUE ECONOMIC PAPERS, 3, 2010
on currency values. Balance sheets of other central banks and their banking systems may be analyzed and compared; for now we leave this to future research.
References
Bagus, Ph. (2008), “Defl ation, Growth and the Quality of Money – a Revealing Chapter of Monetary History from 1865 to 1896.” German Review of New Austrian Economics, 2 (2).
Bagus, Ph. (2009), “The Quality of Money.” Quarterly Journal of Austrian Economics, 12 (4), pp. 41–64.
Bagus, Ph., Schiml, M. H. (2008), “Bilanzpolitik und –analyse von Notenbanken im Kontext der Qualitätstheorie des Geldes.“ German Review of New Austrian Economics, 2 (3).
Bagus, Ph., Schiml, M. H. (2009), “New Modes of Monetary Policy: Qualitative Easing by the Fed.“ Economic Affairs, 29 (2), pp. 46–49.
Brunnermeier, M. K. (2009), “Deciphering the Liquidity and Credit Crunch 2007–2008.“ Journal of Economic Perspectives, 23 (1), pp. 77–100.
Buiter, W. (2008), “Can Central Banks Go Broke?“ Policy Insight No. 24, Centre for Economic Policy Research.
Buiter, W. (2009), “Quantitative and Qualitative Easing Again.“ Financial Times Maverecon Blog. 11th January 2009. Available at: http://blogs.ft.com/maverecon/2009/01/quantitative-and-qualitative-easing-again/. (Accessed: 30.06.2010)
Carlson, J., Lindner, J. (2009), The Changing Composition of the Fed’s Balance Sheet. Economic Trends, The Federal Reserve Bank of Cleveland (Sept.), pp. 6-9.
Cecchetti, St. G. (2009), “Crisis and Responses: The Federal Reserve in the Early Stages of the Financial Crisis.“ Journal of Economic Perspectives, 23(1), pp. 51–75.
Cunningham, Th. J. (1992), “Some Real Evidence on the Real Bills Doctrins versus the Quantity Theory.“ Economic Inquiry, 30 (2), pp. 371–83.
Ehrmann, M., Fratzscher, M. (2004). “Exchange Rates and Fundamentals – New Evidence from Real-Time Data.” ECB Working Paper Series No. 365.
Frankel, J. A., Rose, A. K. (1996). “Currency Crashes in Emerging Markets: An Empirical Treatment.” Journal of International Economics, (41), pp. 351–366.
Federal Reserve (2008), Federal Reserve Statistical Release H.4.1.: Factors Affecting Reserve Balance. http://www.federalreserve.gov/releases/h41/ (Accessed: 08.08.2009)
Hayek, F. A. v. (1925), “Die Währungskrise der Vereinigten Staaten seit der Überwindung der Krise von 1920.“ Zeitschrift für Volkswirtschaft und Sozialpolitik 5, pp. 25–63 and 254–317.
Hazlitt, H. (1978), The Infl ation Crisis, and How to Resolve It. New Rochelle, NY: Arlington House.
Jevons, W. St. [1875] (1876), Money and the Mechanism of Exchange. New York: D. Appleton and Co.
Issing, O. (2005), “Kommunikation, Transparenz, Rechenschaft – Geldpolitik im 21. Jahrhundert.“ Perspektiven der Wirtschaftspolitik, 6, pp. 521–540.
Kiyotaki, N., Moore, J. (2002), “Balance-Sheet Contagion.“ American Economic Review 92(2), Papers and Proceedings, pp. 46–50.
Mariana, J. de [1609] (1994), De Monetae Mutatione. Edited by Josef Falzberger. Heidelberg: Manutius Verlag.
MacDonald, R. (1999), “Exchange Rate Behaviour: Are Fundamentals Important?“ The Economic Journal, 109 (456), pp. F673-F691.
McKean, R. N. (1949), “Liquidity and a National Balance Sheet.“ Journal of Political Economy 57 (6), pp. 506–522.
Menger, C. (1871), Grundsätze der Volkswirtschaftslehre. Vienna: Wilhelm Braumüller.
DOI: 10.18267/j.pep.372

PRAGUE ECONOMIC PAPERS, 3, 2010 217
Mishkin, F. S. (1978), “The Household Balance Sheet and the Great Depression.“ The Journal of Economic History, 38 (4), pp. 918–937.
Pittman, M. (2008), “Fed Refuses to Disclose Recipients of $2 Trillion.“ Bloomberg. December 12th 2008. http://www.bloomberg.com/apps/news?pid=20601109&sid=apx7XNLnZZlc&refer=home (Accessed: 08.08.2009)
Pittman, M., Ivry, B., Fitzgerald, A. (2008), “Fed Defi es Transparency Aim in Refusal to Disclose (Update 2).“ Bloomberg. November 10th, 2008. http://www.bloomberg.com/apps/news?pid=2060 1087&sid=aatlky_cH.tY&refer=worldwide (Accessed: 08.08.2009).
Rothbard, M. N. (2000), America‘s Great Depression, 5th Ed. Auburn, Ala.: Ludwig von Mises Institute.
Taylor, M. P. (1995), “The Economics of Exchange Rate.“ Journal of Economic Literature, 33 (1), pp. 13–47.
DOI: 10.18267/j.pep.372