A Blueprint for Using Data to Reduce Disparities ...
53
A Blueprint for Using Data to Reduce Disparities/ Disproportionalities in Human Services and Behavioral Health Care Written By: Ken Martinez, Psy.D. Karen Francis, Ph.D. Jeffrey M. Poirier, M.A. Larry D. Brown Jr., M.P.A. Ming Wang, L.C.S.W. A Publication of the Cultural Competence Action Team of the Technical Assistance Partnership for Child and Family Mental Health and the American Institutes for Research
Transcript of A Blueprint for Using Data to Reduce Disparities ...

A Blueprint for Using Data to Reduce Disparities/Disproportionalities in Human Services and Behavioral Health Care
Written By:
Ken Martinez, Psy.D.Karen Francis, Ph.D.Jeffrey M. Poirier, M.A. Larry D. Brown Jr., M.P.A.Ming Wang, L.C.S.W.
A Publication of the Cultural Competence Action Team of the Technical Assistance Partnership for Child and Family Mental Health and the American Institutes for Research
A Blueprint for Using Data to Reduce Disparities/Disproportionalities in Human Services and Behavioral Health Care
Acknowledgements
The Cultural Competence Action Team would like to thank Rich Weisgal, Simon Gonsoulin, Joyce Burrell, and Debra Grabill from the TA Partnership for their review and suggestions as well as Tashia Thomas, Cultural and Linguistic Competence Coordinator for OnCare System of Care, Onandaga County, New York for her valuable insights. The Cultural Competence Action Team would like to give Larke Huang, Ph.D., Director of the Office of Behavioral Health Equity in the Administrator’s Office of Policy Planning and Innovation, Substance Abuse and Mental Health Services Administration (SAMHSA), a special thanks for her thoughtful review and helpful suggestions to improve our work. The authors also acknowledge Jessica Herrera for her patience and tireless effort in formatting this document. This publication was written by Ken Martinez, Psy.D., Karen Francis, Ph.D., Jeffrey M. Poirier, M.A., Larry D. Brown, Jr., M.P.A., and Ming Wang, L.C.S.W.
This publication was supported by funding from the Child, Adolescent and Family Branch at SAMHSA. The content is solely the responsibility of the authors and does not necessarily represent the official views of SAMHSA.
A Blueprint for Using Data to Reduce Disparities/Disproportionalities in Human Services and Behavioral Health Care
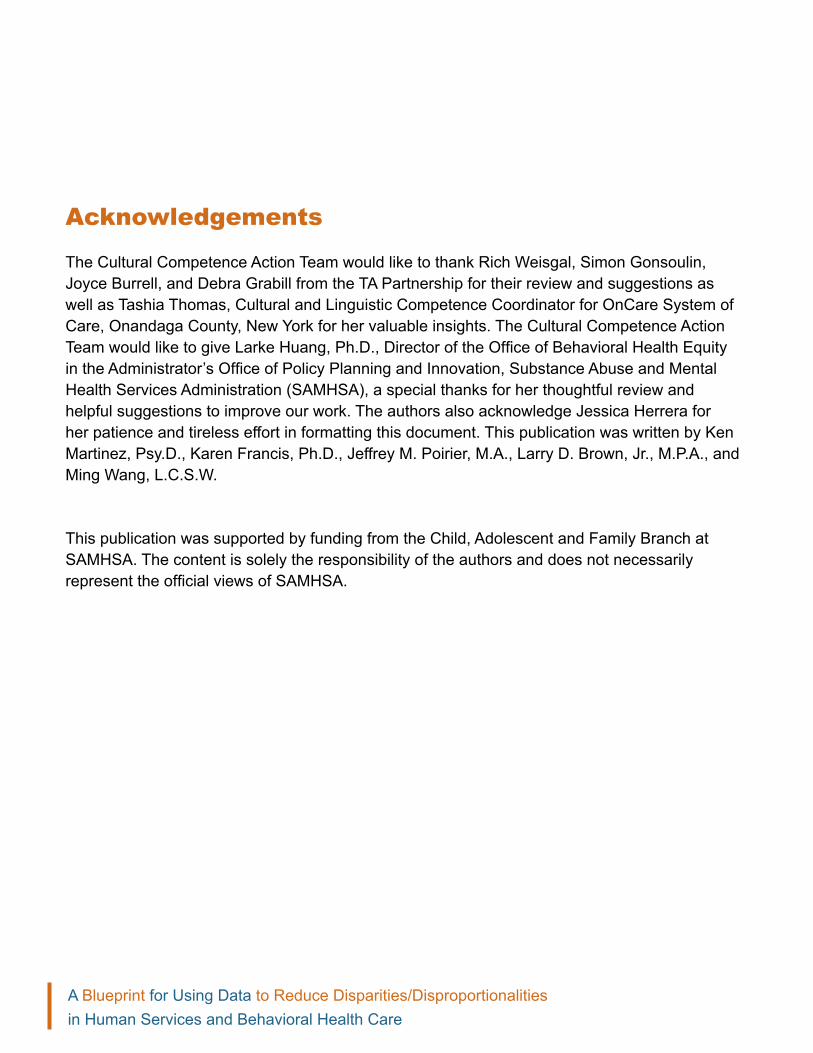
Contents
n Introduction
n Disparities and Disproportionality Framework
n A Case Study: Equityville System of Care
n Welcome to the Equityville System of Care Community
n Stages of the Framework to Reduce Disparities and Disproportionalities
1. Readiness Assessment
2. Community Engagement to Implement Effective Strategies 3. Identification of Disparities and/or Disproportionalities
4. Assessment: Gathering, Disaggregating, Analyzing, and Synthesizing Local/State Quantitative and Qualitative Data
5. Intervention: Designing Intervention Strategies
6. Continuous Quality Improvement and Evaluating Interventions
7. Replication
8. Sustainability
n Appendix A
n Appendix B
n Worksheets
4
Recommended Citation
Martinez, K., Francis, K., Poirier, J., Brown, L., and Wang, M. (2013). A Blueprint for Using Data to Reduce Disparities/Disproportionalities in Human Services and Behavioral Health Care. Available at http://www.tapartnership.org/COP/CLC/
5
7
7
10
10
14
17
19
24
27
32
33
35
38
40

4A Blueprint for Using Data to Reduce Disparities/Disproportionalities in Human Services and Behavioral Health Care
Introduction
D isparities and disproportionalities (D&D) are a social justice concern. Defining
them as a social problem promotes action because they threaten child, family and
adult development and well-being. A social problem is a condition in which gaps
exist between reality and desired outcomes. The condition is perceived to be a problem
and the conditions must be capable of a solution(s) through collective action. Racial/ethnic
differences and broader societal factors sometimes lead to differences in access to quality
care (Pachter & Coll, 2009). Many of these societal factors are a direct result of racism,
discrimination, and prejudice. Other examples of D&D are lack of access/availability of
prevention programs; lack of treatment services or other community resources; differential
and/or discretionary decision points about placement, referral, or dismissal; negative agency
climate; ineffective interventions; lack of cultural competence; or bias in the measures being
used. Deconstructing the nature of racial/ethnic D&D by identifying the contributing causal
factors helps providers and researchers develop an action-oriented approach that can then
facilitate reductions in, and eventually elimination of, D&D.

5A Blueprint for Using Data to Reduce Disparities/Disproportionalities in Human Services and Behavioral Health Care
Disparities and Disproportionality Reduction Framework
Communities and states across the country are developing and implementing effective strategies to reduce D&D. In 2011, the U.S. Department of Health and Human Services released its first-ever HHS Action Plan to Reduce Racial and Ethnic Health Disparities.1 An overarching priority in this plan is
to assess the impact of federal investments, such as grants, on the reduction of disparities in communities across the country. A Blueprint for Using Data to Reduce Disparities/Disproportionalities in Human Services and Behavioral Health Care (Blueprint) will be a useful tool to address this Secretarial priority and the Substance Abuse and Mental Health Services Administration’s (SAMHSA) Disparity Impact Strategy.
The Blueprint describes a framework and multistep process to reduce D&D in your community or state. The steps are (1) readiness, (2) community engagement, (3) identification, (4) assessment, (5) intervention, (6) evaluation/continuous quality improvement, (7) replication, and (8) sustainability.
The stages are adapted from the Office of Juvenile Justice Delinquency Prevention’s (OJJDP)Disproportionate Minority Contact (DMC) Model found in the OJJDP Technical Assistance Manual, although the general processes can be used across child-serving systems.2
The process for developing and implementing strategies in communities and states to reduce D&D should be data driven and requires significant planning, monitoring, and coordination. The Blueprint presents a guided, step-by-step process to help you successfully develop and implement strategies. Take time to carefully read through the document. It is also important to encourage partners and stakeholders to do the same. As communities embark on activities pertinent to this process, they need to think about the strengths, challenges, and intended outcomes of activities. Some of this work may already be planned, under way, or implemented in your community or state. In other cases, you may not have begun the work. 1 U. S. Department of Health and Human Services. (April 2011). Action Plan to Reduce Racial and Ethnic Health Disparities, Retrieved from http://www.minorityhealth.hhs.gov/npa/files/Plans/HHS/HHS_Plan_complete.pdf. 2 Office of Juvenile Justice Delinquency Prevention, U. S. Department of Justice. (July 2009). Disproportional Minority Contact Technical Assistance Manual, 4th Edition, Retrieved from https://www.ncjrs.gov/html/ojjdp/dmc_ta_manual/index.html.

6A Blueprint for Using Data to Reduce Disparities/Disproportionalities in Human Services and Behavioral Health Care

7A Blueprint for Using Data to Reduce Disparities/Disproportionalities in Human Services and Behavioral Health Care
Welcome to Equityville System of Care Community
Background: Equityville County System of Care is a partnership between the Equityville County Department of Mental Health (DMH), the local education agency (LEA), juvenile court, the Equityville Family Federation Network (FFN), and several community-based service agencies. This SOC seeks to improve the quality of life for youth with mental health needs in Equityville County. This system of care community provides wraparound prevention and early intervention services for children, youth, and families with special needs.
Community Demographics: Equityville County comprises several suburban communities that are located less than 50 miles from a large urban hub. Areas of the county are rural, supporting a number of farms and a significant farming community that includes migrant workers. The county has a population of about 75,000 residents, with about one third of that population living in rural areas. The racial/ethnic make-up of the county is diverse: 30% African American/Black, 5% Asian/Pacific Islander, 30% Hispanic/Latino, 5% Native American, and 30% White. Over the last few years, Equityville County has experienced growth in its population and diversity as a result of an expanding farming industry, the relocation of a large office park complex housing head offices for a number of companies, and the availability of affordable housing outside the neighboring urban community.
A Case Study: Equityville System of Care
This case study is a tool to assist readers as they apply the Blueprint for Using Data to Reduce Disparities/Disproportionalities in Human Services and Behavioral Health Care (Blueprint) and the associated worksheets. This case study describes by example the tasks and activities undertaken by a hypothetical community, Equityville System of Care, using data to reduce disparities/disproportionality in its child-serving systems. The case study describes the outcomes of the tasks and activities undertaken in the community. It also highlights the challenges faced and successes realized by this community throughout its system of care (SOC) implementation process. It is an example of an effective approach to using data to inform efforts to reduce disparities and disproportionalities.
8A Blueprint for Using Data to Reduce Disparities/Disproportionalities in Human Services and Behavioral Health Care
Statement of the Problem: As the population increases, the school district is faced with increased elementary, middle, and high school enrollment. Although the tax base in the county is moving in a positive direction, recent state budget cuts have had an impact on the delivery of a number of core services for children, youth, and families in the county. Many families struggle with accessing effective and appropriate mental health services. The county is also home to a 150-bed juvenile detention center. A recent study determined that the detention center confines a disproportionate number of African American and Latino youth. Juvenile justice officials have also observed an increasing number of youth who are transgender or gender diverse entering its facilities. Additionally, the rate of school suspensions and expulsions is high for youth of color and for students who are openly lesbian and gay (or are perceived to be). A number of community-based representatives have voiced concern about disparities and disproportionality that exist in the county’s educational, juvenile justice, and child welfare systems.
Equityville County has not been without its share of racially motivated incidents. Citizens have made claims of racial profiling by law enforcement. Membership in the county board of supervisors is not diverse or representative of the county’s population, with many on the board believing that such representation is unnecessary. The county also struggles with providing adequate interpretation and translation services across its social service systems for its ever-growing Limited English Proficiency (LEP) population. In addition, there is a lack of community-based, cultural and linguistically competent behavioral health services and supports. Many of the behavioral health needs for children and youth of color in the county are not adequately addressed or are simply not met. The local lesbian, gay, bisexual, and transgender (LGBT) advocacy organization has also raised concerns about the treatment of LGBT students in the local school system, in particular how several openly gay and lesbian Latino students have been harassed and schools have mishandled these incidents when reported.
Community Needs: Many community advocates are concerned that differential patterns of entry, exit, service responses, and quality outcomes exist for youth of color within the county. Concern is growing about this for LGBT youth, who have become increasingly open and visibly part of the community within the last few years. There is public interest in examining these disparities and disproportionalities and developing strategies to address the causes and consequences. County agencies currently collect data on the racial/ethnic make-up of the population served. There is, however, some concern that the data collected do not accurately reflect the nuances of the county’s racial/ethnic diversity. Further, no data are collected on LGBT youth populations. This has led many advocates to call for more enhanced and accurate data collection systems and methods.
The county has developed a strategic plan to promote the sustained overall health and well-being of children, youth, and families. Part of that strategic plan includes examining the needs and necessary supports to address the needs of unserved and underserved populations in the county.

9A Blueprint for Using Data to Reduce Disparities/Disproportionalities in Human Services and Behavioral Health Care
The Story Behind Equityville County Efforts to Implement a Data-Driven Approach to Reduce Disparities and Disproportionalities
The Equityville County system of care developed and implemented strategies to reduce D&D in its child-serving systems. Following the suggested framework from the Blueprint for Using Data to Reduce Disparities and Disproportionalities in Human Services and Behavioral Health Care (Blueprint), the champions of D&D reduction in Equityville focused on the following multistep process: (1) readiness, (2) community engagement,(3) identification, (4) assessment, (5) intervention, (6) evaluation and continuous quality improvement, (7) replication, and (8) sustainability.
The D&D reduction efforts in Equityville County were led by its Cultural and Linguistic Competence Coordinator (CLC Coordinator) and several stakeholders who make up The Collaboration Council for Children, Youth, and Families in Equityville County (Council). The CLC Coordinator was a member of the Council and therefore could leverage the interest and support of several members. In fact, they
formed a work group of the Council whose charge involved addressing D&D in the county. The first step of the work group, which comprised eight local stakeholders, was to describe the D&D issue(s). Once the issues were clear, the group then moved on to identify why addressing D&D was important and then to gain consensus about its importance to the county. Through a series of meetings, the work group was developed a list of intended outcomes. This all took time but gave the work group a clear direction and a unified voice.
Worksheets
Look for the icon on the margins at the beginning of each section. Following the icon, you will find a description of the correspond-ing worksheet(s) and the link(s) that direct you to each one on the blueprint. For more information about how to use the worksheets, click here.

10A Blueprint for Using Data to Reduce Disparities/Disproportionalities in Human Services and Behavioral Health Care 10
1. Readiness Assessment
Stages of the Framework to Reduce Disparities and Disproportionalities
Because this effort is a big investment of resources and energy, consider the following factors as part of your readiness assessment.
Readiness: Is your community/state ready? Consider the timing, political climate, alignment, and/or competition with other concurrent initiatives and contextual factors that may affect your effort. Be aware of the historical trauma that may exist in your community/state and its impact on community readiness and trust. Take into consideration the current racism, prejudice and discrimination that your community has experienced that will have an impact on the level of trust and willingness to build partnerships. Don’t assume that diverse groups who are directly affected by D&D are necessarily aware of the situation they and their children are experiencing and therefore will welcome your efforts to address inequity. Individuals or groups experiencing long-term and institutionalized D&D may internalize the oppressive behavioral patterns and view D&D as the status quo. It may require educating them about the issue to engage them in the effort for change.
Timing of this initiative is critical. As you begin your work on reducing D&D, it is important to “know your environment.” Communities, counties and states are busy with many initiatives at any given time, so much so that they compete for everyone’s time, attention, energy, and funding. Reducing D&D is tough work and will require dedication and follow-through. In an atmosphere of extreme partisanship, sometimes worthwhile efforts become embroiled in political discussions which sometimes leads to their demise. Therefore knowing the political climate you are in will help you determine whether to begin this work now or later and who your allies may be.
Complete Worksheets
Worksheet 1a: Framing Disparit ies/Disproportionalit ies
A guide for thinking through (1) the issues related to D&D in the community, (2) the importance of addressing them, (3) the identification of intended outcomes, and (3) development of a disparities impact statement. Worksheet 1b: Determining Readiness
A template to analyze the strengths, weaknesses, opportunities, and threats (SWOT Analysis) to determine your readiness to begin this work. It also provides an opportunity to think through the feasibility of implementing activities to address D&D.

11A Blueprint for Using Data to Reduce Disparities/Disproportionalities in Human Services and Behavioral Health Care
Align your D&D work with other initiatives. Alignment produces synergy and capitalizes on momentum. Examples of possible initiatives to partner with are the Office of Juvenile Justice Delinquency Prevention’s DMC initiative and the work of the Annie E. Casey Foundation in reducing disproportionalities in child welfare. There may also be competing projects that could dilute the effort. Therefore, weighing the congruent and competing projects is a valuable start. Leadership: Is there leadership to begin and sustain the effort? All efforts that succeed have leaders or champions that lead by example, motivate others, articulate the “charge” or the message, and shepherd the work by providing the resources to maximize the chances of success. They could be the visible spokespersons who not only take responsibility but have the authority to effect change and steer the effort. They could also be the informal leaders who get things done and are able to influence others. In either case, leadership is critical to your success.
Leaders confront the barriers that arise and pave the way for the team members to do their work. Leaders see a project through and give credit to the team. Therefore, selecting or identifying a strong key leader, in partnership with the management and/or governing bodies or other key leadership groups in the jurisdiction, as well as other champions at the policy, funding, systems, community, provider, cultural, family, and youth levels early in the readiness process can rally supporters and partners.
Shared vision: Do you and your stakeholder group share a common vision? Know what you want to accomplish. A common agenda may not exist at the beginning, but eventually one will emerge after you engage and work with your constituency groups. You and your stakeholders can develop a shared vision by convening collaboratively in person or through a virtual space to address your distinct and common philosophies, values, cultures, and infrastructures to arrive at a common statement of purpose about what you want to achieve.
Acknowledgment: Do the leaders, community members, systems, funders, elected officials and others, who can effect change acknowledge the existence of the D&D in the community/state? Before you launch your work, your stakeholder team must agree that D&D exist in the community/state. If the “problem” is not acknowledged, the work will not begin. If there is no acknowledgment, the first task may be to share any preliminary data with them to make the case that a problem does exist and the work to improve it will benefit not only the affected individuals involved but the stakeholder groups themselves. Preliminary data may include the number of children of color in special education, child welfare, juvenile justice,
A ll efforts that succeed have leaders or champions that lead by example, mot ivate
others, ar t iculate the “charge” or the message and shepherd the work by providing the resources to maximize the chances of success.

12A Blueprint for Using Data to Reduce Disparities/Disproportionalities in Human Services and Behavioral Health Care
diversion programs, or out of home placement compared with the number of White children. Additionally, you can make the case that reducing D&D will reduce costs for the community, such as decreasing dropouts and improving school achievements and making a healthier community.
Investment: Do you have a critical mass of invested stakeholders? These stakeholders include system(s) leaders, community leaders, family members, youth, and others who form the “community will.” Invite family and community members, especially those who are critical of the systems, to engage them in constructive solutions. Choosing key stakeholders from the agencies that are involved is important. They may not be the agency leads, but they may be individuals at lower levels in the chain of command who have the authority to make decisions, write/direct policy and practice, and effect change. If agency leads are not involved, you still need active support from
top management so that the D&D efforts are taken seriously. A critical mass of decision makers across agencies is also important because it models the importance of the issue and motivates other stakeholders to want to be included.
Feasibility: Is what you are considering tackling feasible? The task must be reasonable given the circumstances and resources you have to work with. As you gather your team, discuss the feasibility of the task ahead. Is your team capable of making needed changes or do you need additional key people to join, more resources, stronger leadership, or other critical factors to be successful? Is the scope of the task doable? Do you need to narrow your population of focus? What can you and your team do to maximize your likelihood of success? These questions are worth asking before proceeding too far.
Resources: Do you have or can you obtain the resources (human, financial, organization-al, political) to begin and sustain your efforts? Having the appropriate tools to work with is necessary for success. If your leadership is willing to provide the resources or if your team is willing to braid their resources together, you will increase your chances of success. Braiding means integrating funding streams while maintaining their integrity to the funding source. Beyond the critical financial and human resources, having organizational backing and political support helps you and your team be credible and be seen as viable change agents. Government employees cannot actively solicit political change, but they can support nongovernmental team partners, such as family members, youth, and cultural and community leaders in their efforts to enlist the support of public figures and others to move the agenda forward. If the climate is amenable, having a visible external champion, whether a celebrity or a political figure, sometimes helps.

13A Blueprint for Using Data to Reduce Disparities/Disproportionalities in Human Services and Behavioral Health Care
In determining the readiness of the county to engage in efforts to address D&D, the work group diligently engaged in completing a SWOT analysis (Worksheet 2). This SWOT analysis gave the work group an opportunity to analyze the strengths, weaknesses, challenges, opportunities, and strengths of the community as a whole to take on the work. It also provided an opportunity to think through the feasibility of implementing activities to address D&D. As the work group developed the SWOT, it found many areas that required some attention; for example, work group members could think through the impact that the pending county elections might have on their efforts. They also made a concerted effort to reach out to civic and faith-based
organizations in the county to ensure that their efforts would be inclusive of the voice of unserved and underserved populations. Armed with the SWOT, the work group moved forward with efforts to engage community partners, identifying their strengths and the resources available in support of the efforts to address D&D.
Equityville County Community Readiness
Barriers: Have you assessed the existing or potential barriers in your community? Barriers include the degree of prejudice/discrimination and overt explicit racism and implicit racism (unconscious assumptions and belief systems each person has about other people, especially those who are different from us), including structural/institutional racism in the community and the desire to maintain the status quo. These may be manifested through resistance to change. This is always a sensitive area because some individuals and institutions are wary of addressing the core issues that many communities face, such as implicit andinstitutional racism, yet sometimes those are some of the reasons that D&D exist. You may experience resistance or push back from some that don’t want to deal with sensitive subjects that are just below the surface yet are powerful and part of the problem. Are there any hidden agendas in your community/state? Some communities have engaged in “courageous conversations” to address these and related issues. These conversations are conducted in safe environments to discuss and clarify the factors that make conversations about race and D&D difficult among individuals and within organizations. Courageous conversations provide a framework for establishing strategies to plan for and engage in difficult conversations that are meaningful and purpose driven.

14A Blueprint for Using Data to Reduce Disparities/Disproportionalities in Human Services and Behavioral Health Care
2. Community engagement to implement effective strategies
Effective Communication: Communication is key to building broad support for the work we seek to accomplish. It builds a strong foundation for community commitment to secure financial and human resources and to promote sustainability. Disseminating information in a useful, meaningful, and timely manner helps facilitate understanding and engagement of stakeholders.
Some key issues to consider in effective communication include the following:
1. Identify your audience of stakeholder partici- pants and enlist their support: It’s important to determine whom you are inviting to work with you. Is it the whole community or a small well-defined group (e.g., policy makers, judiciary, service providers)?
2. Define purpose: A clearly defined purpose describing your intent (e.g., to reduce disproportion-alities in the child welfare system) will shape the scope and content of the communication. It’s important to determine whether you want to inform, instruct, motivate, engage, or persuade.
3. Define message: A clearly defined message about your intended goal of reducing D&D reduces confusion and introduces a sharp focus to the
communication. Jointly develop “elevator speeches,” which can be a brief but effective educational
experience for each different group of stakeholders. People listen when they feel the message is relevant to them in their respective roles.
4. Identify the communications channels you will use: There are various modes of communica ting and each serves a different purpose. Choose methods of communicating that the intended audience is most comfortable with and receptive to. Ask them how they prefer to communicate (e.g., in person; through e-mail, listserv, conference
Complete Worksheets
Worksheet 2a: Community Engagement
A checklist to identify community partners, agencies, and organizations to engage as partners and collaborators, along with activities to identify available resources as well as strengths and assets.
Worksheet 2b: Logic Model Template
A template to assist in defining a clear plan of action (logic model) for activities to address D&D.

15A Blueprint for Using Data to Reduce Disparities/Disproportionalities in Human Services and Behavioral Health Care
calls). The method may vary depending on the purpose of the communication. Your stakeholders are busy, as you are, and you don’t want to tax them with unnecessary communication.
5. Communicate clearly and effectively, always remembering your intended goal: Communication should be tailored to your audience and topic. Therefore, be aware of community/cultural values and norms that can have an impact on how your audience might interpret the message. Some individuals may not be aware that D&D exist, so a strengths-based and nonblaming communication approach is more likely to be heard.
6. Develop and implement social marketing strategies: Social media such as blogs, a Twitter campaign, or Facebook will enhance community awareness of D&D and the need for advocacy and change.Tailor your message to your audience.
7. Anticipate communication breakdowns and conflicts: Communication breakdowns and conflicts should be expected, not thought of as exceptions. It is helpful to respond quickly, take responsibility when appropriate, and communicate directly to correct the issues.
8. Anticipate barriers: The barriers or challenges that individuals or agencies may pose include the lack of staff time to devote to this effort; perceived loss of control over the “agenda” or direction, mistrust of some of the participants, and past history of
unsuccessful collaboration. Anticipating them in a proactive manner allows you to develop strategies to overcome them.
9. Develop a feedback loop: Timely feedback to the involved stakeholders about what is happening helps increase transparency and contribute to everyone’s ownership of the process.
Identifying community partners, agencies, and organizations was relatively easy, but the work group found out pretty quickly that engaging these partners was a challenge. It would take time to build trust and buy-in from key community groups. The work group learned how to reach out to the leaders in the community, faith-based organizations, leaders of the migrant community, to LGBT advocacy organizations and LGBT-affirming community leaders, business leaders, and
the interested partners in core service agencies within the community. Community engagement of these stakeholders also helped refine the strategies and the intended outcomes of the efforts to ensure that they were aligned with the broader community input. This effort required time and patience to ensure success and sustainable partnerships.
Equityville Community Engagement
16A Blueprint for Using Data to Reduce Disparities/Disproportionalities in Human Services and Behavioral Health Care
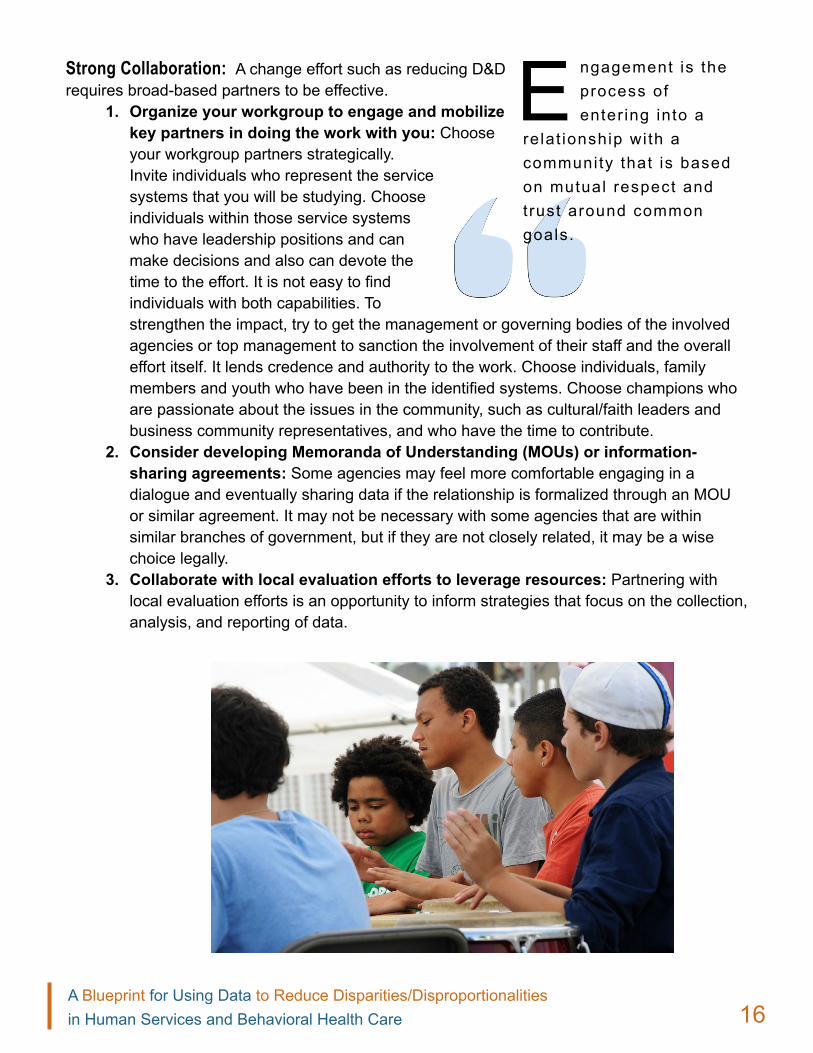
Strong Collaboration: A change effort such as reducing D&D requires broad-based partners to be effective.
1. Organize your workgroup to engage and mobilize key partners in doing the work with you: Choose your workgroup partners strategically. Invite individuals who represent the service systems that you will be studying. Choose individuals within those service systems who have leadership positions and can make decisions and also can devote the time to the effort. It is not easy to find
individuals with both capabilities. To strengthen the impact, try to get the management or governing bodies of the involved agencies or top management to sanction the involvement of their staff and the overall effort itself. It lends credence and authority to the work. Choose individuals, family members and youth who have been in the identified systems. Choose champions who are passionate about the issues in the community, such as cultural/faith leaders and business community representatives, and who have the time to contribute.
2. Consider developing Memoranda of Understanding (MOUs) or information- sharing agreements: Some agencies may feel more comfortable engaging in a dialogue and eventually sharing data if the relationship is formalized through an MOU or similar agreement. It may not be necessary with some agencies that are within similar branches of government, but if they are not closely related, it may be a wise choice legally.
3. Collaborate with local evaluation efforts to leverage resources: Partnering with local evaluation efforts is an opportunity to inform strategies that focus on the collection, analysis, and reporting of data.
E ngagement is the process of enter ing into a
relat ionship wi th a community that is based on mutual respect and trust around common goals.
17A Blueprint for Using Data to Reduce Disparities/Disproportionalities in Human Services and Behavioral Health Care
3. Identification of Disparities and/or Disproportionalities
Search for the data sources: Identifying and analyzing D&D data are the foundation of the work. Much data exist, although frequently are not accessed. Many funding sources, including federal agencies, are increasingly recognizing the existence of D&D in human services systems and elsewhere. They are requiring D&D-related data to be collected and available for analysis.
The Institute of Medicine, in 2009, issued the Race, Ethnicity, and Language Data: Standardization for Health Care Quality Improvement Report. The Subcommittee on Standardized Collection of Race/Ethnicity Data for Healthcare Quality Improvement who wrote the report recommended collection of the existing Office of Management and Budget race and Hispanic ethnicity categories as well as more fine-grained categories of ethnicity and language need. (http://www.iom.edu/Reports/2009/RaceEthnicityData.aspx)
As of October 31, 2011, the Department of Health and Human Services has new survey standards that require granular level collection of race and ethnicity data as well as data on gender, primary language and disability status as part of enforcing Section 4302 of the Affordable Care Act (http://aspe.hhs.gov/datacncl/standards/ACA/4302/index.pdf). Become familiar with this requirement to inform your work.
Identify the disparities/disproportionalities: D&D exist everywhere, even when we want to think otherwise. The D&D issues come to the surface in different ways: reviews of data, exposés by mass media, threatened lawsuits, or complaints by family members or community advocates. The task is what to do with all that you discover. You probably can’t address everything you might want to because the needs are so great, so choosing what to focus on, given the parameters discussed above, is important.
Go to Appendix A for
nat ional and state data
websi te l inks.
Go to Appendix B for
other sources such as
examples of state
reports.
Complete Worksheet
Worksheet 3: Identif ication of Data Sources
A template for (1) identifying data sources that exist within your community or state, (2) describing the data sources, (3) developing a timeline for gathering the data, (4) deciding who will be responsible for gaining access to the data, and (5) describing how the data will be used.
18A Blueprint for Using Data to Reduce Disparities/Disproportionalities in Human Services and Behavioral Health Care
National and state data website links for various human service systems can be found in Appendix A. Some systems have specific efforts to reduce D&D. For example, in adherence to a core requirement of the Juvenile Justice and Delinquency Prevention Act (JJDP Act), the Office of Juvenile Justice Delinquency Prevention (OJJDP) requires states participating in the OJJDP Act’s Part B Formula Grants program to “address efforts to reduce the proportion of juvenile detained or confined in secure detention facilities, secure correctional facilities, jails, and lock-ups who are members of minority groups if such proportion exceeds the proportion such groups represents in the general population” (JJDP Act, 1988; see the Disproportionate Minority Contact Technical Assistance Manual (4th ed.), listed in Appendix B). All states are required to develop and submit a Disproportionate Minority Contact (DMC) Plan to OJJDP to identify, assess, and address DMC. Individuals from each state can request their respective plan from their DMC state contact or state juvenile justice specialist, listed in Appendix A. Additionally, you may be able to find local data by accessing court records and diversion numbers and looking at the number of youth with police contact and in detention.
Other sources: States collect data for submission to federal funding sources. The data are also available to the general public in published reports. It’s important to find out from your state what data are collected, the frequency of collection, and the use of the data in program planning. Some states have D&D work groups or steering committees within human service systems or in some parts of state government. Examples include issue briefs, reports to federal funding agencies, and state of the state reports, some of which can be found in Appendix B.
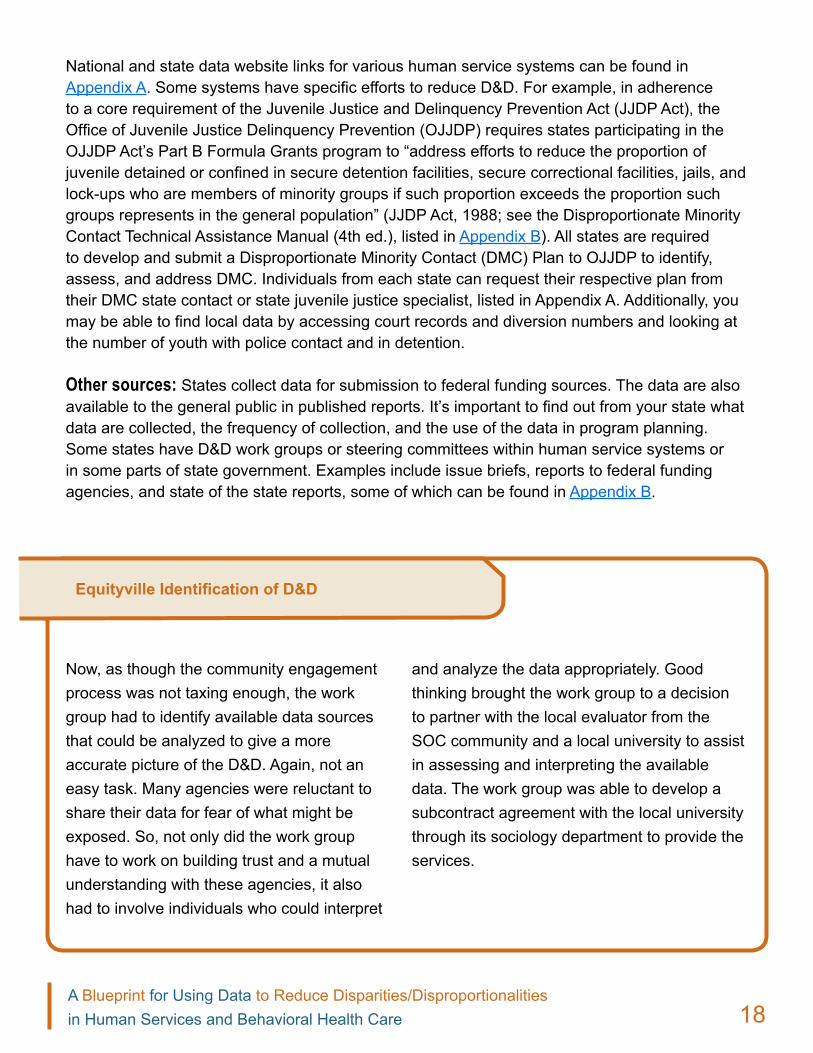
Now, as though the community engagement process was not taxing enough, the work group had to identify available data sources that could be analyzed to give a more accurate picture of the D&D. Again, not an easy task. Many agencies were reluctant to share their data for fear of what might be exposed. So, not only did the work group have to work on building trust and a mutual understanding with these agencies, it also had to involve individuals who could interpret
Equityville Identification of D&D
and analyze the data appropriately. Good thinking brought the work group to a decision to partner with the local evaluator from the SOC community and a local university to assist in assessing and interpreting the available data. The work group was able to develop a subcontract agreement with the local university through its sociology department to provide the services.

19A Blueprint for Using Data to Reduce Disparities/Disproportionalities in Human Services and Behavioral Health Care
4. Assessment: Gathering, Disaggregating, Analyzing, and Synthesizing Local/State Quantitative and Qualitative Data
Gather, disaggregate, analyze, and synthesize data: Once you have identified data sources, your task is to gather all relevant data sets that pertain to the populations that you are interested in studying. The data sets may also contain agg regated data, which are not broken out by race/ethnicity, county, gender, or other variables of interest to you. Therefore, a next step is to disaggregate the data by the variable you want to focus on, such as ethnicity and race. Many online data sets allow you to sort by variables you choose.
Use data that are already available beginning with your Government Performance and Results Act (GPRA) data (http://www.samhsa.gov/grants/tools.aspx) for those entities that are required to collect it. This data are used to identify disparities in access, service use and outcomes. Next use data that are most local to your area of concern. That is, if you are county based, you might be most interested in county-based data, although you may also want to compare your county with others in the state and with the state means or medians. Similarly, if you are at the state level, you may want to compare counties or states in your region. Once you disaggregate data at the level you desire, you can compare raw numbers or percentages with local, county, state, or national data to assess differences/ similarities or over/underrepresentation and therefore begin to make conclusions about the presence/absence of D&D. Qualitative data sets may also be available and potentially helpful and may include satisfaction ratings or other surveys or testimonials of individuals that have experienced the systems.
Generate possible explanations for the D&D: At this point, it is time to start reviewing the possible contributing factors. Usually, there are multiple causes and they are complex. With your team, you can begin generating possible explanations about what may be contributing to the D&D. Factors may
Complete Worksheet
Worksheet 4: Assessment and Review of Data
A tool for pinpointing relevant evaluation questions related to identifying D&D by analyzing data.
D espite these chal lenges, i t is important to
proceed with the best data and methods avai lable to you so that they do not deter your effor ts or mot ivat ion.

20A Blueprint for Using Data to Reduce Disparities/Disproportionalities in Human Services and Behavioral Health Care
include: (1) lack of access/availability of mental health and substance abuse prevention programs; (2) lack, or insufficient number, of treatment services or other community resources that are alternatives to system involvement; (3) differential and/or discretionary jurisdictional decision points at various levels about placement, referral, dismissal, and so on; (4) legislative, policy, regulation, and procedural processes and mandates; (5) degree of ethnic/racial tension in the community; (6) negative agency climate; (7) ineffective interventions; (8) workforce issues; (9) lack of cultural competence;3 (10) bias in measures used;4 (11) economic conditions and other social determinants in the community; (12) differential treatment at various levels within systems; (13) degree of prejudice/discrimination in the community; (14) institutional racism; and (15) implicit bias. Usually it is not one but many contributing factors that lead to D&D.
Validate the explanations: The team must arrive at a mechanism by which to validate/discount the explanations generated so that the interventions you propose later are specific to the probable causes identified. This may be done by “mining” the data further, by digging deeper into the data you have already reviewed or seeking other data to assess your hypotheses. For example, you may conclude that legislative language needs to be changed. Then, you may want to seek new data to prove/disprove that contention. Another example is that you may be interested in finding out why there is such a high rate of referral of African American youth and adults to the juvenile or criminal justice systems. You may want to examine the reasons for the referrals, the density in various geographic locations, and the possible contributing factors. This process takes time and requires individuals who are adept at accessing available data sets. Consensus among team members about pursuing the various explanations is also crucial so that you have full support of your team before expending more resources.
Identify and deal with the challenges: Inevitably you will face challenges in using the data available to you: (1) the consistency and stability of the data over time (reliability) or whether the data are actually measuring what they are supposed to be measuring (validity); (2) the collection methods used; (3) misapplication of race/ethnicity categories due to poor inquiry methods or choices given to the youth/parent; (4) availability of current data; and (5) incompatibility of information technology (IT) platforms or systems that make data sharing difficult, which is common but correctable. Despite these challenges, it is important to proceed with the best data and methods available to you so that they do not deter your efforts or motivation.
Partner in the data gathering, analysis and interpretation activities: Local universities and colleges can help you identify resources and talent to assist in data-gathering, analysis, and interpretation efforts. Reach out to them and their public health, population, and social sciences ________________
3 Dettlaff, A. J., & Rycraft, J. R. (2008). Deconstructing disproportionality: views from multiple community stakehold-ers. Child Welfare, 87(2), 37–58.4 Berger, L. M., McDaniel, M., & Paxson, C. (2005). Assessing parenting behaviors across racial groups: Implica-tions for the child welfare system. Social Service Review, 79(4), 653–688

21A Blueprint for Using Data to Reduce Disparities/Disproportionalities in Human Services and Behavioral Health Care
departments to identify researchers and other personnel to assist you.
Share data with your stakeholders and the community: Collecting and interpreting the data are important, but just as important is sharing the data and findings with the rest of your community. Sharing with the community helps them understand the issues and take ownership in doing something about improving the D&D that exist.
Keep up the pace: At this point, much work has been done. Your team is finding out that the work is significant and feeling the weight of the tasks. Keeping your team motivated is important. All new knowledge discovered is important, and even small successes should be celebrated. It may be a good time to enlist new members to your team to spread the work, invigorate your team, and add new expertise that you initially did not know you needed.
The following are suggested systems data to collect and disaggregate from child-serving systems by race, ethnicity, and other distinguishing characteristics:
• Availability/quality of services/supports in lock-up
• Diversion rates• Information on alleged offense –Type, time, location• Rates of arrest• Rates of, and lengths of stay in,
detention/long-term placement• Rates of referrals –To alternative services –For males vs. females• Recidvism rates • Type of prosecutorial and
judicial decisions at disposition_______________*The same data can be collected from the criminal justice system.
Juvenile Justice*

22A Blueprint for Using Data to Reduce Disparities/Disproportionalities in Human Services and Behavioral Health Care
• Rates of –Expulsions –Special education placements by type –Gifted/advanced placement program placements –Individual Education Plans –Referrals for mental health/substance abuse services/ supports –Referrals to police/ juvenile authorities –Youth who are chronically absent from school• Rates and lengths of –In-/out-of-school detention –Suspensions• Reasons for expulsions/
suspensions/detentions
Education
• • Availability/quality of services/supports for males vs. females• Children in state/county custody• Length of stay in foster care• Rates of –Adoption –Being “screened in” for investigation –Kinship placement –Out of home vs. in home care –Referrals to culturally and linguistically competent mental health and social services providers –Referrals for males vs. females –Reunification vs. termination of parental rights (TPR) –Screening, brief intervention or referral for mental health assessments –Substantiation• Referrals by geographic location (ZIP code)
Child Welfare
23A Blueprint for Using Data to Reduce Disparities/Disproportionalities in Human Services and Behavioral Health Care
The work group worked closely with its evaluation partners to identify relevant evaluation questions and to analyze the data. The work group knew that this information would have to be shared with its partners and the community in a way that would promote understanding and generate interest related to addressing the needs and gaps identified through the analysis. In Equityville County, the assessment that identified quantifiable disparities and disproportionality in its child-serving systems was not received well
by many stakeholders, including the County Board. There was resistance to accepting the information, with many stakeholders engaging in rhetoric that shifted blame—and also denial— that the problems existed. The need arose to address this resistance in a strength-based, data-informed manner that would produce positive outcomes and facilitate agreement on necessary interventions without getting involved in the blame game.
Equityville Assessment
• • Lengths of stay• Rates of -Inpatient/residential care -Outpatient/community based care -Preventive activities/programs -Access, availability, utilization, affordability, appropriateness, quality and outcomes of services/supports
Mental Health

24A Blueprint for Using Data to Reduce Disparities/Disproportionalities in Human Services and Behavioral Health Care
5. Intervention: Designing Intervention Strategies
Recognize that developing an intervention plan and identifying intervention strategies must be a data-driven process. Data gathered from the identification and assessment phases should guide the development of an intervention plan and the ultimate selection of interventions that mirror individual, organizational, and community needs. Additionally, this involves selecting a group of people who have the capacity to have a positive impact on the required systems change. Designing viable strategies requires a critical analysis of what has worked well, while taking into consideration lessons learned from approaches that were ineffective or did not meet the specific needs of the population of focus. Such intervention strategies and intervention workplans can be funneled through an existing or newly formed workgroup of key community members. This workgroup can be the original one formed, a subcommittee of that group, or a separate workgroup. The workgroup members will participate in the intervention development process.
Review existing national reform initiatives: (See figures 1.1, 1.2, 1.3, and 1.4 below)
Design the intervention strategies: Intervention strategies can be focused on different levels of the system. They may include intervention strategies at the policy and practice levels, workforce qualifications/diversity, training and professional development, decision making points in system processes, and access and availability of services or supports and diversion programs, among others.
Assess resources needed to carry out intervention strategies: Both fiscal and human resources are necessary to effectively implement intervention strategies. For example, fiscal resources may be needed to contract an external individual or group, such as a university to help develop intervention strategies.
Complete Worksheet
Worksheet 5: Intervention Planning
A tool to use when considering the range of possible strategies to effectively address D&D at individual, organization/institution, and community/state levels.
B efore implement ing intervent ion
strategies, i t is usual ly helpful to have demonstrat ion or pi lot s i tes. . .before fu l l implementat ion.

25A Blueprint for Using Data to Reduce Disparities/Disproportionalities in Human Services and Behavioral Health Care
Before implementing intervention strategies, it is usually helpful to have demonstration or pilot sites with a smaller group or within a smaller setting to assess whether the intervention strategies have been designed appropriately and to make adjustments before full implementa-tion. This may also include Rapid Cycle Process Improvements where each variable is isolated to determine what may be contributing to the D&D and then working on each process improvement separately for a short period of time (3 months).
Disproportionate minority representation (DMR) occurs when the percentage of a particular racial/ethnic group involved in the child welfare system is significantly higher or lower than its representation in the general population. Model initiatives include Annie E. Casey Foundation, Alliance for Equity in Child Welfare, Casey Family Programs, American Humane Association, Texas Department of Family and Protective Services, and Texas Health and Human Services Commission Center for Elimination of Disproportionality and Disparities.
Child Welfare (Fig. 1.1)
Existing National Reform Initiatives
According to a report from the American Psychological Association, educational disparities include differences in educational outcomes that may result from (a) differential or biased treatment of students from ethnic/racial student groups within the educational system, (b) differences in outcomes because of socioeconomic status, and (c) differences in responses to the education system or differences in the sets of education needs.5
Education (Fig 1.2)
________________
5 American Psychological Association, Presidential Task Force on Educational Disparities. (2012). Ethnic and racial disparities in education: Psychology’s contribution to understanding reducing disparities. Retrieved from http://www.apa.org/ed/resources/racial-disparities.aspx

26A Blueprint for Using Data to Reduce Disparities/Disproportionalities in Human Services and Behavioral Health Care
Disproportionate minority contact (DMC) refers to the disproportionate representa-tion of racial/ethnic youth in the juvenile justice system. Model intervention initiatives include the Juvenile Detention Alternatives Initiative (http://www.aecf.org/MajorInitiatives/JuvenileDetentionAlternativesInitiative.aspx) and the McArthur Foundation Models for Change (http://www.modelsforchange.net/index.html). Although not an initiative, the Burns Institute (http://www.burnsinstitute.org/) promotes strategies to identify practices that foster disproportionality and then asks systems to examine what they have learned.
Juvenile Justice (Fig. 1.3)
According to the Centers for Disease Control and Prevention (CDC), mental health disparities in relation to ethnicity/race refer to disparities between populations with respect to mental health and the quality, accessibility, and outcomes of mental health care. In 2012, the Substance Abuse and Mental Health Services Administration published Mental Health, United States, 2010 (http://www.samhsa.gov/data/2k12/MHUS2010/MHUS-2010.pdf), which contains disparity data. The CDC released a Morbidity and Mortality Weekly Report (MMWR) supplement, Mental Health Surveillance among Children in the United States, 2005-2011 (http://www.cdc.gov/mmwr/preview/mmwrhtml/su6202a1.htm). This report estimates the prevalence of mental disorders and indicators of mental health among children living in the United States and estimates childhood mental disorders and indicators from these systems during 2005–2011.
Mental Health (Fig. 1.4)
Given what the data showed regarding the level, scope, and nature of D&D in Equityville for multiple populations, the work group in conjunction with its partners and stakeholders engaged in several meetings to identify strategies to effectively address the D&D. Its members collaboratively determined appropriate interventions that could be used at the individual, organization/institution, and community levels. To guide them in this process, they requested technical assistance (TA) from their TA provider to identify evidence-based programs and practices. With the TA provider, they looked to examples from other communities while engaging their community in determining appropriate interventions that were culturally and linguistically appropriate.
Equityville Intervention
27A Blueprint for Using Data to Reduce Disparities/Disproportionalities in Human Services and Behavioral Health Care
6. Continuous Quality Improvement and Evaluating Intervention(s)
Your community’s efforts to address D&D can greatly benefit from a thoughtful process of assessing the quality of your efforts—and using this to inform your ongoing efforts. Although a continuous quality improvement (CQI) approach is shown as a separate stage in the framework, it should be integrated throughout the efforts of your larger initiative and should include strategies for evaluating the intervention(s) implemented. Your commitment to CQI can help build buy-in among skeptical community members who want to ensure the effort will be truly collaborative or among others who want to know that if a particular approach doesn’t seem to be working, you are not locked into a decision. CQI data can facilitate this adaptive approach and will provide the foundation for reflecting on progress and areas needing change, including new strategies.
As part of your CQI process, an evaluation will provide several opportunities to gather information about program, service, and intervention effectiveness:
• Process Evaluation: Investigate the process of deliver ing the program, focusing primarily on inputs (e.g., who delivers the intervention), activities (e.g., what is provided to intervention participants), and outputs (e.g., who receives the intervention).
• Outcomes Evaluation: Assess the broader and overall effects—intended or not—of the program as a whole including whether the program caused demonstrable effects on specifically defined target outcomes.
• Impact Evaluation: Assess the broader and overall or net effects—intended or unintended—of the program as a whole.
As part of the initial workgroup you establish, you should identify at least two participants to serve as part of a subgroup that prioritizes CQI and brings back ideas and
Complete Worksheet
Worksheet 6: Continuous Quality Improvement
A worksheet to help you begin thinking about your continuous quality improvement (CQI) plan.

28A Blueprint for Using Data to Reduce Disparities/Disproportionalities in Human Services and Behavioral Health Care
findings to the larger workgroup.This subgroup should develop a draft CQI plan based on collective discussion from the full work group. Try to hold a full workgroup meeting to discuss your initiative’s CQI approach, covering the following issues that will then become core components of your CQI plan:
• CQI questions • Data sources (determine who holds the data needed to address D&D)• Data methods• Who is responsible for collecting the data• CQI reporting
The CQI questions should take into account findings from your readiness assessment, which can provide a baseline for assessing where changes are evident. They should ask about the quality of your larger D&D initiative, including related community engagement, the readiness assessment, identification of D&D, assessment of data, and intervention design.
The CQI questions should also focus on the piloting and implementation of the selected intervention(s)—and include questions related to process, outcomes, and impact as well as its sustainability. The section below discusses this further. These questions should be specific enough with adequate data sources so that you can collect and analyze data and produce meaningful findings. For example, has your communication process been helpful to key stakeholders? Are they satisfied with it? If your intervention is focusing on increasing knowledge about health issues or promoting healthy behaviors, important questions to ask include the following: Has knowledge about health issues increased within the population of focus? If so, in what ways? Has their healthy behavior changed? If so, how? Of course, you will need to agree on and define key concepts clearly, but this should come from your intervention design. For example, what are “healthy” behaviors? The CQI process should at least include three basic questions: (1) what is the intervention doing (effort)?, (2) how effective is the intervention (outcomes)?, how efficient is the intervention (cost/benefit)?

29A Blueprint for Using Data to Reduce Disparities/Disproportionalities in Human Services and Behavioral Health Care
The selected data sources will depend on your selected approaches/strategies and domain of focus (i.e., system, organization, child/family). For example, data sources may include individual providers who are helping implement an intervention, program administrators or leaders, and youth and families receiving an intervention. Where feasible, try to provide a small honorarium (e.g., a $10 gift card) for children and families participating in CQI data collection efforts (this amount should be greater if they are asked to participate multiple times over a period of time). As part of your CQI effort, you will need to decide how much data you need to make informed decisions.
Data methods should include an analysis of some combination of existing data, surveys, focus groups, interviews, and observations. It will be important to talk directly with participants in the intervention(s) so that you can obtain their firsthand perspectives on its quality, benefits, and potential areas for improvement. You should avoid focus groups for discussing sensitive issues, but they can be valuable for increasing the quantity of data you are able to collect with available resources and for discussing topics when it might be helpful to brainstorm an issue or related solutions.
The plan should also include steps about how you will report decisions and initiativerelated changes. How does the workgroup want to share findings based on the CQI data? With whom? Through what modes? How often? You need a clear process for deciding on changes that might be needed based on CQI data. For example, you may want the workgroup lead, along with the CQI team, to meet and come to the full workgroup with recommendations based on CQI results. Or, you may want the full workgroup to review findings and collectively discuss recommendations.
After the workgroup has met and come to consensus about these areas of focus, the CQI subgroup should take this guidance and be empowered to develop a draft CQI plan with a process, outcomes, and impact evaluation embedded within it. The plan should include anticipated CQI challenges (e.g., complexity of measuring effectiveness, low response rates) and strengths (e.g., local evaluation resources). It should also include a draft schedule.
As noted earlier, your communication process should include a feedback loop. This feedback would include what you are learning from CQI efforts. The CQI subgroup should be responsible for facilitating this communication—and the workgroup lead should ensure that CQI is given adequate time on workgroup meeting agendas and is included in communication efforts.
Y our commitment to CQI can help bui ld buy- in among skept ical
community members who want to ensure the effor t wi l l be t ru ly col laborat ive or among others who want to know that i f a part icular approach doesn’ t seem to be working, you are not locked into a decis ion.

30A Blueprint for Using Data to Reduce Disparities/Disproportionalities in Human Services and Behavioral Health Care
The CQI subgroup is tasked with regularly sharing updates on CQI progress—during workgroup meetings and on an interim basis by e-mail. This includes key findings from your CQI efforts. The next section provides more information about creating a process, outcome, and impact evaluation that will yield important CQI data. It is important to include all stakeholders in the process so that all perspectives can be included.
Commit the resources needed to carry out the intervention effectively, based on anticipated needs: The process of evaluation provides necessary information about programeffectiveness, areas that require improvement and the need for additional resources. An effective evaluation process requires planning and should involve individuals who are well versed in evaluation processes and procedures. Whereas an evaluation process can be a costly venture, it is an important component necessary to inform systems change. As mentioned before, consider partnering with a local university or college where social science researchers and program evaluators are available to provide such services. The development and implementation of the evaluation plan should meaningfully involve key stakeholders such as community partners, family, and youth to ensure that the plan is relevant to them. The following section will describe different types of evaluation.
Gather, disaggregate, analyze, and synthesize local quantitative and qualitative data post-intervention to assess the effectiveness of the intervention strategies: This is where the performance of the program, service or intervention is tracked and assessed. It is important to look at and measure performance. Performance measurement is a system of tracking progress in accomplishing specific goals, objectives, and outcomes for a program, service or intervention.
Performance measures should: • Directly relate to program goals and objectives• Measure progress quantitatively• Be specific and focused• Provide a “temperature” reading—it may not tell you everything you want to know but
provides a quick and reliable gauge of selected results
An effective performance measurement system should be results-oriented and concentrate on desired outcomes, as well as on outputs and can serve as the basis or component of a more formal evaluation.

31A Blueprint for Using Data to Reduce Disparities/Disproportionalities in Human Services and Behavioral Health Care
The work group began its process of developing the plan for evaluation and CQI. The evaluation plan included an assessment of the intervention’s process and outcomes. The CQI plan involved careful thought about the following elements: CQI questions, data sources, data collection methods, identification of responsible parties for data collection and analysis, and CQI reporting mechanisms, including the application of findings to improve quality. The work group members knew that it was important to develop a solid CQI plan that would generate information to guide future efforts.
Equityville Evaluation and Continuous Quality Improvement

32A Blueprint for Using Data to Reduce Disparities/Disproportionalities in Human Services and Behavioral Health Care
7. Replication
Develop strategies for replication in other communities or with diverse groups. An essential component to developing strategies for replication of D&D activities in other communities and with different diverse groups is integrating the lessons learned from previous efforts to inform current efforts. Also important is the utilization of measurable outcomes associated with implemented activities to inform the development of replication strategies. It is important to have proven results that show effectiveness in addressing the reduction of D&D. Data gathered from conducting a process evaluation is vital in guiding decisions about whether or not particular approaches are relevant for replication.
Deciding on replication strategies involves several areas for consideration and development such as:
1. The area(s), location, or jurisdiction that will be included in replication efforts
2. Identifying staff who will be responsible for implementation of the replication strategies 3. Development of implementation and training materials 4. Development and implementation of a communications strategy5. Building partnerships and securing and sustaining
funding6. Development and implementation of a data collection
system
Complete Worksheet
Worksheet 7: Strategies for Replication
A checklist to document areas to consider when making decisions about replicating D&D activities in other sites.
I t is important to have proven resul ts that show
effect iveness in addressing the reduct ion of D&D.

33A Blueprint for Using Data to Reduce Disparities/Disproportionalities in Human Services and Behavioral Health Care
8. Sustainability
Developing strategies to sustain changes: What human and financial resources are needed? Who (what existing entities) can sustain all or portions of…? Is there a need for policy development? Sustainability can be achieved at different levels:
1. Policy: Policy is a great way to sustain change at the organizational level.
2. Financing: There are several funding changes that can contribute to sustainability. They include new funding, braided funding and redirected funding. Oftentimes, funding changes are accompanied by policy development for greatest impact.
3. Organizational cultures: It does not necessarily cost money to develop and maintain an organizational culture that is sensitive to D&D issues. Oftentimes, as mentioned earlier, it takes a champion or someone with power or influences to bring these issues forward and keep them front and center in the organization. It is helpful to identify a staff champion to work with family and young people to create and maintain a sense of urgency in the organization. Additionally, recruiting and retaining a workforce that is aware of D&D and trained in reducing them is important for organizational culture change. You want to raise awareness of and impact D&D both on an individual and collective level to shape and build the
organizational culture. 4. Practice changes: Practice changes can be sustained
through regular training, technical assistance, supervision, and monitoring of staff performances. Workforce training educates and sensitizes staff to the existence of D&D and therefore influences them to do what they can to reduce D&D in all aspects of their work.
5. Evaluation: The costs associated with evaluation may vary depending on the breadth and depth of the design and process. The evaluation may be conducted by the workgroup or by an external
contractor (e.g., individual, university, research group,
Complete Worksheet
Worksheet 8:
Sustainabil i ty
An action planning tool to identify steps for sustainabil-ity and training and technical assistance needs.
I t does not necessar i ly cost money to develop
and maintain an organizat ional cul ture that is sensi t ive to D&D issues.

34A Blueprint for Using Data to Reduce Disparities/Disproportionalities in Human Services and Behavioral Health Care
local nonprofit). These and other related factors should be taken into account at the onset, when a greater percentage of human and fiscal resources are typically available for evaluation, and adjusted over time to allow planned or unplanned reductions in the evaluation budget. It may be helpful to explore and engage un- or underutilized staff or staff skills to conduct smaller scale projects that may be manageable by an internal team. Building alliances with local colleges and
universities creates an opportunity for many exchanges. One valuable opportunity is the use of students who are completing internships and practicums. This mutual exchange provides students with practical work, and it can provide organizations with human resources they need to sustain evaluation components and develop the workforce by providing future employment opportunities for students.
The process for developing and implementing activities associated with addressing the reduction of D&D through data-driven mechanisms is not a linear process. The work group learned that it had to revisit and revise plans made early on the process and that the process itself required time, commitment, and dedicated resources to be successful.
Equityville Lessons Learned:
Moving Forward Reducing and ultimately eliminating D&D is challenging and rewarding at the same time. Many factors impact the success and the pace of these efforts. Start wherever and whenever you can. Set goals and develop a realistic plan using this guide as a resource. Take advantage of whatever resources you now have and capitalize on other assets as you move forward. Be aware of the challenges and find ways to overcome them, leveraging the talents and passion of those around you. Most importantly, build a strong team to tackle this work. Your leadership, collaborative efforts and joint energy will make it happen. Celebrate your successes and do not be deterred by challenges. Remember, this is a worthwhile endeavor. Your work will help build a compassionate society, accountable system, effective services, promising families, and thriving individuals.

35A Blueprint for Using Data to Reduce Disparities/Disproportionalities in Human Services and Behavioral Health Care
Appendix A
National/State Disparity/Disproportionality Data Sources
Child Welfare DataAlliance for Equity in Child Welfare. (2011). Disparities and disproportionality in child welfare:
Analysis of the research. Retrieved from http://www.cssp.org/publications/child-welfare/alli-ance/Disparities-and-Disproportionality-in-Child-Welfare_An-Analysis-of-the-Research-Decem-ber-2011.pdf
Annie E. Casey Foundation. (2013). Kids count data center: safety and risky behavior. Retrieved from http://datacenter.kidscount.org/data#USA/1/35/36,37,38,41
Summers, A., Wood, S., & Donovan, J. (2013). Disproportionality rates for children of color in foster care. Retrieved from http://www.ncjfcj.org/resource-library/publications/disproportionali-ty-rates-children-color-foster-care-2013-technical
U.S. Department of Health and Human Services (HHS), Administration for Children and Families (ACF). (2013). Children’s Bureau. Retrieved from http://www.acf.hhs.gov/programs/cb
U.S. Department of Health and Human Services (HHS), Administration for Children and Fami-lies (ACF). (2013). Children’s Bureau adoption and foster care statistics. Retrieved from http://www.acf.hhs.gov/programs/cb/research-data-technology/statistics-research/afcars
U.S. Department of Health and Human Services (HHS), Administration for Children and Families (ACF). (2013). Children’s Bureau adoption data 2011. Retrieved from http://www.acf.hhs.gov/programs/cb/resource/adoption-data-2011
U.S. Department of Health and Human Services (HHS), Administration for Children and Families (ACF). (2013). Children’s Bureau FY 2003‒FY 2011 foster care data: Entries, exits, and num-ber of children in care on the last day of each federal fiscal year. Retrieved from http://www.acf.hhs.gov/sites/default/files/cb/entryexit2011.pdf
U.S. Department of Health and Human Services (HHS), Administration for Children and Fam-ilies (ACF). (2013). Children’s Bureau race/ethnicity of public agency children adopted: 10/1/2010‒9/30/2011. Retrieved from http://www.acf.hhs.gov/programs/cb/resource/race-2011
U.S. Department of Health and Human Services (HHS), Administration for Children and Families (ACF). (2013). Children’s Bureau statistics and research. Retrieved from http://www.acf.hhs.gov/programs/cb/research-data-technology/statistics-research

36A Blueprint for Using Data to Reduce Disparities/Disproportionalities in Human Services and Behavioral Health Care
U.S. Department of Health and Human Services, Administration for Children and Families, Chil-dren’s Bureau. (2012). The adoption and foster care analysis and reporting system (AFCARS) report. Retrieved from http://www.acf.hhs.gov/sites/default/files/cb/afcarsreport19.pdf
Criminal Justice DataHartney, C., Vuong, L. (2009). Created equal: racial and ethnic disparities in the u.s. criminal
justice system. Retrieved from http://www.nccdglobal.org/sites/default/files/publication_pdf/cre-ated-equal.pdf
Vera Institute Project. (2013). Race and ethnicity resources. Retrieved from http://www.vera.org/topics/race-and-ethnicity
Health DataUniversity of Wisconsin Population Health Institute, Robert Wood Johnson Foundation. (2013).
The county health rankings & roadmap. Retrieved from http://www.countyhealthrankings.org/
Juvenile Justice DataAnne Casey Foundation. (2013). Kids count data center: safety and risky behavior. Retrieved
from http://datacenter.kidscount.org/data#USA/1/35/36,37,38,41
Office of Juvenile Justice Delinquency Prevention (OJJDP). (2013). State contacts. Retrieved from http://www.ojjdp.gov/statecontacts/ResourceList.asp
To access state D&D data, you must request it of the OJJDP State Contact or the Dispropor-tionate Minority (DMC) State Contact.
U.S. Department of Justice, Office of Juvenile Justice and Delinquency Prevention. (2009). Na-tional disproportionate minority contact databook. Retrieved from http://www.ojjdp.gov/ojstatbb/dmcdb/asp/display.asp
W. Haywood Burns Institute for Juvenile Justice Fairness and Equity. (2013). State map. Re-trieved from http://www.burnsinstitute.org/state_map.php
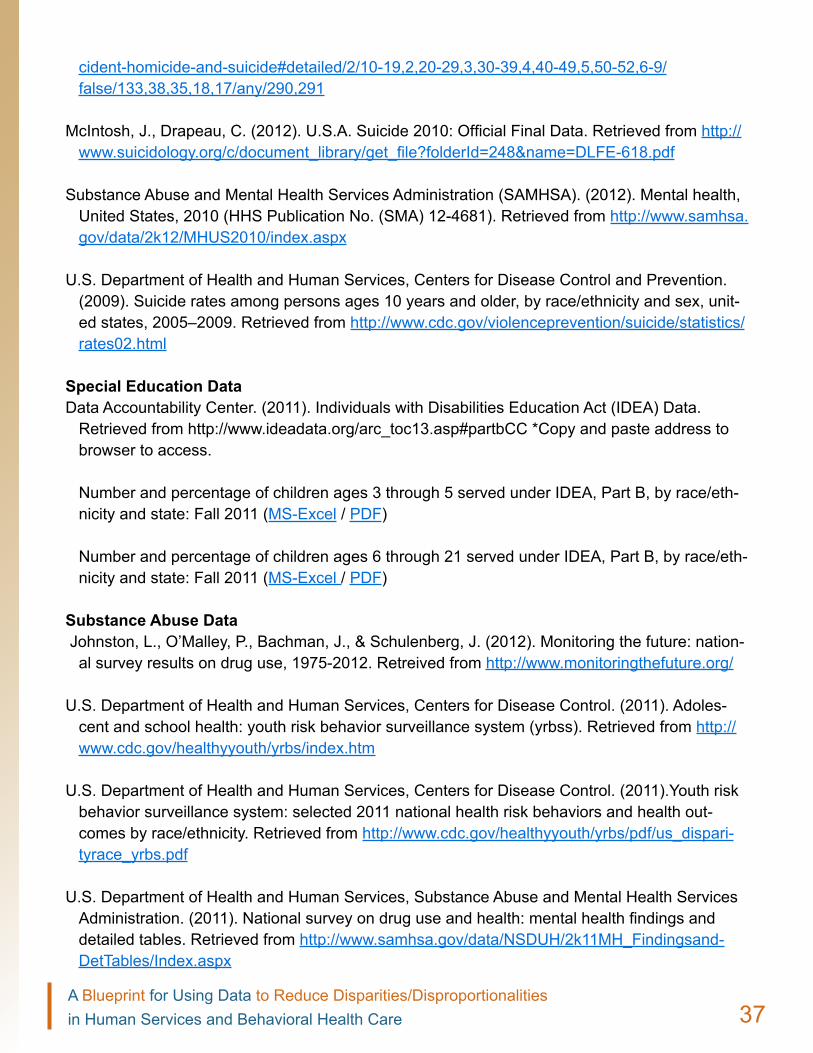
Mental Health DataAmerican Foundation for Suicide Prevention. (2013). Facts and figures: suicide deaths. Re-
trieved from http://www.afsp.org/understanding-suicide/facts-and-figures
Annie E. Casey Foundation. (2013). Kids count data center: demographics indicators. Retrieved from http://datacenter.kidscount.org/data#USA/1/0
Annie E. Casey Foundation. (2013). Kids count data center: teen deaths by accident, homicide and suicide. Retrieved from http://datacenter.kidscount.org/data/tables/24-teen-deaths-by-ac-
37A Blueprint for Using Data to Reduce Disparities/Disproportionalities in Human Services and Behavioral Health Care
cident-homicide-and-suicide#detailed/2/10-19,2,20-29,3,30-39,4,40-49,5,50-52,6-9/false/133,38,35,18,17/any/290,291
McIntosh, J., Drapeau, C. (2012). U.S.A. Suicide 2010: Official Final Data. Retrieved from http://www.suicidology.org/c/document_library/get_file?folderId=248&name=DLFE-618.pdf
Substance Abuse and Mental Health Services Administration (SAMHSA). (2012). Mental health, United States, 2010 (HHS Publication No. (SMA) 12-4681). Retrieved from http://www.samhsa.gov/data/2k12/MHUS2010/index.aspx
U.S. Department of Health and Human Services, Centers for Disease Control and Prevention. (2009). Suicide rates among persons ages 10 years and older, by race/ethnicity and sex, unit-ed states, 2005–2009. Retrieved from http://www.cdc.gov/violenceprevention/suicide/statistics/rates02.html
Special Education DataData Accountability Center. (2011). Individuals with Disabilities Education Act (IDEA) Data.
Retrieved from http://www.ideadata.org/arc_toc13.asp#partbCC *Copy and paste address to browser to access.
Number and percentage of children ages 3 through 5 served under IDEA, Part B, by race/eth-nicity and state: Fall 2011 (MS-Excel / PDF)
Number and percentage of children ages 6 through 21 served under IDEA, Part B, by race/eth-nicity and state: Fall 2011 (MS-Excel / PDF)
Substance Abuse Data Johnston, L., O’Malley, P., Bachman, J., & Schulenberg, J. (2012). Monitoring the future: nation-
al survey results on drug use, 1975-2012. Retreived from http://www.monitoringthefuture.org/ U.S. Department of Health and Human Services, Centers for Disease Control. (2011). Adoles-
cent and school health: youth risk behavior surveillance system (yrbss). Retrieved from http://www.cdc.gov/healthyyouth/yrbs/index.htm
U.S. Department of Health and Human Services, Centers for Disease Control. (2011).Youth risk behavior surveillance system: selected 2011 national health risk behaviors and health out-comes by race/ethnicity. Retrieved from http://www.cdc.gov/healthyyouth/yrbs/pdf/us_dispari-tyrace_yrbs.pdf
U.S. Department of Health and Human Services, Substance Abuse and Mental Health Services Administration. (2011). National survey on drug use and health: mental health findings and detailed tables. Retrieved from http://www.samhsa.gov/data/NSDUH/2k11MH_Findingsand-DetTables/Index.aspx

38A Blueprint for Using Data to Reduce Disparities/Disproportionalities in Human Services and Behavioral Health Care
Appendix B
Resources
Bureau of Justice Statistics. (2012). Data collection: National Survey of Youth in Custody (NSYC). Retrieved from http://www.bjs.gov/index.cfm?ty=dcdetail&iid=321
The National Survey of Youth in Custody (NSYC) is part of the Bureau of Justice Statistics National Prison Rape Statistics Program to gather mandated data on the incidence and prev-alence of sexual assault in juvenile facilities under the Prison Rape Elimination Act of 2003. Data are collected directly from youth in a private setting using audio computer-assisted self-interview (ACASI) technology with a touchscreen laptop and an audio feed to maximize inmate confidentiality and minimize literacy issues. Frequency: 2008‒09 and 2012.
Center for Juvenile Justice Reform, Urban Institute. (2009). Racial and ethnic disparity and dis-proportionality in child welfare and juvenile justice: A compendium pp. 19-20.
Coalition on Juvenile Justice. (2012). Disproportionate minority contact (DMC): Facts and re-sources.
Fertig, T. (2013, January 16). Kansas assesses disproportionate minority contact in juvenile jus-tice system. Retrieved from http://www.reclaimingfutures.org/blog/kansas-dmc
Hanes, M. (2012). In focus: Disproportionate minority contact. Washington, DC: U.S. Department of Justice, Office of Juvenile Justice and Delinquency Prevention (OJJDP). Retrieved from http://www.ojjdp.gov/pubs/239457.pdf
Illinois Juvenile Justice Commission. (2012). Guidelines for collecting and recording the race and ethnicity of youth in Illinois’ juvenile justice system. Retrieved from http://www.models-forchange.net/publications/391
Models for Change. (2011). Knowledge brief: Are minority youth treated differently in juvenile probation? Retrieved from http://www.modelsforchange.net/publications/314
Models for Change. (2012). Innovation brief: Reducing racial and ethnic disparities in Pennsylva-nia. Retrieved from http://www.modelsforchange.net/publications/351
Models for Change. (2013). Directory of racial-ethnic fairness/DMC organizations and state and local efforts. Retrieved from http://www.modelsforchange.net/directory/listing.html?tags=Ra-cial-ethnic+fairness%2fDMC

39A Blueprint for Using Data to Reduce Disparities/Disproportionalities in Human Services and Behavioral Health Care
National Association for the Advancement of Colored People (NAACP). (2011). Misplaced pri-orities: Over incarcerate, under educate. Retrieved from http://www.naacp.org/pages/mis-placed-priorities
Pullmann, M. D., Ague, S., Walker, S. C., Negrete, A., Quick, H. F., & Trumpin, E. (2013). Wash-ington state disproportionate minority contact assessment. Retrieved from http://www.dshs.wa.gov/pdf/ojj/DMC/DMC_Final_Report_2013.pdf
Sedlak, A. J., Bruce, C., Cantor, D., Ditton, P., Hartge, J., Krawchuk, S., McPherson, K., & Sha-piro, G. (2012). Survey of Youth in Residential Placement: Technical report. Retrieved from https://syrp.org/images/SYRP_Tech_Report.pdf
The Survey of Youth in Residential Placement (SYRP) is an addition to Office of Juvenile Jus-tice and Delinquency Prevention’s constellation of surveys on youth in custody in the juvenile justice system. SYRP gathers information directly from youth through anonymous interviews. The website is the gateway to SYRP reports and to the SYRP online analysis system.
Slowkowski, J. (2009). In focus: Disproportionate minority contact. Washington, DC: U.S. Depart-ment of Justice, Office of Juvenile Justice and Delinquency Prevention.
Summers, A., Wood , S., & Russell. (2012). Disproportionality rates for children of color in fos-ter care. Retrieved from http://www.ncjfcj.org/resource-library/publications/disproportionali-ty-rates-children-color-foster-care-2013-technical
U.S. Department of Health and Human Services, Administration for Children and Families. (2013). Child Welfare Information Gateway: Disproportionality. Retrieved from https://www.childwelfare.gov/systemwide/cultural/disporp/
U.S. Department of Justice, Office of Juvenile Justice Delinquency Prevention. (2009). Dispro-portional minority contact technical assistance manual (4th ed.). Retrieved from https://www.ncjrs.gov/html/ojjdp/dmc_ta_manual/index.html
Vera Institute Project. (2013). Race and ethnicity resources. Retrieved from http://www.vera.org/topics/race-and-ethnicity

40A Blueprint for Using Data to Reduce Disparities/Disproportionalities in Human Services and Behavioral Health Care
The process involved in developing and implementing strategies to reduce disparities/
disproportionalities should be data driven. The process involves significant planning,
monitoring, and coordination. The document A Blueprint for Using Data to Reduce Disparities/
Disproportionalities in Human Services and Behavioral Health Care (Blueprint) provides a guided
step-by-step process for successfully developing and implementing strategies. Take time to
carefully read through the document. It is also important to encourage partners and stakeholders
to do the same. As communities and states embark on conducting activities pertinent to this
process, think about the strengths, challenges, and intended outcomes of activities. Some of this
work may already be planned, under way, or implemented in your community or state. In other
cases, you may just be beginning the work.
Purpose of the Worksheets
The worksheets serve as a companion to the Blueprint and are guides for communities
and states as you (1) think through the multiple stages of the process to reduce disparities/
disproportionalities and (2) design a plan and determine specific areas that are critical for
success. The worksheets can also be used to document the planning, implementation, and
evaluation process. Your documentation will assist in guiding future replication efforts.
How to Use the Worksheets
Ten worksheets accompany the Blueprint document. Working through these worksheets will
help you to identify technical assistance (TA) needs and develop a tailored TA plan to support a
successful planning and implementation process. Below is a brief description of each worksheet
and its purpose:
Worksheets
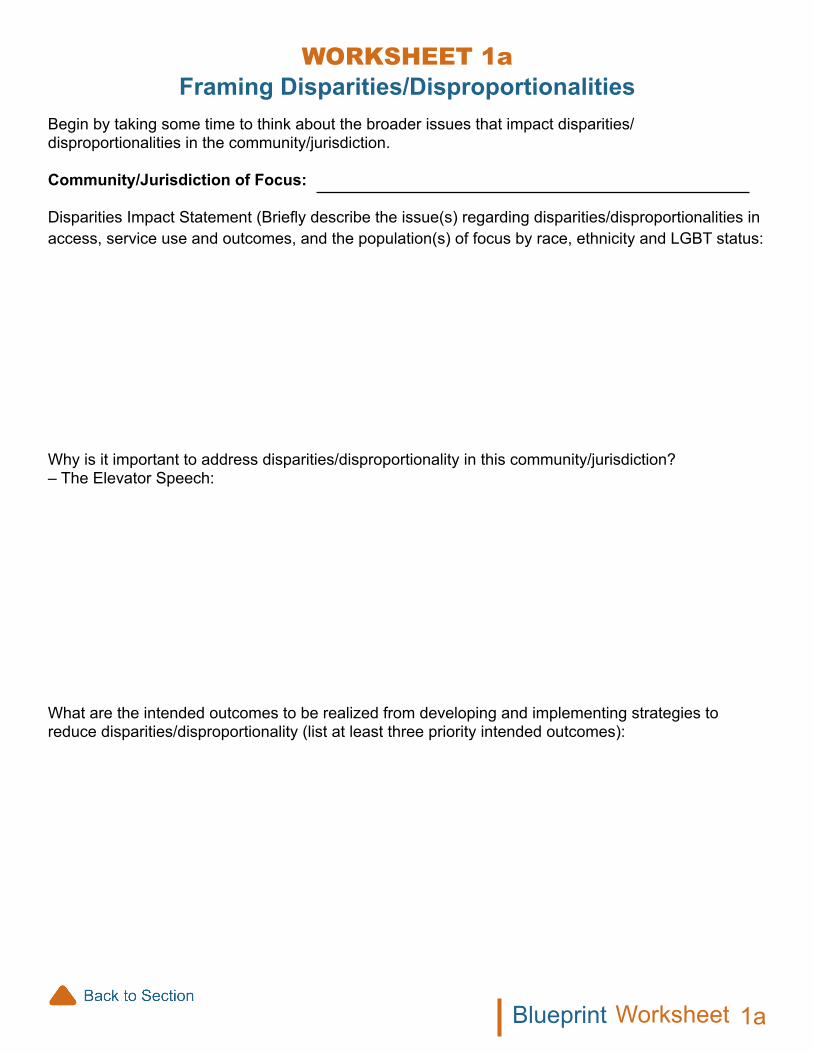
Begin by taking some time to think about the broader issues that impact disparities/disproportionalities in the community/jurisdiction.
Community/Jurisdiction of Focus:
Disparities Impact Statement (Briefly describe the issue(s) regarding disparities/disproportionalities in access, service use and outcomes, and the population(s) of focus by race, ethnicity and LGBT status:
Why is it important to address disparities/disproportionality in this community/jurisdiction? – The Elevator Speech:
What are the intended outcomes to be realized from developing and implementing strategies to reduce disparities/disproportionality (list at least three priority intended outcomes):
Framing Disparities/DisproportionalitiesWoRkSHEEt 1a
1aWorksheetBlueprint

WoRkSHEEt 1bDetermining Readiness
SWOT Analysis (Strengths, Weaknesses, Opportunities, Threats)Complete the categories listed in each area of the SWOT analysis. It is recommended that the SWOT analysis be completed in collaboration with key stakeholders.
Strengths Weaknesses Opportunities ThreatsIdentify leaders in the community/jurisdiction who will lead and sustain the effort
Identify stakeholders and the resources they are able to contribute to the effort
Identify current initiatives in the community/ jurisdiction that have the potential to compete for financial or political support
Identify historical or current events that may promote barriers to taking action
Identify current initiatives in the community/ jurisdiction that support the alignment of activities to address disparities/disproportionalities
Identify other opportunities
Identify threats/risks to being able to proceed with activities focused on addressing disparities/disproportionalities
1bWorksheetBlueprint

Now that the SWOT analysis is complete, think about the feasibility of implementing activities to address disparities/disproportionalities.
• What is the feasibility of intended efforts?• Does the current political climate support efforts to address disparities/disproportionalities?
List strategies for obtaining support (list at least three priority strategies):
1bWorksheetBlueprint

WoRkSHEEt 2aCommunity Engagement
Identify agency leaders, organizational/cultural/faith/business leaders, and stakeholders from the community to support, engage, and participate in activities to address disparities/disproportionalities.
Community Partners/ Organizations/ Agencies/ Stakeholders
Resources Strengths/Assets
2aWorksheetBlueprint

WoRkSHEEt 2bLogic Model Template
Community Jurisdiction:
Shared Vision:
Values:
Resources:
Population of Focus Goals Strategies Outcomes
Context
Short Term
Long Term
2bWorksheetBlueprint
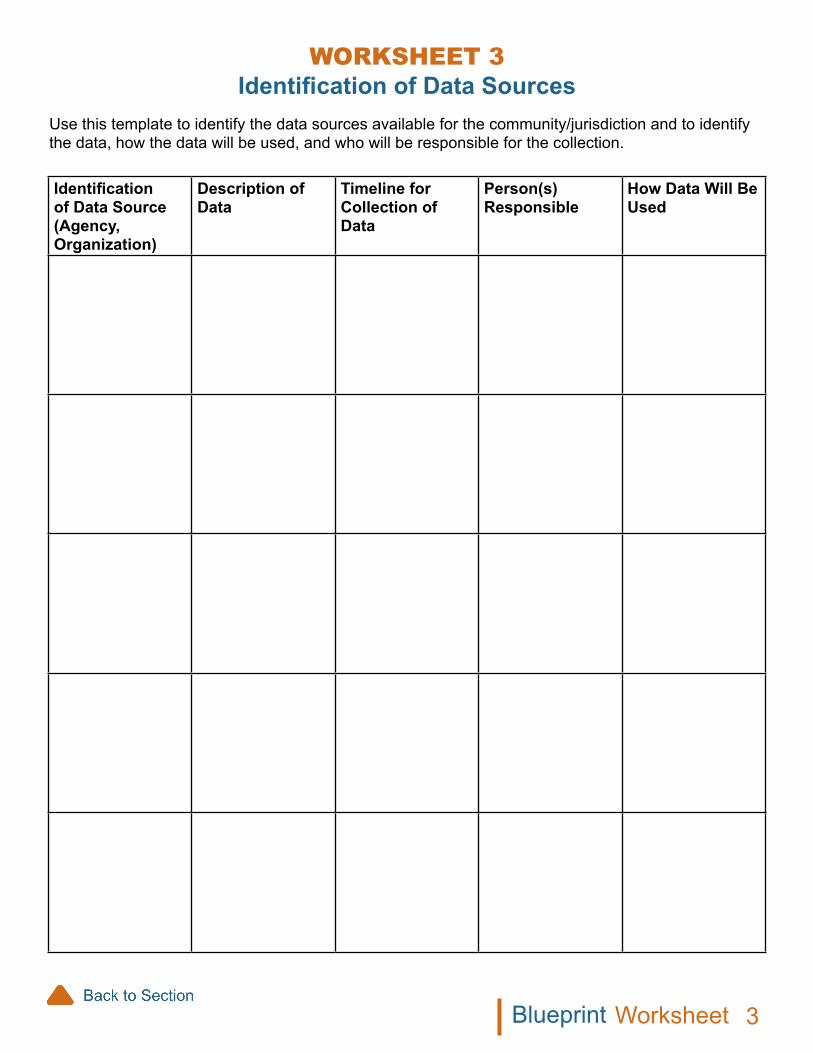
WoRkSHEEt 3Identification of Data Sources
Use this template to identify the data sources available for the community/jurisdiction and to identify the data, how the data will be used, and who will be responsible for the collection.
Identification of Data Source (Agency, Organization)
Description of Data
Timeline for Collection of Data
Person(s)Responsible
How Data Will Be Used
3WorksheetBlueprint

WoRkSHEEt 4Assessment and Review of Data
Evaluation Questions Data Source Type of Data Collection Instrument
Outcomes (What do the Data Say?)
4WorksheetBlueprint
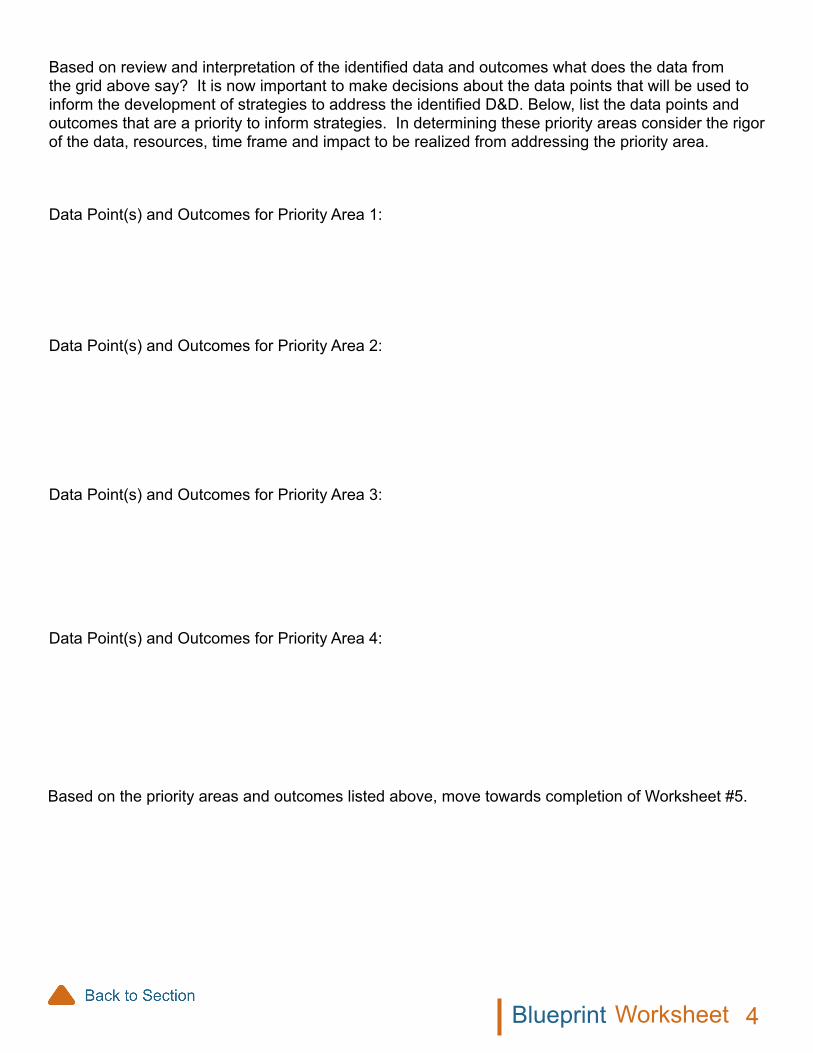
WorksheetBlueprint
Based on review and interpretation of the identified data and outcomes what does the data from the grid above say? It is now important to make decisions about the data points that will be used to inform the development of strategies to address the identified D&D. Below, list the data points and outcomes that are a priority to inform strategies. In determining these priority areas consider the rigor of the data, resources, time frame and impact to be realized from addressing the priority area.
Data Point(s) and Outcomes for Priority Area 1:
Data Point(s) and Outcomes for Priority Area 2:
Data Point(s) and Outcomes for Priority Area 3:
Data Point(s) and Outcomes for Priority Area 4:
Based on the priority areas and outcomes listed above, move towards completion of Worksheet #5.
4

WorksheetBlueprint
WoRkSHEEt 5Intervention Planning
Consider the range of possible strategies to effectively address disparities/disproportionalities and fill in interventions that could be used to address the identified issue(s) at the individual, organization/institution, and community levels. Strategies may overlap and fall into multiple categories. The workgroup can decide which strategies best fit where.
Approaches/StrategiesDOMAINS FOCUS AREA: (Example) Child Welfare (disproportionate overrepresentation of youth from ethnic/racial groups)
Systems Levels Practice Organizational Level
Child/Family Level
ProgramsActivities focused on increasing knowledge about health/mental health/substance use issues and/or promoting healthy behaviors or conditions
Systems ChangeChange that impacts social norms of an organization, institution, or system to reduce or eliminate disparities/disproportionalities
Environmental ChangePhysical aspects of the environment that support pro-social behaviors and conditions to reduce or eliminate disparities/ disproportionalities
PolicyLegislation, policies, mandates, regulations, rules,protocols, and procedures that support the reduction or elimination of disparities/disproportionalities
5

WorksheetBlueprint
WoRkSHEEt 6Continuous Quality Improvement
This worksheet will help you begin thinking about your continuous quality improvement (CQI) plan. You can use it to map out and revise your team’s thinking about how you will approach CQI as part of your broader intervention efforts. The worksheet has two parts (Parts I and II), which should be completed for each of your evaluation focus areas: process, outcomes, and impact. Be sure to ask the right types of questions based on each aspect of your evaluation. For the process evaluation, you want to document what your intervention is doing—what are its outputs and who is participating? For the outcomes evaluation, focus on the intervention’s results. Be sure to involve an evaluator knowledgeable in evaluation design to ensure that your approach to evaluating the results can be attributed to the intervention to the greatest extent possible.
Continuous Quality Improvement Worksheet Part I
This first section focuses on the evaluation questions, data sources for answering these questions, and the methods you will use to answer them. Data sources, methods, and so on, may be similar in some cases. As part of your plan, you should identify opportunities to efficiently collect and analyze data as well as report your findings.
Compenents of the CQI Plan Areas of Evaluative Focus
Process Outcomes Impact
QuestionsWhat are the important questions you want to answer?
Data SourcesWhat sources of information will you draw on (e.g., intervention participants, program administrators, datasets)?
Data MethodsWhat methods should you use to answer the questions (e.g., analysis of extant data, focus groups, interviews, observations)?
6
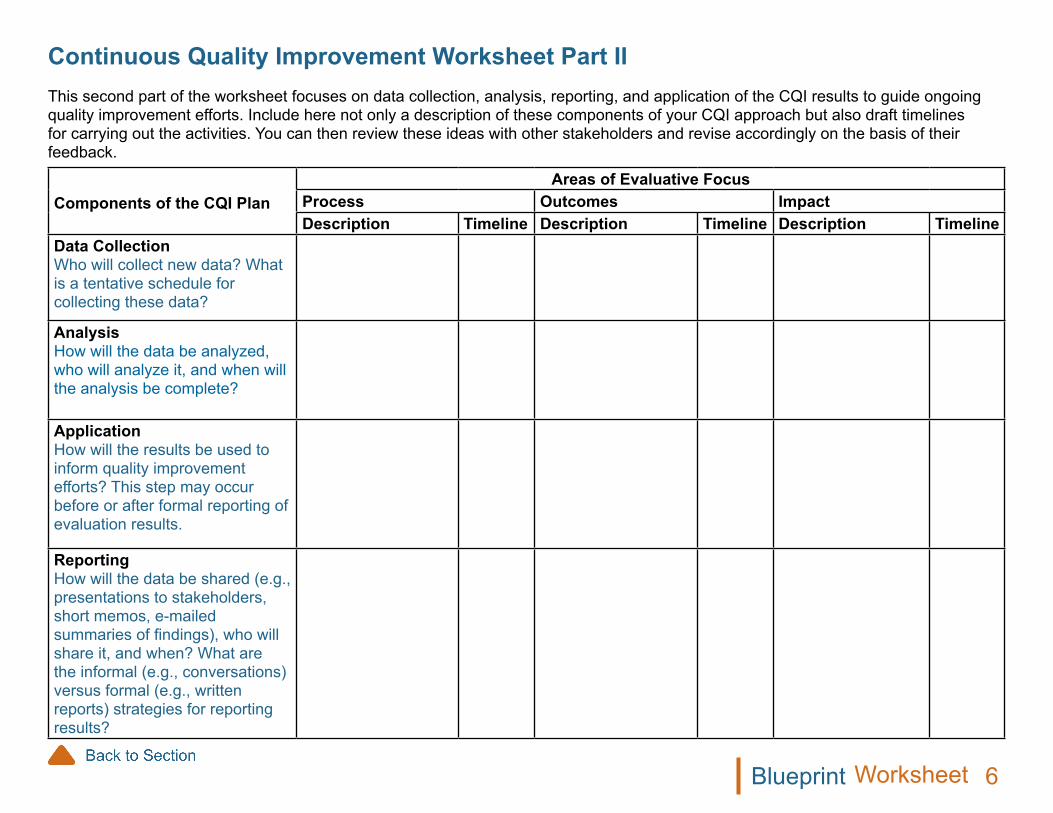
Components of the CQI Plan Areas of Evaluative Focus
Process Outcomes Impact Description Timeline Description Timeline Description Timeline
Data CollectionWho will collect new data? What is a tentative schedule for collecting these data?
AnalysisHow will the data be analyzed, who will analyze it, and when will the analysis be complete?
ApplicationHow will the results be used to inform quality improvement efforts? This step may occur before or after formal reporting of evaluation results.
ReportingHow will the data be shared (e.g., presentations to stakeholders, short memos, e-mailed summaries of findings), who will share it, and when? What are the informal (e.g., conversations) versus formal (e.g., written reports) strategies for reporting results?
WorksheetBlueprint
Continuous Quality Improvement Worksheet Part IIThis second part of the worksheet focuses on data collection, analysis, reporting, and application of the CQI results to guide ongoing quality improvement efforts. Include here not only a description of these components of your CQI approach but also draft timelines for carrying out the activities. You can then review these ideas with other stakeholders and revise accordingly on the basis of their feedback.
6

WorksheetBlueprint
WoRkSHEEt 7Strategies for Replication
Area(s) (location/jurisdiction) for replication of disparities/disproportionalities efforts:
Staff who will be responsible for implementing the replication strategies:
List of training materials needed for implementation:
What materials exist? What materials need to be developed?
Communication strategy: Three priority activities:
Agency/organization partners to support replication efforts:
Community Partners/ Agency/Organization/ Stakeholders
Resources Strengths/ Assets
Worksheets 3 and 4 should be reviewed and completed again for your replication efforts.
7
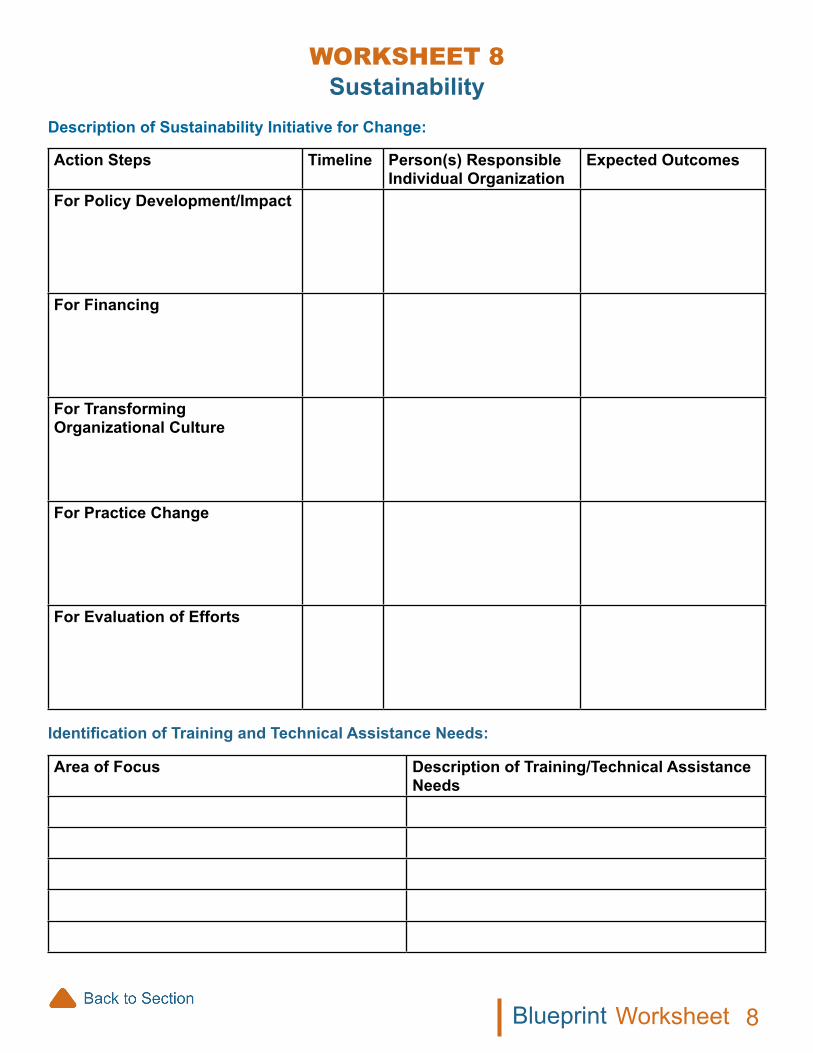
WoRkSHEEt 8Sustainability
Description of Sustainability Initiative for Change:
Action Steps Timeline Person(s) Responsible Individual Organization
Expected Outcomes
For Policy Development/Impact
For Financing
For Transforming Organizational Culture
For Practice Change
For Evaluation of Efforts
Identification of Training and Technical Assistance Needs:
Area of Focus Description of Training/Technical Assistance Needs
8WorksheetBlueprint