A biomechanical model of cardinal vowel production: muscle ...
57
HAL Id: hal-00422426 https://hal.archives-ouvertes.fr/hal-00422426 Submitted on 7 Oct 2009 HAL is a multi-disciplinary open access archive for the deposit and dissemination of sci- entific research documents, whether they are pub- lished or not. The documents may come from teaching and research institutions in France or abroad, or from public or private research centers. L’archive ouverte pluridisciplinaire HAL, est destinée au dépôt et à la diffusion de documents scientifiques de niveau recherche, publiés ou non, émanant des établissements d’enseignement et de recherche français ou étrangers, des laboratoires publics ou privés. A biomechanical model of cardinal vowel production: muscle activations and the impact of gravity on tongue positioning Stéphanie Buchaillard, Pascal Perrier, Yohan Payan To cite this version: Stéphanie Buchaillard, Pascal Perrier, Yohan Payan. A biomechanical model of cardinal vowel pro- duction: muscle activations and the impact of gravity on tongue positioning. Journal of the Acoustical Society of America, Acoustical Society of America, 2009, 126 (4), pp.2033-2051. 10.1121/1.3204306. hal-00422426
Transcript of A biomechanical model of cardinal vowel production: muscle ...

HAL Id: hal-00422426https://hal.archives-ouvertes.fr/hal-00422426
Submitted on 7 Oct 2009
HAL is a multi-disciplinary open accessarchive for the deposit and dissemination of sci-entific research documents, whether they are pub-lished or not. The documents may come fromteaching and research institutions in France orabroad, or from public or private research centers.
L’archive ouverte pluridisciplinaire HAL, estdestinée au dépôt et à la diffusion de documentsscientifiques de niveau recherche, publiés ou non,émanant des établissements d’enseignement et derecherche français ou étrangers, des laboratoirespublics ou privés.
A biomechanical model of cardinal vowel production:muscle activations and the impact of gravity on tongue
positioningStéphanie Buchaillard, Pascal Perrier, Yohan Payan
To cite this version:Stéphanie Buchaillard, Pascal Perrier, Yohan Payan. A biomechanical model of cardinal vowel pro-duction: muscle activations and the impact of gravity on tongue positioning. Journal of the AcousticalSociety of America, Acoustical Society of America, 2009, 126 (4), pp.2033-2051. �10.1121/1.3204306�.�hal-00422426�
A biomechanical model of cardinal vowel production: muscleactivations and the impact of
gravity on tongue positioning
Stephanie Buchaillarda) and Pascal Perrierb)
ICP/GIPSA-lab - UMR CNRS 5216 - Grenoble INP (France)
Yohan Payanc)
TIMC-IMAG - UMR CNRS 5525 - Universite Joseph Fourier - Grenoble (France)
(Dated: July 21, 2009)
Modeling study of cardinal vowel production 1

Abstract
A 3D biomechanical model of the tongue and the oral cavity, controlled by
a functional model of muscle force generation (λ -model of the equilibrium
point hypothesis) and coupled with an acoustic model, was exploited to
study the activation of the tongue and mouth floor muscles during the pro-
duction of French cardinal vowels. The selection of the motor commands to
control the tongue and the mouth floor muscles was based on literature data,
such as electromyographic (EMG), electropalatographic (EPG) and cinera-
diographic data. The tongue shapes were also compared to data obtained
from the speaker used to build the model. 3D modeling offeredthe opportu-
nity to investigate the role of the transversalis, in particular its involvement
in the production of high front vowels. It was found, with this model, to
be indirect via reflex mechanisms due to the activation of surrounding mus-
cles, not voluntary. For vowel /i/, local motor command variations for the
main tongue muscles revealed a non-negligible modificationof the alveolar
groove in contradiction to the saturation effect hypothesis, due to the role
of the anterior genioglossus. Finally, the impact of subject position (supine
or upright) on the production of French cardinal vowels was explored and
found to be negligible.
PACS numbers: 43.70.Aj, 43.70.Bk
2

I. INTRODUCTION
Speech movements and acoustic speech signals are the results of the combined influences of
communicative linguistic goals, perceptual constraints and physical properties of the speech pro-
duction apparatus. To understand how these different factors combine and interact with each other,
it requires an efficient approach that develops realistic physical models of the speech production
and/or speech perception systems. The predictions of thesemodels can then be compared with
experimental data, and used to infer information about parameters or control signals that are not
directly measurable or the measurement of which is difficultand not completely reliable. Such a
methodological approach underlies the present work, in which a biomechanical model of the vo-
cal tract has been used to study muscle control in vowel production, its impact on token-to-token
variability and its consequences for tongue shape sensitivity to changes in head (supine versus
upright) orientation. The findings are interpreted in the light of our own experimental data and
data published in the literature.
Biomechanical models of the tongue and vocal tract have been in use since the 1960’s, and
their complexity has increased with the acquisition of new knowledge about anatomical, neuro-
physiological and physical characteristics of the tongue,as well as with the vast growth in the
computational capacities of computers. All these models have significantly contributed to the
increase in knowledge about tongue behavior and tongue control during speech production, and
more specifically about the relations between muscle recruitments and tongue shape or acoustic
signal (see in particularPerkell, 1996, using his model presented inPerkell(1974); Kakita et al.,
1985; Hashimoto and Suga, 1986; Wilhelms-Tricarico, 1995; Payan and Perrier, 1997; Sanguineti
et al., 1998; Dang and Honda, 2004). With a more sophisticated 3D vocal tract model, based
on non-linear continuum mechanics modeling, and taking in consideration a number of recent
experimental findings, this study aims at deepening and extending these former works for vowel
a)[email protected])[email protected])[email protected]
3

production.
The model consists of a 3D biomechanical model of the tongue and the oral cavity, controlled
by a functional model of muscle force generation (λ -model of the equilibrium point hypothesis)
and coupled with an acoustic model. It is a significantly improved version of the model origi-
nally developed in GIPSA-lab by Gerard and colleagues (Gerardet al., 2003; Gerardet al., 2006).
The oral cavity model was developed so as to give as realistica representation as possible of the
anatomy and of the mechanical properties of the oral cavity.The original modeling was based on
the data of the Visible Human Project, and further adapted tothe anatomy of a specific subject.
For this subject, different kinds of data (X-ray, CT images, acoustic data) were available. The
parameters used in this model were either extracted from theliterature, derived from experimental
data or adapted from the literature. This modeling study is inseparable from a thorough exper-
imental approach. In addition to a careful and accurate account of anatomical, mechanical and
motor control facts, the model implements a number of hypotheses about the hidden parts of the
speech production system. Simulation results, their interpretation and the corresponding conclu-
sions aim at opening new paths for further experimental research that could validate or contest
these conclusions.
The main characteristics of the model (geometry, mechanical properties and model of control) are
presented in SectionII . The model includes improvements in the anatomical and morphological
description and in the strain/stress function, as well as a control model of muscle activation (Sec-
tion II ). The model is first used (SectionIII ) in order to characterize the muscle activation patterns
associated with the production of the French cardinal vowels. Starting from these patterns, the
relation between internal muscle strain and muscle activations is systematically studied. In the
following section (SectionIV), the sensitivity of the postural control of the tongue (andhence
of the formant frequencies) to changes in motor commands is precisely studied for /i/, which is
often described in the literature as a very stable vowel due to specific combinations of muscle
activations. Finally, the impact on tongue positioning of changes in gravity orientation is assessed
(SectionV). Perspectives and further developments are discussed in the conclusion.
4

II. MODELING THE ORAL CAVITY
Modeling the oral cavity by a finite element approach requires meshing the structure of inter-
est, specifying its mechanical properties, and defining a motor control scheme. Then, the simula-
tion of movements in response to motor commands requires solving the body motion equations.
These different aspects will be described in this section.
The primary goal of our work is the development of a model which allows a better under-
standing of how motor control and physical aspects combine and interact to determine the char-
acteristics of speech production signals. Hence, a high degree of realism is essential in the design
of the model, not only concerning the geometrical properties, but also the mechanical and control
aspects.
The model described below is an improved version of the modeldeveloped by Gerard and
colleagues (Gerardet al., 2003; Gerardet al., 2006). The original model was based on the Visible
Human ProjectR⃝ data for a female subject and the work ofWilhelms-Tricarico(2000). It was
then adapted to a specific male subject, PB henceforth. Majordifferences between the current
version and those of Gerard and colleagues lie in (1) the motor control scheme (muscle forces
are now computed via theλ -model of the equilibrium point hypothesis), (2) the constitutive law
for the tongue tissues (the law inferred byGerardet al. (2005) from indentation measurements of
fresh cadaver tissues was modified to match the properties ofliving tissues; in addition, the law
now depends on the level of muscle activation), (3) the modeling of the hyoid bone (a new scheme
was also developed to deal with hyoid bone mobility and to model the infrahyoid and digastric
muscles). Modifications were also made to the tongue mesh, the muscle fibers, the bony insertions
and the areas of contact between the tongue and the surrounding surfaces, namely the mandible,
the hard palate and the soft palate. The 3D vocal tract model was also coupled with an acoustic
model.
5

A. Geometrical and anatomical structures
A precise description of the tongue anatomy will not be givenhere. A thorough description,
which lies at the root of this work, can be found inTakemoto(2001). The tongue model represents
the 3D structure of the tongue of a male subject (PB), for whom several sets of data have been
collected in the laboratory in the last 15 years. This model is made of a mesh composed of
hexahedral elements. The anatomical location of the major tongue muscles is specified via subsets
of elements in the mesh. Fig.1 shows the implementation of the 11 groups of muscles represented
in the model and known to contribute to speech production. Nine of them exert force on the tongue
body itself, while the other two, depicted in the last two panels (Fig.1(j) and1(k)), are considered
to be the major mouth floor muscles. Of course, due to the elastic properties of tongue tissues,
each muscle is likely to induce strain in all the parts of the tongue and mouth floor. On rare
occasion the muscle shape is somewhat unnatural because thetongue muscles were defined as a
subset of elements of the global mesh. This is for example thecase with the IL. However, when
activated, the force generated by the IL appeared correct inamplitude and direction. The insertion
of the different parts of the geniglossus on the mandible canalso appear odd: in human beings,
GGp emanates from the lower surface of the short tendon that reduces crowding of the fibers at
the mandibular symphysis by allowing GGp to arise from belowand the radial fibers to arise from
above. In the model, the tendon is not represented and the origins of GGp, GGm and GGa are
all on the mandibular symphysis. This results in a somewhat too large region of insertion on the
mandible. Only a refined mesh structure would allow a better muscle definition in this area.
It is generally accepted that a muscle can possibly be divided in a number of functionally in-
dependent parts. For tongue muscles this possibility exists, but little work has been done in the
past concerning this issue. Some proposals were the resultsof ad hocchoices made in order to
explain measured 2D or 3D tongue shapes (e.g. the most recentproposal for the styloglossus in
Fanget al., 2008). Some more physiologically based studies used EMG signals, generally assum-
ing that these signals reflect the underlying motor control.Among these studies, the one carried
out by Miyawaki et al. (1975) showed evidence for different activities in different parts of the
6

FIG. 1. (color online) Mesh representation (gray elements)of lingual and mouth floor muscles
as subsets of tongue elements (global mesh) (anterior oblique view). (a-c) anterior, medium and
posterior part of the genioglossus, (d) styloglossus, (e) hyoglossus, (f) verticalis, (g) transversalis,
(h) inferior longitudinalis, (i) superior longitudinalis, (j) geniohyoid, (k) mylohyoid. The muscle
fibers are represented in red. The yellow squares and the bluedots represent the muscle insertions
on the mandible and the hyoid bone, respectively.
genioglossus. However, EMG activity is the result of a combination of efferent and afferent influ-
ences and it cannot be seen as a direct image of the underlyingcontrol. In addition, as emphasized
by Miyawaki et al. (1975), if subdivisions exist in a muscle, we do not know in what manner they
are voluntarily controlled (p. 101). We believe that the only reliable way to address this issue
would be to look at the motor unit distribution within tonguemuscles. To our knowledge, we
lack information on the localization of motor unit territories in human tongue muscles. One way
to know more about it could be to study the architecture of themuscles, with the underlying hy-
pothesis that structurally separated muscle parts could beinnervated by independent motor units.
Slaughteret al. (2005) have carried out such a study for the human SL, and they foundthat this
muscle consists of a number of in-series muscle bundles thatare distributed along the front-back
direction. However, they could not provide clear evidence for the fact that these muscle bundles
are innervated by independent motor units. In the absence ofconvincing physiological evidence,
7

and in order to limit the complexity of the model, only the genioglossus, for which a consensus
seems to exist, was subdivided: three independent parts called the GGa (anterior genioglossus),
the GGm (medium genioglossus), and the GGp (posterior genioglossus) were thus defined.
To mesh the hard and soft structures forming the oral cavity,data of different kinds such as
computed tomography (CT) scans, magnetic resonance imaging(MRI) data and X-ray data, all
collected for PB, were exploited. In addition to the tongue and mouth floor meshes, the model
(Fig. 2) includes a surface representation of the mandible, the soft palate, the hard palate and the
pharyngeal and laryngeal walls as well as a volumetric mesh (tetrahedral elements) of the hyoid
bone. A set of 6 pairs of springs (right and left sides), emerging from the hyoid bone, are used
to represent the elastic links between this mobile bone and fixed bony structures associated with
the anterior and posterior belly of the digastric, infrahyoid muscles (sternohyoid, omohyoid and
thyrohyoid muscles) as well as the hyo-epiglottic ligaments.
FIG. 2. (color online) Oblique anterior view of the 3D tonguemesh in the whole oral cavity
for a rest position (tongue mesh in magenta, mandible in cyan, hyoid bone in yellow, translucent
soft palate, pharyngeal and laryngeal walls in gray, infra-and supra-hyoid muscles represented as
magenta lines).
The relative positions of the different articulators were carefully adjusted so as to represent
well PB’s morphology in a seated position and at rest, just as they are described by lateral X-ray
views of PB’s oral cavity. The final tongue shape in the midsagittal plane at rest was also adapted
so as to match the corresponding X-ray view. This induced some geometrical changes to the
original shape proposed inGerardet al. (2006), because the MRI data used for the original design
8

of that model corresponded to the subject in the supine position; gravity was then shown in that
case to influence tongue shape.
B. Mechanical properties
The lingual tissues were modeled with a non-linear hyper-elastic constitutive law, more pre-
cisely a 2nd order Yeoh constitutive law (Gerardet al., 2005, 2006). Two different constitutive
equations were introduced: one describes the passive behavior of tongue tissues and the other one
models the strain/stress relation for active muscle tissues as an increasing function of muscle acti-
vation. For a particular mesh element, the passive or the active constitutive law is used according
to whether this element belongs to a passive or to an active region (i.e a region made of activated
muscle(s)). The passive constitutive law was directly derived from the non-linear law proposed by
Gerardet al. (2005), which was derived from measurements on a fresh cadaver. However, since
the stiffness of tissues measured shortly after death is known to be lower than that measured inin
vivo tissues, the constitutive law originally proposed byGerardet al. (2005) was modified.
To our knowledge, one of the most relevantin vivomeasurements of human muscle stiffness is
the one carried out byDuck (1990), who proposed a value of 6.2 kPa for the Young modulus for a
human muscle at rest, and a maximum value of 110 kPa for the same muscle once contracted. The
Young modulus measured byGerardet al. (2005) on a cadaver tongue at low strain is 1.15 kPa,
which is significantly smaller thanDuck’s in vivomeasures. This difference is not surprising, since
in living subjects a basic muscle tonus exists, even at rest.Hence, it was decided to multiply both
2nd order Yeoh law coefficients originally proposed byGerardet al. (2005) by a factor of 5.4, in
order to account properly for the Young modulus at rest measured byDuck (1990). Multiplying
both coefficients by the same factor allows preserving the overall non-linear shape of the Yeoh
constitutive law (Fig.3). This new law specifies the properties of passive tongue tissues. In order
to account for the stiffening associated with muscle activation as measured byDuck (1990), it
was decided for the elements belonging to an activated muscle to multiply the coefficients of the
Yeoh constitutive law for passive tissues by a factor that isa function of muscle activation. Thus,
9

an activation-related constitutive law was defined for the active muscles. The multiplying factors
were chosen by taking into account the fact that the contributions of the different muscles to the
Young modulus of an element combine in an additive manner. The basic idea is that an activation
of a muscle leads to an increase in its Young modulus. Givenc10,r andc20,r the Yeoh parameters
for tongue tissues at rest, the parametersci0(e, t) (i ∈ {1,2}) at timet for an elemente belonging
to the tongue or mouth floor, are given by:
ci0(e, t) = ci0,r
(1+ ∑
muscles m
p1(m)
[
∑fibersf∈m
A( f , t)× p2( f ,e)
])(1)
with p1 a positive muscle-dependant factor,A( f , t) the activation level for the macrofiberf at time
t (see the Eq.2 below) andp2( f ,e) a factor equal to 1 ife belongs tom and if the fiberf runs
along the edges ofe, 0 otherwise.
The multiplying factorp1 were chosen in order to maintain the stiffness value below 110 kPa,
when maximal muscle activation is reached.
−0.5 −0.3 −0.1 0.1 0.3 0.5
−150
−120
−90
−60
−30
0
30
Engineering strain
Eng
inee
ring
stre
ss (
kPa)
FIG. 3. (color online) Stress/strain hyperelastic constitutive law (Yeoh 2nd order material) for
lingual tissues. The dotted curve represents the original law obtained from fresh cadaver tissues
(c10 = 192 Pa andc20 = 90 Pa), the dashed curve the law used in the current model for passive
tissues (c10= 1037 Pa andc20= 486 Pa) and the solid line the law used for the maximal activation
(c10 = 10.37 kPa andc20 = 4.86 kPa).
Since tongue tissues are considered to be quasi-incompressible, a Poisson coefficient equal
to 0.499 was used. Furthermore, tongue tissues density was set to 1040 kg.m−3, close to water
density.
10

Currently, only the tongue and the hyoid bone (with the springs connecting it to fixed bony
structure) are modeled as movable structures and need to be mechanically characterized. The
hyoid bone was considered as a rigid body and its density (2000 kg.m−3) was estimated based on
values published in the literature (Dang and Honda, 2004). The same stiffness coefficient (220
N.m-1) was chosen for all the springs connecting the hyoid bone to solid structures; this value
enabled us to reproduce displacements of the hyoid bone thatwere consistent with data published
in Boeet al. (2006).
C. Motor control: Implementation of postural control with sh ort latency feedback
The motor control scheme implemented is based on theλ version of the equilibrium point
hypothesis (EPH) (Feldman, 1986). This theory is known to be controversial in the motor control
domain. The main criticisms are about the fact that this theory claims that the time variation of
motor control variables does not result from any inverse kinematics or inverse dynamics processes
(see for exampleGomi and Kawato(1996) or Hinder and Milner(2003)). However, the defenders
of the EPH theory have systematically provided refutationsof these criticisms that support the
value of the model in research (e.g. inGribble and Ostry(1999) or Feldman and Latash(2005)).
Our own work has also shown that speech motor control based onthe equilibrium point hypothesis
gives a good account of complex kinematic patterns with a 2D biomechanical model of the vocal
tract (Payan and Perrier, 1997; Perrieret al., 2003). From our point of view, this motor control
theory seems particularly interesting for speech production because it provides the framework for
a discrete characterization of continuous physical signals at a motor control level thanks to the link
that can be made between successive equilibrium points and targets; it thus allows a connection to
be made between the discrete phonological units and the physical targets that underlie continuous
articulatory and acoustic signals (Perrieret al., 1996). In addition, the equilibrium point hypothesis
integrates short latency feedback to contribute to the accuracy of speech gesture, which is for us
a crucial feature for speech production control (Perrier, 2006). Hence, the approach used in our
previous modeling work with the 2D biomechanical model of the vocal tract was extended to the
11

3D model.
1. Adjustment of feedback delay
The implementation chosen for the EPH follows the approach proposed byLaboissiereet al.
(1996) and further developed byPayan and Perrier(1997). In the model, bundles of fibers are
represented by way ofmacrofibers(specified as ordered lists of mesh nodes along the edges of
elements) that represent the main directions of muscle fibers in the different parts of the tongue.
In the current version of the model, a unique activation threshold was defined for each muscle
(three for the genioglossus, which was divided into three parts that are assumed to be separately
controlled: the anterior, posterior and medium parts). Every muscle was assumed to be controlled
independently. Obviously, synergies and antagonisms exist in tongue muscles. However, there is
no evidence in the literature supporting the hypothesis that these muscle coordinations are imple-
mented in humans from birth. It is much more likely that coordinated muscle activations are the
result of learning and that they could be task specific. Our modeling approach is in line with this
statement. The design of our biomechanical model gives the largest possible number of degrees of
freedom to the system to be controlled, and does not impose a priori hypotheses that could bias our
study. It allows future work on the emergence of muscle coordinations through task specific learn-
ing. For each muscle, the motor commandλmusclewas determined for the longest macrofiberslmax;
the λ value for each macrofiber of the same muscle was then determined by simply multiplying
theλmusclevalue by the ratio of the macrofiber length at rest overlmax.
For a given macrofiber, the muscle activationA takes into account the difference between the
macrofiber length and the motor commandλ , as well as the lengthening/shortening rate.
A stretch reflex delayd, which corresponds to the propagation delay for the electrical signals
to travel along the reflex arc plus the synaptic time and the integration time of these signals at the
interneurons, is taken into account for fiber length and velocity intervening in the computation of
A. In their model of the mandible,Laboissiereet al.(1996) proposed a delay of 10 ms, and in their
tongue/jaw modelSanguinetiet al. (1998) suggested a delay of 15 ms. In the present model,d
12

was set to 17 ms, based on the data ofIto et al. (2004). Simulations conducted ford ranging from
5 ms to 20 ms showed that this value had a limited impact on tongue motion; the trajectory, peak
velocity, acceleration or force levels were altered, but ina limited range so that the choice of this
value did not seem to be critical within this range of variation. The sensitivity of the activation to
the lengthening/shortening ratel is modulated by a damping coefficientµ, considered for the sake
of simplicity as constant and identical for all the muscles.µ was chosen to be equal to 0.01 s to
ensure the stability of the system, following numerous simulations.
A(t) =[l (t −d)−λ (t)+µ l (t −d)
]+(2)
Muscle activation is associated with the firing of the motoneurons (henceforth MNs). HenceA is
either positive or zero (ifA is mathematically negative, it is set to zero). A zero value corresponds
to the MNs fire threshold; beyond this threshold, the MN depolarization becomes possible: the
higher the activationA, the higher the firing frequency of MNs. As long as the activation A is zero,
no force is generated. Force varies as an exponential function of the activation (see below).
2. Feedback gain: A key value for postural control stability
Active muscle forceM is given as a function of the activationA(t) by the following equation:
M (t) = max[ρ(
expcA(t)−1),ρ]
(3)
with ρ a factor related to the muscle capacity of force generation and c a form parameter symbol-
izing the MN firing gradient.
The determination of the parameterρ, which modulates the force generation capacity, is based
on the assumption that, for a fusiform muscle,ρ is linked in a first approximation to the cross-
sectional area of the muscle. The values are based on the workof Payan and Perrier(1997) for
the tongue muscles, except for the transversalis, which wasnon-existent in a 2D tongue model,
and with some adaptations for the verticalis, the implementation of which was slightly different.
For the mouth floor musclesρ values were estimated from the data fromvan Eijdenet al. (1997),
13

and were measured on the model for the transversalis. This muscle force capacity (TableI) was
distributed among the different macrofibers proportionally to the volume of the surrounding el-
ements. Given a fiberf belonging to a musclem, its capacity of force generationρfib is such
that:
ρfib ( f ) = ρ(m)∑eV (e)× p(e, f )
S(4)
with e an element belonging tom, V (e) the volume ofe, p(e, f ) a parameter equal to 1 iff is
located inside the muscle, 0.5 on a muscle face (exterior surface of a muscle excluding muscle
corners) and 0.25 on a muscle edge (exterior surface of a mesh, corners only).S is a normalization
term, such that theρfib values for the different fibers ofmsum up toρ (m).
Parameterc is an important factor for stability issues since it determines how feedback infor-
mation included in the activation influences the level of force. Original values forc found in the
literature (c= 112 m−1, Laboissiereet al., 1996) brought about dramatic changes in the muscular
activation level for a small variation in the muscle length.This generated mechanical instabilities.
Therefore, parameterc was decreased. After several trials,c was fixed to 40 m−1. This value is
not the only one that ensured a stable mechanical behavior ofthe model. A large range of values
was possible. The value 40 m−1 was chosen because it provides a fair compromise between the
level of reflex activation and stability (Buchaillardet al., 2006).
The influence of muscle lengthening/shortening velocity onthe force developed is also in-
cluded. The model accounts for the sliding filaments theory (Huxley, 1957) by calculating the
total muscle forceF with the following equation (Laboissiereet al., 1996):
F (t) = M (t)
(f1+ f2arctan
(f3+ f4
l (t)r
)+ f5
l (t)r
)(5)
wherel is the lengthening/shortening velocity andr the muscle length at rest. The parameters used
are based on the work ofPayan and Perrier(1997) for rapid muscles, but are slightly different:
f1 = 0.7109, f2 = 0.712, f3 = 0.43, f4 = 0.4444 s,f5 = 0.0329 s.
14

D. Lagrangian equation of motion and boundary conditions
The Lagrangian equation of motion that governs the dynamic response of the finite element
system is given by:
M−→q +C
−→q +K−→q =
−→F (6)
with −→q the nodal displacements vector,−→q and
−→q its first and second derivatives,M the mass
matrix, C the damping matrix,K the stiffness matrix and−→F the load vector (the reader can refer
to Bathe(1995) for a detailed description of the Finite Element Method).
A Rayleigh damping model was chosen for the definition of the damping matrix :C = αM +
βK . α andβ were set to 40 s−1 and 0.03s, respectively, in order to have a damping close to the
critical one in the range of modal frequency from 3 to 10 Hz (Fig. 4).
0 5 10 15 201
1.261.5
2
2.5
3
3.5
Frequency (Hz)
Crit
ical
dam
ping
rat
io
FIG. 4. Ratio damping over critical damping vs. frequency forα = 40 s−1 and β = 0.03 s
(Rayleigh damping model). For a modal frequency from 3 to 10 Hz, the damping ratio is below
1.26, i.e. close to the critical damping (ratio equal to 1).
The load vector F includes the muscle forces computed for every macrofiber (Eq.5), the
gravity and contact forces between tongue and vocal tract walls.
Two kinds of boundary conditions were introduced through the definition of no-displacement
constraints to model muscular insertions and the management of contacts. Muscle insertions on
the bony structures (inner anterior and lateral surface of the mandible and hyoid bone) were imple-
mented and they match as well as possible the information about PB’s anatomy that was extracted
from X-ray scans. During speech production, the tongue comes into contact with the hard and soft
15

tissues that compose the vocal tract walls. Consequently, the contacts were modeled between the
tongue and the set hard palate/upper dental arch, the soft palate and the set inner surface of the
mandible/lower dental arch. The modeling of contacts is non-linear. A face-to-face detection was
used to avoid the interpenetration of the surfaces in contact, which are potentially in contact with
the tongue. A relatively low Coulomb friction was used, sincefriction is assumed to be limited
due to the saliva. The contacts are managed through an augmented Lagrangian method, which
corresponds to an iterative series of penalty methods.
The partial differential equation (6) was solved by the AnsysTM finite element software pack-
age, based on a combination of Newton-Raphson and Newmark methods.
E. Acoustic modeling
A model of sound synthesis, including the determination of the 3D area function of the vocal
tract, was coupled with the mechanical model.
The computation of the area function from the mesh node coordinates was achieved by using
the MatlabR⃝ software. Before computing the area function, the surface ofthe tongue was interpo-
lated using 35 periodic cubic splines in order to get a more accurate detection of the constriction
locations in the vocal tract. This processing and its use forthe computation of the area function
make the implicit assumption that the spatial sampling of the tongue surface provided by the finite
element mesh is sufficient to allow a correct interpolation of the tongue surface from the positions
of the nodes. A set of planes, which will be referred to as cutting planes below, was computed for
the vocal tract in its rest position. These cutting planes, orthogonal to the sagittal plane, are ap-
proximately perpendicular to the vocal tract midline at rest. For a given vocal tract configuration,
the intersections between the cutting planes and the surface of the tongue (approximated by a set of
periodic cubic splines), of the mandible, of the hyoid bone,of the hard and soft palates, and of the
pharyngeal and laryngeal walls were computed. On every cutting plane, a closed contour based on
these intersections and representing the shape of the vocaltract was computed and approximated
by periodic cubic splines. The inner surface of each of the thus determined closed contours was
16

calculated. The lips, which are not part of the biomechanical model, were represented by a sin-
gle cylinder, whose length and section represented lip protrusion and aperture, respectively. To
determine the distance between two consecutive cutting planes, and thus to compute the length of
the path from the glottis to the lips, it was decided to compute the distance between the centers of
gravity of two successive surfaces. This distance approximates the average distance traveled by
the acoustic wave between two consecutive cutting planes. An acoustic model (analog harmonic of
the vocal tract) was used to generate the spectrum of the signal produced from the area function1.
III. MUSCLE ACTIVATIONS DURING FRENCH ORAL VOWEL PRODUCTION
A. Muscle activations
To study the postural control of speech sounds, the best approach would consist in roaming
the motor command space of the biomechanical model in a systematic and comprehensive way,
using for example a Monte Carlo method, in order to characterize the links between motor com-
mands, tongue shapes and acoustics, following the approachof Perrieret al. (2005) for their 2D
model. However, such an approach is currently impossible with this 3D model, because of the
running time (around 40 minutes for a 100 ms simulation, withAnsysTM11.0 and Windows XP
SP2 running on a Pentium IV CPU at 3 GHz and 1 Go of RAM). Consequently, it was necessary
to work with a more limited number of simulations to study muscle activations in vowel produc-
tion and the sensitivity of the vowel configurations to changes in motor commands. The results
presented in this section were obtained on the basis of 300 simulations, all carried out with a fixed
mandible. These simulations resulted from a specific choiceof motor commands guided primarily
by studies with our model of the individual impact of each muscle on tongue shape (see below).
Our objectives were to generate a very good match of the tongue shapes classically observed in
the midsagittal plane for French oral vowels by means of cineradiographic data (Bothorelet al.,
1986). EMG studies byMiyawaki et al.(1975) andBaeret al.(1988) were also used as sources of
complementary information on the main tongue and mouth floormuscles activated during vowel
production. Acoustic signals were synthesized from the final vocal tract shape, and the formants
17

were calculated.
The selection of the optimal vowels has involved a mostly qualitative evaluation of the sim-
ilarity between the computed tongue shapes and the 3D tongueshapes measured for the speaker
PB (CT data). A quantitative comparison of the simulated tongue shapes with the measured 3D
shapes was not possible and would not have been very informative, mainly for two reasons:
1. In our vocal tract model the jaw is fixed. It is known that a variety of jaw positions are possi-
ble for the same sound without endangering the quality of itsperception, and, in particular,
producing speech with a fixed jaw does not prevent the speakers from producing satisfactory
vowels with fair formants, as shown by bite block experiments (Mooshammeret al., 2001);
however this articulatory perturbation has an impact on thetongue shape considered in its
entirety.
2. The model is a symmetrical one while human subjects are never symmetrical. Hence a
detailed comparison of the constriction shape was not possible. This is why our simulations
were essentially assessed in terms of global tongue elevation, proximity to the palate, and
front/back position of the constriction in the vocal tract.However, a quantitative evaluation
of the simulated and measured formant patterns was carried out.
Only the simulations obtained for the extreme vowels /i, a, u/ will be presented in this paper.
The results correspond to the shape and position of the tongue at the end of the simulated move-
ment. For single muscle activations, movement lasted 400 mswhile it lasted only 200 ms for the
vowels (for the three vowels, steady state equilibrium positions were reached). In all cases, the
movement started from rest position.
1. Impact of individual muscles on tongue shape
Figs.5 and6 show the individual impact of the tongue and mouth floor muscles on the tongue
shape in the midsagittal plane and in the 3D space from a frontview perspective. Target motor
commands were defined such that a single muscle was activatedduring each simulation. For the
18

only activated muscle, the command (i.e., the threshold muscle length above which active mus-
cle force is generated) was set either to 75% or 85% of the muscle length at rest (the smaller the
percentage, the larger the activation; hence, a larger percentage was chosen for larger muscles to
avoid too strong deformations). For the other muscles, the motor commands were set to a large
enough value so as to prevent these muscles from generating forces; for example, a command
twice as large as the muscle length at rest ensures that this muscle will remain inactive throughout
a simulation. These simulations show that the role of the individual muscles in our model matches
well with classic knowledge inferred from experimental data and clarify their impact on the tongue
shape. The anterior genioglossus moves the tongue downwardin its front part, essentially in the re-
gion close to the midsagittal plane (tongue grooving in the palatal region≈ 6 mm). This downward
movement is associated with a slight backward movement in the pharyngeal region (Fig.5(a), ≈
1.6 mm). Note that the backward movement is much smaller thanthe one predicted by 2D (Payan
and Perrier, 1997) or 2.5D (Dang and Honda, 2004) models. This can be explained by the fact that
in these models the volume conservation is in fact implemented as a surface conservation property
in the midsagittal plane. In our model, volume conservationcauses the changes that are generated
in one part of the tongue to be compensated not only in the other parts of the midsagittal plane,
but also in the whole tongue volume. Indeed, a slight enlargement of the tongue is observed in
the transverse direction (up to 2.2 mm). It can also be noticed that the limited backward motion
is consistent with data showing that a larger expansion may occur in the transverse plane, local
to the compression, while a small expansion occur in the sameplane (Stoneet al., 2004). The
medium part of the genioglossus lowers the tongue in its dorsal region (≈ 5 mm) and moves the
apical part forward (≈3 mm) and upward, while an enlargement of the tongue is observed in the
transverse direction (up to 1.4 mm). The posterior genioglossus (GGp) enables the tongue to be
pushed forward (≈ 5.3 mm); this forward movement is associated with an elevation of the tongue
(≈ 2.4 mm) due to the apex sliding on the anterior part of the mandible (Fig.5(c)). However, the
elevation of the tongue is less strong than what was predicted by the 2D and the 2.5D models.
As for the GGa, it leads to the enlargement of the tongue in thetransverse direction (≈ 1.3 mm
in the apical area and 1.6 mm in the pharyngeal area, Fig.6(c)). The styloglossus (Sty) causes
19

a downward (≈ 9.6 mm) and backward (≈ 7 mm) displacement of the tongue tip, producing an
elevation of the dorsal part of the tongue and a lowering of the apical region (Figs.5(d)and6(d)).
No change is observed in the transverse direction. Changes inthe midsagittal plane are similar
to the predictions of 2D or 2.5D models. The hyoglossus generates a backward movement in the
pharyngeal part (≈ 5 mm), an apex elevation (upward displacement of≈ 4.7 mm) and a lowering
of the tongue in its dorsal part (Fig.5(e)). An enlargement is observed in the transverse direction
in the pharyngeal part (Fig.6(e), ≈ 5 mm). The verticalis provokes only a very small lowering
in the palatal region (below≈ 0.5 mm) associated with a very slight backward movement in the
pharyngeal part (below≈ 0.5 mm) (Fig.5(f)). Its contraction also widens the tongue (≈ 1.4 mm in
the apical area). Its impact will then be essentially indirect: by stiffening its elements in the palatal
part of the tongue, it will modify the action of other muscles. The transverse muscle induces es-
sentially a reduction in the tongue width in the transverse direction (up to 2.1 mm in the superior
part of the tongue, Fig.6(g)). Due to the volume conservation property this change spreads over
the whole tongue in the midsagittal plane, generating at thesame time a small forward movement
of the apex and a small backward movement in the pharyngeal part. The inferior longitudinalis
lowers the tongue tip (≈ 5 mm) and moves it backwards (≈ 6 mm). A small backward movement
of the tongue is also observed in the pharyngeal region (≈ 1.3 mm) (Fig.5(h)). In the transverse
direction, a slight enlargement is observed in the dorsal region (≈ 1 mm). The activation of the
superior longitudinalis mainly induces an elevation (≈ 12 mm) and a backward movement (≈
11 mm) of the tongue tip with a slight backward movement in thepharyngeal part (≈ 1.7 mm)
(Fig. 5(i)). The geniohyoid essentially moves the hyoid bone forward and downward, which in-
duces a slight lowering in the dorsal region (≈ 0.7 mm) (Fig.5(j)). Finally, the mylohyoid elevates
the mouth floor in its midsagittal part (up to 4 mm) and moves the dorsal part of the tongue slightly
upward (Fig.5(k)). The analysis of the influences of individual tongue muscles revealed possible
synergies and antagonisms between muscles: GGp, Sty and GH can act in synergy to produce an
elevation of the tongue in the palatal region; in this part ofthe tongue they act antagonistically with
the GGa and the GGm. The Sty and GGm are antagonists for the control of the vertical position
of the dorsal part of the tongue. The GGp, SL and GGm contribute to the tongue tip elevation and
20
their action can be counteracted by that of the IL, the Sty andthe GGa. As for the control of the
width of the tongue in the transverse direction, Trans tendsto reduce it in the whole tongue body;
GGa and GGm are the main muscles enlarging it in the palatal part, while HG contributes to its
enlargement in the pharyngeal part.
2. Simulations of French vowels
In order to generate the 300 simulations used to determine the muscle activation patterns for
the French vowels, the timing of the motor commands was as follows: at timet = 0, the central
commands were equal to the muscle length at rest; then they varied linearly for a transition time
of 30 ms up to the target values. Coarse sets of motor commands were first determined for each
vowel, guided by prior knowledge of the tongue shapes and by literature data. The values of the
commands for the main muscles involved in the production of the vowels were then made to vary
within a more or less wide range around their primary value. The range was determined according
to the tongue shape sensitivity to their modification.
Within the set of 300 simulations, the best motor commands for French extreme vowels (Ta-
ble III ) were selected on the basis of the obtained tongue shapes andthe formant patterns. Optimal
vowels were chosen in order to get the best match between the tongue shape in the midsagittal
plane with PB’s MRI data, and between the formants computed with the formants measured from
PB’s acoustic data. The tongue shapes and the formant patterns obtained for the 300 simulations
were compared to the MRI data and the formant patterns collected from subject PB. For each
French extreme vowel, the motor commands providing the bestmatch of the tongue shape ex-
perimentally measured on PB in the midsagittal plane and of the corresponding formant patterns
have been selected as reference motor commands (TableIV). The corresponding tongue shapes
are represented in Fig.7 (oblique anterior and posterior views) and the formants aregiven in Ta-
ble IV (the lip aperture and protrusion are also indicated in this table). TableII summarizes the
force levels computed at the end of the selected simulationsfor every tongue and mouth floor mus-
cle. The values indicated correspond to the algebraic sum ofthe force levels computed for each
21

6 8 10 12 14
4
6
8
10
12
antero−posterior axis (cm)
long
itudi
nal a
xis
(cm
)
(a) GGa
6 8 10 12 14
4
6
8
10
12
antero−posterior axis (cm)
long
itudi
nal a
xis
(cm
)
(b) GGm
6 8 10 12 14
4
6
8
10
12
antero−posterior axis (cm)
long
itudi
nal a
xis
(cm
)
(c) GGp
6 8 10 12 14
4
6
8
10
12
antero−posterior axis (cm)
long
itudi
nal a
xis
(cm
)
(d) Sty
6 8 10 12 14
4
6
8
10
12
antero−posterior axis (cm)
long
itudi
nal a
xis
(cm
)
(e) HG
6 8 10 12 14
4
6
8
10
12
antero−posterior axis (cm)
long
itudi
nal a
xis
(cm
)
(f) Vert
6 8 10 12 14
4
6
8
10
12
antero−posterior axis (cm)lo
ngitu
dina
l axi
s (c
m)
(g) Trans
6 8 10 12 14
4
6
8
10
12
antero−posterior axis (cm)
long
itudi
nal a
xis
(cm
)
(h) IL
6 8 10 12 14
4
6
8
10
12
antero−posterior axis (cm)
long
itudi
nal a
xis
(cm
)
(i) SL
6 8 10 12 14
4
6
8
10
12
antero−posterior axis (cm)
long
itudi
nal a
xis
(cm
)
(j) GH
6 8 10 12 14
4
6
8
10
12
antero−posterior axis (cm)
long
itudi
nal a
xis
(cm
)
(k) MH
FIG. 5. (color online) Impact of the activation of individual lingual and mouth floor muscles on
tongue shape (400 ms command duration, sufficient to reach mechanical equilibrium). The con-
tours of the articulators (tongue and hyoid bone in red, mandible, hard and soft palate, pharyngeal
and laryngeal walls in black) are given in the midsagittal plane (tongue tip on the left). For ev-
ery simulation, the target motor command of the only activated muscle equals 75% of the muscle
length at rest, except for the activation of the long musclesSty, IL and SL (85% of the muscle
length at rest). The dotted contours correspond to the tongue shape in its rest position.
macrofiber. It is not a true value of the force exerted on the tongue, but it provides a fair idea of its
22

−3−2−10123
6
7
8
9
10
11
transverse axis (cm)
long
itudi
nal a
xis
(cm
)
(a) GGa
−3−2−10123
6
7
8
9
10
11
transverse axis (cm)
long
itudi
nal a
xis
(cm
)
(b) GGm
−3−2−10123
6
7
8
9
10
11
transverse axis (cm)
long
itudi
nal a
xis
(cm
)
(c) GGp
−3−2−10123
6
7
8
9
10
11
transverse axis (cm)
long
itudi
nal a
xis
(cm
)
(d) Sty
−3−2−10123
6
7
8
9
10
11
transverse axis (cm)
long
itudi
nal a
xis
(cm
)
(e) HG
−3−2−10123
6
7
8
9
10
11
transverse axis (cm)
long
itudi
nal a
xis
(cm
)
(f) Vert
−3−2−10123
6
7
8
9
10
11
transverse axis (cm)
long
itudi
nal a
xis
(cm
)
(g) Trans
−3−2−10123
6
7
8
9
10
11
transverse axis (cm)
long
itudi
nal a
xis
(cm
)
(h) IL
−3−2−10123
6
7
8
9
10
11
transverse axis (cm)
long
itudi
nal a
xis
(cm
)
(i) SL
−3−2−10123
6
7
8
9
10
11
transverse axis (cm)
long
itudi
nal a
xis
(cm
)
(j) GH
−3−2−10123
6
7
8
9
10
11
transverse axis (cm)
long
itudi
nal a
xis
(cm
)
(k) MH
−3−2−10123
6
7
8
9
10
11
transverse axis (cm)
long
itudi
nal a
xis
(cm
)
(l) Rest position
FIG. 6. (color online) Impact of the activation of individual lingual and mouth floor muscles
on tongue shape (400 ms command duration, sufficient to reachmechanical equilibrium) [frontal
view]. For every simulation, the target motor command of theonly activated muscle equals 75%
of the muscle length at rest, except for the activation of thelong muscles Sty, IL and SL (85% of
the muscle length at rest). The shape of the tongue at rest is given for indication on the bottom
right.
order of magnitude. Fig.7 reflects the traditional relationships between the French extreme vowels
(anterior vs. posterior, low vs. high) while the formants are consistent with the classic published
values and with acoustic data obtained for the speaker PB (Table V). We can note a good corre-
23

spondence between the formants of the acoustic data measured for PB and those obtained with the
simulations. The average difference between the formants that were measured and those that were
simulated is below 3.3% for the first four formants. The difference does not exceed 4.3% for the
first formant (vowel /u/) and 10.2% for the second formant (vowel /i/).
Due to the redundancy of the system (some pairs of muscles interact as agonist-antagonists),
the commands were also chosen such that the amount of force generated by the different muscles
remains reasonable. Only the extreme cardinal vowels will be presented in detail.
68
1012
−20
2
6
8
10
12
antero−posterior axis (cm)tranverse axis (cm)
vert
ical
axi
s (c
m)
(a) vowel /i/
68
1012
−20
2
6
8
10
12
antero−posterior axis (cm)
transverse axis (cm)
vert
ical
axi
s (c
m)
(b) vowel /u/
68
1012
−20
2
6
8
10
12
antero−posterior axis (cm)transverse axis (cm)
vert
ical
axi
s (c
m)
(c) vowel /a/
68
1012
−2
0
26
8
10
12
vert
ical
axi
s (c
m)
antero−posterior axis (cm)
transverse axis (cm)
(d) vowel /i/
68
1012
−2
0
26
8
10
12
vert
ical
axi
s (c
m)
antero−posterior axis (cm)
transverse axis (cm)
(e) vowel /u/
68
1012
−2
0
26
8
10
12
vert
ical
axi
s (c
m)
antero−posterior axis (cm)
transverse axis (cm)
(f) vowel /a/
FIG. 7. (color online) Final tongue shape for the simulationof the French cardinal vowels (first
row: anterior oblique view, second row: posterior oblique view).
a. Muscle activation pattern in vowel /i/Fig. 8 shows the tongue shapes obtained by simulation
and those obtained experimentally for the speaker PB (CT data). Some discrepancies can be
24

seen in the tongue posterior part, but the delimitation of the tongue contours in this area is less
precise (the delimitation of the tongue body on CT images is a tedious and less obvious task in
this part of the body, due to the presence of the hyoid bone, epiglottis and other soft tissues)
and acoustically less relevant than in the anterior part. This figure shows a good correspondence
between the experimental results and the computed data, in particular in the anterior part of the
tongue, which plays an important role in the production of vowel /i/. As expected from Fig.5,
FIG. 8. Superimposition of the shape of the tongue for the speaker PB (CT data) (dense mesh) and
the shape of the tongue obtained by simulation (coarse mesh)for vowel /i/.
since vowel /i/ is an anterior and high vowel (Fig.7(a)), the model predicted the GGp, GH and
MH muscles to play a fundamental role in its production. In addition to their slight impact on
the tongue geometry (see SectionIII.A.1), the GH and MH muscles can help stiffen the mouth
floor, thanks to a significant propagation of the stress into the lingual tissues. Activated alone,
the styloglossus pulls the tongue backwards (Fig.5(d)); this movement is here counterbalanced
by the strong GGp activation, while both muscles elevate thetongue in the palatal region. For
the transversalis and the anterior genioglossus, the motorcommands (λ commands of the EPH)
are larger than the muscle lengths at rest (TableIII ). From a motor control perspective, these two
muscles can consequently be seen as being in their rest state, and their activation is the result of
reflex loops (TableII ). The transversalis reflex activation avoids an overwidening of the tongue that
would otherwise result from the combination of the GGp activation (see SectionIII.A.1), while
ensuring a contact between the palatal arch and the lateral borders of the tongue in the alveolar
25

region. The GGa reflex activation limits tongue elevation inthe median alveolar region, thus
creating the slight groove characteristic of an /i/. The voluntary activations are consistent with the
EMG data ofBaeret al. (1988), except for the styloglossus, for which no activity was measured
by these authors for vowel /i/. With the model, the combined activation of the GGp and Sty is
essential to precisely control the location of the constriction for high vowels. This co-activation is
consistent with our previous findings with a 2D tongue model (Payan and Perrier, 1997).
Qualitatively the tongue shape proposed for /i/ is in good agreement with different kinds of
data published in the literature. This is true for the 2D shape in the midsagittal plane, which is
consistent withBothorelet al. (1986) data for French speech sounds. It is also true for the 3D
distribution of the contacts between the hard palate and theupper dental arch on the one side and
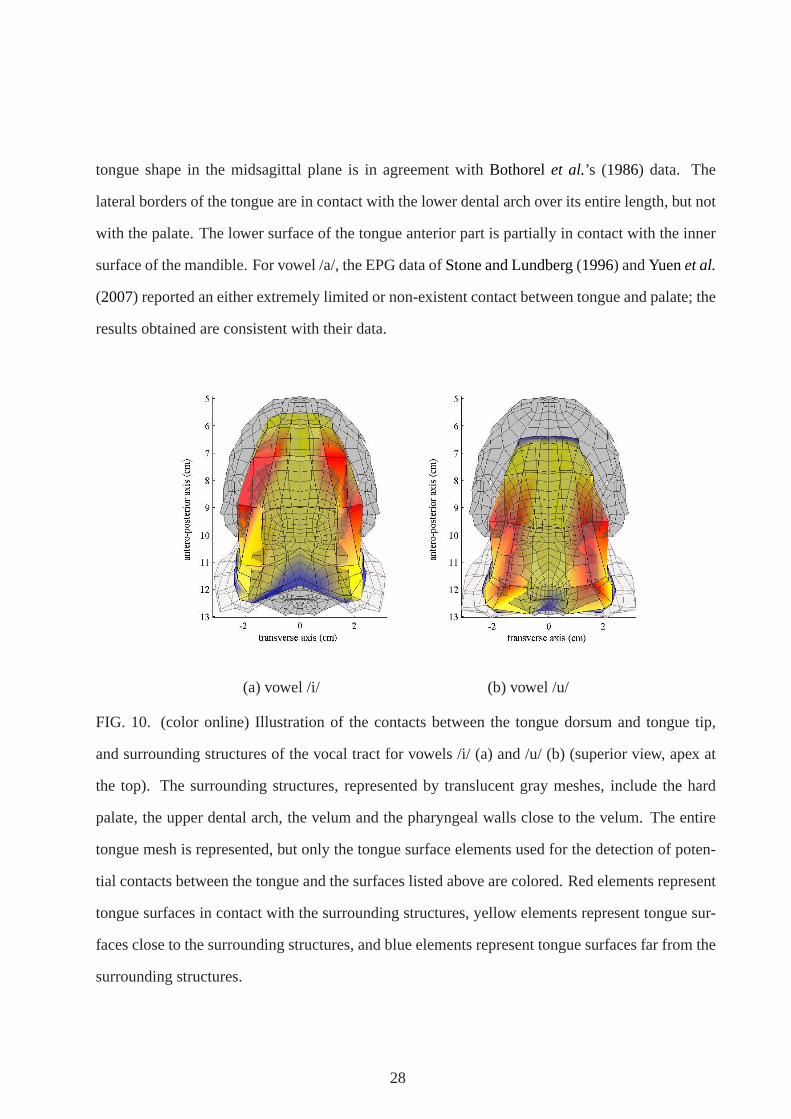
the tongue lateral borders on the other side. These contactsare represented in Fig.10(a). The
surface of contact stretches over the whole hard palate and is also extended to the inner aspects of
the molars. In addition, we can note the presence of contactsbetween the apex and the mandible
inner surface, behind the lower incisors (not shown). Theseobservations are consistent with the
electropalatographic data (EPG) ofStone and Lundberg(1996) (Fig. 9) andYuenet al. (2007) for
English vowels.
FIG. 9. EPG data for American English vowels /i/ and /u/. Reprinted from Stone, M. and Lund-
berg, A., J. Acoust. Soc. Am., “Three-dimensional tongue surface shapes of English consonants
and vowels”, 99(6), 3728-3737, 1996. Copyright 1996, Acoustical Society of America.
b. Muscle activation pattern in vowel /u/The model produces vowel /u/, a posterior and high
vowel (Fig. 7(b)), essentially with the activation of the styloglossus, themylohyoid and the
transversalis (TableIII ). As with vowel /i/, the model requires the activation of theMH to stiffen
26

the mouth floor and thus contribute to the tongue elevation, due to the complementary action of
other muscles. The styloglossus allows the tongue to be pulled both backwards and upwards. The
GGp is also active. It increases the size of the vocal tract back cavity by propelling the tongue
forward and contributes to the upward movement of the tongue. The transversalis contributes to
the limitation of the tongue widening, but this is not its only role. Indeed, for this vowel the model
uses an active recruitment of the transversalis in order to facilitate the tongue elevation, due to the
incompressibility of the lingual tissues (note, however, that the amount of force generated by the
transversalis is close to that used in the production of /i/). The motor commands proposed in our
model are consistent with the EMG data ofBaeret al. (1988). Here again, the 2D tongue shape
in the midsagittal plane is in good agreement withBothorelet al. (1986) data. In our simulation,
the tongue tip is located in the mid height of the tongue. Figure 10(b) shows the distribution of
the contacts of the tongue dorsum and the tongue tip with the surrounding structure, namely the
hard and soft palate, the superior dental arch and a part of the pharyngeal walls. The figure shows
that the tongue post-dorsal surface is laterally in contactwith the inner surface of the molars and,
further back, with the lateral sides of the pharyngeal walls. The contacts between the tongue and
hard palate observed in the simulations are consistent withthe EPG data ofStone and Lundberg
(1996) (Fig. 9) andYuenet al.(2007). However, EPG data do not provide information on possible
contacts between the tongue and velum.
c. Muscle activation pattern in vowel /a/Vowel /a/, a posterior and low vowel, was essentially
produced in the model with the activations of the HG and GGa muscles (Fig.7(c) and TableIII ).
The HG pulls the tongue backward and downward but also rotates the tongue tip toward the palate
(Fig. 5(e)). The GGa limits the apex rotation by flattening the tongue tip and maintaining it in
contact with the inner surface of the mandible, thus preventing the creation of a sub-lingual cavity,
and increasing the size of the anterior cavity. The GGp activation is a reflex activation, since from
the motor command point of view it is in its rest state (see Table III ); the GGp limits the backward
movement of the tongue and thus avoids the occlusion of the vocal tract in the laryngopharyngeal
region. The motor commands are in agreement with the EMG dataof Baeret al. (1988). The
27
tongue shape in the midsagittal plane is in agreement withBothorel et al.’s (1986) data. The
lateral borders of the tongue are in contact with the lower dental arch over its entire length, but not
with the palate. The lower surface of the tongue anterior part is partially in contact with the inner
surface of the mandible. For vowel /a/, the EPG data ofStone and Lundberg(1996) andYuenet al.
(2007) reported an either extremely limited or non-existent contact between tongue and palate; the
results obtained are consistent with their data.
(a) vowel /i/ (b) vowel /u/
FIG. 10. (color online) Illustration of the contacts between the tongue dorsum and tongue tip,
and surrounding structures of the vocal tract for vowels /i/(a) and /u/ (b) (superior view, apex at
the top). The surrounding structures, represented by translucent gray meshes, include the hard
palate, the upper dental arch, the velum and the pharyngeal walls close to the velum. The entire
tongue mesh is represented, but only the tongue surface elements used for the detection of poten-
tial contacts between the tongue and the surfaces listed above are colored. Red elements represent
tongue surfaces in contact with the surrounding structures, yellow elements represent tongue sur-
faces close to the surrounding structures, and blue elements represent tongue surfaces far from the
surrounding structures.
28

B. Highlighting the role of the transverse muscle in midsagittal tongue shaping
A 3D biomechanical tongue model allows the study of the transverse muscle action during
speech production. Since speech has experimentally mainlybeen studied in the sagittal domain,
the potential role of this muscle has essentially been ignored. However, it could be of great impor-
tance in speech production, since it is the only muscle able to directly act on tongue deformations
in the transverse dimension orthogonal to the sagittal plane.
The role of the transverse muscle in the midsagittal deformation of the tongue was recently
observed byGilbert et al. (2007) for swallowing through the analysis of diffusion-weighted MRI
measurements. They found in particular that the recruitment of the transversalis is used to gener-
ate depressions in the tongue to facilitate the movement of the food toward the pharynx. Unfortu-
nately, similar experimental observations do not yet existfor speech, and it is a strength of our 3D
model that it offers the possibility to quantitatively assess the role of the transversalis in speech
production. As a matter of fact, the simulations of vowel production reported in the preceding
sections highlighted the fundamental role of this muscle inthe maintenance of the tongue dimen-
sion along the transverse direction and its influence on midsagittal shaping. These results have
been obtained in the context of our motor control model, based on the EPH theory, which gives an
account of the postural control in a particularly effectiveway, thanks to the integration of reflex
activation in the muscle force generation mechanisms. Indeed, the model predicts that for vowel
/i/ (and also for the high anterior vowels /y/ and /e/ not presented here), the transverse muscle is
active, despite the fact that the motor commands for this muscle were those of the rest position
or higher (see Eq.2). This is the result of a reflex activation (or limited activecontraction) due
to the lengthening of the transverse fibers induced by the centrally activated muscles that mainly
act on the tongue shape in the sagittal plane. This reflex activation limits the amplitude of the
deformations in the transverse dimension and, in turn, due to the incompressibility of tongue tis-
sues, it increases the deformations in the sagittal plane. According to the simulations, a voluntary
activation of the transversalis would lead to a decrease in the tongue width that does not seem com-
patible with the production of high anterior vowels, unlessthis decrease can be compensated by
29

the action of other muscles. Hence, the combination of a voluntary co-activation of the transver-
salis and of other tongue muscles could also be considered asan alternative to the proposed reflex
activation of the transversalis. Such a strategy is realistic, but it would imply the activation of a
larger number of muscles acting antagonistically; inducing an increase the amount of force neces-
sary to produce high anterior vowels. Our simulations do notrule out the possibility of a voluntary
activation of the transversalis. However, such a strategy does not sound like an economical way
to control tongue shapes for high vowels. As already mentioned above, 2D or 2.5D models, such
as those ofPayan and Perrier(1997) or Dang and Honda(2004), could only account for tongue
incompressibility in the sagittal plane due to a simplifying assumption assimilating volume con-
servation and area preservation in this very plane. In a way,this simplifying approach implicitly
included the role of the transverse muscle, without formalizing it in explicit terms. We have seen
in SectionIII.A.1 that this hypothesis led to partially inaccurate conclusions concerning the role
of muscles taken individually. Our 3D modeling approach allows these former conclusions to be
corrected and emphasizes the indirect role of the transverse muscle in the shaping of the tongue
midsagittally (Fig.7(a)).
Based on simulations made with their 2D model,Perrieret al. (2000) concluded that the
main directions of deformation for the tongue during speechproduction as observed for different
languages (namely the factors front and back raising of the PARAFAC analysis ofHarshman
et al.(1977), seeJackson(1988); Maeda(1990); Nix et al.(1996); Hoole(1998), or more recently
Mokhtariet al.(2007)) did not result from a specific speech control, but emerged naturally from the
actions of the major tongue muscles (GGp, GGa, HG and Sty). Similar conclusions could be drawn
from Honda’s (1996) EMG data. The results concerning the role of individual muscles in our
3D model can be used to reformulate these conclusions more accurately. The main directions of
deformation could indeed emerge naturally, provided that the tongue widening along the transverse
direction is strictly controlled by the reflex transversalis activation. This reflex activation, based
on the use of the motor commands at rest, is not likely to be speech-specific, since it allows the
tongue to remain within the space determined by the dental arches, possibly in order to avoid
biting problems (several observations indeed show a widening of the tongue for edentulous people
30

(Kapur and Soman, 1964)). Taking into account this reflex limitation of tongue width seems to be
essential to understanding the precise control process of the place of articulation in the vocal tract.
IV. VARIABILITY OF MOTOR COMMANDS AND TONGUE POSITIONING
ACCURACY FOR VOWEL /i/
A. Methodology
The accuracy of speech motor control is an important and still unsolved issue. Indeed, speech
movements can be as short as a few tens of milliseconds, so that it is traditionally suggested
that cortical feedback, involving long latency loops, can only be used to monitor speech after its
production and not during on-going production (see for example Perkellet al. (2000) for details).
Tongue positioning has to be very accurate though for the production of some sounds, such as
fricatives and high vowels. This apparent contradiction (the absence of cortical feedback versus
the accuracy requirement) suggests that speech motor control has developed into a very efficient
process to ensure, in a simple way, accuracy and stability oftongue positioning. This efficient
treatment and accuracy can be seen as the result of the high amount of training and experience in
speaking that speakers have.
For the high vowel /i/ more specifically, it has been argued that control accuracy would come
from a combination of biomechanical effects, namely the co-contraction of the GGp and the GGa
associated with tongue/palate contacts (Fujimura and Kakita, 1979). This effect is called the “sat-
uration effect”. Using a rudimentary 3D tongue model,Fujimura and Kakita(1979) showed that
the tongue was stabilized during the production of /i/ when laterally pressed against the palate, due
to the combined action of the GGa and GGp, which stiffened thetongue. Our 3D model, which
integrates numerous improvements as compared toFujimura and Kakita’ (1979) original model
(smaller mesh elements, non-linear tissue elasticity, gravity, stiffening due to activation, accurate
model of contacts), offers a powerful context to revisit this hypothesis and to better understand
how the different biomechanical factors interact. With thecurrent model, a number of simulations
were realized around the reference tongue shape for /i/ to evaluate the articulatory and acoustic
31

sensitivity of the vowel to changes provided to the motor commands. The tongue shape varia-
tions as well as the formant variations resulting from smallchanges in the central commands were
studied for this vowel, so as to better understand the patterns of variability observed during its
production. The motor commands defined previously (cf. Section III and TableIII ) formed the
basis of this study. The motor commands of the main tongue muscles (i.e. the anterior, medial
and posterior genioglossus, the styloglossus, the hyoglossus, the transversalis, the lingual inferior
and superior muscles and the mylohyoid) were independentlymodified. For the GGa, GGp, Sty,
MH and Trans, the motor commands were modified by±2%,±5%,±8% and±10% around their
values at target. For the GGm, HG, IL and SL, which were not active during the production of
vowel /i/ in our modeling, the motor commands were only modified by -2%, -5%, -8% and -10%,
since an increase in their values would let them inactive. The same lip protrusion and aperture
parameters as previously applied were used to generate the acoustic signals and to determine the
formants associated with the different area functions. Table VI indicates the first three formants
for each of the 56 simulations.
B. Results
Fig. 11 shows the scatter plots in the midsagittal plane for 6 nodes on the tongue surface
obtained from the simulations. Results are presented in the upper left panel for the variations of
all muscle commands together, and in the other panels, more specifically, for the variations of the
commands to three muscles that play a major role in the production of vowel /i/: the styloglossus
and the anterior and posterior genioglossus. For the globalresults (upper left panel), 3σ ellipses
characterizing the node position dispersion with a Gaussian statistical model are superimposed on
the data. Considering first the influence of all muscles taken together, the following observations
can be made. In the pharyngeal and velopharyngeal regions (three most posterior nodes), the
major axes of the dispersion ellipses essentially correspond to a displacement along the front-to-
back direction (from the pharyngeal to the velopharyngeal position, length of the major axes 3.0,
3.9 and 4.4 mm, respectively, length of the small axes 1.5, 1.4, 0.8 mm, angles of the major axes
32

with the antero-posterior axis 133, 147, 173 degrees). In the palatal and alveopalatal parts of the
tongue (second and third nodes from the front), the ellipseshave no clear direction and they tend
to be more circular. In addition, the maximal variability issmaller than in the back part of the
tongue (length of the major axes 2.9 and 3.5 mm, respectively, length of the small axes 2.4 and
2.1 mm). Finally, in the apical part (most anterior node) a very strong correlation is observed
between elevation and forward movement. This leads to a global ellipsis orientation similar to
the one observed in the tongue blade region, but much stronger and clearer and with much more
variation along the principal axis (length of the major axis8.3 mm, length of the small axis 3.4 mm,
angle of the major axis 147 degrees).
These observations are in quite good agreement with experimental data published in the lit-
erature about vowel variability. See, in particular,Perkell and Nelson(1985), Beckmanet al.
(1995), or Mooshammeret al. (2004): the front-back orientation of the variability in the velar
region and the reduced variability in the palatal and alveopalatal regions (the region of constric-
tion for /i/) were already observed by these authors. In addition, the absence of clear orientation
of the ellipses in the region of constriction was also observed in 2 of the 3 subjects studied by
Mooshammeret al. while Perkell and NelsonandBeckmanet al. rather observed ellipses paral-
lel to the palatal contour in this region. The large variability in the apical part was observed by
Mooshammeret al., but not byPerkell and NelsonandBeckmanet al.. Note, however, that this
specific aspect of the displacement of the apex relative to that of the tongue body has already been
observed many times by different authors, in particularPerkell(1969).
Our model allows one to look more specifically at the biomechanical factors influencing these
articulatory patterns. Looking at the variability associated with the variation in the GGa, GGp,
and Sty activations separately, it can be observed that the angle of the main ellipses in the three
posterior nodes is similar to the orientation of the scatterplots generated by the Sty and GGa.
However, for the GGp, the largest variability is also observed in the front-back direction. The
reduction in the variability in the region of constriction is observed both for the Sty and the GGp,
while the GGa, in contrast, shows the largest variability inthis region. This can be interpreted in
the light of the palatal contacts for vowel /i/ (see Fig.10). The GGp and Sty act on the position
33

of the whole tongue body, whose variability in the constriction region is limited by the palatal
contacts. The GGa influences only the center of the front partof the tongue, which is not in
contact with the palate. It can be noted that in our simulations the styloglossus generates the largest
variability, as compared to the other muscles, except as explained above in the constriction region.
This phenomenon is intrinsically linked to the approach that was used in our simulations. In the
context of theλ -model, since the styloglossus macrofibers are longer than in the other muscles, a
given percentage of variation generated a larger change in the commands for the styloglossus, and
then, in turn, larger changes in force level. This approach could have influenced the global amount
of variability depicted in the upper left panel of Fig.11, but not its relation with the node position
on the tongue, neither in terms of orientation nor of amplitude, except for the tongue tip variation,
which is largely dependent on the styloglossus.
As concerns the other muscles (not depicted in Fig.11), their impacts are smaller, but some
interesting observations can be mentioned. The transversalis shows a notable contribution in the
variability in the velopharyngeal region (third node from the back), where an increase in its acti-
vation induces backward displacements of the tongue dorsum. The mylohyoid participates in the
up-down displacements, with an amplitude of approximately1.5 mm in the pharyngeal region.
C. The saturation effect for vowel /i/ revisited
From the simulations of the consequences of motor command variability for tongue shape for
vowel /i/, interesting conclusions can be drawn for this vowel concerning the influence of the GGa
and of its variability on the vocal tract shape and formants.Contrary to what could be inferred
from the statistical processing of articulatory speech data (see for exampleBadinet al., 2002), the
central tongue groove observed for vowel /i/ in many languages does not seem to be a consequence
of the combined activations of the GGp and Sty muscles. It is in fact obtained in our model very
specifically by activating the GGa. As mentioned above, thisstatement is consistent withFujimura
and Kakita(1979)’s hypothesis of a co-activation of the GGp and GGa in the production of /i/.
However, the variability patterns generated with our model, together with their interpretation
34

6 8 10 12
9
10
11
12
antero−posterior axis (cm)
long
itudi
nal a
xis
(cm
)
(a) Global results
6 8 10 12
9
10
11
12
antero−posterior axis (cm)
long
itudi
nal a
xis
(cm
)
(b) Results for GGp
6 8 10 12
9
10
11
12
antero−posterior axis (cm)
long
itudi
nal a
xis
(cm
)
(c) Results for GGa
6 8 10 12
9
10
11
12
antero−posterior axis (cm)
long
itudi
nal a
xis
(cm
)
(d) Results for Sty
FIG. 11. (color online) Displacement scatter plots (black circles) for vowel /i/ in the midsagittal
plane. Only the surface of the tongue is represented. Panel (a) summarizes the results obtained for
the 9 muscles whose motor commands were modified. The 3σ ellipses of dispersion (red) are also
represented, and their major axes are drawn in blue. Panels (b-d) represent the dispersion obtained
when modifying the motor commands of the posterior genioglossus (b), the anterior genioglossus
(c) and the styloglossus (d) only.
in terms of the respective influence of each muscle, stronglysuggest that there is no saturation
effect, which would facilitate the accurate control of the constriction area for /i/. This observation
questionsFujimura and Kakita’s original hypothesis as well as the numerous follow-up contribu-
tions that have used this hypothesis to explain the control of high front vowels, in particular those
of Perkellet al. (2000) andBadinet al. (1990).
In agreement with the work of the previous authors, our modeltends to confirm that the tongue
is indeed stabilized in its entirety by these palatal contacts, and that this should contribute to
simplifying its motor control. However, in contrast toFujimura and Kakita’s tongue model, which
was quite rudimentary because of the computational limitations existing at that time, our model
35

shows that the variability of the GGa activation leads to a variation in the alveolar groove with
noticeable consequences for its formant pattern (see below). This variation is highly localized
in the globally well-stabilized tongue, but it is fundamental to acoustics, because it plays on the
constriction size.
The amplitudes of variation for the first three formants wereas follows:∆F1≈ 103 Hz,∆F2
≈ 250 Hz,∆F3≈ 283 Hz2 (TableVI). An important part of the variability is due to the styloglossus
(impact on F1, F2 and F3, but see our remark above about the force level variation for this muscle),
but other muscles also have a noticeable influence, either onthe first, second or third formant. The
F1 variability is due in great part to the modifications in thelevel of activation of the GGa and Sty,
and secondarily of the GGp and SL. According to the model, thevariability of F2 results mainly
from the modification of the Sty and GGm motor commands, whilethat of F3 is due to the Sty
and Trans.
The variability of F1 for /i/ has important consequences; indeed the perception of vowel /i/ is
sensitive to F1 variations in French (one can easily move from /i/ to /e/). Likewise for F3, too low
an F3 value moves the perception from /i/ to /y/ (Schwartz and Escudier, 1987). It can therefore be
concluded that the articulatory variability generated in the simulations is too important to ensure
proper perception of vowel /i/. It is necessary to reduce it.This need for an active reduction of
the articulatory variability is consistent with the observations made byMooshammeret al. (2004)
with German speakers: they concluded from their study that the potential saturation effect related
to the interaction between tongue and palate did not seem to be sufficient for their speakers to meet
the perceptive requirements of the German vowel system, andthat a specific control adapted to the
individual palate shape of each speaker was necessary to limit the articulatory variability and its
consequences for perception.
This is then quite an important result as it throws back into question a widely made assumption
to explain the precise control of the vowel /i/, namely the saturation effect.
36

V. IMPACT OF GRAVITY ON LINGUAL MOVEMENTS
With the increasing use of MRI systems, numerous speech data are acquired while the subject
is lying on his or her back. Due to the change in the orientation of gravitational forces in relation
to the head, this position is likely to alter the vocal tract shape and its control. This is why many
studies have tried to compare the production of speech sounds and speech articulations (either
vowels or consonants) for subjects when they are sitting, standing or lying (Weir et al., 1993;
Tiedeet al., 2000; Shilleret al., 2001; Stoneet al., 2007). Our model allows the impact of gravity
to be tested and quantitatively assessed. With this aim in view, the pattern of activation needed to
keep the tongue in its neutral position was first studied in the presence of a gravitational field in
an upright and in a supine position. Then, the influence of gravity on the tongue shape during the
production of vowels was evaluated together with its impacton the acoustic signal.
A. Impact of gravity in the absence of active and reflex muscleactivation
First, the impact of gravity alone on the tongue shape and position was studied: the force
generator was deactivated (no internal force could be generated, whether active or reflex forces).
The final tongue shape is given in Fig.12 for an upright and supine position starting from the rest
position and after a 1 s movement. For a standing subject, there is a clear lowering of the tongue
body, which is particularly marked in the posterior radicalpart of the tongue, but is also visible in
its apical region (approximately 1.5 mm). For a lying subject, the gravity alone produces a strong
backward displacement of the tongue body, with a displacement of the tongue tip equal to 9 mm.
These results show that tongue muscle activations are required to maintain the tongue in its rest
position, whether the subject is lying on his back or standing.
Reflex activation obtained with motor commands equal to muscle lengths at rest is not suf-
ficient to maintain the tongue in the rest position, as shown by Fig. 13 for a 1 s simulation. A
small backward displacement of the apex (≈ 1 mm) and of the rear part of the tongue is visible in
the upright position, as well as a more limited rotation of the apex in the supine position than in
the absence of muscle activations (displacement of the tongue tip≈ 3 mm). A limited voluntary
37

6 8 10 12
4
6
8
10
12
antero−posterior axis (cm)
long
itudi
nal a
xis
(cm
)
FIG. 12. (color online) Final tongue position in the midsagittal plane for 1 s simulation under the
influence of gravity alone. The neutral position of the tongue and the hyoid bone (rest position for
a subject in upright position) is represented by a black dotted line, the final shape for the tongue
and hyoid bone for a subject in upright position by a red dashed line, and for a subject in supine
position by a blue solid line. The black solid lines correspond to the contours of the mandible,
hard and soft palate, and pharyngeal and laryngeal walls.
activation of the GGp and GGa combined with a stronger activation of the MH associated with
the reflex activation of the other tongue and mouth floor muscles can compensate for the gravity
effect (commands indicated in TableIII for vowel /@/). Based on the model, the MH activation
strengthens the mouth floor and limits the lowering of the tongue inferior region (Fig.5(k)). The
GGp action prevents the backward displacement of the tongue(Fig. 5(c)) and the GGa counteracts
the GGp action in the apical and dorsal areas, limiting the tongue elevation (Fig.5(a)). A good
equilibrium between the activation of these three muscles,based on numerous simulations, leads
to the stabilization of the tongue in a “neutral” upright position. Corresponding force levels com-
puted at the end of the simulation for every tongue and mouth floor muscle are given in TableII
(vowel /@/).
38

6 8 10 12
4
6
8
10
12
antero−posterior axis (cm)
long
itudi
nal a
xis
(cm
)
FIG. 13. (color online) Final tongue position in the midsagittal plane for 1 s simulation under the
influence of the reflex activation alone. The neutral position of the tongue and the hyoid bone (rest
position for a subject in upright position) is represented by a black dotted line, the final shape for
the tongue and hyoid bone for a subject in upright position bya red dashed line, and for a subject
in supine position by a blue solid line. The black solid linescorrespond to the contours of the
mandible, hard and soft palate, and pharyngeal and laryngeal walls.
B. Impact of gravity on French oral vowels
The impact of the subject position (upright or supine) on vowel production was studied by
modifying the orientation of the gravitational field. Simulations were realized for the supine posi-
tion for the 10 French oral vowels with the same commands and the same timing as in the upright
position. The tongue shapes and positions for the supine andupright positions were compared, as
well as the force levels for tongue and mouth floor muscles.
The differences in tongue shape and formant values between upright and supine positions
were negligible for all vowels. However, differences were noticed in the level of forces developed
by the GGp, with an increase in supine position that is variable across vowels: the peak and the
final forces increased on the order of 8% for /a/, 7% for /u/ and1% for /i/. On the whole, this
modification in the force level affects in percentage more posterior than anterior vowels. This
is consistent with the fact that the production of front vowels necessitates a strong force from the
39

GGp anyway, in comparison to which the gravitational force becomes quasi negligible. Our results
are also in agreement with experimental observations, in which an increase in the GGp activity in
supine position is commonly observed (see for example the EMG data ofNiimi et al. (1994) and
Otsukaet al. (2000)).
In the model, the tongue weight, which is on the order of one Newton, is small as compared to
the muscular forces. Hence, feedback activation efficiently counteracts the effects of gravity ori-
entation changes, and limits tongue shape variation. This small shape variation is in contradiction
to experimental values typically found in the literature. For instance,Badinet al. (2002) reported
a more important backward displacement of the tongue for both vowels and consonants in supine
position (MR images) compared to upright position (cineradiofilm images), which they attributed
to the tongue weight.Shiller et al. (1999) found differences in the formant values between the
upright and supine position for vowels /a/ and /E/. They found that, when the head was in the
supine orientation, the jaw was rotated away from occlusion, which led them to conclude that the
nervous system did not completely compensate for changes inhead orientation relative to gravity.
In the current model, the fact that the model has a fixed jaw position (the same for the supine and
upright orientation) could in part explain the absence of notable differences. However, it should
be mentioned that recent experimental findings provide goodsupport for our simulation results.
Indeed,Stoneet al.(2007) showed that the impact of gravity was low (or even negligible) for some
speakers when vowels were pronounced in context and not in anisolated manner as has thus far
been the case.
VI. CONCLUSION
A 3D finite element model of the tongue has been presented which was used to study biome-
chanical aspects and tongue control during vowel production. The model provides a high level
of realism both in terms of compliance with anatomical and morphological characteristics of
the tongue and in terms of soft tissue modeling hypotheses (geometrical and mechanical non-
linearity). The tongue and mouth floor muscles were controlled using a force generator based on
40

the EPH theory. Simulations with the model coupled with an acoustic analog of the vocal tract
allowed muscle activation patterns to be proposed for the French oral vowels which were consis-
tent with the EMG data published in the literature and which generated realistic tongue shapes,
tongue/palate contact patterns and formant values. The simultaneous analysis of these activation
patterns and of the actual muscle forces generated for each vowel revealed, among other things,
a systematic feedback activation of the transversalis. This suggests that this muscle is used to
maintain the dimension of the tongue quasi-constant along the transverse direction orthogonal to
the sagittal plane. This role is very important for the control of tongue shape in the midsagittal
plane, since, due to tongue tissue incompressibility, it allows more deformation in this plane. This
is consistent with the recent experimental observations made byGilbertet al. (2007) for swallow-
ing. The results obtained from the simulations have led us toconclude that the main directions
of tongue deformation in the midsagittal plane (as described by the classic front and back raising
factors ofHarshmanet al. (1977)) could naturally emerge from the combined action of the major
tongue muscles and of the transversalis playing the role of a“size maintainer” in the transverse
direction. This conclusion is in line withPerrieret al. (2000), who suggested that these main
directions of deformation are not speech specific, but are intrinsically linked to tongue muscle
arrangements.
The muscle activation patterns proposed for each French vowel served as a basis for further
studies. The patterns of articulatory variability, and their associated acoustic variability, were
analyzed for local changes in the central commands for vowel/i/. These results cast doubt over the
idea, generally accepted since the work ofFujimura and Kakita(1979), that a muscular saturation
due to a simultaneous co-activation of the GGa and GGp muscles would facilitate the accurate
control of /i/. Indeed, the tongue grooving in the constriction region was shown to be sensitive
to change in the GGa activation with a significant impact on the F1 formant value. The impact
of gravity was also considered. Simulations showed the importance of low-level feedback in the
postural control for the rest position, as well as the impactof the head orientation on the tongue
shape and position. These results are at odds with data published in the literature for isolated
sound production, but they find support in the recent work ofStoneet al.(2007) on the production
41

of vowels in context.
Further work will be required to significantly reduce the computation time, and thus increase
the number of simulations and refine the results. Studies have also been undertaken to assess the
contribution of this model to medical applications, in particular the surgical planning of tongue
exeresis, with lingual tissue resection and reconstruction processes. First results have proved to be
promissing and show the potential of such a model (Buchaillardet al., 2007). The results obtained
for the planning of tongue surgeries and the comparison withpatients’ data should also provide
particularly interesting information about the compensation processes and the motor control mech-
anisms.
Acknowledgments
The authors wish to thank Ian Stavness for helpful comments and suggestions. This project
was supported in part by the EMERGENCE Program of the Region Rhone-Alpes and by the P2R
Program funded by the CNRS and the French Foreign Office (POPAART Project).
Endnotes
1. Program written by Pierre Badin (ICP/GIPSA-lab)
2. It should be noted that these values were obtained with tongue motions starting from a
resting state. Modifying this starting state would have an impact on the formant values, but
due to the simulation durations, sufficient to reach an equilibrium position, and to the model
of motor control, the variations of the formant values should remain limited.
References
Abry, C., Boe, L.-J., Corsi, P., Descout, R., Gentil, M., and Graillot, P. (1980), Labialite et
phonetique : donnees fondamentales etetudes experimentales sur la geometrie et la motricite
42

labiales (Labiality and phonetics: fundamental data and experimental studies on lip geometry
and mobility)(Publications de l’Universite des langues et lettres de Grenoble).
Badin, P., Bailly, G., Reveret, L., Baciu, M., Segebarth, C., and Savariaux, C. (2002), “Three-
dimensional linear articulatory modeling of tongue, lips and face, based on MRI and video im-
ages,” J. Phonetics30(3), 533–553.
Badin, P., Perrier, P., Boe, L.-J., and Abry, C. (1990), “Vocalic nomograms: Acoustic and articu-
latory considerations upon formant convergence,” J. Acoust. Soc. Am.87(3), 1290–1300.
Baer, T., Alfonso, P. J., and Honda, K. (1988), “Electromyography of the tongue
muscles during vowels in /@pVp/ environment,” Ann. Bull. RILP 22, 7–19, URL
http://www.umin.ac.jp/memorial/rilp-tokyo/.
Bathe, K.-J. (1995), Finite Element Procedures(Prentice Hall, Englewood Cliffs, New Jersey),
second ed.
Beckman, M. E., Jung, T.-P., Lee, S.-L., de Jong, K., Krishnamurthy, A. K., Ahalt, S. C., Cohen,
K. B., and Collins, M. J. (1995), “Variability in the production of quantal vowels revisited,” J.
Acoust. Soc. Am.97(1), 471–490.
Boe, L.-J., Granat, J., Autesserre, D., Perrier, P., and Peyre, E. (2006), “Variation et prediction
de la position de l’os hyoıde de l’Homme moderne (Variation and prediction of the hyoid bone
position for modern man),” Biom. Hum. Anthropol.24(3–4), 257–272.
Bothorel, A., Simon, P., Wioland, F., and Zerling, J.-P. (1986), Cineradiographie des voyelles
et des consonnes du francais (Cineradiography of vowels and consonants in French)(Institut de
Phonetique, Universite Marc Bloch, Strasbourg, France).
Buchaillard, S., Brix, M., Perrier, P., and Payan, Y. (2007), “Simulations of the consequences
of tongue surgery on tongue mobility: Implications for speech production in post-surgery condi-
tions,” Int. J. Med. Robot. Comp.3(3), 252–261.
Buchaillard, S., Perrier, P., and Payan, Y. (2006), “A 3D biomechanical vocal tract model to study
speech production control: How to take into account the gravity?” in Proceedings of the 7th
International Seminar on Speech Production(Ubatuba, Brazil), pp. 403–410.
Dang, J. and Honda, K. (2004), “Construction and control of a physiological articulatory model,”
43

J. Acoust. Soc. Am.115(2), 853–870.
Duck, F. A. (1990), Physical Properties of Tissues: A Comprehensive Reference Book (Academic
Press, London, UK).
Fang, Q., Fujita, S., Lu, X., and Dang, J. (2008), “A model based investigation of activation pat-
terns of the tongue muscles for vowel production,” inProceedings of InterSpeech 2008(Brisbane,
Australia), pp. 2298–2301.
Feldman, A. G. (1986), “Once more on the equilibrium-point hypothesis (λ model) for motor
control,” J. Mot. Behav.18(1), 17–54.
Feldman, A. G. and Latash, M. L. (2005), “Testing hypotheses and the advancement of science:
recent attempts to falsify the equilibrium point hypothesis.” Exp. Brain. Res.161(1), 91–103.
Fujimura, O. and Kakita, Y. (1979), “Remarks on quantitative description of lingual articulation,”
in Frontiers of Speech Communication Research, edited by B. Lindblom and S.Ohman (Academic
Press, San Diego), pp. 17–24.
Gerard, J.-M., Ohayon, J., Luboz, V., Perrier, P., and Payan,Y. (2005), “Non-linear elastic proper-
ties of the lingual and facial tissues assessed by indentation technique. Application to the biome-
chanics of speech production,” Med. Eng. Phys.27(10), 884–892.
Gerard, J.-M., Perrier, P., and Payan, Y. (2006), “3D biomechanical tongue modelling to study
speech production,” inSpeech Production: Models, Phonetic Processes, and Techniques, edited
by J. Harrington and M. Tabain (Psychology Press, New-York,USA), pp. 85–102.
Gerard, J.-M., Wilhelms-Tricarico, R., Perrier, P., and Payan, Y. (2003), “A 3D dynamical biome-
chanical tongue model to study speech motor control,” RecentRes. Dev. Biomech.1, 49–64.
Gilbert, R. J., Napadow, V. J., Gaige, T. A., and Wedeen, V. J. (2007), “Anatomical basis of lingual
hydrostatic deformation,” J. Exp. Biol.210, 4069–4082.
Gomi, H. and Kawato, M. (1996), “Equilibrium-point control hypothesis examined by measured
arm-stiffness during multi-joint movement,” Science272(5258), 117–120.
Gribble, P. L. and Ostry, D. J. (1999), “Compensation for interaction torques during single- and
multijoint limb movement,” J. Neurophysiol.82, 2310–2326.
Harshman, R., Ladefoged, P., and Goldstein, L. (1977), “Factor analysis of tongue shapes,” J.
44

Acoust. Soc. Am.62(3), 693–713.
Hashimoto, K. and Suga, S. (1986), “Estimation of the muscular tensions of the human tongue by
using a three-dimensional model of the tongue,” J. AcousticSoc. Japan7(1), 39–46.
Hinder, M. R. and Milner, T. E. (2003), “The case for an internal dynamics model versus equilib-
rium point control in human movement,” J. Physiol.549, 953–963.
Honda, K. (1996), “The organization of tongue articulation for vowels,” J.Phonetics24(1), 39–52.
Hoole, P. (1998), “Modelling tongue configuration in German vowel production,” in Proceed-
ings of the 5th International Conference on Spoken Language and Processing(Sidney, Australia),
vol. 5, pp. 1867–1870.
Huxley, A. F. (1957), “Muscle structure and theories of contraction,” Prog. Biophys. Chem.7,
255–318.
Ito, T., Murano, E. Z., and Gomi, H. (2004), “Fast force-generation dynamics of human articula-
tory muscles,” J. Appl. Physiol.96(6), 2318–2324.
Jackson, M. T. (1988), “Analysis of tongue positions: language-specific and cross-linguistic mod-
els,” J. Acoust. Soc. Am.84(1), 124–143.
Kakita, Y., Fujimura, O., and Honda, K. (1985), “Computation of mapping from muscular contrac-
tion patterns to formant patterns in vowel space,” inPhonetic Linguistics, edited by V. A. Fromkin
(Academic, Orlando, FL), pp. 133–144.
Kapur, K. K. and Soman, S. D. (1964), “Masticatory performance and efficiency in denture wear-
ers,” J. Prosthet. Dent.14(4), 687–694.
Laboissiere, R., Ostry, D. J., and Feldman, A. G. (1996), “The Control of Multi-Muscle Systems:
Human Jaw and Hyoid Movements,” Biol. Cybern.74, 373–384.
Maeda, S. (1990), “Compensatory articulation during speech: evidence fromthe analysis and
synthesis of vocal-tract shapes using an articulatory model,” in Speech Production and Speech
Modeling, edited by W. J. Hardcastle and A. Marchal (Kluwer Academic Publishers), pp. 131–
149.
Miyawaki, K., Hirose, H., Ushijima, T., and Sawashima, M. (1975), “A Preliminary Report on the
Electromyographic Study of the Activity of Lingual Muscles,” Ann. Bull. RILP 9, 91–106, URL
45

http://www.umin.ac.jp/memorial/rilp-tokyo/.
Mokhtari, P., Kitamura, T., Takemoto, H., and Honda, K. (2007), “Principal components of vocal-
tract area functions and inversion of vowels by linear regression of cepstrum coefficients,” J. Pho-
netics35(1), 20–39.
Mooshammer, C., Perrier, P., Fuchs, S., Geng, C., and Pape, D. (2004), “An EMMA and EPG
study on token-to-token variability,” AIPUK36, 47–63.
Mooshammer, C., Perrier, P., Fuchs, S., Geng, C., and Payan, Y.(2001), “The Control of Token-to-
Token Variability: an Experimental and Modeling Study,” inProceedings of the 4th International
Speech Motor Conference(Nijmegen, Netherlands).
Niimi, S., Kumada, M., and Niitsu, M. (1994), “Functions of Tongue-Related Mus-
cles during Production of the Five Japanese Vowels,” Ann. Bull. RILP 28, 33–40, URL
http://www.umin.ac.jp/memorial/rilp-tokyo/.
Nix, D. A., Papcun, G., Hogden, J., and Zlokarnik, I. (1996), “Two cross-linguistic factors under-
lying tongue shapes for vowels,” J. Acoust. Soc. Am.99, 3707–3717.
Otsuka, R., Ono, T., Ishiwata, Y., and Kuroda, T. (2000), “Respiratory-Related Genioglossus Elec-
tromyographic Activity in Response to Head Rotation and Changes in Body Position,” Angle Or-
thod.70, 63–69.
Payan, Y. and Perrier, P. (1997), “Synthesis of V-V sequences with a 2D biomechanical tongue
model controlled by the equilibrium point hypothesis,” Speech Commun.22(2–3), 185–205.
Perkell, J. S. (1969), Physiology of speech production: results and implication of a quantitative
cineradiographic study, MIT Press research monograph (Cambridge, Mass. M.I.T. Press).
Perkell, J. S. (1974), “A physiologically oriented model of tongue activity in speech
production,” Ph.D. thesis, Massachusetts Institute of Technology, Boston, USA, URL
http://dspace.mit.edu/handle/1721.1/29190.
Perkell, J. S. (1996), “Properties of the tongue help to define vowel categories:Hypotheses based
on physiologically oriented modeling,” J. Phonetics24(1), 3–22.
Perkell, J. S., Guenther, F. H., Lane, H., Matthies, M. L., Perrier, P., Vick, J., Wilhelms-Tricarico,
R., and Zandipour, M. (2000), “A theory of speech motor control and supporting data fromspeak-
46

ers with normal hearing and with profound hearing loss,” J. Phonetics28, 233–272.
Perkell, J. S. and Nelson, W. L. (1985), “Variability in production of the vowels /i/ and /a/,” J.
Acoust. Soc. Am.77(5), 1889–1895.
Perrier, P. (2006), “About speech motor control complexity,” inSpeech Production: Models, Pho-
netic Processes, and Techniques, edited by J. Harrington and M. Tabain (Psychology Press, New-
York, USA), pp. 13–26.
Perrier, P., Ma, L., and Payan, Y. (2005), “Modeling the production of VCV sequences via the
inversion of a biomechanical model of the tongue,” inProceedings of the 9th European Conference
on Speech Communication and Technology (Interspeech’2005)(Lisbon, Portugal), pp. 1041–1044.
Perrier, P., Ostry, D. J., and Laboissiere, R. (1996), “The Equilibrium Point Hypothesis and Its
Application to Speech Motor Control,” J. Speech Hear. Res.39, 365–378.
Perrier, P., Payan, Y., Zandipour, M., and Perkell, J. S. (2003), “Influence of tongue biomechan-
ics on speech movements during the production of velar stop consonants: A modeling study,” J.
Acoust. Soc. Am.114(3), 1582–1599.
Perrier, P., Perkell, J., Payan, Y., Zandipour, M., Guenther, F., and Khalighi, A. (2000), “Degrees of
freedom of tongue movements in speech may be constrained by biomechanics,” inProceedings of
the 6th International Conference on Spoken Language Processing, ICSLP’2000(Beijing, China).
Sanguineti, V., Laboissiere, R., and Ostry, D. J. (1998), “A dynamic biomechanical model for
neural control of speech production,” J. Acoust. Soc. Am.103(3), 1615–1627.
Schwartz, J. L. and Escudier, P. (1987), The Psychophysics of Speech Perception(Martinus Ni-
jhoff Publishers, Dordrecht), chap. Does the human auditory system include large scale spectral
integration?, Nato Asi, pp. 284–292.
Shiller, D. M., Ostry, D. J., and Gribble, P. L. (1999), “Effects of Gravitational Load on Jaw
Movements in Speech,” J. Neurosci.19(20), 9073–9080.
Shiller, D. M., Ostry, D. J., Gribble, P. L., and Laboissiere, R. (2001), “Compensation for the
effects of head acceleration on jaw movement in speech,” J. Neurosci.21(16), 6447–6456.
Slaughter, K., Li, H., and Sokoloff, A. J. (2005), “Neuromuscular organization of the superior
longitudinalis muscle in the human tongue. 1. Motor endplate morphology and muscle fiber archi-
47

tecture,” Cells Tissues Organs181(1), 51–64.
Stone, M., Epstein, M. A., and Iskarous, K. (2004), “Functional segments in tongue movement,”
Clin. Linguist. Phon.18(6–8), 507–521.
Stone, M. and Lundberg, A. (1996), “Three-dimensional tongue surface shapes of English conso-
nants and vowels,” J. Acoust. Soc. Am.99(6), 3728–3737.
Stone, M., Stock, G., Bunin, K., Kumar, K., Epstein, M., Kambhamettu, C., Li, M., Parthasarathy,
V., and Prince, J. (2007), “Comparison of speech production in upright and supine position,” J.
Acoust. Soc. Am.122(1), 532–541.
Takemoto, H. (2001), “Morphological analysis of the human tongue musculaturefor three-
dimensional modelling,” J. Speech Lang. Hear. Res.44, 95–107.
Tiede, M. K., Masaki, S., and Vatikiotis-Bateson, E. (2000), “Contrasts in speech articulation
observed in sitting and supine conditions,” inProceedings of the 5th International Seminar on
Speech Production, pp. 25–28.
van Eijden, T. M. G. J., Korfage, J. A. M., and Brugman, P. (1997), “Architecture of the human
jaw-closing and jaw-opening muscles,” Anat. Rec.248(3), 464–474.
Weir, A. D., McCutcheon, M. J., and Flege, J. E. (1993), “A comparison of formant frequencies for
vowels pronounced in the supine and upright positions,” inProceedings of the Twelfth Southern
Biomedical Engineering Conference, pp. 188–190.
Wilhelms-Tricarico, R. (1995), “Physiological modeling of speech production: methods for mod-
eling soft-tissue articulators,” J. Acoust. Soc. Am.97(5 Pt 1), 3085–3098.
Wilhelms-Tricarico, R. (2000), “Development of a tongue and mouth floor model for normal-
ization and biomechanical modelling,” inProceedings of the 5th speech production seminar and
CREST Workshop on models of speech production(Kloster Seeon, Bavaria), pp. 141–148.
Yuen, I., Lee, A., and Gibbon, F. (2007), “Lingual contact in selected English vowels and its
acoustic consequence,” inProceedings of the 16th International Congress of Phonetic Sciences
(Saarbrucken, Germany).
48

TABLE I. Cross-sectional areas and corresponding force generation capacities (ρ).
GGa GGm GGp Sty HG Vert Trans IL SL GH MH
Area (mm2) 82 55 168 109 295 91 227 41 86 80 177
ρ (N) 18 12 37 24 65 20 50 9 19 17.5 39
TABLE II. Final force levels (in Newtons) observed for every tongue and mouth floor muscle dur-
ing the production of the French cardinal vowels and /@/. The levels of force indicated correspond
to the algebraic sum of the forces computed for every macrofiber. Gray cells represent voluntarily
activated muscles.
vowel GGa GGm GGp Sty HG Vert Trans IL SL GH MH
/i/ 0.51 0 25.82 6.90 0 0 1.61 0 0 3.37 13.89
/@/ 0.11 0.13 0.95 0.04 0.04 0.00 0.25 0 0.100.10 1.62
/u/ 0 0 6.73 7.42 0 0 1.83 0.47 0 1.02 6.79
/a/ 3.34 0 1.91 0 8.21 2.31 0 0.16 0 0 0.78
TABLE III. Motor commands used for the production of French cardinal vowels and for /@/. These
values are given as a percentage of the muscle length at rest.Values below 1 therefore correspond
to a voluntary activation.
vowel GGa GGm GGp Sty HG Vert Trans IL SL GH MH
/i/ 1.03 1.05 0.60 0.90 1.23 1.13 1.05 1.02 1.09 0.76 0.75
/@/ 0.98 0.98 0.98 1.00 1.00 1.00 1.00 1.00 1.00 0.98 0.94
/u/ 1.20 1.20 0.91 0.84 1.25 1.35 0.95 0.98 1.20 0.95 0.80
/a/ 0.75 1.10 1.00 1.10 0.70 0.85 1.30 1.00 1.20 1.05 1.05
49

TABLE IV. Lip aperture la and protrusion lp chosen for the determination of the vocal tract area
function (based onAbry et al., 1980) and the values of the first four formants for the simulation
of French oral vowels (extreme cardinal vowels and /@/). These values were computed with the
WinSnoori software.
vowel la (cm2) lp (cm) F1 (Hz) F2 (Hz) F3 (Hz) F4 (Hz)
/i/ 3 0.5 321 2095 2988 4028
/@/ 1.5 0.8 502 1235 2407 3612
/u/ 0.3 1.5 298 723 2547 3450
/a/ 4.5 0.8 667 1296 2875 3948
TABLE V. Values of the first four formants based on acoustic data obtained for the speaker PB. The
values were averaged over 10 repetitions of every one of the extreme cardinal vowels in different
contexts.
vowel F1 (Hz) F2 (Hz) F3 (Hz) F4 (Hz)
/i/ 311 2308 3369 4126
/u/ 285 792 2783 4055
/a/ 661 1291 2657 3717
50

TABLE VI. First, second and third formants computed after a local modification of the motor
commands for vowel /i/. The formants for vowel /i/ are given in TableIV. The motor commands
of the vowel /i/ were modified for 9 muscles independently andmultiplied by±2%,±5%,±8%
or ±10%. The formants obtained following these modifications are given. In theλ -model, an
increase in the motor commands corresponds to a decrease in the muscle activation; therefore a
multiplication by+10% corresponds to the lowest level of activation for a givenmuscle, whereas
a multiplication by−10% corresponds to the highest level of activation.
F1 (Hz) F2 (Hz) F3 (Hz) F1 (Hz) F2 (Hz) F3 (Hz)
GG
p
+10% 350 2084 2942
GG
m
−2% 321 2085 2979
+8% 340 2073 2931 −5% 322 2057 2960
+5% 332 2080 2950 −8% 321 2019 2938
+2% 326 2090 2976 −10% 322 2001 2924
−2% 317 2105 2992
HG
−2% 320 2094 2986
−5% 309 2102 3014 −5% 323 2087 2973
−8% 305 2102 3024 −8% 326 2079 2963
−10% 302 2111 3026 −10% 331 2076 2957
GG
a
+10% 273 2078 3035
Sty
+10% 272 2009 3017
+8% 273 2078 3035 +8% 278 2018 3000
+5% 283 2082 3012 +5% 296 2050 2994
+2% 307 2099 3008 +2% 311 2076 2981
−2% 333 2082 2967 −2% 334 2135 3003
−5% 351 2071 2928 −5% 348 2167 2924
−8% 368 2062 2903 −8% 360 2214 2814
−10% 375 2049 2895 −10% 364 2251 2766
MH
+10% 329 2101 2977
Tran
s
+10% 316 2118 3049
+8% 325 2096 2976 +8% 317 2117 3043
+5% 322 2095 2986 +5% 318 2112 3027
51

+2% 321 2095 2982 +2% 320 2108 3004
−2% 319 2091 2983 −2% 321 2083 2966
−5% 318 2100 2986 −5% 321 2069 2944
−8% 317 2096 2985 −8% 321 2056 2920
−10% 316 2096 2980 −10% 319 2048 2913
IL
−2% 321 2097 2980
SL
−2% 322 2094 2989
−5% 322 2094 2969 −5% 327 2104 2977
−8% 322 2098 2964 −8% 342 2103 2958
−10% 321 2103 2958 −10% 346 2106 2912
52

List of Figures
FIG. 1 (color online) Mesh representation (gray elements) of lingual and mouth floor
muscles as subsets of tongue elements (global mesh) (anterior oblique view). (a-
c) anterior, medium and posterior part of the genioglossus,(d) styloglossus, (e)
hyoglossus, (f) verticalis, (g) transversalis, (h) inferior longitudinalis, (i) superior
longitudinalis, (j) geniohyoid, (k) mylohyoid. The musclefibers are represented
in red. The yellow squares and the blue dots represent the muscle insertions on
the mandible and the hyoid bone, respectively.. . . . . . . . . . . . . . . . . . 7
FIG. 2 (color online) Oblique anterior view of the 3D tongue mesh in the whole oral
cavity for a rest position (tongue mesh in magenta, mandiblein cyan, hyoid bone
in yellow, translucent soft palate, pharyngeal and laryngeal walls in gray, infra-
and supra-hyoid muscles represented as magenta lines).. . . . . . . . . . . . . . 8
FIG. 3 (color online) Stress/strain hyperelastic constitutive law (Yeoh 2nd order material)
for lingual tissues. The dotted curve represents the original law obtained from
fresh cadaver tissues (c10 = 192 Pa andc20 = 90 Pa), the dashed curve the law
used in the current model for passive tissues (c10 = 1037 Pa andc20 = 486 Pa)
and the solid line the law used for the maximal activation (c10 = 10.37 kPa and
c20 = 4.86 kPa). . . . . . . . . . . . . . . . . . . . . . . . . . . . . . . . . . . 10
FIG. 4 Ratio damping over critical damping vs. frequency forα = 40 s−1 andβ = 0.03 s
(Rayleigh damping model). For a modal frequency from 3 to 10 Hz, the damping
ratio is below 1.26, i.e. close to the critical damping (ratio equal to 1).. . . . . . 15
53
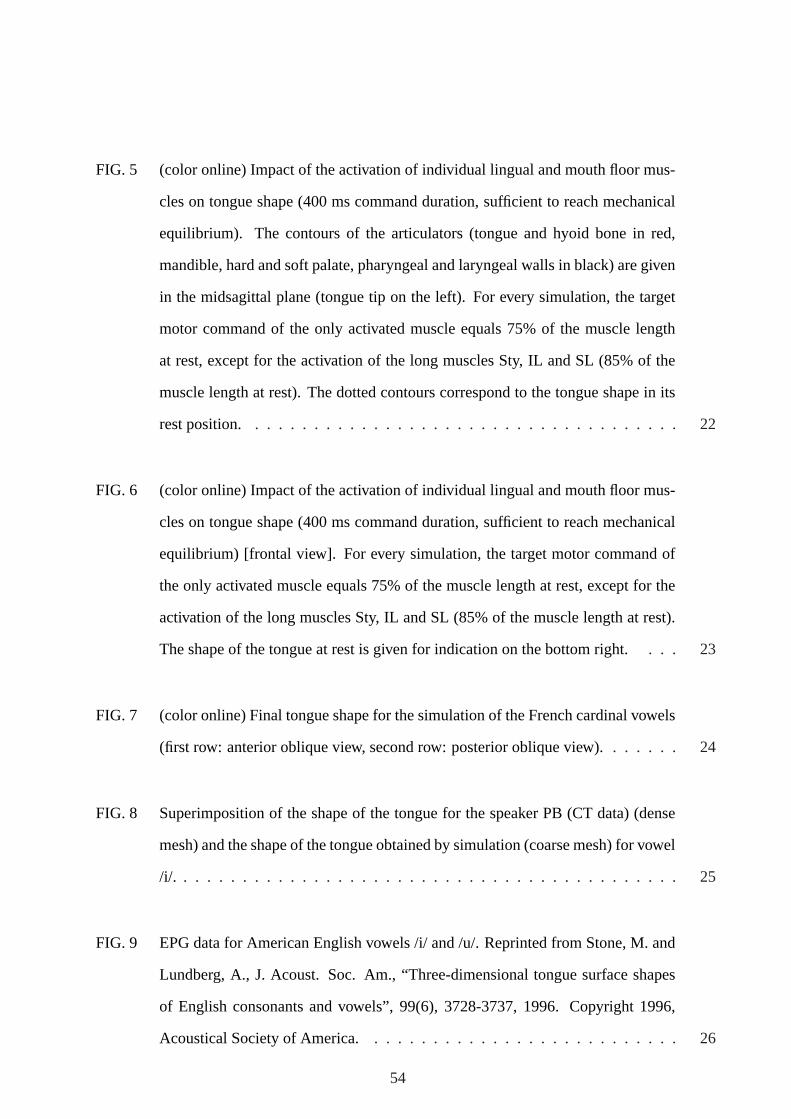
FIG. 5 (color online) Impact of the activation of individuallingual and mouth floor mus-
cles on tongue shape (400 ms command duration, sufficient to reach mechanical
equilibrium). The contours of the articulators (tongue andhyoid bone in red,
mandible, hard and soft palate, pharyngeal and laryngeal walls in black) are given
in the midsagittal plane (tongue tip on the left). For every simulation, the target
motor command of the only activated muscle equals 75% of the muscle length
at rest, except for the activation of the long muscles Sty, ILand SL (85% of the
muscle length at rest). The dotted contours correspond to the tongue shape in its
rest position. . . . . . . . . . . . . . . . . . . . . . . . . . . . . . . . . . . . . 22
FIG. 6 (color online) Impact of the activation of individuallingual and mouth floor mus-
cles on tongue shape (400 ms command duration, sufficient to reach mechanical
equilibrium) [frontal view]. For every simulation, the target motor command of
the only activated muscle equals 75% of the muscle length at rest, except for the
activation of the long muscles Sty, IL and SL (85% of the muscle length at rest).
The shape of the tongue at rest is given for indication on the bottom right. . . . 23
FIG. 7 (color online) Final tongue shape for the simulation of the French cardinal vowels
(first row: anterior oblique view, second row: posterior oblique view). . . . . . . 24
FIG. 8 Superimposition of the shape of the tongue for the speaker PB (CT data) (dense
mesh) and the shape of the tongue obtained by simulation (coarse mesh) for vowel
/i/. . . . . . . . . . . . . . . . . . . . . . . . . . . . . . . . . . . . . . . . . . . 25
FIG. 9 EPG data for American English vowels /i/ and /u/. Reprinted from Stone, M. and
Lundberg, A., J. Acoust. Soc. Am., “Three-dimensional tongue surface shapes
of English consonants and vowels”, 99(6), 3728-3737, 1996.Copyright 1996,
Acoustical Society of America. . . . . . . . . . . . . . . . . . . . . . . . . . . 26
54
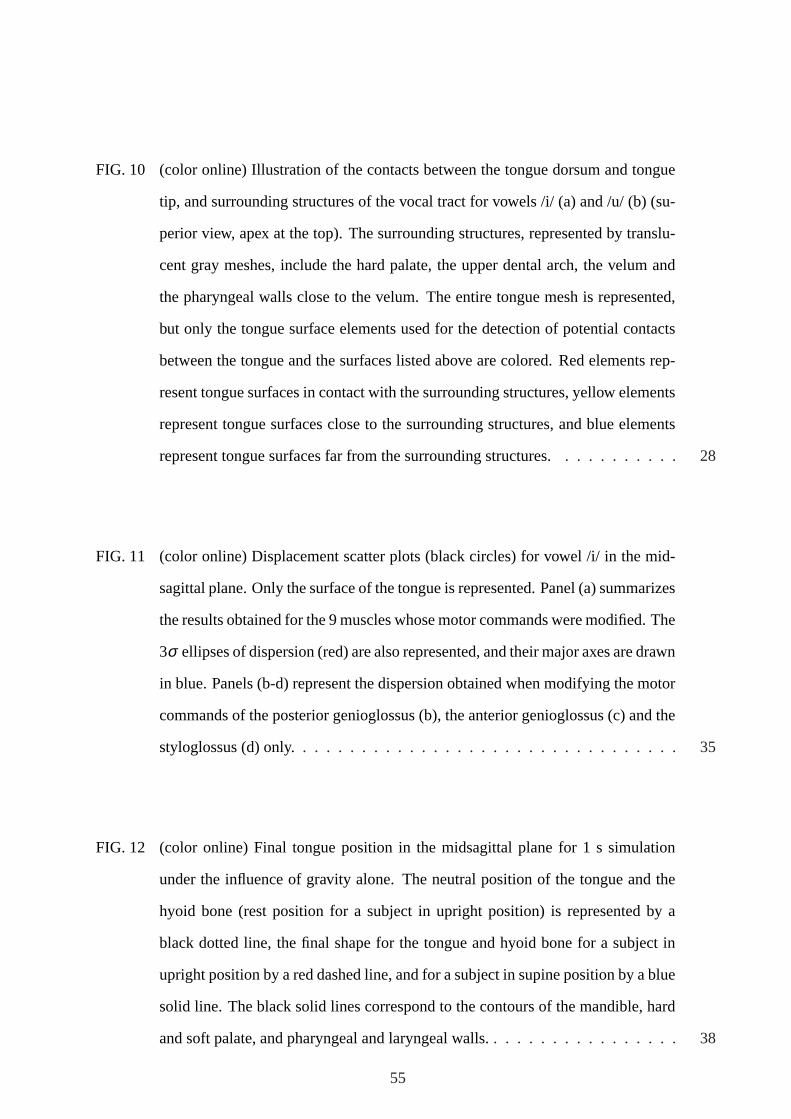
FIG. 10 (color online) Illustration of the contacts betweenthe tongue dorsum and tongue
tip, and surrounding structures of the vocal tract for vowels /i/ (a) and /u/ (b) (su-
perior view, apex at the top). The surrounding structures, represented by translu-
cent gray meshes, include the hard palate, the upper dental arch, the velum and
the pharyngeal walls close to the velum. The entire tongue mesh is represented,
but only the tongue surface elements used for the detection of potential contacts
between the tongue and the surfaces listed above are colored. Red elements rep-
resent tongue surfaces in contact with the surrounding structures, yellow elements
represent tongue surfaces close to the surrounding structures, and blue elements
represent tongue surfaces far from the surrounding structures. . . . . . . . . . . 28
FIG. 11 (color online) Displacement scatter plots (black circles) for vowel /i/ in the mid-
sagittal plane. Only the surface of the tongue is represented. Panel (a) summarizes
the results obtained for the 9 muscles whose motor commands were modified. The
3σ ellipses of dispersion (red) are also represented, and their major axes are drawn
in blue. Panels (b-d) represent the dispersion obtained when modifying the motor
commands of the posterior genioglossus (b), the anterior genioglossus (c) and the
styloglossus (d) only.. . . . . . . . . . . . . . . . . . . . . . . . . . . . . . . . 35
FIG. 12 (color online) Final tongue position in the midsagittal plane for 1 s simulation
under the influence of gravity alone. The neutral position ofthe tongue and the
hyoid bone (rest position for a subject in upright position)is represented by a
black dotted line, the final shape for the tongue and hyoid bone for a subject in
upright position by a red dashed line, and for a subject in supine position by a blue
solid line. The black solid lines correspond to the contoursof the mandible, hard
and soft palate, and pharyngeal and laryngeal walls.. . . . . . . . . . . . . . . . 38
55

FIG. 13 (color online) Final tongue position in the midsagittal plane for 1 s simulation un-
der the influence of the reflex activation alone. The neutral position of the tongue
and the hyoid bone (rest position for a subject in upright position) is represented
by a black dotted line, the final shape for the tongue and hyoidbone for a subject
in upright position by a red dashed line, and for a subject in supine position by a
blue solid line. The black solid lines correspond to the contours of the mandible,
hard and soft palate, and pharyngeal and laryngeal walls.. . . . . . . . . . . . . 39
56