A BALANCED SCORECARD APPROACH TO … Internnlioitrti Symposium In Deitelopitlg Iicononties:...
13
Internnlioitrti Symposium In Deitelopitlg Iicononties: Cornrnonnlities Airtong Diversities -~ .,~ ~.~. ~~ . . A BALANCED SCORECARD APPROACH TO MEASURING INDUSTRY PERFORMANCE Poh Tin Hiap Malaysia University of Science and Technology Malaysia E-mail: pthia~fi3~ocketmail.com Toong Khuan Chan The University of Melbourne Australia E-mail: [email protected] ABSTRACT A systematic measurement framework for the Malaysian construction industry enables the industry to monitor its progress towards achieving the goals set out in the ConstructionIndustry Master Plan 2006-2015. The objectives of this paper were to evaluate the appropriateness of critical successfactors defined in the master plan, to develop a set of performance measures for the constrr~ction indmtry and to benchmark the available data with data available in 2006. The Balanced Scorecard approach was used to evaluate the critical success factors to ensure that it provides a holistic and balanced view to enhance the industry's competitive standing. The review concluded that the critical successfactors defined in the CIMP generally cover all the Balanced Scorecard perspectives with an over-emphasis on the Learning and Growth Perspective and lackedfocus on the Customer Perspective. A list of key performance measures for the Malaysian construction industry has been identified together with a clear association between the strategic thrusts and performance measures. (159 words) Keywords: performance nteasurement, benchmarking, construction industry " . 1.0 INTRODUCTION The Malaysian construction industry has largely been supported by substantial public spending to f h d the construction of basic infrastructure in order to enhance economic activities (i.e. agriculture, rural development, transport, commerce and industry) and to provide affordable public housing to house the needy. Due to a decline in public spending in 2003 and 2004, the construction sector value added dropped 0.9%, 1.8% and 0.5% in 2004, 2005 and 2006, respectively. This decline was attributed to the completion of a number of large scale public infrastructure projects and numerous major highways (CIDB, 2007). More recently RM200 billion ( U S 5 6 billion) has been allocated for in the Ninth Malaysia Plan - a five-year development plan spanning 2006-2010; approximately RM40 billion per year in construction project value is expected to increase construction demand and spur growth in this sector (EPU, 2006). The total value of public and private contracts awarded increase to RM 59 billion in 2006 followed by a further increase to RM 88 billion in 2007. The industry is championed by the Construction Industry Development Board (CIDB), a government agency established by an Act of Parliament, to promote and stimulate the development, improvement and expansion of the construction industry in Malaysia, and generally to represent the industry to the government and the public. Contractors or construction companies in Malaysia are required to be registered with the CIDB and are classified based on their financial status, technical . .. - -- . .. - 415lPage
Transcript of A BALANCED SCORECARD APPROACH TO … Internnlioitrti Symposium In Deitelopitlg Iicononties:...

Internnlioitrti Symposium In Deitelopitlg Iicononties: Cornrnonnlities Airtong Diversities -~ . , ~ ~ . ~ . ~~ . .
A BALANCED SCORECARD APPROACH TO MEASURING INDUSTRY PERFORMANCE
Poh Tin Hiap Malaysia University of Science and Technology
Malaysia E-mail: pthia~fi3~ocketmail.com
Toong Khuan Chan The University of Melbourne
Australia E-mail: [email protected]
ABSTRACT
A systematic measurement framework for the Malaysian construction industry enables the industry to monitor its progress towards achieving the goals set out in the Construction Industry Master Plan 2006-2015. The objectives of this paper were to evaluate the appropriateness of critical success factors defined in the master plan, to develop a set of performance measures for the constrr~ction indmtry and to benchmark the available data with data available in 2006. The Balanced Scorecard approach was used to evaluate the critical success factors to ensure that it provides a holistic and balanced view to enhance the industry's competitive standing. The review concluded that the critical success factors defined in the CIMP generally cover all the Balanced Scorecard perspectives with an over-emphasis on the Learning and Growth Perspective and lacked focus on the Customer Perspective. A list of key performance measures for the Malaysian construction industry has been identified together with a clear association between the strategic thrusts and performance measures. (159 words)
Keywords: performance nteasurement, benchmarking, construction industry " .
1.0 INTRODUCTION
The Malaysian construction industry has largely been supported by substantial public spending to f h d the construction of basic infrastructure in order to enhance economic activities (i.e. agriculture, rural development, transport, commerce and industry) and to provide affordable public housing to house the needy. Due to a decline in public spending in 2003 and 2004, the construction sector value added dropped 0.9%, 1.8% and 0.5% in 2004, 2005 and 2006, respectively. This decline was attributed to the completion of a number of large scale public infrastructure projects and numerous major highways (CIDB, 2007). More recently RM200 billion (US56 billion) has been allocated for in the Ninth Malaysia Plan - a five-year development plan spanning 2006-2010; approximately RM40 billion per year in construction project value is expected to increase construction demand and spur growth in this sector (EPU, 2006). The total value of public and private contracts awarded increase to RM 59 billion in 2006 followed by a further increase to RM 88 billion in 2007.
The industry is championed by the Construction Industry Development Board (CIDB), a government agency established by an Act of Parliament, to promote and stimulate the development, improvement and expansion of the construction industry in Malaysia, and generally to represent the industry to the government and the public. Contractors or construction companies in Malaysia are required to be registered with the CIDB and are classified based on their financial status, technical . .. - ~ -- . .. ~ - ~ ~~~ ~ ~~
4 1 5 l P a g e

capabilities and track record into seven grades (GI to G7). As of 2006, there were a total of 62,884 contractors registered with 3,751 in the highest grade of G7 and more than 53,000 contractors in the lower grades GI-G3. Sixty foreign contractors are also registered'with the board. The board has noted that many registered contractors are inactive primarily due to the decline in demand for construction services in recent years. The sector was reported to employ approximately 700,000 workers in 2006 (CIDB, 2008).
2.0 THE CONSTRUCTION INDUSTRY MASTERPLAN
A decline in the performance of the Malaysian construction industry in the 2004-06 period has presented an opportunity for the industry to examine its strength and weaknesses, and to chart its future diection towards strengthening its foundations to face future challenges. Towards the end of 2007, the CIDB published a ten-year master plan (CIDB, 2007) for the construction industry that will be implemented from 2006 to 2015 with the objective of refocusing the strategic position and charting the future direction of the industry. It was intended to provide industry stakeholders with a clear diection through its strategic thrusts, recommendations, and action plans to convert the industry into one that is more sustainable, delivers high quality products and related services, performance oriented and has an improved image.
The main driver for the strategic plan was the fact that the industry has recorded an average annual growth of only 0.7% during the period between 2000 and 2007 compared to an average annual gross domestic product growth of 5.5% over the same period. There were concerns that the construction industry, being a main pillar of industrialisation and major contributor to economic growth, was not performing at its best and thus not able to meet the dual challenge of open markets and greater global competition. Procurement methods and practices, construction methods, planning and building plan approval procedures were some of the key areas identified as deficient. The availability of cheap foreign labour has hitherto encouraged the industry to adopt labour- intensive construction methods as opposed to the more productive capital-intensive technologies. This has led to low productivity levels, unsafe and unhealthy practices, low built quality, and a general lack of interest of the local wor!dorce to join the construction industry.
The master plan was therefore initiated to establish an innovative, sustainable, professional, profitable and world-class construction industry through the identification of eight critical success factors (see Table 1) that were imperative to the success of the mission, and the promotion of seven strategic thrusts which are listed in Table 2.
Table 1: Eight critical success factors essential to achieve the mission of the master plan
Critical Success Factors I Descri~tion CSFl Productivity
CSF2 Quality
CSF3 Human Resources
CSF4 Knowledge
CSF5 Innovation
CSF6 Environment-Friendly Practices
CSF7 Industry Sustainability
CSFB Professionalism
Improve productivity throughout the value chain
Improve quality through better use of manpower, materials, equipment and construction methods
Upgrade skills and enhance knowledge to create a competent workforce
Upgrade the level of knowledge of the construction community
Introduce new construction methods, materials, taols and equipment
Minimise impact on environment by engaging in sustainable practices
Generate new opportunities both in the domestic and overseas markets.
Improve industry image by enhancing professionalism
At least twenty one recommendations have been suggested in order to fulfil the goals outlined by the seven strategic thrusts. It can be argued that the strategic plan and the critical success factors together with the thrusts and recommendations form only two parts of the plan-act-measure- -
4 1 6 I P a g e

International Syrnposlum fn Developiitg ~conol2tieS: Cornrnoncrlities Afrtong Diversities . .. . . . . ~. ~ -.
(repeat) methodology of bringing about change. The third part - measure, is the missing link which enables the results of the 'action ' to be quantified, analysed and further improved upon.
Table 2: Seven strategic thrusts that form the basis of the strategic master plan
Strategic Thrusts ST1 - Integrate the construction industry value chain to enhance efficiency and increase productivity ST2 - Strengthen the construction industry image ST3 - Strive for the highest standard of quality, occupational safety and health, and environmental
practices ST4 -Develop human resource capabilities and capacities in the construction industry ST5 - Jimovate through R&D and adopt new construction methods ST6 -Leverage on ICT in the construction industry ST7 -Benefit from globalization and increase the export of construction products and services.
The objective of this paper is firstly to develop a set of performance measures in order to gauge the performance of the construction industry over a range of its activities in order for the stakeholders to monitor its progress towards achieving its goals. Previous studies (Landin and Nilsson, 2001; Kagioglou et al., 2001; Mohamed, 2003; Takim et al., 2003; Beatham et al., 2004; Bassioni et al., 2004; Lin and Shen, 2007; Nudurupati et al., 2007; Yu et al., 2007) have mainly been focused on evaluating project outcomes or company performance and implemented primarily for the contractors, consultants and managers of construction projects. Other stakeholders, such as clients, suppliers, regulatory authorities and the community were not assessed or taken into account. The Balanced Scorecard approach was adopted to evaluate the eight critical success factors and seven thrusts of the master plan to ensure that these provide a balanced approach to improve the performance of the industry. A review of performance measure initiatives was then conducted to select the appropriate performance measures to reflect the industry's competitive position. The second objective was to determine a baseline from which the outcome of the master plan can be measured against and for future benchmarking studies. The availability of these performance measures will allow the CIDB, the organisation primarily tasked to implement the master plan, with a framework with which to benchmark and analyse the activities of the companies which comprise the construction industry.
3.0 PEFWORMANCE MEASUREMENT INITIATWES
Traditionally businesses have measured their performance in financial terms: mainly profit, turnover, and return on investment. These financial measures of performance have been the sole measures of a company's success but have been deemed to be out of step with recent changes in many industries, particularly relating to new technologies and increased competition. It is clear that performance measurement is only a small part of the business improvement process and unless action is taken based on the results attained then these measures are meaningless, costing money to obtain and not adding value to the business. Performance measurement must therefore be part of a system, which reviews performance, decides on actions and changes the way in which businesses operate.
Over the last few decades many performance measurement frameworks have been suggested and adopted for the purpose of improving performance. Good overviews of performance measurement frameworks in construction together with discussions and critiques of the deficiencies can be found in Kagioglou et al. (2001), Bassioni et al. (2004) and Costa et al. (2006). These frameworks include performance measures which can be implemented at the project, company or industry level where the measures for the project perspectives are sub-sets of the measures for the company performance, and the aggregation of company measures evolve into measures for the

industry. Kagioglou et al. (2001) extended the framework for an organisation to the construction industry by adding the 'project' and 'supplier' perspectives. Bassioni et al. (2004) reviewed the three main performance measurement frameworks in the UK construction industry - the key performance indicators (KF'I), Balanced Scorecard, and the EFQM Excellence Model, and highlighted a range of issues that requires further research. These include how existing performance measurement systems interact with newly developed systems, the setting of targets and standards for performance measures, aggregation of measures, hurdles to implementation, and using performance measures to take managerial action. Some of these concerns were addressed in the article by Costa et al. (2006) which highlighted the role of performance measurement to enable a company to benchmark its performance against that of other similar organisations in key business activities.
Five performance measurement initiatives, some implemented with the intent of establishing a benchmarking programme, are discussed: the Key Performance Indicators (KPI) for the United Kingdom; the National Benchmarking System for the Chilean Construction Industry (NBS-Chile); the Benchmark Centre for Danish Construction Sector (BEC); the New Zealand Construction Industry National Key Performance Indicators; and the performance measurement program of the Canadian Construction Innovation Council.
3.1 United Kingdom
Following the Latham Report (DOE, 1994) and the Egan Report @TI, 1998) in the UK, the UK construction industry has developed its own set of key performance indicators (KPIs) to measure its performance. The Construction Best Practice Programme (CBPP), which was government funded, is recognized as the leading organisation involved in the production of KPIs within the industry, and this has been vety successful in introducing many construction companies to the subject of performance measurement. The CBPP launched its ten headline KPIs in 1998. These are: client satisfaction - product a id service, profitability, productivity, defects, safety, predictability - time and cost, construction time and construction cost. This effort has lead to the formation of Construction Excellence, a new single organisation, which aims to deliver improved industry performance resulting in a demonstrably better built environment (Constructing Excellence, 2007a). Construction Excellence markets its services in advising on the implementation and the use of KPIs in the UK construction industry on an annual licence fee basis. The KPI Management Tool, available for many years through the KPI Group, is an on-line facility ~ttp://www.kpizone.com) that allows companies to measure and manage company and project KPIs. It is supposedly easy to use and quickly generates reports and radar diagrams using the latest Department of Trade and Industry KPI Benchmark data (DETR, 2000; Swan and Kyng, 2004). In 2007, the KPI Group extended the scope of its work and published the UK Construction Consultants Key Performance Indicators (Constructing Excellence, 2007b) that provides a step-by-step methodology to help implement and to define methods of measurement. It has been reported that more than 3,000 companies in the construction sector are currently involved in performance measurement and benchmarking.
3.2 Chile
The National Benchmarking system in Chile was developed in 2000 by the Corporation for Technical Development (CDT) of the Chilean Chamber of Construction and the Program for Excellence in Production Management at the Pontificia Universidad Catolica de Chile (GEPUC). The programme consists of two initiatives: devising and implementing performance measurement in the construction industry; and establishing benchmarking clubs to compare performance. Performance indicators such as project cost and schedule deviations, subcontract, labour efficiency,
Internntioirai Syrrrpossi~ In Developir~g Econor~ties: Commoncriities A l n o n Diversities - ~ . ~. . ~
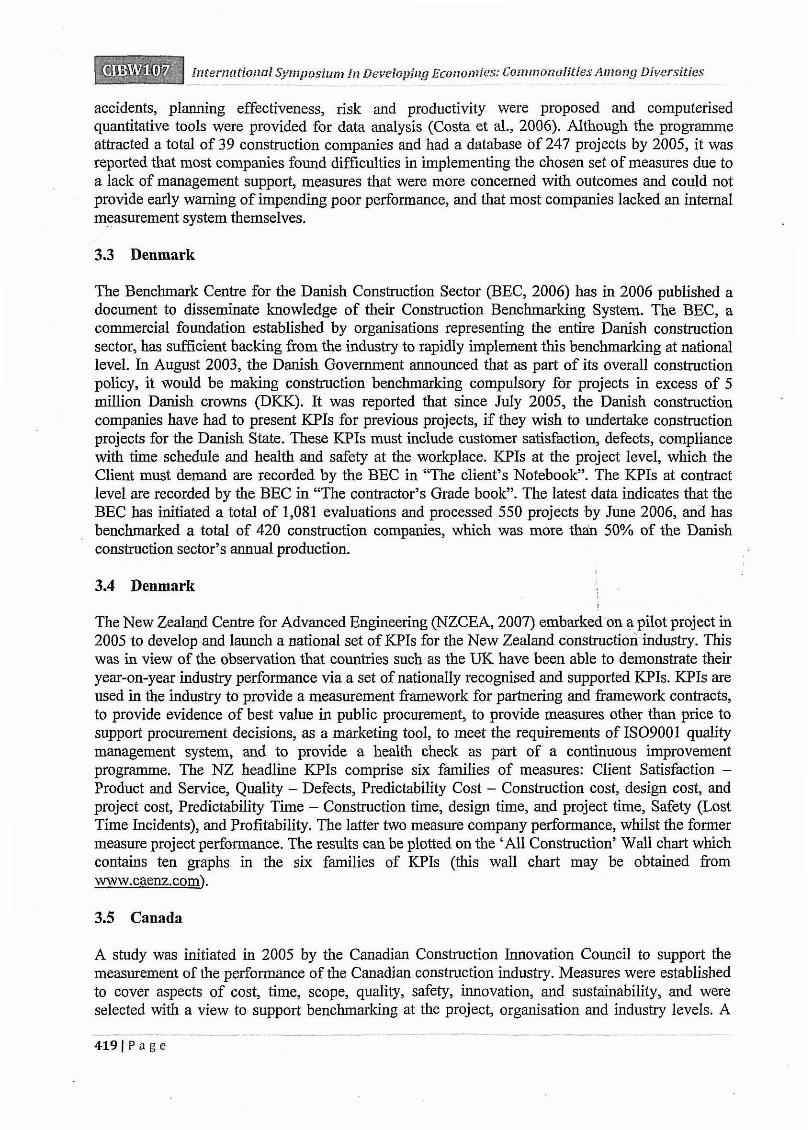
accidents, planning effectiveness, risk and productivity were proposed and computerised quantitative tools were provided for data analysis (Costa et al., 2006). Although the programme attracted a total of 39 construction companies and had a database of 247 projects by 2005, it was reported that most companies found difficulties in implementing the chosen set of measures due to a lack of management support, measures that were more concerned with outcomes and could not provide early warning of impending poor performance, and that most companies lacked an internal measurement system themselves.
3.3 Denmark
The Benchmark Centre for the Danish Construction Sector (BEC, 2006) has in 2006 published a document to disseminate knowledge of their Construction Benchmarking System. The BEC, a commercial foundation established by organisations representing the entire Danish construction sector, has sufficient backing ftom the industry to rapidly implement this benchmarking at national level. In August 2003, the Danish Government announced that as part of its overall construction policy, it would be making construction benchmarking compulsory for projects in excess of 5 million Danish crowns (DICK). It was reported that since July 2005, the Danish construction companies have had to present KF'Is for previous projects, if they wish to undertake construction projects for the Danish State. These KPIs must include customer satisfaction, defects, compliance with time schedule and health and safety at the workplace. KPIs at the project level, which the Client must demand are recorded by the BEC in "The client's Notebook". The KPIs at contract level are recorded by the BEC in "The contractor's Grade book". The latest data indicates that the BEC has initiated a total of 1,081 evaluations and processed 550 projects by June 2006, and has benchmarked a total of 420 construction companies, which was more thah 50% of the Danish construction sector's annual production.
3.4 Denmark . . !
The New Zealand Centre for Advanced Engineering (NZCEA, 2007) embarked on a pilot project in 2005 to develop and launch a national set of KPIs for the New Zealand construction industry. This was in view of the observation that countries such as the UK have been able to demonstrate their year-on-year industry performance via a set of nationally recognised and supported -1s. KPIs are used in the industry to provide a measurement framework for partnering and framework contracts, to provide evidence of best value in public procurement, to provide measures other than price to support procurement decisions, as a marketing tool, to meet the requirements of IS09001 quality management system, and to provide a health check as part of a continuous improvement propamme. The NZ headline KF'Is comprise six families of measures: Client Satisfaction - Product and Service, Quality - Defects, Predictability Cost - Construction cost, design cost, and project cost, Predictability Time - Construction time, design time, and project time, Safety (Lost Time Incidents), and Profitability. The latter two measure company performance, whilst the former measure project performance. The results can be plotted on the 'All Construction' Wall chart which contains ten graphs in the six families of KPIs (this wall chart may be obtained from www.caenz.com).
3.5 Canada
A study was initiated in 2005 by the Canadian Construction Innovation Council to support the measurement of the performance of the Canadian construction industry. Measures were established to cover aspects of cost, time, scope, quality, safety, innovation, and sustainability, and were selected with a view to support benchmarking at the project, organisation and industry levels. A

recent report on a pilot study (Rankin et al., 2008) indicated that while cost, time, scope and safety information was readily available, the information for quality innovation and sustainability was not. The preliminary results were expected to become the basis of a broad benchmarking program.
The reviews above has given a broad overview of the various KPI and benchmarking initiatives at various stages of implementation, beginning with the UK which has a mature system of reporting KPIs since 1998, the Chilean initiative, and more recently the Danish, New Zealand and Canadian efforts have made significant progress although initiated in only the mid-2000s. These programmes have indicated that the performance measures for the construction industry necessarily include a combination of metrics for projects (time and cost target, quality), companies (profitability, turnover, return on capital) and the industry (safety, growth, labour productivity, innovation, training, construction demand).
4.0 APPLYING THE BSC TO THE CONSTRUCTION INDUSTRY
The Balanced Scorecard (BSC) approach, fust introduced by Kaplan and Norton (1992), is widely adopted by many companies and viewed by researchers as a strategic management tool in developing a performance management system. It has been recognised that the traditional financial measure does not predict an organisation's future performance as financial measures are lagging indicators targeted at past performance. The BSC attempts to provide managers with relevant information about activities they are currently managing than that of which is provided by financial measures by including non-financial measures.
The BSC suggests that an organization's ability to create value in the future will be driven by four major perspectives: financial, customer, internal process, and learning and growth. In one sentence, the balanced scorecards describe the knowledge, skills, and systems that employees will need (their leaming and growth) to innovate and build the right strategic capabilities and efficiencies (the internal processes) that deliver specific value to the market (the customers), which will eventually lead to higher shareholder value (the financials).
Following on the initial approach which attempted to identify specific measures from a broader perspective, Kaplan and Norton (2004) further suggested creating a Strategy Map which emphasised the linkages among these four perspectives. It follows that the Balanced Scorecard approach has evolved from a measurement system to a communication system which provides a one-page graphical representation of what an organisation must do well in each of the four perspectives in order to successfully execute strategy (Niven, 2006). A strategy map embeds the different items on an organisation's balanced scorecard into a cause-and-effect chain, connecting the desired outcomes with the drivers of those results. The best way to build the map is to build from the top down, starting with the strategic vision and then charting the routes that will lead to achieving the vision. As opposed to a map for a company which typically starts with a financial strategy for increasing shareholder value, the strategy map for the entire construction industry will have to focus on increasing stakeholder value instead. Stakeholder value includes greater value for customers, enhanced benefits to the national economy and increased profits for construction companies. The eight critical success factors from the master plan and the associated strategic thrusts have been mapped to these four perspectives in Figure 1.
4.1 Financial Perspective
Kaplan and Norton (1992) suggested that companies have two basic levers for their financial strategy: revenue growth and productivity. The former includes increasing revenue from new markets, new products and new customers, and increase value to existing customers through cross- selling or bundling of products. The revenue growth strategy for the industry calls for the

Internatiottnl S'posiun~ In Developi~tg Econoli1ie.s: Commontiffties Ainonij Diversities .- . . .. .~ .~ ~ -~ ~. -
government to continue to invest in national development projects to support socio-economic growth, greater spending on maintenance, and to export construction products and services by offering total solutions (construction technology and financing) to overseas clients. Although the initiative to enhance the procurement strategies can potentially increase value to construction clients, the action plan seems to focus mainly on internal processes such as recommending the use of standard forms of contracts and resolving non-payment issues with the introduction of a Payment and Adjudication Act. The master plan lacks a clear productivity strategy on improving the industry's cost structure and using assets more effectively.
4.2 Customer Perspective
The value proposition to construction industry clients is focused on only two parameters - quality and image. It defines how the sector attracts, retains, and deepens relationships with their customers. The value proposition is crucial because it helps the sector connect its internal processes to improved outcomes with its customers. The master plan has specifically put in place a strategy to improve quality through IS0 certification and accreditation, and tightening existing standards. The industry intends to improve on its image by enhancing professionalism ofthe industry with stricter registration requirements for contractors, greater specialisation, and tighter monitoring of contractor performance. However, the overall customer strategy lacks emphasis on availability, range, functionality of the products offered, and the quality of the relationships with customers. The construction sector has historically been competing on the basis of price and would certainly need to pursue a strategy on either developing partnerships with its customers, developing operational excellence or achieving product leadership.
4.3 ~nternal Process Perspective
Once the industry has a clear picture of its customer and hancial perspectives, it can then determine the means by which it will achieve the differentiated value for customers and the productivity improvements to reach its financial objectives. The four key internal processes by which the construction industry creates value are operations management, customer management, innovation, and regulatory and social processes. In the operations management area, the industry has identiiied new construction methods such as the 'industrialised building systems' as a way of enhancing efficiency, improving quality and reducing the reliance on manual labour. To sustain or build a competitive advantage, the industry must keep creating and bringing to market new products, services and processes. The strategy to invest in research and development for innovative products and processes in anticipation of customer's future needs is in place. The sector must continually comply with all the regulatory and social practices by adopting environmentally- iiiendly practices and aim for a higher occupational health and safety compliance rate. However, the industry plan is relatively weak in the customer management areas where no clear strategy is presented to attempt to understand the needs of the customers both locally and overseas, and the value proposition that they will find most appealing.
4.4 Learning and Growth Perspectives
The foundation of the entire strategy is the learning and growth perspective, which defines the core competencies and skills, the technologies, and the corporate culture needed to support the industry's mission. The construction industry has identified that all its workers, supervisors and managers need to be highly skilled and competent and has introduced training and accreditation schemes to develop these human resources. The sector intends to promote the use of information technology to share knowledge, to implement online planning, approval, procurement and project
management systems. In the area of organisation capital, the industry has emphasised the need to enhance professionalism by introducing monitoring the performance of the registered contractors, developing a code of ethics and conducting performance assessments and benchmarking against best practices.
FINANCIAL LONG-TERM VALUE TO CLIENTS. CONTRACTORS. CONSULTANTS. EMPLOYEES 8 GOVN.
PERSPECTIVE I I P R ~ ~ ~ ~ ~ ~ I ~ ~ S T R A T E G Y I GROWTH STRATEGY
TI: INCREASE PROOUCTIV~TY ST7: EXPORT CONST'N PRODUCTS 8
CUSTOMER CUSTOMERVALUE PROPOSITION
PERSPECTIVE PRODUCTISERVICE ATTB. RELATIONSHIP IMAGE
CSF2: QUAUN -
\+ST2 IMPROVE QUALITY+- INDUSTRY IMAGE
- - - - - - - - -- - - - - - - - - - - -- - - - - - . - - - - - - - - - - - -
K i Y t E R
INNOVATION OPERATIONS
PERSPECTIVE MGMT
CSFG: ENVIRONMENT- CSFS. I ~ N n v n ~ l n N CSF4' K ~ n w l Fnr;F
FRIENDLY PRACTICES
ST5: \~EW ST3: HIG~ OSHAND THROUGH R&D CONSTRUCTION ENVIRONMENTAL
LEARNING AND G R O W
INTANGIBLE ASSETS
HUMAN CAPITAL INFORMATION
CSF3: HUMAN CSFB: PROFESSIONALISM
ST4: DEVELOP HUMAN I ST6: LEVERAGE ON
RESOURCE CAPABILITY AND CAPACIIES
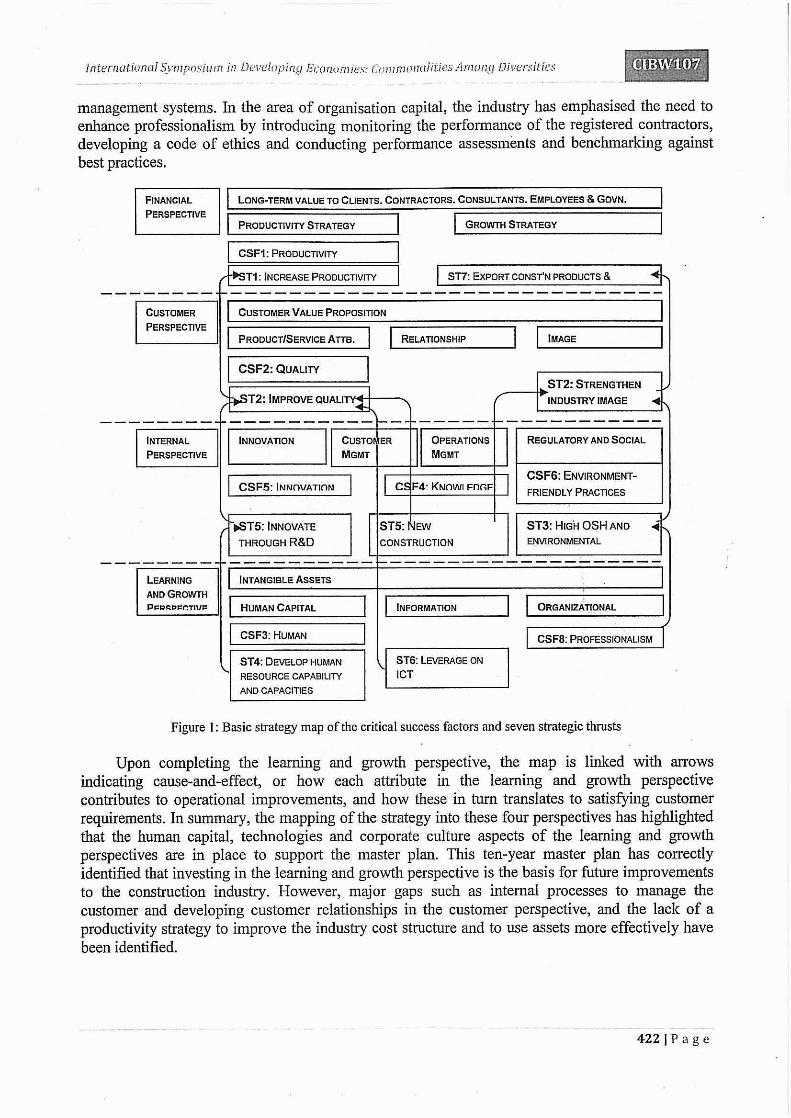
Figure 1: Basic strategy map o f the critical success factors and seven strategic thrusts
Upon completing the learning and growth perspective, the map is linked with arrows indicating cause-and-effect, or how each attribute in the learning and growth perspective contributes to operational improvements, and how these in turn translates to satisfying customer requirements. In summary, the mapping of the strategy into these four perspectives has highlighted that the human capital, technologies and corporate culture aspects of the learning and growth perspectives are in place to support the master plan. This ten-year master plan has correctly identified that investing in the learning and growth perspective is the basis for future improvements to the construction industry. However, major gaps such as internal processes to manage the customer and developing customer relationships in the customer perspective, and the lack of a productivity strategy to improve the industry cost structure and to use assets more effectively have been identified.

Interncitional S~iri.vo,sirtm IPI Developirtg &or~oniie.s: Commonalities Ainon,q i)iver.sities ~ - ~. ~
5.0 CURRENT PERFORMANCE METRICS AND PROPOSED TARGETS
The list of performance measures was designed to focus on the strategic thrusts in each of the four perspectives to ensure that the measures are explicitly liked to its strategy. A number of measures from other initiatives, which were found to be effective, were included in this list. An additional measure is suggested to rectifi the lack of emphasis on customer management in the master plan. These measures will be presented in line with the four BSC perspectives as shown in Table 3. The measures are defined, sources of data identified, and computed for the 2006 base year. A target is set for each measure by reviewing the derived data against benchmark data from other countries.
6.0 DISCUSSION AND IMPLEMENTATION ISSUES
Based on the attempt to derive the measures for the Malaysian construction industry and also the review of the performance measurement and benchmarking initiatives in the UK, Chile, Denmark, New Zealand and Canada, some key issues for the design and implementation of these systems are discussed. Firstly, the establishment of an industry wide performance measurement system and incorporating the measures into the entire industry require a fairly intense effort. The responsibility for data collection, processing and analysis is not well defined at this stage although existing sources of data have been identified. The implementation of this initiative demands a joint effort from several government agencies, construction clients, individual construction companies, research institutions, and industry organisation. Several issues regarding the lack of data, inconsistencies in some published information have surfaced: (1) no published data for some measures (project cost and time predictabiity, labour productivity, contractor performance, approval time, client satisfaction, training and staff turnover), (2) the number of workers in the construction industry was reported as 400,000 in the Survey of Construction Industries 2005 (DOS, 2006), but recorded as 800,000 in the Labour Census Report 2004 @OS, 2008) although both documents were published by the same organisation, and (3) the small number of samples for some parameters would not give a good representative report of the actual performance. The requirement for a consistent, accurate and validated set of data from reliable sources cannot be over-emphasised.
In the discussions which followed on from the presentation of the early draft of the performance measures, it became apparent to the CIDB the responsibility to overcome these shortcomings will f d within their efforts to implement the master plan. Significant efforts would have to be expended to convince the industry stakeholders to report the necessary project and company information to the CIDB. Presently, the regulations only require the registered construction companies to supply the following information: project values when projects are awarded, company certifications, and worker training, accreditation and registration. Additional information regarding productivity, company profitability, project performance, customer satisfaction, and staff training and turnover shall be required to ensure that the performance measurement program is carried out effectively and successfully.
Although a range of measures has been proposed, the list is by no means complete or exhaustive but a balance between expedient implementation of the initiative and measuring many parameters. The draft list of measures has been designed to cover all four perspective of the balanced scorecard in equal weightage. As discussed above, the measures in the financial and customer perspectives are all lagging measures or outcomes whereas the measures in the internal, and learning and growth perspectives help identify improvement opportunities and point towards management interventions. In parallel, the list of measures for the industry necessarily encompasses measures derived from both projects and companies as construction is a project-oriented where each project is unique in terms of design, site conditions, team members and suppliers. This list of measures shall be reviewed periodically to ensure that the measures remain relevant to the

appropriate perspectives and that the data remains comparable with those obtained from different countries.
In general, the successful implementation of this performance measurement initiative can lead to the development of benchmarking initiatives where project, company and industry performance is compared against the best performances in other sectors of the economy andlor other countries. In the final analysis, a performance measurement system is of no value if it is not used as a guide to management decisions. The feedback loop and consequent decision making based on these measures are necessary to convert the measurement system into a management system. Failure to take action and manage with the data will severely curtail the potential for achieving performance improvement.

Table 3 Proposed list of performance measures
Item
1 .I 1.2 1.3 1.4 1.5 1.6 1.7 1.8
2.1 2.2 2.3 2.4 2.5 2.6 2.7 2.8 2.9 2.10
3.1 3.2 3.3
3.4 3.5 3.6 3.7 3.8
3.9 3.10
4.1 4.2 4.3 4.4 4.5 . 4.6
Performance Measures Financial Perspective Annual construction demand from public sector Annual construction demand from private sector Ratio of value of contracts awarded to Malaysian contractors vs foreign Total annual value of overseas construction projects Productivity -Value-add per worker (RM per worker) Productivity growth rate (annual change in productivity) Profitability - Company (Revenue as a percentage of sales) Return on equity (Revenue as percentage of equity) Customer Perspective Predictability Cost - Design (%on target) Predictability Cost - Construction ( O h on target) Predictability Cost - Project (% on target) Predictability Time - Design (% on target) Predictability Time-Construction (% on target) Predictability Time - Project (% on target) QLASSiC score l i m e for Approvals (weeks) Performance Ratings Client Satisfaction - Products and Services Internal Perspective- innovation Construction R8D per RMlm of project value Percentage of iBSlpre-castlpre-fabrication Number of patents registered locally -Operations Labour productivity (man-days per sq. m of completed works) Labour productivity growth rate (annual change in productivity) Number of construclion companies with IS09001 certification Number of construction companies with IS014001 certification Number of construction companies with OSHMSIOHSAS certification -Occupational Health and Safety Number of accidents (per 100,000 workers) Employee fatality (per 100.000 workers) Learning and Growth Perspective Workers accreditation by CiDB (AccreditedIRegistered) Supervisors accreditation by ClDB (AccreditefflRegistered) Staff turnover Number of training days per worker per year Total iCT spending of the construction industry (per RM l m of project value) Inputs from the ICT industry to the construction industry
2006 Base Year
RM 21.5 billion RM 37.5 billion - 93% RM 30 billion RM35,240 2.63% (2005) 9.8% (mean) 7.7% (mean)
No data No data No data No data No data No data 60 No data No data No data
RM120 (est.)
197
NO data No data 375 (2007) 2 (2007) 6 (2007)
91 5 (2005) 18 (2005)
27,797 41 1 No data N o data RM505 RM254 million
Source
ClDB Data CiDB Data ClDB Data ClDB Data DOSM DOSM CiDB Survey CiDB S u ~ e y
CiDB Survey ClDB Survey ClDB Survey CiDB Survey ClDB Survey ClDB Survey ClDB Data ClDB Survey CiDB Survey ClDB Survey
GiD&CREAM ClDB Data MyiPO
CiDB Survey ClDB Survey ClDB Data ClDB Data ClDB Data
SOSCO SOCSO
CiDB Data CiDB Data ClDB Survey ClDB Survey DOSM DOSM
Phase 2 (2009-2012)
) RM 6Ob ) (Total) 80% 8 above RM25b .
4%
30%
30% 70 Report Report Report
RM 240
3% +G6,G5-50% G7-30% G7-30%
700 13
1 + 50% + 50%
Phase 1 (2006-2008)
80% &above RM 13b
3% Report Report
Report Report Report Report Report Report Report Report Report Report
RM 120 Report Report
Report 2% G7-100% Report Report
Report Report Report Report + 50% + 50%
Phase 3 (2013-2015)
) RM 75b
80% 8 above ) (Total)
RM45b
5%
50%
50% 80 Report Report Report
RM 360
3% +G6.G5-70% G7-50% G7-50%
450 8
> 95% > 95%
2 + 50% + 50%
7.0 CONCLUSIONS
This article has reviewed the strategic initiatives of the construction industry master plan to transform the industry into a "world-class, innovative, and knowledgeable global solution provider". This study has pointed out that the critical success factors and strategic thrusts have covered all four perspectives of the Balanced Scorecard with a strong emphasis on the Learning and Growth perspective and deficient in its focus on customer management. A performance measure to assess customer satisfaction is recommended and added to the list of proposed measures. A strategy map of the critical success factors and strategic thrusts clearly illustrates the cause-and-effect relationships between the four perspectives. The link between developing employee capabilities, leading to greater innovation, and improved built quality, and eventually to increases in productivity can be clearly seen in the strategy map.
A draft list of key performance measures for the Malaysian construction industry has been identified together with a clear association between the strategic thrusts and performance measures. Data for the 2006 base year was derived fiom various sources and have been presented here to serve as the basis for future comparisons.
REFERENCES
Bassioni, H.A., Price, A.D.F. and' Hassan, T.M. (2004) Performance measurement in construction, Journal of Management in Engineering, ASCE, 20(2), 42-50.
Beatham, S., Anumba, C., Thorpe, T. and Hedges, I. (2004) KPIs: A critical appraisal of their use in construction, Benchmarking, Vol. 11, No. 1,93-117.
Constructing Excellence (2007a) Key Performance Indicators KPI Management Tool, London. Constructing Excellence (2007b) UK Construction Consultants Key Performance Indicators 2007, London. Construction Industry Development Board (2007) Construction Industry Master Plan Malaysia 2006-2015, Kuala
Lumpur. Construction Industry Development Board (2008) Construction Quarterly Bulletin Third ~ua r t e r 2007, Kuala Lumpur. Costa, D.B., Formoso, C.T., Kagioglou, M., Alarcon, L.F. and Caldas, C.H. (2006) Benchmarking initiatives in the
construction industry: Lessons learned and improvement opportunities, Journal of Management in Engineering, ASCE, Vol. 22, No 4, 158-167.
Department of the Environment, Transport and the Regions (2000) KPI Report for the Minister for Construction - by the KPI Working Grotip dated January 2000, UK.
Department of Environment (1994) Constructing the Team: Final Report of the Government/lndustry Review of Procurement and Contractual Arrangements in the UK Constrtrction Industry, The Stationery Office.
Department of Statistics (2006) Survey of conshrcfion industries 2005, Malaysia, October 2006. Department of Statistics (2008) Laporan Penyiasatan Tenaga Burlib Separuh Tahun Pertama 2008 Malaysia, (in
Malay), 4(3), Malaysia Department of Trade and Indushy (1 998) Rethinking Conshictian: the report of the construction task force, London. Kagioglou, M., Cooper, R and Aouad, G. (2001) Performance management in construction: a conceptual framework,
Construction Management and Economics, 19,85-95. Kaplan, RS. and Norton, D.P. (1992) The Balanced Scorecard - Measures that drive performance, Harvard Business
Review, Vol. 70, No 1,71-79. Kaplan, RS. and Norton, D.P. (2004) Strategy Maps: Converting Intangible Assets into Tangible O~itcomes, Hatvard
Business School Press, First edition. Landi, A. and Nilsson, C-H. (2001) Do quality systems really make a difference? Building Research & Information,
Vol. 29, No. 1, 12-20. Lin, G. and Shen, Q. (2007) Measuring the performance of value management studies in construction: Critical review,
Journal afManagement in Engineering, ASCE, Vol. 23, No. 1,2-9. Mohamed, S. (2003) Scorecard approach to benchmarking organizational safety culture in conshuction, Journal of
Conslruction Engineering and Management, ASCE, Vol. 129, No. 1, 80-88. New Zealand Centre for Advanced Engineering (2007) The New Zealand Construction Indushy National Key
Performance Indicators -Handbook & Industry Measures 2006 Data, Christchurch, New Zealand. Niven, P.R (2006) Balanced scorecard step-by-step - Maximizing perfomance and maintaining results, Second
Edition, John Wiley and Sons, Inc., New Jersey. - ~ - - . .
4 2 6 I P a g e

Nudurupati, S., Arshad, T . and Turner, T . (2007) Perfommce measurement in the construction industry: An action case investigating manufacturing methodologies, Computers in Industry, Vol. 58,667-676.
Rankin, J., Fayek, A.R., Meade, G., Haas, C. and Manseau, A. (2008) Initial metrics and pilot program results for measuring the performance o f the Canadian construction industry, Canadian Journal of Civil Engineering, Vol. 35,894-907.
Swan, W . and Kyng, E. (2004) An Introduction to Key Performance Indicators, Centre for Construction Innovation. Takim, R, Akintoye, A and Kelly, J. (2003) Performance measurement systems in construction, In: Greenwood, D.J.
(Ed.), 19th Annual ARCOM Confience, 3-5 September 2003, University o f Brighton, Association o f Researchers in Construction Management, VoI. 1,423-432.
The Benchmark Centre for the Danish Construction Sector (BEC) (2006) Benchmarking Danish Construction, Copenhagen.
The Economic Planning Unit (2006) Ninth Malaysia Plan 2006-2010, Prime Minister's Departmen6 Putrajaya, Malaysia.
Yq I., Kim, K., Jung, Y . and Chin, S. (2007) Comparable performance measurement system for construction companies, Journal ofManagement in Engineering, ASCE, Vo1. 23, No. 3, 13 1-139.
Author's Biography ~ . . . . - ~ .. ~- .- ~ ~.
Hiap Poh Tln obtained her Master of Systems Engineering and Management from the Malaysia University of Science and Technology in 2008, and a Bachelor of Science (Physics)from the University of Malaya in 1998. She applied the Balanced Scorecard approach to develop aframework to measure the performance of the Malaysian construction industry as her research project and had the opportunity to work with the implementation team at the ClDB Headquarters on the Construction
- . , . , . : Industry Master Plan to assist in the development of key peformance indicators for the local industry. Poh Tin was previously a Project Engineer with a fire engineering company and is currently an Assistant Regisear at the Malaysia Universiy of Science and Technology.
Dr. Chan Toong M I I I O ~ is currently a Senior Lecturer at the Faculty of Architecture Building and Planning, The University of Melbourne, Australia He has over 10 years of design and management experience in engineering, construction, micro-electronics and environmental protection companies. : He wos trained as a civil andstruchdral engineer, holds a Bachelor of Engineering (Civil) degreefiom the Universiy of Malaya, Kuala Lumpur and a PhDfrom the Universiv oxcambridge, UK He has taught at the Nanyang Technological University, Singapore and at the Mahjsia University of Science and Technolagv. Malaysia. His research interest is in the area of construction management, specifically how the construction industry peforms and competes, both in the local andglobal context