– Ashith N. Kampani Sandeep Parekh – Dharmakirti...
24
Vol. IX • No. 2 • Apr - Jun 2013 ISSN 2320 – 1371 On Tax ‘Pass Through’ Status for Alternative Investment Funds Registered with SEBI – Ashith N. Kampani Sandeep Parekh India: What Lies Ahhead? – Dharmakirti Joshi Dietary Diversity: How important is it for Tackling India’s Double Burden of Malnutrition? – Mousumi Das Select Economic Indicators
Transcript of – Ashith N. Kampani Sandeep Parekh – Dharmakirti...
Vol. IX • No. 2 • Apr - Jun 2013
ISSN 2320 – 1371
On Tax ‘Pass Through’ Status for Alternative Investment Funds Registered with SEBI – Ashith N. Kampani Sandeep Parekh
India: What Lies Ahhead? – Dharmakirti Joshi
Dietary Diversity: How important is it for Tackling India’s Double Burden of Malnutrition? – Mousumi Das
Select Economic Indicators

Bombay Chamber of Commerce & Industry
The Bombay Chamber of Commerce and Industry is India’s premier Chamber of Commerce and Industry situated in Mumbai, the industrial, financial and commercial capital of India. Established in 1836, it is one of the oldest Chambers in the country and has a long and illustrious history of continuous service to trade and industry.
The Chamber can boast not only of its longevity but also of its impeccable lineage. With more than 4000 prime companies as its members, the Chamber represents the cream of Indian Industry, Commerce and Services. While the name ‘Bombay Chamber’ conjures images of an organization representing exclusively a city-based membership, in reality it represents a wide spectrum of highly reputed and professionally run companies which are based in the city of Mumbai, but whose manufacturing facilities and commercial influence spread not only all over India but also internationally.
The Chamber uniquely represents large and medium sized Corporations, Banking and Financial Institutions, professional Consulting Companies and a large number of Multinationals. It comes as no surprise that today the Bombay Chamber’s membership represents as much as a third of the country’s GDP in the manufacturing and service sectors.
Bombay Chamber of Commerce and IndustryMackinnon Mackenzie Building, Ballard Estate, Mumbai 400 001
Tel: 91-22-4910 0200E-mail: [email protected]: www.bombaychamber.com

1
AnAlytique • Vol. IX • No. 2 • April - June 2013
From the Editor’s Desk
Published and Printed by Vikas Gadre, Bombay Chamber of Commerce & Industry Trust for Economic and Management Studies, Mackinnon Mackenzie Building, Ballard Estate, Mumbai 400 001 • Tel.: 91-22-49100200 • Email: [email protected]
Contents
Editorial BoardVikas Gadre
Sugeeta Upadhyay
Disclaimer - The articles published in do not necessarily reflect the
views of the Bombay Chamber of Commerce and Industry Trust for Economic and Management Studies.
Printed at Uchitha Graphic Printers Pvt. Ltd.
As we go to the press with the second quarter issue of Analytique, we all do agree that Growth is desirable to enhance the welfare and has been considered as the need of the hour but the process of growth is as important as the growth number itself. We are aware of the fact that the finest India economists are debating among themselves on important issues like what India’s governance priorities should be. Whether in medium and long run India should invest more in its social sector to boost the productivity of its people and thereby raise growth, or alternatively the nation should focus on growth first.
Investing in health and education to improve human capabilities is central to Development Economies and gained momentum since past several decades. Without such investments, inequality will widen and the growth process itself will falter. But there exists counter argument, equally important , in the literature.The argument asserts Growth may raise inequality initially but sustained growth will eventually raise enough resources for the state to invest in social sector schemes and mitigate the effects of the initial inequality. Hence Growth should be given priority !
The battle between these two ideologies question the views of the public schemes launched by the Congress-led United Progressive Alliance government and the so called Gujarat model.To the citizen of India, it is easy to believe that the poverty among lower castes and agricultural labourers fell faster in the period between 2004-05 and 2009-10 than before due to the government’s redistributive efforts. But further research argues the faster decline in poverty in the past few years compared to the earlier years in the period following economic liberalization was primarily due to the ‘pull’ effect of growth and higher growth and consequent increases in construction wages had a greater role in driving up farm wages in recent years than the government-sponsored right to employment law, operational in rural areas.
It is in this current context, the present issue has tried to understand some specific public policies including Alternative Investment Funds and National Food Security Bill among others by questioning some
prevalent views with the end objective of to provide some insights on its implication aspects. Evidently, the last word on
what works best in India has not been said yet.
Vol. IX • No. 2 • April-June 2013
Special Theme On Tax ‘Pass Through’
Status for Alternative Investment Funds Registered with SEBI – Ashith N. Kampani Sandeep Parekh 02
Current Affairs
India: What Lies Ahead? – Dharmakirti Joshi 08
Dietary Diversity: How important is it for Tackling India’s Double Burden of Malnutrition? – Mousumi Das 11
Select Economic Indicators 16
ISSN 2320 – 1371
2
AnAlytique • Vol. IX • No. 2 • April - June 2013
Executive Summary
SEBI had notified regulations on alternative investment funds (AIF) in May, 2012. The intent behind the regulations was to create a mechanism where regulatory framework is available for all shades of private pool of capital or investment vehicles so that such funds are channelized in the desired space in a regulated manner. The regulations created three categories of registrations for all private pools of capital. Category-I AIF consists of venture capital funds, SME funds, infrastructure funds and social venture funds. Category-II AIF consists of private equity funds, debt funds and Category-III AIF are in the nature of domestic hedge fund structures. Currently the automatic tax pass through status is restricted to a sub-category of Category I AIF (Venture Capital Funds or VCFs) whereas the rest of the AIFs (mentioned above) are not accorded such a status. Since the earlier unregulated categories are now brought within the ambit of SEBI’s supervision under AIF Regulations, they should be accorded the same tax pass through treatment. The tax pass through status ensures that the income is exempt at the fund level
and only taxable in the hands of the investors. Hence there is a single level of taxation, simplicity and certainty.
In order to achieve tax pass through status for AIFs (other than VCFs), the industry relies on principles of trust taxation (as vast majority of the funds are set up as trusts). If a trust qualifies to be a determinate and non-discretionary trust (if the beneficiaries and their shares are identified in the trust deed) then a tax pass through status can be achieved. This is based on judicial and other rulings interpreting a 130 year old trust law which was never meant for these funds. This results in lot of ambiguity as a different view can be taken by a tax officers. In this backdrop, there is a clear disparity in the treatment accorded between VCFs and all other categories of AIFs. Income of other domestic institutional investors like mutual funds is also exempt from tax and foreign investors like FIIs enjoy tax free capital gains income under the provisions of DTAAs. Hence, the fund industry needs a clear and certain tax pass through status for all AIFs registered with SEBI. This will also ensure a level playing field amongst different categories of domestic and foreign
On Tax ‘Pass Through’ Status for Alternative Investment Funds registered with SEBIAshith N. Kampani and Sandeep Parekh*
Ashith N. Kampani is Partner, CosmicMandala15 Financial Advisors. He can be reached at - [email protected]
Sandeep Parekh is Founder of Finsec Law. He can be reached at - [email protected]
Spec
ial T
hem
eO
n Ta
x ‘P
ass
Thro
ugh’
Sta
tus
for A
ltern
ativ
e In
vest
men
t Fun
ds r
egis
tere
d w
ith S
EB
I
3
AnAlytique • Vol. IX • No. 2 • April - June 2013
On
Tax
‘Pas
s Th
roug
h’ S
tatu
s fo
r Alte
rnat
ive
Inve
stm
ent F
unds
reg
iste
red
with
SE
BI
investors. This would be revenue neutral as the investors in the AIF would be taxable as per the individual tax rates. Given greater tax certainty, such reform would result in more AIFs being set up and result in more investments. Besides tax neutrality, this would increase investment in the productive economy substantially and thus substantially increase foreign investments, supervision of a high quality growth (private equity often hand holds investee companies) and a net increase in tax. Category III AIFs (which invest in listed equity and derivatives) have the most adverse tax treatment. Under current tax treatment, the entire income of the Fund (even gains arising from long term and short term disposal of listed securities on which STT is paid) would be taxed at maximum marginal rate (over 30%). This creates a huge disincentive for investors to invest in a Category III AIF, because if they were to invest directly in the listed equity space they would end up paying 0% tax (subject to STT and 1 year holding). Tax pass through status to Category III AIFs can increase depth in the Indian equity markets, reduce cost of capital for listed companies, increase economic activity and reduce overreliance on offshore foreign investment (who pay no capital gains tax).
Summary of benefits of pass through status
• Fund investors continue to pay taxes
• More certainty for investors• More economic activity• More liquidity on the exchanges
• Tax neutral in short term• Tax positive in long term – directly
and indirectly• Develops fund industry• More active domestic private
equity market means companies get more hand holding
• Reduces tax non-parity with foreign investors
• Investment climate improvement• Reliance on interpretation of trust
law unnecessary
Background
The Securities and Exchange Board of India (SEBI) notified norms for regulating alternative investment funds (AIFs) under the SEBI (AIF) Regulations, 2012 (AIF Regulations) on May 21, 2012. SEBI under AIF Regulations has created three categories of registrations. Category-I AIF consists of those funds that are likely to have positive effects on the economy as they invest in start-ups or early stage ventures or other socially/economically desirable sectors. The category consists of venture capital funds, SME funds, infrastructure funds and social venture funds. Category-I AIFs are subject to investment restrictions and, at the same time, would also avail the benefits of certain takeover and IPO lock-in norms, which the other two categories would not have. Category-II AIF consists of private equity funds, debt funds, etc. for which no specific incentives/concessions are required (also not subject to investment restrictions of the likes of Category-I) and consist of residual category of funds that do
4
AnAlytique • Vol. IX • No. 2 • April - June 2013
not classify either as a Category-I or Category-III AIFs. Category-III AIFs are in the nature of domestic hedge fund structures, which could have leverage and can invest in the listed equity space. Accordingly, additional reporting and other regulatory burdens have been imposed on them.
In a nutshell, the key departure under the AIF regulations from the now repealed SEBI Venture Capital Regulations (which applied only to registered venture capital funds), is that registration as an AIF is broadly mandatory for all private pools of capital raising money from investors. Previously, registration as a VCF was optional and, if registered, the entity would have to comply with several investment restrictions but at the same time would also avail of benefits under tax, takeover and IPO laws.
Tax Position
Prior to 2007, venture capital funds that were registered with SEBI under the SEBI VCF Regulations were provided a tax pass-through benefit on their income that arose from investments in any venture capital undertaking. Under Section 10 (23FB) read with Section
115U of the Indian Income Tax Act, 1961 (“ITA”), the income of a venture capital fund earned from its investment in any venture capital undertaking was exempt from tax in the hands of the fund and was only taxable in the hands of the investors of the fund due to the tax pass through status. This ensured that there was a single level of taxation and more tax certainty for
the investors. In 2007, the ITA was amended and this tax “pass-through” benefit was restricted only to income from venture capital undertakings that operated in nine specified sectors. However, the Finance Bill, 2012 once again reverted to the pre-2007 position by extending this tax “pass-through” benefit to income of a venture capital fund arising from investment in any venture capital undertaking, regardless of the sector in which the venture capital undertaking operates.
It was expected that this benefit would be extended to the newly coined AIFs (which replaced VCFs) as well. This also appeared to be SEBI’s intent, as gathered from SEBI’s earlier draft paper on AIFs which specified that, “SEBI may represent that similar provision for tax pass through may be provided for AIFs once the VCF Regulations are repealed and the AIF Regulations are notified.”
Budget 2013 - Tax “pass through” benefit available only to VCFs under Category I AIFs
Regulation 3(4)(a) of the AIF Regulation has an explanation which states that Category I AIFs shall be treated as venture capital funds for the purpose of Section 10 (23FB) of the ITA. However, prior to the Budget, 2013-14, it was expected that there will be amendments in the ITA so as to make all the Categories of AIFs a pass through entity similar to VCFs. However, contrary to the expectations, the Finance Bill, 2013 extended a tax pass through status only to a VCF registered as a sub category of a Category I AIF under the AIF Regulations and a VCF registered O
n Ta
x ‘P
ass
Thro
ugh’
Sta
tus
for A
ltern
ativ
e In
vest
men
t Fun
ds r
egis
tere
d w
ith S
EB
I
5
AnAlytique • Vol. IX • No. 2 • April - June 2013
under the erstwhile SEBI VCF Regulations. No other tax provisions are made for AIFs (other than VCFs) which is discouraging for the fund industry and the part of the economy which seeks capital from the industry (potentially the entire small and medium enterprise units).
Trust Taxation and Ambiguity
The existing tax position is that the income from Category I AIFs (other than VCFs), Category II and III AIFs will not be exempt under section 10 (23FB) of the ITA, and there are no specific provisions in the ITA for such AIFs. Taxation of such funds would depend on the legal status of the fund i.e. company, limited liability partnership or trust. If the Fund is set-up as a company or LLP, then the general tax principles as applicable to a company or LLP would apply to such funds as well. However, if these Funds are set-up as a trust (which happens in a vast majority of cases), then such Funds will be taxed as per the principles of trust taxation. The income of a trust would be subject to tax as per the provisions of sections 161 to 164 of the ITA. For a trust to be taxed under these sections, there are certain tests to be satisfied viz. the trust has to be a determinate trust and non-discretionary in nature. As per explanation 1 to the section 164 of the ITA, the trust shall be considered a ‘determinate trust’, if the names of the beneficiaries are specified in the trust deed and the individual share of the beneficiaries are ascertainable on the date of the trust deed. As per section 164(1), if the trust does not
satisfy the above test of determinacy, then the income of trust would be chargeable to Maximum Marginal Rate (MMR), subject to certain exceptions as laid down in the section. However, if the trust satisfies the test, then the trust will be treated as pass through. Such tax regime creates a lot of tax uncertainty, as the names of the beneficiaries cannot be identified on the date of the execution of the trust deed – investors to the fund are found subsequently. Given this difficulty of funds to identify the beneficiaries on the date of the trust deed, tax experts rely on various rulings (especially the AIG advance ruling, 1997 224 ITR 473 AAR) to give comfort of tax pass through status for the investors. But the experts always qualify their opinions of the nature of pass through with a possibly different view which can be taken by a tax officer after several years. No fund manager would like the sword of a tax liability on his head for income generated for his investor and distributed to the investor, thus the uncertainty has the adverse effect of stunting the growth of the domestic fund industry. Purely foreign funds do not face similar issues.
Recommendations
I. In this backdrop, a major issue for the fund industry has been the lack of a long-term, clear tax policy from the Government. There is a clear disparity in the treatment accorded inter-se between the three categories of AIFs and also between VCF as a sub-category under Category I AIF and the other 3 sub- O
n Ta
x ‘P
ass
Thro
ugh’
Sta
tus
for A
ltern
ativ
e In
vest
men
t Fun
ds r
egis
tere
d w
ith S
EB
I

6
AnAlytique • Vol. IX • No. 2 • April - June 2013
categories within Category I AIF. Income of other domestic institutional investors like mutual funds is also exempt from tax under the ITA. Foreign investors like FIIs enjoy tax free capital gains income under the provisions of Double Taxation Avoidance Agreements (DTAAs). Hence, it is requested that all Funds registered with SEBI (and not only VCFs) under the AIF Regulations should be eligible for tax pass through as specified under section 10(23FB) of ITA read with section 115U. This will ensure a level playing field amongst different categories of domestic and foreign institutional players and will be in the interest of the end investors due to increased competition, more liquidity and better price discovery. The high net worth domestic investors will have a greater incentive to invest their money in AIFs, as an alternative to investing in gold and real estate, which has been one of the biggest worries for the Finance Ministry.
This would be revenue neutral as the investors in the AIF would be taxable as per the tax rates individually applicable to them. In other words tax pass through does not reduce revenues, rather it increases certainty for all concerned – the fund manager and the investor.
II. According tax pass through status across all categories of AIFs will in turn improve the quality
and quantity of capital available to various entities in search of capital in the Indian markets and also increase the employment opportunities. We believe that such reform would make a perceptible difference in the governance of investee companies as well, as they get not just capital but would get other improvements in innovation and governance also which the private equity and venture capital industry is famous for across the globe. This would bring a marked improvement in the Indian economy at large and would create increase in tax inflows from the medium to the long term and help reduce the fiscal deficit and improve growth.
III. Currently, automatic tax pass through status is restricted to the Venture Capital Funds as a sub-category of Category I AIF whereas the rest of the sub-categories like the SME Fund, Social Venture Fund, Infrastructure Fund under Category I and the other 2 categories viz. Category II and Category III AIFs i.e., broadly the PE and hedge funds are not accorded such a status. Since these earlier unregulated categories are now brought within the ambit of SEBI’s supervision under AIF Regulations, they should be accorded the same tax pass through treatment.
We believe that an assured pass through status rather than reliance on an AAR ruling (AIG advance ruling, 1997 224 ITR O
n Ta
x ‘P
ass
Thro
ugh’
Sta
tus
for A
ltern
ativ
e In
vest
men
t Fun
ds r
egis
tere
d w
ith S
EB
I

7
AnAlytique • Vol. IX • No. 2 • April - June 2013
473 AAR) for the determinate status is the need of the hour. This would still create taxation at one level and therefore would be broadly revenue neutral. In contrast, any uncertainty which is resultant from whether or not the trust pays the tax or whether the investor pays the tax is an unnecessary cost and stunts the funds industry and the capital starved SME sector.
IV. The Category III AIF’s, with investment strategies of investing in listed equity are worst hit in absence of an automatic tax pass through status. Unless the Fund qualifies as a determinate trust (which in all likelihood is not going to be the case in view of the open ended structure, trading strategies etc.), the entire income of the Fund (even gains arising from long term and short term disposal of listed securities on which STT is paid) would be taxed at maximum marginal rate, which an investor in such Category III Fund would have otherwise not incurred had he invested directly in such securities. An individual investing in listed equities and holding for over a year pays no capital gains tax (subject to STT). This creates a huge disincentive for investors to invest in a Category III AIF as the trust taxation is not likely to offer a determinate status because of the manner in which such funds are structured. Hence, in absence of an automatic tax
pass through status, the investors would unnecessarily suffer the highest tax. In absence of a tax pass through status for Category III AIFs, the model itself is likely to fail. This would in turn restrict the growth of equity markets which otherwise would have benefited from the depth which Category III Funds would have provided. Similarly placed purely foreign funds by contrast would pay no capital gains tax for investment in listed equity.
According tax pass through status to Category III AIFs can actually result in development of an Indian hedge fund industry which may decrease the over reliance on offshore FII entities and hence can also help in reducing the volatility in Indian markets. Also, a tax pass through status for Category III AIFs may result in greater foreign inflows in Category III AIFs for making investments in Indian stock markets and hence boost the domestic hedge fund industry. This would be more advantageous than a situation wherein such money is deployed by the foreign investors in FII/Sub-Accounts, which in turn invest in Indian stock markets. Increase in Government tax income due to increase in STT collection and short term capital gains tax on investment in listed securities will also help in addressing the mounting fiscal deficit.
On
Tax
‘Pas
s Th
roug
h’ S
tatu
s fo
r Alte
rnat
ive
Inve
stm
ent F
unds
reg
iste
red
with
SE
BI
J
8
AnAlytique • Vol. IX • No. 2 • April - June 2013
We have indeed come a long way. No, I am not referring to India’s achievement of attaining near 9 per cent growth in the pre-Lehman crisis period. Nor am I talking about the swift recovery from the 2009 crisis, when growth went up again to 8.6 per cent and 9.3 per cent in 2009-10 and 2010-11, respectively. On the contrary, I am referring to the current slump in the economy and the trimmed down prospects. Today, achieving 6 per cent GDP growth in 2013-14 (over a 10 year low growth of 5 per cent in 2012-13) is widely being perceived as a challenge. This would have been regarded as severe under-performance just a few years ago, when the Indian economy was roaring at near 9 per cent.
Not only has growth slowed down, the balance of payments problems too have compounded. A rising current account deficit has made us extremely vulnerable to global risk appetite and liquidity, as reflected by the recent sharp drop in the value of the domestic currency against the US dollar. Inflation, though down, is clearly not out. While the WPI inflation has fallen below 5 per cent, consumer prices continue to rise at a nearly double-digit rate. The plunge in the rupee has
India: What Lies Ahead?Dharmakirti Joshi*
* Dharmakirti Joshi is Chief Economist at CRISIL Ltd. He can be reached at - [email protected]
wiped out the gains arising from low global crude and commodity prices. With weak rupee and rising domestic administered prices (electricity, diesel), WPI inflation too can rise. Therefore, despite the decline in both CPI and WPI inflation, we do not expect the Reserve Bank of India to cut interest rates sharply, as it wants to bring down inflation to below 5 per cent levels on a sustainable basis.
The other major worries are a sharp slowdown in the manufacturing sector and services sector growth. Private corporate investments, which were a key driver of growth in the pre-crisis boom, are languishing. The share of private corporate sector investment in GDP has fallen to around 11 per cent in 2011-12 from over 17 per cent in 2007-08. Recently released employment data too presents a depressing picture, particularly in the manufacturing sector. According to the data, employment in the manufacturing sector increased by just 4.4 million between 2004-05 and 2011-12 even though the economy had grown at a historically high rate of 8.6 per cent per year during this period. The situation will deteriorate if the slowdown worsens.
Cur
rent
Aff
airs
Indi
a: W
hat l
ies
ahea
d?

9
AnAlytique • Vol. IX • No. 2 • April - June 2013
So where are we headed?
Not much improvement is expected on the growth front in the short run, and medium term expectations too have been revised downwards. The International Monetary Fund, for instance, has scaled down its Indian economy growth outlook to 5.7 per cent in 2013 6.5 per cent per year over the medium run (2013 to 2017). Here, I must point out that anticipating the growth turnaround and its speed is a daunting task, particularly in today’s uncertain environment. Growth forecasts are heavily influenced by the macroeconomic environment prevailing at the time when the forecasts are made. We typically overestimate the growth potential during an upturn and underestimate it during a downturn. So the depressed macroeconomic environment that we face today can explain part of the pessimism that is reflected in the forecasts of both domestic and foreign forecasters. India’s slowdown and muted outlook can partly be attributed to a weak global environment. In an increasingly interconnected world, this is bound to happen. But the present slowdown in the economy is largely the result of homegrown issues. Until these challenges are addressed, nothing short of a miracle can take and sustain India’s growth to the pre-crisis growth rate of 9 per cent.
The situation today is fundamentally different from the early 2000s as well as during the aftermath of the global crisis, for two reasons. Firstly, although the tail risks have reduced in Europe
and the US outlook has improved somewhat, global factors are still far from favourable. By contrast, the global economy was booming during the mid-2000s. Secondly, the growth upturn during 2004-2008 was led by private investments, which were expanding at over 40 per cent per year in nominal terms and 33 per cent per year in real terms. But nominal private corporate investments fell by 13 per cent in 2011-12 and CRISIL expects them to fall by another 35 per cent in 2012-13. We do not anticipate any noteworthy upturn in investments in 2013-14 too, as the private investment pipeline has been impaired and will recover only when a favourable investment climate is recreated and maintained. Unlike 2009-10 and 2010-11, there is also no leeway with fiscal policy to directly support growth via increased spending. On the contrary, deficit control involves tough decisions on the expenditure front.
We expect India’s GDP growth to pick up to 6 per cent in 2013-14 from 5 per cent in 2012-13. But the recovery would be fragile and hinges critically on a normal monsoon. So far, the signs are good on the progress of rains. But if the monsoons falter in July and August, resulting in weak/no growth in agriculture, then GDP may grow by only around 5.1 per cent. Two more factors could drive growth - some reduction in interest rates, and rural-oriented government spending on the eve of elections. But election spending is a one-off factor and cannot influence growth beyond the current fiscal. Durability of interest rate reductions,
Indi
a: W
hat l
ies
ahea
d?
10
AnAlytique • Vol. IX • No. 2 • April - June 2013
meanwhile, would depend on the inflation trajectory.
Economic recovery, and its pace beyond 2013-14, will depend on the revival of private corporate investment. We do not foresee an investment revival in 2013-14. This view is shaped by continued policy-related issues impacting the implementation of ongoing projects, fewer project announcements and funding challenges
in the infrastructure sector due to leveraged balance sheets. Some quick wins can be achieved by sorting out mining issues and clearing the delayed projects. But raising India’s growth potential will require fundamental reforms such as Good and Services Tax, transparent and predictable land acquisition and taxation policies, provision of labour market flexibility and resolving governance issues.
Indi
a: W
hat l
ies
ahea
d?
J
Cur
rent
Aff
airs
Notes for Contributors•ANALYTIQUE welcomes original articles or essays on any subject of
interest related to commerce and industry such as macro economy, industrial performance, international trade, banking and finance, etc.
•Contributions must be no more than 4,000 words, including notes andreferences.Andmust be accompanied by an abstract of amaximumof 150words in MS word. Tables, Graphs should be in MS Excel format.
•Contributionshouldnothavebeensimultaneouslysubmittedforpublicationto another Journal.
• Authors are requested to provide full details for correspondence: postaladdress, day-time phone numbers and e-mail address for our records. Only author’s affiliation and e-mail address will be published along with the articles unless otherwise directed.
11
AnAlytique • Vol. IX • No. 2 • April - June 2013
Die
tary
Div
ersi
ty: H
ow im
porta
nt is
it fo
r ta
cklin
g In
dia’
s do
uble
bur
den
of m
alnu
tritio
n?
Abstract
Consumption pattern of households in India have changed over time in favor of costlier and nutrient rich food items without any improvement in nutritional status. In fact the country at present is witnessing nutrition transition and the double burden of malnutrition: both under nutrition and obesity, and presence of nutritionally-related chronic diseases. So the question is whether focus on only consumption of cereals is enough while solving the problem of food insecurity. In this context we conducted a short survey to understand the common man’s perception of food security. Based on studies and discussion we conclude that promotion of dietary diversity can be an important strategy to tackle food insecurity and double burden of malnutrition.
Introduction
While the entire nation is obsessed with the implementation of the National Food Security Bill, the costs involved and political gains, little attention seems to be paid to the issue of dietary transition in India and the consumption of a diverse
Dietary Diversity: How important is it for Tackling India’s Double Burden of Malnutrition?Mousumi Das
diet. The National Food Security Bill is all set to become an Act and give legal entitlement to the citizens of the country to food grains. It aims to correct distortions in the existing food distribution system and eradicate malnutrition given the limitations and challenges it faces. However, the Bill simply focuses on cereal consumption and entitlement while other developed and developing countries worry about dietary diversity.
Our body requires the intake of different types of macro and micronutrients for physical growth and development of cognitive ability. Individuals lacking these essential nutrients are prone to deficiency diseases. Consuming a diversified diet ensures intake of different nutrients. Monotonous diets have serious nutritional implications and lead to chronic diseases. This relationship has been established in many epidemiological studies (Cornia, 1994; Hatloy, 1998). Lack of micro nutrients has led to the problem of “hidden hunger”1. In developing countries micronutrient deficiency due to lack of iron, vitamin B12, folate and vitamin A
Cur
rent
Aff
airs
Mousumi Das is research scholar at Indira Gandhi Institute of Development Research (IGIDR), Mumbai. She can be reached at - [email protected]

12
AnAlytique • Vol. IX • No. 2 • April - June 2013
Die
tary
Div
ersi
ty: H
ow im
porta
nt is
it fo
r ta
cklin
g In
dia’
s do
uble
bur
den
of m
alnu
tritio
n?
has been on rise. The reason for this deficiency can be that the individual is not consuming a diversified diet.
Empirical studies show that calorie intake in India has fallen overtime (Deaton and Dreze, 2001; Patnaik, 2004, 2007; Meenakshi and Viswanathan, 2005;Suryanaryana, 1995, 2009).However, this has not led to any serious deterioration in the health status of the population. This shows that calorie intake is neither a binding constraint, nor a comprehensive indicator of food security. However calorie intake has generally been used as an indicator of food security in India. Dietary diversity is an important indicator of food security. It gives an overall assessment of the nutritional intake of an individual. For instance, U.S. Department of Agriculture (USDA) promotes the concept of dietary diversity by popularizing what is called MyPlate. Food items belonging to the five food groups is depicted in a colorful and easy to learn way. The tool called Super Tracker helps to calculate on a daily basis the amount of nutrients consumed and shortfall depending on the level of physical activity. However for Indians such resources do exist but has very little focus and publicity by the relevant authorities to make the “unawares” aware of it.
We conducted a short survey to find out what is the common man’s perception of food security; interviewing people from different backgrounds a la “What did you eat yesterday?” of The New York Times.
We followed up with 20 people from different sections of the society. We asked questions like what they ate the previous day, whether they consume a diversified diet or not, what do they mean by food security, and about the Right to Food Act.
Food security has a different meaning for each. For some diversity matters: eating a diversified diet in larger quantities makes them contended. For others hygiene matters: getting to eat homemade food cooked in hygienic conditions is more important. For another subset, tastes and preferences, and not nutrition matter: irrespective of the nutritional content getting to eat what one likes the most like sweets, and special dishes would leave them more satisfied. Some of them are unaware of the fact that eating a diverse set of unhealthy food items is harmful even though their level of satisfaction is the highest. Even people from the well-off sections are too busy to eat a diverse diet and land up eating at fast food joints, which has a negative impact on their health status. Poor people seem to be aware of the Right to Food Act (better off households are not worried about it), yet getting a ration card seems to be a dream for many, despite possessing a valid identification proof (Aadhar cards do intend to take care of some of these leakages and inefficiencies).While some wanted access to PDS others shunned it due to the poor quality of food grains. Eating a wholesome and diverse diet everyday is still a dream for many. In an era of food inflation, limited access and availability, and time
13
AnAlytique • Vol. IX • No. 2 • April - June 2013
Die
tary
Div
ersi
ty: H
ow im
porta
nt is
it fo
r ta
cklin
g In
dia’
s do
uble
bur
den
of m
alnu
tritio
n?
constraint, nutrition is no longer an overriding pursuit. This has an adverse impact on the health status of an individual.
Conclusion
Tackling malnutrition is not only focusing on the quantity of cereals but the nutritional quality of food items consumed (CGIAR, 2013).However the National Food Security Bill focuses mostly on the quantity aspect. It should not ensure the creation of perpetual beggars dependent on cereals. Consumption of a diverse diet is important for both children and adults. Also intake of food is as important as its absorption, which is dependent on factors like safe drinking water, sanitation, health services, and proper breastfeeding for infants. In fact it is this lack of focus on inculcating proper dietary habits, urbanization and lifestyle changes that is leading to a nutrition transition with the prevalence of both high rates of malnutrition and obesity and other micronutrient deficiency and non-communicable diseases (Gaiha et al, 2013; Misra et al, 2011; Shetty, 2002).It is not expected that one Bill can by itself solve all the problems, but the focus on consumption of cereals is inadequate. From our survey we find that the common man’s perception of food security is as diverse as the basket of food items that he wants to consume. Some respondents are aware of a proper balanced diet comprising of all food groups. Some others perceive consumption of sweets or non-vegetarian food items as a balanced diet. Thus, we find that
there is a serious lack of awareness on what composites a balanced diet and awareness of the same is required. Dietary diversity can act as an important and effective strategy to tackle the problem of food insecurity and double burden of malnutrition.(The author would sincerely like to thank M.H. Suryanarayana, S. Chandrasekhar and Sudha Narayanan. The views expressed in this paper are the author’s only.)
End Notes
1. It is a measure of the number of different food items or groups con-sumed over a given reference period (Ruel, 2002). Also see Gaiha (2012), Hoddinott and Yohannes (2002), Khera (2011), Pingali and Khwaja (2004) and Suryanarayana (2013) for a discussion on dietary diversity in the Indian context.
2. Hidden hunger is not due to lack of food. It is due to the chronic lack of vitamins and minerals, and peo-ple are not aware of it even if they are suffering as there are no visible warning signals. Hidden hunger has disastrous effects and can lead to mental impairment, poor health and productivity, or even death. Ev-ery one out of three children suffers from hidden hunger (Source: http://www.micronutrient.org).
3. http://www.who.int/nutrition/topics/ida/en/index.html
4. According to the NFHS survey con-ducted in 2005-06: 79 percent of children in the age group of 6-35 months had anemia; 40 percent of the children were underweight; 36 percent of women and 34 percent of

14
AnAlytique • Vol. IX • No. 2 • April - June 2013
Die
tary
Div
ersi
ty: H
ow im
porta
nt is
it fo
r ta
cklin
g In
dia’
s do
uble
bur
den
of m
alnu
tritio
n?
men in the age group of 15-49 years were underweight; obesity rates were higher for women at 13 percent than for men (9 percent); 55 percent of women suffered from anemia as compared to 24 percent of men.
5. (Source: http://202.71.128.172/nihfw/nchrc/sites/default/files/Nu-trition%20in%20India%20Nation-al%20Family%20Health%20Sur-vey%20NFHS%203%20India%202005%2006-824_0.pdf)
6. See: http://www.choosemyplate.gov/
7. For details on the Indian Food Pyra-mid see: http://www.foodpyramidin-dia.org/
8. h t t p : / / i n d i a . b l o g s . n y t i m e s .com/2012/06/08/india-what-did-you-eat-yesterday/
9. References
10. Consultative Group of International Agricultural Research (CGIAR) (2013): “Tackling malnutrition means quality as well as quantity”, available online at: http://www.c g i a r. o r g / c o n s o r t i u m - n e w s /tackling-malnutrition-means-quality-as-well-as-quantity/
11. Cornia, G. A.(1994):Poverty, Food Consumption, and Nutrition During the Transition to the Market Economy in Eastern Europe, The American Economic Review , vol. 84(2), Papers and Proceedings of the Hundred and Sixth Annual Meeting of the American Economic Association
(May, 1994), pp. 297-302.
12. Hoddinott, J., and Y. Yohannes (2002): Dietary diversity as a food security indicator. Washington, D.C.: Food and Nutrition Technical Assistance, Academy for Educational Development.
13. Hatløy, A., L. E. Torheim, and A. Oshaug (1998): “Food variety-A good indicator of nutritional adequacy of the diet? A case study from an urban area in Mali, West Africa”, European Journal of Clinical Nutrition, vol 52 (12): pp. 891-898.
14. Deaton, A., and J. Dreze (2009): “Food and Nutrition in India: Facts and Interpretation”, Economic and Political Weekly, vol XLIV (7), pp. 42-65.
15. Gaiha, R., R. Jha, and V. S. Kulkarni (2013): “How Pervasive is Eating Out in India?”, Journal of Asian and African Studies 0021909612472040, first published on January 3, 2013 doi: 10.1177/0021909612472040.
16. Gaiha, R., Nidhi Kaicker, Katsushi Imai, Vani S. Kulkarni and Ganesh Thapa(2012):”Has Dietary Transition Slowed Down in India: An analysis based on 50th, 61st and 66th Rounds of NSS,”ASARC Working Papers 2012-07, The Australian National University, Australia South Asia Research Centre.
17. Khera, Reetika (2011): “Revival of the Public Distribution System: Evidence and Explanations”,
15
AnAlytique • Vol. IX • No. 2 • April - June 2013
Die
tary
Div
ersi
ty: H
ow im
porta
nt is
it fo
r ta
cklin
g In
dia’
s do
uble
bur
den
of m
alnu
tritio
n?
J
Economic and Political Weekly, vol XLVI (44/ 45), pp. 36-50.
18. Meenakshi, J V and B. Viswanathan (2005): “Calorie Deprivation in Rural India between 1983 and 1999-2000” in Angus Deaton and Valerie Kozel (ed.), The Great Indian Poverty Debate (New Delhi: Macmillan), pp 570-83.
19. Misra, A., Singhal, N., Sivakumar, B., Bhagat, N., Jaiswal, A. and Khurana, L. (2011): “Nutrition transition in India: Secular trends in dietary intake and their relationship to diet-related non-communicable diseases”, Journal of Diabetes, vol 3, pp 278–292.
20. Patnaik, U. (2004): “The Republic of Hunger”, Social Scientist, vol 32(9/10), pp. 9-35.
21. – (2007): “Neoliberalism and Rural Poverty in India”, Economic and Political Weekly, vol 42(30), pp. 3132-50.
22. Pingali,P. and Y. Khwaja(2004):”Globalization of Indian Diets and the Transformation of Food Supply Systems,” Working Papers 04-05, Agricultural and Development Economics Division of the Food and Agriculture Organization of the United Nations (FAO - ESA).
23. Ruel, M. T. (2002): “Is Dietary Diversity an Indicator of Food
Security or Dietary Quality? A Review of Measurement Issues and Research Needs”, Discussion Paper, Food Consumption and Nutrition Division, International Food Policy Research Institute.
24. Shetty, P.S. (2002): “Nutrition transition in India”, Public Health and Nutrition, vol 5 (1A), pp. 175–182.
25. Suryanarayana, M .H. (1995): “Growth, Poverty and Levels of Living: Hypotheses, Methods and Policies”, Journal of Indian School of Political Economy, vol. VII (2), pp. 203-255.
26. Suryanarayana, M.H. (2009): Nutritional Norms for Poverty: Issues and Implications. Concept paper prepared for the Expert Group to Review the Methodology for Estimation of Poverty (available online at: http://www.planningcommission.gov.in/reports/genrep/surya.pdf on April 9, 2013).
27. Suryanarayana (2013): “The Pursuit of Food Security in India: Policies sans Concept and Commitment?”, The International Policy Centre for Inclusive Growth, One Pager No. 207,Poverty Practice, Bureau for Development Policy, UNDP, Brazil(available online at: http://www.ipc-undp.org/pub/IPCOnePager207.pdf)
16
AnAlytique • Vol. IX • No. 2 • April - June 2013
Sel
ect E
cono
mic
Indi
cato
rs
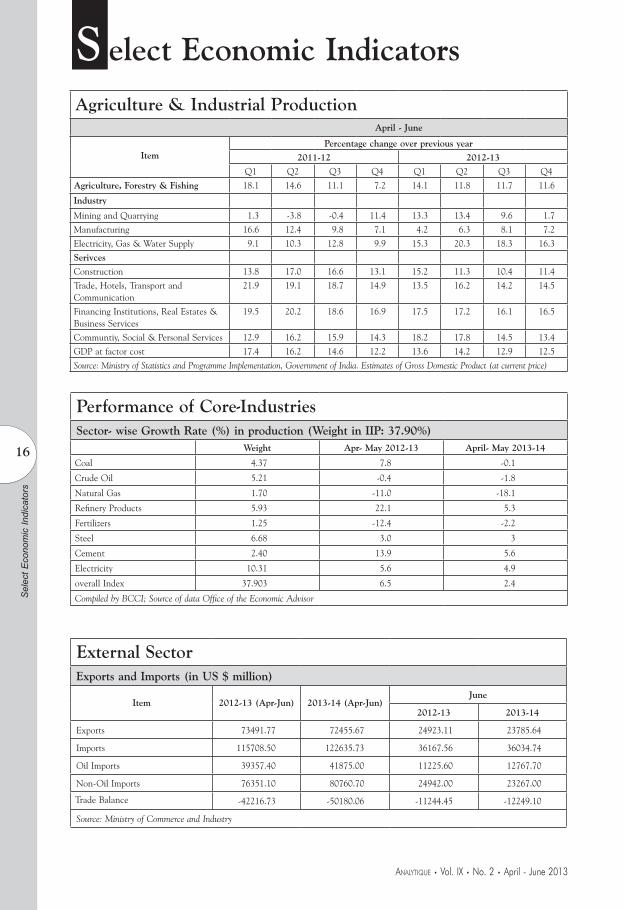
S elect Economic Indicators
Agriculture & Industrial ProductionApril - June
Item
Percentage change over previous year
2011-12 2012-13
Q1 Q2 Q3 Q4 Q1 Q2 Q3 Q4
Agriculture, Forestry & Fishing 18.1 14.6 11.1 7.2 14.1 11.8 11.7 11.6
Industry
Mining and Quarrying 1.3 -3.8 -0.4 11.4 13.3 13.4 9.6 1.7
Manufacturing 16.6 12.4 9.8 7.1 4.2 6.3 8.1 7.2
Electricity, Gas & Water Supply 9.1 10.3 12.8 9.9 15.3 20.3 18.3 16.3
Serivces
Construction 13.8 17.0 16.6 13.1 15.2 11.3 10.4 11.4
Trade, Hotels, Transport and Communication
21.9 19.1 18.7 14.9 13.5 16.2 14.2 14.5
Financing Institutions, Real Estates & Business Services
19.5 20.2 18.6 16.9 17.5 17.2 16.1 16.5
Communtiy, Social & Personal Services 12.9 16.2 15.9 14.3 18.2 17.8 14.5 13.4
GDP at factor cost 17.4 16.2 14.6 12.2 13.6 14.2 12.9 12.5
Source: Ministry of Statistics and Programme Implementation, Government of India. Estimates of Gross Domestic Product (at current price)
Performance of Core-IndustriesSector- wise Growth Rate (%) in production (Weight in IIP: 37.90%)
Weight Apr- May 2012-13 April- May 2013-14
Coal 4.37 7.8 -0.1
Crude Oil 5.21 -0.4 -1.8
Natural Gas 1.70 -11.0 -18.1
Refinery Products 5.93 22.1 5.3
Fertilizers 1.25 -12.4 -2.2
Steel 6.68 3.0 3
Cement 2.40 13.9 5.6
Electricity 10.31 5.6 4.9
overall Index 37.903 6.5 2.4
Compiled by BCCI; Source of data Office of the Economic Advisor
External SectorExports and Imports (in US $ million)
Item 2012-13 (Apr-Jun) 2013-14 (Apr-Jun)June
2012-13 2013-14
Exports 73491.77 72455.67 24923.11 23785.64
Imports 115708.50 122635.73 36167.56 36034.74
Oil Imports 39357.40 41875.00 11225.60 12767.70
Non-Oil Imports 76351.10 80760.70 24942.00 23267.00
Trade Balance -42216.73 -50180.06 -11244.45 -12249.10
Source: Ministry of Commerce and Industry
17
AnAlytique • Vol. IX • No. 2 • April - June 2013
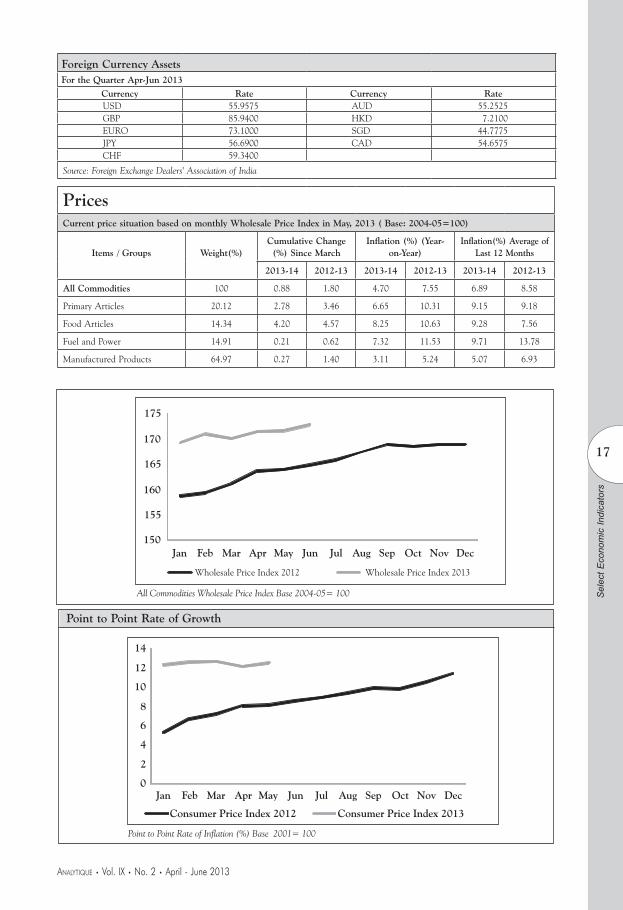
Point to Point Rate of Growth
Sel
ect E
cono
mic
Indi
cato
rs
Foreign Currency AssetsFor the Quarter Apr-Jun 2013
Currency Rate Currency RateUSD 55.9575 AUD 55.2525GBP 85.9400 HKD 7.2100EURO 73.1000 SGD 44.7775JPY 56.6900 CAD 54.6575CHF 59.3400
Source: Foreign Exchange Dealers' Association of India
PricesCurrent price situation based on monthly Wholesale Price Index in May, 2013 ( Base: 2004-05=100)
Items / Groups
Weight(%)
Cumulative Change (%) Since March
Inflation (%) (Year-on-Year)
Inflation(%) Average of Last 12 Months
2013-14 2012-13 2013-14 2012-13 2013-14 2012-13
All Commodities 100 0.88 1.80 4.70 7.55 6.89 8.58
Primary Articles 20.12 2.78 3.46 6.65 10.31 9.15 9.18
Food Articles 14.34 4.20 4.57 8.25 10.63 9.28 7.56
Fuel and Power 14.91 0.21 0.62 7.32 11.53 9.71 13.78
Manufactured Products 64.97 0.27 1.40 3.11 5.24 5.07 6.93
18
AnAlytique • Vol. IX • No. 2 • April - June 2013
Sel
ect E
cono
mic
Indi
cato
rs
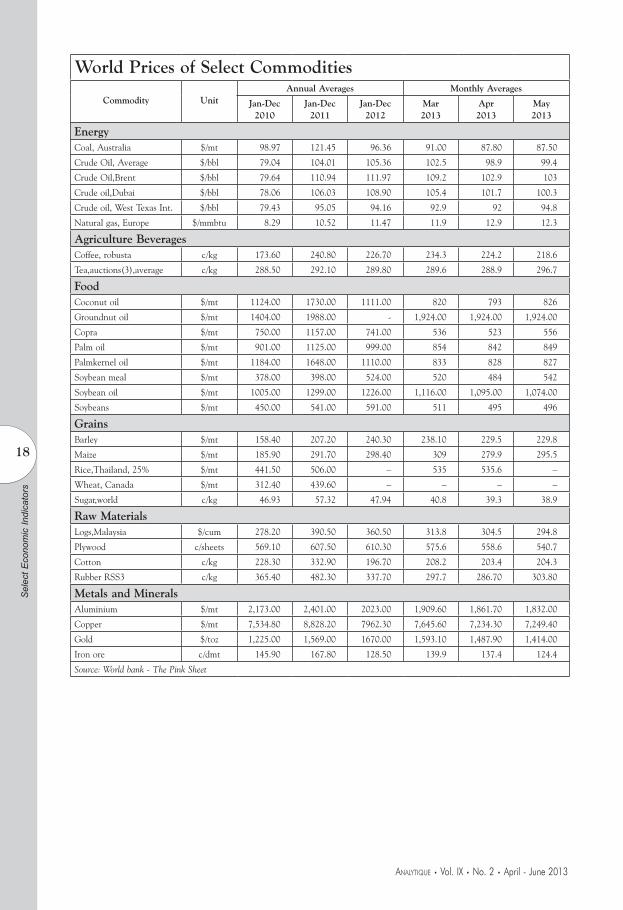
World Prices of Select Commodities
Commodity
UnitAnnual Averages Monthly Averages
Jan-Dec2010
Jan-Dec2011
Jan-Dec2012
Mar2013
Apr2013
May2013
EnergyCoal, Australia $/mt 98.97 121.45 96.36 91.00 87.80 87.50
Crude Oil, Average $/bbl 79.04 104.01 105.36 102.5 98.9 99.4
Crude Oil,Brent $/bbl 79.64 110.94 111.97 109.2 102.9 103
Crude oil,Dubai $/bbl 78.06 106.03 108.90 105.4 101.7 100.3
Crude oil, West Texas Int. $/bbl 79.43 95.05 94.16 92.9 92 94.8
Natural gas, Europe $/mmbtu 8.29 10.52 11.47 11.9 12.9 12.3
Agriculture Beverages Coffee, robusta c/kg 173.60 240.80 226.70 234.3 224.2 218.6
Tea,auctions(3),average c/kg 288.50 292.10 289.80 289.6 288.9 296.7
Food Coconut oil $/mt 1124.00 1730.00 1111.00 820 793 826
Groundnut oil $/mt 1404.00 1988.00 - 1,924.00 1,924.00 1,924.00
Copra $/mt 750.00 1157.00 741.00 536 523 556
Palm oil $/mt 901.00 1125.00 999.00 854 842 849
Palmkernel oil $/mt 1184.00 1648.00 1110.00 833 828 827
Soybean meal $/mt 378.00 398.00 524.00 520 484 542
Soybean oil $/mt 1005.00 1299.00 1226.00 1,116.00 1,095.00 1,074.00
Soybeans $/mt 450.00 541.00 591.00 511 495 496
GrainsBarley $/mt 158.40 207.20 240.30 238.10 229.5 229.8
Maize $/mt 185.90 291.70 298.40 309 279.9 295.5
Rice,Thailand, 25% $/mt 441.50 506.00 – 535 535.6 –
Wheat, Canada $/mt 312.40 439.60 – – – –
Sugar,world c/kg 46.93 57.32 47.94 40.8 39.3 38.9
Raw MaterialsLogs,Malaysia $/cum 278.20 390.50 360.50 313.8 304.5 294.8
Plywood c/sheets 569.10 607.50 610.30 575.6 558.6 540.7
Cotton c/kg 228.30 332.90 196.70 208.2 203.4 204.3
Rubber RSS3 c/kg 365.40 482.30 337.70 297.7 286.70 303.80
Metals and MineralsAluminium $/mt 2,173.00 2,401.00 2023.00 1,909.60 1,861.70 1,832.00
Copper $/mt 7,534.80 8,828.20 7962.30 7,645.60 7,234.30 7,249.40
Gold $/toz 1,225.00 1,569.00 1670.00 1,593.10 1,487.90 1,414.00
Iron ore c/dmt 145.90 167.80 128.50 139.9 137.4 124.4
Source: World bank - The Pink Sheet
19
AnAlytique • Vol. IX • No. 2 • April - June 2013
Sel
ect E
cono
mic
Indi
cato
rs
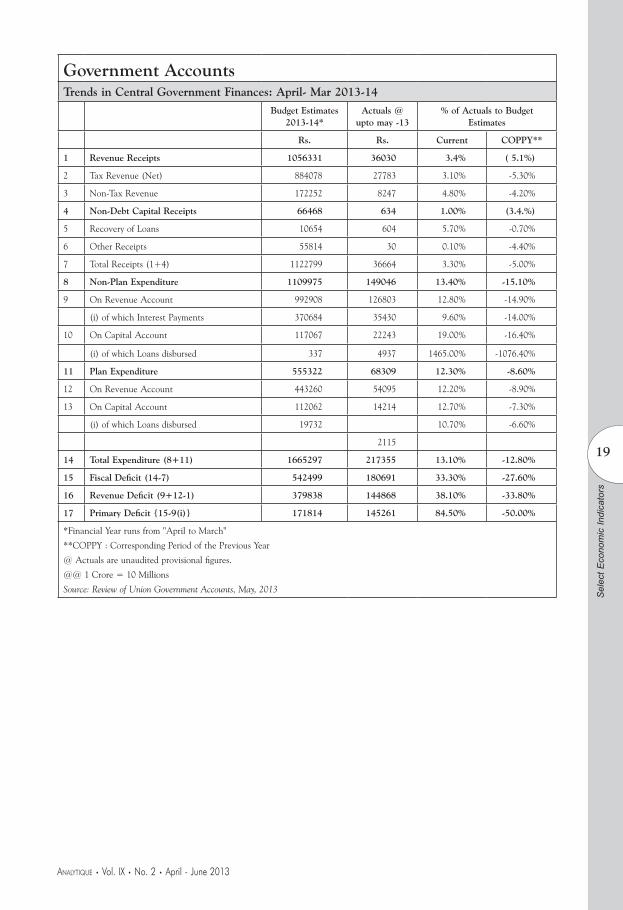
Government AccountsTrends in Central Government Finances: April- Mar 2013-14
Budget Estimates 2013-14*
Actuals @ upto may -13
% of Actuals to Budget Estimates
Rs. Rs. Current COPPY**
1 Revenue Receipts 1056331 36030 3.4% ( 5.1%)
2 Tax Revenue (Net) 884078 27783 3.10% -5.30%
3 Non-Tax Revenue 172252 8247 4.80% -4.20%
4 Non-Debt Capital Receipts 66468 634 1.00% (3.4.%)
5 Recovery of Loans 10654 604 5.70% -0.70%
6 Other Receipts 55814 30 0.10% -4.40%
7 Total Receipts (1+4) 1122799 36664 3.30% -5.00%
8 Non-Plan Expenditure 1109975 149046 13.40% -15.10%
9 On Revenue Account 992908 126803 12.80% -14.90%
(i) of which Interest Payments 370684 35430 9.60% -14.00%
10 On Capital Account 117067 22243 19.00% -16.40%
(i) of which Loans disbursed 337 4937 1465.00% -1076.40%
11 Plan Expenditure 555322 68309 12.30% -8.60%
12 On Revenue Account 443260 54095 12.20% -8.90%
13 On Capital Account 112062 14214 12.70% -7.30%
(i) of which Loans disbursed 19732 10.70% -6.60%
2115
14 Total Expenditure (8+11) 1665297 217355 13.10% -12.80%
15 Fiscal Deficit (14-7) 542499 180691 33.30% -27.60%
16 Revenue Deficit (9+12-1) 379838 144868 38.10% -33.80%
17 Primary Deficit {15-9(i)} 171814 145261 84.50% -50.00%
*Financial Year runs from "April to March"
**COPPY : Corresponding Period of the Previous Year
@ Actuals are unaudited provisional figures.
@@ 1 Crore = 10 Millions
Source: Review of Union Government Accounts, May, 2013

20
AnAlytique • Vol. IX • No. 2 • April - June 2013
Sel
ect E
cono
mic
Indi
cato
rs
J
Money & Banking
Money Stock - Components and Sources (` Billion)
Item
Outstanding as on Variation over (per cent)
2013 2013 Financial Year so Far Year on Year
Mar-31 May-31 2012-13 2013-14 2012 2013
M3 83,444.9 85,942.4 4.1 3.0 14.3 12.1
Components (i+ii+iii+iv)
(i) Currency with the Public 11,445.3 11,766.5 5.0 2.8 12.1 9.5
(ii) Demand Deposits with Banks 7,420.9 7,397.0 -4.4 -0.3 6.6 8.8
(iii) Time Deposits with Banks 64,546.7 66,737.2 5.0 3.4 15.7 12.9
(iv) "Other" Deposits with Reserve Bank 32.0 41.7 -46.8 30.3 -60.5 177.7
Sources (i+ii+iii+iv-v)
(i) Net Bank Credit to Government (a+b) 26996.4 28347.1 5.5 5.5 20.0 13.8
(a) Reserve Bank 5923.9 6456.1
(b) Other Banks 21072.6 21891.0 6.3 3.9 14.6 12.2
(ii) Bank Credit to Commercail Sector (a+b) 56405.5 57573.5 2.5 2.1 18.5 13.3
(a) Reserve Bank 30.6 24.1
(b) Other Banks 56375.0 57549.4 2.5 2.1 18.5 13.3
(iii) Net Foreign Exchange Assets of Banking Sector*
15991.4 16360.4 5.9 2.3 13.9 0.1
(iv) Government's Currency Liabilities to the Public 151.3 151.3 2.0 - 5.8 10.3
(v) Banking Sector's Net Non-Monetary Liabilities
of which: 16,099.80 16,489.90 2.2 2.4 41.2 6.0
Net Non-Monetary Liabilities of RBI 6943.5 7350.7 14.2 5.9 17.3 6.6
*: Includes Investments in foreign currency denominated bonds issued by IIFC(UK) since March 20, 2009Note: Government Balances as on March 31, 2013 are before closure of accounts
Select Scheduled Commercial Banks - Business in India
Item
2013-14Outstanding as on (` Billion)
Percentage Variation
Financial Year So Far Year on Year
29,March 31,May 2012-13 2013-14 2012 2013
Bank Credit 52,604.6 53,792.4 -0.9 2.3 17.8 15.4
Non-Food Credits 51,640.4 52,612.0 -1.6 1.9 17.2 15.5
Aggregate Deposits 67,504.5 69,665.3 -0.6 3.2 14.3 14.5
Cash Reserve Ratio/ Interest RateItem/Week Ended 2012 2013
1 - June 31 - May
Cash Reserve Ratio (per cent) (1) 4.75 4.00
Bank Rate 9.50-8.50 8.25
Base Rate 9.75/10.50 9.70/10.25
Term Deposit Rate(2) 8.0/9.25 7.25/9.0
Saving Deposit Rate 4.00 4.00
Call Money Rate 8.10 7.22
(1) Cash Reserve Ratio relates to the Scheduled Commercial Banks (exclusing Regional Rural Banks)(2) Deposit Rate related to major Banks for deposits of more than one year maturity.

Bombay Chamber of Commerce and Industry Trust for Economic
and Management Studies
The Bombay Chamber of Commerce and Industry Trust for Economic and Management Studies was constituted in 1996 by the Bombay Chamber of Commerce and Industry to undertake independent research activities on various economic and management issues and for providing analytical views on macro-economic scenario, industrial performance and other issues of topical interest.
The Trust started publishing the quarterly magazine ‘AnalytiQue’ for the quarter October-December in the year of 1999 to serve as an effective vehicle of communication between the government, industry, economists, thinkers, management consultants and scholars. In its short journey the magazine had some trying spells and after the issue of January-March, 2006 there has been no issue. However, after four years, the Trust published the next issue as Journal in March, 2010. While retaining its basic purpose and character, AnalytiQue now continues to serve members, who are drawn mainly from the world of business and commerce and deals with contemporary economic issues while documenting some of the important developments of the Indian economy.
Bombay Chamber of Commerce & Industry Trust for Economic and Management Studies
Mackinnon Mackenzie Building, Ballard Estate, Mumbai 400 001 Tel: 91-22-4910 0200
Email: [email protected]

The “E - Information Service” is provided through an online newsletter called ‘E - weekly’ to disseminate useful information on business and commerce in India and International countries. This service is provided to both the members of Bombay Chamber as well as non-members. The information contains notifications, circulars and reports issued by respective Departments on:
– Banking & Taxation
– Customs & Central Excise
– D. A. circulars, Industrial Relation and Labour Laws
– Selected Statistical Data
– International Trade Information through Economic and Commercial Reports
– World Bank news on Loan and Credit Summary
– Shipping
For Further information on prescribed fess and registration please refer the link below:
http://www.bombaychamber.com/Uploads/Document/104/E-info_Form.pdf
“E - Information Service”