
A. Arnaiz-Villena et al.
12
Transcript of A. Arnaiz-Villena et al.
A. Arnaiz-Villena et al.
(1125 BC) but found the struggle with the Philistines(Palestinians) more difficult. Philistines had establishedan independent state on the southern coast of Palestineand also controlled the Canaanite town of Jerusalem.
The “sea people” contributed to the fall of theAnatolian Hittites and other Middle East people by 1200BC and apparently seriously threatened Egypt [5]. ThePhilistines have been included among the “sea people”invaders. However, it is doubtful that big amounts ofpeople entered nowadays Anatolia and Palestine; a newiron technology probably was taken de novo by someautochthonous Canaanite tribes that acquired superiority.
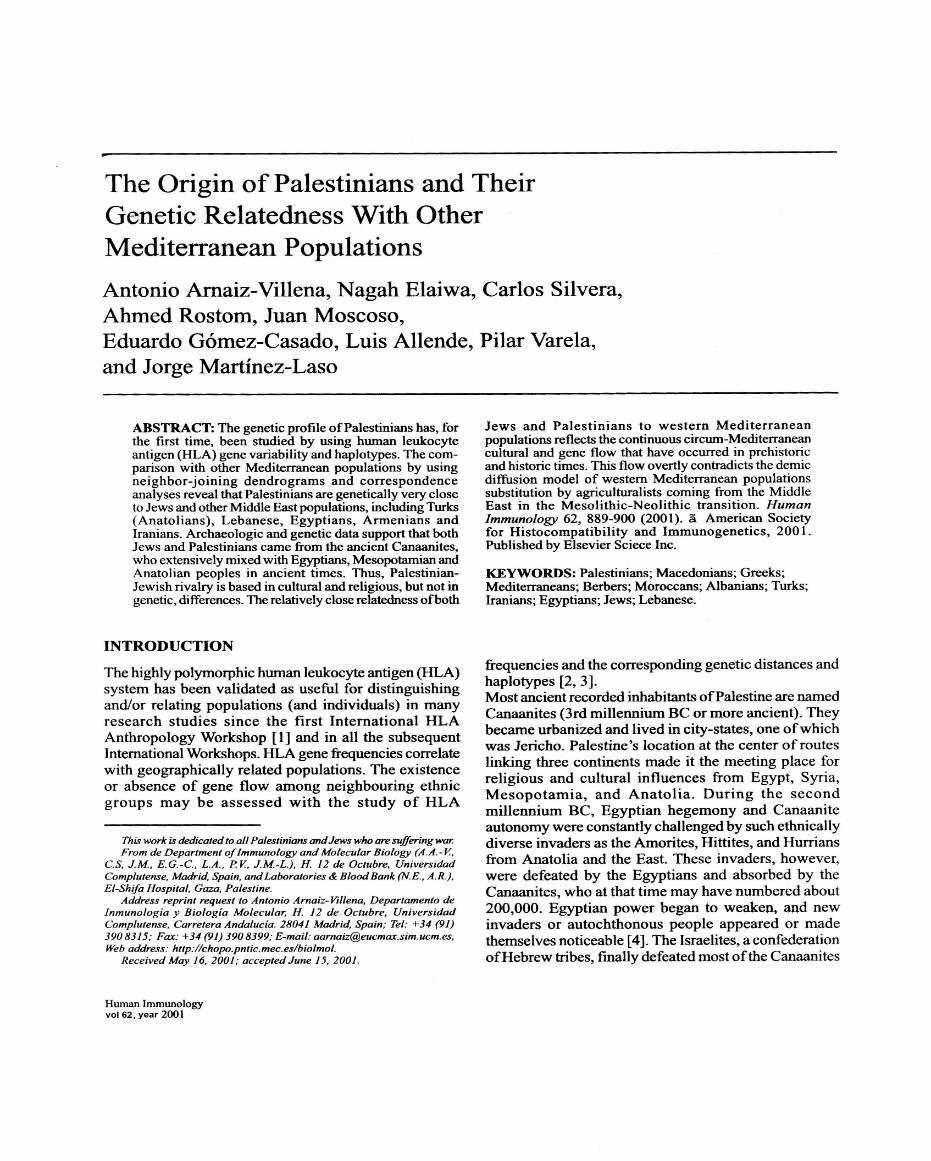
In fact, the Palestinians are nowadays thought to comefrom the Egyptian garrisons that were abandoned to theirown fate on the Canaan land by 1200 years BC (Figure1) and had to manage to construct or reinforce or rebuiltsome ancient Canaanite city-states, together with the oldautochthonous tribes [6]. Otherwise, the ancientPalestinians might have come from Crete or its empire[7]. Israelites could also stem from autochthonousCanaanite tribes that were agglutinated by a group ofpeople led by Moses to fight against other Canaanites,including Philistines and finally set up ancient Israel [6-8]. By 1000 BC, and after warring with Philistines andother Canaanites, an Israelite state was founded by kingSaul [6].
Palestinians held five important city-states when thefighting with Israel began (after 1200 BC): Gaza, Ash-
FIGURE 1 Canaan in ancient times. Palestinians (Philis-tines) city-states by 1100-1000 BC (black squares) Jerichowas an ancient Canaanite city-state. Jerusalem, Nazareth andmodern Tel-Aviv are also indicated [37]. Palestinian city-states may come from the remains of Egyptian garrisons,left to their own fate according to archaeological records[6]; the Bible quotes that Palestinians may have come fromCrete [7]. Gath may be placed more to the south because ithas not been recognized in modern times. Goliath, thePalestine, who was killed by King David according to theBible, come from this city.
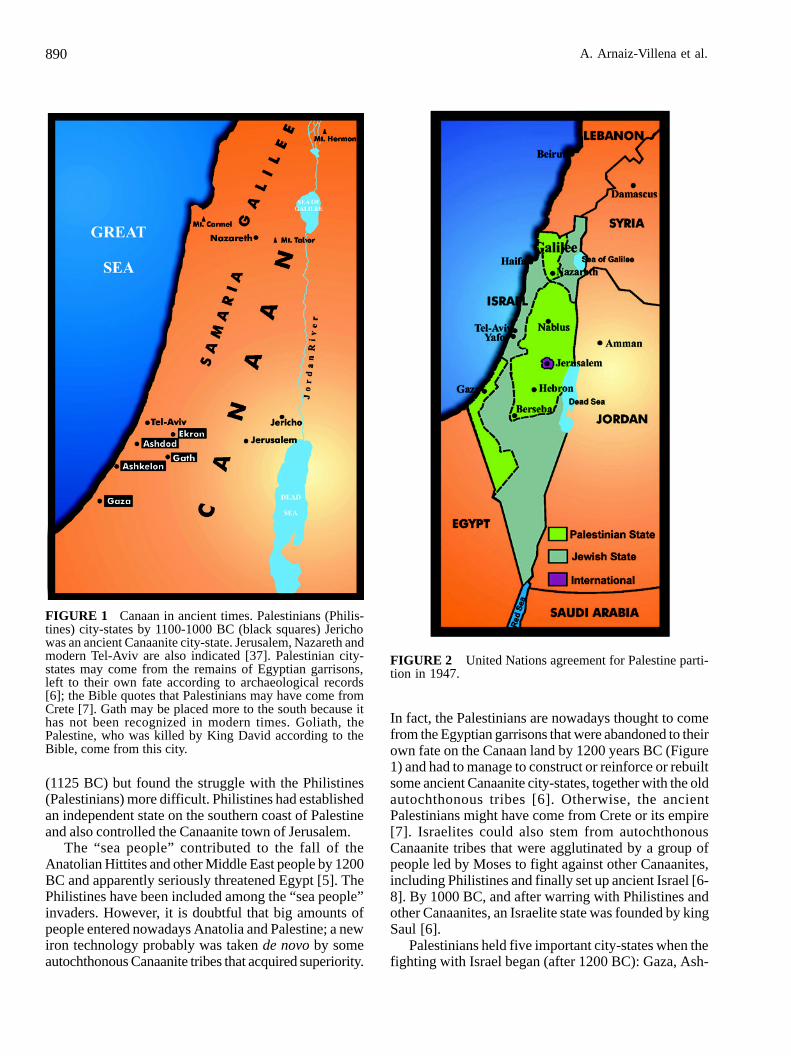
FIGURE 2 United Nations agreement for Palestine parti-tion in 1947.
890
HLA Genes in Palestinians
kelon, Ashod, Ekron and Gath (Figure 1). They wonseveral battles and the time that they were in control ofall Canaan, west to the Jordan river (about 100 years?)has been enough to name the land as Palestine until afterWorld War II [9]. They probably had an iron technologyhigher than Israelites, because they did not let Israelitesto work as blacksmiths when they were ruling over Israel-ites [see Bible starting in Samuel 13 and 19; 5,7].
Alexander the Great [9] surrendered Gaza after a longsiege about 333 BC. Later, Gaza became an importantChristian center [9] and afterwards an important Islamiccenter because Palestine was converted to Islam by Ara-bic troops and priests by 700 AD [9]. Ancient Canaan(Palestine in Middle Age and modern times) has sequen-tially belonged to the Roman-Byzantine empire, toEgyptian Muslim Mammeluks, to the European crusadersand finally to the Ottoman-Empire [9] since the XVIcentury. In 1918 British led mixed Arab-British troops
seized the region. Palestine had 750,000 inhabitants in1919 [9] and only 70,000 were Jewish. Immigrationrapidly increased the number of Jews (who had beenseveral times led to Diaspora, expelled, deported, andmassacred by ancient Iranians and Romans, most westernEuropean countries, and finally Hitler [8,9]). There were400,000 Jews present in Palestine by 1936 and 600,000by 1947 when Palestine population amounted 2,000,000inhabitants. The United Nations plan for Palestinepartition in 1947 is illustrated in Figure 2 [9]. Israel´sself-proclaimed independent in 1948 and started a waragainst Muslim Palestinians and other Muslimneighbouring countries. After several regional wars,Israel has taken more space and sized Jerusalem, asillustrated in Figure 3. The present situation (April 2001)is unstable.
Palestinians were about 5,000,000 at the beginningof the last decade. Nowadays, they might reach 7,000,000[9-11]. Three kind of Palestinians, according to theirstatus, may be defined as follows: (1) the inhabitantsunder an autonomous Palestinian government (about30%) that controls very little of the West Jordan Bank
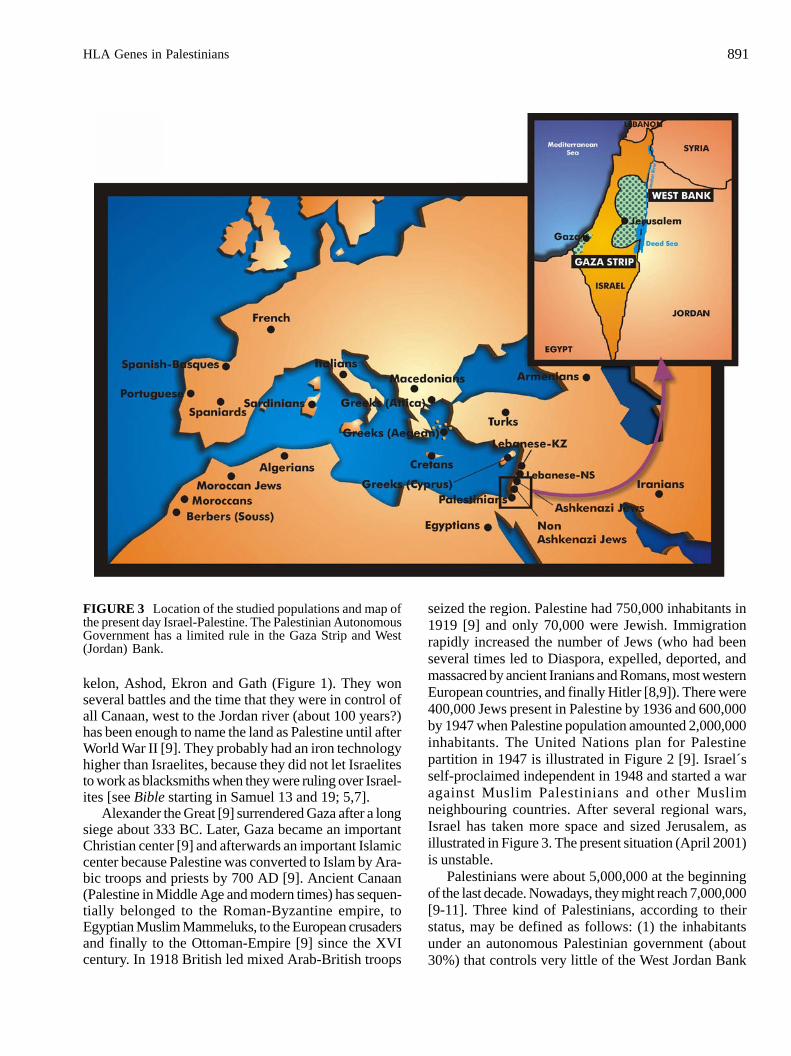
FIGURE 3 Location of the studied populations and map ofthe present day Israel-Palestine. The Palestinian AutonomousGovernment has a limited rule in the Gaza Strip and West(Jordan) Bank.
891
A. Arnaiz-Villena et al.
(inhabited by more than 1,500,000 Palestinians), butcontrols more in the Gaza strip (about 1,000,000Palestinians), where Palestinians have to lived mixed withJewish colonist in their theoretically own territories; (2)the Diaspora Palestinians (occurred after 1947), whohave refugee status (about 40%, [9,10]), and live eitherin concentration camps or are scattered in Jordan (38%),Syria (12%) and Lebanon (13%). Saudi Arabia andKuwait gather about 500,000 Palestinians; Egypt, Iraqand other Mediterranean, European and Americancountries have more reduced communities; and (3) theIsrael Palestinians, who live within Israel (37%). Mostof Palestinians profess Muslim religion, but there arealso Druze and Christian minorities [10]. They speakthe Palestinian-Arab dialect [10].
The aim of the present study is to examine the geneticrelationships of Palestinians with their neighbours(particularly the Jews) and other Mediterraneanpopulations in order to: (1) discover the Palestinianorigins, and (2) explain the historic basis of the presentday Middle East conflict between Palestinians and otherMuslim countries with Israelite Jews.
MATERIAL AND METHODSPopulation samplesSamples from 165 unrelated Palestinians in Gaza(Laboratories and Blood Bank, El-Shifa Hospital, Gaza)were used for HLA genotyping and phylogeneticcalculations. All were selected in order that their ancestors(eight grandparents) had a Palestinian origin. This sample
may be considered as representative of the Palestinianpopulation because many people have been forced to livein the Gaza strip, coming from other parts of Palestine,and the Gaza strip is now a relatively or totally (whenthe ongoing conflict aggravates) secluded area. All otherpopulations used for comparisons are detailed in Table1 and Figure 3.
HLA Genotyping, DNA Sequencing and StatisticsGeneric HLA class I (A and B) and high resolution HLAclass II (DRB1 and DQB1) genotyping was performedusing a reverse dot-blot technique with the AutomatedInnolipa system (Innogenetics N.V., Zwijndrecht,Belgium). HLA-A, -B, -DRB1, and -DQB1 allele DNAsequencing was only done when indirect DNA typing(reverse dot-blot) yielded ambiguous results [12].Statistical analysis was performed with Arlequin v1.1software kindly provided by Excoffier and Slatkin [13].In summary, this program calculated HLA-A, -B, -DRB1and -DQB1 allele frequencies, Hardy-Weinbergequilibrium and the linkage disequilibrium between twoalleles at two different loci. Linkage disequilibrium (D´;also named LD, see Imanishi et al. [14]) and its level ofsignificance (p) for 2 x 2 comparisons were determinedusing the formulae of Mattiuz and co-workers [15] andthe 11th International Histocompatibility Workshopmethodology [14].
In addition, the most frequent complete haplotypeswere deduced following a methodology used in the 11thInternational Histocompatibility Workshop: (1) the 2, 3,and 4 HLA loci haplotype frequencies [3,16-21]; (2) the
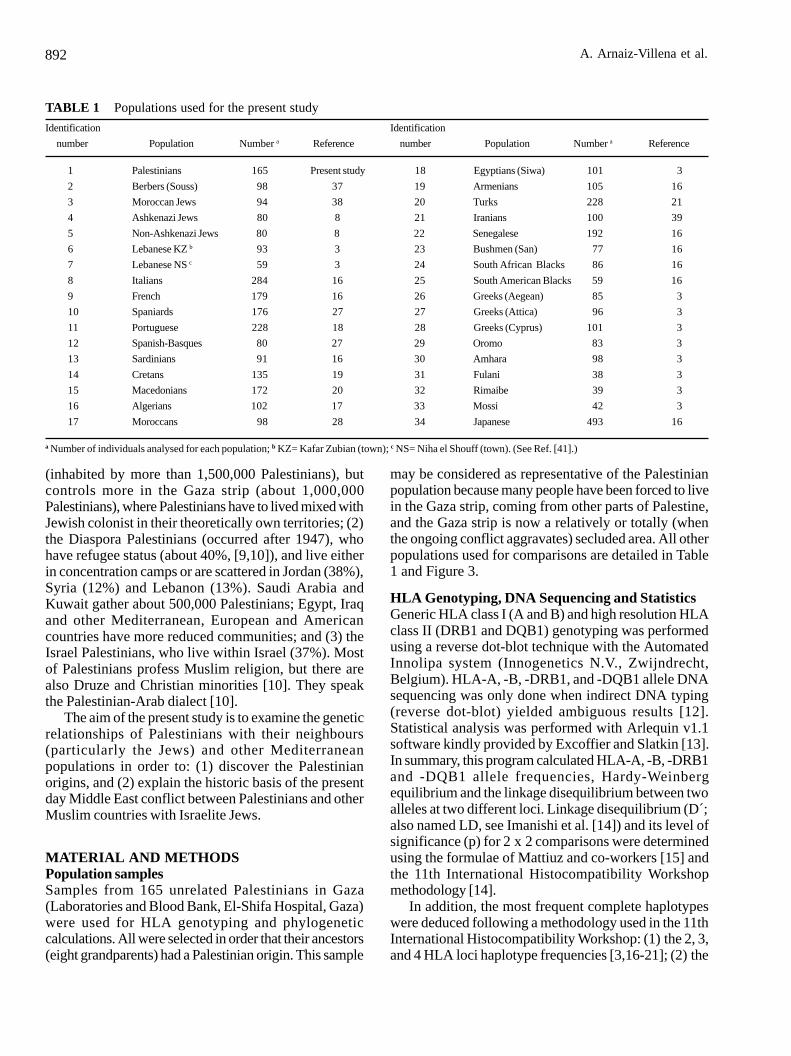
TABLE 1 Populations used for the present study
Identification Identification
number Population Number a Reference number Population Number a Reference
1 Palestinians 165 Present study 18 Egyptians (Siwa) 101 3
2 Berbers (Souss) 98 37 19 Armenians 105 16
3 Moroccan Jews 94 38 20 Turks 228 21
4 Ashkenazi Jews 80 8 21 Iranians 100 39
5 Non-Ashkenazi Jews 80 8 22 Senegalese 192 16
6 Lebanese KZ b 93 3 23 Bushmen (San) 77 16
7 Lebanese NS c 59 3 24 South African Blacks 86 16
8 Italians 284 16 25 South American Blacks 59 16
9 French 179 16 26 Greeks (Aegean) 85 3
10 Spaniards 176 27 27 Greeks (Attica) 96 3
11 Portuguese 228 18 28 Greeks (Cyprus) 101 3
12 Spanish-Basques 80 27 29 Oromo 83 3
13 Sardinians 91 16 30 Amhara 98 3
14 Cretans 135 19 31 Fulani 38 3
15 Macedonians 172 20 32 Rimaibe 39 3
16 Algerians 102 17 33 Mossi 42 3
17 Moroccans 98 28 34 Japanese 493 16
a Number of individuals analysed for each population; b KZ= Kafar Zubian (town); c NS= Niha el Shouff (town). (See Ref. [41].)
892
HLA Genes in Palestinians
haplotypes previously described in other populations[3,16]; and (3) haplotypes that were assigned if theyappeared in two or more individuals and the alternativehaplotype was well defined. In order to compare allelicand haplotype HLA frequencies with other populations,the reference tables used were those of the 11th and 12thInternational HLA Workshops [3,16]; see also Table 1.Phylogenetic trees (dendrograms) were constructed withthe allelic frequencies by applying the Neighbor-Joining(NJ) method [22] with the genetic distances betweenpopulations (DA, [23]) and using DISPAN softwarecontaining the programs GNKDST and TREEVIEW[24,25]. A three-dimensional correspondence analysisand its bidimensional representation was carried out usingthe VISTA v5.02 computer program ([26]; http:/forrest.psych.unc.edu). Correspondence analysiscomprises a geometric technique that may be used fordisplaying a global view of the relationships amongpopulations according to HLA (or other) allelefrequencies. This methodology is based on the allelicfrequency variance among populations (similar to theclassical principal components methodology) and on thedisplay of a statistical projection of the differences.
RESULTSCharacteristic HLA Allele Frequencies of thePalestinian Population Compared WithOther MediterraneansThe expected and observed gene allelic frequencies forHLA-A, -B, -DRB1 and -DQB1 loci do not significantlydiffer and the population sample is in Hardy-Weinbergequilibrium. Table 2 illustrates the HLA allelefrequencies found in the Palestinian population.Seventeen HLA-A and 26 different HLA-B alleles wereobserved in the Palestinian population. Seven HLA-Aand seven HLA-B alleles had frequencies higher than5% (A*01, A*02, A*03, A*23, A*24, A*30, A*32,B*18, B*35, B*41, B*44 B*49, B*50, and B*51) andthese are characteristic of Mediterranean populations,particularly from eastern Mediterranean regions [17,19-21,27,28]. With regard to the HLA class II alleles, 31different DRB1 alleles were found and only seven hadfrequencies higher than 5% (DRB1*0301, *0403, *0406,*0701, *1101, *1104, *1303) being also characteristicof eastern Mediterranean populations. In particular,DRB1*0403 is present in high frequency in Lebanese[29], North African and Jewish populations [8,17];DRB1*0406 is also present in North Africanspopulations [17,28]. Besides, DRB1*0302 (allelefrequency 3.3%), characteristic of African Blackpopulations, is also present in North African Caucasians,Jews and Lebanese [8,17,28,29]. DQ allele frequencies
reflect the DRB1 locus allele distribution due to the stronglinkage disequilibrium between these two loci.Three types of analyses were carried out to comparePalestinian HLA frequencies with other Mediterraneanpopulation frequencies: (1) with DRB1-DQB1 data,which is probably a more informative and discriminatingmethodology; (2) with DRB1 data; and (3) with generic(low resolution) DR-DQ data. These three types ofanalysis were performed because some of the populationsused for comparison lacked HLA-A and -B data (Berbers[from Souss, Agadir area], Jews [Ashkenazi], Jews[Morocco], Jews [non-Ashkenazi], Lebanese [NS andKZ], see Table 1), or high resolution HLA-DQ data(Greeks [Attica], Greeks [Cyprus], Greeks [Attica-Aegean], see Table 1), or only generic HLA-DR and –DQ data were available (Portuguese, Turks, Iranians,Armenians and Egyptians, see Table 1). These partiallyHLA-typed populations should have been ignored, butthey could be analyzed conjointly taking into accountonly either DRB1 or generic DR and DQ frequencies(Table 3, Figsures 1, 2, 3, 4 and 5).
Analyses using DRB1 and DQB1 conjointly weremade but are not illustrated because only a fewpopulations could be used and the results are concordantwith the DRB1 analysis. Finally, it should be pointedout that class I generic typing tends to homogenize thecomparisons based on DRB1 high resolution typing [28];one class I allele obtained by generic DNA typing maycontain several class I alleles, whereas this is not thecase for most DRB1 alleles at present.
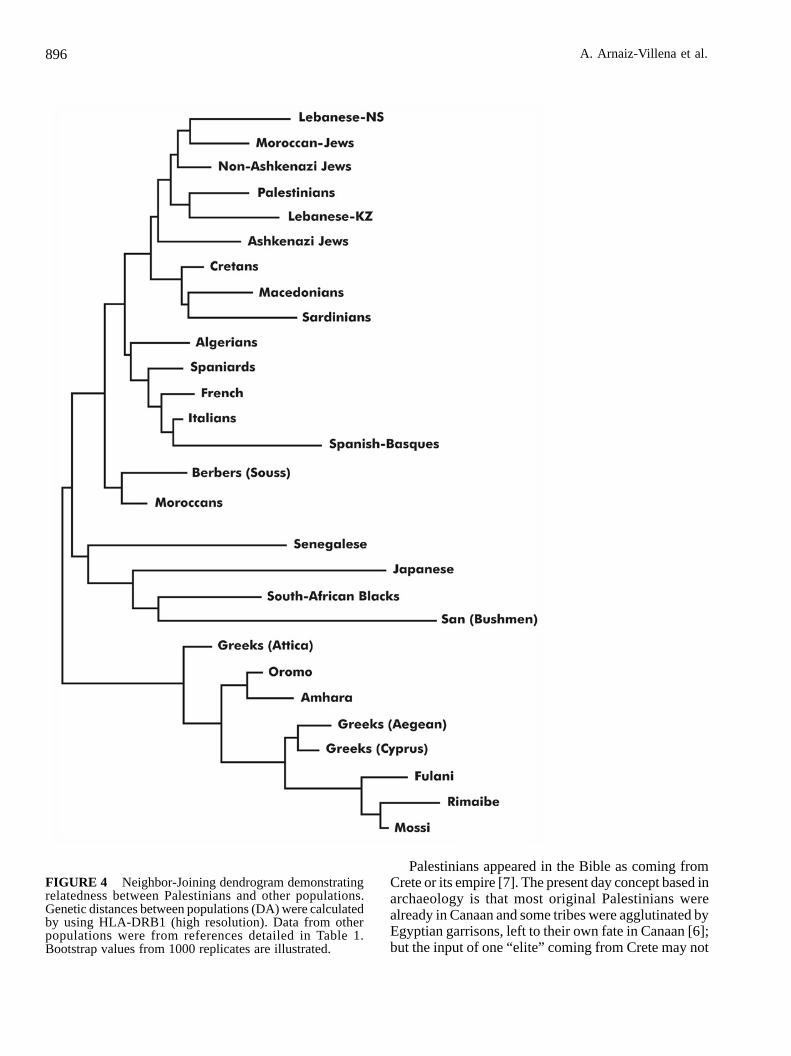
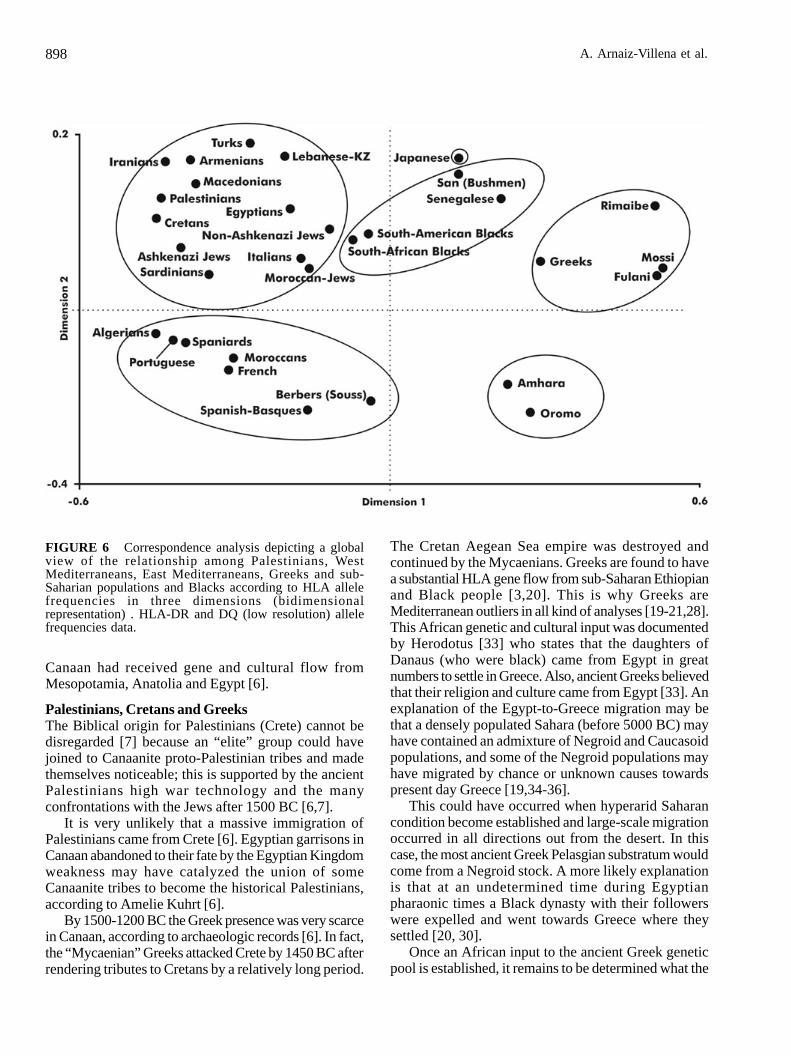
Figure 4 depicts an HLA class II “high-resolution”(DRB1) NJ tree. Populations are grouped into three mainbranches: the first one groups both eastern (includingPalestinians, Macedonians, Cretans, Jews, Lebanese) andwestern Mediterranean populations (Europeans andNorth Africans; Sardinians are included in the firstgroup). The second branch is formed by African Negroidpopulations and Japanese (Mediterranean outgroups) andthe third one includes Greek and Ethiopian/sub-Saharanpopulations. This distribution is also confirmed in thecorrespondence analysis (Figure 5): the three groups areclearly delimited and an smooth West to EastMediterranean gradient is shown. The Palestinianpopulation reveals the closest genetic distance with Jews(generic DR-DQ typing), Cretans (using DRB1-DQB1)or Algerians (using DRB1) (see Table 3) and nodiscontinuity is observed between eastern and westernMediterranean populations reflecting the geneticsimilarity among all these populations. It is evidencedthat Palestinians/Greeks distance is high and confirmsthe different genetic background of the Greeks, who havereceived a substantial sub-Saharan gene flow [3,20].These results are confirmed using DR and DQ generictypings (see Table 3 and Figure 6) which were used in
893
A. Arnaiz-Villena et al.
order to include other Mediterranean populations (Irani-ans, Armenians, Egyptians and Turks, see Table 1). Theclose relatedness of Palestinians (Table 3 first column,Figure 6) to Iranians, Armenians, Egyptians andAnatolians (Turks [21]) further support an autochthonousCanaanite/Middle East origin for both Palestinians andJews. A DR-DQ neighbour-joining tree (not shown)maintains the west and east Mediterranean groups andalso the group formed by Greeks and sub-Saharan pop-ulations. Turks (old Anatolians), Armenians, Jews andLebanese are illustrated specifically to cluster with Pal-estinians. On the other hand, genetic distances obtainedby using DR-DQ generic typing allele frequencies (Table
3) illustate that Ashkenazi Jews, Iranians, Cretans, Ar-menians, Turks and non-Ashkenazi Jews are the popu-lations closest to the Palestinians, followed by the otherMediterraneans populations. Other analyses and geneticdistances confirm these results (Table 3, Figures 4 and 5).
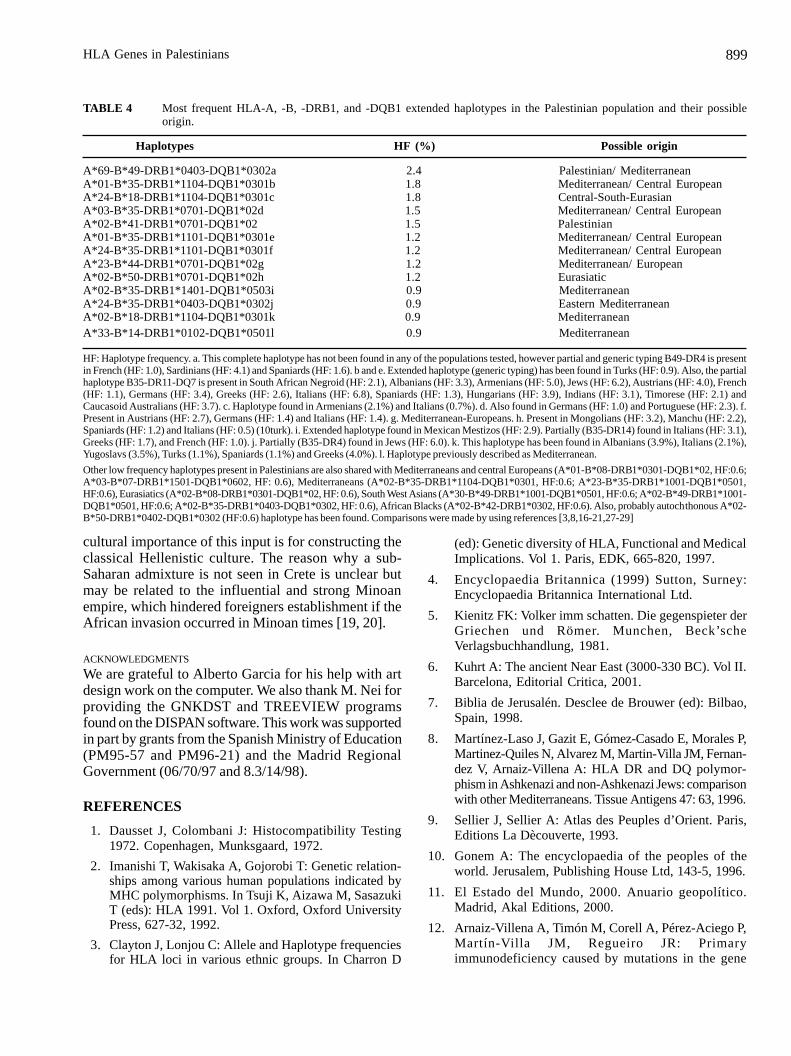
HLA-A, -B, -DRB1, and -DQB1 LinkageDisequilibria in PalestiniansExtended HLA haplotypes were defined in Palestiniansand compared with those previously reported in otherpopulations (Table 4).
HLA-A-B and DRB1*-DQB1* two-loci linkagedisequilibrium data (not shown) show that the most
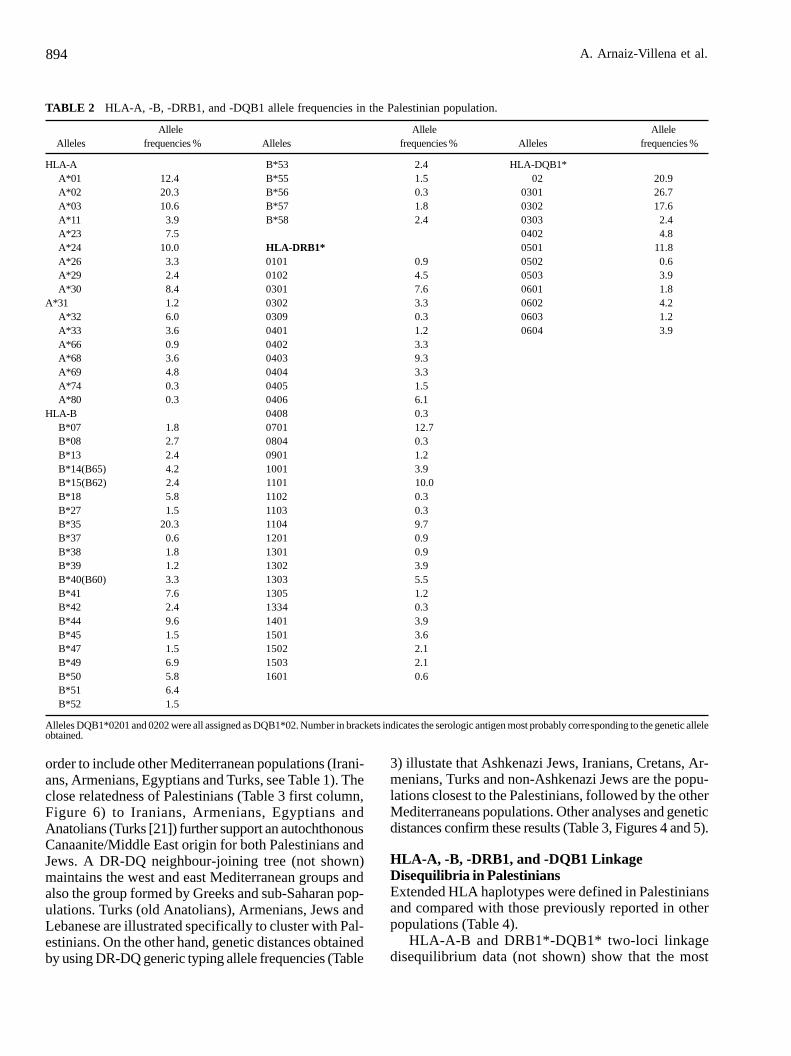
TABLE 2 HLA-A, -B, -DRB1, and -DQB1 allele frequencies in the Palestinian population.
Allele Allele AlleleAlleles frequencies % Alleles frequencies % Alleles frequencies %
HLA-A B*53 2.4 HLA-DQB1*A*01 12.4 B*55 1.5 02 20.9A*02 20.3 B*56 0.3 0301 26.7A*03 10.6 B*57 1.8 0302 17.6A*11 3.9 B*58 2.4 0303 2.4A*23 7.5 0402 4.8A*24 10.0 HLA-DRB1* 0501 11.8A*26 3.3 0101 0.9 0502 0.6A*29 2.4 0102 4.5 0503 3.9A*30 8.4 0301 7.6 0601 1.8
A*31 1.2 0302 3.3 0602 4.2A*32 6.0 0309 0.3 0603 1.2A*33 3.6 0401 1.2 0604 3.9A*66 0.9 0402 3.3A*68 3.6 0403 9.3A*69 4.8 0404 3.3A*74 0.3 0405 1.5A*80 0.3 0406 6.1
HLA-B 0408 0.3B*07 1.8 0701 12.7B*08 2.7 0804 0.3B*13 2.4 0901 1.2B*14(B65) 4.2 1001 3.9B*15(B62) 2.4 1101 10.0B*18 5.8 1102 0.3B*27 1.5 1103 0.3B*35 20.3 1104 9.7B*37 0.6 1201 0.9B*38 1.8 1301 0.9B*39 1.2 1302 3.9B*40(B60) 3.3 1303 5.5B*41 7.6 1305 1.2B*42 2.4 1334 0.3B*44 9.6 1401 3.9B*45 1.5 1501 3.6B*47 1.5 1502 2.1B*49 6.9 1503 2.1B*50 5.8 1601 0.6B*51 6.4B*52 1.5
Alleles DQB1*0201 and 0202 were all assigned as DQB1*02. Number in brackets indicates the serologic antigen most probably corresponding to the genetic alleleobtained.
894
HLA Genes in Palestinians
frequent combinations are characteristic of Mediterra-nean (western and eastern) populations (A*1-B*35, hap-lotype Frequency (HF): 5.1; B*35-DRB1*1104, HF:3.2; B*35-DRB1*0403, HF: 3.2; A*2-B*41, HF: 3.1;A*2-B*51, HF: 2.9; B*18-DRB1*1104, HF: 2.8;B*49-DRB1*0403, HF: 2.7; A*24-B*35, HF: 2.3;A*23-B*44, HF: 2.3; A*24-B*18, HF: 2.1; B*14-DRB1*0102, HF: 2.0; B*35-DRB1*1101, HF: 2.0;A*33-B*14, HF: 1.7; B*49-DRB1*1001, HF: 1.6;B*35-DRB1*1001, HF: 1.5; B*50-DRB1*0701,HF:1.5; B*8-DRB1*0301, HF: 1.5). The combinationA*69-B*49 (HF: 2.7) has not been found in any ofthe populations tested and it is included in an extendedhaplotype (A*69-B*49-DRB1*0403-DQB1*0302,see below) not previously described.
The HLA-A-B-DR-DQ extended haplotypes foundin the Palestinian population (Table 4) reflect commoncharacteristics with the other “older” Mediterraneanpopulation mainly from eastern Mediterraneans andNorth Africans (see footnote to Table 4), like Jews [8].These haplotype results are concordant with those ob-
tained by the allele frequency analyses (genetic distances,NJ trees and correspondence analyses, see above).
DISCUSSIONPalestinians and JewsThe genetic identity of Ashkenazi and non-AshkenaziJews who now lives in Israel has already been reported[8]. Babylonian and Roman-induced Diaspora, droveJews to many parts of Europe, Africa and Asia, whichoccurred in 587 BC and 70 AD, respectively. Jews startedto come back to Palestine during the 19th and 20th cen-turies [8]. However, religion and close communities havekept Jews relatively isolated from the inhabitants of thecountries that hosted them during this long period of time.Jews wrote the Bible, a religious and historical book thatis a continuous source of historical Middle East facts,but that only tells the Jewish view [6]. It is now necessaryto rely on other sources, such as archaeology, linguistics,etc, to establish a more objective history of Middle Eastand particularly ancient Canaan [6,9].
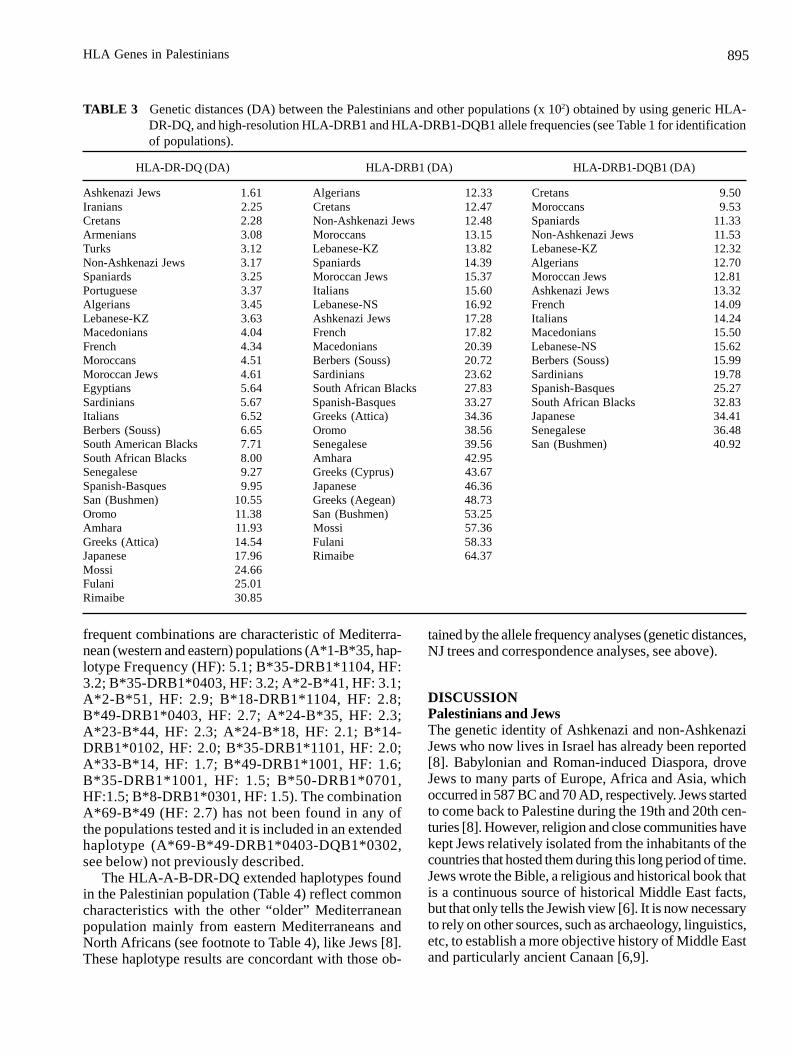
TABLE 3 Genetic distances (DA) between the Palestinians and other populations (x 102) obtained by using generic HLA-DR-DQ, and high-resolution HLA-DRB1 and HLA-DRB1-DQB1 allele frequencies (see Table 1 for identificationof populations).
HLA-DR-DQ (DA) HLA-DRB1 (DA) HLA-DRB1-DQB1 (DA)
Ashkenazi Jews 1.61 Algerians 12.33 Cretans 9.50Iranians 2.25 Cretans 12.47 Moroccans 9.53Cretans 2.28 Non-Ashkenazi Jews 12.48 Spaniards 11.33Armenians 3.08 Moroccans 13.15 Non-Ashkenazi Jews 11.53Turks 3.12 Lebanese-KZ 13.82 Lebanese-KZ 12.32Non-Ashkenazi Jews 3.17 Spaniards 14.39 Algerians 12.70Spaniards 3.25 Moroccan Jews 15.37 Moroccan Jews 12.81Portuguese 3.37 Italians 15.60 Ashkenazi Jews 13.32Algerians 3.45 Lebanese-NS 16.92 French 14.09Lebanese-KZ 3.63 Ashkenazi Jews 17.28 Italians 14.24Macedonians 4.04 French 17.82 Macedonians 15.50French 4.34 Macedonians 20.39 Lebanese-NS 15.62Moroccans 4.51 Berbers (Souss) 20.72 Berbers (Souss) 15.99Moroccan Jews 4.61 Sardinians 23.62 Sardinians 19.78Egyptians 5.64 South African Blacks 27.83 Spanish-Basques 25.27Sardinians 5.67 Spanish-Basques 33.27 South African Blacks 32.83Italians 6.52 Greeks (Attica) 34.36 Japanese 34.41Berbers (Souss) 6.65 Oromo 38.56 Senegalese 36.48South American Blacks 7.71 Senegalese 39.56 San (Bushmen) 40.92South African Blacks 8.00 Amhara 42.95Senegalese 9.27 Greeks (Cyprus) 43.67Spanish-Basques 9.95 Japanese 46.36San (Bushmen) 10.55 Greeks (Aegean) 48.73Oromo 11.38 San (Bushmen) 53.25Amhara 11.93 Mossi 57.36Greeks (Attica) 14.54 Fulani 58.33Japanese 17.96 Rimaibe 64.37Mossi 24.66Fulani 25.01Rimaibe 30.85
895
A. Arnaiz-Villena et al.
Palestinians appeared in the Bible as coming fromCrete or its empire [7]. The present day concept based inarchaeology is that most original Palestinians werealready in Canaan and some tribes were agglutinated byEgyptian garrisons, left to their own fate in Canaan [6];but the input of one “elite” coming from Crete may not
FIGURE 4 Neighbor-Joining dendrogram demonstratingrelatedness between Palestinians and other populations.Genetic distances between populations (DA) were calculatedby using HLA-DRB1 (high resolution). Data from otherpopulations were from references detailed in Table 1.Bootstrap values from 1000 replicates are illustrated.
896
HLA Genes in Palestinians
be discarded. Also, the bulk of Jewish people probablycame from ancient autochthonous Canaanites [6]; thisis compatible with an input of foreign leaders andtheir groups (Abraham, Moses) as described in theBible [7].
Both Jews and Palestinians share a very similar HLAgenetic pool (Table 3, Figures 4, 5 and 6) that support acommon ancient Canaanite origin. Therefore, the originof the long-lasting Jewish-Palestinian hostility is the fightfor land in ancient times. Religious and cultural haveenhanced the conflict in the last centuries, together withthe massive European, American, Asian and African Jewssettlements in the area, which has also caused a massivedisplacement of Palestinians and wars. A difficultproblem has now been created between two communitiesthat are close genetic relatives.
Regarding Palestinian population identity, it isclear that they spoke a language different to Arab orJewish in ancient times and only a few words have beenpreserved. Palestinians named their leaders or princesas “seren” (Basque, Zar = old man, en = the most impo-rtant) [7]. The study of this and other words suggests
that they spoke a Dene-Caucasian language like otherMediterranean populations [30,31]. The typical Philistinecrest-hut already appeared in the Cretan Phaistos Disk(1600 BC) and in the Ramses III-Medinet Habu temple,Egypt (1200 BC, [5]).
The Eurocentric confusion “Arab = Muslim” has alsolowered the Palestinian identity by identifying the countrywere Mohammed was born (Saudi Arabia) with theMuslim religion; it also has artificially divided peoplesboth coming from ancient Canaanites (Jews and Pales-tinians).
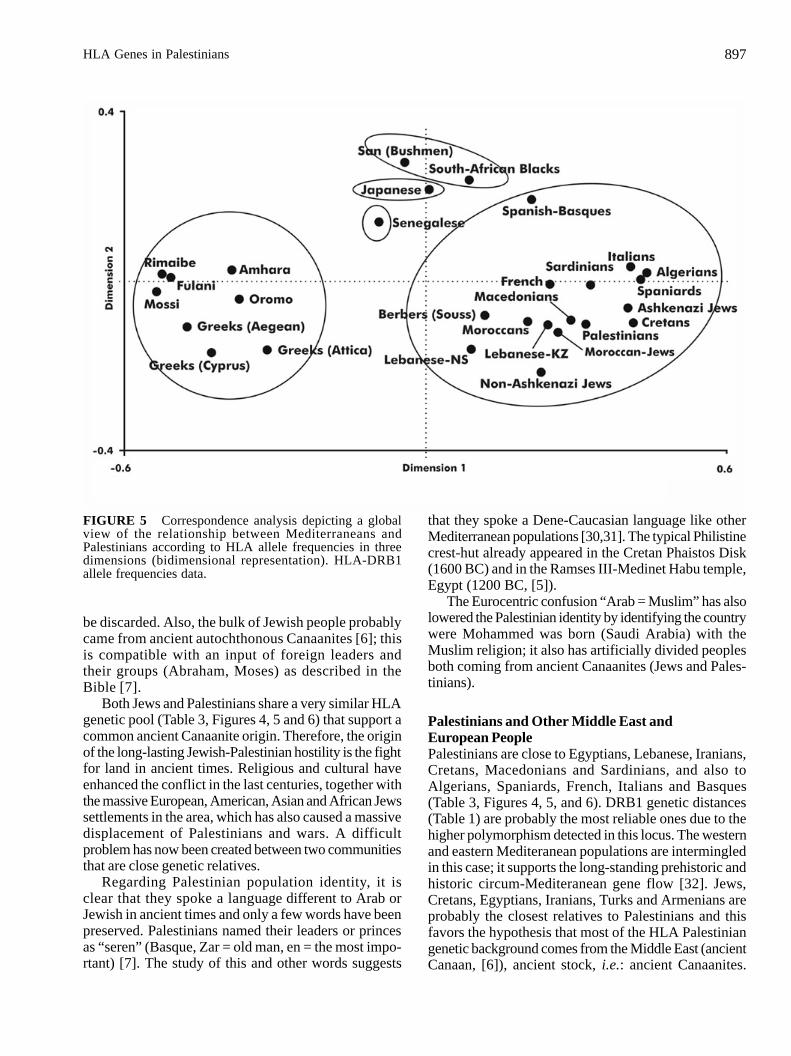
Palestinians and Other Middle East andEuropean PeoplePalestinians are close to Egyptians, Lebanese, Iranians,Cretans, Macedonians and Sardinians, and also toAlgerians, Spaniards, French, Italians and Basques(Table 3, Figures 4, 5, and 6). DRB1 genetic distances(Table 1) are probably the most reliable ones due to thehigher polymorphism detected in this locus. The westernand eastern Mediteranean populations are intermingledin this case; it supports the long-standing prehistoric andhistoric circum-Mediteranean gene flow [32]. Jews,Cretans, Egyptians, Iranians, Turks and Armenians areprobably the closest relatives to Palestinians and thisfavors the hypothesis that most of the HLA Palestiniangenetic background comes from the Middle East (ancientCanaan, [6]), ancient stock, i.e.: ancient Canaanites.
FIGURE 5 Correspondence analysis depicting a globalview of the relationship between Mediterraneans andPalestinians according to HLA allele frequencies in threedimensions (bidimensional representation). HLA-DRB1allele frequencies data.
897
A. Arnaiz-Villena et al.
Canaan had received gene and cultural flow fromMesopotamia, Anatolia and Egypt [6].
Palestinians, Cretans and GreeksThe Biblical origin for Palestinians (Crete) cannot bedisregarded [7] because an “elite” group could havejoined to Canaanite proto-Palestinian tribes and madethemselves noticeable; this is supported by the ancientPalestinians high war technology and the manyconfrontations with the Jews after 1500 BC [6,7].
It is very unlikely that a massive immigration ofPalestinians came from Crete [6]. Egyptian garrisons inCanaan abandoned to their fate by the Egyptian Kingdomweakness may have catalyzed the union of someCanaanite tribes to become the historical Palestinians,according to Amelie Kuhrt [6].
By 1500-1200 BC the Greek presence was very scarcein Canaan, according to archaeologic records [6]. In fact,the “Mycaenian” Greeks attacked Crete by 1450 BC afterrendering tributes to Cretans by a relatively long period.
The Cretan Aegean Sea empire was destroyed andcontinued by the Mycaenians. Greeks are found to havea substantial HLA gene flow from sub-Saharan Ethiopianand Black people [3,20]. This is why Greeks areMediterranean outliers in all kind of analyses [19-21,28].This African genetic and cultural input was documentedby Herodotus [33] who states that the daughters ofDanaus (who were black) came from Egypt in greatnumbers to settle in Greece. Also, ancient Greeks believedthat their religion and culture came from Egypt [33]. Anexplanation of the Egypt-to-Greece migration may bethat a densely populated Sahara (before 5000 BC) mayhave contained an admixture of Negroid and Caucasoidpopulations, and some of the Negroid populations mayhave migrated by chance or unknown causes towardspresent day Greece [19,34-36].
This could have occurred when hyperarid Saharancondition become established and large-scale migrationoccurred in all directions out from the desert. In thiscase, the most ancient Greek Pelasgian substratum wouldcome from a Negroid stock. A more likely explanationis that at an undetermined time during Egyptianpharaonic times a Black dynasty with their followerswere expelled and went towards Greece where theysettled [20, 30].
Once an African input to the ancient Greek geneticpool is established, it remains to be determined what the
FIGURE 6 Correspondence analysis depicting a globalview of the relationship among Palestinians, WestMediterraneans, East Mediterraneans, Greeks and sub-Saharian populations and Blacks according to HLA allelefrequencies in three dimensions (bidimensionalrepresentation) . HLA-DR and DQ (low resolution) allelefrequencies data.
898
HLA Genes in Palestinians
cultural importance of this input is for constructing theclassical Hellenistic culture. The reason why a sub-Saharan admixture is not seen in Crete is unclear butmay be related to the influential and strong Minoanempire, which hindered foreigners establishment if theAfrican invasion occurred in Minoan times [19, 20].
ACKNOWLEDGMENTS
We are grateful to Alberto Garcia for his help with artdesign work on the computer. We also thank M. Nei forproviding the GNKDST and TREEVIEW programsfound on the DISPAN software. This work was supportedin part by grants from the Spanish Ministry of Education(PM95-57 and PM96-21) and the Madrid RegionalGovernment (06/70/97 and 8.3/14/98).
REFERENCES
1. Dausset J, Colombani J: Histocompatibility Testing1972. Copenhagen, Munksgaard, 1972.
2. Imanishi T, Wakisaka A, Gojorobi T: Genetic relation-ships among various human populations indicated byMHC polymorphisms. In Tsuji K, Aizawa M, SasazukiT (eds): HLA 1991. Vol 1. Oxford, Oxford UniversityPress, 627-32, 1992.
3. Clayton J, Lonjou C: Allele and Haplotype frequenciesfor HLA loci in various ethnic groups. In Charron D
(ed): Genetic diversity of HLA, Functional and MedicalImplications. Vol 1. Paris, EDK, 665-820, 1997.
4. Encyclopaedia Britannica (1999) Sutton, Surney:Encyclopaedia Britannica International Ltd.
5. Kienitz FK: Volker imm schatten. Die gegenspieter derGriechen und Römer. Munchen, Beck’scheVerlagsbuchhandlung, 1981.
6. Kuhrt A: The ancient Near East (3000-330 BC). Vol II.Barcelona, Editorial Critica, 2001.
7. Biblia de Jerusalén. Desclee de Brouwer (ed): Bilbao,Spain, 1998.
8. Martínez-Laso J, Gazit E, Gómez-Casado E, Morales P,Martinez-Quiles N, Alvarez M, Martin-Villa JM, Fernan-dez V, Arnaiz-Villena A: HLA DR and DQ polymor-phism in Ashkenazi and non-Ashkenazi Jews: comparisonwith other Mediterraneans. Tissue Antigens 47: 63, 1996.
9. Sellier J, Sellier A: Atlas des Peuples d’Orient. Paris,Editions La Dècouverte, 1993.
10. Gonem A: The encyclopaedia of the peoples of theworld. Jerusalem, Publishing House Ltd, 143-5, 1996.
11. El Estado del Mundo, 2000. Anuario geopolítico.Madrid, Akal Editions, 2000.
12. Arnaiz-Villena A, Timón M, Corell A, Pérez-Aciego P,Martín-Villa JM, Regueiro JR: Primaryimmunodeficiency caused by mutations in the gene
TABLE 4 Most frequent HLA-A, -B, -DRB1, and -DQB1 extended haplotypes in the Palestinian population and their possibleorigin.
Haplotypes HF (%) Possible origin
A*69-B*49-DRB1*0403-DQB1*0302a 2.4 Palestinian/ MediterraneanA*01-B*35-DRB1*1104-DQB1*0301b 1.8 Mediterranean/ Central EuropeanA*24-B*18-DRB1*1104-DQB1*0301c 1.8 Central-South-EurasianA*03-B*35-DRB1*0701-DQB1*02d 1.5 Mediterranean/ Central EuropeanA*02-B*41-DRB1*0701-DQB1*02 1.5 PalestinianA*01-B*35-DRB1*1101-DQB1*0301e 1.2 Mediterranean/ Central EuropeanA*24-B*35-DRB1*1101-DQB1*0301f 1.2 Mediterranean/ Central EuropeanA*23-B*44-DRB1*0701-DQB1*02g 1.2 Mediterranean/ EuropeanA*02-B*50-DRB1*0701-DQB1*02h 1.2 EurasiaticA*02-B*35-DRB1*1401-DQB1*0503i 0.9 MediterraneanA*24-B*35-DRB1*0403-DQB1*0302j 0.9 Eastern MediterraneanA*02-B*18-DRB1*1104-DQB1*0301k 0.9 MediterraneanA*33-B*14-DRB1*0102-DQB1*0501l 0.9 Mediterranean
HF: Haplotype frequency. a. This complete haplotype has not been found in any of the populations tested, however partial and generic typing B49-DR4 is presentin French (HF: 1.0), Sardinians (HF: 4.1) and Spaniards (HF: 1.6). b and e. Extended haplotype (generic typing) has been found in Turks (HF: 0.9). Also, the partialhaplotype B35-DR11-DQ7 is present in South African Negroid (HF: 2.1), Albanians (HF: 3.3), Armenians (HF: 5.0), Jews (HF: 6.2), Austrians (HF: 4.0), French(HF: 1.1), Germans (HF: 3.4), Greeks (HF: 2.6), Italians (HF: 6.8), Spaniards (HF: 1.3), Hungarians (HF: 3.9), Indians (HF: 3.1), Timorese (HF: 2.1) andCaucasoid Australians (HF: 3.7). c. Haplotype found in Armenians (2.1%) and Italians (0.7%). d. Also found in Germans (HF: 1.0) and Portuguese (HF: 2.3). f.Present in Austrians (HF: 2.7), Germans (HF: 1.4) and Italians (HF: 1.4). g. Mediterranean-Europeans. h. Present in Mongolians (HF: 3.2), Manchu (HF: 2.2),Spaniards (HF: 1.2) and Italians (HF: 0.5) (10turk). i. Extended haplotype found in Mexican Mestizos (HF: 2.9). Partially (B35-DR14) found in Italians (HF: 3.1),Greeks (HF: 1.7), and French (HF: 1.0). j. Partially (B35-DR4) found in Jews (HF: 6.0). k. This haplotype has been found in Albanians (3.9%), Italians (2.1%),Yugoslavs (3.5%), Turks (1.1%), Spaniards (1.1%) and Greeks (4.0%). l. Haplotype previously described as Mediterranean.
Other low frequency haplotypes present in Palestinians are also shared with Mediterraneans and central Europeans (A*01-B*08-DRB1*0301-DQB1*02, HF:0.6;A*03-B*07-DRB1*1501-DQB1*0602, HF: 0.6), Mediterraneans (A*02-B*35-DRB1*1104-DQB1*0301, HF:0.6; A*23-B*35-DRB1*1001-DQB1*0501,HF:0.6), Eurasiatics (A*02-B*08-DRB1*0301-DQB1*02, HF: 0.6), South West Asians (A*30-B*49-DRB1*1001-DQB1*0501, HF:0.6; A*02-B*49-DRB1*1001-DQB1*0501, HF:0.6; A*02-B*35-DRB1*0403-DQB1*0302, HF: 0.6), African Blacks (A*02-B*42-DRB1*0302, HF:0.6). Also, probably autochthonous A*02-B*50-DRB1*0402-DQB1*0302 (HF:0.6) haplotype has been found. Comparisons were made by using references [3,8,16-21,27-29]
899
A. Arnaiz-Villena et al.
encoding the CD3-gg subunit of the T-lymphocytereceptor. N Eng J Med 327:529, 1992.
13. Excoffier L, Slatkin M: Maximum-likelihood estimationof molecular haplotype frequencies in a diploidpopulation. Mol Biol Evol 12:921, 1995.
14. Imanishi T, Akaza T, Kimura A, Tokunaga K, GojorobiT: Estimation of allele and haplotype frequencies forHLA and complement loci. In Tsuji K, Aizawa M,Sasazuki T (eds): HLA 1991. Vol I. Oxford, OxfordUniversity Press, 76-9, 1992.
15. Mattiuz PL, Ihde D, Piazza A, Ceppelini R, WodmerWF. Histocompatibility Testing 1970. Copenhagen,Munksgaard, 193-206, 1970
16. Imanishi T, Akaza T, Kimura A, Tokunaga K, GojoboriT: Allele and haplotype frequencies for HLA andcomplement loci in various ethnic groups. In Tsuji K,Aizawa M, Sasazuki T (eds): HLA 1991. Vol 1. Oxford:Oxford University Press, 1065-220, 1992.
17. Arnaiz-Villena A, Benmamar D, Álvarez M, Díaz-Campos N, Varela P, Gomez-Casado E, Martinez-LasoJ: HLA allele and haplotype frequencies in Algerians.Relatedness to Spaniards and Basques. Hum Immunol43:259, 1995.
18. Arnaiz-Villena A, Martínez-Laso J, Gómez-Casado E,Díaz-Campos N, Santos P, Martinho A, Breda-CoimbraH: Relatedness among Basques, Portuguese, Spaniards,and Algerian studied by HLA allelic frequencies andhaplotypes. Immunogenetics 47:37, 1997.
19. Arnaiz-Villena A, Iliakis P, González-Hevilla M,Longás J, Gomez-Casado E, Sfyridaki K, Trapaga J,Silvera-Redondo C, Matsouka C, Martínez-Laso J: Theorigin of Cretan population as determined bycharacterization of HLA alleles. Tissue Antigens53:213, 1999.
20. Arnaiz-Villena A, Dimitroski K, Pacho A, Moscoso J,Gomez-Casado E, Silvera C, Varela P, Martinez-LasoJ: HLA genes in Macedonians and the sub-Saharanorigin of the Greeks. Tissue Antigens 57:118, 2001.
21. Arnaiz-Villena A, Carin M, Bendikuze N, Gomez-Casado E, Moscoso J, Silvera C, Pacho A, Allende L,Guillén J, Martinez-Laso J: HLA alleles and haplotypesin the Turkish population: relatedness to Kurds,Armenians and other Mediterraneans. Tissue Antigens57:308, 2001.
22. Saitou N, Nei M: The neighbor-joining method: a newmethod for reconstructing phylogenetic trees. Mol BiolEvol 4:406, 1987.
23. Nei M: Genetic distances between populations. Am Nat:106:283, 1972.
24. Nei M: Analysis of gene diversity in subdividedpopulations. Proc Natl Acad Sci USA 70:3321, 1973.
25. Nei M, Tajima F, Tateno Y: Accuracy of estimatedphylogenetic trees from molecular data II. Genefrequency data. J Mol Evol 19:153, 1983.
26. Young FW, Bann CM: A Visual Statistics system. In
Stine RA & Fox J (eds): Statistical ComputingEnvironments for Social Researchers. New York, Sagepublications, 207-36, 1996.
27. Martínez-Laso J, De Juan D, Martínez-Quiles N,Gómez-Casado E, Cuadrado E, Arnaiz-Villena A: Thecontribution of the HLA-A, -B, -C and -DR, -DQ DNAtyping to the study of the origins of Spaniards andBasques. Tissue Antigens: 45:237, 1995.
28. Gomez-Casado E, del Moral P, Martinez-Laso J, García-Gómez A, Allende L, Silvera-Redondo C, Longas J,González-Hevilla M, Kandil M, Zamora J, Arnaiz-Villena A: HLA genes in Arabic-speaking Moroccans:close relatedness to Berbers and Iberians. TissueAntigens 55:239, 2000.
29. Bias W, Gazit E: 12th International HistocompatibilityWorkshop: Anthropology SWAS regional report. In Cha-rron D (ed): Genetic diversity of HLA, Functional andMedical Implications. Vol 1. Paris, EDK, 353-363, 1997.
30. Arnaiz-Villena A, Martinez-Laso J, Alonso-García J:The correlation between languages and genes: the usko-Mediterranean peoples. Human Immunol (This issue)
31. Arnaiz-Villena A, Alonso-Garcia J: The Usko-Medi-terranean languages. In Arnaiz-Villena A (ed): Prehisto-ric Iberia: Genetics, Anthropology and Linguistics. NewYork, Kluwer Academic-Plenum Publishers, 2000.
32. Arnaiz-Villena A, Martinez-Laso J, Alonso-Garcia A.Iberia: Population genetics, Anthropology, andlinguistics. Hum Biol 71:725, 1999.
33. Herodotus: History. Madrid, Ed. Gredos, 1989.
34. Arnaiz-Villena A, Alonso-García J: El origen de losVascos y otros pueblos Mediterraneos. Madrid, Edito-rial Complutense SA, 1998.
35. Arnaiz-Villena A, Alonso-García J: Minoicos, Creten-ses y Vascos. Un estudio genético y lingüístico. Ma-drid, Editorial Complutense SA, 1999.
36. Arnaiz-Villena A, Alonso-García J: Egipcios,Bereberes, Guanches y Vascos. Madrid, EditorialComplutense SA, 2000.
37. Grollemberg LH: The Penguin shorter Atlas of the Bible.New York, Penguin Books Ltd, 1978.
38 Izaabel H, Garchon HJ, Caillat-Zucman S, Beaurain G,Akhayat O, Bach JF, Sanchez-Mazas A: HLA class IIDNA polymorphism in a Moroccan population fromthe Souss, Agadir area. Tissue Antigens 51: 106, 1998.
39. Roitberg-Tambur A, Witt CS, Friedmann A, SafirmanC, Sherman L, Battat S, Nelken D, Brautbar C:Comparative analysis of HLA polymorphism at theserologic and molecular level in Moroccan andAshkenazi Jews. Tissue Antigens 46: 104, 1995.
40. Mehra NK, Rajalingam R, Kanga U, McEnemy L,Cullen C, Agarwal S, Middleton D, Pollack MS,Amirzargar A, Singal DP: Genetic diversity of HLA inthe populations of India, Sri Lanka and Iran. In CharronD (ed): Genetic diversity of HLA, Funcional and MedicalImplications. Vol 1. Paris, EDK, 314-20, 1997.
900