9M-2020 RESULTS - Credit insurance, Debt Collection ...
30
9M-2020 RESULTS PRESENTATION TO FINANCIAL ANALYSTS 26 OCTOBER 2020
Transcript of 9M-2020 RESULTS - Credit insurance, Debt Collection ...

9M-2020 RESULTS
PRESENTATION TO FINANCIAL ANALYSTS
26 OCTOBER 2020
2 9M-2020 RESULTS | PRESENTATION TO FINANCIAL ANALYSTS | 26 OCTOBER 2020
9M-2020 RESULTS:
NET INCOME AT €52.4M; ROATE AT 4.1%
9M-2020
HIGHLIGHTS
19M-2020
RESULTS
2 3KEY TAKE-AWAYS
& OUTLOOK
4APPENDICES

PART 1 9M-2020 HIGHLIGHTS

4 9M-2020 RESULTS | PRESENTATION TO FINANCIAL ANALYSTS | 26 OCTOBER 2020
* Launching a share buyback programme for a maximum amount of €15m or 2.4 million shares1 RoATE = Average return on equity2 Badwill is based on preliminary estimates and could vary pending final analysis
Turnover reached €1,082m y-t-d, down -0.9% at constant FX and perimeter following client activity, Q3-2020 down -2.2% y-o-y
• Record new business and retention drive positive net production (€36.9m)
• Confirmed repricing momentum (+1%) as environment remains highly uncertain
• Client activity is decreasing, in line with expectations
9M-2020 net loss ratio up by 10.1 ppts at 55.2%; Net combined ratio increased by 8.5 ppts at 85.3%
• Q3-2020 net loss ratio at 50.0%, up by 2.8 ppts vs Q3-19 but improved 7.4 ppts vs H1-20, reflecting low loss activity
• 9M-2020 net cost ratio improved by 1.6 ppt at 30.1%, reflecting continued cost controls
• Net combined ratio at 77.4% for Q3-2020 benefiting from temporary impact of higher cession rate for around 6.8 points
• In Q3-2020 government schemes improved net cost ratio by 1.1 ppt and net loss ratio by 5.7 ppts. However, impact on pretax profit is a negative -€1m in Q3-2020, and a positive €7m year to date
Net income (group share) at €52.4m, of which €28.5m in Q3-2020; Annualised RoATE1 stands at 4.1%
• Q3-20 benefits from €8.9m purchase gap2 on GIEK Kredittforsikring acquisition as previously announced
Strong balance sheet and positive operational KPIs allow to launch €15m share buyback*
COFACE REPORTS €52.4M NET PROFIT IN 9M-2020 OF WHICH €28.5M IN Q3,
ACTIVATES €15M BUYBACK*

5 9M-2020 RESULTS | PRESENTATION TO FINANCIAL ANALYSTS | 26 OCTOBER 2020
CONTINUOUSLY ACTING TO MITIGATE IMPACT IN A CHALLENGING ENVIRONMENT
COFACE’S WORLD GDP GROWTH FORECAST (annual average, %)
TOTAL EXPOSURE* IS DOWN(in € bn)
-1.7
4.33.2
2.5 2.7 3.0 3.02.3
3.3 3.22.6
-4.8
4.4
'09 '10 '11 '12 '13 '14 '15 '16 '17 '18 '19 '20 '21
Source: IMF, National authorities, National data, Datastream, Coface
• Coface anticipates a very gradual recovery in world GDP
• Risk prevention actions remain at an elevated level (x 2.5 vs Q3-19)
• Risk exposures are significantly down (-3% in Q3, -9% YTD)
INCREASED PREVENTION ACTIONS(# of credit limits cancelled or reduced)
40,000
90,000
140,000
190,000
240,000
290,000
Q1'16
Q1'17
Q1'18
Q1'19
Q1'20
x 2.5 vs 9M-19
450
470
490
510
530
550
H1-18 FY-18 H1-19 FY-19 9M-20
-9.1%
6 9M-2020 RESULTS | PRESENTATION TO FINANCIAL ANALYSTS | 26 OCTOBER 2020
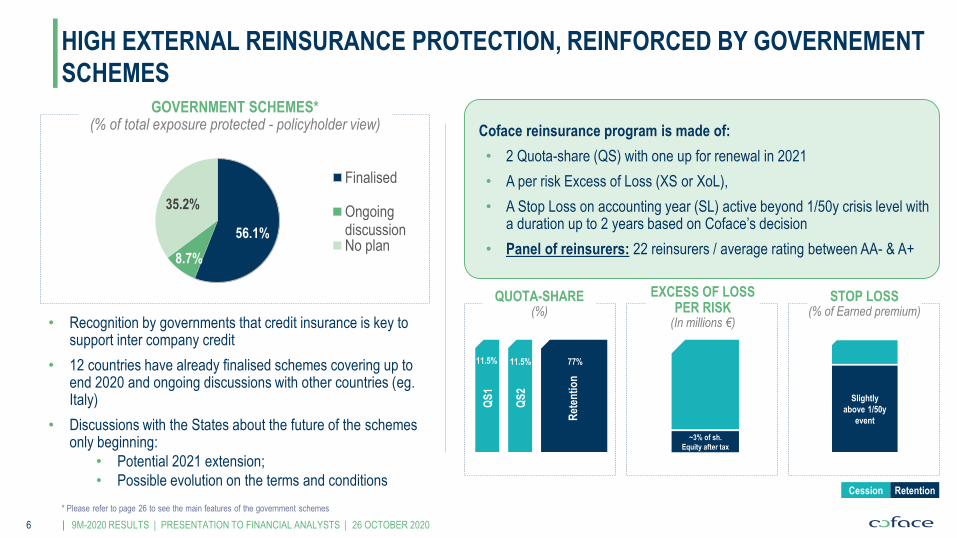
HIGH EXTERNAL REINSURANCE PROTECTION, REINFORCED BY GOVERNEMENT
SCHEMES
Coface reinsurance program is made of:
• 2 Quota-share (QS) with one up for renewal in 2021
• A per risk Excess of Loss (XS or XoL),
• A Stop Loss on accounting year (SL) active beyond 1/50y crisis level with a duration up to 2 years based on Coface’s decision
• Panel of reinsurers: 22 reinsurers / average rating between AA- & A+
QUOTA-SHARE (%)
QS
1
Ret
enti
on
QS
2
11.5% 11.5% 77%
RetentionCession
GOVERNMENT SCHEMES*(% of total exposure protected - policyholder view)
• Recognition by governments that credit insurance is key to support inter company credit
• 12 countries have already finalised schemes covering up to end 2020 and ongoing discussions with other countries (eg. Italy)
• Discussions with the States about the future of the schemes only beginning:
• Potential 2021 extension;
• Possible evolution on the terms and conditions
56.1%
8.7%
35.2%
Finalised
OngoingdiscussionNo plan
STOP LOSS (% of Earned premium)
EXCESS OF LOSS PER RISK
(In millions €)
~3% of sh.
Equity after tax
Slightly
above 1/50y
event
* Please refer to page 26 to see the main features of the government schemes

PART 2 9M-2020 RESULTS

8 9M-2020 RESULTS | PRESENTATION TO FINANCIAL ANALYSTS | 26 OCTOBER 2020
TURNOVER DECREASING SLIGHTLY AT -0.9%
Gross Earned Premiums(GEP)
Insurance related fees
Other revenue
In €m
Fees / GEP ratio
1 Including Bonding and Single RiskV% V% ex. FX
Total revenue down -0.9% vs 9M-2019 at constant FX
• Trade Credit Insurance1 decreasing by 1.1% at constant FX and perimeter driven by declining client activity
• Positive net production reaching €36.9m
• Services revenues up 6.9% vs 9M-2019 at constant FX and perimeter, with information sales up 10%
• Factoring down by -11.5% (and -6.5% in Q3) due to volume decline while repricing actions have started
• Fees up by 3.3% at constant FX and perimeter
(1.9)% (0.9)%
78 75107 110
918 897
1,103 1,082
9M-2019 9M-2020
11.7% 12.3%
9M-2019 9M-2020

9 9M-2020 RESULTS | PRESENTATION TO FINANCIAL ANALYSTS | 26 OCTOBER 2020
88 89
9M-19 9M-20
Total revenue by region, in €m
TURNOVER MOSTLY REFLECTING LOWER CLIENT ACTIVITY
Lower activity (-5%), offset by lower premium refunds, high single risk and
services
Strong retention, positive effect of repricing and increase of services (+7%)
Low client activity and decline of factoring (-13%)
Very low client activity in TCI (revenues down -4%) and low factoring volumes
Higher new business and improved
pricing offset by lower activityLower client activity offsetting
good retention
Low new business and activity, positive price effectV% V% ex. FX
Western Europe Northern Europe Central Europe Mediterranean & Africa
North America Asia Pacific Latin America
(5.0)% (6.0)%0.2% (0.0)% (2.9)% (3.6)% 1.1% 2.1%
(0.4)% (0.1)% (17.5)% 2.0%1.5% 1.3%
233 221
9M-19 9M-20
219 220
9M-19 9M-20
110 107
9M-19 9M-20
289 292
9M-19 9M-20
103 102
9M-19 9M-20
62 51
9M-19 9M-20

10 9M-2020 RESULTS | PRESENTATION TO FINANCIAL ANALYSTS | 26 OCTOBER 2020
CONTINUED STRONG COMMERCIAL METRICS
* Portfolio as of 30 September 2020; and at constant FX and perimeter. New production: in €m
Record high retention
Selective repricing under way
As expected, client activity is declining further
Record high new business while keeping selective
growth strategyNew
pro
du
ctio
n*
Ret
enti
on
rate
*
Pri
ce
effe
ct*
Vo
lum
e
effe
ct*
10290 96
114
9M-17 9M-18 9M-19 9M-20
89.7%91.4% 92.2% 92.7%
9M-17 9M-18 9M-19 9M-20
(1.6)% (1.5)% (1.1)%
1.0%
9M-17 9M-18 9M-19 9M-20
3.5%4.8%
2.4%
-0.7%9M-17 9M-18 9M-19 9M-20
11 9M-2020 RESULTS | PRESENTATION TO FINANCIAL ANALYSTS | 26 OCTOBER 2020
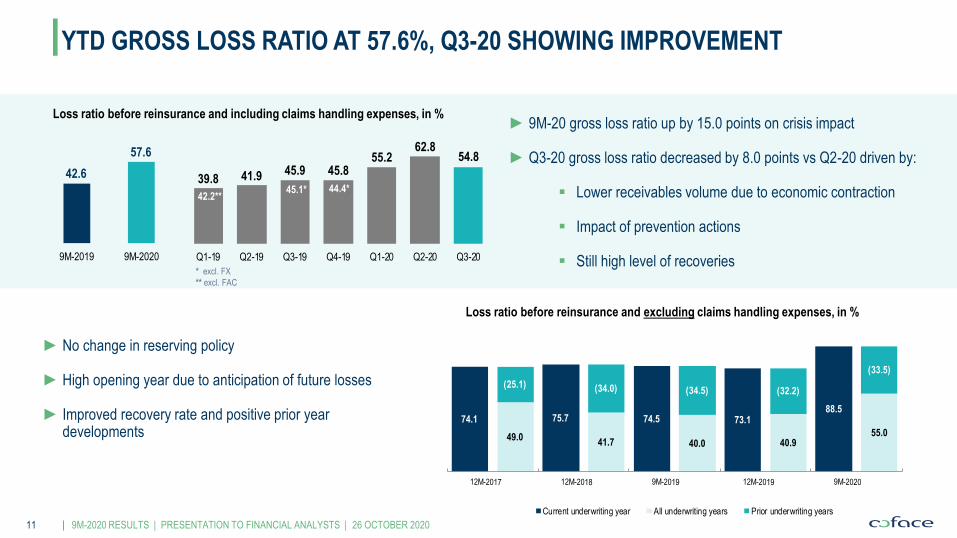
Loss ratio before reinsurance and including claims handling expenses, in %
Loss ratio before reinsurance and excluding claims handling expenses, in %
► No change in reserving policy
► High opening year due to anticipation of future losses
► Improved recovery rate and positive prior year developments
YTD GROSS LOSS RATIO AT 57.6%, Q3-20 SHOWING IMPROVEMENT
* excl. FX
** excl. FAC
► 9M-20 gross loss ratio up by 15.0 points on crisis impact
► Q3-20 gross loss ratio decreased by 8.0 points vs Q2-20 driven by:
Lower receivables volume due to economic contraction
Impact of prevention actions
Still high level of recoveries
39.8 41.9 45.9 45.855.2
62.854.8
Q1-19 Q2-19 Q3-19 Q4-19 Q1-20 Q2-20 Q3-20
42.6
57.6
9M-2019 9M-2020
42.2**45.1* 44.4*
74.1
49.0
75.7
41.7
74.5
40.0
73.1
40.9
88.5
55.0
(25.1) (34.0) (34.5) (32.2)
(33.5)
Current underwriting year All underwriting years Prior underwriting years

12 9M-2020 RESULTS | PRESENTATION TO FINANCIAL ANALYSTS | 26 OCTOBER 2020
Loss ratio before reinsurance, including claims handling expenses – in %
* % of Total revenue by region
**48.9% excl. FX
LOSS RATIO INCREASE CONTAINED IN ALL REGIONS
**43.8% excl. FX **51.8% excl. FX ***53.4% excl. FX***42.9% excl. FX
Group North America Asia Pacific Latin America
Central EuropeWestern Europe Northern Europe Mediterranean
& Africa
20%*20%* 10%* 27%*
8%*9%* 5%*
51.4 44.2** 43.5***57.6
FY-17 FY-18 FY-19 9M-20
57.248.9 40.9 43.8
FY-17 FY-18 FY-19 9M-20
54.034.6 34.6
56.3
FY-17 FY-18 FY-19 9M-20
49.6 49.7 42.5 48.6
FY-17 FY-18 FY-19 9M-20
48.4 48.8** 46.356.5
FY-17 FY-18 FY-19 9M-20
49.039.1 45.8
74.6
FY-17 FY-18 FY-19 9M-20
35.9
57.9** 60.1***
87.0
FY-17 FY-18 FY-19 9M-20
53.8
23.635.9
51.1
FY-17 FY-18 FY-19 9M-20
13 9M-2020 RESULTS | PRESENTATION TO FINANCIAL ANALYSTS | 26 OCTOBER 2020
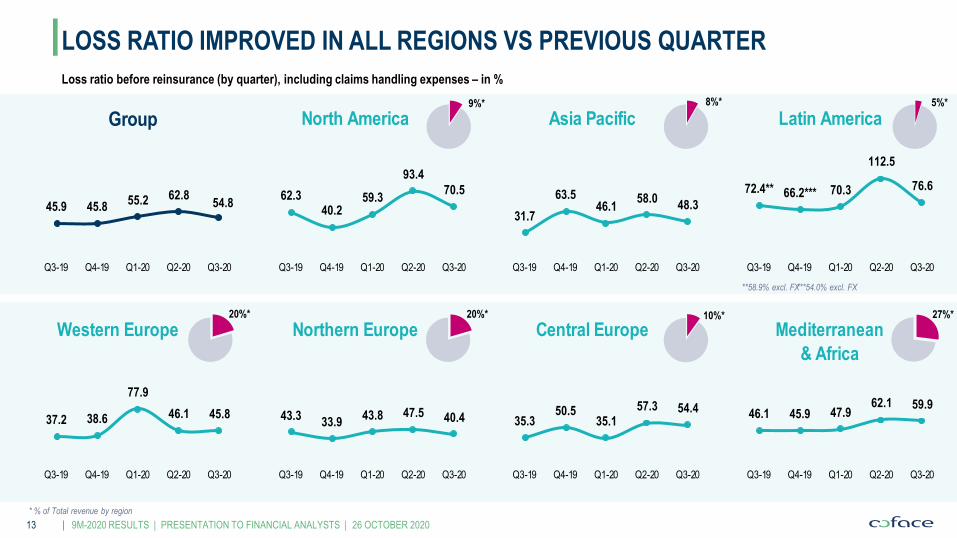
Loss ratio before reinsurance (by quarter), including claims handling expenses – in %
* % of Total revenue by region
LOSS RATIO IMPROVED IN ALL REGIONS VS PREVIOUS QUARTER
**58.9% excl. FX***54.0% excl. FX
Group North America Asia Pacific Latin America8%*9%* 5%*
Central EuropeWestern Europe Northern Europe Mediterranean
& Africa
20%*20%* 10%* 27%*
45.9 45.855.2 62.8
54.8
Q3-19 Q4-19 Q1-20 Q2-20 Q3-20
62.340.2
59.3
93.4
70.5
Q3-19 Q4-19 Q1-20 Q2-20 Q3-20
31.7
63.546.1
58.048.3
Q3-19 Q4-19 Q1-20 Q2-20 Q3-20
72.4** 66.2*** 70.3
112.5
76.6
Q3-19 Q4-19 Q1-20 Q2-20 Q3-20
43.333.9
43.8 47.5 40.4
Q3-19 Q4-19 Q1-20 Q2-20 Q3-20
37.2 38.6
77.9
46.1 45.8
Q3-19 Q4-19 Q1-20 Q2-20 Q3-20
35.350.5
35.157.3 54.4
Q3-19 Q4-19 Q1-20 Q2-20 Q3-20
46.1 45.9 47.962.1 59.9
Q3-19 Q4-19 Q1-20 Q2-20 Q3-20
14 9M-2020 RESULTS | PRESENTATION TO FINANCIAL ANALYSTS | 26 OCTOBER 2020
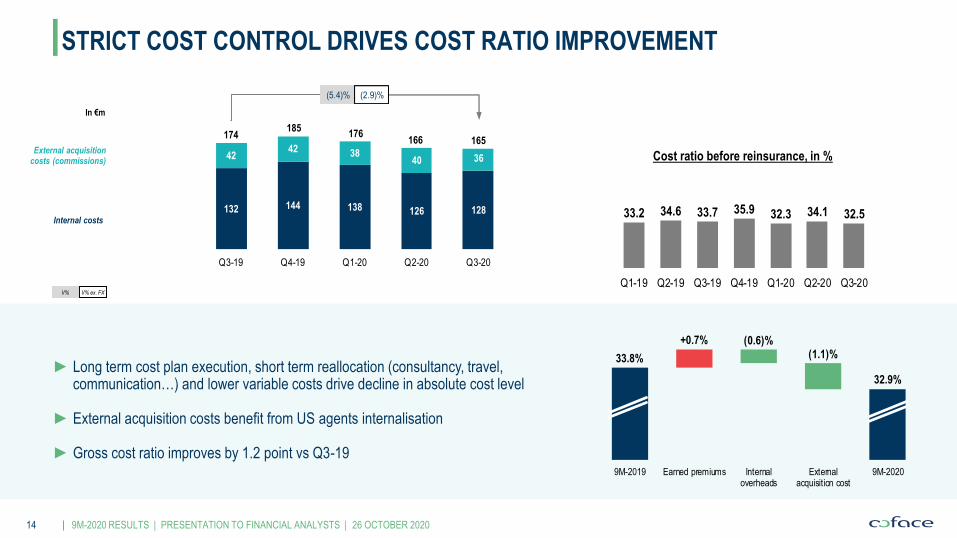
33.8%
32.9%
(0.6)%(1.1)%
+0.7%
9M-2019 Earned premiums Internaloverheads
Externalacquisition cost
9M-2020
External acquisition costs (commissions)
Internal costs
In €m
STRICT COST CONTROL DRIVES COST RATIO IMPROVEMENT
► Long term cost plan execution, short term reallocation (consultancy, travel, communication…) and lower variable costs drive decline in absolute cost level
► External acquisition costs benefit from US agents internalisation
► Gross cost ratio improves by 1.2 point vs Q3-19
V% V% ex. FX
Cost ratio before reinsurance, in %
(5.4)% (2.9)%
132 144 138 126 128
4242 38
40 36
174185
176166 165
Q3-19 Q4-19 Q1-20 Q2-20 Q3-20
33.2 34.6 33.7 35.9 32.3 34.1 32.5
Q1-19 Q2-19 Q3-19 Q4-19 Q1-20 Q2-20 Q3-20
15 9M-2020 RESULTS | PRESENTATION TO FINANCIAL ANALYSTS | 26 OCTOBER 2020
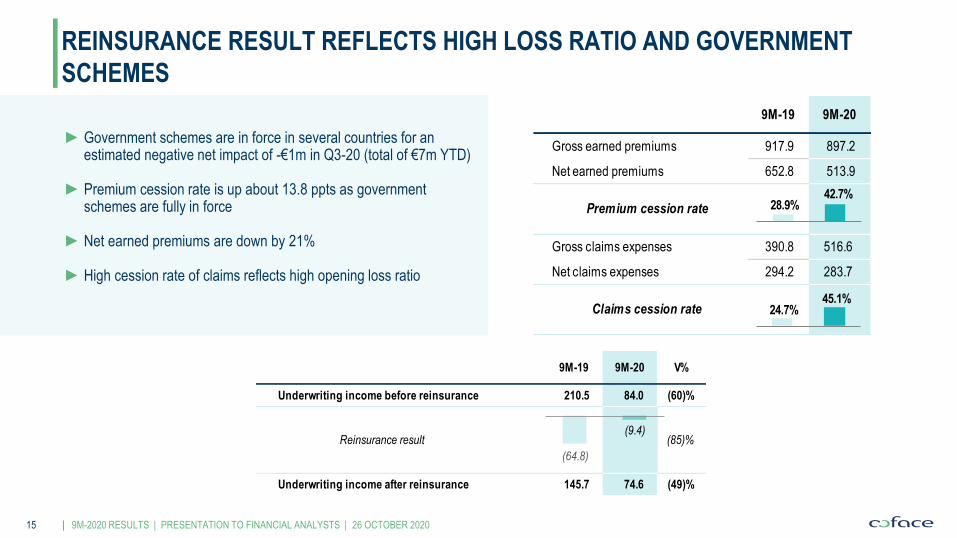
► Government schemes are in force in several countries for an estimated negative net impact of -€1m in Q3-20 (total of €7m YTD)
► Premium cession rate is up about 13.8 ppts as government schemes are fully in force
► Net earned premiums are down by 21%
► High cession rate of claims reflects high opening loss ratio
REINSURANCE RESULT REFLECTS HIGH LOSS RATIO AND GOVERNMENT
SCHEMES
9M-19 9M-20
Gross earned premiums 917.9 897.2
Net earned premiums 652.8 513.9
Gross claims expenses 390.8 516.6
Net claims expenses 294.2 283.7
Premium cession rate
Claims cession rate
28.9%42.7%
24.7%45.1%
9M-19 9M-20 V%
Underwriting income before reinsurance 210.5 84.0 (60)%
Underwriting income after reinsurance 145.7 74.6 (49)%
Reinsurance result (85)%
(64.8)
(9.4)

16 9M-2020 RESULTS | PRESENTATION TO FINANCIAL ANALYSTS | 26 OCTOBER 2020
45.155.2
31.7
30.1
76.885.3
9M-2019 9M-2020
► Net combined ratio up to 85.3% (vs 76.8% in 9M-2019)due to increase in claims ratio
► Cost ratio down 1.6 ppt showing good cost discipline
► 9M-2020 net loss ratio up by 10.1 ppts in a more complex risk environment
► Net cost ratio decreased to 27.5% (vs 31.0% in Q3-19) benefiting from more reinsurance commissions applied to a smaller retained business
► Loss ratio is down 7.9 ppts vs previous quarter, reflecting higher reinsurance cession of high loss ratio underwriting year and lower cession of recoveries. Effect is expected to partially reverse in coming quarters
NET COMBINED RATIO AT 85.3%
Net cost ratio
Net loss ratio
Net combined ratio
In %
Net cost ratio
Net loss ratio
Net combined ratio
In %
+8.5 ppts
47.1 44.857.1 57.9 50.0
31.0 35.629.7 33.5
27.5
78.1 80.486.8 91.4
77.4
Q3-19 Q4-19 Q1-20 Q2-20 Q3-20
(0.7) ppt

17 9M-2020 RESULTS | PRESENTATION TO FINANCIAL ANALYSTS | 26 OCTOBER 2020
Bonds
65%
Loans,
Deposit & other
financial
23%
Equities
5%
Investment
Real Estate8%
FINANCIAL PORTFOLIO: RESILIENT INVESTMENT INCOME, LOW RATES WILL
CONTINUE TO MATERIALIZE
► Conservative strategy protected balance sheet from volatility; progressively redeploying liquidity
► Low interest rates environment extended beyond 2020
Keeping a diversified strategy * Excludes investments in non-consolidated subsidiaries
** Excludes investments in non-consolidated subsidiaries, FX and investment management charges
*** This represent the cumulative impact of realized gains and losses, impairments and impairments release, as well as equities & interest rate
derivatives. Historical data on page 25
Total
€2.79bn*
€m 9M-19 9M-20
Income from investment portfolio without gains on sales** 32.6 25.8
Gains on sales and impairement, net of hedging*** 1.6 0.6
FX effect 4.0 (2.0)
Other (9.8) (0.9)
Net investment income
Accounting yield
on average investment portfolio1.2% 0.9%
Accounting yield on average investment portfolio without
Realized gains1.2% 0.9%
28.4 23.5
18 9M-2020 RESULTS | PRESENTATION TO FINANCIAL ANALYSTS | 26 OCTOBER 2020
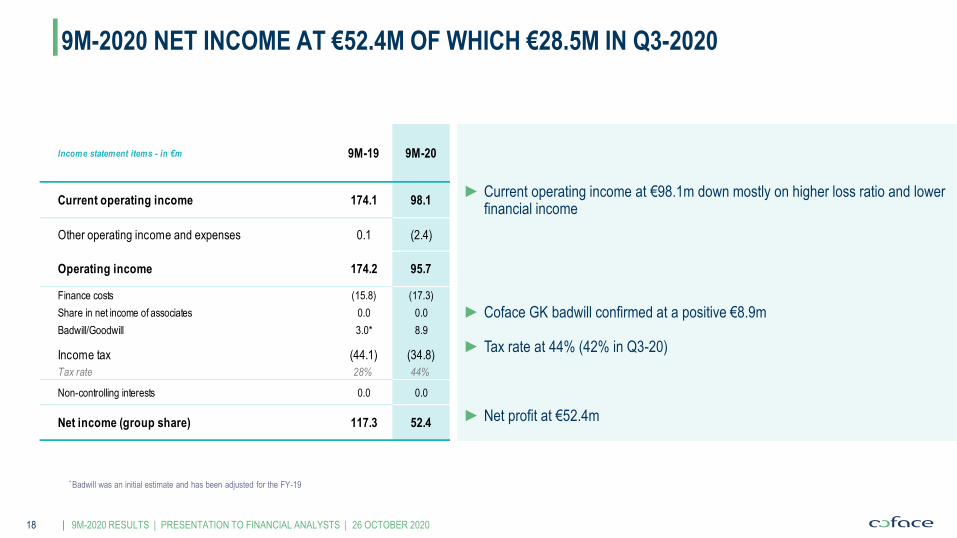
► Current operating income at €98.1m down mostly on higher loss ratio and lower financial income
► Coface GK badwill confirmed at a positive €8.9m
► Tax rate at 44% (42% in Q3-20)
► Net profit at €52.4m
9M-2020 NET INCOME AT €52.4M OF WHICH €28.5M IN Q3-2020
* Badwill was an initial estimate and has been adjusted for the FY-19
Income statement items - in €m 9M-19 9M-20
Current operating income 174.1 98.1
Other operating income and expenses 0.1 (2.4)
Operating income 174.2 95.7
Finance costs (15.8) (17.3)
Share in net income of associates 0.0 0.0
Badwill/Goodwill 3.0* 8.9
Income tax (44.1) (34.8)
Tax rate 28% 44%
Non-controlling interests 0.0 0.0
Net income (group share) 117.3 52.4

19 9M-2020 RESULTS | PRESENTATION TO FINANCIAL ANALYSTS | 26 OCTOBER 2020
ROATE STANDS AT 4.1%, DOWN 4.8 PPTS
Change in equity
In €m
Return on average tangible equity (RoATE)1
1 Annualised RoATE
0.0 52.4 (6.8) (24.2) 1,945.9
IFRS Equityattributable to owners
of the parentDec 31, 2019
Distribution toshareholders
Net income impact Revaluatuion reserve(financial instruments
AFS)
Treasury shares,currency translationdifferences & others
IFRS Equityattributable to owners
of the parentSept. 30, 2020
1,924.5
4.1%(0.5) ppt
8.9% (4.1) ppts
(0.3) ppt
RoATE 31.12.19 Technical result Financial result Tax and others RoATE 30.09.20

PART 3KEY TAKE-AWAYS & OUTLOOK

21 9M-2020 RESULTS | PRESENTATION TO FINANCIAL ANALYSTS | 26 OCTOBER 2020
KEY TAKE-AWAYS & OUTLOOK
9M-2020 demonstrates Coface’s resilience in unprecedented times
• Coface has generated €52.4m net profit in 9M-20 in a disrupted economic environment while maintaining prudent reserving
• Q3-20 shows a reduction in claims level
Coface continues to deploy its Build to Lead strategy
• Strong commercial performance; pricing and service revenues are developing favourably
• Strong balance sheet and good operating KPIs allow for €15m share buyback
The economic environment remains uncertain and is dependant on the sanitary situation and the handling of economic stress by governments and central banks. Coface continues to confidently implement its Build to Lead strategy for the long term.

PART 4APPENDICES
23 9M-2020 RESULTS | PRESENTATION TO FINANCIAL ANALYSTS | 26 OCTOBER 2020
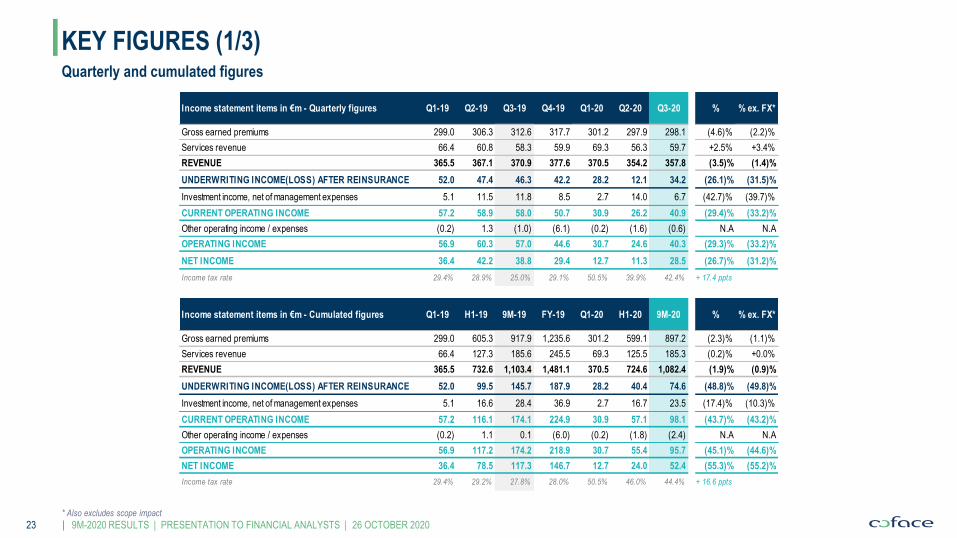
KEY FIGURES (1/3)Quarterly and cumulated figures
* Also excludes scope impact
Income statement items in €m - Quarterly figures Q1-19 Q2-19 Q3-19 Q4-19 Q1-20 Q2-20 Q3-20 % % ex. FX*
Gross earned premiums 299.0 306.3 312.6 317.7 301.2 297.9 298.1 (4.6)% (2.2)%
Services revenue 66.4 60.8 58.3 59.9 69.3 56.3 59.7 +2.5% +3.4%
REVENUE 365.5 367.1 370.9 377.6 370.5 354.2 357.8 (3.5)% (1.4)%
UNDERWRITING INCOME(LOSS) AFTER REINSURANCE 52.0 47.4 46.3 42.2 28.2 12.1 34.2 (26.1)% (31.5)%
Investment income, net of management expenses 5.1 11.5 11.8 8.5 2.7 14.0 6.7 (42.7)% (39.7)%
CURRENT OPERATING INCOME 57.2 58.9 58.0 50.7 30.9 26.2 40.9 (29.4)% (33.2)%
Other operating income / expenses (0.2) 1.3 (1.0) (6.1) (0.2) (1.6) (0.6) N.A N.A
OPERATING INCOME 56.9 60.3 57.0 44.6 30.7 24.6 40.3 (29.3)% (33.2)%
NET INCOME 36.4 42.2 38.8 29.4 12.7 11.3 28.5 (26.7)% (31.2)%
Income tax rate 29.4% 28.9% 25.0% 29.1% 50.5% 39.9% 42.4% + 17.4 ppts
Income statement items in €m - Cumulated figures Q1-19 H1-19 9M-19 FY-19 Q1-20 H1-20 9M-20 % % ex. FX*
Gross earned premiums 299.0 605.3 917.9 1,235.6 301.2 599.1 897.2 (2.3)% (1.1)%
Services revenue 66.4 127.3 185.6 245.5 69.3 125.5 185.3 (0.2)% +0.0%
REVENUE 365.5 732.6 1,103.4 1,481.1 370.5 724.6 1,082.4 (1.9)% (0.9)%
UNDERWRITING INCOME(LOSS) AFTER REINSURANCE 52.0 99.5 145.7 187.9 28.2 40.4 74.6 (48.8)% (49.8)%
Investment income, net of management expenses 5.1 16.6 28.4 36.9 2.7 16.7 23.5 (17.4)% (10.3)%
CURRENT OPERATING INCOME 57.2 116.1 174.1 224.9 30.9 57.1 98.1 (43.7)% (43.2)%
Other operating income / expenses (0.2) 1.1 0.1 (6.0) (0.2) (1.8) (2.4) N.A N.A
OPERATING INCOME 56.9 117.2 174.2 218.9 30.7 55.4 95.7 (45.1)% (44.6)%
NET INCOME 36.4 78.5 117.3 146.7 12.7 24.0 52.4 (55.3)% (55.2)%
Income tax rate 29.4% 29.2% 27.8% 28.0% 50.5% 46.0% 44.4% + 16.6 ppts
24 9M-2020 RESULTS | PRESENTATION TO FINANCIAL ANALYSTS | 26 OCTOBER 2020
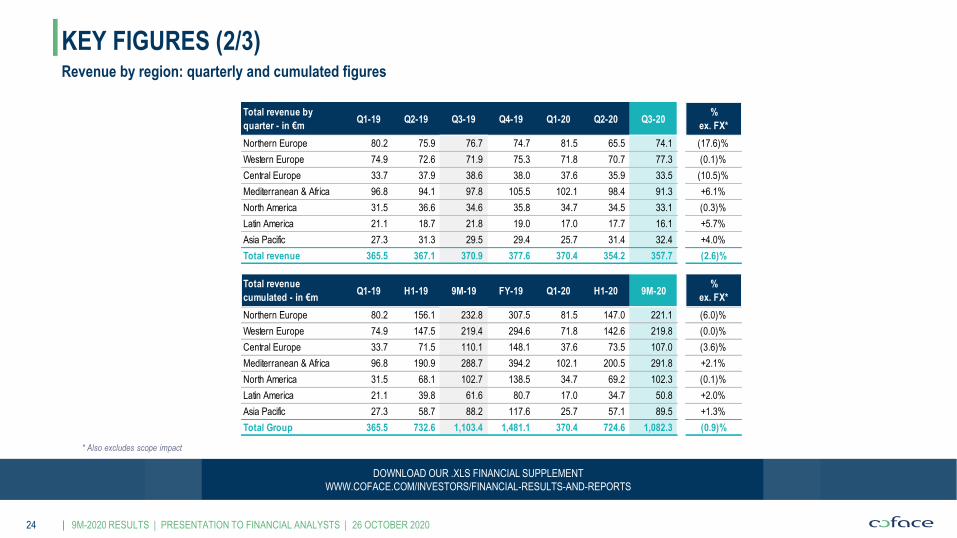
KEY FIGURES (2/3)Revenue by region: quarterly and cumulated figures
DOWNLOAD OUR .XLS FINANCIAL SUPPLEMENT
WWW.COFACE.COM/INVESTORS/FINANCIAL-RESULTS-AND-REPORTS
* Also excludes scope impact
Total revenue by
quarter - in €mQ1-19 Q2-19 Q3-19 Q4-19 Q1-20 Q2-20 Q3-20
Northern Europe 80.2 75.9 76.7 74.7 81.5 65.5 74.1
Western Europe 74.9 72.6 71.9 75.3 71.8 70.7 77.3
Central Europe 33.7 37.9 38.6 38.0 37.6 35.9 33.5
Mediterranean & Africa 96.8 94.1 97.8 105.5 102.1 98.4 91.3
North America 31.5 36.6 34.6 35.8 34.7 34.5 33.1
Latin America 21.1 18.7 21.8 19.0 17.0 17.7 16.1
Asia Pacific 27.3 31.3 29.5 29.4 25.7 31.4 32.4
Total revenue 365.5 367.1 370.9 377.6 370.4 354.2 357.7
%
ex. FX*
(17.6)%
(0.1)%
(10.5)%
+6.1%
(0.3)%
+5.7%
+4.0%
(2.6)%
Total revenue
cumulated - in €mQ1-19 H1-19 9M-19 FY-19 Q1-20 H1-20 9M-20
Northern Europe 80.2 156.1 232.8 307.5 81.5 147.0 221.1
Western Europe 74.9 147.5 219.4 294.6 71.8 142.6 219.8
Central Europe 33.7 71.5 110.1 148.1 37.6 73.5 107.0
Mediterranean & Africa 96.8 190.9 288.7 394.2 102.1 200.5 291.8
North America 31.5 68.1 102.7 138.5 34.7 69.2 102.3
Latin America 21.1 39.8 61.6 80.7 17.0 34.7 50.8
Asia Pacific 27.3 58.7 88.2 117.6 25.7 57.1 89.5
Total Group 365.5 732.6 1,103.4 1,481.1 370.4 724.6 1,082.3
(3.6)%
+2.1%
(0.1)%
+2.0%
%
ex. FX*
(0.0)%
(0.9)%
(6.0)%
+1.3%
25 9M-2020 RESULTS | PRESENTATION TO FINANCIAL ANALYSTS | 26 OCTOBER 2020
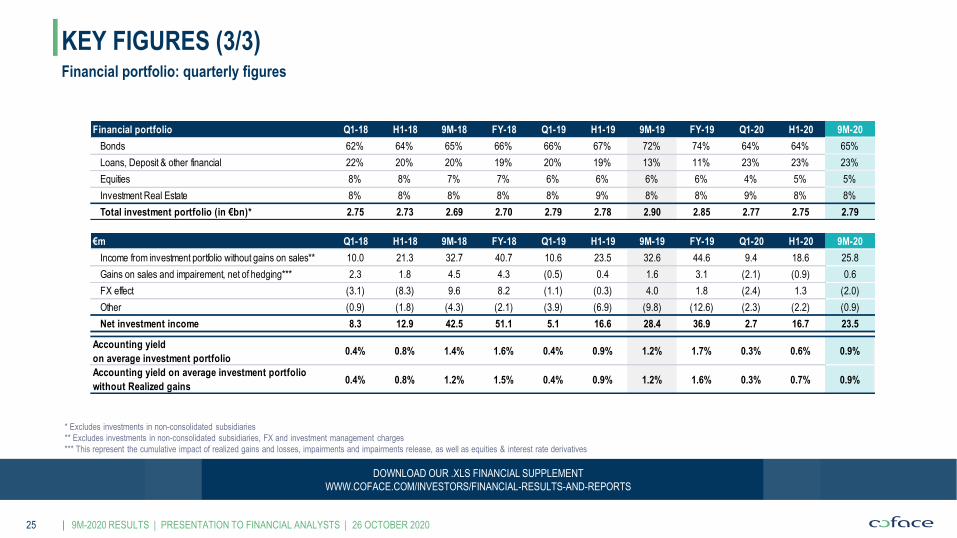
KEY FIGURES (3/3)Financial portfolio: quarterly figures
DOWNLOAD OUR .XLS FINANCIAL SUPPLEMENT
WWW.COFACE.COM/INVESTORS/FINANCIAL-RESULTS-AND-REPORTS
* Excludes investments in non-consolidated subsidiaries
** Excludes investments in non-consolidated subsidiaries, FX and investment management charges
*** This represent the cumulative impact of realized gains and losses, impairments and impairments release, as well as equities & interest rate derivatives
€m Q1-18 H1-18 9M-18 FY-18 Q1-19 H1-19 9M-19 FY-19 Q1-20 H1-20 9M-20
Income from investment portfolio without gains on sales** 10.0 21.3 32.7 40.7 10.6 23.5 32.6 44.6 9.4 18.6 25.8
Gains on sales and impairement, net of hedging*** 2.3 1.8 4.5 4.3 (0.5) 0.4 1.6 3.1 (2.1) (0.9) 0.6
FX effect (3.1) (8.3) 9.6 8.2 (1.1) (0.3) 4.0 1.8 (2.4) 1.3 (2.0)
Other (0.9) (1.8) (4.3) (2.1) (3.9) (6.9) (9.8) (12.6) (2.3) (2.2) (0.9)
Net investment income 8.3 12.9 42.5 51.1 5.1 16.6 28.4 36.9 2.7 16.7 23.5
Accounting yield
on average investment portfolio0.4% 0.8% 1.4% 1.6% 0.4% 0.9% 1.2% 1.7% 0.3% 0.6% 0.9%
Accounting yield on average investment portfolio
without Realized gains0.4% 0.8% 1.2% 1.5% 0.4% 0.9% 1.2% 1.6% 0.3% 0.7% 0.9%
Financial portfolio Q1-18 H1-18 9M-18 FY-18 Q1-19 H1-19 9M-19 FY-19 Q1-20 H1-20 9M-20
Bonds 62% 64% 65% 66% 66% 67% 72% 74% 64% 64% 65%
Loans, Deposit & other financial 22% 20% 20% 19% 20% 19% 13% 11% 23% 23% 23%
Equities 8% 8% 7% 7% 6% 6% 6% 6% 4% 5% 5%
Investment Real Estate 8% 8% 8% 8% 8% 9% 8% 8% 9% 8% 8%
Total investment portfolio (in €bn)* 2.75 2.73 2.69 2.70 2.79 2.78 2.90 2.85 2.77 2.75 2.79
26 9M-2020 RESULTS | PRESENTATION TO FINANCIAL ANALYSTS | 26 OCTOBER 2020
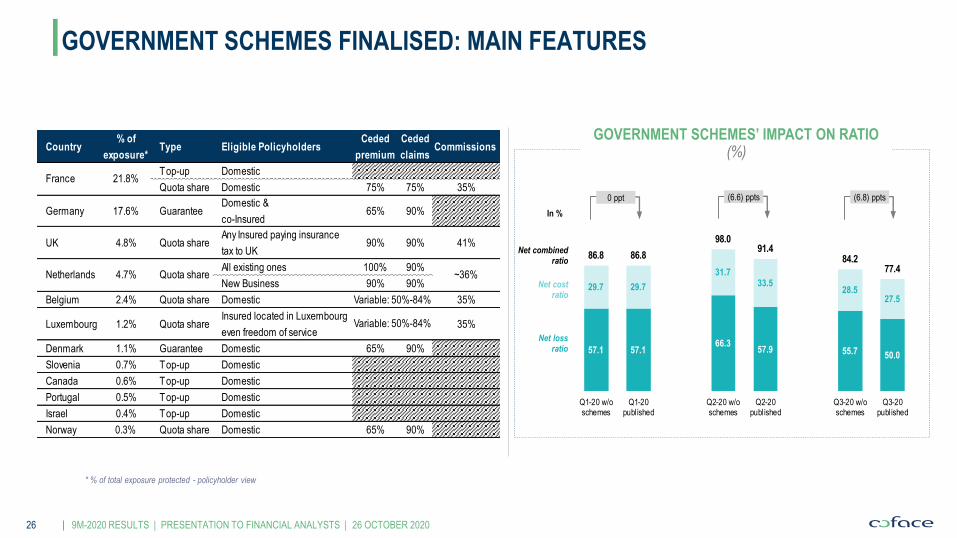
GOVERNMENT SCHEMES’ IMPACT ON RATIO(%)
GOVERNMENT SCHEMES FINALISED: MAIN FEATURES
* % of total exposure protected - policyholder view
(6.8) ppts
Net cost ratio
Net loss ratio
Net combined ratio
In %
(6.6) ppts0 ppt
57.1 57.166.3
57.9 55.7 50.0
29.7 29.7
31.733.5
28.527.5
86.8 86.8
98.091.4
84.277.4
Q1-20 w/oschemes
Q1-20published
Q2-20 w/oschemes
Q2-20published
Q3-20 w/oschemes
Q3-20published
Country% of
exposure*Type Eligible Policyholders
Ceded
premium
Ceded
claimsCommissions
Top-up Domestic
Quota share Domestic 75% 75% 35%
Germany 17.6% GuaranteeDomestic &
co-Insured65% 90%
UK 4.8% Quota shareAny Insured paying insurance
tax to UK90% 90% 41%
All existing ones 100% 90%
New Business 90% 90%
Belgium 2.4% Quota share Domestic 35%
Luxembourg 1.2% Quota shareInsured located in Luxembourg
even freedom of service35%
Denmark 1.1% Guarantee Domestic 65% 90%
Slovenia 0.7% Top-up Domestic
Canada 0.6% Top-up Domestic
Portugal 0.5% Top-up Domestic
Israel 0.4% Top-up Domestic
Norway 0.3% Quota share Domestic 65% 90%
Variable: 50%-84%
21.8%France
Variable: 50%-84%
~36%Netherlands 4.7% Quota share

27 9M-2020 RESULTS | PRESENTATION TO FINANCIAL ANALYSTS | 26 OCTOBER 2020
► Combined ratio before reinsurance
► Combined ratio after reinsurance
COMBINED RATIO CALCULATION
DOWNLOAD OUR .XLS FINANCIAL SUPPLEMENT
WWW.COFACE.COM/INVESTORS/FINANCIAL-RESULTS-AND-REPORTS
loss ratio before reinsurance (B)
(A)+ cost ratio before reinsurance
(C)
(A)
loss ratio after reinsurance (E)
(D)+ cost ratio after reinsurance
(F)
(D)
1
1
In €k 9M-2019 9M-2020
Earned Premiums
Gross earned premiums [A] 917,895 897,180
Ceded premiums (265,069) (383,236)
Net earned premiums [D] 652,825 513,944
Claims expenses
Claims expenses [B] (390,774) (516,555)
Ceded claims 90,429 128,038
Change in claims provisions 6,151 104,835
Net claims expenses [E] (294,194) (283,683)
Technical expenses
Operating expenses (500,060) (481,801)
Employee profit sharing sharing and incentive plans 3,942 957
Other revenue 185,553 185,261
Operating expenses, net of revenues from other services
before reinsurance [C](310,565) (295,584)
Commissions received from reinsurers 103,686 140,927
Operating expenses, net of revenues from other services
after reinsurance [F](206,879) (154,657)
Ratios 9M-2019 9M-2020
Loss ratio before reinsurance 42.6% 57.6%
Loss ratio after reinsurance 45.1% 55.2%
Cost ratio before reinsurance 33.8% 32.9%
Cost ratio after reinsurance 31.7% 30.1%
Combined ratio before reinsurance 76.4% 90.5%
Combined ratio after reinsurance 76.8% 85.3%
28 9M-2020 RESULTS | PRESENTATION TO FINANCIAL ANALYSTS | 26 OCTOBER 2020
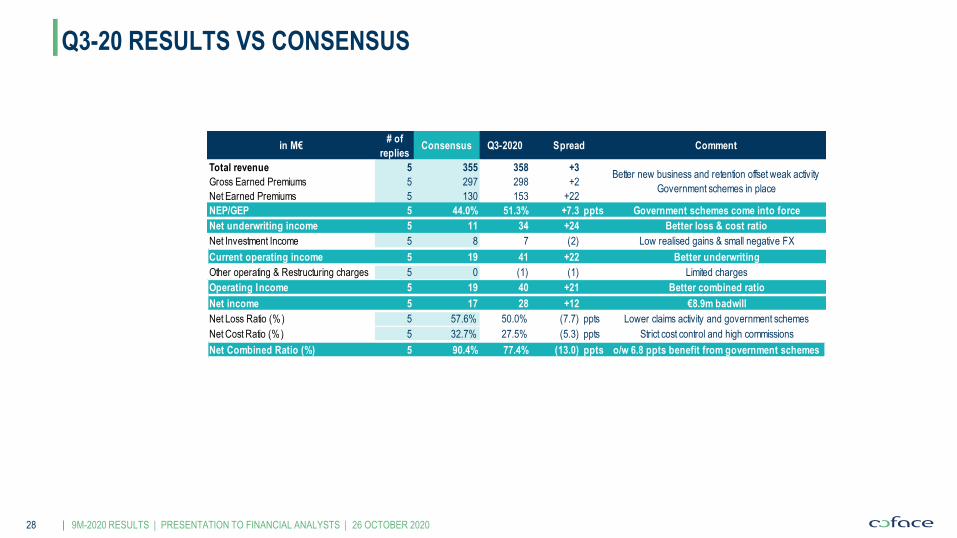
Q3-20 RESULTS VS CONSENSUS
in M€# of
repliesConsensus Q3-2020 Comment
Total revenue 5 355 358 +3
Gross Earned Premiums 5 297 298 +2
Net Earned Premiums 5 130 153 +22
NEP/GEP 5 44.0% 51.3% +7.3 ppts Government schemes come into force
Net underwriting income 5 11 34 +24 Better loss & cost ratio
Net Investment Income 5 8 7 (2) Low realised gains & small negative FX
Current operating income 5 19 41 +22 Better underwriting
Other operating & Restructuring charges 5 0 (1) (1) Limited charges
Operating Income 5 19 40 +21 Better combined ratio
Net income 5 17 28 +12 €8.9m badwill
Net Loss Ratio (%) 5 57.6% 50.0% (7.7) ppts Lower claims activity and government schemes
Net Cost Ratio (%) 5 32.7% 27.5% (5.3) ppts Strict cost control and high commissions
Net Combined Ratio (%) 5 90.4% 77.4% (13.0) ppts o/w 6.8 ppts benefit from government schemes
Spread
Better new business and retention offset weak activity
Government schemes in place

29 9M-2020 RESULTS | PRESENTATION TO FINANCIAL ANALYSTS | 26 OCTOBER 2020
FINANCIAL CALENDAR & INVESTOR RELATIONS CONTACTS
Calendar
IR Contacts: [email protected]
Thomas JACQUET
Head of Investor Relations & Rating Agencies
+33 (0)1 49 02 12 58
Benoit CHASTEL
Investor Relations Officer
+33 (0)1 49 02 22 28
Coface is scheduled to attend
the following investor conferences
Next Event Date
FY-2020 Results 10 February 2021 after market close
Q1-2021 Results 27 April 2021 after market close
Annual shareholders meeting 12 May 2021
H1-2021 Results 27 July 2021 after market close
9M-2021 Results 28 October 2021 after market close
Own shares transactions
Next Event Date
CIC Market solutions Forum 12 November 2020 (virtual)
Exane BNP Paribas - Mid Cap CEO Conference 17 November 2020 (virtual)
ODDO BHF Forum 7, 8 & 12 January 2021 (virtual)
TOTAL
(in shares)
% Total of
# Shares
Voting
rights
30/09/2020 264,890 1,063,069 0 1,327,959 0.87% 150,703,990
DateLiquidity
AgreementLTIP
Buy-back
(cancellation)
Own shares transactions

30 9M-2020 RESULTS | PRESENTATION TO FINANCIAL ANALYSTS | 26 OCTOBER 2020
IMPORTANT LEGAL INFORMATION
IMPORTANT NOTICE:
This presentation has been prepared exclusively for the purpose of the disclosure of Coface Group’s results for the period ending 30 September 2020.
This presentation includes only summary information and does not purport to be comprehensive. The Coface Group takes no responsibility for the use of these materials by any person.
The information contained in this presentation has not been subject to independent verification. No representation, warranty or undertaking, express or implied, is made as to, and no
reliance should be placed on, the fairness, accuracy, completeness or correctness of the information or opinions contained herein. None of the Coface Group, its affiliates or its advisors,
nor any representatives of such persons, shall have any liability whatsoever for any loss arising from any use of this document or its contents or otherwise arising in connection with this
document or any other information or material discussed.
Participants should read the interim financial report for the period ending 30 June 2020 and complete this information with the Universal Registration Document for the year 2019. The
Universal Registration Document for 2019 was registered by the Autorité des marchés financiers (“AMF”) on 16 April 2020 under the number D.20-0302. These documents all together
present a detailed description of the Coface Group, its business, strategy, financial condition, results of operations and risk factors.
This presentation contains certain forward-looking statements. Such forward looking statements in this presentation are for illustrative purposes only. Forward-looking statements relate to
expectations, beliefs, projections, future plans and strategies, anticipated events or trends and similar expressions concerning matters that are not historical facts. The forward-looking
statements are based on Coface Group’s current beliefs, assumptions and expectations of its future performance, taking into account all information currently available. The Coface Group
is under no obligation and does not undertake to provide updates of these forward-looking statements and information to reflect events that occur or circumstances that arise after the date
of this document.
Forward-looking information and statements are not guarantees of future performance and are subject to various risks and uncertainties, many of which are difficult to predict and generally
beyond the control of the Coface Group. Actual results could differ materially from those expressed in, or implied or projected by, forward-looking information and statements. These risks
and uncertainties include those discussed or identified under Chapter 5 “Main risk factors and their management within the Group” (Chapitre 5 “Principaux facteurs de risque et leur
gestion au seins du Groupe”) in the Universal Registration Document.
This presentation contains certain information that has not been prepared in accordance with International Financial Reporting Standards (“IFRS”). This information has important
limitations as an analytical tool and should not be considered in isolation or as a substitute for analysis of our results as reported under IFRS.
More comprehensive information about the Coface Group may be obtained on its Internet website (http://www.coface.com/Investors).
This document does not constitute an offer to sell, or a solicitation of an offer to buy COFACE SA securities in any jurisdiction.