9M 2018 Financial Results
44
islandsbanki.is 9M 2018 Financial Results Íslandsbanki 9M 2018 Financial Results 8 November, 2018
Transcript of 9M 2018 Financial Results

isla
ndsb
anki
.is
9M 2018Financial Results
Íslandsbanki 9M 2018 Financial Results
8 N
ovem
ber,
2018

Table of Contents
1. 9M 2018 highlights
2. Income statement
3. Balance sheet
4. Financial targets and highlights
5. Annex – Icelandic economy update
Íslandsbanki 9M 2018 Financial Results
8 N
ovem
ber,
2018
2

isla
ndsb
anki
.is
1. 9M 2018 highlights
— Íslandsbanki 9M 2018 Financial Results
8 N
ovem
ber,
2018
Íslandsbanki 9M 2018 Financial Results

Economic highlightsA year of adjustment ahead following a long upswing period
Slower GDP growth ahead due to less increase in domestic demand...
...and the tourism sector is maturing following a high growth period…
…rapid supply increase is facilitating a more balanced housing market…
..while ISK depreciation will help to keep the current account in surplus
8 N
ovem
ber,
2018
4
Source: Central bank of Iceland, Statistics Iceland
-10%
0%
10%
20%
30%
40%
50%
2004 2005 2006 2007 2008 2009 2010 2011 2012 2013 2014 2015 2016 2017 20188MForeign passengers through KEF airport Overnight stays in hotels
100
120
140
160
180
200
220
240
260
0
20
40
60
80
100
120
140
160
1997 1999 2001 2003 2005 2007 2009 2011 2013 2015 2017 2019Residential investment (ISK bn, 2017 prices, l.axis) Real house prices (index, r.axis)
7.34.0
3.41.5 2.8
-20
-15
-10
-5
0
5
10
15
1998 2000 2002 2004 2006 2008 2010 2012 2014 2016 2018 2020
Imports Exports Inventory chg. Investment
50
60
70
80
90
100
110
120-20%
-15%
-10%
-5%
0%
5%
10%
15%1990 1993 1996 1999 2002 2005 2008 2011 2014 2017 2020
Trade balance, % of GDP (l.axis) Real exchange rate, index (r.axis)
Íslandsbanki 9M 2018 Financial Results

Financial highlightsKey figures & ratios
8 N
ovem
ber,
2018
Íslandsbanki 9M 2018 Financial Results
5
1. Return from regular operations on normalised CET1 of 16%, adjusted for risk free interest on excess capital. From January 2018 the definition of regular operations has been revised to include profit from discontinued operations as the Bank has successfully divested most non-core business related assets. The Bank has introduced a new long term minimum capital target of 16% (CET1 16%), resulting in adjustments to its ROE on regular operations from previous levels (CET1 15%).2. Calculated as (Administrative expenses + Contribution to the Depositors' and Investors' Guarantee Fund – One off items) / (Total operating income – one off items)3. Earnings from regular operations is defined as earnings excluding one-off items e.g. bank tax, one-off costs and income.
9M18 9M17 3Q18 3Q17 2017
PROFITABILITY ROE 16% CET1 (regular operations)¹ 9.0% 9.7% 8.1% 7.9% 10.3%ROE (after tax) 7.1% 7.7% 4.9% 4.7% 7.5%Net interest margin (of total assets) 2.9% 2.9% 3.0% 2.8% 2.9%Cost to income ratio² 65.6% 60.2% 62.1% 62.7% 62.5%After tax profit, ISK m 9,241 10,114 2,111 2,073 13,226Earnings from regular operations, ISK m³ 8,979 10,178 2,929 2,812 13,848
30.9.2018 30.6.2018 31.3.2018 31.12.2017
CAPITAL Total equity, ISK m 174,630 172,182 166,337 181,045
Tier 1 capital ratio 19.9% 20.5% 20.3% 22.6%
Total capital ratio 21.7% 21.6% 21.4% 24.1%
Leverage ratio 14.0% 14.5% 14.3% 16.2%
BALANCE SHEET Total assets, ISK m 1,162,639 1,111,742 1,088,308 1,035,822
Loans to customers, ISK m 835,582 799,938 776,149 755,175
Deposits from Customers, ISK m 608,646 578,414 575,196 567,029
Customer deposit / customer loan ratio 72.8% 72.3% 74.1% 75.1%

30.09.17 31.12.17 31.03.18 30.06.18 30.09.18
Cost / income ratio2ROEreg. operations CET1 16%1
Total capital ratioLeverage ratio
Profit after taxISKm
REA / total assetsISKbn
Loans to customersISKbn
Loans to customers – sector splitAs of 30.09.18
Number of FTE's for Parent CompanyExcluding seasonal employees
Financial highlightsKey figures & ratios (cont’d)
1Earnings on regular income now includes profit from discontinued operations. The Bank has introduced a new long term minimum capital target of 16% (CET1 16%) resulting in adjustments to its ROE on regularoperations from previous levels (CET1 15%).
2The cost/income ratio for 3Q18 the parent company is 57%.
3Q17 4Q17 1Q18 2Q18 3Q18
7.9%
10.3%
8.0%
11.1%
8.1%
3Q17 4Q17 1Q18 2Q18 3Q18
2,073
3,112
2,097
5,033
2,111
3Q17 4Q17 1Q18 2Q18 3Q18
62.7%69.2% 69.8%
65.0% 62.1%
1,163
71.2% 74.9% 73.1% 73.7% 73.6%
Seafood
ISK 836bn 38% Individuals
15%Commerce and services
Realestate 16%
13%
Industrial and transport 10%
Other
30.09.17 31.12.17 31.03.18 30.06.18 30.09.18
860 855841 835
881
79.2% 75.1% 74.1% 72.3% 72.8%
Loans to customers Deposits from customers to loans to customers ratio
30.09.17 31.12.17 31.03.18 30.06.18 30.09.18
15.3% 16.2%14.3% 14.5% 14.0%
30.09.17 31.12.17 31.03.18 30.06.18 30.09.18
22.7% 24.1%21.4% 21.6% 21.7%
8%
836800776755741
1,1121,0881,0361,078
30.09.17 31.12.17 31.03.18 30.06.18 30.09.18Total assets REA / total assets
8 N
ovem
ber,
2018
6
Íslandsbanki 9M 2018 Financial Results

Large companies and investors
This is ÍslandsbankiA leader in financial services in Iceland, Íslandsbanki is a universal bank with a proven strategy
1.Return from regular operations on normalised CET1 of 16%, adjusted for risk free interest on excess capital. From January 2018 the definition of regular operations has been revised to include profit from discontinued operations as the Bank has successfully divested all non-core business related assets. The Bank has introduced a new long term minimum capital target of 16% (CET1 16%), resulting in adjustments to its ROE on regular operations from previous levels (CET1 15%).2. Calculated as (Administrative expenses + Contribution to the Depositors´ and Investors´ Guarantee Fund – One off items) / (Total operating income – one off items). The cost/income ratio for the parent company and core subsidiary Íslandssjóðir is 56,8%.3. Based on Gallup survey regarding primary bank.
7
9,0%65,6%21.7%
ISK 1,163bn /EUR 8.5bn
ROE (Regular operations)1
Cost to income ratio2
Total Capital Ratio
Total Assets835
Driven by the vision to be #1 for service, our relationship banking business model is propelled by three business divisions that manage and build relationships with our customers. A clear focus is on growth, simplifying our operations and unify our objectives with society - or as we like to say it - we MULTIPLY, SIMPLIFY and UNIFY
Employees Market share3 Ways to bank9M18 Key figures
Job satisfaction among Íslandsbanki's employees91%
4 training courses a year per employee
Number of FTE's forparent company at end 9M2018
32%36% SMEs
32%
78,000 APPusers
14 Branches and1 self service branch
54ATMs
112,000 Online Banking users
Individuals
Stable outlook
BBB+/A-2
BBB/F3Stable outlook
Bank of the year in Iceland2014, 2016, 2017
Recognition Universal banking
Íslandsbanki 9M 2018 Financial Results
2013 2014 2015 2016
2017
Leading the IcelandicCustomerSatisfaction Index for5 consecutive
years
Credit ratingsStrategic vision
8 N
ovem
ber,
2018
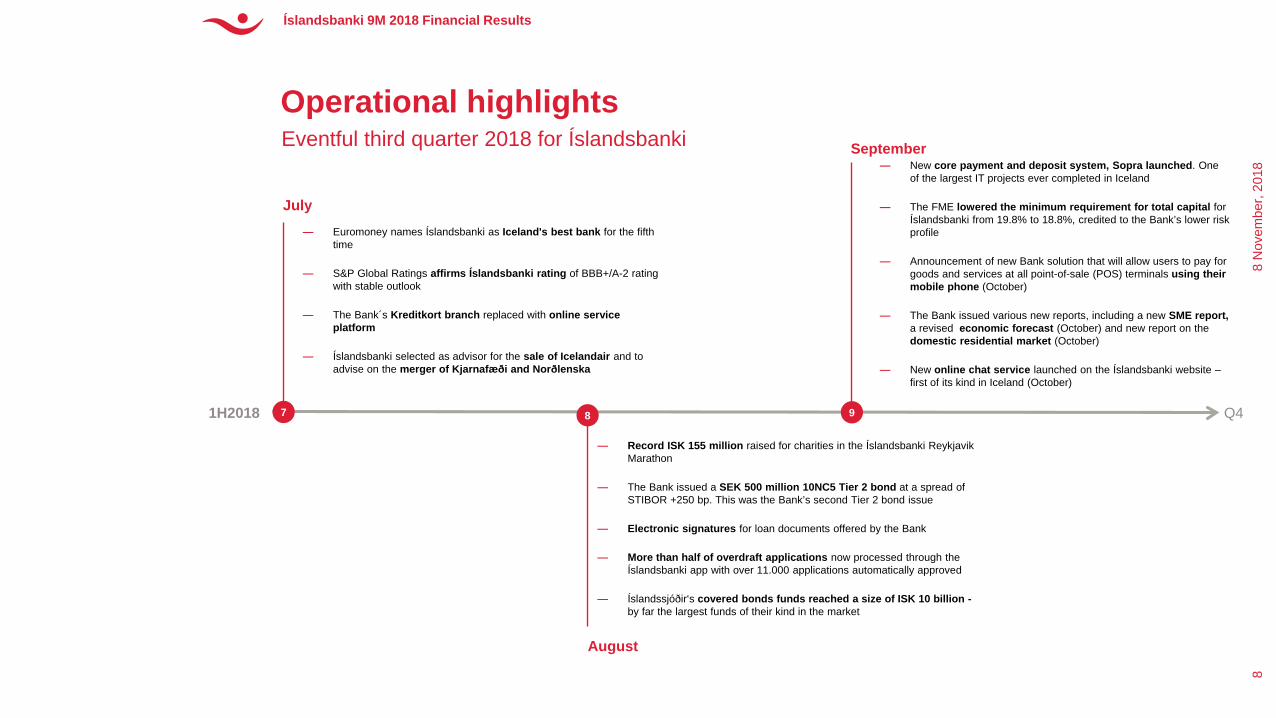
— Record ISK 155 million raised for charities in the Íslandsbanki Reykjavik Marathon
— The Bank issued a SEK 500 million 10NC5 Tier 2 bond at a spread of STIBOR +250 bp. This was the Bank’s second Tier 2 bond issue
— Electronic signatures for loan documents offered by the Bank
— More than half of overdraft applications now processed through the Íslandsbanki app with over 11.000 applications automatically approved
— Íslandssjóðir‘s covered bonds funds reached a size of ISK 10 billion -by far the largest funds of their kind in the market
Operational highlightsEventful third quarter 2018 for Íslandsbanki
8 N
ovem
ber,
2018
Íslandsbanki 9M 2018 Financial Results
8
1H2018
August
Q47 9
— Euromoney names Íslandsbanki as Iceland's best bank for the fifth time
— S&P Global Ratings affirms Íslandsbanki rating of BBB+/A-2 rating with stable outlook
— The Bank´s Kreditkort branch replaced with online service platform
— Íslandsbanki selected as advisor for the sale of Icelandair and to advise on the merger of Kjarnafæði and Norðlenska
July
8
— New core payment and deposit system, Sopra launched. One of the largest IT projects ever completed in Iceland
— The FME lowered the minimum requirement for total capital for Íslandsbanki from 19.8% to 18.8%, credited to the Bank’s lower risk profile
— Announcement of new Bank solution that will allow users to pay for goods and services at all point-of-sale (POS) terminals using their mobile phone (October)
— The Bank issued various new reports, including a new SME report, a revised economic forecast (October) and new report on the domestic residential market (October)
— New online chat service launched on the Íslandsbanki website –first of its kind in Iceland (October)
September

New revenue
Innovation
#1 for service
Collaboration
Speed to market
Open banking
The future ready bank New core system for payments and deposits (Sopra) went live in Q3 which will prepare the Bank for future challenges and enable it to benefit from new opportunities
8 N
ovem
ber,
2018
9
Successful launch of new core system in September
— Íslandsbanki IT architectural system has gone through extensive overhaul in the past few years
— A major milestone was reached when a new system for payments and deposits from Sopra went live in September 2018, replacing 40 year old systems
— The future bank is open, modern, secure and agile enough to allow for seamless integration of applications, API management and cloud based services
— The future ready bank, drivers for change:
– Reduce future IT costs
– Increase speed to market for new products
– Standardised international platform
– Preparation for a data rich world with expanding data volumes
– Customer expectations and behaviour – on demand banking
Open Banking as means to new revenues and value added services
— Sopra offers more flexibility when partnering with innovators, fintechs and start-ups in an open banking environment
— The Bank is building up partnerships with innovators, fintech's and start-ups to develop better banking services
— The goal is to define the future of financial services in Iceland and beyond, as well as and identify opportunities for future revenue growth
— A sandbox will officially be opened for selected third party providers (TPP’s) at the end of 2018, providing access to some of the Bank’s API’s
Íslandsbanki 9M 2018 Financial ResultsÍslandsbanki 9M 2018 Financial Results

#1 for service and digital developmentEnhanced focus on servicing individuals through digital channels
1. Customers that have used the app in the last 90 days
App usersThousands (active users1)
Bank transfers through appThousands per month
Bill payments through appThousands per month
Branch visits to tellers and advisorsThousands
22
5076
114
146
2018(Sept.)
2014 20172015 2016
5178
131
192220
2014 20172015 2016 2018(Sept.)
51 5259 62
2017-09 2017- 12 2018-06 2018-09
322 287203
632
497
323
20172016 2018 (Sept.)
Tellers
Advisors
Digital innovation enhancing the customer experience — Contactless payments by
phone currently being tested by users
— New online secured chat service – first of its kind in Iceland
— Multiple solutions possible through the Íslandsbanki app, including changes to overdraft where over 11.000 applications have been automatically approved
Íslandsbanki 9M 2018 Financial Results
8 N
ovem
ber,
2018
10
Íslandsbanki 9M 2018 Financial Results

isla
ndsb
anki
.is
2. Income statement
— Íslandsbanki 9M 2018 Financial Results
8 N
ovem
ber,
2018
Íslandsbanki 9M 2018 Financial Results

Income statementContinued positive net impairments in 9M18 despite slowdown in the economy
— Total income amounted to ISK 33.7bn in 9M18, an increase of 2.7% between years as a result of strong interest income and the sale of properties
— Net interest income totalled ISK 23.6bn, an increase of 4.3% from the previous year
— Positive changes in the CPI index and strong loan and deposit growth contribute to higher net interest income
— The net interest margin was 2.9% for 9M18, which is at comparable levels to 9M17
— Overall net fee income showed a 13.5% decline year on year, principally due to lower activity levels from two of the Bank's fee generating subsidiaries
— Net impairment on financial assets generated a gain of ISK 1.9bn in 9M18, compared to ISK 0.6bn gain in 9M17, mostly deriving from the lifting of the Bank’s prior commitments in relation to foreign currency-based loans
8 N
ovem
ber,
2018
Íslandsbanki 9M 2018 Financial Results
12
HighlightsISK m 9M18 9M17 ∆ 3Q18 3Q17 ∆
Net interest income 23,643 22,661 982 8,301 7,450 851
Net fee and commission income 8,749 10,118 (1,369) 2,939 3,305 (366)
Net financial income (325) (975) 650 (420) (1,084) 664
Net foreign exchange gain (75) 446 (521) (8) 76 (84)
Other operating income 1,664 506 1,158 64 291 (227)
Total operating income 33,656 32,756 900 10,876 10,038 838
Salaries and related expenses (11,453) (10,936) (517) (3,501) (3,168) (333)
Other operating expenses (8,732) (8,377) (355) (2,962) (2,879) (83)
Administrative expenses (20,185) (19,313) (872) (6,463) (6,047) (416)
Depositors' and Investors' Guarantee Fund (874) (795) (79) (295) (280) (15)
Bank tax (2,541) (2,278) (263) (944) (806) (138)
Total operating expenses (23,600) (22,386) (1,214) (7,702) (7,133) (569)
Profit before net impairment on financial assets 10,056 10,370 (314) 3,174 2,905 269
Net impairment on financial assets 1,881 587 1,294 (53) 147 (200)
Profit before tax 11,937 10,957 980 3,121 3,052 69
Income tax expense (3,616) (3,335) (281) (1,136) (1,072) (64)
Profit for the period from continuing operations 8,321 7,622 699 1,985 1,980 5
Profit from discontinued operations net of income tax 920 2,492 (1,572) 126 93 33
Profit for the period 9,241 10,114 (873) 2,111 2,073 38

NII on the rise as well as NFC for the Bank and Íslandssjóðir— Net interest income was ISK
23.6bn (9M17: ISK 22.7bn), an increase of 4.3% between years and the net interest margin was 2.9% (9M17: 2.9%)
— Net fee & commission income for the Bank and Íslandssjóðir was ISK 7.9bn (9M17: ISK 7.1bn), an increase of 6.1% between years
Operating incomeIncome up by 2.7% compared to 9M17 as a result of strong interest income and sale of properties
Income trends
8 N
ovem
ber,
2018
Íslandsbanki 9M 2018 Financial Results
13
Total operating income (excluding one-off income)ISKm
Net fee and commission incomeISKm
Net interest income (NII)ISKm
Other income ISKm
Net interest margin (NIM)%
10,038
11,433
10,238
11,007 10,876
3Q17 4Q17 1Q18 2Q18 3Q18
7,450 7,338 7,740 7,6028,301
3Q17 4Q17 1Q18 2Q18 3Q18
3,3053,632
2,7783,032 2,939
3Q17 4Q17 1Q18 2Q18 3Q18
2.8% 2.8% 2.9% 2.8%3.0%
3Q17 4Q17 1Q18 2Q18 3Q18
-717
463
-280
1,908
-3643Q17 4Q17 1Q18 2Q18 3Q18
7.9%
10.3%
8.0%
11.1%
8.1%
3Q17 4Q17 1Q18 2Q18 3Q18
2,812
3,670
2,169
3,881
2,929
3Q17 4Q17 1Q18 2Q18 3Q18
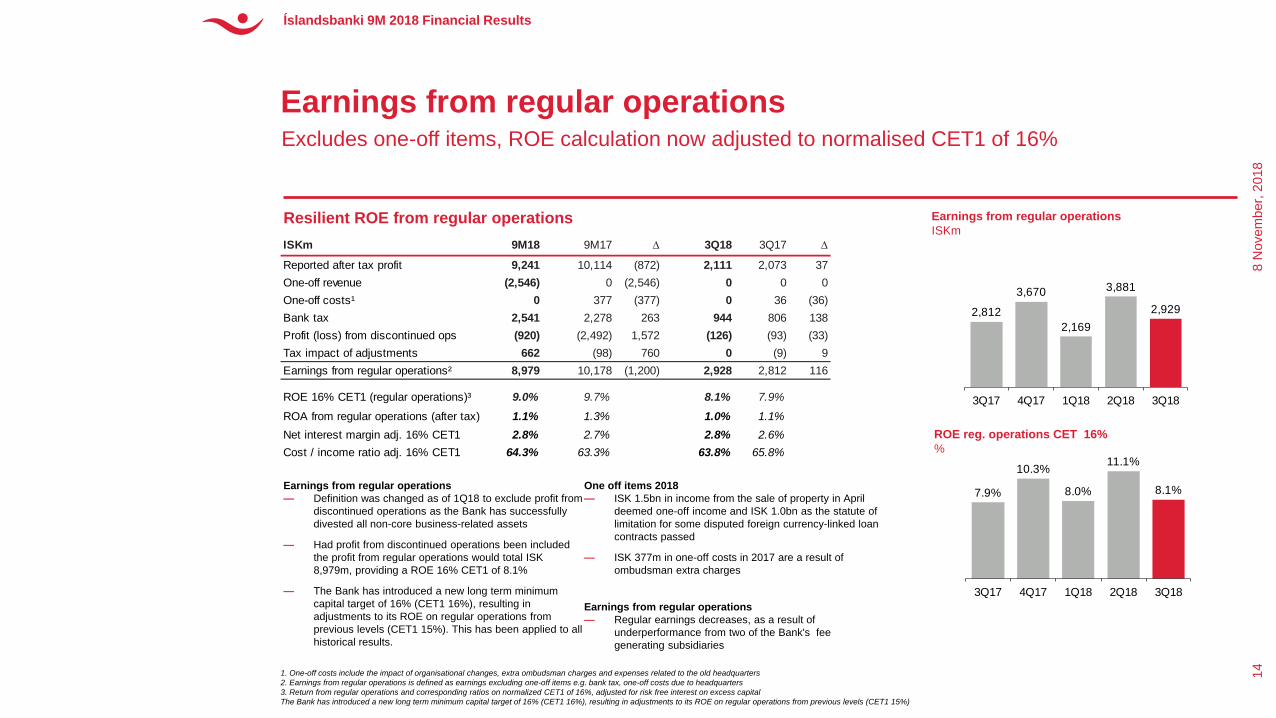
Earnings from regular operations— Definition was changed as of 1Q18 to exclude profit from
discontinued operations as the Bank has successfully divested all non-core business-related assets
— Had profit from discontinued operations been included the profit from regular operations would total ISK 8,979m, providing a ROE 16% CET1 of 8.1%
— The Bank has introduced a new long term minimum capital target of 16% (CET1 16%), resulting in adjustments to its ROE on regular operations from previous levels (CET1 15%). This has been applied to all historical results.
One off items 2018— ISK 1.5bn in income from the sale of property in April
deemed one-off income and ISK 1.0bn as the statute of limitation for some disputed foreign currency-linked loan contracts passed
— ISK 377m in one-off costs in 2017 are a result of ombudsman extra charges
Earnings from regular operations— Regular earnings decreases, as a result of
underperformance from two of the Bank's fee generating subsidiaries
Earnings from regular operationsExcludes one-off items, ROE calculation now adjusted to normalised CET1 of 16%
Resilient ROE from regular operations
1. One-off costs include the impact of organisational changes, extra ombudsman charges and expenses related to the old headquarters2. Earnings from regular operations is defined as earnings excluding one-off items e.g. bank tax, one-off costs due to headquarters3. Return from regular operations and corresponding ratios on normalized CET1 of 16%, adjusted for risk free interest on excess capital The Bank has introduced a new long term minimum capital target of 16% (CET1 16%), resulting in adjustments to its ROE on regular operations from previous levels (CET1 15%)
8 N
ovem
ber,
2018
Íslandsbanki 9M 2018 Financial Results
14
Earnings from regular operationsISKm
ROE reg. operations CET 16% %
ISKm 9M18 9M17 ∆ 3Q18 3Q17 ∆
Reported after tax profit 9,241 10,114 (872) 2,111 2,073 37 One-off revenue (2,546) 0 (2,546) 0 0 0 One-off costs¹ 0 377 (377) 0 36 (36)Bank tax 2,541 2,278 263 944 806 138 Profit (loss) from discontinued ops (920) (2,492) 1,572 (126) (93) (33)Tax impact of adjustments 662 (98) 760 0 (9) 9 Earnings from regular operations² 8,979 10,178 (1,200) 2,928 2,812 116
ROE 16% CET1 (regular operations)³ 9.0% 9.7% 8.1% 7.9%
ROA from regular operations (after tax) 1.1% 1.3% 1.0% 1.1%Net interest margin adj. 16% CET1 2.8% 2.7% 2.8% 2.6%Cost / income ratio adj. 16% CET1 64.3% 63.3% 63.8% 65.8%

62.7%
69.2% 69.8%
65.0%62.1%
3Q17 4Q17 1Q18 2Q18 3Q18
57.0%59.7%
63.9%
51.8%
57.3%
3Q17 4Q17 1Q18 2Q18 3Q18
Administrative expensesCost to income ratio for the Bank and Íslandssjóðir not far off from long term target of 55%
Efficiency – Cost to income ratio1
1. The cost-to-income ratio excludes Bank tax and one-off cost and revenue items2. The Group consists of the Bank, Íslandssjóðir, Borgun and Hringur
Cost structure improving overall
3.. Excluding one off items 4. FTE numbers exclude seasonal employees 5. Administrative expense - cost index is calculated as 40% inflation and 60% salary index excluding one-off items
8 N
ovem
ber,
2018
Íslandsbanki 9M 2018 Financial Results
15
Branch network #, Byr branches due to merger in dark grey
Administrative expenses3
ISK m
Period end FTE numbers4
#, Parent companyAnnualised admin. expenses vs cost index5
ISK bn, excl. one-off cost, parent company
The Bank & Islandssjóðir%
The Group2
%
6,010
7,6196,850 6,872 6,463
3Q17 4Q17 1Q18 2Q18 3Q18
6
21 19 18 17 15 14 1420
´11 12 ´13 1614 17´15 18
26
23.9 23.5 24.0 25.4 27.4 26.923.9 24.9 26.2 28.2 29.5 30.9
2013 2014 2015 2016 2017 3Q18
Admin expenses ActualAdmin exps - cost index881 860 855 841 835
3Q17 4Q17 1Q18 2Q18 3Q18

isla
ndsb
anki
.is
3. Balance sheet
Íslandsbanki 9M 2018 Financial Results
8 N
ovem
ber,
2018
Íslandsbanki 9M 2018 Financial Results
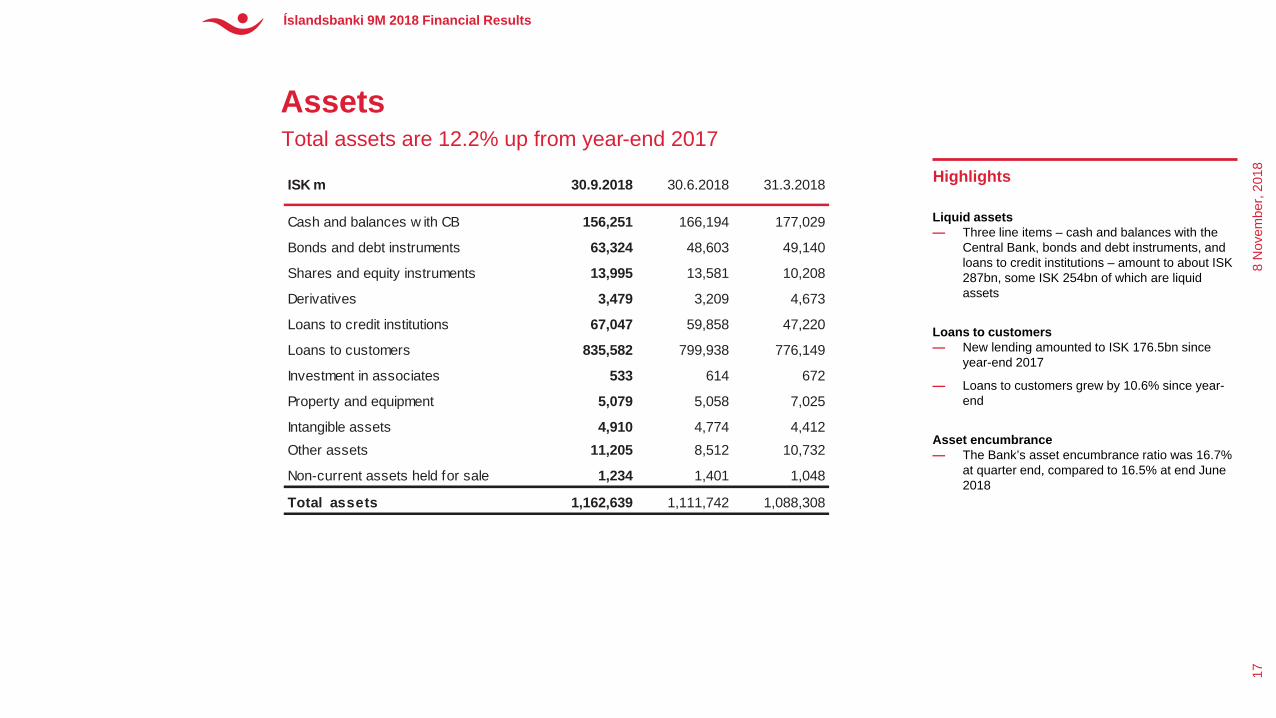
Liquid assets— Three line items – cash and balances with the
Central Bank, bonds and debt instruments, and loans to credit institutions – amount to about ISK 287bn, some ISK 254bn of which are liquid assets
Loans to customers — New lending amounted to ISK 176.5bn since
year-end 2017
— Loans to customers grew by 10.6% since year-end
Asset encumbrance— The Bank’s asset encumbrance ratio was 16.7%
at quarter end, compared to 16.5% at end June 2018
AssetsTotal assets are 12.2% up from year-end 2017
8 N
ovem
ber,
2018
Íslandsbanki 9M 2018 Financial Results
17
HighlightsISK m 30.9.2018 30.6.2018 31.3.2018
Cash and balances w ith CB 156,251 166,194 177,029
Bonds and debt instruments 63,324 48,603 49,140
Shares and equity instruments 13,995 13,581 10,208
Derivatives 3,479 3,209 4,673
Loans to credit institutions 67,047 59,858 47,220
Loans to customers 835,582 799,938 776,149
Investment in associates 533 614 672
Property and equipment 5,079 5,058 7,025
Intangible assets 4,910 4,774 4,412Other assets 11,205 8,512 10,732
Non-current assets held for sale 1,234 1,401 1,048
Total assets 1,162,639 1,111,742 1,088,308

Diversified loan portfolioLoans to customers grew by 10.6% in the first 9 months of 2018
Loans to customersby sector, consolidated
Loans to customersby currency, consolidated
Highlights
— Strong demand for loans across all sectors for the first 9 months
— The mortgage portfolio increased by 7.6% since year-end 2017. Mortgages comprised 29.1% of loans to customers at 3Q 2018, compared to 29.8% in 4Q 2017
— Exposure to tourism is unchanged from year end 2017, 13%
— Real estate (hotels), commerce & services (car rentals, restaurants, tour operators) and industrials and transportation are the largest underlying sectors in tourism
8 N
ovem
ber,
2018
18
FX18%
ISK CPI35%
ISK47% ISK 836bn
Standard sectors Including tourism
8% 9% 8% 13% 13% 13%9% 10% 10%
7% 9% 8%15% 16% 15% 7% 7% 7%
17% 16% 16%
8% 8% 8%
11% 11% 13%
14% 14% 14%
40% 38% 38%
11% 11% 13%
40% 38% 37%
31.12.2017 30.6.201830.6.2018 30.9.2018 31.12.2017 30.9.2018
Individuals
Seafood
Real estate
Commerce and services
Industrial and transportation
Other
Tourism
Íslandsbanki 9M 2018 Financial Results

LTV distribution of loan portfolioLoans generally well covered by stable collateral, majority in residential and commercial real estate
LTV distribution by underlying asset classISK bn, by type of underlying asset, as of 30.09.2018
LTV distribution of mortgages to individualsISK bn, as of 30.09.2018 – avg LTV 61% (63% 31.12.2017)1
Highlights
— Most of the Bank’s collateral is in the form of residential and commercial real estate
— The second most important collateral type is vessels, mostly fishing vessels
— For seasoned mortgages, the LTV distribution is calculated from tax value of properties, which is published annually in June, but for newly granted mortgages the purchase price of the property can be used as a valuation in the beginning while it is considered more accurate
— LTV has decreased since year end 2017 which is mainly due to the newly published tax value of properties that raised housing valuations of about 12.8% from its previous publication
8 N
ovem
ber,
2018
19
1. The average LTV can be calculated in many different ways and therefore the definition is important for comparison to other banks. The weight is Íslandsbanki’s total amount outstanding on the property and the LTV used is the maximum LTV of all Íslandsbanki’s loans of the property.
0
20
40
60
80
100
120
140
160
Other collateral
Vehicles & equipment
Cash & securites
Vessels
Commercial real estate
Residential real estate
0
5
10
15
20
25
30
35
40
45
50
31.12.2017
30.9.2018
Íslandsbanki 9M 2018 Financial Results

Asset qualityAsset quality improving with NPL ratios continuing downward trend
Loans to customers & off-balance sheet items: impairment allowance account 1.
Development of allowance account. ISK bn
Loans to customers, gross carrying amountRisk class and impairment stage. ISK bn 30.09.2018 Highlights
— With the adoption of IFRS 9, facilities are now categorised in one of three stages and receive an impairment accordingly. Consequently, specific and collective impairments are no longer reported
— In addition off-balance sheet exposures now contribute to the impairment allowance account
— During the first 9 months of 2018 the impairment allowance has decreased, mainly due to write-offs of facilities in Stage 3
— At the end of 3Q18, gross carrying amount of loans in Stage 3 as a proportion of the total gross carrying amount of loans to customers was 2.5%, compared to 2.9% at end of 1H18
— Using the European Banking Authority’s definition of NPL, which does not only include loans to customers but also loans and advances to central banks and credit institutions, the Bank's NPL ratio was 2.0% at the end of 3Q18, compared to 3.6% average for European banks2
8 N
ovem
ber,
2018
20
1. The impairment allowance for 31.12.2017 is based on IAS 39 but other dates are based on IFRS 92. Source European Banking Authority
Loans to customers: credit qualityBreak-down of loans to customers
8.7 9.2 8.67.0 6.7
1.21.0
1.20.9
1.7
2.72.7
2.83.1
0.70.6
0.6 0.710.4
13.812.9
11.7 11.3
31.12.2017 1.1.2018 31.3.2018 30.06.2018 30.9.2018
Stage 3 Stage 2 Stage 1 Off-balance
216
351
186
37 5
1
19
1021
1-4 5-6 7-8 9 10 Unrated
(ISK bn) (%) (ISK bn) % (ISK bn) %Stage 1 795 93,9% 3,1 0,4% 792 94,7%Stage 2 31 3,6% 0,9 2,8% 30 3,6%Stage 3 21 2,5% 6,7 32,0% 14 1,7%Total 846 100,0% 10,6 1,3% 836 100,0%
Net carrying amount
Gross carrying amount
Impairment allowance
Íslandsbanki 9M 2018 Financial Results

LiabilitiesDiversified funding strategy
Deposits— Customer deposits are up by 7.3% to ISK 609bn
in end September 2018
– The increase was due mainly to an increase in pension fund positions but also from individuals and SMEs
— The customer deposit to customer loan ratio was 72.8%
Debt issued and other borrowings— Includes covered bonds, commercial papers and
bonds in foreign currency
— Market access for covered bonds remain solid, with issuance of ISK 21.1bn in the first nine months of 2018, reinforcing the Bank’s position as Iceland’s largest covered bond issuer
Other liabilities— 69% of other liabilities are attributable to credit
card liabilities to retailers through the Bank's subsidiary Borgun
Equity— Íslandsbanki’s dividend pay-out ratio target is
40-50% of after tax profits. Due to its strong capital position, a higher dividend payment of ISK 13bn was approved during its March Annual General Meeting (AGM), bringing the Bank's total dividend payments to ISK 76bn since 2013
8 N
ovem
ber,
2018
Íslandsbanki 9M 2018 Financial Results
21
HighlightsISK m 30.9.2018 30.6.2018 31.3.2018
Deposits from CB and credit inst. 15,530 15,391 13,563
Deposits from customers 608,646 578,414 575,196
Derivatives and short positions 5,585 7,075 8,104
Debt issued and other borrow ed funds 297,318 288,360 269,255
Subordinated loans 15,531 8,872 8,838
Tax liabilities 10,311 8,925 7,908
Other liabilities 35,014 32,447 39,028
Non-current liabilities held for sale 74 76 79
Total liabilities 988,009 939,560 921,971
Total equity 174,630 172,182 166,337
Total liabilities and equity 1,162,639 1,111,742 1,088,308

Deposits remain the main source of fundingCore deposits continue to be stable
Deposit by LCR category 30.09.2018 compared with year end-2017, consolidated
Deposit compositionISK bn, consolidated
Highlights
Stable core deposit base— Deposits remain the main funding source for the Bank
and the deposit to loan ratio remains high
— At the end of the period, 71% of the deposits were in non-indexed ISK, 15% CPI linked and 14% in foreign currencies
Deposits concentration remains stable— At the end of September 2018,16% of the Bank’s
deposits belonged to the 10 largest depositors and 38% belonged to the 100 largest depositors. Compared to 15% and 39% respectively for year-end 2017
8 N
ovem
ber,
2018
22
Íslandsbanki 9M 2018 Financial Results
ISK bnLess
stable Δ Stable ΔTerm
deposits ΔTotal
deposits ΔRetail 135 16 61 (2) 67 (2) 263 11SMEs 65 10 16 1 7 (0) 88 10Operational relationships 3 1 - - - - 3 1Corporations 72 8 0 0 23 (4) 95 3
Sovereigns, Central Bank and public sector entities 9 2 0 0 1 (1) 10 1
Financial institutions in composition 2 (1) - - - - 2 (1)Pension funds 53 21 - - 26 (3) 79 19
Domestic financial entities 28 (3) - - 29 2 57 (1)Foreign financial entities 3 (2) - - 8 3 11 1Other foreign entities 13 4 2 (1) 3 (3) 18 1Total deposits 382 56 80 (2) 162 (8) 624 46
31% 29% 36%29% 26%
12% 12%12%
14% 13%
57%59% 52%
56% 61%
555
619 599 578624
0
100
200
300
400
500
600
700
31.12.2014 31.12.2015 31.12.2016 31.12.2017 30.9.2018
Deposits maturing within 30 days - Less stable
Deposits maturing within 30 days - Stable
Term deposits over 30 days
-
--
-

BorrowingsSuccessful international and domestic market transactions
Borrowing sources Book value, ISK bn
Maturity profile of long-term debt and repayment of long term debt as percentage of balance sheet1
Nominal value, ISK bn
Currency split of FX borrowing sources Nominal value, ISK bn
HighlightsÍslandsbanki is the largest issuer of covered bonds in the domestic market— Total covered bonds issuance in Q3 was ISK 5.5bn
Successful international funding in Q318— SEK 500m Tier II issued in August
— In July and August, the Bank issued a number of private placements under its GMTN Programme totalling SEK 1.3bn
8 N
ovem
ber,
2018
23
Íslandsbanki 9M 2018 Financial Results
SEK32%
EUR64%
NOK4%
ISK 171bn17
4
17
8
27 25
7
14
71
16
13
41
16
0.6%
2.7%
6.4%
1.4%
2.6%
0.7%
5.8%
3.5%
2018 2019 2020 2021 2022 2023 2024 >2024
ISK FX Repayment of long-term debt as a % of balance sheet
929
68
125101
156
24
33
50
64 109
133
57
35
32
238
8
2221
20
10
16
111 118
170
212
227
312
31.12.2013 31.12.2014 31.12.2015 31.12.2016 31.12.2017' 30.9.2018
GMTN Covered bonds Other borrowings Subordinated loans
1. Final maturity assumed for callable bonds

— All liquidity measures well above regulatory and internal requirements
— FX liquid assets are composed of government bonds that have a minimum requirement of AA rating and cash placed with highly rated correspondent banks
— Stress testing of liquidity position is an integrated part of the annual ICAAP/ILAAP process as well the annual regulatory stress test
— Liquidity Contingency Plan is in place which shall be tested regularly
Sound management of liquidity Liquid assets of ISK 254bn are prudently managed
Net stable funding ratio (NSFR)
Highlights
Liquidity coverage ratio – all currencies Liquidity coverage ratio – foreign currencies and Icelandic krona
8 N
ovem
ber,
2018
24
Íslandsbanki 9M 2018 Financial Results
117%
159%
40%
60%
80%
100%
120%
140%
160%
180%
30.09.2015 30.09.2016 30.09.2017 30.09.2018NSFR all currencies (group level)NSFR foreign currencies (group level)FX NSFR - regulatory minimum
146%
164%
0%
50%
100%
150%
200%
250%
30.09.2015 30.09.2016 30.09.2017 30.09.2018Liquidity coverage ratio (parent level)Liquidity coverage ratio (group level)LCR - Regulatory minimum
270%
126%
0%
100%
200%
300%
400%
500%
600%
30.09.2015 30.09.2016 30.09.2017 30.09.2018Liquidity coverage ratio in foreigin currency (group level)Liquidity coverage ratio in icelandic krona (group level)LCR - Regulatory minimum for foreign currency

Sound capital positionThe capital ratio in line with target and leverage is low
Capital and leverage ratios Risk exposure amount (REA)ISK bn
Highlights
Capital ratios— The capital base was ISK 186bn and the CET1 capital
was ISK 170bn at 30 September 2018, compared to ISK 187bn and ISK 176bn respectively at year-end 2017
— The decrease in CET1 capital is mainly due to an ISK 13bn dividend payment in March, offset by retained earnings for the period.
— The issuance of Tier 2 subordinated debt amounting to SEK 500 m in August contributed to an increase in the capital base, offsetting further the dividend payment, leaving the capital base at a level comparable to year end figures
— The RAC ratio for the Bank was 19.4% at end June 2018 according to S&P Global Ratings
Risk exposure amount (REA)— The REA growth is mainly due to increase in loans to
customers during the year
— The ratio of REA of total assets remains fairly stable at 74%
8 N
ovem
ber,
2018
25
Íslandsbanki 9M 2018 Financial Results
767 776 796 819856
71%
75%73% 74% 74%
30/09/2017 31/12/2017 31/03/2018 30/06/2018 30/09/2018REA REA/Total assets
22.7%24.1%
21.4% 21.6% 21.7%
22.5% 22.6%
20.3% 20.5% 19.9%
15.3%16.2%
14.3% 14.5% 14.0%
30/09/2017 31/12/2017 31/03/2018 30/06/2018 30/09/2018
Total capital ratio CET1 ratio Leverage ratio

Íslandsbanki's capital targetBased on the regulatory SREP requirement in addition to 50 – 200bp management buffer
Íslandsbanki’s capital target Capital requirement composition Highlights
— The sum of Pillar 1, Pillar 2-R and the combinedcapital buffers form the overall regulatory capitalrequirement
— Based on the SREP 2018 results, published inOctober 2018, the overall capital requirement forÍslandsbanki is 18.8% of risk exposure amount (REA)
— The FME has increased the countercyclical capitalbuffer from 1.25% to 1.75%, effective from May 2019
— Íslandsbanki's total capital target ratio is based on theregulatory SREP requirement in addition to a 50-200bp management buffer
— In light of recent changes to regulatory requirementsand an updated assessment of the businessenvironment, the Bank has decided to revise itsmanagement buffer from 0.5-1.5% to 0.5-2.0%
— The size of the management buffer is based on factorssuch as volatility in the capital ratios for example dueto currency fluctuations, volatility in earnings and REAand uncertainties in the regulatory or operatingenvironment
8 N
ovem
ber,
2018
26
50-200bp mgmt buffer
Systemic risk buffer
Pillar 1
O-SII buffer
Pillar 2-R
Capital conservation buffer
Countercyclical capital buffer
Total Capital Ratio 21.7%
Capital target >19.3-20.8%
Overall capital requirement 18.8%
Total SREP capital requirement 10.2%
8.0%
2.2%
2.9%
2.0%
1.2%
2.5%
Capitalcomponents
Current regulatoryrequirements
Long-term capitaltarget
Íslandsbanki'scurrent capital
Cap
ital
buffe
rs
18.8%
21.7%
SREP requirement+
0.5-2.0% Management
buffer
18.8%
Tier 2
Common Equity Tier 1Additional Tier 1
0.5-2.0%
Pilla
r2-
RPi
llar
I14.3% 14.3%
19.9%
1.9% 1.9%
2.6% 2.6%
1.8%
Íslandsbanki 9M 2018 Financial Results

Íslandsbanki credit ratings
FITCHBBB/F3 Stable Outlook
Press Release 15 December 2017
In December, Fitch Ratings affirmed Íslandsbanki's ratings of BBB/F3 with a stable outlook. Fitch had in January 2017, upgraded the Bank to this rating
According to Fitch, the ratings for Íslandsbankireflect the Bank's leading domestic positionwith a market share of around 30 per cent and the Bank's satisfactory asset quality, stable liquidity position and high reported capital ratiosFurthermore, Fitch noted that Íslandsbanki'sstrategy to target continued organic growth in Iceland, combined with its sound risk management framework, would continue to strengthen the Bank's asset quality, with the Bank having seen a sharp decline in its non-performing loans since 2010
Ratings affirmed from both Fitch and S&P in late 2017 and mid-2018
S&PBBB+/A-2 Stable Outlook
Press Release 17 July 2018
In July, S&P Global Ratings affirmed Íslandsbanki's ratings of BBB+/A-2 with a stable outlook along with three other Icelandic financial institutions. S&P had in October 2017 upgraded the Bank to this rating
In its press release, S&P notes that the rating actions take into account their view that economic growth in Iceland continues to support the banking sector, resulting in business growth and low default rates. This is balanced by their expectation of more challenging competitive and funding dynamics
S&P also comments that the stable outlook on Íslandsbanki reflects our expectation that the bank’s RAC ratio will remain sustainably above 15%, even while the bank prepares for an eventual sale or IPO over the next two years, and it optimises its capital base by paying extraordinary dividends and issuing capital instruments
8 N
ovem
ber,
2018
Íslandsbanki 9M 2018 Financial Results
27
S&P FITCH
Long-term BBB+ BBB
Short-term A-2 F3
Outlook Stable Stable
Rating action July 18 Dec 17
Íslandsbanki
Icelandic sovereign
S&P FITCH MOODY’S
Long-term A A A3
Short-term A-1 F1 -
Outlook Stable Stable Positive
Rating action Jun 18 Jun 18 Jul 18

isla
ndsb
anki
.is
4. Financial targets and next steps
Íslandsbanki 9M 2018 Financial Results
8 N
ovem
ber,
2018
Íslandsbanki 9M 2018 Financial Results

8-10%
<55%
>16% LT
> 19.3 – 20.8%
40-50%
9.0%
65.6%
19.9%
21.7%
100%
10.3%
62.5%
22.6%
24.1%
50%
10.7%
56.9%
24.9%
25.2%
50%
Financial targetsMedium and long term strategies structured around achieving key financial targets
1. Return from regular operations on normalized CET1 of 16%, adjusted for risk free interest on excess capital. Earnings from regular operations is defined as earnings excluding one-off items e.g. net loan impairment before collective impairment, fair value gain deriving from changes in accounting treatment, Bank tax, and one off costs.2. Calculated as (Administrative expenses + Contribution to the Depositors' and Investors' Guarantee Fund – One off items) / (Total operating income – one-off items). 29
ROE regular operations1
Cost/ Income ratio2
CET1
Total capital ratio
Dividend payout ratio
Target 9M18 2017 2016
— Based on risk free rate + 4-6% which is considered to be CBI current account rate, currently at 4.25% (average in 2017 = 4.4%)
— As the Bank retains a large pool of liquid assets, interest rate level in Iceland can have a substantial impact on ROE levels
— The bank tax, excluded thus far from target returns, will have an impact on profitability if kept at current high levels
Guidance
— This is a medium to long term target, C/I ratio can be expected to be higher than target in the near term— Headcount and non-headcount related cost control programmes in place— Lower C/I on parent company basis than on a consolidated basis
— Current SREP requirement of 18.8% plus management buffer means currently a target 14.8-16.3% CET1 ratio
— Based on the regulatory SREP requirement with a 50 – 200 bp management buffer— Current SREP requirement is 18.8%— Short term target removed in Q317 due to less uncertainty regarding lifting of capital controls and IFRS9
implementation
— Dividend pay-out ability will be impacted if the bank tax will be kept at current high levels— The BoD agreed to pay out ISK 13 billion in dividend for the 2017 financial year which is higher than the
dividend payout target due to a strong capital position
8 N
ovem
ber,
2018
Íslandsbanki 9M 2018 Financial Results

Next steps for ÍslandsbankiThe Bank’s core investments have created a strong platform for offering enhanced digital and personalised services while maintaining low risk and reducing overhead costs in an increasingly competitive environment
8 N
ovem
ber,
2018
Íslandsbanki 9M 2018 Financial Results
30
Maintain profitability and limit costs — Focus on continued strong core operations and stable fee and commission
income— Continue growing the loan portfolio while maintaining high levels of asset
quality and diversification — Further exploit operational efficiency gains to decrease costs
Focus on digital growth— Focus on digitalisation of retail banking services to meet customers needs for
automated services— Emphasis is on adding features and services to the Bank´s app, the payments
app and Kass— New services such as contactless payments via mobile phone and online chat
will strengthen the Bank’s digital offering— Open banking platform will foster new ideas from fintechs
Optimise capital structure— The Bank has already issued two Tier 2 bonds — Capital optimisation process likely to continue with additional Tier 1 or Tier 2
issuances in order to normalise the capital structure— The Bank expects to continue paying out dividends payments in line with
Bank‘s financial targets
Maintain moderate risk profile and implement international regulations and best practices— Íslandsbanki´s market risk continues to be low in respect of main risk factors
and the FME´s conservative capital requirements are the lowest for Íslandsbanki
— Implementation ongoing or underway for multiple international regulation, including IFRS 9, MIFID II, PSD II, GDPR, BRRD and MREL
Completed core investments by Íslandsbanki— Launch of new core payment and deposit system and investments in other
core IT infrastructure— Move completed to new headquarters bringing operations from 4 separate
locations under one roof— New customer focused organisational structure
— Branch network limited to only 14 strategically branches that are located in greater capital area of Reykjavik and around Iceland
— Stronger risk management and culture within the Bank through a new “three lines of defense” approach
— Successful restructuring of new balance sheet from Glitnir

isla
ndsb
anki
.is
Annex – Icelandic economy update
Íslandsbanki 9M 2018 Financial Results
8 N
ovem
ber,
2018
Íslandsbanki 9M 2018 Financial Results

2019: A year of adjustmentInvestment, private consumption and service exports take a breather
GDP and the contribution of major subitems 1YoY change (%)
— After a long period of economic upswing, the end of the growth period appears to be in sight
— Íslandsbanki Research expects GDP growth to measure 3.4% this year and 1.5% in 2019
— Weaker growth in 2019 is due to a contraction in business investment, modest private consumption growth, and relatively weak growth in services exports
— In essence, then, these main drivers of the past few years’ growth spurt will take a break next yea
— The outlook is for growth to rise to about 2.8% in2020, buoyed by increased private consumption growth, a resumption of growth in business investment, and continued growth in other investment and exports
1. Shaded areas indicate ISB Research/ forecastsSource: Statistic Iceland and ISB Research
7.3
4.03.4
1.52.8
-20
-15
-10
-5
0
5
10
15
1998 1999 2000 2001 2002 2003 2004 2005 2006 2007 2008 2009 2010 2011 2012 2013 2014 2015 2016 2017 2018 2019 2020Imports Exports Inventory chg. Investment Public consumption Priv.consumption GDP
Íslandsbanki 9M 2018 Financial Results
8 N
ovem
ber,
2018
32

Tourism sector growth slows as sector maturesStreamlining and mergers take over from rapid growth and supply-side increases
Foreign visitors and overnight hotel staysYoY change
Services exports and foreign card turnoverYoY change
— The tourism sector is still growing by most measures, although the pace has fallen back from its 2015-2016 peak
— This year is the first year without an appreciation of the ISK since the tourism boom started. As a result, Iceland is not significantly “more expensive” this year than it was in 2017
— In the first 8 months of 2018, the number of foreign tourists increased by 4.4% YoY and overnight hotel stays went up by 2.3%
— The tourism sector shows various signs of maturing, with increased emphasis on streamlining and mergers taking over from rapid growth and supply-side increases among many providers
— 2019 will provide a testing ground for how successfully the sector handles its newfound maturity. There is every reason to believe it will do so without major mishaps
Source: Statistics Iceland, Centre for Retail Studies and Icelandic Tourist Board
-5%
0%
5%
10%
15%
20%
25%
30%
35%
40%
45%
2004 2005 2006 2007 2008 2009 2010 2011 2012 2013 2014 2015 2016 2017 20188M
Foreign passengers through KEF airport Overnight stays in hotels
-5%
0%
5%
10%
15%
20%
25%
30%
35%
40%
45%
50%
55%
2013 2014 2015 2016 2017 2018
Services exports Exports, air transport and travel
Payment card turnover by tourists
Íslandsbanki 9M 2018 Financial Results
8 N
ovem
ber,
2018
Íslandsbanki 9M 2018 Financial Results
33

Current account expected to remain in surplusNet external position to continue improving throughout decade
Imports, YoY change (%) Current account balance% of GDP
1. Shaded areas and dotted lines indicate ISB Research/ forecastsSource: Central bank of Iceland, Statistics Iceland and ISB Research
— Both import and export growth to keep tapering off early in the forecast horizon
— Export growth at 3.5% and import growth at 5.6% this year, followed by 2.3% and 2.7%, respectively, in 2019 and 3.9% and 2.0%, respectively, in 2020
— Services exports — tourism in particular — will continue to be one of the mainstays of export growth. Increased fishing industry exports will also be a major contributor. The reverse will be true for imports, however, with goods imports carrying much of the weight
— Improved outlook for the current account balance, due largely to a lower real exchange rate and weaker growth in domestic demand in the coming term
— 2020 will be the ninth year in a row with a current account surplus
— Iceland’s net external position will therefore continue to improve through the end of the decade, everything else being equal. As of mid-2018, external assets exceeded external liabilities by nearly 10% of GDP
-10.3
-4.7
1.1
-5.0
-9.8
-15.7
-23.2
-14.2
-17.5
1.3
-0.9 -0.5
0.7
7.2
5.2 5.87.5
3.32.3 2.8
1.7
-25
-20
-15
-10
-5
0
5
10
15
2000 2002 2004 2006 2008 2010 2012 2014 2016 2018 2020Trade balance C/A balance
* 2009-2015: C/A balance excl. old banks
12.5
5.6
2.73.9
-2.5
0.0
2.5
5.0
7.5
10.0
12.5
15.0
2010 2011 2012 2013 2014 2015 2016 2017 2018 2019 2020
Goods Services Total
5.5
3.52.3 2.0
-5.0
-2.5
0.0
2.5
5.0
7.5
10.0
12.5
2010 2011 2012 2013 2014 2015 2016 2017 2018 2019 2020Goods Services Total
Exports, YoY change (%)
Íslandsbanki 9M 2018 Financial Results
8 N
ovem
ber,
2018
34

Domestic balance sheets remain robustEconomy-wide leverage moderate in comparison with peers and historical levels
Household debt - domestic%
Household debt – international comparison% of GDP
Corporate debt – international comparison% of GDP
Central government gross debt – international comparison% of GDP
8 N
ovem
ber,
2018
35
0
50
100
150
200
250
300
0
20
40
60
80
100
120
140
2005 2007 2009 2011 2013 2015 2017Household debt/GDP Household debt/net wealthLTV for residential mortgages Household debt/disposable income (r.axis)
0
50
100
150
200
250
300
1995 1997 1999 2001 2003 2005 2007 2009 2011 2013 2015 2017
Iceland Denmark Sweden Finland Ireland Norway
0
20
40
60
80
100
120
140
160
2003 2005 2007 2009 2011 2013 2015 2017Iceland Denmark Sweden Netherlands Ireland Norway
0
20
40
60
80
100
120
2010 2011 2012 2013 2014 2015 2016 2017
Iceland USA UK Germany Denmark
Source: Central bank of Iceland, Statistics Iceland
Íslandsbanki 9M 2018 Financial Results

Outlook for similar investment level in coming yearsGrowth shifts from business investment to residential investment and public sector investment
Investment 1% of GDP
— Investment in Iceland picked up strongly in the middle of the decade, after a steep contraction at the end of the 2000s
— Business investment was particularly robust early in the growth period
— The investment-to-GDP ratio was 22% in 2017, after bottoming out at just over 14% in 2010
— Main source of growth is shifting to residential investment and public investment
— Investment level likely to remain just over 1/5 of GDP until the end of the decade
1. Shaded areas indicate ISB Research/ forecastsSource: Statistic Iceland and ISB Research
0%
5%
10%
15%
20%
25%
30%
35%
40%
2000 2002 2004 2006 2008 2010 2012 2014 2016 2018 2020
Business Residential Public sector
Íslandsbanki 9M 2018 Financial Results
8 N
ovem
ber,
2018
36
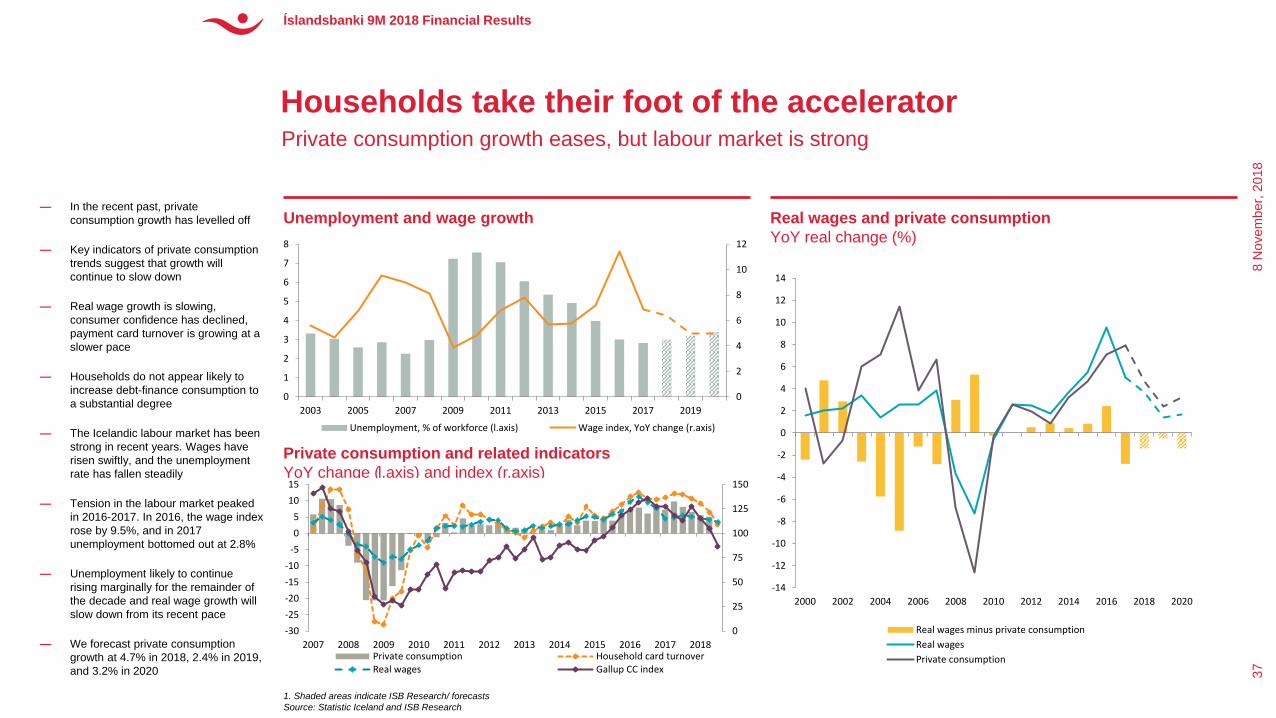
Households take their foot of the acceleratorPrivate consumption growth eases, but labour market is strong
Unemployment and wage growth Real wages and private consumptionYoY real change (%)
— In the recent past, private consumption growth has levelled off
— Key indicators of private consumption trends suggest that growth will continue to slow down
— Real wage growth is slowing, consumer confidence has declined, payment card turnover is growing at a slower pace
— Households do not appear likely to increase debt-finance consumption to a substantial degree
— The Icelandic labour market has been strong in recent years. Wages have risen swiftly, and the unemployment rate has fallen steadily
— Tension in the labour market peaked in 2016-2017. In 2016, the wage index rose by 9.5%, and in 2017 unemployment bottomed out at 2.8%
— Unemployment likely to continue rising marginally for the remainder of the decade and real wage growth will slow down from its recent pace
— We forecast private consumption growth at 4.7% in 2018, 2.4% in 2019, and 3.2% in 2020
Private consumption and related indicators YoY change (l.axis) and index (r.axis)
0
2
4
6
8
10
12
0
1
2
3
4
5
6
7
8
2003 2005 2007 2009 2011 2013 2015 2017 2019
Unemployment, % of workforce (l.axis) Wage index, YoY change (r.axis)
-14
-12
-10
-8
-6
-4
-2
0
2
4
6
8
10
12
14
2000 2002 2004 2006 2008 2010 2012 2014 2016 2018 2020
Real wages minus private consumptionReal wagesPrivate consumption
0
25
50
75
100
125
150
-30-25-20-15-10
-505
1015
2007 2008 2009 2010 2011 2012 2013 2014 2015 2016 2017 2018Private consumption Household card turnoverReal wages Gallup CC index
Íslandsbanki 9M 2018 Financial Results
8 N
ovem
ber,
2018
1. Shaded areas indicate ISB Research/ forecastsSource: Statistic Iceland and ISB Research
37

Real estate market moving gradually toward balanceSupply is increasing and main drivers of recent price rises are losing momentum
Real residential capital region house prices and defining factorsindices
Commercial real estate real price index
New apartments and population increase in the capital region 1
House prices and residential investment
8 N
ovem
ber,
2018
38
100
120
140
160
180
200
220
240
260
0
20
40
60
80
100
120
140
160
1997 1999 2001 2003 2005 2007 2009 2011 2013 2015 2017 2019Residential investment (ISK bn, 2017 prices, l.axis) Real house prices (index, r.axis)
0
500
1000
1500
2000
2500
3000
-1000
0
1000
2000
3000
4000
5000
6000
7000
1998 2000 2002 2004 2006 2008 2010 2012 2014 2016 2018 2020Population increase (r.axis) Completed apartments (l.axis)
* Dotted lines: forecasts by Statistics Iceland and The Federation of Icelandic Industry
70
90
110
130
150
170
Jan-00 Jan-03 Jan-06 Jan-09 Jan-12 Jan-15 Jan-18Real residential house price index House price/wage index ratioHouse price/building cost ratio House price/rent ratio
-40
-30
-20
-10
0
10
20
30
40
50
0
50
100
150
200
250
300
350
Mar-97 Mar-00 Mar-03 Mar-06 Mar-09 Mar-12 Mar-15 Mar-18
YoY change (r.axis) Real price index (l.axis)
Íslandsbanki 9M 2018 Financial Results
1. Shaded areas indicate ISB Research/ forecastsSource: Statistic Iceland and ISB Research

Period of sub-target inflation has endedInflation to peak in 2019 following ISK depreciation as domestic cost pressures remain considerable
Inflation and contribution of main subitems%
Inflation and CBI inflation target%
8 N
ovem
ber,
2018
39
-3
-2
-1
0
1
2
3
4
5
6
Jan-13 Jan-14 Jan-15 Jan-16 Jan-17 Jan-18
Other services Public services Housing
Imported goods Domestic goods CPI
0.0
0.5
1.0
1.5
2.0
2.5
3.0
3.5
4.0
4.5
2014 2015 2016 2017 2018 2019
Inflation Deviation limit Inflation target
Fcast
— Inflation has been close to the CBI’s 2.5% inflation target in the recent term, after a four-year stint below target
— Upward pressure on the CPI from the housing component has subsided. At the same time the impact of the steep appreciation of the ISK in 2016-2017 on import prices has tapered off
— The outlook is for rising inflation in coming quarters. The recent depreciation of the ISK will push import prices higher. Furthermore, house price inflation is still tangible, if not as strong as before, and other cost pressures are growing steadily
— Outlook for average inflation of 3.5% in 2019 and 3.2% in 2020
— Moderating inflation further ahead, assuming that house price rises and wage increases slow gradually
— Uncertainty about wage cost pressures to the upside as wage demands in upcoming labour market bargaining are large
Íslandsbanki 9M 2018 Financial Results
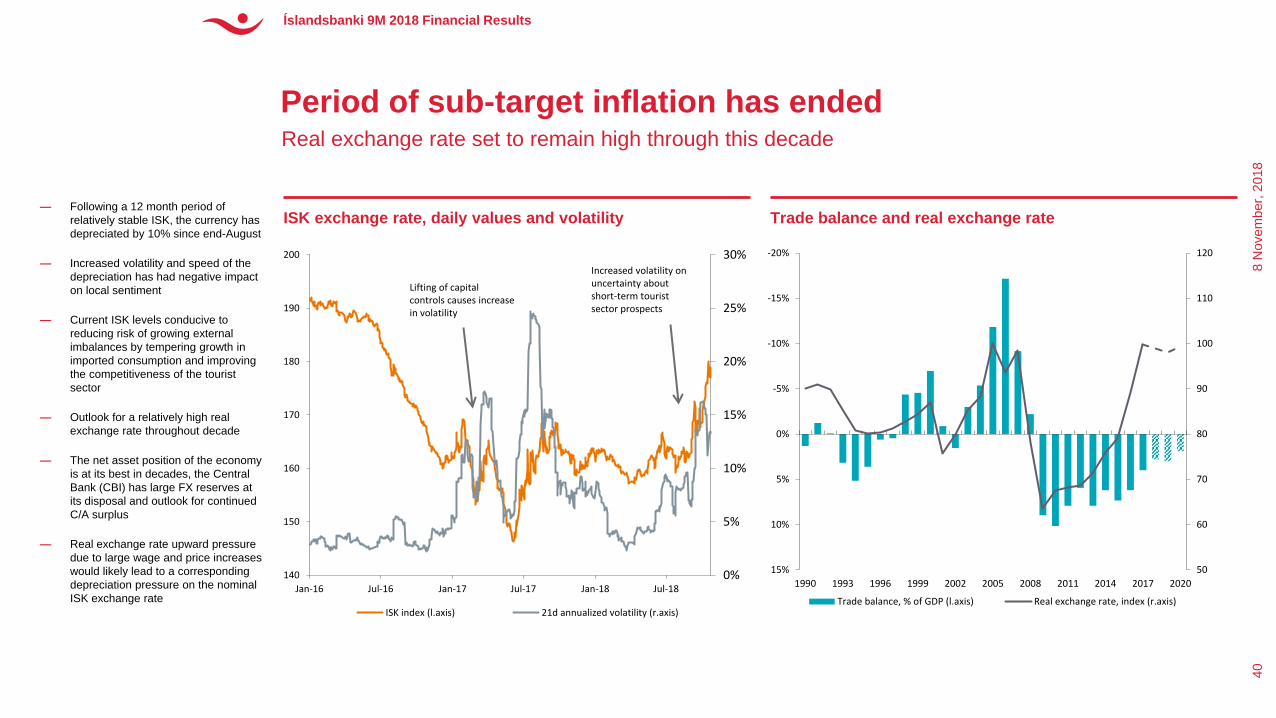
Period of sub-target inflation has endedReal exchange rate set to remain high through this decade
ISK exchange rate, daily values and volatility Trade balance and real exchange rate
8 N
ovem
ber,
2018
40
— Following a 12 month period of relatively stable ISK, the currency has depreciated by 10% since end-August
— Increased volatility and speed of the depreciation has had negative impact on local sentiment
— Current ISK levels conducive to reducing risk of growing external imbalances by tempering growth in imported consumption and improving the competitiveness of the tourist sector
— Outlook for a relatively high real exchange rate throughout decade
— The net asset position of the economy is at its best in decades, the Central Bank (CBI) has large FX reserves at its disposal and outlook for continued C/A surplus
— Real exchange rate upward pressure due to large wage and price increases would likely lead to a corresponding depreciation pressure on the nominal ISK exchange rate
0%
5%
10%
15%
20%
25%
30%
140
150
160
170
180
190
200
Jan-16 Jul-16 Jan-17 Jul-17 Jan-18 Jul-18
ISK index (l.axis) 21d annualized volatility (r.axis)
Lifting of capital controls causes increase in volatility
Increased volatility on uncertainty about short-term tourist sector prospects
50
60
70
80
90
100
110
120-20%
-15%
-10%
-5%
0%
5%
10%
15%1990 1993 1996 1999 2002 2005 2008 2011 2014 2017 2020
Trade balance, % of GDP (l.axis) Real exchange rate, index (r.axis)
Íslandsbanki 9M 2018 Financial Results

Jan-05 Jan-06 Jan-07 Jan-08 Jan-09 Jan-10 Jan-11 Jan-12 Jan-13 Jan-14 Jan-15 Jan-16 Jan-17 Jan-18
Moody´s S&P Global Fitch
AAA/Aaa
AA+/Aa1
AA/Aa2
AA-/Aa3
A+/A1
A/A2A-/A3
BBB+/Baa1
BBB/Baa2
Iceland’s credit rating has improved markedlyUpgrades from S&P and Fitch following lifting of capital controls
Development of sovereign credit rating
Source: Moody´s, S&P, Fitch Ratings and Central Bank of Iceland
MOODY’S IN JULY 2018
• The positive outlook also reflects progress made in the past two years on the major preconditions we laid out at the time of the upgrade to A3 in September 2016, including the smooth removal of capital controls and the settlement of the offshore krónursituation.
FITCH IN JUNE 2018
• The outlook is stable. • The A rating balances the economy’s high
income per capita, strong performance on governance, human development and doing business indicators against its high commodity export dependence, vulnerability to external shocks and experience of macroeconomic and financial volatility.
S&P IN JULY 2018
• S&P Global Ratings affirmed its 'A/A-1' long-and short-term foreign and local currency sovereign credit ratings on the Republic of Iceland. The outlook is stable.
• The stable outlook balances the risks stemming from the domestic economy overheating against the potential for more rapid improvements in the government and external balance sheets over the next few years.
Moody´s in July 18:
Outlook changed to positive on improved economic resilience and ongoing improvement in govt. debt metrics above expectations
S&P in Mar-17:
Rating upgrade to A on lifting of capital controls; outlook stable
Fitch in Dec-17:
Rating upgrade to A on economic stability, reduced external vulnerability and improvement in government debt ratios, supported by robust growth
Íslandsbanki 9M 2018 Financial Results
8 N
ovem
ber,
2018
41

More about ÍslandsbankiLearn more about the Bank on the Investor Relations website and through our contacts
Investor relations
Gunnar S. MagnússonHead of Investor Relations
440 4665 / 844 [email protected]
Media relations
Edda HermannsdóttirExecutive Director and Head of Communications
440 4005 / 844 [email protected]
Investor material
Further investor information can be found at the Íslandsbanki IR website https://www.islandsbanki.is/english/investor-relations/
Please visit the Icelandic IR site for material in Icelandic https://www.islandsbanki.is/um-islandsbanka/fjarfestatengsl/
8 N
ovem
ber,
2018
Íslandsbanki 9M 2018 Financial Results
42

Forward looking statementsAll information contained in this presentation should be regarded as preliminary and based on company data available. Due care and attention has been used in the preparation of forecast information. However, actual results may vary from their forecasts, and any variation may be materially positive or negative. Forecasts, by their very nature, are subject to uncertainty and contingencies, many of which are outside the control of Íslandsbanki.
Íslandsbanki cannot guarantee that the information contained herein is without fault or entirely accurate. The information in this material is based on sources that Íslandsbanki believes to be reliable. Íslandsbanki can however not guarantee that all information is correct. Furthermore, information and opinions may change without notice. Íslandsbanki is under no obligation to make amendments or changes to this publication if errors are found or opinions or information change. Íslandsbanki accepts no responsibility for the accuracy of its sources.
Íslandsbanki and its management may make certain statements that constitute “forward-looking statements". These statements can be identified by the fact that they do not relate strictly to historical or current facts. Forward-looking statements often use words such as “anticipates,” “targets,” “expects,” “estimates,” “intends,” “plans,” “goals,” “believes” and other similar expressions or future or conditional verbs such as “will,” “should,” “would” and “could.”
The forward-looking statements represent Íslandsbanki’s current expectations, plans or forecasts of its future results and revenues and beliefs held by the company at the time of publication. These statements are not guarantees of future results or performance and involve certain risks, uncertainties and assumptions that are difficult to predict and are often beyond Íslandsbanki’s control. Actual outcomes and results may differ materially from those expressed in, or implied by, any of these forward-looking statements.
Forward-looking statements speak only as of the date they are made, and Íslandsbanki undertakes no obligation to update any forward-looking statement to reflect the impact of circumstances or events that arise after the date the forward-looking statement was made.
Íslandsbanki does not assume any responsibility or liability for any reliance on any of the information contained herein. Íslandsbanki is the owner of all works of authorship including, but not limited to, all design, text, sound recordings, images and trademarks in this material unless otherwise explicitly stated. The use of Íslandsbanki’s material, works or trademarks is forbidden without written consent except were otherwise expressly stated. Furthermore, it is prohibited to publish material made or gathered by Íslandsbanki without written consent.
8 N
ovem
ber,
2018
Íslandsbanki 9M 2018 Financial Results
43

isla
ndsb
anki
.is
Takk fyrir!
8 N
ovem
ber,
2018
Íslandsbanki 9M 2018 Financial ResultsÍslandsbanki 9M 2018 Financial Results