96 BACK FACE OPENING DISPLACEMENT STRAIN (BPS) ^ …
44
96 BACK FACE_____ STRAIN (BPS) ^ G/UGE CRACK MOUTH OPENING DISPLACEMENT (CMOO) GAUGE 0 8 3 O a a'tt 3 2 1 O CRACK TIP CLIP GAUGES CRACK TIP STRAIN GAUGES NEAR TIP STRAIN GAUGES Figure 2.9 Positioning of compliance gauges used for closure measurements. LOAD Figure 2.10 Sketch showing how the point P0p is determined using the onset of linearity and using the intersection of tangents.
Transcript of 96 BACK FACE OPENING DISPLACEMENT STRAIN (BPS) ^ …

96
BACK FACE_____STRAIN (BPS) ^ G/UGE
CRACK MOUTH OPENING DISPLACEMENT (CMOO) GAUGE
0 8 3O
a a 'tt 3 2 1O
CRACK TIP CLIP GAUGES
CRACK TIP STRAIN GAUGES
NEAR TIP STRAIN GAUGES
Figure 2.9 Positioning of compliance gauges used for closure measurements.
LOAD
Figure 2.10 Sketch showing how the point P0p is determined using the onset of linearity and using the intersection of tangents.
97
Figure 2.11 An example showing how the method used Co determine closure alters the closure trend as R ratio varies. If closure is measured using the intersection of tangents (dotted linos) Kop increases with R, whereas if Kop is measured using the onset of linearity (indicate by markers) Kop remains remains fairly constant as R increases (data from ref. [55]).
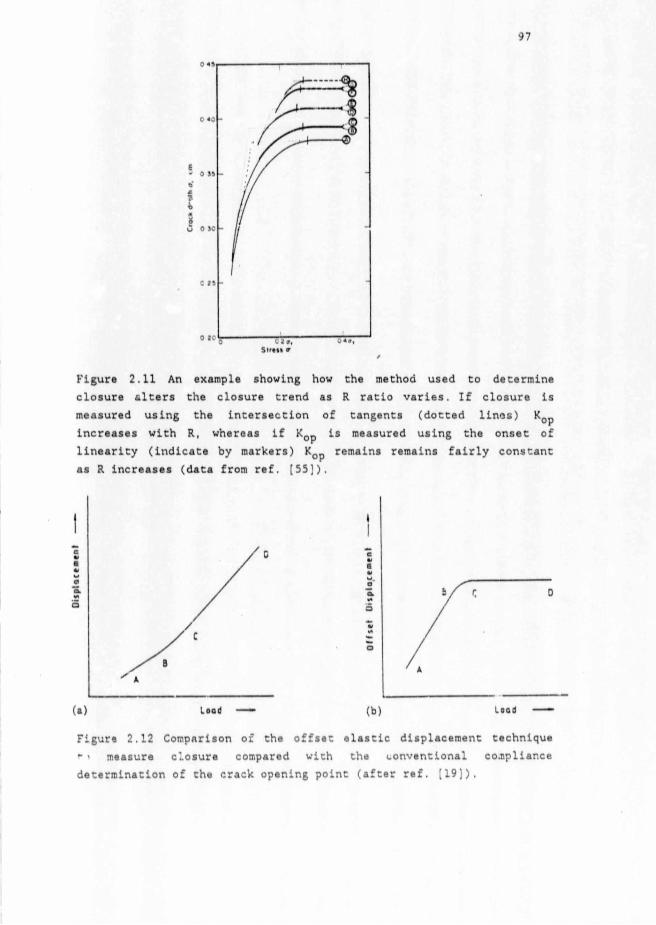
Figure 2.12 Comparison of the offset elastic displacement technique t- > measure closure compared with the conventional compliance determination of the crack opening point (after ref. [19]).
98
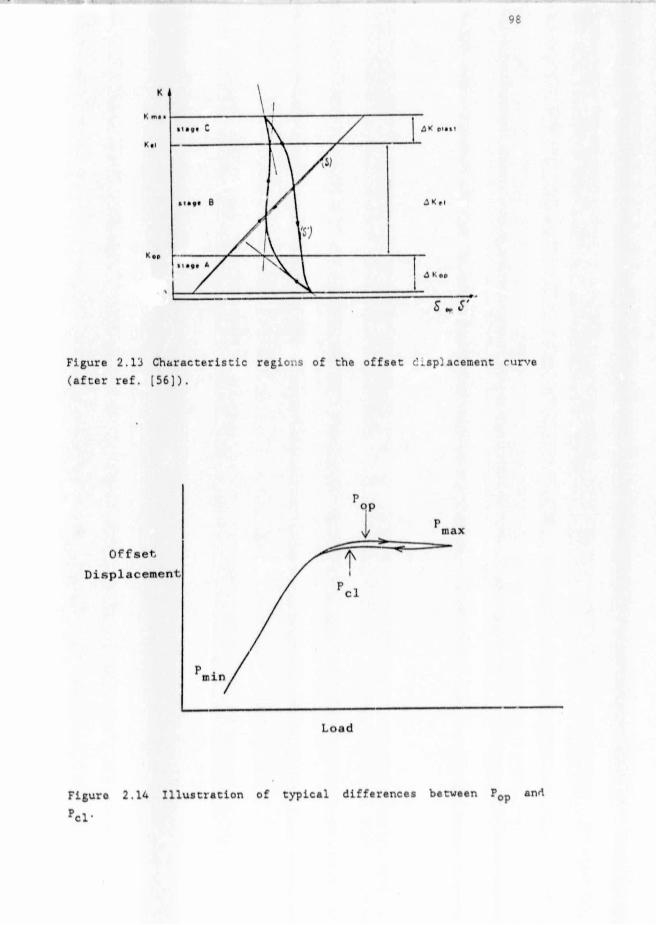
Figure 2.Ill Characteristic regions of the offset displacement curve (after ref. [56]).
Figure 2.14 Illustration of typical differences between pop and pcl-

99
Half Crock Linglh 0 tern)
Figure 2.15 An Estimation of the resolution of the closure measuring technique by using the crack increment between the minimum growth rate value and the maximum closure value, from data according to [62].
Figure 2.16 Fatigue load cycle showing the magnitude, of the parameter CTOD relative to AK and AKeff.

100
Figure 2.17 Fatigue fracture surfaces illustrating the type of surface roughness which produced closure a) comparud to that which did not produce closure b), (after ref. [25]).

( mm/cyck)
101
Figure 2.18 Growth rate data which is rations!. rn<i sir.g . >o closure parameter AKe£f, (after ref. [79]),
Id*
>.■ M fr *
■L"0OO
’O jO li'T -L )
r ? ?OF
AK
Figure 2.19 Growth rate data which is rot totally retiiv.aliseu by AKeff, (after ref. [70]).

102
Figure 2.20 Strongly bovred fatigie crack front for 25 mm thick CT specimen following growth under compressive loading (after ref [100]).

103
Notch
Reverse plastic zone that moves - along with the crack tip (decreasing in size)
esidua] tensile stresses (tensile plastic zone) after compressivu load has been renoved
Notch plastic •arising from compression
zone
Figure 2.21 a) The development of tensile stresses under compressive loading, b) Movement of the tensile stresses (reverse plastic zone) during compressive loading.

104
FATIGUE CRACK LENGTH, olmml
0.1 0.2 0.3 0.4 0.5
-4
z£ -8 o < o _j
-12
-16
Mumericol Resul'r., Plane Strain Experimer'ol Results
I A P I (kN) (o) 13.50 (b) 24.30(c) 31.95
Figure 2.22 A comparison between numerically and experimentally determined crack tip opening loads obtained under compressive loading (aiter ref. [28]) .
Figure 2.23 Schematic representation of da/dN vs AK for short and long cracks (after ref. [30]).

105
Sur£ace crack length 2c (mm)
igurp 2.24 Variation of aspect ratio with surface crack length ,.fr»r ref. [71].
Figure 2 25 Grain size (GS) vs plastic zone size (rpc) which can bevsed to determine the crack length at which the da/dn vs AK curvesconverge for small and large cracks for several alloy systems (after ref. [118]).

106
i.o j"3 . * -
...C. 7 •
0. 6 r
n---rs u : t n
t.* 0 .5
o.«0.)0.2
0.1
0
O o o
Figure 2.26 Short crack closure data obtained by a) Morris [123] and b) Larson [131].
Crack Unglh a [[Inn)
Figure 2.27 Development of crac!; closure (^op^^max^ with increasing crack length, from FFM cc -ations (after ref. [79]).

&J,mMNrrT* 107
Figure 2.28 Growti. race data correlating short (a S 0.18 nun) and 1l (a fc 25 mm) crack growth in A533B ste<jl, .'sing the ilastic plastic fracture mechanics parameter AJ (after Dowling [135]).
Figure 2.29 Graphs showing the increase in crack lenfth and closure ratio with number of cycles following d reduction ix.closure caused by the application of compressivc overloads (a*ter ref.128]).

Figure 2.30 Variation of K0p level with crack length as of AK (after rel. [53]).
*1---
Z 6
i s
3
7
\
: /
■i-----J-----I---------L___] _. I ,1 I . , „ l .0.1 a (mm) '
function
Figure 2.31 Variation of Kop with crack length a) for a 2024 T351 Al alloy (ref. [140]) and b) for a nodular cast Iron (ref. [141]).
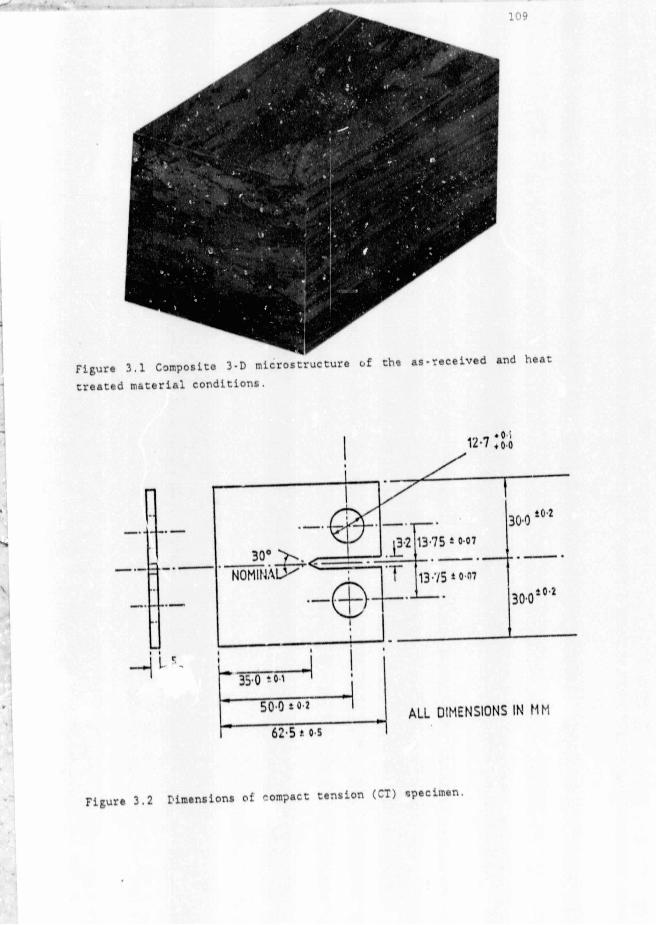
Figure 3.1 Composite 3-D microstructure of treated material conditions.
the as-received and heat
Figure 3.2 Dimensions of compact tension (CT) specimen.

110
Figure. 3.3 Orientation of CT and short crack specimens relative to the rolling direction of the aluminium plate.
7 5mm L__J
2 PLACES
175 mm
|75 mm
30mm
Figvire 3.4 Short crcck specimen geometry, similar to that used by Larson (131].

Ill
Figure 3.5 Typical fractograph of a short crack used to determine a/c ratios.
BACK FACE_____ ^STRAIN (BFS) f GAUGE
CRACK MOUTH OPENING DISPLACEMENT (CMOO) GAUGE
NEAR TIP STRAIN GAUGES
Figure 3.6 Positioning of the various gauges used ';o measure closure on CT specimens.

112
Figure 3.7 Layout of cra^k closure system. (K represents stress intensity, 6 represents strain or displacement and f represents offset displacement.)
Of f set Displacement
Load
Figure 3.8 Load vs offset displacement trace indicating the points at which P0p and were ch^'en.

113
CT Specimens
tensile
tensile
Figure 3.9 Residual stress distribution around fatigue crack notch afte'- compressive loading.

Figure 4.1 Representation of R ratio variation relative to Kop.
CT Specimen •Screw Clamp
..Wedge, which is positioned while the .specimen isbeing loaded
Hatched regions indicate areas of contact ie Clamp does not hold both top and bottom part of specimen
Figure 4.2 Sketch of triangular shaped wedge clamped into the mouth of a CT specimen, used to compare physical wedgeing with closure.

PWNMh: V’V*115
OffsetDisplacement
S'
Natural trace
op rpmax
Load
Figure 4.3 Offset displacement vs load traces illustrating the effect of wedge contact on the curvature of the trace.
= 0.05 nun
CTOD at K=7MPa/m~ is approximately 0.1um thus a particle of lum should have an effect if it is within say 0.05 mm from the cr^ck tip.
= 0.1 nun
Figure 4.4 Illustration of wcdgeing effect caused by a particle a) close to the crack tip, b) far from the crack tip.

§■s
116
Delta K (MPo >/H>
figure 5.1 Growth rates in the AR condition for 5 mm, 15 mm and 25 mm thick CT specimens.
D e lta K (MPa 7 i )
Figure 5.2 Closure data in the AR inattiial for 5 mm, 15 mm and 21 mm thick CT specimens corresponding to growth rate da.a in Fig. 5.1.

da/dN
(mm/
cycl
r)
117
Figure 5.3 Growth rate vs AKe £•£■, illustrating the inability of closure concepts to reduce growth rates onto a single line.

118
Figure 5. at R — 0.
8-:c
Flf.-re 5
4 Growth rate data for 5 mm thick heat treated CT specimens 1.
1.2
CLOSURE DATA 5 mm Heat Treated
1 P - 0. 1
* O
0.8 . 0
© ©
_0
o0.6
o ©_
© O©
©
0.4
• -
J. *■
i
0 14 6 e 10 12 14 16
O a ito K (MPa s/ni)
5a Closure data corresponding to growth rate data In Fig 5.4.

10
9
g
/-s1*5 7 >O
Q_ r 3E 6w
8- 5 4
3
24 6 a io i.: 14 is
D e lta K (MPa >/m)
Figure 5.5b Closure data presented as K0p vs AK illustrating the consistency of the Kop magnitude,
119
Kop vs AK 5 mm Hisat Treated
R - 0. 1
©
< B P 0
1C-4
S
■8
- n --- 1— m -------------- ;---- r"" " I1 1 1 — p
• *
* R ■ 0 . 1 5 win H o o t T r s a t » d -
- -r
J o :
• .
- © -
r _
: © I• O. g
O o
<*> 0r* 0 0
—’ 0 :
■ 0 :■
0-
r —j s- -
- 0 .
- -
5 - J --- 1-- 1-1 M i l __________ 1 1 » 1 « 12 I 4 S 10 20 10 40 SO
Onlto K'eff <MPo /m)
Figure 5.5c Growth rate presented as da/dN vs AKef£ for 5 mm heat treated CT specimens.
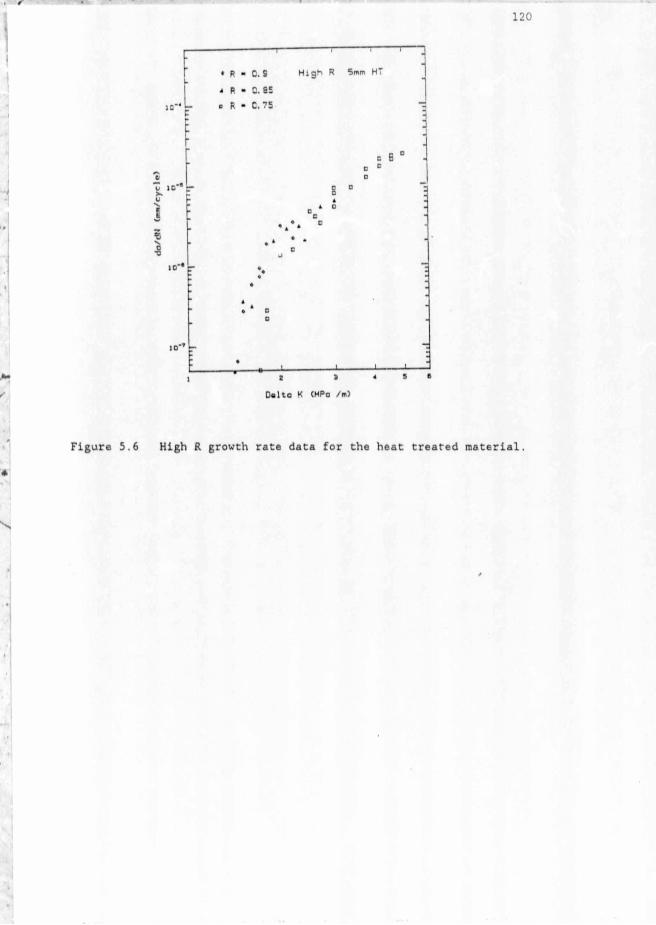
Figure 5.6 High R growth rate data for the heat treated material.

121
Delta K (MPa /in)
Figure 5.7 Closure presented as K0p vs AK for growth rate data presented in Fig 5.6.
• i i i I M I I 1 1 T T T ■Growth Rot« v« AK«ff HT -
_ o r - 0. 1 m
: ► R - 0. 75 |o :
■ o R - 0. 85 •■ 0 R - 0. 0 -
r O 1; O j. 0 .■ O 0
* 0•
- —• 6 z
; I. ■bt> .-
0 ► ►p
>
“. •
■ 0> >
.► ■
m -L J___1__JL-L-J-J I ’ - - « - « i i i u-ii
,* .1 .4 .1 .7 t 1 I * S 10
Dalto K «ff (MPo Stn)
Figure 5.8 Growth rate vs AKeff for 5 mm thick heat treated CT specimens.

Closure
Kop/Kmox
122
Del to K (MPo »/m)
Golta K (MPa 7m)
Figure 5.9 a) A comparison between the AR and HT growth rate data and the b) closure data .

Figure 5.10 Straining gauge used to strain CT specimens in the SEM.
pm
Figure 5.11 Roughness trace of the fracture surface for a 25 mm thick CT specimen in the AR condition.

124
Figure 5.12 Fractographs of fracture surfaces representative of growth rates a) b. ''•» 10' * mm/cycle and b) above 10"^ ram/cycle.
Figure 5.13 Schematic representation of the possible strain intensification due ti limited asperity contact.

125
Delta K (MPa /m)
Figure 5.14 Closure dat.i for all R ratios tested in the heat treated condition.
oxu\EE
3■uo*Dcno
C rock G rowth undar C o m p r « * » l v « Loading
Paok Compr« » » I v « Loc'4 " 13 K M
2 2.5 3Crack Growth (mm)
Figure 5.15 Fatigue crack growth under compressive loading.
126
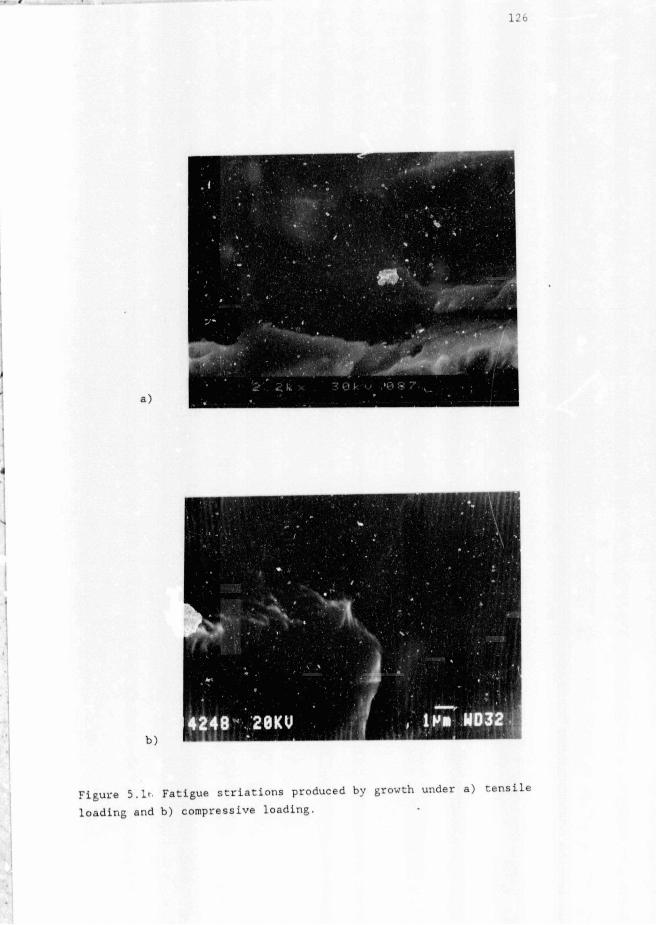
Figure 5.It Fatigue strlations produced by growth under a) tensile loading and b) compressive loading.

127
<
Figure 6.1 Fractured 25 nun chick CT specimens showing extensive curvature along the crack front.
Crack Increment (mm)
'
Figure 6.2 Closure developmenc for the AR material after closure had been eliminated by wake removal and a compressive overload.

128
Figure 6.3 Closure development in the HT material at AK - 3 MPa/m followed by closure development at AK - 6 MPa 'm.
Crack Increment (mm)
Figure 6.4 Closure development at AK - 4 MPaVm.
Crock increment (mm)
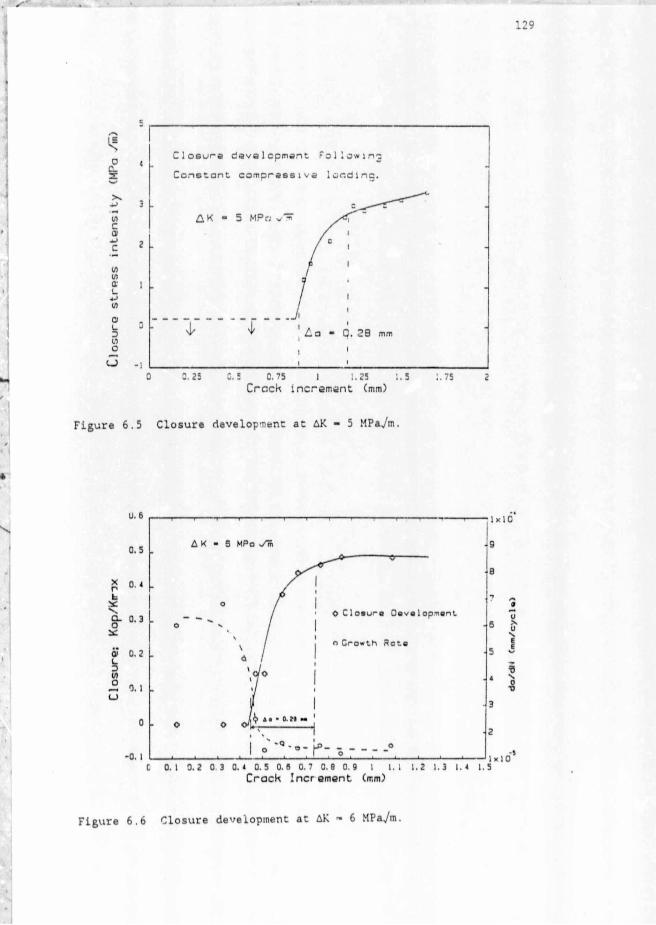
Figure 6.5 Closure development at AK - 5 MPaVm.
Figure 6.6 Closure development at AK - 6 HV&Jm.

Closure:
Kop/Ki
130
Crack Increment (mm)
Figure 6.7 Closure development at AK - 9 MPa /m.
Growth
Rots
(mm/
cyci
c)

r121
xoEbesQ-OX
Io. g
0.8 0.7 0. E
0.5 0. 4 0. 3 0.2 0. 1 . 0
C l o s u r e d e v e l o p m e n t rollowing
g r o w t h u n d e r c c m p - e s s i v e locdlnc
1n c r e o s 1ng ^ K
A r r a a tI0
L ln « » In d le e t a p o in t * a t w h ich
load 1 n c r* a » *d
e>0. ;• »«,0.2 0.4 0.6 0.8 1 1. 2 1. 4 l.S
Crack Increment (mm)
Figure 6.8a Closure development for increasing AK, starting with AK - 1.56 MPa^m.
5S■8
0 T a n i 1 1• g rowth following compraaatva
looding.
Compraaa s va g-owth ■ 1.24 mm
C i oaura first Oatactad
f o r o • 0 . 31 mm.c
•^-Long 3r o w t h rota doto
S ci¥I |V 6
o - C. 31 ♦» ♦
lO’V
D a l t o K (H Po vTS)
Figure 6.8b Fatigue crack growth rates obtained from an increasing AK method, after a crack had been produced ur>H«»r compressive cyclic loading.
132
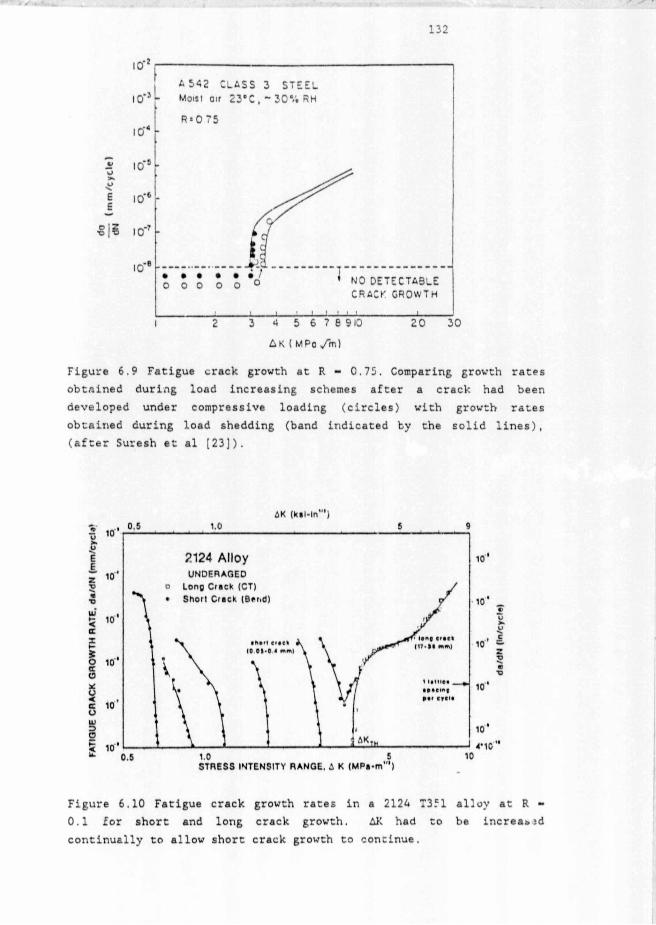
Figure 6.9 Fatigue crack growth at R - 0.75. Comparing growth rates obtained during load increasing schemes after a crack had been developed under compressive loading (circles) with growth rates obtained during load shedding (band indicated by the solid lines), (after Suresh et al [23]).
flK (kil-ln'")
IE.zm■©<dXKsocco*o<coUJ=>o
zx>
Figure 6.10 Fatigue crack growth rates in a 2124 T351 alloy at R - 0.1 for short and long crack growth. AK had to be increas’d continually to allow short crack growth to continue.
133
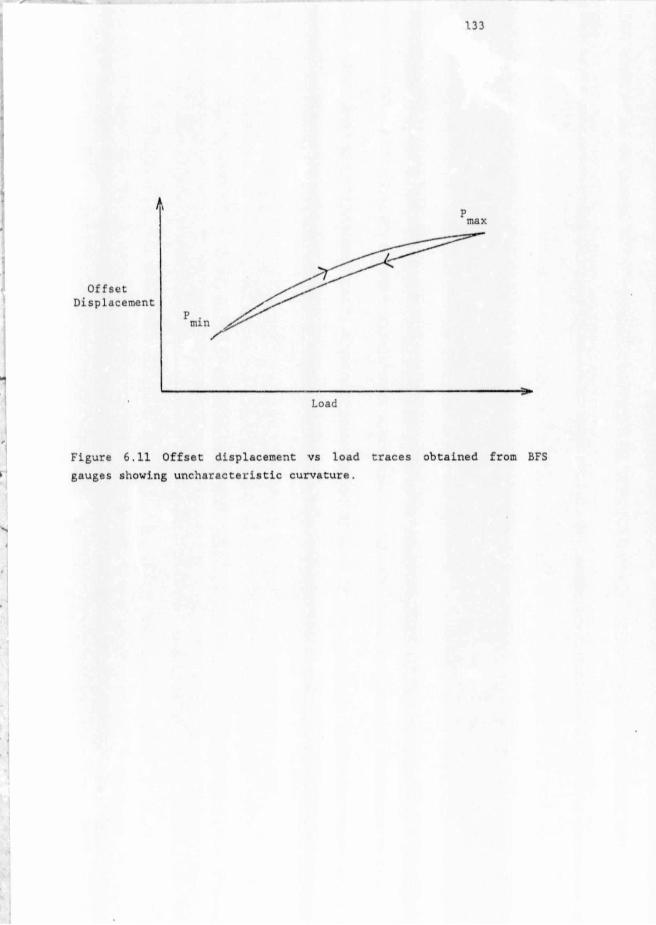
Figure 6.11 Offset displacement vs load traces obtained from BFS gauges showing uncharacteristic curvature.

134
10- t-i
Sho-t CrocH HT R • C. 2
«* o b e • 234 MPc
D<0 Ac ' 1S? MPa
I r5- l0*‘r »»»
▼ o
® 2c * 700 u*
j
1 4 S 10 20 SO 100 20C 500 1000 SC 0
ZZ (urn)
b ) Dal to K <MPo ./m)
Figure 7.1 Short crack growth data for the HT material at R - 0.1 plotted as a) da/dN vs 2c and b) da/dN vs AK.

135
Zc (yin)a)
Figure 7.2 Shorr crack growth data for the AP. material at R - 0.1

•a
Figure 7.31.
s.
'
Figure 7.3 material.
136
C^och OoptK a (/j«0
Short crack growth rates at R - 0.55 for the HT material.
O a lta K <MPa /m )
b) Comparison between short and long crack data in the HT

137
D al t o K (MPa v^S)
Figure 7.4 Comparison between shore crack data at R - 0.1 and R - 0.55 for the HT material showing a difference in growth rates for AK ranges greater than 2.2 MPaVm'.

137
Dal to K iMPa s/m)
Figure 7.4 Comparison between shore crack data at R - 0.1 and R - 0.55 for the HT material showing a difference in growth rates for AK ranges greater than 2.2 MPaVm'.

Author Garz Reiner Ernst Name of thesis Fatigue Crack Closure And Closure Development In A High Strength Aluminium Alloy. 1988
PUBLISHER: University of the Witwatersrand, Johannesburg
©2013
LEGAL NOTICES:
Copyright Notice: All materials on the Un i ve r s i t y o f the Wi twa te r s rand , Johannesbu rg L ib ra ry website are protected by South African copyright law and may not be distributed, transmitted, displayed, or otherwise published in any format, without the prior written permission of the copyright owner.
Disclaimer and Terms of Use: Provided that you maintain all copyright and other notices contained therein, you may download material (one machine readable copy and one print copy per page) for your personal and/or educational non-commercial use only.
The University of the Witwatersrand, Johannesburg, is not responsible for any errors or omissions and excludes any and all liability for any errors in or omissions from the information on the Library website.