9 Multidimensional Poverty in India - Home - Chronic
21
9 Multidimensional Poverty in India: District Level Estimates Aasha Kapur Mehta 1 (assisted by Deepa Chatterjee and Nikhila Menon) 1. Introduction Spatial inequalities exist at all levels of disaggregation. However, the nature and extent of these inequalities vary with choice of indicator and geographical space over which comparisons are made. A given state may perform extremely well on all indicators but there may be districts within that state that are among the most deprived in the country. Or a state may have very high levels of attainment on economic development and health and very low levels of attainment on education and gender parameters. No single indicator can capture the complexities of development. Therefore, indices are generally estimated by aggregating performance with regard to several indicators. This requires the identification of variables to be included in the index, the range to be used for scaling and weights to be allocated to the different variables. Decisions in this regard tend to be arbitrary and driven by availability of data. Changes in any of these factors can lead to very different results. In addition there is the issue of choice of method to be used in estimating the index. 1 Time and resources provided by IIPA and CPRC and especially the valuable suggestions made by Prof. K.L. Krishna, Dr. Pronab Sen, Dr. P.L. Sanjeev Reddy, Dr. N.C.B. Nath, Dr. Rohini Nayyar, Dr. Amita Shah, Dr. Rangacharyulu, Dr. Suryanarayana, Prof. D.C. Sah and other participants who attended the presentation of an earlier version of this paper at the Research Design Workshop for Exploring Appropriate Solutions to Chronic Poverty held at IIPA on 15th and 16th May, 2002 are gratefully acknowledged. Comments by Ramakrushna Panigrahi and Sashi Sivramkrishna are also gratefully acknowledged.
Transcript of 9 Multidimensional Poverty in India - Home - Chronic

9
Multidimensional Poverty in India:District Level Estimates
Aasha Kapur Mehta1
(assisted by Deepa Chatterjee and Nikhila Menon)
1. Introduction
Spatial inequalities exist at all levels of disaggregation. However, thenature and extent of these inequalities vary with choice of indicatorand geographical space over which comparisons are made. A givenstate may perform extremely well on all indicators but there may bedistricts within that state that are among the most deprived in thecountry. Or a state may have very high levels of attainment on economicdevelopment and health and very low levels of attainment on educationand gender parameters.
No single indicator can capture the complexities of development.Therefore, indices are generally estimated by aggregating performancewith regard to several indicators. This requires the identification ofvariables to be included in the index, the range to be used for scalingand weights to be allocated to the different variables. Decisions in thisregard tend to be arbitrary and driven by availability of data. Changes inany of these factors can lead to very different results. In addition thereis the issue of choice of method to be used in estimating the index.1 Time and resources provided by IIPA and CPRC and especially the valuable suggestions made
by Prof. K.L. Krishna, Dr. Pronab Sen, Dr. P.L. Sanjeev Reddy, Dr. N.C.B. Nath, Dr. RohiniNayyar, Dr. Amita Shah, Dr. Rangacharyulu, Dr. Suryanarayana, Prof. D.C. Sah and otherparticipants who attended the presentation of an earlier version of this paper at the ResearchDesign Workshop for Exploring Appropriate Solutions to Chronic Poverty held at IIPA on15th and 16th May, 2002 are gratefully acknowledged. Comments by Ramakrushna Panigrahiand Sashi Sivramkrishna are also gratefully acknowledged.

340Aasha Kapur Mehta
The paper tries to identify chronic poverty at the district level byusing multidimensional indicators that reflect persistent deprivation,such as illiteracy, infant mortality, low levels of agricultural productivityand poor infrastructure.
2. Spatial distribution of the Chronically, Severely and Multi-dimensionally Poor: A State level analysis
The incidence of poverty in India has declined from 54.9 per cent toreportedly 26 per cent of the population and from 321.3 million toreportedly 260.2 million during the period between 1973-74 and 1999-2000. However, those in poverty are unevenly distributed across thecountry with concentration of poverty in some states. 71.65 per cent ofIndia’s poor and half of the population are located in six states. Theseare Uttar Pradesh (including Uttaranchal), Bihar (including Jharkhand),Madhya Pradesh (including Chhatisgarh), Maharashtra, West Bengaland Orissa. Between 50 to 66 per cent of the population of seven states(the six mentioned above and additionally Assam) was living below thepoverty line in 1973-74. Twenty years later 35 to 55 per cent of theirpopulation was still in poverty. In Bihar, Orissa, Madhya Pradesh,Assam and Uttar Pradesh persistently high levels of poverty, in excess of30 percent, have occurred for several decades (Mehta and Shah, 2003).
Table 1: Incidence and Concentration of Income Povertyin Seven Selected States of India
State share of India’s Percentage of the PopulationState Poor Population of the state that is in poverty
1999-2000 2001 1973-74 1993-94 1999-2000
Assam 3.63 2.59 51.21 40.86 36.09Bihar* 16.36 10.69 61.91 54.96 42.6Madhya Pradesh* 11.47 7.91 61.78 42.52 37.43Maharashtra 8.76 9.42 53.24 36.86 25.02Orissa 6.50 3.57 66.18 48.56 47.15Uttar Pradesh* 20.36 17 57.07 40.85 31.15West Bengal 8.20 7.81 63.43 35.66 27.02All India 100.00 100.00 54.88 35.97 26.1
* including the districts in the now newly formed states.Source: Mehta and Shah (2003) based on Government of India, Poverty Estimates for 1999-
2000, Press Information Bureau, February 22, 2001 and March 1997 and Governmentof India, 2001 Provisional Population Tables.

341 Chronic Poverty in India
Table 2: State Rankings: HDI and Population below the Poverty Line
Rank Ranks of states based Ranks estimated Rank estimated Difference inon Population for HDI in 1991 for HDI in 2001 HDI Rankbelow poverty between 1991line in 1993-94 and 2001
1 Punjab Kerala Kerala 02 Andhra Pradesh Punjab Punjab 03 Gujarat Tamil Nadu Tamil Nadu 04 Haryana Maharashtra Maharashtra 05 Kerala Haryana Haryana 06 Rajasthan Gujarat Gujarat 07 Karnataka Karnataka Karnataka 08 Tamil Nadu West Bengal West Bengal 09 West Bengal Andhra Rajasthan +210 Maharashtra Assam Andhra -111 Uttar Pradesh Rajasthan Orissa +112 Assam Orissa MadhyaPradesh +113 Madhya Pradesh MadhyaPradesh Uttar Pradesh +114 Orissa Uttar Pradesh Assam -415 Bihar Bihar Bihar 0
Source: Planning Commission Press Release, March, 1997 and Planning Commission, NationalHuman Development Report, (2002).
Multidimensional Poverty
The poor suffer deprivation in multiple ways: low levels of income,illiteracy, relatively high levels of mortality, poor infrastructure, lackof voice and poor access to resources such as credit, land, water, andforests. Human and gender development indices improve on income-based indicators as measures of well being, by moving beyond incomecentered approaches, to measuring development and incorporatingcapabilities such as being healthy or literate into the development index.
Comparing the ranks of 15 large states on the basis of populationbelow the poverty line estimated by the Planning Commission withvalues of the human development index shows that income basedpoverty incidence and performance on human development indicatorsseem to follow a similar pattern in most cases. The exceptions in thisregard are Andhra, Kerala, Rajasthan, Tamil Nadu and Maharashtra(See table 2). Low attainments on literacy result in the rank for Andhra

342Aasha Kapur Mehta
plummeting from 2 on proportion of population below the povertyline to 9 /10 on HDI and for Rajasthan from 6 to 11/9. Conversely,Maharashtra’s rank improves from 10 on poverty to 4 on HDI, TamilNadu’s from 8 to 3 and Kerala’s from 5 to 1 primarily due to highlevels of literacy and significant reductions in infant mortality in thesestates. The HDI ranks for the different states remain fairly stable formost states between 1991 and 2001. 5 out of the 7 high income povertystates, i.e., Orissa, Madhya Pradesh, Uttar Pradesh, Assam and Bihar,have the lowest five ranks on human development as well. West Bengalis ranked 9 on poverty and 8 on human development out of 15 states.Maharashtra is the only state that is high on income poverty (rank 10)but performs well on human development (rank 4). The overall patternreflects a convergence of deprivation in multiple dimensions ormultidimensional poverty.
Human and gender development indices such as HDI, GDI, GEMand HPI have also been estimated by several researchers at the statelevel for India and their results show that Kerala, has the highest rankon all four indices and Maharashtra also performs well. Punjab andHaryana have high scores on human development but perform poorlyon gender indicators. Orissa, Uttar Pradesh, Bihar, Madhya Pradeshand Assam have high income poverty and also perform poorly on HDI,GDI, GEM and HPI. Rajasthan ranks better on income poverty butperforms dismally on all four multidimensional indicators. (see CPRCWorking Paper No. 7).
Spatial distribution of the Multidimensional Poor at the Regionallevel
Disaggregated estimates of poverty and severe poverty are availableat the regional level for 59 regions from 16 large states. The data showthat the severest concentration of poverty in India is in 12 rural and 21urban regions. Between 20 percent and 43 percent of the populationliving in these regions suffer severe poverty (income of 75 percent orless than the poverty line). All 12 rural and 15 out of 21 urban regionsare located in five out of the seven states with high incidence of incomepoverty. Addditionally, severe poverty also occurs in six urban regions

343 Chronic Poverty in India
of three of the more developed states - Andhra Pradesh, Karnatakaand Tamil Nadu.
The 12 rural regions are southern, (now Jharkhand) northern andcentral Bihar, central, southern and south western, Madhya Pradesh,inland central and inland eastern Maharashtra, southern Orissa andcentral, eastern and southern Uttar Pradesh. Approximately half tomore than two thirds of the population of the rural areas of theseregions was below the poverty line (the exact estimates are 46 percent to 69 per cent). Variables reflecting multidimensional deprivation,such as incidence of child mortality, literacy, access to infrastructuresuch as electricity, toilet facilities and postal and telegraphiccommunications show that in these regions, child mortality is 1.7 timesto 3.7 times, female literacy one tenth to half and total literacy onefourth to two thirds of the estimates for the best performing region.Similarly, access to public provisioning of infrastructure such aselectricity, toilet facilities and post and telegraph are as low as 5 percent, 6 per cent and 9 per cent of those in the best performing region.
The 21 urban regions with 20 per cent to 43 per cent of theirpopulation in severe poverty include inland southern and southwesternAndhra, northern Bihar, inland eastern and inland northern Karnataka,central, northern, southern and southwestern Madhya Pradesh as alsoMalwa, Vindhya and Chattisgarh, (now one of the newly formed states)regions of Madhya Pradesh, eastern, inland central, inland eastern andinland northern Maharashtra, coastal and southern Orissa, coastal andsouthern Orissa and southern Uttar Pradesh. 16 out of the 21 regionshad 45 per cent to 72 per cent of their population below the povertyline. (see table 3). Estimates of access to education, health andinfrastructure for the urban areas of these regions also reflect valuesthat are well below those for the best performing region.
Most of these regions have suffered high incidence of income andnon-income deprivation over many decades. With approximately halfto three-fourths of the population of these areas in poverty, it ispossible to conclude that those vulnerable to severe and long durationpoverty tend to suffer deprivation in multiple and mutually reinforcingways.

344Aasha Kapur Mehta
Tabl
e 3: D
epriv
atio
n at
the R
egio
nal L
evel
: Diff
eren
t Dim
ensi
ons
Rur
al%
seve
rely
% p
oor
Child
Fem
ale
Tota
lE
lect
ricity
Toile
tP
& T
poor
mor
talit
ylit
erac
ylit
erac
yfa
cilit
y
Stat
eRe
gion
Biha
rCe
ntra
l24
.66
54.0
372
.28
22.5
339
.77
6.53
7.74
18.1
2
Biha
rN
orth
ern
27.6
258
.68
76.0
515
.71
30.3
93.
883.
9822
.68
Biha
rSo
uthe
rn31
.57
62.4
469
.816
.31
32.6
67.
653.
659.
17
Mad
hya P
.Ce
ntra
l21
.78
50.1
312
7.77
21.3
338
.65
37.1
4.45
11.1
4
Mad
hya P
.So
uth
22.3
746
.36
123
27.2
742
.24
36.7
33.
513
.02
Mad
hya P
.S
Wes
tern
42.2
468
.213
3.21
21.9
635
.77
48.0
75.
4114
.72
Mah
aras
htra
Inl C
entra
l28
.91
50.0
260
.23
27.5
45.7
448
.63
2.85
25.5
1
Mah
aras
htra
Inl E
aste
rn20
.06
49.0
893
.38
47.1
759
.86
57.3
17.
8723
.46
Oris
saSo
uthe
rn34
.08
69.0
212
3.25
11.0
123
.56
6.64
2.77
11.8
3
Utta
r P.
Cent
ral
26.7
950
.298
.43
18.9
534
.92
5.74
3.42
17.8
2
Utta
r P.
Easte
rn23
.248
.692
.33
15.1
235
.33
10.3
23.
2613
.98
Utta
r P.
Sout
hern
39.7
66.7
410
1.54
16.6
336
.34
7.47
3.71
23.8
3
Max
1.67
7.55
35.3
987
.96
91.0
685
.88
48.6
999
.11
Min
42.2
469
.02
135.
669.
3723
.56
3.88
2.11
9.17

345 Chronic Poverty in India
Urb
an%
seve
rely
% p
oor
Child
Fem
ale
Tota
lE
lect
ricity
Toile
tP
& T
poor
mor
talit
ylit
erac
ylit
erac
yfa
cilit
y
And
hra P
.In
l Sou
ther
n22
.75
45.4
453
.40
29.1
843
.44
51.3
45.
4260
.21
And
hra P
.SW
este
rn20
.29
40.9
368
.98
20.0
034
.83
44.5
44.
1176
.42
Biha
rN
orth
ern
21.6
849
.37
76.0
515
.71
30.3
93.
883.
9822
.68
Kar
nata
kaIn
l Eas
tern
20.1
536
.29
61.0
444
.73
55.9
546
.67
9.56
68.1
5K
arna
taka
Inl N
orth
ern
36.4
957
.63
63.8
728
.25
43.0
236
.47
3.63
44.0
8M
adhy
a P.
Cent
ral
32.9
353
.68
127.
7721
.33
38.6
537
.14.
4511
.14
Mad
hya P
.Ch
attis
garh
21.8
844
.210
9.06
20.9
835
.22
25.2
63.
3113
.11
Mad
hya P
.M
alwa
21.8
545
.53
92.9
314
.45
31.4
943
.96
4.92
12.5
1M
adhy
a P.
Nor
ther
n23
.54
44.7
211
3.98
14.7
036
.40
39.7
32.
7315
.32
Mad
hya P
.So
uth
27.9
51.2
312
327
.27
42.2
436
.73
3.5
13.0
2M
adhy
a P.
S W
este
rn36
.657
.14
133.
2121
.96
35.7
748
.07
5.41
14.7
2M
adhy
a P.
Vin
dhya
24.3
250
.45
135.
6615
.80
32.0
324
.71
2.11
12.7
6M
ahar
asht
raE
aste
rn21
.02
52.0
291
.24
40.7
554
.95
74.3
611
.28
15.9
8M
ahar
asht
raIn
l Cen
tral
42.6
260
.13
60.2
327
.545
.74
48.6
32.
8525
.51
Mah
aras
htra
Inl E
aste
rn38
.99
59.3
293
.38
47.1
759
.86
57.3
17.
8723
.46
Mah
aras
htra
InlN
orth
ern
32.2
856
.94
74.8
938
.74
52.9
664
.83
5.20
35.0
5O
rissa
Coas
tal
26.5
448
.42
127.
5241
.29
55.9
223
.50
4.51
20.2
0O
rissa
Sout
hern
33.5
345
.64
123.
2511
.01
23.5
66.
642.
7711
.83
Tam
il N
adu
Coas
tal
20.3
142
.11
50.1
144
.46
57.6
637
.57.
0661
.12
Tam
il N
adu
Sout
hern
24.8
248
.13
55.6
348
.68
63.5
344
.56
9.03
56.3
3U
ttar P
.So
uthe
rn37
.54
72.5
210
1.54
16.6
336
.34
7.47
3.71
23.8
3M
ax72
.52
<1
35.3
987
.96
91.0
685
.88
48.6
999
.11
Min
3.86
42.6
213
5.66
9.37
23.5
63.
882.
119.
17
Sour
ce: P
lanni
ng C
ommi
ssion
, Jun
e, 20
00 an
d NIR
D, In
dia R
ural
Deve
lopme
nt R
epor
t, 19
99

346Aasha Kapur Mehta
3. Indicators and Methods
Multidimensional indicators were estimated for about 379 districts in15 large states of India based on data for the early 1990s. Variableschosen were those for which data is available at the district level andthat reflect long duration deprivation. For example, persistent spatialvariations in the infant mortality rate could be considered to reflectpersistent deprivation to the means of accessing good health. Thiscould be due to several factors such as inability to get medical caredue to lack of income, lack of available health care facilities in thevicinity, poor quality of drinking water resulting in water borne diseasesthat cause mortality, lack of roads and public transport that enablequick transportation to hospitals in case of emergency or all of theabove. Similarly, illiteracy could be considered to be a persistent denialof access to information, knowledge and voice. Low levels ofagricultural productivity may reflect poor resource base, low yieldsdue to lack of access to irrigation and other inputs, poor quality ofsoil resulting from erosion or lack of access to resources for investmentbecause of lack of collateral or adverse climatic or market conditions.Poor quality of infrastructure reflects persistent denial of opportunitiesfor income generation and growth. These district level indicators wereused to help sharpen the identification of areas in chronic poverty.
Three groups of indices were computed.
1. An average of three indicators representing education, health andincome, with equal weights of one third assigned to each. These are:
a. An average of female literacy and percent population in theage group 11-13 years attending school
b. Infant mortality rate
c. Agricultural productivity.
2. An average of four indicators representing education, health,income and development of infrastructure with equal weights ofone fourth assigned to each. These are:
a. An average of female literacy and percent population in theage group 11-13 years attending school

347 Chronic Poverty in India
b. Infant mortality rate
c. Agricultural productivity
d. Infrastructure development.
3. An average of four indicators representing education, health,income and development of infrastructure with equal weights ofone fourth assigned to each. These are:
a. An average of literacy and percent of population in the agegroup 11-13 years attending school
b. Infant mortality rate
c. Agricultural productivity
d. Infrastructure development.
Each of these sets of three indices is computed on the basis ofthree different methods with a view to determining robustness of theresults. The three methods are:
1. the method used by the UNDP with the minimum-maximum rangegiven below:
a. For literacy, female literacy and percent population in the agegroup 11-13 years attending school – 0 to 100 in each case
b. Infant mortality rate – 0 to 200
c. Agricultural productivity – 0 to 30
d. Infrastructure development – 0 to 500
2. calculating an Adjusted value of each index so that the valuesobtained are not sensitive to changes in the ranks with changes inthe minimum – maximum limits used. The method for calculatingthe AHDI is based on Panigrahi and Sivaramakrishna, 2002.1 Theminimum-maximum used is the same as in the UNDP method in(1) above.
3. calculating an Adjusted value of each index so that the valuesobtained are not sensitive to changes in the ranks with changes inthe minimum – maximum limits used. The minimum-maximumused is the actual minimum and maximum for each of the variables.

348Aasha Kapur Mehta
Data are from the Census (1991), Bhalla and Singh (2001) andCMIE (2000).
4. Deprivation at the District Level: Identifying the 50 to 60 mostdeprived districts in India
The 9 sets of results were then sorted to identify the most depriveddistricts.
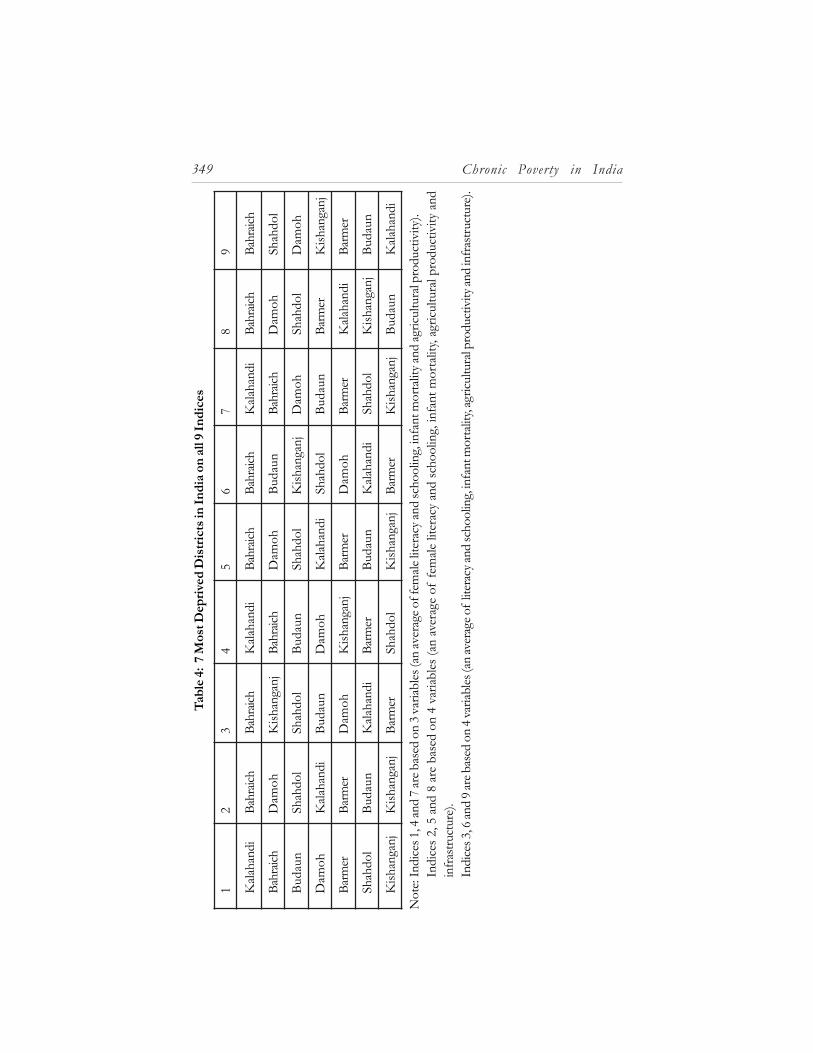
The seven most deprived districts computed on the basis of the 9sets of indices have been identified as Bahraich and Budaun in UP,Barmer in Rajasthan, Damoh and Shahdol in MP, Kishanganj in Biharand Kalahandi in Orissa (see table 4). The results clearly show stabilityacross all 9 indices with regard to the identification of the mostdeprived districts.
Comparing the districts identified as most deprived on the basisof multidimensional indicators in table 4 with the states and regionsthat are identified as having the largest percentage of their populationbelow the poverty line and in severe poverty (see tables 1, 5 and 6),shows that:
Six of the seven most deprived districts are located in four of theseven high income poverty states identified in table 1. These areOrissa, Bihar, Madhya Pradesh and Uttar Pradesh.
None of the districts in Assam, West Bengal and Maharashtra areincluded in the seven districts with the highest multidimensionaldeprivation.
Rajasthan is not one of the seven states with the highest incidenceof income poverty. However, the district of Barmer is includedamong the seven districts with the highest multidimensionaldeprivation due to levels of literacy especially female literacy beingabout the lowest in the country (7.7 per cent), very low levels ofagricultural productivity and high infant mortality.
Kalahandi in Orissa is the most deprived regardless of how wemeasure poverty. It is among the 7 most multidimensionallydeprived districts and also belongs to the poorest rural region(Southern Orissa) in the country, with 69 per cent of people living
349 Chronic Poverty in India
Tabl
e 4: 7
Mos
t Dep
rived
Dis
trict
s in
Indi
a on
all 9
Indi
ces
12
34
56
78
9
Kala
hand
iBa
hraic
hBa
hraic
hK
alaha
ndi
Bahr
aich
Bahr
aich
Kala
hand
iBa
hraic
hBa
hraic
h
Bahr
aich
Dam
ohK
ishan
ganj
Bahr
aich
Dam
ohBu
daun
Bahr
aich
Dam
ohSh
ahdo
l
Buda
unSh
ahdo
lSh
ahdo
lBu
daun
Shah
dol
Kish
anga
njD
amoh
Shah
dol
Dam
oh
Dam
ohK
alaha
ndi
Buda
unD
amoh
Kala
hand
iSh
ahdo
lBu
daun
Barm
erK
ishan
ganj
Barm
erBa
rmer
Dam
ohK
ishan
ganj
Barm
erD
amoh
Barm
erK
alaha
ndi
Barm
er
Shah
dol
Buda
unK
alaha
ndi
Barm
erBu
daun
Kala
hand
iSh
ahdo
lK
ishan
ganj
Buda
un
Kish
anga
njK
ishan
ganj
Barm
erSh
ahdo
lK
ishan
ganj
Barm
erK
ishan
ganj
Buda
unK
alaha
ndi
Not
e:In
dice
s 1, 4
and
7 ar
e bas
ed o
n 3
varia
bles
(an
aver
age o
f fem
ale lit
erac
y and
scho
olin
g, in
fant
mor
talit
y and
agric
ultu
ral p
rodu
ctiv
ity).
Indi
ces 2
, 5 a
nd 8
are
bas
ed o
n 4
varia
bles
(an
aver
age
of fe
male
lite
racy
and
scho
olin
g, in
fant
mor
talit
y, ag
ricul
tura
l pro
duct
ivity
and
infra
struc
ture
).In
dice
s 3, 6
and
9 are
bas
ed o
n 4 v
ariab
les (a
n av
erag
e of l
itera
cy an
d sc
hool
ing,
infa
nt m
orta
lity,
agric
ultu
ral p
rodu
ctiv
ity an
d in
frastr
uctu
re).

350Aasha Kapur Mehta
below the poverty line. (see tables 5 and 6). Kalahandi has verylow levels of literacy and an extremely high level of infant mortalityof 137.All the regions of Bihar have relatively high levels of poverty.However, Kishanganj in Northern Bihar is additionally one of the7 districts with the most multidimensional deprivation. Whilepoverty incidence at 62 per cent is higher in Southern Bihar (nowJharkhand) compared with 58 per cent in Northern Bihar, ruralareas of both are included among the seven regions that have thehighest levels of income poverty. The female literacy rate inKishanganj is 10 per cent and infant mortality close to the highestin Bihar at 113.The South west region of Madhya Pradesh has the second highestproportion of the rural population in poverty and severe povertyin India (68 per cent) and has the fifth highest level of urbanpoverty. However, none of the districts of this region are amongthe 7 most multidimensionally deprived.The only other part of Madhya Pradesh that is included among thepoorest seven regions of India is urban Central Madhya Pradesh.
Table 5: Population in poverty and severe poverty in regions to which7 most deprived districts belong
Districts Rural Rural Urban UrbanState Region % popu- % popu- % popu- % popu
lation lation lation lationpoor severely poor severely
poor poor
Orissa Southern Kalahandi 69.02 34.08 45.64 33.53
Bihar Northern Kishanganj 58.68 27.62 49.37 21.68
Madhya Pradesh Central Damoh 50.13 21.78 53.68 32.93
Madhya Pradesh Vindhya Shahdol 36.71 13.8 50.45 24.32
Uttar Pradesh Eastern Bahraich 48.6 23.2 38.6 18.48
Uttar Pradesh Western Budaun 29.59 10.24 31.03 14.37
Rajasthan Western Barmer 25.48 5.84 23.68 7.43
Source: Based on K.L. Datta and Savita Sharma, Level of Living in India, PlanningCommission, 2000.

351 Chronic Poverty in India
Table 6: 7 Regions with the largest percentage of populationin poverty and severe poverty in India
Rural Poor VeryPoor
Orissa Southern 69.02 Madhya Pradesh South Western 42.24Madhya Pradesh South Western 68.2 Uttar Pradesh Southern 39.7Uttar Pradesh Southern 66.74 Orissa Southern 34.08Bihar Southern 62.44 Bihar Southern 31.57West Bengal Himalayan 58.73 Maharashtra Inland Central 28.91Bihar Northern 58.68 Bihar Northern 27.62Bihar Central 54.03 Uttar Pradesh Central 26.79
Urban Poor VeryPoor
Uttar Pradesh Southern 72.52 Maharashtra Inland Central 42.62Maharashtra Inland Central 60.13 Maharashtra Inland Eastern 38.99Maharashtra Inland Eastern 59.32 Uttar Pradesh Southern 37.54Karnataka Inland Northern 57.63 Madhya Pradesh South Western 36.6Madhya Pradesh South Western 57.14 Karnataka Inland Northern 36.49Maharashtra Inland Northern 56.94 Orissa Southern 33.53Madhya Pradesh Central 53.68 Madhya Pradesh Central 32.93
Source: Based on K.L. Datta and Savita Sharma, Level of Living in India, Planning Commission,2000.
However, two districts, Damoh in Central MP and Shahdol inVindhya, are among the most multidimensionally deprived districtsin India. With infant mortality rates at 166 in Damoh and 137 inShahdol, extreme health deprivation exists in these districts.
Rajasthan does relatively well in income poverty terms and lesswell on multidimensional criteria. Barmer in Western Rajasthan isone of the 7 most multidimensionally deprived districts, with afemale literacy rate of 7.7 per cent , extremely low levels ofagricultural productivity and an infant mortality rate of 99.
While southern UP is among the poorest regions in the country,none of the districts in this region gets included in the 7 mostmultidimensionally deprived districts of India. However, Bahraich(female literacy 10 per cent and infant mortality rate 138) in Eastern

352Aasha Kapur Mehta
UP and Budaun (female literacy 12 per cent and infant mortalityrate 146) in Western UP are in this group of districts.
Similarly, computations based on the 9 indices listed above showthat the 52 to 60 districts with the highest levels of multidimensionaldeprivation out of 379 districts in 15 large states of India (see table 7)are located in six states of India.
Five of these six states are among the seven high income povertystates in table 1, i.e., Orissa, Bihar, Madhya Pradesh, Uttar Pradeshand Assam.
The distribution of districts between the six states is 21 to 26districts in Madhya Pradesh, 11 to 12 districts in Rajasthan, 6 to10 districts in UP, between 5 to 8 districts in Bihar, 4 districts inOrissa, and 1 district in Assam.
The constancy of districts regardless of indicators used andmethod of computation is clearly reflected in the results. The same52 to 60 districts are identified as the most deprived in almost all9 cases.
Low literacy, especially female literacy and high infant mortalityare major factors in explaining the incidence of multidimensionaldeprivation.
Identification of districts that reflect chronic deprivation inmultidimensional parameters is the first step in determiningstrategies to correct such imbalances.
5. Conclusions
Spatial estimates at various levels of disaggregation reflect convergenceof deprivation in multiple dimensions or multidimensional poverty.Those in poverty are unevenly distributed across India withconcentration of poverty in some states. Variables reflectingmultidimensional deprivation, such as incidence of child mortality,literacy, access to infrastructure such as electricity, toilet facilities andpostal and telegraphic communications are estimated to be severaltimes worse in regions with high incidence of poverty relative to thosein the best performing region.

353 Chronic Poverty in India
Tabl
e 7: M
ost d
epriv
ed 50
to 60
dis
trict
s out
of 3
79 d
istri
cts
Inde
x1
23
45
67
89
Stat
eA
ssam
Dhu
bri
Dhu
bri
Dhu
bri
Dhu
bri
Dhu
bri
Dhu
bri
Dhu
bri
Dhu
bri
Dhu
bri
Biha
rA
raria
Ara
riaA
raria
Ara
riaA
raria
Ara
riaA
raria
Ara
riaA
raria
Biha
rD
eogh
arD
eogh
arD
eogh
arK
ishan
ganj
Deo
ghar
Deo
ghar
Biha
rK
atih
arBi
har
Kish
anga
njK
ishan
ganj
Kish
anga
njK
ishan
ganj
Kish
anga
njK
ishan
ganj
Kish
anga
njK
ishan
ganj
Biha
rPa
lamu
Palam
uPa
lamu
Palam
uPa
lamu
Palam
uPa
lamu
Palam
uPa
lamu
Biha
rPu
rnia
Purn
iaPu
rnia
Purn
iaBi
har
Sahi
bgan
jSa
hibg
anj
Sahi
bgan
jSa
hibg
anj
Sahi
bgan
jSa
hibg
anj
Biha
rSi
tam
arhi
Sita
mar
hiSi
tam
arhi
Sita
mar
hiSi
tam
arhi
Sita
mar
hiSi
tam
arhi
Sita
mar
hiSi
tam
arhi
MP
Basta
rBa
star
Basta
rBa
star
Basta
rBa
star
Basta
rBa
star
Basta
rM
PBe
tul
Betu
lBe
tul
Betu
lBe
tul
Betu
lBe
tul
Betu
lBe
tul
MP
Chha
ttarp
urCh
hatta
rpur
Chha
ttarp
urCh
hatta
rpur
Chha
ttarp
urCh
hatta
rpur
Chha
ttarp
urCh
hatta
rpur
Chha
ttarp
urM
PD
amoh
Dam
ohD
amoh
Dam
ohD
amoh
Dam
ohD
amoh
Dam
ohD
amoh
MP
Dat
iaD
atia
Dat
iaM
PD
har
MP
Eas
t Nim
arE
ast N
imar
Eas
t Nim
arE
ast N
imar
Eas
t Nim
arE
ast N
imar
Eas
t Nim
arE
ast N
imar
Eas
t Nim
arM
PG
una
Gun
aG
una
Gun
aG
una
Gun
aG
una
Gun
aG
una
MP
Jhab
uaJh
abua
Jhab
uaJh
abua
Jhab
uaJh
abua
Jhab
uaJh
abua
Jhab
uaCo
ntd.
Nex
t Pag
e.....

354Aasha Kapur Mehta
MP
Man
dla
Man
dla
Man
dla
Man
dla
Man
dla
Man
dla
Man
dla
Man
dla
Man
dla
MP
Pann
aPa
nna
Pann
aPa
nna
Pann
aPa
nna
Pann
aPa
nna
Pann
aM
PRa
isen
Raise
nRa
isen
Raise
nRa
isen
Raise
nRa
isen
Raise
nRa
isen
MP
Rajga
rhRa
jgarh
Rajga
rhRa
jgarh
Rajga
rhRa
jgarh
Rajga
rhRa
jgarh
Rajga
rhM
PRa
jnan
dgao
nRa
jnan
dgao
nRa
jnan
dgao
nRa
jnan
dgao
nRa
jnan
dgao
nM
PRa
tlam
Ratla
mRa
tlam
Ratla
mRa
tlam
Ratla
mRa
tlam
Ratla
mRa
tlam
MP
Rewa
Rewa
Rewa
Rewa
Rewa
Rewa
Rewa
Rewa
Rewa
MP
Saga
rSa
gar
Saga
rSa
gar
Saga
rSa
gar
Saga
rSa
gar
Saga
rM
PSa
tna
Satn
aSa
tna
Satn
aSa
tna
Satn
aSa
tna
Satn
aSa
tna
MP
Seho
reSe
hore
Seho
reSe
hore
Seho
reSe
hore
Seho
reSe
hore
Seho
reSe
oni
MP
Shah
dol
Shah
dol
Shah
dol
Shah
dol
Shah
dol
Shah
dol
Shah
dol
Shah
dol
Shah
dol
MP
Shaja
pur
Shaja
pur
Shaja
pur
Shaja
pur
MP
Shiv
puri
Shiv
puri
Shiv
puri
Shiv
puri
Shiv
puri
Shiv
puri
Shiv
puri
Shiv
puri
Shiv
puri
MP
Sidh
iSi
dhi
Sidh
iSi
dhi
Sidh
iSi
dhi
Sidh
iSi
dhi
Sidh
iM
PSu
rguj
aSu
rguj
aSu
rguj
aSu
rguj
aSu
rguj
aSu
rguj
aSu
rguj
aSu
rguj
aSu
rguj
aM
PTi
kam
garh
Tika
mga
rhTi
kam
garh
Tika
mga
rhTi
kam
garh
Tika
mga
rhTi
kam
garh
Tika
mga
rhTi
kam
garh
MP
Wes
t Nim
arW
est N
imar
Wes
t Nim
arW
est N
imar
Wes
t Nim
arW
est N
imar
Wes
t Nim
arW
est N
imar
Wes
t Nim
arO
rissa
Gan
jamG
anjam
Gan
jamG
anjam
Gan
jamG
anjam
Gan
jamG
anjam
Gan
jamO
rissa
Kala
hand
iK
alaha
ndi
Kala
hand
iK
alaha
ndi
Kala
hand
iK
alaha
ndi
Kala
hand
iK
alaha
ndi
Kala
hand
i
Cont
d. N
ext P
age..
...
Cont
d. Pr
eviou
s Pa
ge....
.

355 Chronic Poverty in India
Oris
saK
orap
utK
orap
utK
orap
utK
orap
utK
orap
utK
orap
utK
orap
utK
orap
utK
orap
utO
rissa
Phul
bani
Phul
bani
Phul
bani
Phul
bani
Phul
bani
Phul
bani
Phul
bani
Phul
bani
Phul
bani
Rajas
than
Bans
war
aBa
nsw
ara
Bans
war
aBa
nsw
ara
Bans
war
aBa
nsw
ara
Bans
war
aBa
nsw
ara
Bans
war
aRa
jasth
anBa
rmer
Barm
erBa
rmer
Barm
erBa
rmer
Barm
erBa
rmer
Barm
erBa
rmer
Rajas
than
Bhilw
ara
Bhilw
ara
Bhilw
ara
Bhilw
ara
Bhilw
ara
Bhilw
ara
Bhilw
ara
Bhilw
ara
Bhilw
ara
Rajas
than
Dho
lpur
Dho
lpur
Rajas
than
Dun
garp
urD
unga
rpur
Dun
garp
urD
unga
rpur
Dun
garp
urD
unga
rpur
Dun
garp
urD
unga
rpur
Dun
garp
urRa
jasth
anJa
isalm
erJa
isalm
erJa
isalm
erJa
isalm
erJa
isalm
erJa
isalm
erJa
isalm
erJa
isalm
erJa
isalm
erRa
jasth
anJa
lor
Jalo
rJa
lor
Jalo
rJa
lor
Jalo
rJa
lor
Jalo
rJa
lor
Rajas
than
Jhala
war
Jhala
war
Jhala
war
Jhala
war
Jhala
war
Jhala
war
Jhala
war
Jhala
war
Jhala
war
Rajas
than
Nag
aur
Nag
aur
Nag
aur
Nag
aur
Nag
aur
Nag
aur
Nag
aur
Nag
aur
Rajas
than
Pali
Pali
Pali
Pali
Pali
Pali
Pali
Pali
Pali
Rajas
than
Siro
hiSi
rohi
Siro
hiSi
rohi
Siro
hiSi
rohi
Siro
hiSi
rohi
Siro
hiRa
jasth
anTo
nkTo
nkTo
nkTo
nkTo
nkTo
nkTo
nkTo
nkTo
nkUP
Bahr
aich
Bahr
aich
Bahr
aich
Bahr
aich
Bahr
aich
Bahr
aich
Bahr
aich
Bahr
aich
Bahr
aich
UPBa
nda
Band
aBa
nda
Band
aBa
nda
Band
aBa
nda
Band
aBa
nda
UPBa
stiBa
stiBa
stiBa
stiBa
stiBa
stiBa
stiBa
stiBa
stiUP
Buda
unBu
daun
Buda
unBu
daun
Buda
unBu
daun
Buda
unBu
daun
Buda
unUP
Gon
daG
onda
Gon
daG
onda
Gon
daG
onda
Gon
daG
onda
Gon
daUP
Har
doi
Har
doi
Har
doi
Har
doi
Har
doi
Har
doi
Har
doi
Har
doi
Har
doi
Cont
d. N
ext P
age..
...
Cont
d. Pr
eviou
s Pa
ge....
.

356Aasha Kapur Mehta
UPLa
litpu
rLa
litpu
rLa
litpu
rLa
litpu
rLa
litpu
rLa
litpu
rLa
litpu
rLa
litpu
rUP
Shah
jahan
-Sh
ahjah
an-
Shah
jahan
-Sh
ahjah
an-
Shah
jahan
-pu
rpu
rpu
rpu
rpu
rUP
Sidd
rath
-Si
ddra
th-
Sidd
rath
-Si
ddra
th-
Sidd
rath
-na
gar
naga
rna
gar
naga
rna
gar
UPSi
tapu
rSi
tapu
rSi
tapu
rSi
tapu
rSi
tapu
rSi
tapu
rN
ote:
Indi
ces 1
, 4 an
d 7
are b
ased
on
3 va
riabl
es (a
n av
erag
e of f
emale
liter
acy a
nd sc
hool
ing,
infa
nt m
orta
lity a
nd ag
ricul
tura
l pro
duct
ivity
).In
dice
s 2, 5
and
8 a
re b
ased
on
4 va
riabl
es (a
n av
erag
e of
fem
ale li
tera
cy a
nd sc
hool
ing,
infa
nt m
orta
lity,
agric
ultu
ral p
rodu
ctiv
ity a
ndin
frastr
uctu
re).
Indi
ces 3
, 6 an
d 9 a
re b
ased
on
4 var
iables
(an
aver
age o
f lite
racy
and
scho
olin
g, in
fant
mor
talit
y, ag
ricul
tura
l pro
duct
ivity
and
infra
struc
ture
).
Cont
d. Pr
eviou
s Pa
ge....
.

357 Chronic Poverty in India
Multidimensional indicators were estimated for 379 districts in 15large states of India on the basis of variables that can be consideredto reflect persistent deprivation. These include variables such asilliteracy, infant mortality, low levels of agricultural productivity andpoor infrastructure. The seven most deprived districts computed onthe basis of the 9 sets of multidimensional indices reflecting deprivationare Bahraich and Budaun in UP, Barmer in Rajasthan, Damoh andShahdol in MP, Kishanganj in Bihar and Kalahandi in Orissa. WhileKalahandi in Southern Orissa is located in one of the most incomepoor regions in the country, Bahraich and Budaun in Eastern andWestern UP are not in the poorest regions of India. Therefore, thedistricts identified as poorest on income criteria are not always thesame as regions identified as poorest in multidimensional terms. Thiscould be both due to averaging out between better and worseperforming districts constituting a region as also the inclusion ofvariables reflecting non-income measures of development throughincorporating capabilities such as being healthy or literate.
The 52 to 60 most deprived districts out of 379 districts in 15large states of India are distributed as follows: 21 to 26 districts inMadhya Pradesh, 11 to 12 districts in Rajasthan, 6 to 10 districts inUP, between 5 to 8 districts in Bihar, 4 districts in Orissa, and 1 districtin Assam.
Identification of districts that reflect chronic deprivation inmultidimensional parameters is the first step in determining strategiesto correct such imbalances. While it is true that some districts getaveraged out in the regional and state level analysis, the fact that districtsin MP, Bihar, Orissa and UP are among the most deprived is no surprise.The policy related implications of estimates of female literacy at 7.7per cent for Barmer and infant mortality at 166 in Damoh (even thedata pertain to the early 1990s) need serious attention.
ReferencesAgarwal, Bina 1997. Gender, Environment, and Poverty Interlinks: Regional Variations andTemporal Shifts in Rural India, 1971-91. World Development, Vol. 25, No.1, 23-52.Bhalla, G. S. and Singh, Gurmail 2001. Indian Agriculture: Four Decades of Development. NewDelhi: Sage.Census of India 1991. State District Profile. Registrar General of India.

358Aasha Kapur Mehta
CMIE (Centre For Monitoring Indian Economy) 2000. Profiles Of Districts. CMIE PrivateLimited, Economic Intelligence Service. Mumbai, October.Datt, Gaurav and Ravallion, Martin 1996. India’s checkered History in Fight Against Poverty:Are There Lessons for the Future? Economic and Political Weekly, Special Number.Ghosh, P. K., Kundu, Amitabh and Shariff, Abusaleh 2002. Indexing Human Development inIndia: Indicators, Scaling and Composition. National Council of Applied Economic Research,Working Paper Series No. 83.Government of India 1997. Report of the Committee To Identify 100 Most Backward and PoorestDistrict in the Country. Ministry of Rural Areas and Employment.Haq, Mahbub ul 1996. Human Development Paradigm for South Asia. Mainstream.Haan, Arjan de and Lipton, Michael 1998. Poverty in Emerging Asia: Progress,Setbacks and Log-jams. Asian Development Review, Vol.16, No.2.Krishnan, T. N. 2000. The Route To Social Development In Kerala: Social Intermediation AndPublic Action. In Development With A Human Face: Experiences In Social Achievement And EconomicGrowth, edited by S. Mehrotra and R. Jolly, Oxford, England: Oxford University Press.Kurian, N. J. 2000. Widening Regional Disparities in India: Some Indicators. Economic andPolitical Weekly.Mahanty, Ghanshyam 2000. Human Development in Andhra Pradesh: A District Level Analysis.The Indian Journal of Labour Economics, Vol. 43, No. 2.Mehta, Aasha Kapur and Shah, Amita 2001. Chronic Poverty in India: Overview Study. CPRCWorking Paper No. 7, University of Manchester.Mehta, Kapur Aasha 1996. Recasting Indices for Developing Countries: A Gender EmpowermentMeasure. Economic and Political Weekly, Vol. 31, No. 43.Mehta, Aasha Kapur and Shah, Amita 2003. Chronic Poverty in India: Incidence, Causes andPolicies. World Development, Vol. 31, No. 3.Panigrahi, Ramakrushna and Sivaramakrishna, Sashi 2002. An Adjusted Human DevelopmentIndex: Robust Country Rankings with respect to choice of fixed maximum and minimumindicator values. Journal of Human Development, Vol. 3, No. 2.Ravallion, M. 1996. Issues In Measuring And Modeling Poverty. The Economic Journal, 106,1328-1343.Rajakutty, S., Acharya, S. and Haque, T. 1999. India’s Rural Development Report 1999:Regional Disparities In Development And Poverty. National Institute Of Rural Development(NIRD), Hyderabad.Rani, Geetha P. 1999. Human Development Index in India: A District Profile, Vol. 41, No.1, 9-30.Rao, H. and Babu, M. Devendra 1996. Intra-Regional Disparities In Hyderabad-KarnatakaRegion: An Analysis. In Regional Development: Problems And Policy Measures, A. Aziz and S.Krishna, New Delhi: Concept Publishing Company.Sivaramakrishna, Sashi and Panigrahi, Ramakrushna. Articulating Uneven RegionalDevelopment for Micro and Macro Planning. Journal of Human Development (forthcoming).Shivkumar, A. K. 1994. Human Development Index For Indian States. Economic And PoliticalWeekly, Vol. 36.UNDP (United Nations Development Programme) 1999. Human Development Report 1999.New York: Oxford University Press.

359 Chronic Poverty in India
Vani, B. P. and Vyasulu, Vinod 1997. Development and Deprivation in Karnataka: A District-Level Study. Economic and Political Weekly.
Endnotes1 1. In the case of the UNDP three indicator (life expectancy at birth, education and income)
based calculations:i) let
l = Lb – Lk, where Lb is the maximum actual LEB index value, say, of country b, and Lk
is the minimum actual LEB index value, say, of country ke = Em – En, where Em is the maximum actual EDN index value, say, of country m, andEn is the minimum actual EDN index value, say, of country ng= Gp – Gq where Gp is the maximum actual GDP index value, say, of country p, and Gq
is the minimum actual GDP index value, say, of country q.ii) Take the minimum of (1,e and g). Let us suppose that 1 <e and 1<g (i.e. 1 is the minimum
or least value among 1,e and g).iii) Then let e* = 1/e and g* = 1/g.iv) Adjust Lj, Ej and Gj as follows.
Since 1 is minimum, let: aLj = Lj for all j
aEj = e*Ej for all jaGj = g*Gj for all j
v) aHDIj = (aLj + aEj + aGj)/3vi) Choose maxj (aHDIj) and HDIj)
vii) Let v= (HDIj)/maxj(aHDIj)viii) Let AHDIj = v(aHDIj)ix) Rank countries according to AHDI with higher values getting a better rank.