9 M-Mode Echocardiography -...
10
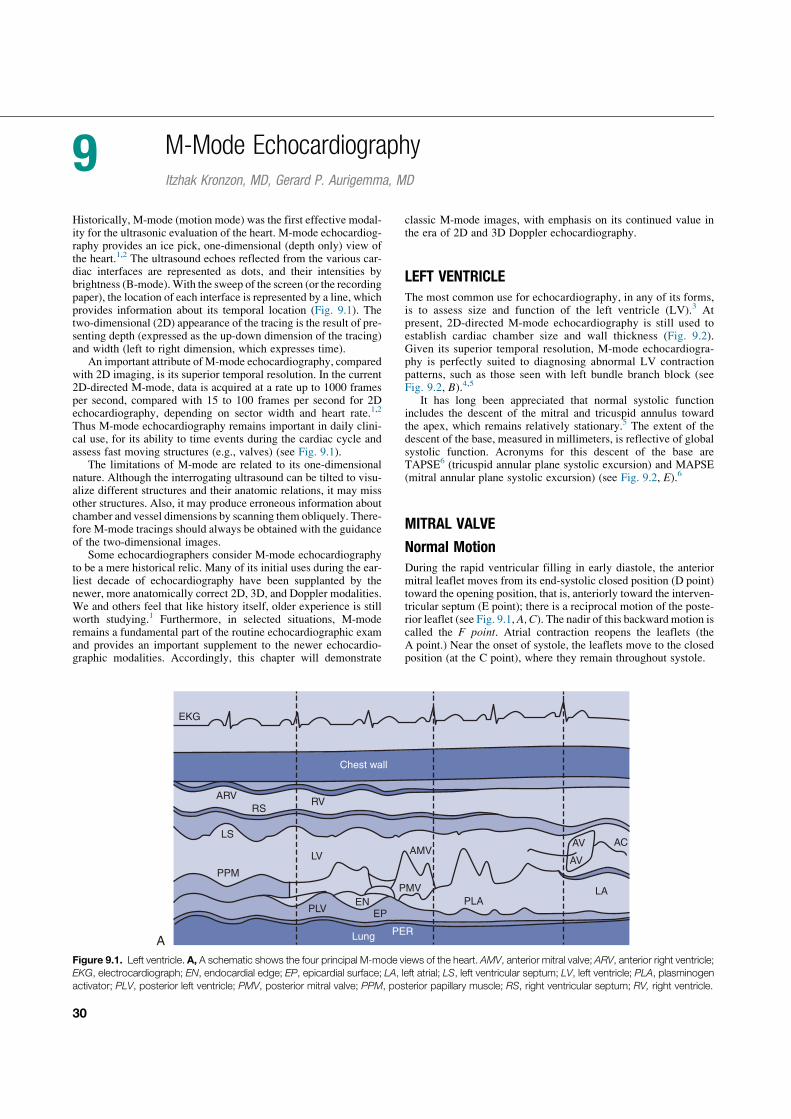
9 M-Mode Echocardiography Itzhak Kronzon, MD, Gerard P. Aurigemma, MD Historically, M-mode (motion mode) was the first effective modal- ity for the ultrasonic evaluation of the heart. M-mode echocardiog- raphy provides an ice pick, one-dimensional (depth only) view of the heart. 1,2 The ultrasound echoes reflected from the various car- diac interfaces are represented as dots, and their intensities by brightness (B-mode). With the sweep of the screen (or the recording paper), the location of each interface is represented by a line, which provides information about its temporal location (Fig. 9.1). The two-dimensional (2D) appearance of the tracing is the result of pre- senting depth (expressed as the up-down dimension of the tracing) and width (left to right dimension, which expresses time). An important attribute of M-mode echocardiography, compared with 2D imaging, is its superior temporal resolution. In the current 2D-directed M-mode, data is acquired at a rate up to 1000 frames per second, compared with 15 to 100 frames per second for 2D echocardiography, depending on sector width and heart rate. 1,2 Thus M-mode echocardiography remains important in daily clini- cal use, for its ability to time events during the cardiac cycle and assess fast moving structures (e.g., valves) (see Fig. 9.1). The limitations of M-mode are related to its one-dimensional nature. Although the interrogating ultrasound can be tilted to visu- alize different structures and their anatomic relations, it may miss other structures. Also, it may produce erroneous information about chamber and vessel dimensions by scanning them obliquely. There- fore M-mode tracings should always be obtained with the guidance of the two-dimensional images. Some echocardiographers consider M-mode echocardiography to be a mere historical relic. Many of its initial uses during the ear- liest decade of echocardiography have been supplanted by the newer, more anatomically correct 2D, 3D, and Doppler modalities. We and others feel that like history itself, older experience is still worth studying. 1 Furthermore, in selected situations, M-mode remains a fundamental part of the routine echocardiographic exam and provides an important supplement to the newer echocardio- graphic modalities. Accordingly, this chapter will demonstrate classic M-mode images, with emphasis on its continued value in the era of 2D and 3D Doppler echocardiography. LEFT VENTRICLE The most common use for echocardiography, in any of its forms, is to assess size and function of the left ventricle (LV). 3 At present, 2D-directed M-mode echocardiography is still used to establish cardiac chamber size and wall thickness (Fig. 9.2). Given its superior temporal resolution, M-mode echocardiogra- phy is perfectly suited to diagnosing abnormal LV contraction patterns, such as those seen with left bundle branch block (see Fig. 9.2, B). 4,5 It has long been appreciated that normal systolic function includes the descent of the mitral and tricuspid annulus toward the apex, which remains relatively stationary. 5 The extent of the descent of the base, measured in millimeters, is reflective of global systolic function. Acronyms for this descent of the base are TAPSE 6 (tricuspid annular plane systolic excursion) and MAPSE (mitral annular plane systolic excursion) (see Fig. 9.2, E). 6 MITRAL VALVE Normal Motion During the rapid ventricular filling in early diastole, the anterior mitral leaflet moves from its end-systolic closed position (D point) toward the opening position, that is, anteriorly toward the interven- tricular septum (E point); there is a reciprocal motion of the poste- rior leaflet (see Fig. 9.1, A, C). The nadir of this backward motion is called the F point. Atrial contraction reopens the leaflets (the A point.) Near the onset of systole, the leaflets move to the closed position (at the C point), where they remain throughout systole. EKG ARV RS LS PPM AMV PMV PLA PLV EP EN LA AV AV AC RV LV Chest wall PER Lung A Figure 9.1. Left ventricle. A, A schematic shows the four principal M-mode views of the heart. AMV, anterior mitral valve; ARV, anterior right ventricle; EKG, electrocardiograph; EN, endocardial edge; EP, epicardial surface; LA, left atrial; LS, left ventricular septum; LV, left ventricle; PLA, plasminogen activator; PLV, posterior left ventricle; PMV, posterior mitral valve; PPM, posterior papillary muscle; RS, right ventricular septum; RV, right ventricle. 30
Transcript of 9 M-Mode Echocardiography -...
9 M-Mode Echocardiography
Itzhak Kronzon, MD, Gerard P. Aurigemma, MD
Historically, M-mode (motion mode) was the first effective modal-ity for the ultrasonic evaluation of the heart. M-mode echocardiog-raphy provides an ice pick, one-dimensional (depth only) view ofthe heart.1,2 The ultrasound echoes reflected from the various car-diac interfaces are represented as dots, and their intensities bybrightness (B-mode).With the sweep of the screen (or the recordingpaper), the location of each interface is represented by a line, whichprovides information about its temporal location (Fig. 9.1). Thetwo-dimensional (2D) appearance of the tracing is the result of pre-senting depth (expressed as the up-down dimension of the tracing)and width (left to right dimension, which expresses time).
An important attribute of M-mode echocardiography, comparedwith 2D imaging, is its superior temporal resolution. In the current2D-directed M-mode, data is acquired at a rate up to 1000 framesper second, compared with 15 to 100 frames per second for 2Dechocardiography, depending on sector width and heart rate.1,2
Thus M-mode echocardiography remains important in daily clini-cal use, for its ability to time events during the cardiac cycle andassess fast moving structures (e.g., valves) (see Fig. 9.1).
The limitations of M-mode are related to its one-dimensionalnature. Although the interrogating ultrasound can be tilted to visu-alize different structures and their anatomic relations, it may missother structures. Also, it may produce erroneous information aboutchamber and vessel dimensions by scanning them obliquely. There-fore M-mode tracings should always be obtained with the guidanceof the two-dimensional images.
Some echocardiographers consider M-mode echocardiographyto be a mere historical relic. Many of its initial uses during the ear-liest decade of echocardiography have been supplanted by thenewer, more anatomically correct 2D, 3D, and Doppler modalities.We and others feel that like history itself, older experience is stillworth studying.1 Furthermore, in selected situations, M-moderemains a fundamental part of the routine echocardiographic examand provides an important supplement to the newer echocardio-graphic modalities. Accordingly, this chapter will demonstrate
classic M-mode images, with emphasis on its continued value inthe era of 2D and 3D Doppler echocardiography.
LEFT VENTRICLE
The most common use for echocardiography, in any of its forms,is to assess size and function of the left ventricle (LV).3 Atpresent, 2D-directed M-mode echocardiography is still used toestablish cardiac chamber size and wall thickness (Fig. 9.2).Given its superior temporal resolution, M-mode echocardiogra-phy is perfectly suited to diagnosing abnormal LV contractionpatterns, such as those seen with left bundle branch block (seeFig. 9.2, B).4,5
It has long been appreciated that normal systolic functionincludes the descent of the mitral and tricuspid annulus towardthe apex, which remains relatively stationary.5 The extent of thedescent of the base, measured in millimeters, is reflective of globalsystolic function. Acronyms for this descent of the base areTAPSE6 (tricuspid annular plane systolic excursion) and MAPSE(mitral annular plane systolic excursion) (see Fig. 9.2, E).6
MITRAL VALVE
Normal Motion
During the rapid ventricular filling in early diastole, the anteriormitral leaflet moves from its end-systolic closed position (D point)toward the opening position, that is, anteriorly toward the interven-tricular septum (E point); there is a reciprocal motion of the poste-rior leaflet (see Fig. 9.1, A, C). The nadir of this backward motion iscalled the F point. Atrial contraction reopens the leaflets (theA point.) Near the onset of systole, the leaflets move to the closedposition (at the C point), where they remain throughout systole.
EKG
ARV
RS
LS
PPM
AMV
PMV
PLAPLV
EPEN
LA
AV
AV
AC
RV
LV
Chest wall
PERLungA
Figure 9.1. Left ventricle. A, A schematic shows the four principal M-mode views of the heart. AMV, anterior mitral valve; ARV, anterior right ventricle;
EKG, electrocardiograph; EN, endocardial edge; EP, epicardial surface; LA, left atrial; LS, left ventricular septum; LV, left ventricle; PLA, plasminogen
activator; PLV, posterior left ventricle; PMV, posterior mitral valve; PPM, posterior papillary muscle; RS, right ventricular septum; RV, right ventricle.
30
RV
A
C
E
F
MV
D
B C
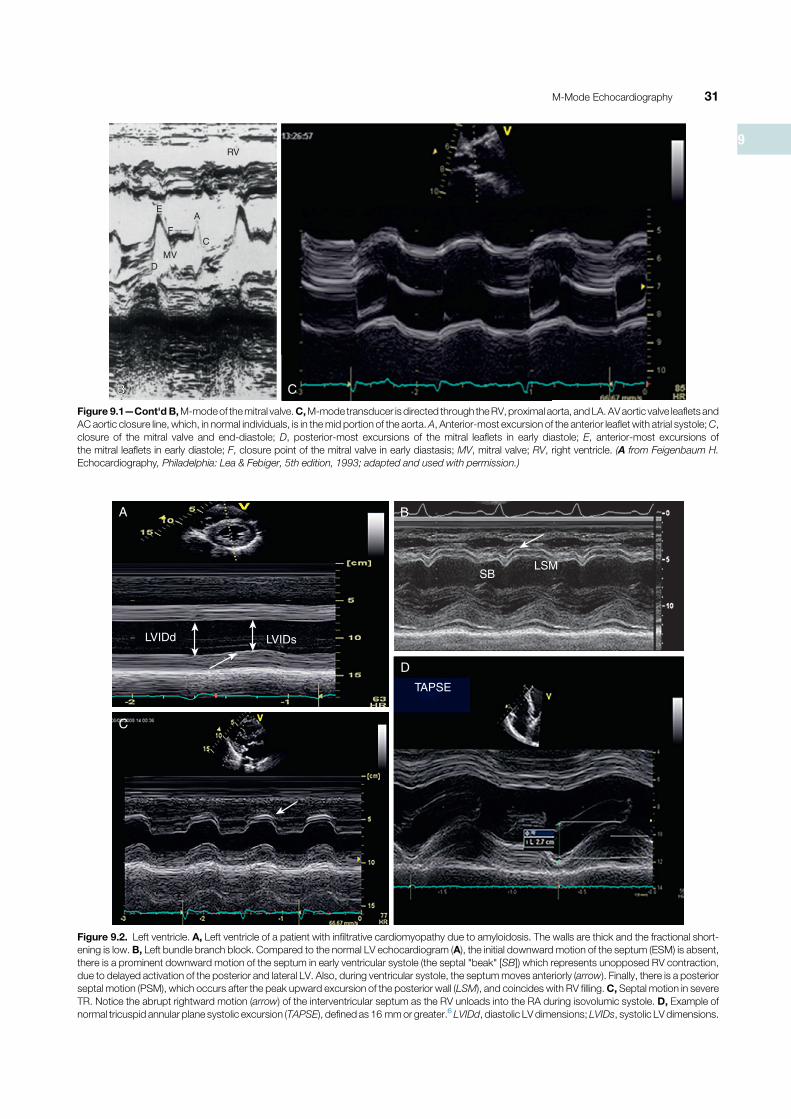
Figure 9.1—Cont'd B,M-modeof themitral valve.C,M-mode transducer is directed through theRV,proximal aorta, andLA.AVaortic valve leaflets and
AC aortic closure line, which, in normal individuals, is in themid portion of the aorta.A, Anterior-most excursion of the anterior leaflet with atrial systole;C,
closure of the mitral valve and end-diastole; D, posterior-most excursions of the mitral leaflets in early diastole; E, anterior-most excursions of
the mitral leaflets in early diastole; F, closure point of the mitral valve in early diastasis; MV, mitral valve; RV, right ventricle. (A from Feigenbaum H.
Echocardiography, Philadelphia: Lea & Febiger, 5th edition, 1993; adapted and used with permission.)
TAPSE
LVIDd
A B
C
D
LVIDs
SBLSM
Figure 9.2. Left ventricle. A, Left ventricle of a patient with infiltrative cardiomyopathy due to amyloidosis. The walls are thick and the fractional short-
ening is low.B, Left bundle branch block. Compared to the normal LV echocardiogram (A), the initial downward motion of the septum (ESM) is absent,
there is a prominent downward motion of the septum in early ventricular systole (the septal "beak" [SB]) which represents unopposed RV contraction,
due to delayed activation of the posterior and lateral LV. Also, during ventricular systole, the septummoves anteriorly (arrow). Finally, there is a posterior
septal motion (PSM), which occurs after the peak upward excursion of the posterior wall (LSM), and coincides with RV filling.C, Septal motion in severe
TR. Notice the abrupt rightward motion (arrow) of the interventricular septum as the RV unloads into the RA during isovolumic systole. D, Example of
normal tricuspid annular plane systolic excursion (TAPSE), defined as 16 mmor greater.6 LVIDd, diastolic LV dimensions; LVIDs, systolic LV dimensions.
9
31M-Mode Echocardiography

Mitral Stenosis
The mitral leaflets open at early diastole. The leaflets are thickenedwith commissural fusion. The larger anterior leaflet moves anteri-orly, which also pulls the smaller posterior leaflet anteriorly.Because of the pressure gradient across the valve throughout dias-tole and the lack of rapid ventricular filling phase, the leaflets donot return toward the closure position as in normal valves.1,2 TheEF slope (see Fig. 9.1, B) is flatter than normal. The M-mode
combination of leaflet thickening, anterior motion of the posteriormitral leaflet, and flat EF slope is diagnostic of mitral stenosis(Fig. 9.3, A).
Mitral Valve Prolapse
Unlike mitral stenosis, the valve diastolic motion is normal, andleaflets remain closed in systole. In mitral valve prolapse the closedmitral leaflets sag backward. This motion may occur in mid to late
RV
LV
S
MV
PW
A
RV
MV
B
C
AVO
MVC
Ao
LA
LV
D
Figure 9.3. A, Rheumatic mitral stenosis. Note the mitral valve echoes of the anterior and posterior leaflet are thickened andmove in concert, because
of inflammatory valvulitis. The EF slope is diminished.B,Severemitral valve prolapse: arrows indicate late systolic sagging or “hammocking” of themitral
valve. C, Anterior motion of the mitral valve in a patient with hypertrophic obstructive cardiomyopathy (arrow). D, Hemodynamic tracing illustrating the
principle behind the early opening of the aortic valve in a patient with acute severe aortic regurgitation. Notice that there is pressure equilibration
between the aorta and LV, which occurs at end diastole. See text for details. Ao, Aorta; AVO, atrial valve opening; LA, left atrium; LV, left ventricle;
MV, mitral valve; MVC, mitral valve closing; PW, posterior wall; RV, right ventricle; S, septum.
32 SECTION II Transthoracic Echocardiography

E
LV
MV
RV
F
G
Figure 9.3—Cont'd E, Early closure of the mitral valve in a patient with acute severe aortic regurgitation. Note that the mitral valve (arrow) closes well
before the QRS complex, indicative of pressure equilibration between the LV and left atrium in this patient. F, Fine fluttering of the mitral valve at end
diastole in a patient with aortic regurgitation. G, E point septal separation (arrow) in a patient with idiopathic dilated cardiomyopathy. LV, Left ventricle;
MV, mitral valve; RV, right ventricle.
(Continued)
33M-Mode Echocardiography
9

LA LA
LV LV
E E
D D
AA
C C
H
I
J
Figure 9.3—Cont'd H, Schematic diagram (left panel) and M-mode recording in a patient with elevated left ventricular diastolic pressure, showing the
so-called B-bump (black arrow, right panel of schematic; blue arrow in patient M-mode). I, Color M-mode in a patient with complete heart block. Left
arrow points to superimposed mitral regurgitation jet, which occurs in isovolumic systole. Right arrow points to diastolic mitral regurgitation seen in the
left atrium, following nonconducted atrial depolarization. J, Use of M-mode echocardiography to estimate size of a proximal isovelocity systolic area
(PISA). This adaptation of color M-mode allows for easy recognition of the extent of the PISA. A, Anterior-most excursion of the anterior leaflet with atrial
systole;C, closure of themitral valve and end-diastole;D, posterior-most excursions of themitral leaflets in early diastole; E, anterior-most excursions of
the mitral leaflets in early diastole; LA, left atrial pressure; LV, left ventricular pressure. (Schematic adapted and used with permission from Feigenbaum
H. Echocardiography. ed 5. Philadelphia: Lea & Febiger, 1993.)
34 SECTION II Transthoracic Echocardiography
systole (see Fig. 9.3, B), and may be associated with mid-systolicclick or pansystolic (and be associated with a pansystolic mitralregurgitation murmur).7–9
Systolic Anterior Motion of the AnteriorMitral Leaflet
An anterior mitral leaflet that demonstrates systolic anterior motion(SAM) is seen mainly in patients with hypertrophic cardiomyopa-thy; high velocity in the left ventricular outflow tract results in sys-tolic anterior motion of the anterior mitral leaflet,10,11 due to theVenturi effect. In these patients, the diastolic mitral valve motionis normal. During systole, however, the anterior leaflet movestoward the interventricular septum, and may coapt with the ventric-ular surface. The duration and degree of coaptation are related tothe pressure gradient (see Fig. 9.3, C).10,11
The Mitral Valve in Aortic Insufficiency
In acute aortic regurgitation the diastolic pressure in the ventriclerises rapidly during diastole as a result of aortic runoff. In fact,in some instances the left ventricular pressure may rise above theLA pressure, leading to premature closure of the mitral valve(see Fig. 9.3, D, E).12,13 When the aortic regurgitation jet strikesthe anterior mitral leaflet, a fine, fluttering. motion can be seen.This finding suggests the presence of aortic insufficiency, but isnot a marker of its severity (see Fig. 9.3, F). None of these findingsin aortic regurgitation are reliably demonstrated by 2D echocardi-ography because of its inferior temporal resolution. Therefore M-mode data complements the assessment of valve regurgitationseverity in contemporary practice.
The Mitral Valve in Left Ventricular Dysfunction
Normally the mitral E point is close to the interventricular septum(E point septal separation). In patients with left ventricular dilatationand reduced stroke volume, the E point of the anterior leaflet isseparated from the septum by a distance of at least 8 mm. Interest-ingly, this expression of unfavorable LV remodeling was the first
echocardiographic finding that appeared directly related to progno-sis (see Fig. 9.3,G).14–16A secondM-mode sign of LV dysfunctionis a disturbance in the A-C line, which is usually rapid andstraight. In patients with noncompliant LVs, atrial systole resultsin a significant elevation in LV diastolic pressures. The M-modereflection of this phenomenon is an interruption in the normalA-C closure line, which is known as the A-C shoulder or B bump(see Fig. 9.3, H).17,18
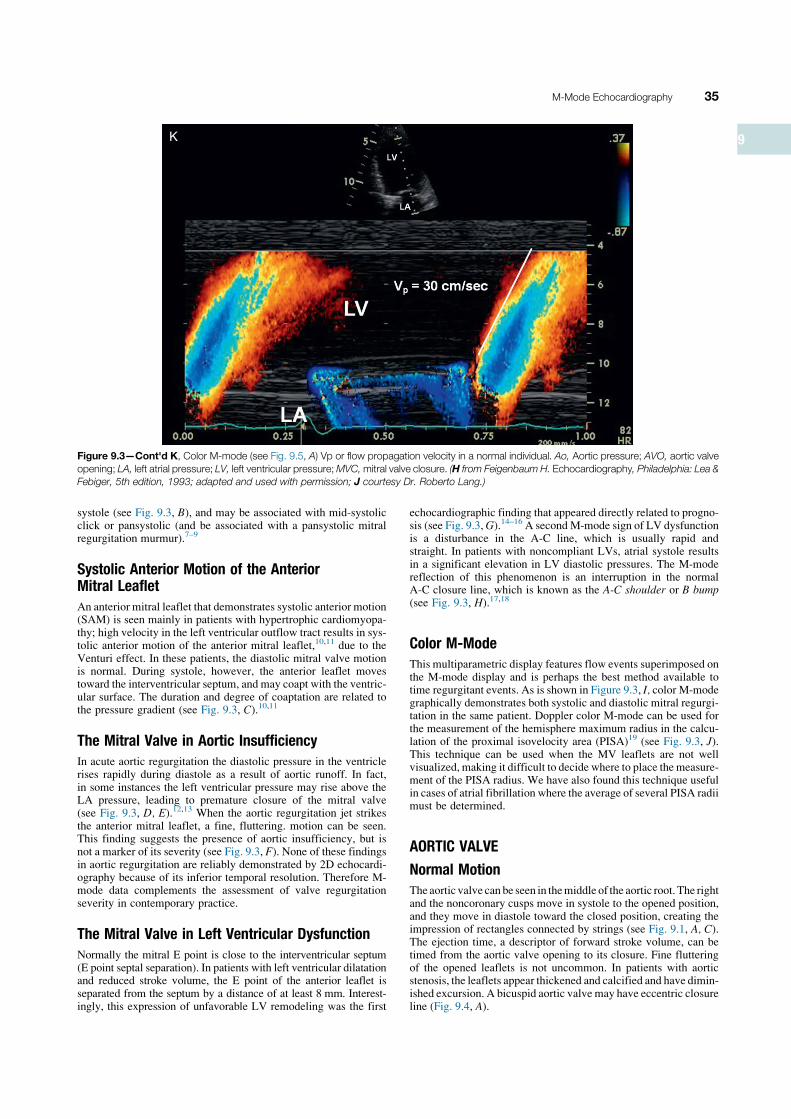
Color M-Mode
This multiparametric display features flow events superimposed onthe M-mode display and is perhaps the best method available totime regurgitant events. As is shown in Figure 9.3, I, color M-modegraphically demonstrates both systolic and diastolic mitral regurgi-tation in the same patient. Doppler color M-mode can be used forthe measurement of the hemisphere maximum radius in the calcu-lation of the proximal isovelocity area (PISA)19 (see Fig. 9.3, J).This technique can be used when the MV leaflets are not wellvisualized, making it difficult to decide where to place the measure-ment of the PISA radius. We have also found this technique usefulin cases of atrial fibrillation where the average of several PISA radiimust be determined.
AORTIC VALVE
Normal Motion
The aortic valve can be seen in themiddle of the aortic root. The rightand the noncoronary cusps move in systole to the opened position,and they move in diastole toward the closed position, creating theimpression of rectangles connected by strings (see Fig. 9.1, A, C).The ejection time, a descriptor of forward stroke volume, can betimed from the aortic valve opening to its closure. Fine flutteringof the opened leaflets is not uncommon. In patients with aorticstenosis, the leaflets appear thickened and calcified and have dimin-ished excursion. A bicuspid aortic valve may have eccentric closureline (Fig. 9.4, A).
K
Figure 9.3—Cont'd K, Color M-mode (see Fig. 9.5, A) Vp or flow propagation velocity in a normal individual. Ao, Aortic pressure; AVO, aortic valve
opening; LA, left atrial pressure; LV, left ventricular pressure;MVC,mitral valve closure. (H from Feigenbaum H. Echocardiography, Philadelphia: Lea &
Febiger, 5th edition, 1993; adapted and used with permission; J courtesy Dr. Roberto Lang.)
35M-Mode Echocardiography
9

The Aortic Valve in Hypertrophic ObstructiveCardiomyopathy
In hypertrophic obstructive cardiomyopathy the systolic anteriormotion may result in left ventricular outflow obstruction, andtherefore flow across the aortic valve will be decreased inmidsystole. The M-mode will show a midsystolic closure of theaortic valve (see Fig. 9.4, B). In discrete subaortic stenosis to a sub-aortic membrane, by contrast, the valve opens well in early systole,and then suddenly returns to near closure position, where it stays forthe rest of systole (see Fig. 9.4, C).
Premature Aortic Valve Opening
With severe aortic regurgitation, there is a rapid rise of left ventric-ular diastolic pressure and a rapid decline in the aortic diastolicpressure. With left atrial contraction, the left atrial (and left ventric-ular) diastolic pressure may rise above the aortic diastolic pressure,resulting in premature (end-diastolic) aortic valve opening (seeFig. 9.4, D).
PULMONIC VALVE
Normal Motion
In most cases where motion is normal, only the anterior leaflet ofthe pulmonic valve can be depicted on M-mode. This leafletmoves posteriorly and remains opened during systole. At enddiastole, with right atrial contraction, the right ventricular pres-sure approaches the pulmonary arterial end-diastolic pressure,resulting in posterior motion of the pulmonic valve (A-wave)(Fig. 9.5, A).2,20,21
Severe Pulmonary Hypertension
In severe pulmonary hypertension, the pulmonary artery diastolicpressure is much higher than the right ventricular diastolic pressure.In this hypertension situation, the right atrial contraction will haveno effect on the pulmonic valve end-diastolic position. No A-waveis seen, in spite of normal sinus rhythm (see Fig. 9.5, B). Anotherfinding seen in pulmonary hypertension is the “flying W” sign seenduring pulmonic valve systolic opening. This unusual motion, with
Ao
LA
A
B
C
D
Figure 9.4. Aortic valve.A,M-mode echocardiogram in a patient with a bicuspid aortic valve. Arrow indicates eccentric closure line.B, In hypertrophic
cardiomyopathy (HCM), there ismidsystolic closure (arrows) indicating left ventricular outflow tract obstructionwith diminution in forward flow. As the LV
pressure rises and then overcomes the dynamic obstruction, the aortic valve opens a second time. Opening of the aortic valve is associated with
reduced forward stroke volume. C, In subaortic membrane. The aortic valve envelope shows a rapid upward swing followed by restoration to a mid-
aortic position without secondary opening (white arrow). This is in contrast to the M-shaped envelope in patients with hypertrophic obstructive car-
diomyopathy. D, Early aortic valve opening (black arrow) in a patient with acute severe aortic regurgitation. In the first and third beats following a longer
cycle, there is more opportunity for pressure equilibration between the LV and the aorta because the filling of the left ventricle is augmented. This leads to
premature opening of the aortic valve. Ao, Aorta; LA, left atrium. (Image courtesy Dr. Theo E. Meyer.)
36 SECTION II Transthoracic Echocardiography
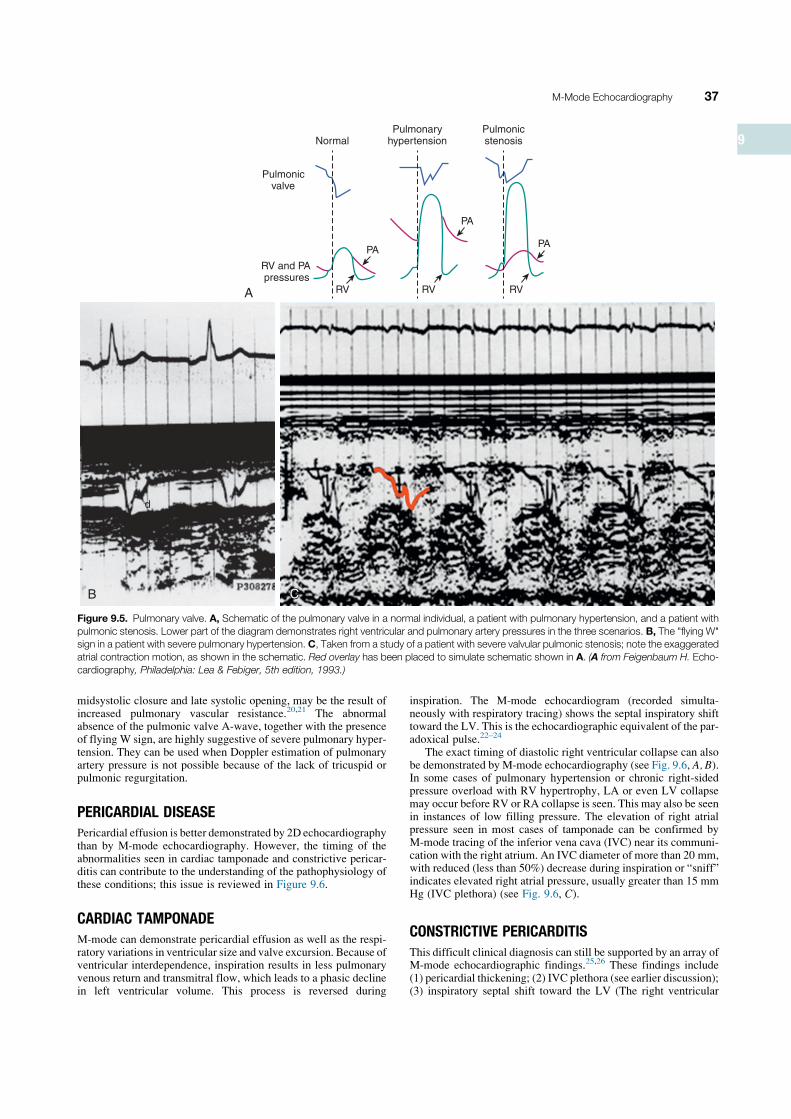
midsystolic closure and late systolic opening, may be the result ofincreased pulmonary vascular resistance.20,21 The abnormalabsence of the pulmonic valve A-wave, together with the presenceof flying W sign, are highly suggestive of severe pulmonary hyper-tension. They can be used when Doppler estimation of pulmonaryartery pressure is not possible because of the lack of tricuspid orpulmonic regurgitation.
PERICARDIAL DISEASE
Pericardial effusion is better demonstrated by 2D echocardiographythan by M-mode echocardiography. However, the timing of theabnormalities seen in cardiac tamponade and constrictive pericar-ditis can contribute to the understanding of the pathophysiology ofthese conditions; this issue is reviewed in Figure 9.6.
CARDIAC TAMPONADE
M-mode can demonstrate pericardial effusion as well as the respi-ratory variations in ventricular size and valve excursion. Because ofventricular interdependence, inspiration results in less pulmonaryvenous return and transmitral flow, which leads to a phasic declinein left ventricular volume. This process is reversed during
inspiration. The M-mode echocardiogram (recorded simulta-neously with respiratory tracing) shows the septal inspiratory shifttoward the LV. This is the echocardiographic equivalent of the par-adoxical pulse.22–24
The exact timing of diastolic right ventricular collapse can alsobe demonstrated by M-mode echocardiography (see Fig. 9.6, A, B).In some cases of pulmonary hypertension or chronic right-sidedpressure overload with RV hypertrophy, LA or even LV collapsemay occur before RV or RA collapse is seen. This may also be seenin instances of low filling pressure. The elevation of right atrialpressure seen in most cases of tamponade can be confirmed byM-mode tracing of the inferior vena cava (IVC) near its communi-cation with the right atrium. An IVC diameter of more than 20 mm,with reduced (less than 50%) decrease during inspiration or “sniff”indicates elevated right atrial pressure, usually greater than 15 mmHg (IVC plethora) (see Fig. 9.6, C).
CONSTRICTIVE PERICARDITIS
This difficult clinical diagnosis can still be supported by an array ofM-mode echocardiographic findings.25,26 These findings include(1) pericardial thickening; (2) IVC plethora (see earlier discussion);(3) inspiratory septal shift toward the LV (The right ventricular
A
Pulmonicvalve
RV and PApressures
Normal
RV
PA
Pulmonaryhypertension
RV
PA
Pulmonicstenosis
RV
PA
B
d
C
Figure 9.5. Pulmonary valve. A, Schematic of the pulmonary valve in a normal individual, a patient with pulmonary hypertension, and a patient with
pulmonic stenosis. Lower part of the diagram demonstrates right ventricular and pulmonary artery pressures in the three scenarios. B, The "flying W"
sign in a patient with severe pulmonary hypertension. C, Taken from a study of a patient with severe valvular pulmonic stenosis; note the exaggerated
atrial contraction motion, as shown in the schematic. Red overlay has been placed to simulate schematic shown in A. (A from Feigenbaum H. Echo-
cardiography, Philadelphia: Lea & Febiger, 5th edition, 1993.)
37M-Mode Echocardiography
9

cavity dimension increases during inspiration and decreases duringexpiration, and there are reciprocal changes in the LV. Duringexpiration, the mitral valve opening duration is longer than that dur-ing inspiration) (see Fig. 9.6, D); (4) diastolic septal “bounce”(characteristic early diastolic notch) as well as a late diastolic
reverberation in the septum, around the time of atrial contraction(see Fig. 9.6, D, E); and (5) premature opening of the pulmonicvalve due to elevation of the right ventricular end-diastolic pressurewithout pulmonary hypertension, and relatively low pulmonaryartery diastolic pressure.
RV
LV
b
b
aa
10mm
A
A B
C
D
EKG
ARV
RS
LS
DM ASM
PPM
E
Figure 9.6. Pericardial disease. A, Cardiac tamponade: Large pericardial effusion and diastolic collapse of the right ventricular free wall, indicated by
the arrow. B, Large circumferential pericardial effusion (upper pair of downward arrows) and left atrial collapse (lower pair of downward arrows), indi-
cating increased intrapericardial pressure leading to ventricular diastolic and left atrial systolic collapse. When filling pressures are low, this constellation
of findings is called low pressure cardiac tamponade. C, In patient with tamponade, the vena cava is dilated and does not collapse. D, Constrictive
pericarditis. E, Schematic of normal septal motion (left) and recording from a patient with constrictive pericarditis. Note the diastolic posterior motion of
the septum (DM), as well as the second reverberation in the septum (ASM), which corresponds to atrial systole.
38 SECTION II Transthoracic Echocardiography

REFERENCES
1. FeigenbaumH: Role ofM-mode technique in today’s echocardiography, J Am Soc
Echocardiogr 23:240–257, 2010.
2. Feigenbaum H: Echocardiography, ed 5, Malvern, Pa, 1993, Lea & Febiger.
3. Lang RM, Bierig M, Devereux RB, et al: Recommendations for chamber quanti-
fication, J Am Soc Echocardiogr 18:1440–1463, 2005.
4. Grines CL, Bashore TM, Boudoulas H, et al: Functional abnormalities in isolated
left bundle branch block. The effect of interventricular asynchrony, Circulation
79:845–853, 1989.
5. Jones CJ, Raposo L, Gibson DG: Functional importance of the long axis dynamics
of the human left ventricle, Br Heart J 634:215–220, 1990.
6. Rudski LG, Lai WW, Afilalo J, et al: Guidelines for the echocardiographic assess-
ment of the right heart in adults: a report from the American Society of Echocar-
diography, J Am Soc Echocardiogr 23:685–713, 2010, quiz 786–688.
7. Dillon JC, Haisse CL, Chang S, et al: Use of echocardiography in patients with
prolapsed mitral valve, Circulation 43:503–507, 1971.
8. Kerber RE, Isaeff DM, Hancock EW: Echocardiographic patterns in patients with
the syndrome of systolic click and late systolic murmur, N Engl J Med
284:691–693, 1971.
9. Popp RE, Brown OR, Silverman JF, et al: Echocardiographic abnormalities in the
mitral valve prolapsed syndrome, Circulation 49:428–433, 1974.
10. Henry WL, Clark CE, Griffith JM, et al: Mechanism of left ventricular outflow
obstruction in patients with obstructive asymmetric septal hypertrophy (idiopathic
hypertrophic subaortic stenosis), Am J Cardiol 35:337–345, 1975.
11. Pollick C, Rakowski H, Wigle ED: Muscular subaortic stenosis: the quantitative
relationship between systolic anterior motion and the pressure gradient, Circula-
tion 69:43–49, 1984.
12. Botvinick EH, Schiller NB, Wickramasekaran R, et al: Echocardiographic dem-
onstration of early mitral valve closure in severe aortic insufficiency. Its clinical
implications, Circulation 51:836–847, 1975.
13. Perez JE, Cordova F, Cintron G: Diastolic opening of the aortic valve (AV) in a
case of aortic insufficiency due to AV fenestration, Cardiovasc Dis 5:254–257,
1978.
14. Ahmadpour H, Shah AA, Allen JW, et al: Mitral E point septal separation: a reli-
able index of left ventricular performance in coronary artery disease, Am Heart J
106:21–28, 1983.
15. Child JS, Krivokapick J, Perloff JK: Effect of left ventricular size onmitral E point
to ventricular septal separation in assessment of cardiac performance, Am Heart J
101:797–805, 1981.
16. Massie BM, Schiller NB, Ratshin RA, et al: Mitral-septal separation: new echocar-
diographic index of left ventricular function, Am J Cardiol 39:1008–1016, 1977.
17. Konecke LL, Feigenbaum H, Chang S, et al: Abnormal mitral valve motion in
patients with elevated left ventricular diastolic pressures, Circulation
47:989–996, 1973.
18. Ambrose JA, Teichholz LE, Meller J, et al: The influence of left ventricular late
diastolic filling on the A wave of the left ventricular pressure trace, Circulation
60:510–519, 1979.
19. ZoghbiWA, Enriquez-SaranoM, Foster E, et al: Recommendations for evaluation
of the severity of native valvular regurgitation with two-dimensional and Doppler
echocardiography, J Am Soc Echocardiogr 16:777–802, 2003.
20. Weyman AE, Dillon JC, Feigenbaum H, et al: Echocardiographic patterns of
pulmonic valvemotionwith pulmonary hypertension,Circulation 50:905–910, 1974.
21. Nanda NC, Gramiak R, Robinson TI, et al: Echocardiographic evaluation of
pulmonary hypertension, Circulation 50:575–581, 1974.
22. ArmstrongWF, Schilt BF, Helper DJ, et al: Diastolic collapse of the right ventricle
with cardiac tamponade: an echocardiographic study, Circulation 65:1491–1496,
1982.
23. Feigenbaum H, Zaky A, Grabhorn LL: Cardiac motion in patients with pericardial
effusion. A study using reflected ultrasound, Circulation 34:611–619, 1966.
24. Leimgruber PP, Klopfenstein HS, Wann LS, et al: The hemodynamic derange-
ment associated with right ventricular diastolic collapse in cardiac tamponade:
an experimental echocardiographic study, Circulation 68(3):612–620, 1983.
25. Pool P, Seagren C, Abbasi A, et al: Echocardiographic manifestations of constric-
tive pericarditis: abnormal septal motion, Chest 68:684–688, 1975.
26. Candell-Rivera J, Garcia del Castillo H, Permanyer-Miralda G, et al: Echocardio-
graphic features of the interventricular septum in chronic constrictive pericarditis,
Circulation 57:1154–1158, 1978.
10 Doppler Echocardiography: Normal AntegradeFlow Patterns
Mohamed Ahmed, MD, Gerard P. Aurigemma, MD
Four modalities of Doppler echocardiography are currently avail-able for use with a wide variety of applications: pulsed wave(PW) Doppler, continuous wave (CW) Doppler, color flow imag-ing, and tissue Doppler imaging. Each modality plays an importantrole in the overall assessment of the patient with heart disease.Whereas M-mode and two-dimensional echocardiography providestructural and functional data, tissue Doppler imaging supplementsthe assessment of myocardial function, including diastolic func-tion. Doppler echocardiography is the modality on which noninva-sive assessment of cardiac hemodynamics depends. The purpose ofthis chapter is to review the normal antegrade intracardiac flowusing PW and CW.
BASIC CONCEPTS
Doppler echocardiography is based on the important concept thatbackscattering of the ultrasound from moving blood cells willappear higher or lower in frequency than the transmitted frequencydepending on the speed and direction of blood flow. Velocities arecalculated using the formula:
ΔF¼V!2Fo!cosθ
C
where ΔF represents Doppler shift (the difference between thetransmitted frequency and the backscattered frequency), V is thevelocity of the moving blood cells, F0 is the transducer frequency,
cos θ is the cosine of the angle of the incidence, and C is the velocityof propagation in the soft tissues, including the myocardium. Forcardiac applications, the velocity of propagation in the myocardiumis 1540 M/sec and cos θ is 1 (because the angle of the incidence is0 or 180 degrees). To calculate Doppler velocities, the formula canbe rearranged:
V¼ΔF!C
2Fo!cosθ
All commercially available ultrasound machines provide flowvelocities data.
Quantification of flow velocity is obtained with either PW orCW Doppler. PW Doppler records flow velocities at one specificlocation, whereas CW Doppler records flow velocity along theentire pathway of the ultrasound beam (Fig. 10.1). The former isused to quantitate flow in a given locus, but can only measurevelocity over a limited range. The latter permits the measurementof high velocity flows, but does not determine the location of thesignal because signals from the entire length of the ultrasound beamare included in the spectral CW Doppler tracing. By convention,flow toward the transducer is displayed, spectrally, above the zerobaseline and flow away, below the zero baseline. By convention inechocardiography, the y-axis is the velocity (in m/sec) and thex-axis represents time (in seconds).
PW Doppler is used to assess velocities across normal valves orvessels to calculate flow and assess cardiac function. Commonapplications include measurements of stroke volume (SV), cardiac
39Doppler Echocardiography: Normal Antegrade Flow Patterns
10