9 Lab - Modeling Elastic Rebound
17
Lab - Modeling Elastic Rebound 74 IDAHO IS YOUR HOME RATIONALE Tectonic earthquakes are caused by a sudden slippage along the boundary (fault) between two plates. In this activity, students explore a mechanical model of a fault to examine how energy is stored elastically in rocks and released suddenly as an earthquake. Students then use the model to understand why some earthquakes are small and some are large. They will make observations, collect data, and compare modeled data to global data. The earthquake machine model is a slip- predictable fault model that demonstrates the property of elastic rebound. This means that when an earthquake occurs on the fault, the stress in the system always releases all stored energy so that the system returns to a “zero” state. Thus, this model cannot be used to predict when the next event will occur, but can be used to predict the magnitude of the earthquake if it were to occur at any given time. Putting Down Roots, pp. 14 - 15 Idaho State Standards: 8th/9th Earth Science 1.2 (all), 1.3 (all), 1.6.3, 1.8.1 8th Mathematics 3.5.1, 4.3.1, 5.1.1, 5.1.2, 5.2.1, 5.4.1, 5.5.1 9th Mathematics 1.1.1, 1.2.1, 2.1.1, 2.2, 2.3.1, 2.4.1, 3.2, 3.3, 3.5, 3.6, 4.3, 4.4, 5.1.1, 5.2.1, 5.3, 5.4, 5.5 Objectives: Students will be able to: 1. Define earthquakes and model their occurrence. 2. Give examples of why models are important in science. 3. Explain energy transfer as applied to the model. 4. Use and explain the model to generate data that will be analyzed. 5. Critically analyze data generated by the Earthquake Machine. 6. Describe the global trends for earthquake occurrence and size. 7. Interpret a Gutenberg Richter plot (frequency v. magnitude). TEACHING CLUES AND CUES This lab activity can be performed on a table top and would not require the set up listed below. However, if the surfaces are very smooth (ex. plastic laminate), then the block will tend to slide as the rubber band is stretched, rather than stick and then slip. One option for increasing friction between the block being pulled and the table is to attach a sanding belt to the table top surface. Another option is to use a strip of elastic fabric (such as Spandex), one meter long and slightly wider than the 2x4 block, taped to the table surface. It is important that the block remain on the sanding belt or elastic fabric and does not scratch the table surface. Instructions for construction of the earthquake slip-stick model can be found on pp. 77 - 78. The attachment of a model building to the block provides a visual clue to the stick-slip motion and energy released. The further the block slips, the more energy released, and the more violently the building shakes. Through the use of the model, students will be able to see the elastic nature of earth materials by clearly seeing that energy is put into the system, stored as potential energy in the rubber band, and then suddenly released as an earthquake. Without the elastic component of the system, energy could not be stored and earthquakes could not occur. The model accurately simulates the strain energy that slowly accumulates in rock surrounding a locked fault that is released in a sudden slip event known as the Elastic Rebound Theory, it is ultimately a simplification of a complex earth system (Bolt, 2004). Such simplifications must be understood to interpret the model accurately. Therefore the relationship between the model and reality should be clearly emphasized to students, since middle and high school aged students often think of physical models as copies of reality rather than representations (Grosslight et al., 1991). See p. 82 for a concept map of the Elastic Rebound Theory. FOCUS QUESTION(S): • How frequently do earthquakes occur? • What is the role of a model in science? • How frequently do large events occur? • Can earthquakes be predicted? • How does the model data compare to global data? MATERIALS: for one EQ Stick-Slip Model (for construction pro- cedures see pp. 77 - 78) • 1 – one foot piece of 2X4 scrap wood • 1 – 4”x36” sanding belt, 50 grit • 1 – 1/3 sheet of sandpaper, 60 grit • 1 – screw eye 12x1-3/16 • 1 – bag of rubber bands, varying size • 1 – cloth tape measure with both English and Metric markings (a meter stick can substitute for this)
Transcript of 9 Lab - Modeling Elastic Rebound
Lab - Modeling Elastic Rebound
74
IDAHO IS YOUR HOME
RATIONALETectonic earthquakes are caused by a sudden slippage along the boundary (fault) between two plates. In this activity, students explore a mechanical model of a fault to examine how energy is stored elastically in rocks and released suddenly as an earthquake. Students then use the model to understand why some earthquakes are small and some are large. They will make observations, collect data, and compare modeled data to global data. The earthquake machine model is a slip-predictable fault model that demonstrates the property of elastic rebound. This means that when an earthquake occurs on the fault, the stress in the system always releases all stored energy so that the system returns to a “zero” state. Thus, this model cannot be used to predict when the next event will occur, but can be used to predict the magnitude of the earthquake if it were to occur at any given time.
Putting Down Roots, pp. 14 - 15
Idaho State Standards: 8th/9th Earth Science 1.2 (all), 1.3 (all), 1.6.3, 1.8.1 8th Mathematics 3.5.1, 4.3.1, 5.1.1, 5.1.2, 5.2.1, 5.4.1, 5.5.19th Mathematics 1.1.1, 1.2.1, 2.1.1, 2.2, 2.3.1, 2.4.1, 3.2, 3.3, 3.5, 3.6, 4.3, 4.4, 5.1.1, 5.2.1, 5.3, 5.4, 5.5
Objectives:Students will be able to:1. Define earthquakes and model their occurrence.2. Give examples of why models are important in science.3. Explain energy transfer as applied to the model.4. Use and explain the model to generate data that will be analyzed.5. Critically analyze data generated by the Earthquake Machine.6. Describe the global trends for earthquake occurrence and size.7. Interpret a Gutenberg Richter plot (frequency v. magnitude).
TEACHING CLUES AND CUESThis lab activity can be performed on a table top and would not require the set up listed below. However, if the surfaces are very smooth (ex. plastic laminate), then the block will tend to slide as the rubber band is stretched, rather than stick and then slip. One option for increasing friction between the block being pulled and the table is to attach a sanding belt to the table top surface. Another option is to use a strip of elastic fabric (such as Spandex), one meter long and slightly wider than the 2x4 block, taped to the table surface. It is important that the block remain on the sanding belt or elastic fabric and does not scratch the table surface.
Instructions for construction of the earthquake slip-stick model can be found on pp. 77 - 78. The attachment of a model building to the block provides a visual clue to the stick-slip motion and energy released. The further the block slips, the more energy released, and the more violently the building shakes. Through the use of the model, students will be able to see the elastic nature of earth materials by clearly seeing that energy is put into the system, stored as potential energy in the rubber band, and then suddenly released as an earthquake. Without the elastic component of the system, energy could not be stored and earthquakes could not occur.
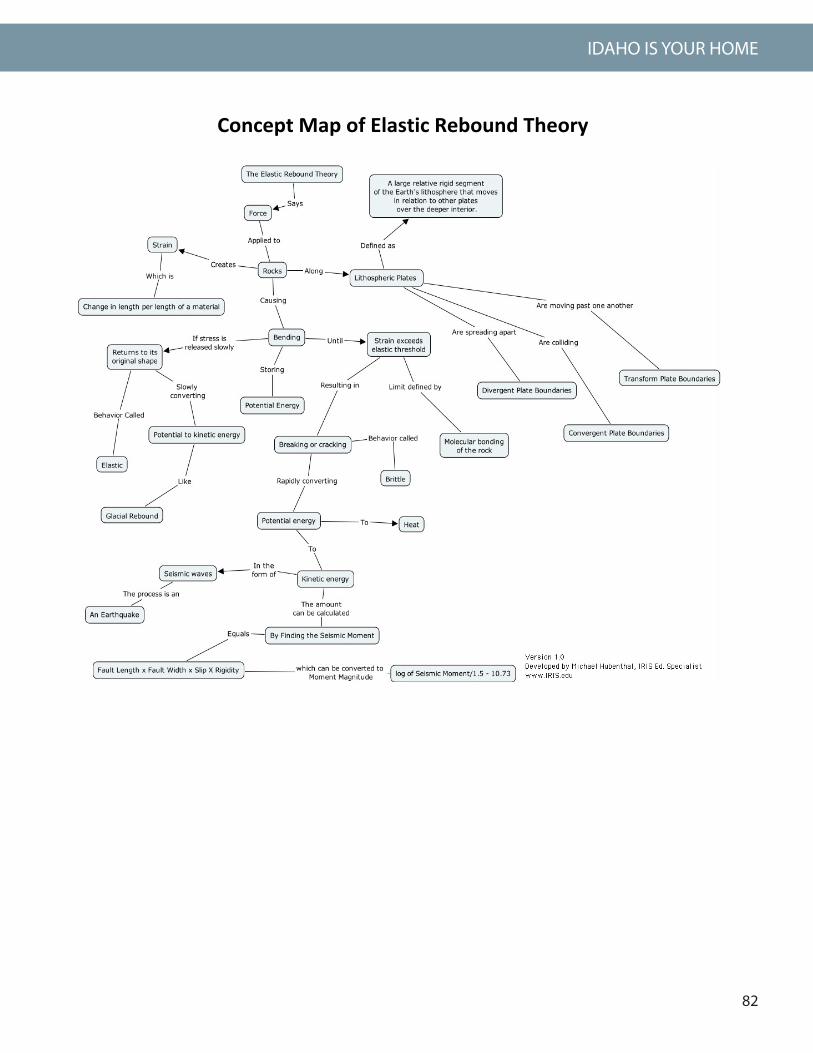
The model accurately simulates the strain energy that slowly accumulates in rock surrounding a locked fault that is released in a sudden slip event known as the Elastic Rebound Theory, it is ultimately a simplification of a complex earth system (Bolt, 2004). Such simplifications must be understood to interpret the model accurately. Therefore the relationship between the model and reality should be clearly emphasized to students, since middle and high school aged students often think of physical models as copies of reality rather than representations (Grosslight et al., 1991). See p. 82 for a concept map of the Elastic Rebound Theory.
FOCUS QUESTION(S):• How frequently do earthquakes occur?• What is the role of a model in science?• How frequently do large events occur?• Can earthquakes be predicted?• How does the model data compare to global data?
MATERIALS:for one EQ Stick-Slip Model (for construction pro-cedures see pp. 77 - 78)• 1 – one foot piece of 2X4 scrap wood• 1 – 4”x36” sanding belt, 50 grit• 1 – 1/3 sheet of sandpaper, 60 grit• 1 – screw eye 12x1-3/16• 1 – bag of rubber bands, varying size• 1 – cloth tape measure with both English and Metric markings
(a meter stick can substitute for this)
75
WHY SHOULD I CARE?
• 1 – manila folder• 1 – roll of duct tape (to hold down meter stick or cloth tape
measure)
for teacher• Teacher Background, pp. 79 - 81• Answer Key, Student Lab worksheet, pp. 88 - 89• Answer Key, Student Homework, p. 90• Concept Map of Elastic Rebound Theory, p. 82
for the students: (work in pairs)• 1 – Stick-slip model• Student Lab worksheet “Earthquake Slip Model - Lab,” pp. 83
- 84• Student Homework, pp. 85 - 87• Graph paper• Pencil or Pen
PROCEDURE: Teacher PreparationIn addition to gathering the materials needed for each group and constructing the Earthquake slip model (see pp. 79-80), it is important to experiment with some of the blocks of wood and the surfaces that students will use. If the surfaces are very smooth, then the block will tend to slide as the rubber band is stretched, rather than stick and then slip. There are places along the San Andreas Fault where the fault creeps, rather than sticking to generate an earthquake, so this type of behavior is possible for faults as well as for blocks of wood. However, this lab would not be very interesting if the block moved by creep rather than by stick-slip motion.
It is possible to calculate the magnitude of the “earthquake” generated on the earthquake machine. However, this is not the purpose of this lab. For instructions on how to determine magnitude, go to http://www.jclahr.com/science/earth_science/tabletop/earthshaking/index.html and access the section “Understanding the Results.”
B. Lesson Development1. Group students into teams of 3-4.
2. Provide students with the materials necessary to complete the lab.
3. Take a few minutes to make a string of rubber bands, by looping them together. Loop one completely through the eye bolt of the block of wood. Stick-slip motion is more likely if the rubber bands are thin and the string of rubber bands is long.
4. One student will be the “puller,” one will be the observer, and one or two will take notes.
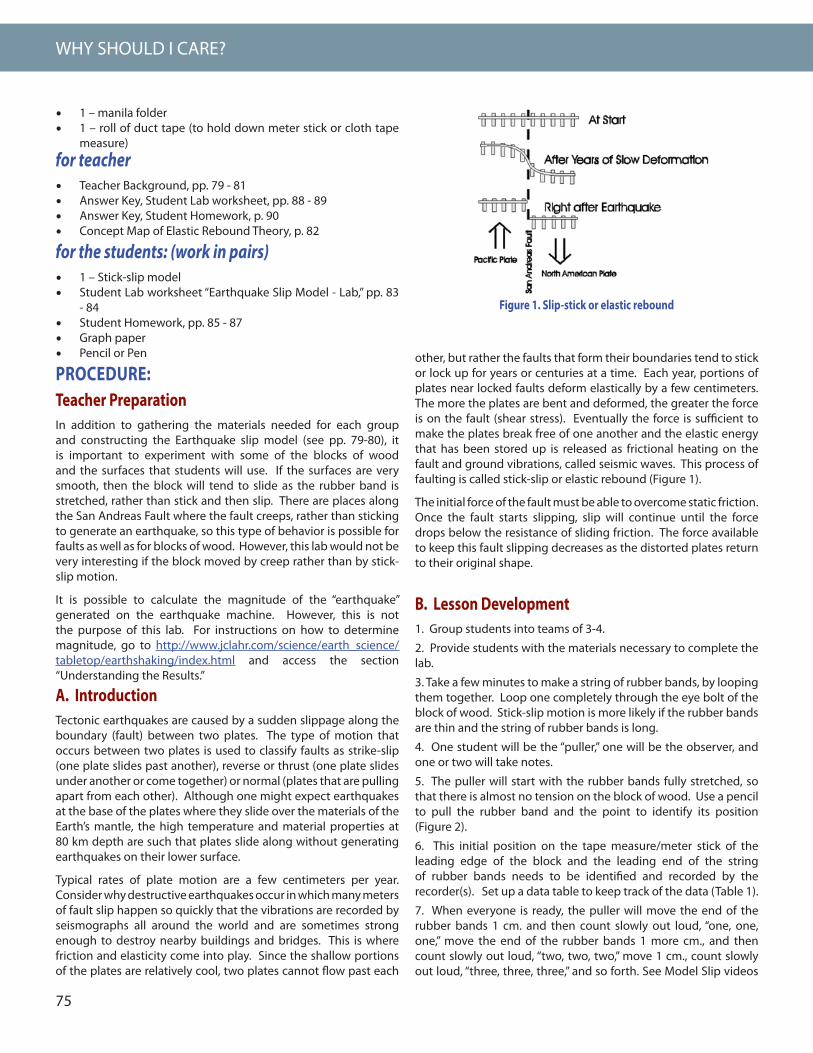
5. The puller will start with the rubber bands fully stretched, so that there is almost no tension on the block of wood. Use a pencil to pull the rubber band and the point to identify its position (Figure 2).
6. This initial position on the tape measure/meter stick of the leading edge of the block and the leading end of the string of rubber bands needs to be identified and recorded by the recorder(s). Set up a data table to keep track of the data (Table 1).
7. When everyone is ready, the puller will move the end of the rubber bands 1 cm. and then count slowly out loud, “one, one, one,” move the end of the rubber bands 1 more cm., and then count slowly out loud, “two, two, two,” move 1 cm., count slowly out loud, “three, three, three,” and so forth. See Model Slip videos
A. IntroductionTectonic earthquakes are caused by a sudden slippage along the boundary (fault) between two plates. The type of motion that occurs between two plates is used to classify faults as strike-slip (one plate slides past another), reverse or thrust (one plate slides under another or come together) or normal (plates that are pulling apart from each other). Although one might expect earthquakes at the base of the plates where they slide over the materials of the Earth’s mantle, the high temperature and material properties at 80 km depth are such that plates slide along without generating earthquakes on their lower surface.
Typical rates of plate motion are a few centimeters per year. Consider why destructive earthquakes occur in which many meters of fault slip happen so quickly that the vibrations are recorded by seismographs all around the world and are sometimes strong enough to destroy nearby buildings and bridges. This is where friction and elasticity come into play. Since the shallow portions of the plates are relatively cool, two plates cannot flow past each
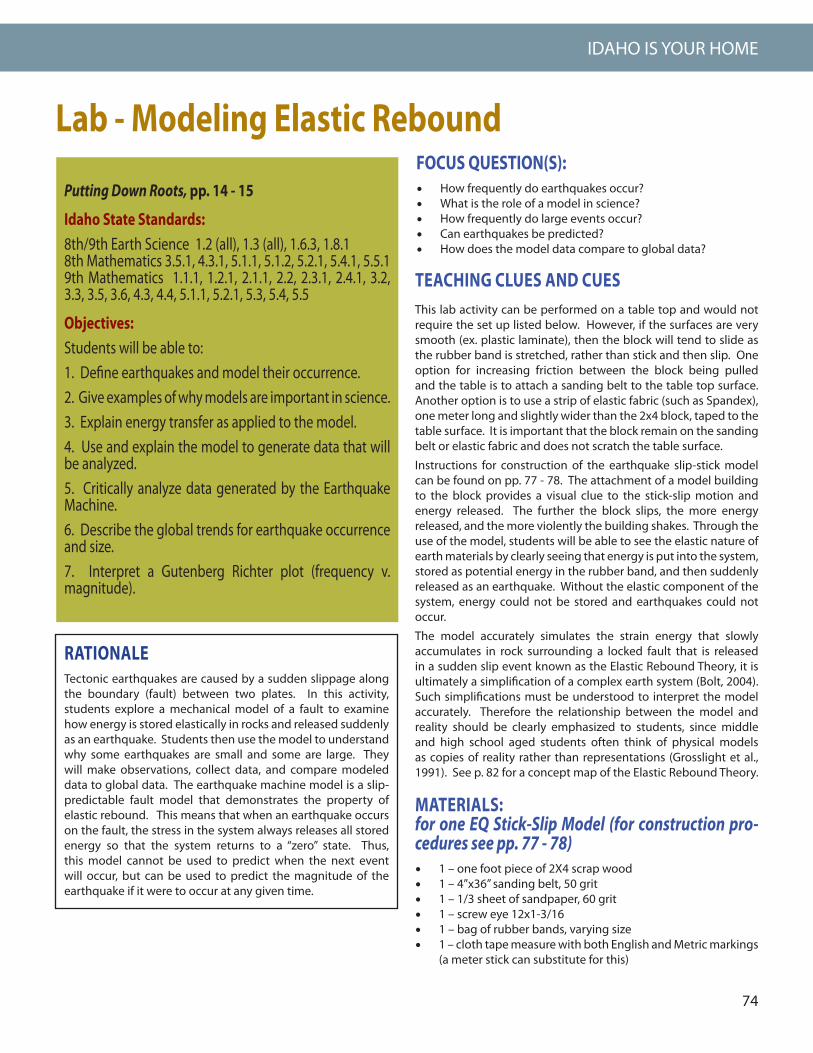
Figure 1. Slip-stick or elastic rebound
other, but rather the faults that form their boundaries tend to stick or lock up for years or centuries at a time. Each year, portions of plates near locked faults deform elastically by a few centimeters. The more the plates are bent and deformed, the greater the force is on the fault (shear stress). Eventually the force is sufficient to make the plates break free of one another and the elastic energy that has been stored up is released as frictional heating on the fault and ground vibrations, called seismic waves. This process of faulting is called stick-slip or elastic rebound (Figure 1).
The initial force of the fault must be able to overcome static friction. Once the fault starts slipping, slip will continue until the force drops below the resistance of sliding friction. The force available to keep this fault slipping decreases as the distorted plates return to their original shape.
76
IDAHO IS YOUR HOME
C. ConclusionNow that you have an idea about how the lab works, discuss what you think is going on. How is friction related to the movement of the block? What do the different parts of the model represent in real life? Sketch a diagram of the model to show how energy is transferred. Would you expect the motion of the block to be the same if the experiment were repeated? Repeat the experiment twice, each time changing the spuller, observer, and recorder assignments. Graph the additional two sets of data.
Adaptations and Extensions• Connecting two blocks of wood, as shown in the video,
will allow for variations in the lab and demonstrate how foreshocks precede the main earthquake, as well as the occurrence of aftershocks.
• Make blocks with different grits of sandpaper. Does this change the data? How?
• Have groups compare their data to other groups.
Figure 2
in folder or go to http://www.jclahr.com/science/earth_science/tabletop/earthshaking/video/index.html. Counting in this way allows for three seconds between the next stretch of the rubber band.
8. The observer will read out loud the position of the leading edge of the block at its initial position and then after each movement of the block, while the recorders(s) record the numbers. It is im-portant that the observer take accurate measurements of “any” block movement no matter how small. Clue: watch for motion of the building to indicate movement. The number of centimeters that the rubber band stretched should also be recorded when movement occurs. See p. 86 for an example of how a graph for recording time v. the amount of displacement should be set up. If the block moves as the puller is moving to the next centimeter, then the movement is assigned to the higher value. This model assumes that the plates are moving at 1 cm per year. Thus, the change in rubber band stretch is referred to as ΔT.
9. Continue to take readings for the complete length of the sand-ing belt. While it is not necessary for the rubber band to be on the sanding belt, the block of wood should be while measurements are taken.
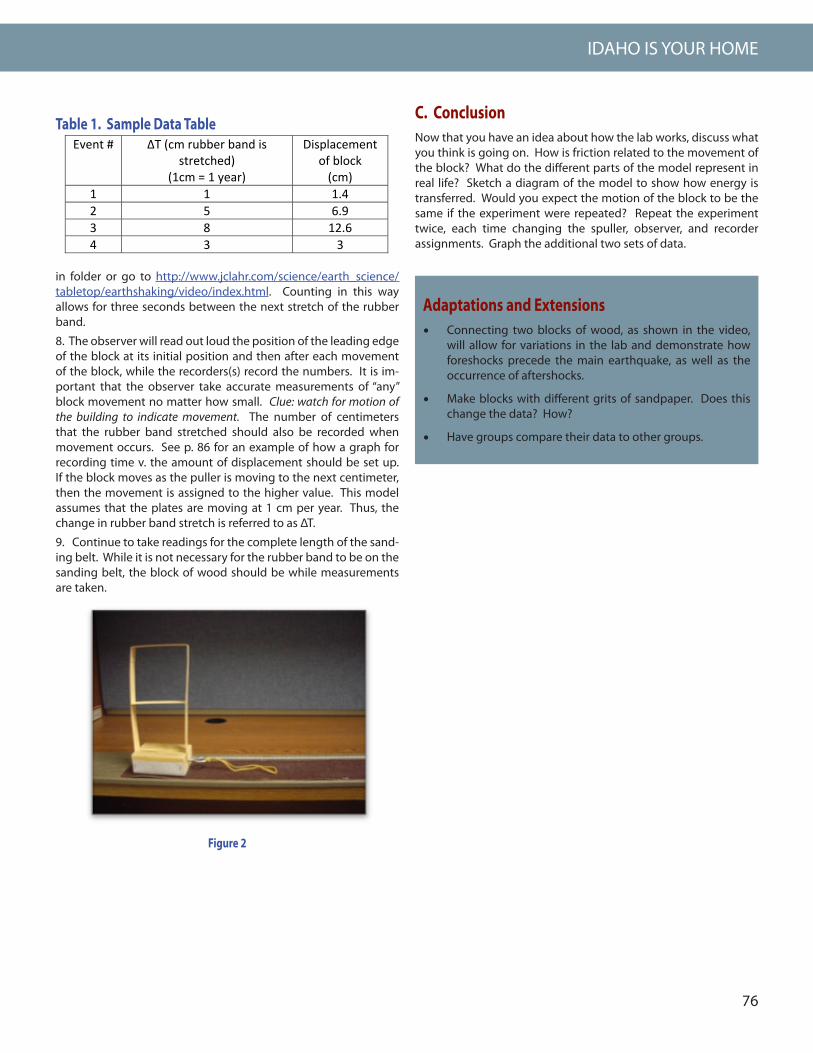
Event # ΔT (cm rubber band is stretched)
(1cm = 1 year)
Displacement of block (cm)
1 1 1.4 2 5 6.9 3 8 12.6 4 3 3
Table 1. Sample Data Table
77
WHY SHOULD I CARE?
7
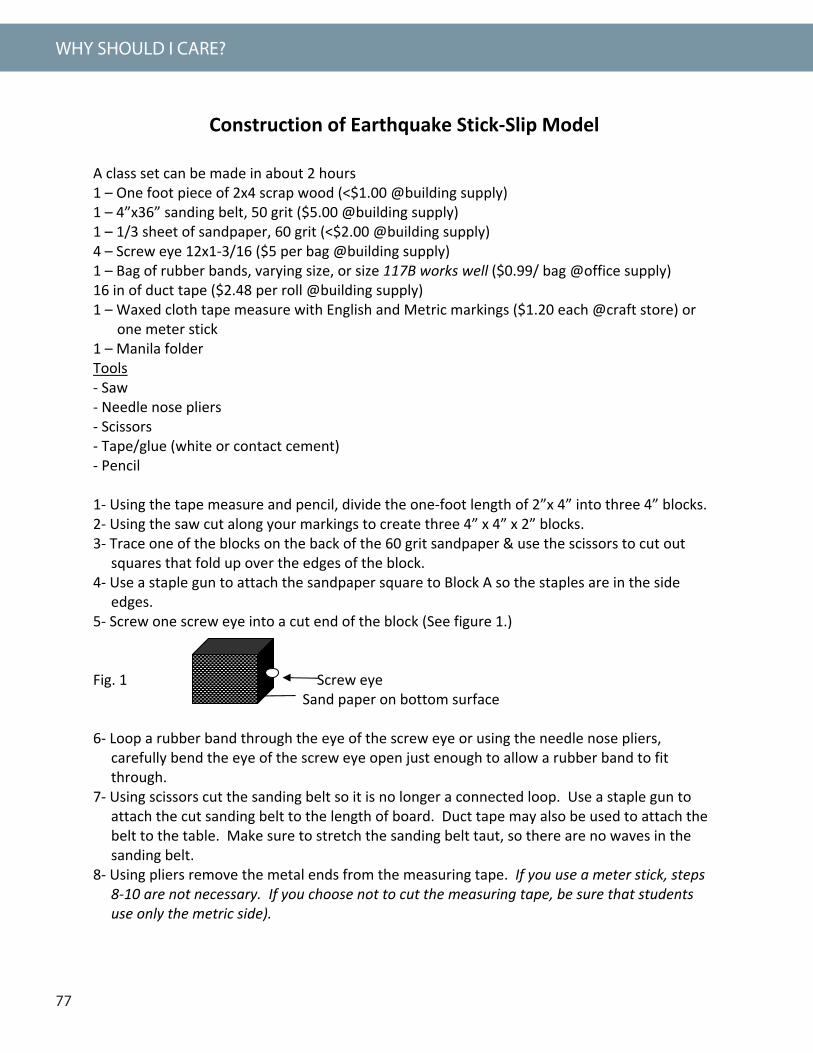
Construction of Earthquake Stick‐Slip Model A class set can be made in about 2 hours 1 – One foot piece of 2x4 scrap wood (<$1.00 @building supply) 1 – 4”x36” sanding belt, 50 grit ($5.00 @building supply) 1 – 1/3 sheet of sandpaper, 60 grit (<$2.00 @building supply) 4 – Screw eye 12x1‐3/16 ($5 per bag @building supply) 1 – Bag of rubber bands, varying size, or size 117B works well ($0.99/ bag @office supply) 16 in of duct tape ($2.48 per roll @building supply) 1 – Waxed cloth tape measure with English and Metric markings ($1.20 each @craft store) or
one meter stick 1 – Manila folder Tools ‐ Saw ‐ Needle nose pliers ‐ Scissors ‐ Tape/glue (white or contact cement) ‐ Pencil 1‐ Using the tape measure and pencil, divide the one‐foot length of 2”x 4” into three 4” blocks. 2‐ Using the saw cut along your markings to create three 4” x 4” x 2” blocks. 3‐ Trace one of the blocks on the back of the 60 grit sandpaper & use the scissors to cut out
squares that fold up over the edges of the block. 4‐ Use a staple gun to attach the sandpaper square to Block A so the staples are in the side
edges. 5‐ Screw one screw eye into a cut end of the block (See figure 1.) Fig. 1 Screw eye Sand paper on bottom surface 6‐ Loop a rubber band through the eye of the screw eye or using the needle nose pliers,
carefully bend the eye of the screw eye open just enough to allow a rubber band to fit through.
7‐ Using scissors cut the sanding belt so it is no longer a connected loop. Use a staple gun to attach the cut sanding belt to the length of board. Duct tape may also be used to attach the belt to the table. Make sure to stretch the sanding belt taut, so there are no waves in the sanding belt.
8‐ Using pliers remove the metal ends from the measuring tape. If you use a meter stick, steps 8‐10 are not necessary. If you choose not to cut the measuring tape, be sure that students use only the metric side).
78
IDAHO IS YOUR HOME
8
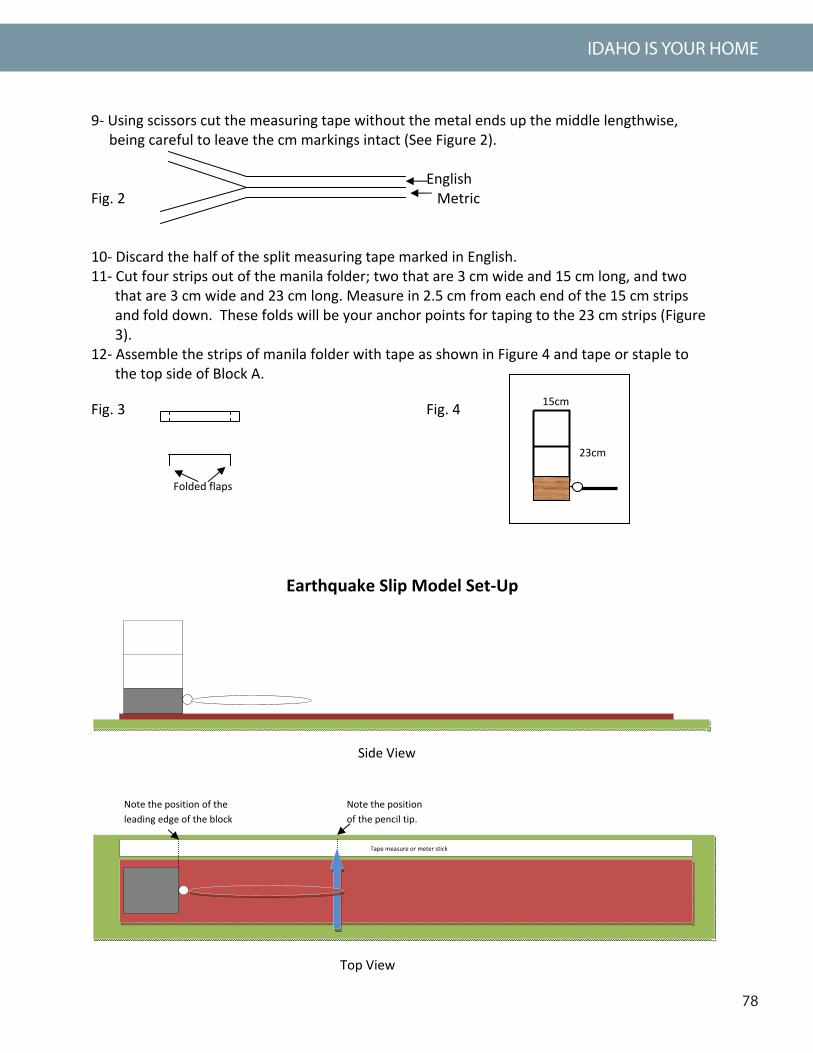
9‐ Using scissors cut the measuring tape without the metal ends up the middle lengthwise, being careful to leave the cm markings intact (See Figure 2).
English Fig. 2 Metric 10‐ Discard the half of the split measuring tape marked in English. 11‐ Cut four strips out of the manila folder; two that are 3 cm wide and 15 cm long, and two
that are 3 cm wide and 23 cm long. Measure in 2.5 cm from each end of the 15 cm strips and fold down. These folds will be your anchor points for taping to the 23 cm strips (Figure 3).
12‐ Assemble the strips of manila folder with tape as shown in Figure 4 and tape or staple to the top side of Block A.
Fig. 3 Fig. 4
Earthquake Slip Model Set‐Up
Tape measure or meter stick
Note the position of the leading edge of the block
23cm
15cm
Folded flaps
Side View
Top View
Note the position of the pencil tip.
79
WHY SHOULD I CARE?
9
Teacher Background Calculating Magnitude Using the Model*
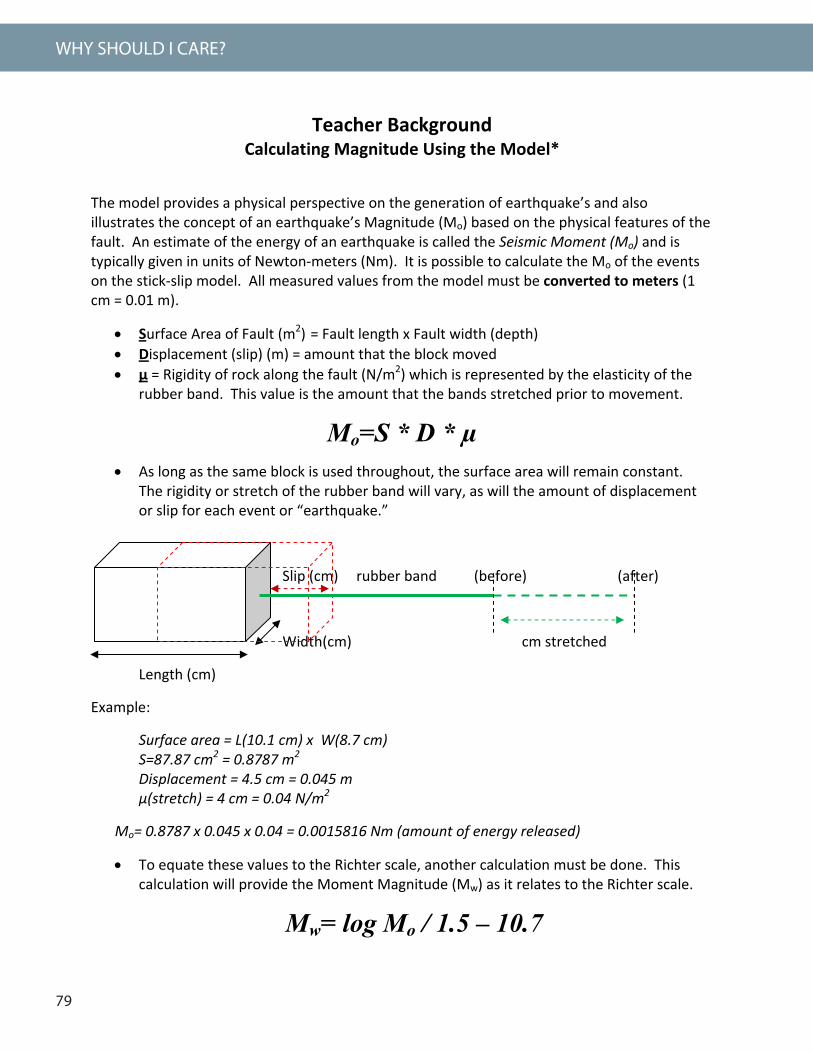
The model provides a physical perspective on the generation of earthquake’s and also illustrates the concept of an earthquake’s Magnitude (Mo) based on the physical features of the fault. An estimate of the energy of an earthquake is called the Seismic Moment (Mo) and is typically given in units of Newton‐meters (Nm). It is possible to calculate the Mo of the events on the stick‐slip model. All measured values from the model must be converted to meters (1 cm = 0.01 m).
Surface Area of Fault (m2) = Fault length x Fault width (depth) Displacement (slip) (m) = amount that the block moved µ = Rigidity of rock along the fault (N/m2) which is represented by the elasticity of the
rubber band. This value is the amount that the bands stretched prior to movement.
Mo=S * D * µ As long as the same block is used throughout, the surface area will remain constant.
The rigidity or stretch of the rubber band will vary, as will the amount of displacement or slip for each event or “earthquake.”
Slip (cm) rubber band (before) (after)
Width(cm) cm stretched
Length (cm)
Example:
Surface area = L(10.1 cm) x W(8.7 cm) S=87.87 cm2 = 0.8787 m2
Displacement = 4.5 cm = 0.045 m µ(stretch) = 4 cm = 0.04 N/m2
Mo= 0.8787 x 0.045 x 0.04 = 0.0015816 Nm (amount of energy released)
To equate these values to the Richter scale, another calculation must be done. This calculation will provide the Moment Magnitude (Mw) as it relates to the Richter scale.
Mw= log Mo / 1.5 – 10.7
80
IDAHO IS YOUR HOME
10
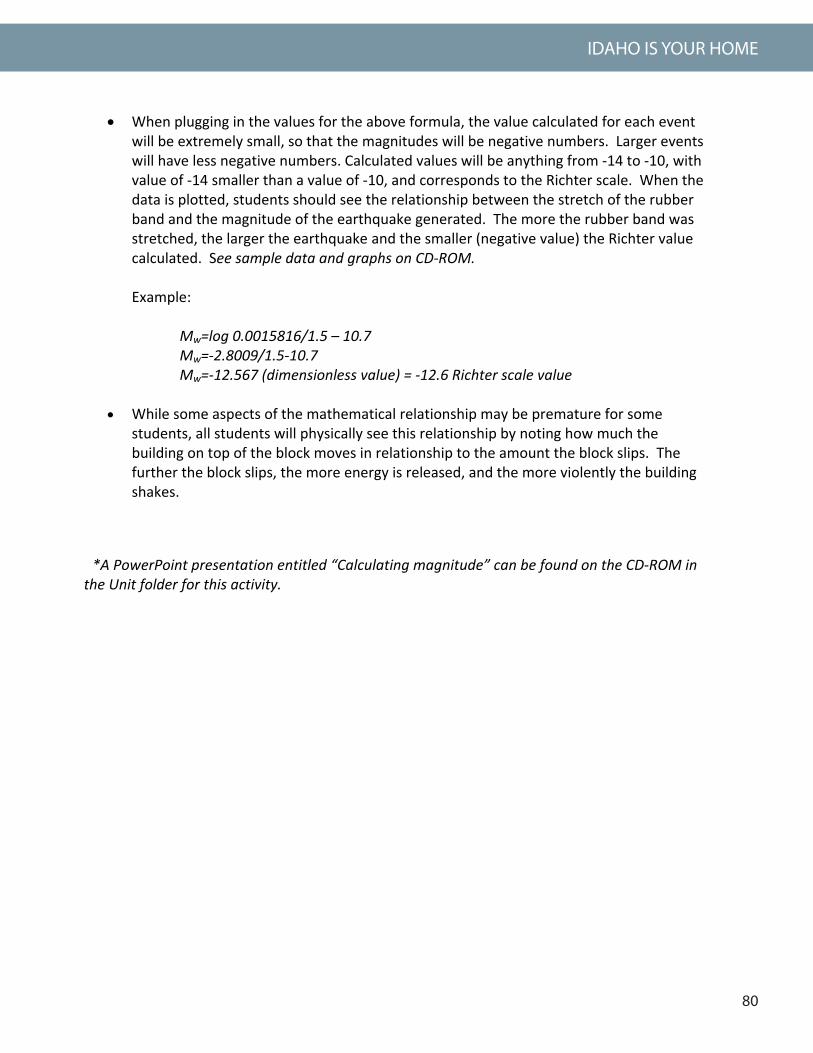
When plugging in the values for the above formula, the value calculated for each event will be extremely small, so that the magnitudes will be negative numbers. Larger events will have less negative numbers. Calculated values will be anything from ‐14 to ‐10, with value of ‐14 smaller than a value of ‐10, and corresponds to the Richter scale. When the data is plotted, students should see the relationship between the stretch of the rubber band and the magnitude of the earthquake generated. The more the rubber band was stretched, the larger the earthquake and the smaller (negative value) the Richter value calculated. See sample data and graphs on CD‐ROM. Example:
Mw=log 0.0015816/1.5 – 10.7 Mw=‐2.8009/1.5‐10.7 Mw=‐12.567 (dimensionless value) = ‐12.6 Richter scale value
While some aspects of the mathematical relationship may be premature for some
students, all students will physically see this relationship by noting how much the building on top of the block moves in relationship to the amount the block slips. The further the block slips, the more energy is released, and the more violently the building shakes.
*A PowerPoint presentation entitled “Calculating magnitude” can be found on the CD‐ROM in the Unit folder for this activity.
81
WHY SHOULD I CARE?
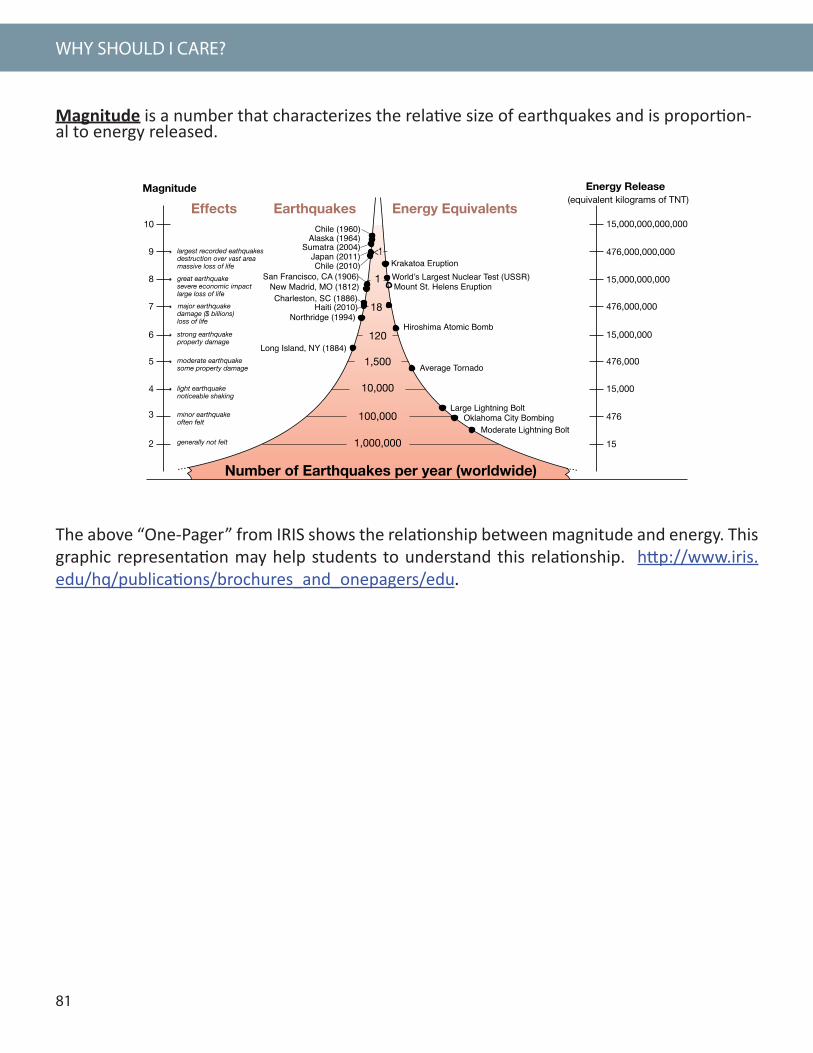
Magnitude is a number that characterizes the relative size of earthquakes and is proportion-al to energy released.
1200 New York Ave, #800Washington DC 20005phone (202) 682-2220fax (202) 682-2444www.iris.edu
Education and Outreach Series No. 3
How Often Do Earthquakes Occur?
This figure was produced in coop-eration with the US Geological Survey, and the University of Memphis
Earthquakes are always happening somewhere.
2
6
4
8
10
9
3
7
5
15
476
15,000
476,000
15,000,000
476,000,000
15,000,000,000
476,000,000,000
15,000,000,000,000
Number of Earthquakes per year (worldwide)
1,000,000
100,000
10,000
1,500
120
18
1
<1
Energy Release(equivalent kilograms of TNT)
Magnitude
largest recorded eathquakesdestruction over vast areamassive loss of life
great earthquakesevere economic impactlarge loss of life
major earthquakedamage ($ billions)loss of life
strong earthquakeproperty damage
moderate earthquakesome property damage
light earthquakenoticeable shaking
minor earthquakeoften felt
generally not felt
Chile (1960)Alaska (1964)
Sumatra (2004)Japan (2011)Chile (2010)
San Francisco, CA (1906)New Madrid, MO (1812)
Long Island, NY (1884)
Large Lightning Bolt
Average Tornado
Hiroshima Atomic Bomb
Mount St. Helens EruptionCharleston, SC (1886)
Oklahoma City BombingModerate Lightning Bolt
Krakatoa EruptionWorldʼs Largest Nuclear Test (USSR)
EarthquakesEffects Energy Equivalents
Northridge (1994)Haiti (2010)
The left side of the figure above describes the effects of an earthquake by magnitude. The larger the number, the bigger the earthquake. Significant earthquakes are noted on the left side of the shaded tower. The shaded area indicates how many earthquakes of each magnitude occur every year. The events on the right side of the tower show equivalent energy release.
The 2004 earthquake in Haiti, for example, was magnitude 7.0. Earthquakes this size occur about 20 times each year worldwide. Although the Haiti earthquake is considered moderate in size, it caused unprecedented devastation due to poor building material and construction techniques resulting in estimates of $11 billion to reconstruct. The earthquake released the energy equivalent to 476 million kilograms of explosive, about 100 times the amount of energy that was released by the atomic bomb that destroyed the city of Hiroshima during World War II.
The largest recorded earthquake was the Great Chilean Earthquake of May 22, 1960 which had a magnitude of 9.5. The great earthquake in 2004 in Sumatra, Indonesia measuring magnitude 9.1 produced tsunamis that caused widespread disaster in 14 countries. A magnitude 9.0 earthquake in Japan in 2011 also caused large tsunamis. All three were mega-thrust earthquakes on subduction-zone boundaries that, in a period of minutes, released centuries of accumulated strain and caused rebound in the overlying plates. Because great earthquakes release so much energy, the five largest earthquakes are responsible for half of the total energy released by all earthquakes in the last century.
Has earthquake activity been increasing?There has definitely been an increase in the number of earthquakes that can be detected and located
due to a more-than 10-fold increase in the number of seismic stations world wide over the past century. This doesn’t mean that the annual average number of earthquakes has increased. In fact, earthquakes of magnitude 7.0 and greater have remained relatively constant since record keeping began.
Although the average number of large earthquakes per year is fairly constant, they can occur in clusters. However, that does not imply that earthquakes that are distant in location, but close in time, are causally related. The NEIC locates about 12,000–14,000 earthquakes each year. Those records are reflected in the graph above.
Magnitude 2 and smaller earthquakes occur several hundred times a day world wide. Major earthquakes, greater than magnitude 7, happen more than once per month. “Great earthquakes”, magnitude 8 and higher, occur about once a year.
Support for IRIS comes from the National Science Foundation,
universities, andprivate foundations.
IRIS is a university research consortium dedicated to monitoring the Earth and exploring its interior through the collection and distribution of geophysical data.
E&OAdvancing awareness and understanding of seismology & Earth science while inspiring careers in geophysics.
IRIS programs contribute to scholarly research, education, earthquake hazard mitigation, and the verification of the Comprehensive Test Ban Treaty.
other federal agencies,
June 2011
The above “One-Pager” from IRIS shows the relationship between magnitude and energy. This graphic representation may help students to understand this relationship. http://www.iris.edu/hq/publications/brochures_and_onepagers/edu.
82
IDAHO IS YOUR HOME
19
Concept Map of Elastic Rebound Theory
83
WHY SHOULD I CARE?
12
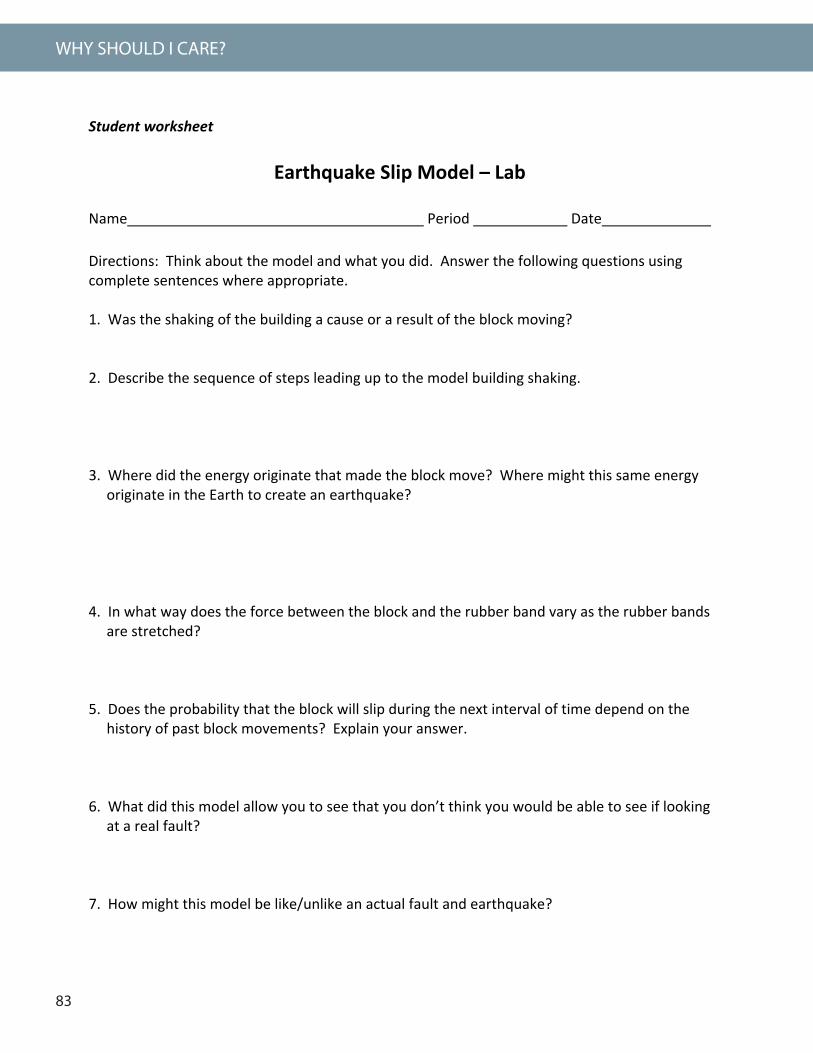
Student worksheet
Earthquake Slip Model – Lab
Name Period Date
Directions: Think about the model and what you did. Answer the following questions using complete sentences where appropriate. 1. Was the shaking of the building a cause or a result of the block moving? 2. Describe the sequence of steps leading up to the model building shaking. 3. Where did the energy originate that made the block move? Where might this same energy
originate in the Earth to create an earthquake? 4. In what way does the force between the block and the rubber band vary as the rubber bands
are stretched? 5. Does the probability that the block will slip during the next interval of time depend on the
history of past block movements? Explain your answer. 6. What did this model allow you to see that you don’t think you would be able to see if looking
at a real fault? 7. How might this model be like/unlike an actual fault and earthquake?
84
IDAHO IS YOUR HOME
13
8. How would you modify the model so that it no longer stored energy? How do you think your modification would impact the model’s overall operation?
9. What aspects of the model were you able to “measure” quantitatively? 10. Graph the data that you gathered from the stick‐slip model. Place “Time” on the X axis and
“Displacement” on the Y axis, use the graph provided, or generate the graph using a graphing program.
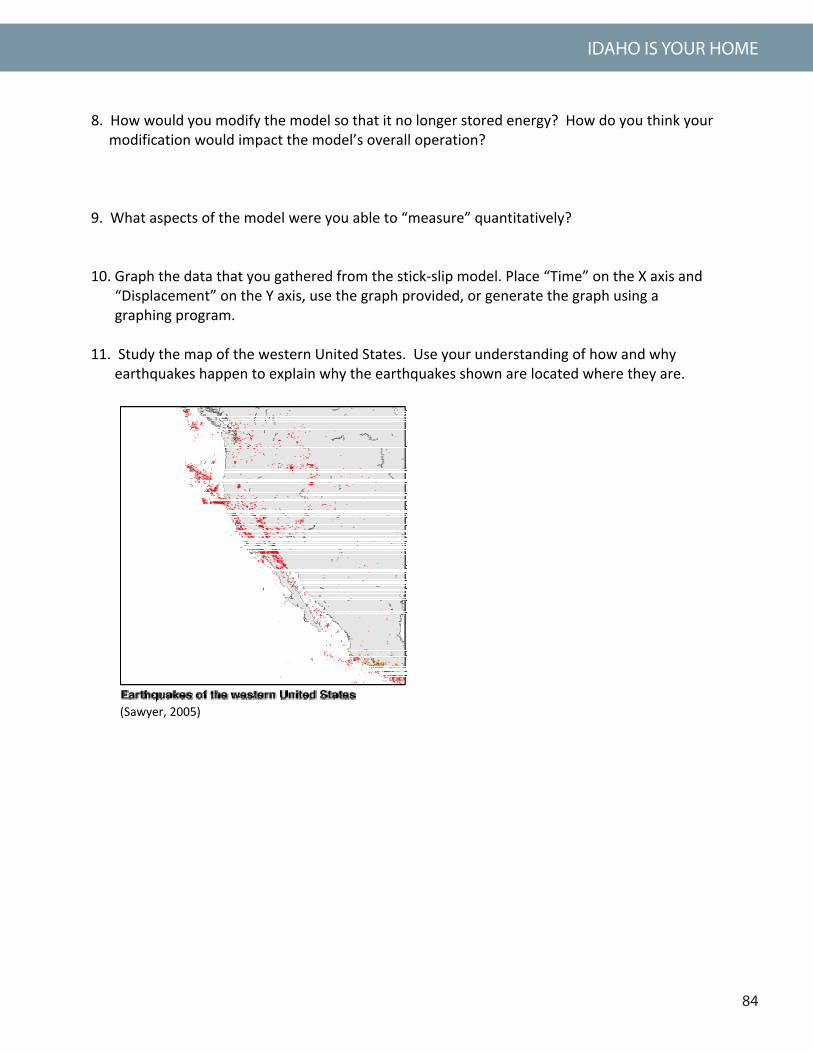
11. Study the map of the western United States. Use your understanding of how and why
earthquakes happen to explain why the earthquakes shown are located where they are.
(Sawyer, 2005)
85
WHY SHOULD I CARE?
14
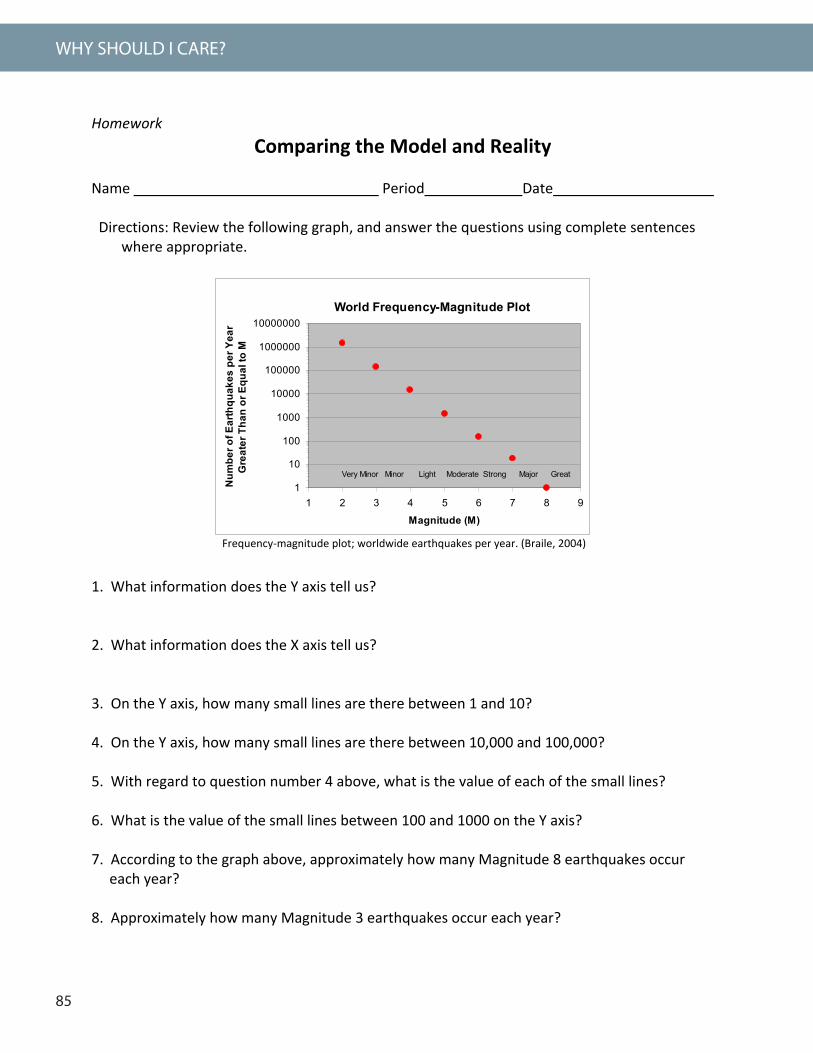
Homework Comparing the Model and Reality
Name Period Date Directions: Review the following graph, and answer the questions using complete sentences
where appropriate.
1. What information does the Y axis tell us? 2. What information does the X axis tell us? 3. On the Y axis, how many small lines are there between 1 and 10? 4. On the Y axis, how many small lines are there between 10,000 and 100,000? 5. With regard to question number 4 above, what is the value of each of the small lines? 6. What is the value of the small lines between 100 and 1000 on the Y axis? 7. According to the graph above, approximately how many Magnitude 8 earthquakes occur
each year? 8. Approximately how many Magnitude 3 earthquakes occur each year?
World Frequency-Magnitude Plot
1
10
100
1000
10000
100000
1000000
10000000
1 2 3 4 5 6 7 8 9
Magnitude (M)
Num
ber o
f Ear
thqu
akes
per
Yea
r G
reat
er T
han
or E
qual
to M
Very Minor Minor Light Moderate Strong Major Great
Frequency‐magnitude plot; worldwide earthquakes per year. (Braile, 2004)

86
IDAHO IS YOUR HOME
15
9. Keeping your responses to questions #5 and #6 in mind, what would be the next major line on the Y axis below the X,Y intercept?
10. If you were to extrapolate the graph by extending the slope of the line off the bottom of
the graph, approximately how frequently would you expect a Magnitude 9 earthquake to occur?
11. Is the global data shown in the graph above like or unlike the data collected from the lab
using the model? How? Give specifics.
87
WHY SHOULD I CARE?
16
Time vs. Amount of Displacement
0 2 4 6 8 10 12 14 16 18 20
Time (cm=year)
Displacemen
t (cm
)
0
5 10
15 20
25
30
35
88
IDAHO IS YOUR HOME
17
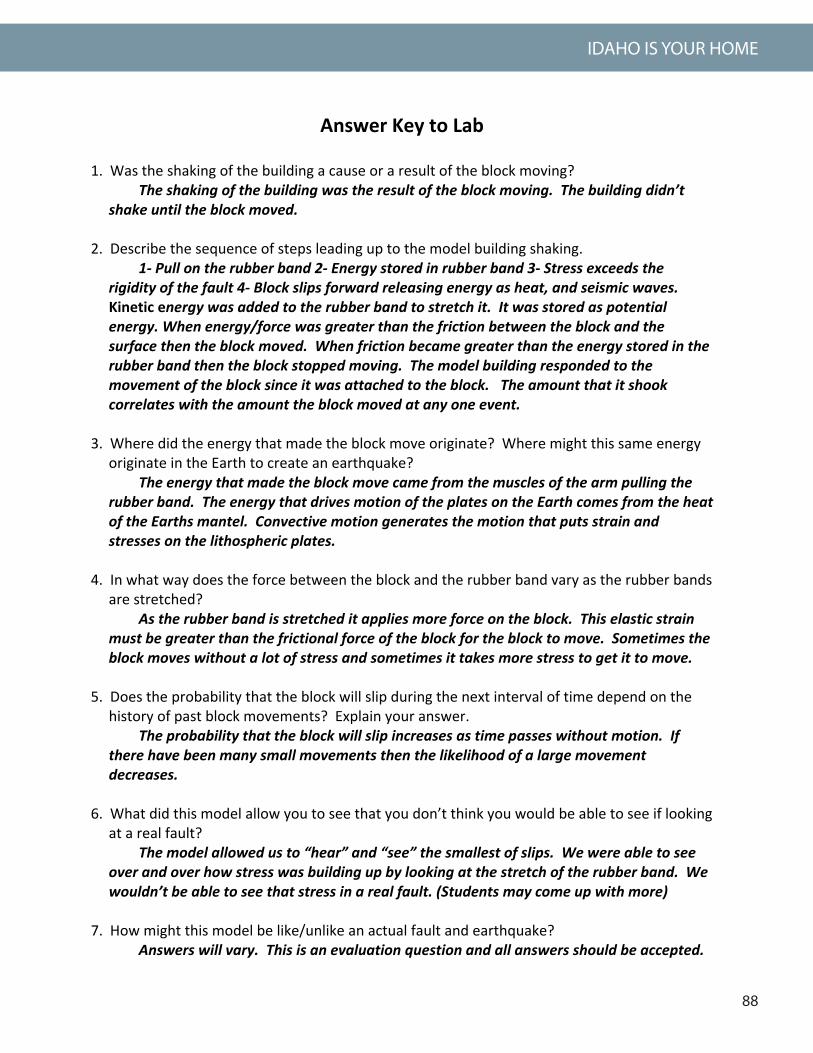
Answer Key to Lab 1. Was the shaking of the building a cause or a result of the block moving? The shaking of the building was the result of the block moving. The building didn’t
shake until the block moved. 2. Describe the sequence of steps leading up to the model building shaking. 1‐ Pull on the rubber band 2‐ Energy stored in rubber band 3‐ Stress exceeds the
rigidity of the fault 4‐ Block slips forward releasing energy as heat, and seismic waves. Kinetic energy was added to the rubber band to stretch it. It was stored as potential energy. When energy/force was greater than the friction between the block and the surface then the block moved. When friction became greater than the energy stored in the rubber band then the block stopped moving. The model building responded to the movement of the block since it was attached to the block. The amount that it shook correlates with the amount the block moved at any one event.
3. Where did the energy that made the block move originate? Where might this same energy
originate in the Earth to create an earthquake? The energy that made the block move came from the muscles of the arm pulling the
rubber band. The energy that drives motion of the plates on the Earth comes from the heat of the Earths mantel. Convective motion generates the motion that puts strain and stresses on the lithospheric plates.
4. In what way does the force between the block and the rubber band vary as the rubber bands
are stretched? As the rubber band is stretched it applies more force on the block. This elastic strain
must be greater than the frictional force of the block for the block to move. Sometimes the block moves without a lot of stress and sometimes it takes more stress to get it to move.
5. Does the probability that the block will slip during the next interval of time depend on the
history of past block movements? Explain your answer. The probability that the block will slip increases as time passes without motion. If
there have been many small movements then the likelihood of a large movement decreases.
6. What did this model allow you to see that you don’t think you would be able to see if looking
at a real fault? The model allowed us to “hear” and “see” the smallest of slips. We were able to see
over and over how stress was building up by looking at the stretch of the rubber band. We wouldn’t be able to see that stress in a real fault. (Students may come up with more)
7. How might this model be like/unlike an actual fault and earthquake? Answers will vary. This is an evaluation question and all answers should be accepted.
89
WHY SHOULD I CARE?
18
8. How would you modify the model so that it no longer stored energy? How do you think your modification would impact the models overall operation?
To modify the model a string could be used to pull the block instead of rubber bands. String would not allow the energy to be stored. The block would not stick‐slip. Another modification could be to have the block placed on a smooth surface so that it did not stick. This would produce a slow and steady “creeping” motion without sudden movements.
9. What aspects of the model were you able to “measure” quantitatively? The number of events, the distance the block moved on each event, the number of
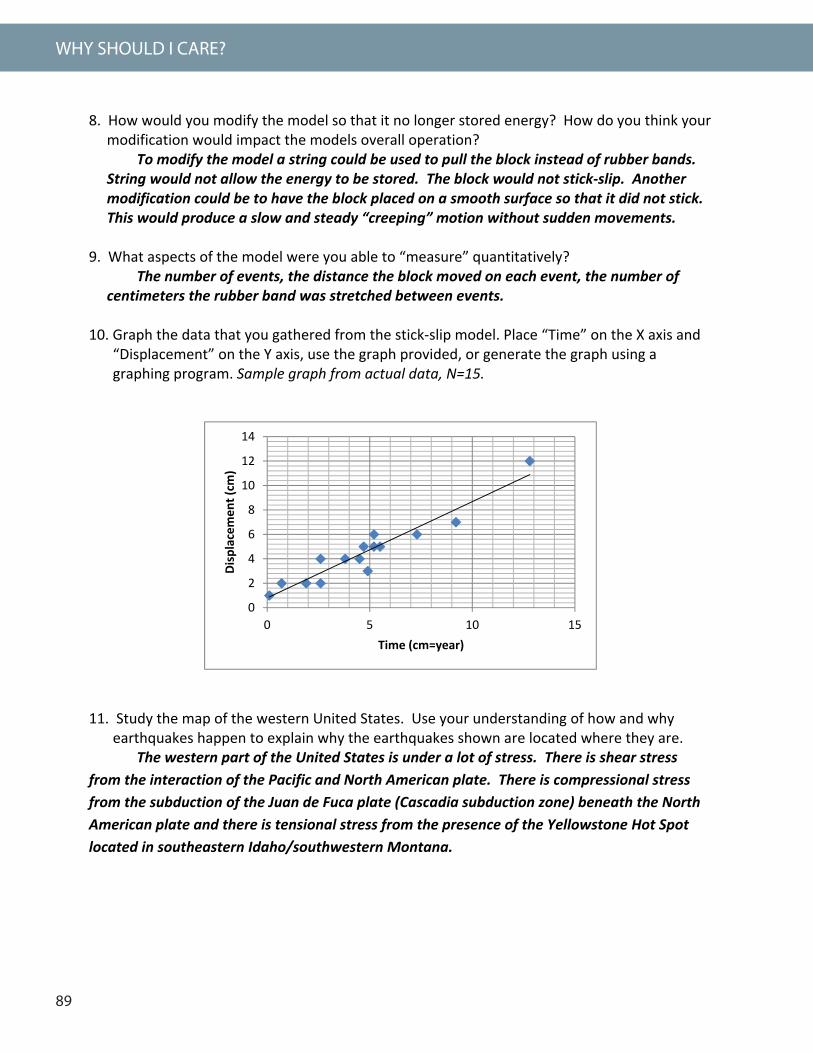
centimeters the rubber band was stretched between events. 10. Graph the data that you gathered from the stick‐slip model. Place “Time” on the X axis and
“Displacement” on the Y axis, use the graph provided, or generate the graph using a graphing program. Sample graph from actual data, N=15.
11. Study the map of the western United States. Use your understanding of how and why
earthquakes happen to explain why the earthquakes shown are located where they are. The western part of the United States is under a lot of stress. There is shear stress from the interaction of the Pacific and North American plate. There is compressional stress from the subduction of the Juan de Fuca plate (Cascadia subduction zone) beneath the North American plate and there is tensional stress from the presence of the Yellowstone Hot Spot located in southeastern Idaho/southwestern Montana.
0
2
4
6
8
10
12
14
0 5 10 15
Displacem
ent (cm
)
Time (cm=year)
90
IDAHO IS YOUR HOME
20
Answer Key to Homework 1. What information does the Y axis tell us? The Y axis tells us the number of earthquakes that occur yearly.
2. What information does the X axis tell us? The X axis tells us the magnitude of the events.
3. On the Y axis, how many small lines are there between 1 and 10? There are eight small lines between 1 and 10 on the Y axis.
4. On the Y axis, how many small lines are there between 10,000 and 100,000? There are eight small lines between 10,000 and 100,000 on the Y axis.
5. With regard to question number 4 above, what is the value of each of the small lines? Each small line is equal to 10,000 earthquakes per year.
6. What is the value of the small lines between 100 and 1000 on the Y axis? Each small line is equal to 100 earthquakes per year.
7. According to the graph above, approximately how many Magnitude 8 earthquakes occur each year?
One Magnitude 8 earthquakes should occur each year.
8. Approximately how many Magnitude 3 earthquakes occur each year? Between 100,000 and 200,000 Magnitude 3 earthquakes should occur each year.
9. Keeping your responses to questions #5 and #6 in mind, what would be the next major line on the Y axis below the X,Y intercept?
The next major line long the graph below the X,Y intercept on the graph should be 0.1 earthquakes per year.
10. If you were to extrapolate the graph by extending the slope of the line off the bottom of the graph, approximately how frequently would you expect a Magnitude 9 earthquake to occur?
One would expect 0.1 Magnitude 9 earthquakes to occur each year, or one every 10 years.
11. Is the global data shown in the graph above like or unlike the data we collected from the stick – slip model? How? Give specifics.
The data from the model is quite similar to the global data set. Using the model we saw that we had a variety of different sized events occur, but there were significantly more small events and large ones. The same thing happens globally as shown by the graph. There are many, many more small events than large ones.