9. ICAEW: debt - Election 2017 - IFS · PDF file9. ICAEW: debt Ross Campbell (ICAEW) and...
26
The IFS Green Budget: February 2017 270 © Institute for Fiscal Studies 9. ICAEW: debt Ross Campbell (ICAEW) and Martin Wheatcroft (on behalf of ICAEW) Key findings The government continues to rely on external finance to provide the funds it needs to pay for spending, for investment, and to repay existing debts as they fall due. The government needs to raise £646 billion from external investors over the next five years. This is £11 billion more than the amount it raised over the last five years, with greater refinancing, higher government lending and lower asset sales more than offsetting a £293 billion reduction in fiscal deficits. The government should update its treasury management objectives and strategy to ensure they are fit for purpose. The government’s most recently published treasury strategy is embodied in a 1995 treasury management review that predates Bank of England independence, the global financial crisis, quantitative easing and the UK’s decision to leave the EU. By purchasing gilts, the Bank of England has significantly altered the risk profile of the government’s debt portfolio. Gilt maturities have increased to an average of more than 18 years, much greater than for other countries. This should reduce exposure to changes in short-term interest rates, but the Bank of England’s gilt holdings have the effect of swapping a significant proportion of this exposure back again. Higher inflation and interest rates could significantly increase interest charges, potentially putting back the government’s objective of eliminating the fiscal deficit. Higher inflation, and potentially higher interest rates too, would have a significant impact on interest charges. A 1 percentage point increase in inflation and a 1 percentage point increase in short-term interest rates would increase interest charges by around £10 billion a year.
Transcript of 9. ICAEW: debt - Election 2017 - IFS · PDF file9. ICAEW: debt Ross Campbell (ICAEW) and...
The IFS Green Budget: February 2017
270 © Institute for Fiscal Studies
9. ICAEW: debtRoss Campbell (ICAEW) and Martin Wheatcroft (on behalf of ICAEW)
Key findings
The government continues to rely on external finance to provide the funds it needs to pay for spending, for investment, and to repay existing debts as they fall due.
The government needs to raise £646 billion from external investors over the next five years. This is £11 billion more than the amount it raised over the last five years, with greater refinancing, higher government lending and lower asset sales more than offsetting a £293 billion reduction in fiscal deficits.
The government should update its treasury management objectives and strategy to ensure they are fit for purpose.
The government’s most recently published treasury strategy is embodied in a 1995 treasury management review that predates Bank of England independence, the global financial crisis, quantitative easing and the UK’s decision to leave the EU.
By purchasing gilts, the Bank of England has significantly altered the risk profile of the government’s debt portfolio.
Gilt maturities have increased to an average of more than 18 years, much greater than for other countries. This should reduce exposure to changes in short-term interest rates, but the Bank of England’s gilt holdings have the effect of swapping a significant proportion of this exposure back again.
Higher inflation and interest rates could significantly increase interest charges, potentially putting back the government’s objective of eliminating the fiscal deficit.
Higher inflation, and potentially higher interest rates too, would have a significant impact on interest charges. A 1 percentage point increase in inflation and a 1 percentage point increase in short-term interest rates would increase interest charges by around £10 billion a year.
ICAEW: debt
© Institute for Fiscal Studies 271
Scenario planning, including ‘country-level stress tests’, should be undertaken to assess the resilience of the UK to potential adverse developments in credit markets and to develop contingency plans accordingly.
Market sentiment in UK sovereign debt remains strong and the risk of investors withdrawing from credit markets appears to be very low. However, the high level of fundraising planned by the exchequer over the next five years means the UK is more exposed to adverse credit market events were they to occur.
9.1 Introduction
The UK government relies on external investors to provide it with the funding it needs. Cash to pay for spending not covered by taxes or other income, cash to invest in infrastructure and other assets, cash to lend to students and business, and cash to settle previously-incurred liabilities, including repaying existing debts as they fall due.
Over the last five years, the government has raised £635 billion from external investors, substantially greater than the levels of funding required prior to the financial crisis. Despite reduced fiscal deficits, it needs to raise even more over the next five years.
The job of issuing new debt falls to the Debt Management Office (DMO), the executive agency responsible for central government debt and cash management. It operates within an annual remit from HM Treasury, in line with a strategy established by a review into treasury management conducted in 1995. The remit sets out total gilt sales planned and the split between index-linked and conventional gilts and between short-, medium- and long-dated gilts.
The funds raised come at a price – investors require a return on the funds they provide and the cost of servicing debt is estimated to amount to £40 billion for 2016–17. Fortunately, low interest rates and low inflation have kept the government’s debt interest bill down at the same time as the total amount of debt has increased significantly.
The DMO seeks to balance the risks associated with debt with its overall objective of minimising its overall cost. However, the Bank of England’s purchases of gilts have altered that risk profile, significantly increasing the government’s exposure to changes in short-term interest rates.
Section 9.2 provides an analysis of the government’s current external debt position and how this has increased over recent years. It also looks at the cost of financing that debt and how that has changed over time.
This is followed by Section 9.3, which analyses the DMO’s plan to raise fresh funds over the next five years and how that is driven by a need to refinance existing debts. It also

The IFS Green Budget: February 2017
272 © Institute for Fiscal Studies
explains how gilt auctions are conducted and how debt is expected to start to fall in comparison with the size of the economy.
Section 9.4 looks at risks, including exposures to changes in inflation and interest rates. It considers external perception of the risks associated with investing in UK government debt, as well as discussing the need for a robust treasury management strategy in the light of global uncertainties.
Section 9.5 concludes.
9.2 Debt
Public sector net debt excluding banks (PSNDex) is the government’s preferred measure of indebtedness. It is used throughout this chapter in analysing the government’s debt position, even though it nets off some, but not all, financial assets against most, but not all, financial liabilities.1
By definition, PSNDex does not incorporate the financial liabilities or assets of the Royal Bank of Scotland. It also excludes other liabilities as discussed in Chapter 4.
Financial liabilities have increased significantly over the last decade as government spending has exceeded its income each year since the financial crisis. Figure 9.1 illustrates how net debt has increased from £524 billion a decade ago to an expected £1,725 billion at 31 March 2017.
Figure 9.1. Public sector net debt excluding banks, March 2007 to March 2017
Note: Public sector net debt excluding banks. 2017 based on forecasts in the 2016 Autumn Statement.
Source: Office for National Statistics, Debt Management Office, Bank of England, Office for Budget Responsibility.
1 The government has recently started to report a new measure in the National Accounts – ‘public sector net
financial liabilities’. This captures more liabilities than are included in public sector net debt, but then nets off a wider range of assets. At 31 December 2016, public sector net financial liabilities were estimated to be £1,520 billion compared with public sector net debt excluding banks of £1,698 billion at the same date.
0
200
400
600
800
1,000
1,200
1,400
1,600
1,800
2,000
2007 2008 2009 2010 2011 2012 2013 2014 2015 2016 2017
£ bi
llion

ICAEW: debt
© Institute for Fiscal Studies 273
Table 9.1. Public sector net debt at 31 December 2016 £ billion
Government securities 1,038
Bank of England 502
National Savings & Investments 141
Loans and other debt 92
External debt 1,773
Less: cash and other liquid financial assets
(75)
Public sector net debt (PSNDex) 1,698
Note: Government securities are shown net of both central government and Bank of England gilt holdings.
Source: Office for National Statistics, ‘Public sector finances December 2016’; Debt Management Office, Bank of England.
Table 9.1 analyses public sector net debt excluding banks at 31 December 2016.
Government securities The primary method of financing for the government is through the issue of interest-paying bonds. Known as ‘gilts’ or ‘Treasury bills’, depending on their length, they are traded on the London Stock Exchange, with financial institutions and institutional investors being the principal investors.
At 31 December 2016, there were £1,579 billion of government securities in issue, as illustrated by Figure 9.2.
Figure 9.2. Government securities at 31 December 2016
Note: Government bonds in issue, i.e. before eliminating central government and Bank of England holdings.
Source: Debt Management Office.
Fixed-interest gilts £1,124bn
Index-linked gilts £388bn
Treasury bills £67bn

The IFS Green Budget: February 2017
274 © Institute for Fiscal Studies
Table 9.2. Government securities at 31 December 2016 Nominal value by maturity date
Gilts in issue
(£bn)
Central government
(£bn)
Bank of England
(£bn)
External investors
(£bn)
Treasury bills 67 0 0 67
2016–17 last quarter 29 (5) (11) 13
2017–18 to 2021–22 467 (36) (142) 289
2022–23 to 2026–27 244 (11) (49) 184
2027–28 to 2031–32 128 (16) (107) 5
2032–33 to 2036–37 148 (17) (24) 107
2037–38 to 2041–42 110 (9) (26) 75
2042–43 to 2046–47 149 (12) (27) 110
2047–48 to 2051–52 71 (3) (16) 52
2052–53 to 2056–57 66 (7) (10) 49
2057–58 onwards 100 (2) (11) 87
Total 1,579 (118) (423) 1,038
Note: Nominal amounts include inflation uplifts on index-linked gilts. Numbers in parentheses relate to cross-holdings of government debt that are eliminated in arriving at the gilts owned by external investors.
Source: Debt Management Office and Bank of England.
Table 9.2 summarises the government securities in issue at 31 December 2016 by maturity (redemption) date. They are reported at their nominal values, which are based on how much will be repaid when they mature. In the case of index-linked gilts, this includes inflation-linked uplifts accrued up until 31 December 2016.
These amounts differ from the amounts actually paid by investors to the government on issue or the amounts for which they will change hands in the market subsequently.
At 31 December 2016, there were £118 billion of government bonds owned by central government itself. These include gilts that have been issued by the DMO but have yet to be sold to investors, as well as gilts used by the DMO for operational reasons – for example, to support the Treasury in managing central government cash resources, or to support the efficient operation of gilt markets by providing additional liquidity when required.
ICAEW: debt
© Institute for Fiscal Studies 275
Box 9.1. Types of government securities
Conventional fixed-interest gilts are bonds issued for a variety of periods: short-term if they are due to be repaid within seven years of the date of issue, medium-term between seven and 15 years, and long-term if longer than 15 years. They pay interest (known as a coupon) twice a year until they mature, when the principal amount is repaid.
An example of a long-term fixed-interest gilt is the 1.75% Treasury Gilt 2037 issued by the DMO on 6 January 2017. Investors purchased these in units of £100, entitling them to coupon payments of 87.5p twice a year over the next 20 years, followed by a final payment of £100 in 2037.
These gilts were sold at an average price of £96.27, equivalent to an effective annual interest rate of 1.97% on the funds raised.
Index-linked gilts are generally issued in medium- or long-term lengths and also pay a fixed coupon twice a year between their issue and their maturity date. The principal payable when they mature is not fixed and is instead linked to the change in the Retail Prices Index (RPI) over that time.
An example of an index-linked gilt is the 0.125% Index-Linked Treasury Gilt 2046 first issued by the DMO on 13 January 2016. Each £100 gilt pays a coupon of 6.25p twice a year over its 30-year term, followed by a payment of principal equal to £100 uplifted by the increase in the RPI between 2015 and 2045.
These gilts were first sold at an average price of £128.48, equivalent to a real interest rate of –0.72%.
Treasury bills are usually issued for periods of one, three or six months. They do not pay any coupons; investors in effect receive interest in the form of the difference between the discounted price at which they are issued and the repayment on maturity.
An example is a six-month Treasury bill issued in January 2017 and due to mature on 17 July 2017. £100 Treasury bills were issued at an average discounted price of £99.91, providing a yield to investors equivalent to an annual rate of interest of 0.18%.
Bank of England The Bank of England also provides finance to the government, principally in the form of deposits owed to banks and other financial institutions – in effect, electronic money. The Bank of England pays base rate (currently 0.25%) on these deposits and so these balances currently represent a relatively cheap form of financing.
At 31 December 2016, the net amount owed to external parties by the Bank of England was £502 billion. This has increased significantly since the financial crisis as a consequence of quantitative easing, as described in Box 9.2.

The IFS Green Budget: February 2017
276 © Institute for Fiscal Studies
Box 9.2. The Bank of England, quantitative easing and printing money
In January 2009, the Bank of England set up an asset purchase facility to buy high-quality assets financed by the issuance of Treasury bills with the aim of improving liquidity in credit markets. At the same time, the government also authorised the Bank of England’s Monetary Policy Committee (MPC) to support monetary policy by purchasing financial assets in exchange for creating new deposits in the Bank of England.
The latter process is known as quantitative easing and has become a key part of the MPC’s response to the financial crisis. Its aim is to increase private sector spending in the economy and help return inflation to target.
Decisions about quantitative easing are made by the independent MPC. With continued low inflation and weak economic growth, the MPC has on several occasions increased the target for gilt purchases, with the latest being to reach £435 billion in gilt holdings by 31 March 2017.
The MPC has also extended quantitative easing beyond the purchase of gilts, with a £10 billion corporate bond purchase scheme and a ‘Term Funding Scheme’ of up to £100 billion, the aim of which is to encourage lending by providing low-cost finance for up to four years to UK banks and building societies for onward lending to businesses.
The issue of new bank deposits by the Bank of England is sometimes described as ‘printing money’, even though it still gives rise to financial liabilities on which the Bank of England has to pay interest at the bank base rate, currently 0.25%.
By purchasing gilts in this way, the Bank of England has changed the external profile of the government’s debt, reducing the amount owed to external investors in gilts in exchange for a higher level of Bank of England deposits. As the overall interest rate payable on gilts is higher than the current base rate, this has the effect of saving the government money on its interest bill – in 2016–17, by approximately £13 billion. However, this has the consequence of significantly increasing the government’s exposure to movements in short-term interest rates, as discussed in Section 9.4.
At 31 December 2016, quantitative easing asset purchases amounted to £449 billion, comprising £423 billion used to fund the purchase of gilts, £5 billion used to fund the purchase of corporate bonds and £21 billion used to fund loans under the Term Funding Scheme.
Other sources of finance The government also raises funds from private investors in the UK through National Savings & Investments, a state-run savings institution. At 31 December 2016, there was £141 billion due to investors in the form of tax-free deposit accounts, savings certificates and premium bonds.
These can be analysed as shown in Figure 9.3, which shows the position at 31 March 2016 when balances totalled £135 billion.

ICAEW: debt
© Institute for Fiscal Studies 277
Figure 9.3. National Savings & Investments at 31 March 2016
Source: National Savings & Investments, Product Accounts 2015–16.
Loans and other debt of £92 billion at 31 December 2016 comprise the external debts of local authorities, public corporations and other public bodies. In total, these bodies had debts amounting to £175 billion, but £83 billion of these were owed to central government and so are eliminated in arriving at the total for external debt.
Local authorities owed £21 billion to external investors and £71 billion to central government. The majority of central government lending to local government (approximately £65 billion) is for loans provided by the Public Works Loan Board to support infrastructure projects.
Public corporations, which include Network Rail and housing associations, had debts of £83 billion at 31 December 2016, of which £12 billion was due to central government. Amounts owed to external parties included corporate bonds as well as bank loans and other forms of finance.
Investors The primary investors in gilts are domestic institutional investors, as shown in Figure 9.4. Overseas investors account for a little more than a third of the total.
Insurance companies and pension funds are major investors in government securities, particularly in index-linked gilts. The benefit of owning index-linked gilts is the protection they provide against inflation, which can be matched against liabilities that are also linked to inflation, such as pension obligations.
There is high demand for index-linked gilts as, with the exception of index-linked corporate bonds issued by price-regulated utilities, there are only a small number of alternative investments available with similar characteristics. This high level of demand is likely to continue for the near to medium term as defined benefit pension schemes in particular continue to seek to hedge their exposures to inflation. However, changes in the pension arrangements for younger generations mean that demand for index-linked gilts in future decades may reduce.
Premium bonds £62bn
Savings certificates £28bn
Income bonds £14bn
65+ growth bonds £10bn
Direct saver £7bn
Guaranteed bonds £6bn
Other £8bn

The IFS Green Budget: February 2017
278 © Institute for Fiscal Studies
Figure 9.4. Gilt investor composition at 30 June 2016
Source: Debt Management Office, Quarterly Report September 2016, adjusted to exclude Bank of England gilt holdings.
Interest on debt The rate of interest actually paid by the government depends on market rates at the date bonds are issued, and also on the length of time for which money is borrowed. This is because investors will generally want to be paid a higher rate of interest to tie up their money for longer, while borrowers will be prepared to pay more to secure longer-term funding.
Table 9.3 provides details of recent interest rates available to investors in government securities or in Bank of England deposits.
It is important to understand that the effective interest rate actually paid by the government reflects interest rates prevailing at the time government securities were originally issued. For a Treasury bill that might be only a month or two ago, but for older long-term gilts the interest rate being paid today would have been set more than a decade ago.
Yields on index-linked gilts are currently negative in real terms, with one 30-year index-linked gilt recently priced at the equivalent of a real interest rate of –1.5%.
Table 9.3. Market yields at 20 January 2017 Annualised
rate (%)
Annualised rate (%)
1-month Treasury bills 0.14% 2-year fixed-interest gilts 0.18%
3-month Treasury bills 0.24% 5-year fixed-interest gilts 0.61%
6-month Treasury bills 0.28% 10-year fixed-interest gilts 1.41%
Base rate 0.25% 30-year fixed-interest gilts 2.05%
Source: Bloomberg.
Insurance companies and pension funds 35%
Overseas investors 35%
Banks and other financial institutions 13%
Central banks 11%
Private investors 6%
ICAEW: debt
© Institute for Fiscal Studies 279
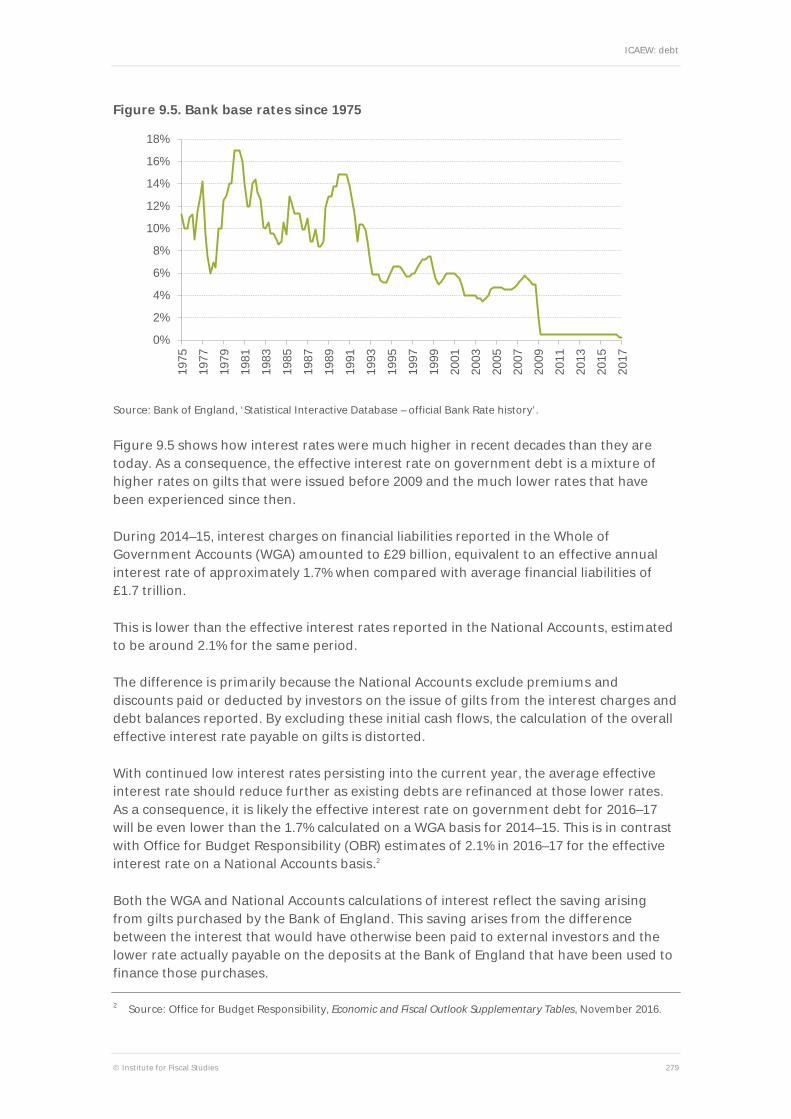
Figure 9.5. Bank base rates since 1975
Source: Bank of England, ‘Statistical Interactive Database – official Bank Rate history’.
Figure 9.5 shows how interest rates were much higher in recent decades than they are today. As a consequence, the effective interest rate on government debt is a mixture of higher rates on gilts that were issued before 2009 and the much lower rates that have been experienced since then.
During 2014–15, interest charges on financial liabilities reported in the Whole of Government Accounts (WGA) amounted to £29 billion, equivalent to an effective annual interest rate of approximately 1.7% when compared with average financial liabilities of £1.7 trillion.
This is lower than the effective interest rates reported in the National Accounts, estimated to be around 2.1% for the same period.
The difference is primarily because the National Accounts exclude premiums and discounts paid or deducted by investors on the issue of gilts from the interest charges and debt balances reported. By excluding these initial cash flows, the calculation of the overall effective interest rate payable on gilts is distorted.
With continued low interest rates persisting into the current year, the average effective interest rate should reduce further as existing debts are refinanced at those lower rates. As a consequence, it is likely the effective interest rate on government debt for 2016–17 will be even lower than the 1.7% calculated on a WGA basis for 2014–15. This is in contrast with Office for Budget Responsibility (OBR) estimates of 2.1% in 2016–17 for the effective interest rate on a National Accounts basis.2
Both the WGA and National Accounts calculations of interest reflect the saving arising from gilts purchased by the Bank of England. This saving arises from the difference between the interest that would have otherwise been paid to external investors and the lower rate actually payable on the deposits at the Bank of England that have been used to finance those purchases.
2 Source: Office for Budget Responsibility, Economic and Fiscal Outlook Supplementary Tables, November 2016.
0%
2%
4%
6%
8%
10%
12%
14%
16%
18%
1975
19
77
1979
19
81
1983
19
85
1987
19
89
1991
19
93
1995
19
97
1999
20
01
2003
20
05
2007
20
09
2011
20
13
2015
20
17

The IFS Green Budget: February 2017
280 © Institute for Fiscal Studies
In 2016–17, this is expected to result in a saving of around £13 billion in interest payments, reducing interest as reported in the National Accounts from £53 billion before quantitative easing to £40 billion after taking it into account.
The saving in interest costs that the temporary quantitative easing intervention provides has been extremely helpful to the government in controlling public spending. However, this benefit will continue only for as long as the MPC deems quantitative easing to still be necessary, while in the meantime the size of the saving would be reduced significantly if bank base rates were to increase.
Funding over the last five years Over the last five years, the government has raised £635 billion in cash from external investors to finance its operations, supplemented by £175 billion in new Bank of England deposits.
Table 9.4. Funding required and cash raised over the last five years 2012–13
(£bn) 2013–14
(£bn) 2014–15
(£bn) 2015–16
(£bn) 2016–17
(£bn) Total (£bn)
Fiscal deficit (123) (104) (92) (72) (68) (459)
Government lendinga (10) (13) (14) (14) (61) (112)
Debt repayments (67) (52) (65) (70) (70) (324)
Asset disposals 14 26 11 26 2 79
Timing and otherb 21 (13) 16 (10) (8) 6
Funding required (165) (156) (144) (140) (205) (810)
Gilt salesc 93 153 126 128 87 587
National Savings 0 3 18 11 9 41
Treasury bills 0 0 0 1 6 7
External investors 93 156 144 140 102 635
Bank of England deposits
72 0 0 0 103 175
Cash raised 165 156 144 140 205 810
a Government lending in 2016–17 includes £10 billion in quantitative easing purchases of corporate bonds and £33 billion in Term Funding Scheme loans. b ‘Timing and other’ reflects differences between the ‘near cash’ fiscal deficit and actual cash movements, net changes in local authorities’ and public corporations’ debts and foreign currency reserves, as well as premiums and discounts on gilt issues. c Gilt sales are based on nominal values and are net of Bank of England purchases of gilts financed by new deposits.
Source: Office for Budget Responsibility; Debt Management Office.

ICAEW: debt
© Institute for Fiscal Studies 281
This is set out in Table 9.4, which shows the principal drivers of the funding required and the sources of cash raised.
The most significant driver of the funding requirement over the last five years was the need to pay for spending in excess of income – the fiscal deficit.
Cash was also needed to fund government lending, comprising student loans as well as loans to businesses and other organisations. This increased in 2016–17 as a consequence of an additional £43 billion in lending to businesses by the Bank of England in the form of £10 billion of corporate bond purchases and £33 billion in low-cost loans provided through the Term Funding Scheme.
The second-largest funding requirement was to repay debts, but this was partially offset by cash generated from asset disposals, principally the sale of shares and other assets of financial institutions acquired at the time of the financial crisis.
The primary means of fundraising was through the sale of gilts to external investors by the DMO, which issued £719 billion in new gilts over the five years shown in Table 9.4. This was offset by £132 billion of gilts purchased by the Bank of England that were financed by new bank deposits.
9.3 Funding over the next five years
Based on OBR forecasts published at the time of the 2016 Autumn Statement, the government needs to raise £646 billion in funding over the next five years. This is summarised in Table 9.5.
Fiscal deficits are expected to be lower than in the previous five years, but this is more than offset by an increase in the amount of debt that needs to be refinanced and by an expectation that there will be no further increase in the Bank of England’s gilt holdings.
It is likely that most of the £646 billion in funding required from external investors will be raised through issuing gilts, with the balance coming from increased lending by National Savings & Investments and through increases in the volume of Treasury bills in issue. This is £11 billion higher than the amount raised from external investors (net of quantitative easing) over the preceding five years.
Although the forecast assumes that there will be no increase in the Bank of England’s gilt holdings, it does assume that there will be purchases of gilts by the Bank of England to replace existing gilts as and when those holdings mature. This appears to be a reasonable assumption, as the MPC has indicated that quantitative easing is likely to be maintained for some time to come, and that when it is unwound this will be done at a gradual pace.
A ‘passive’ approach to unwinding quantitative easing would involve ceasing to purchase replacement gilts when existing gilts mature and using those funds to reduce Bank of England deposits instead.

The IFS Green Budget: February 2017
282 © Institute for Fiscal Studies
Table 9.5. Cash flows and planned funding over the five years to 2021–22 2017–18
(£bn) 2018–19
(£bn) 2019–20
(£bn) 2020–21
(£bn) 2021–22
(£bn) Total (£bn)
Fiscal deficit (59) (47) (22) (21) (17) (166)
Government lending (73) (22) (22) (23) (25) (165)
Debt repayments (80) (67) (93) (97) (79) (416)
Asset disposals 23 7 3 2 - 35
Timing and other 3 3 5 - 3 14
Funding required (186) (126) (129) (139) (118) (698)
External investors 134 126 129 139 118 646
Bank of England deposits
52 0 0 0 0 52
Planned funding 186 126 129 139 118 698
Note: Government lending and debt repayments are shown net of repayments of £31 billion and £54 billion in 2020–21 and 2021–22 respectively under the Term Funding Scheme. Projected asset disposals include £2 billion from sales of Lloyds shares, £21 billion from sales of former Northern Rock and Bradford & Bingley loan books and £12 billion from sales of student loans. Amounts shown exclude Bank of England corporate bond purchase and Term Funding schemes.
Source: Office for Budget Responsibility and Debt Management Office.
This contrasts with a more active process of unwinding quantitative easing (QE) involving the sale of gilts by the Bank of England, repaying Bank of England depositors by increasing the funds to be obtained from external investors.
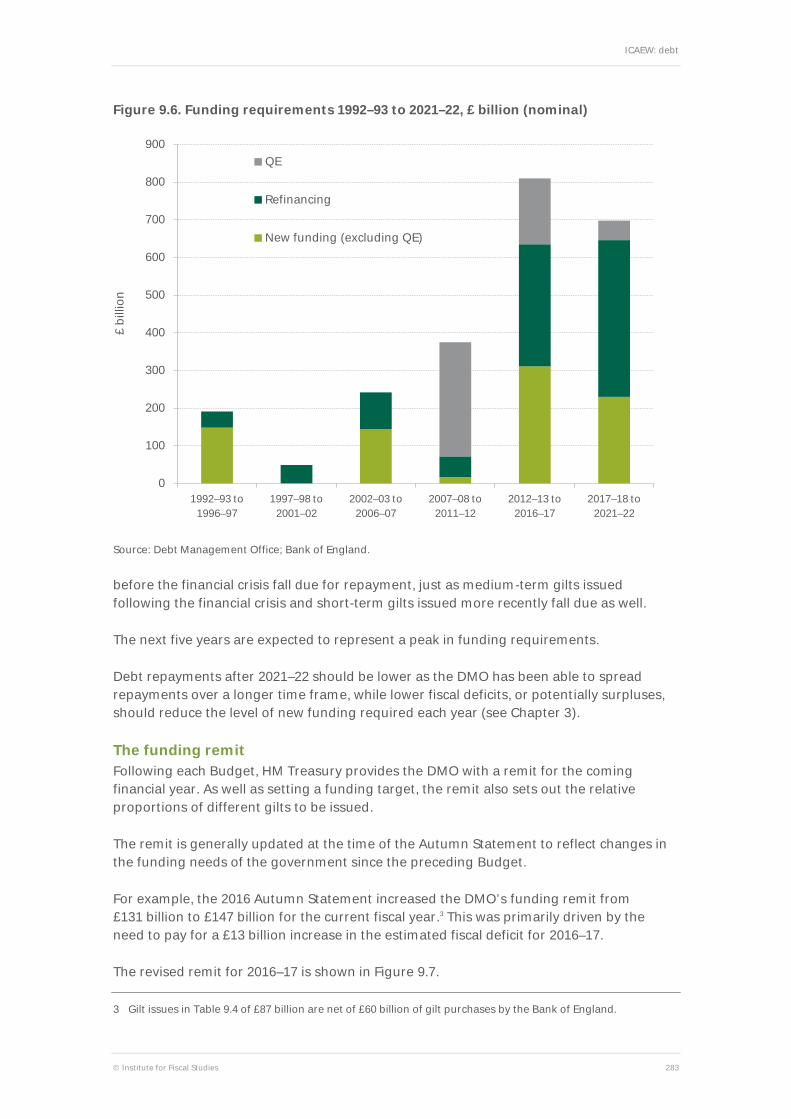
Figure 9.6 illustrates how funding requirements have increased significantly over the last 25 years since 1992.
Fiscal deficits in the five-year period from 1992–93 to 1996–97 were followed by an overall net surplus in the following five years up to 2001–02. This pattern was reversed in the next five years, with increased spending combined with an increased need to refinance the borrowing a decade earlier driving a relatively high funding requirement in the period to 2006–07.
The financial crisis in 2008 resulted in historically large deficits in the five years from 2007–08 to 2011–12. However, as proceeds received by the DMO from investors from the sale of gilts were offset by payments made by the Bank of England to external investors for the purchase of gilts, the net new funding obtained from external investors was relatively small in comparison with the amount provided by Bank of England depositors.
The higher level of funding required in the next five years, to 2016–17, is driven by a combination of factors. As well as continuing to need to fund fiscal deficits, there is a greater refinancing requirement as a coincidence of timing as long-term gilts issued
ICAEW: debt
© Institute for Fiscal Studies 283
Figure 9.6. Funding requirements 1992–93 to 2021–22, £ billion (nominal)
Source: Debt Management Office; Bank of England.
before the financial crisis fall due for repayment, just as medium-term gilts issued following the financial crisis and short-term gilts issued more recently fall due as well.
The next five years are expected to represent a peak in funding requirements.
Debt repayments after 2021–22 should be lower as the DMO has been able to spread repayments over a longer time frame, while lower fiscal deficits, or potentially surpluses, should reduce the level of new funding required each year (see Chapter 3).
The funding remit Following each Budget, HM Treasury provides the DMO with a remit for the coming financial year. As well as setting a funding target, the remit also sets out the relative proportions of different gilts to be issued.
The remit is generally updated at the time of the Autumn Statement to reflect changes in the funding needs of the government since the preceding Budget.
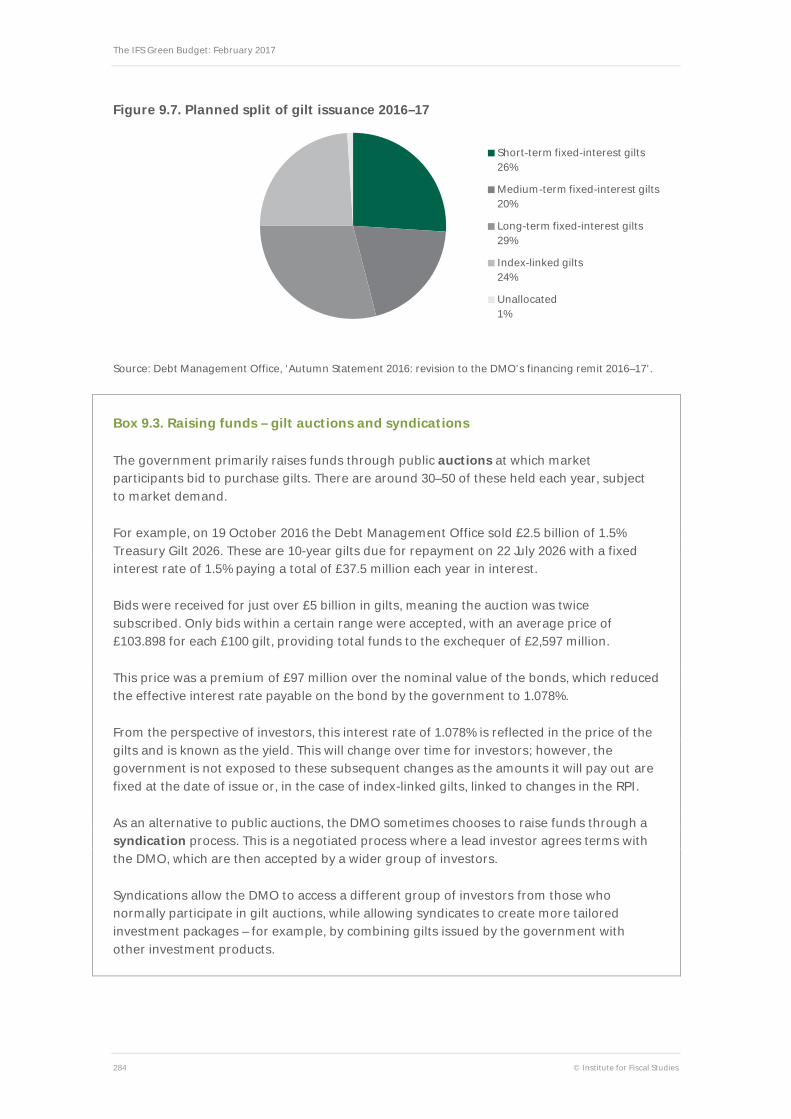
For example, the 2016 Autumn Statement increased the DMO’s funding remit from £131 billion to £147 billion for the current fiscal year.3 This was primarily driven by the need to pay for a £13 billion increase in the estimated fiscal deficit for 2016–17.
The revised remit for 2016–17 is shown in Figure 9.7.
3 Gilt issues in Table 9.4 of £87 billion are net of £60 billion of gilt purchases by the Bank of England.
0
100
200
300
400
500
600
700
800
900
1992–93 to 1996–97
1997–98 to 2001–02
2002–03 to 2006–07
2007–08 to 2011–12
2012–13 to 2016–17
2017–18 to 2021–22
£ bi
llion
QE
Refinancing
New funding (excluding QE)
The IFS Green Budget: February 2017
284 © Institute for Fiscal Studies
Figure 9.7. Planned split of gilt issuance 2016–17
Source: Debt Management Office, ‘Autumn Statement 2016: revision to the DMO’s financing remit 2016–17’.
Box 9.3. Raising funds – gilt auctions and syndications
The government primarily raises funds through public auctions at which market participants bid to purchase gilts. There are around 30–50 of these held each year, subject to market demand.
For example, on 19 October 2016 the Debt Management Office sold £2.5 billion of 1.5% Treasury Gilt 2026. These are 10-year gilts due for repayment on 22 July 2026 with a fixed interest rate of 1.5% paying a total of £37.5 million each year in interest.
Bids were received for just over £5 billion in gilts, meaning the auction was twice subscribed. Only bids within a certain range were accepted, with an average price of £103.898 for each £100 gilt, providing total funds to the exchequer of £2,597 million.
This price was a premium of £97 million over the nominal value of the bonds, which reduced the effective interest rate payable on the bond by the government to 1.078%.
From the perspective of investors, this interest rate of 1.078% is reflected in the price of the gilts and is known as the yield. This will change over time for investors; however, the government is not exposed to these subsequent changes as the amounts it will pay out are fixed at the date of issue or, in the case of index-linked gilts, linked to changes in the RPI.
As an alternative to public auctions, the DMO sometimes chooses to raise funds through a syndication process. This is a negotiated process where a lead investor agrees terms with the DMO, which are then accepted by a wider group of investors.
Syndications allow the DMO to access a different group of investors from those who normally participate in gilt auctions, while allowing syndicates to create more tailored investment packages – for example, by combining gilts issued by the government with other investment products.
Short-term fixed-interest gilts 26%
Medium-term fixed-interest gilts 20%
Long-term fixed-interest gilts 29%
Index-linked gilts 24%
Unallocated 1%

ICAEW: debt
© Institute for Fiscal Studies 285
A similar remit is expected to be published with the 2017 Budget in March, setting out the proportions of different types of gilts that the DMO will need to plan to issue in 2017–18. It will also indicate the balance between issuing gilts through auctions and syndications respectively, as described in Box 9.3.
These proportions are primarily intended to balance the government’s exposure between short- and long-term interest rates and to inflation risk, as well as to spread future repayments over time. This is to minimise the refinancing requirements in any one particular year.
The DMO also takes account of anticipated market demand that could drive cheaper financing opportunities.
The proportions of different gilts selected over time have had the consequence of changing the maturity profile of the external debt portfolio as it is refinanced. For example, the maturity profile will lengthen as short-term fixed-interest gilts repaid this year are replaced by medium- and long-term gilts in a ratio of 3 to 1. This reflects the greater proportion of short-term debt that is currently being refinanced.
A further factor is that the DMO has taken advantage of favourable market conditions to increase the length of both long-term gilts and index-linked gilts, locking in very low nominal or real interest rates for periods of up to 50 years.
Over the last decade, a combination of these approaches has had the effect of increasing the average maturity of gilts in issue up to around 18 years at 30 September 2016.
The effect this has on refinancing risk and on the government’s external interest rate profile is discussed further in Section 9.4.
Public sector net debt While refinancing debt does not increase the overall total amount owed to external investors, the new funding required to pay for public spending and increased government lending will result in an increase in public sector net debt over the next five years.
The effect of this increase is summarised in Table 9.6, which highlights how public sector net debt excluding banks is expected to reach almost £2 trillion by March 2022.
Lower fiscal deficits are expected to result in a slower rate of growth in public sector debt over the next five years than has been seen over the past decade. In comparison with the overall size of the economy, it is expected to peak at 90.2% of GDP at 31 March 2018 and to fall thereafter.
The Term Funding Scheme has the effect of increasing public sector net debt as it is used to fund new loans, which is then reversed as those loans are repaid four years later. As a consequence, the forecast peak in public sector net debt excluding banks as a share of GDP is exaggerated as is the subsequent fall.
The expected peak in public sector net debt as a proportion of GDP has now moved several times, with expectations being revised in successive fiscal events due to poorer-than-expected performance of the economy. An example is the March 2015 Budget, which

The IFS Green Budget: February 2017
286 © Institute for Fiscal Studies
Table 9.6. Projected public sector net debt over the next five years PSNDex March
2017 (£bn)
March 2018 (£bn)
March 2019 (£bn)
March 2020 (£bn)
March 2021 (£bn)
March 2022 (£bn)
Excluding Term Funding Scheme
1,692 1,755 1,819 1,860 1,898 1,952
Term Funding Scheme
33 85 85 85 52 0
PSNDex 1,725 1,840 1,904 1,945 1,950 1,952
PSNDex exc. Term Funding Scheme / GDP
85.7% 86.0% 85.7% 84.2% 82.5% 81.6%
PSNDex / GDP 87.3% 90.2% 89.7% 88.0% 84.8% 81.6%
Source: Office for Budget Responsibility.
predicted that debt would start to fall as a proportion of GDP over the course of 2015–16. Whether the most recent forecast of a fall over the course of 2018–19 will be achieved is subject to some uncertainty, at least on a basis excluding the Term Funding Scheme.
9.4 Strategy and risks
The outlook remains negative, reflecting the continued institutional and economic uncertainty surrounding Brexit negotiations, and what arrangements will emerge post-departure. We also see heightened risks of a deterioration in external financing conditions in light of the UK's high gross external financing requirements.
Standard & Poor’s, 28 October 2016
Debt management strategy The government’s current strategy for raising and managing debt was established in a debt management review conducted in 1995. It is based on an overall objective for debt management, which is ‘to minimize over the long term the cost of meeting the government’s financing needs, taking account of risk, whilst ensuring that debt management policy is consistent with monetary policy’.
The strategy established by the review emphasised the importance of maintaining a strong and liquid gilt market that remains open and available for the government to be able to raise new debt as required. It also sets out a principle that the government should seek to balance exposures between short-term interest rates, long-term interest rates and inflation.
To support the operation of efficient gilt markets, the review sets out how the government should issue debt in a predictable way, on a ‘no surprises’ basis. In order to achieve this, the DMO communicates planned funding requirements well in advance and conducts

ICAEW: debt
© Institute for Fiscal Studies 287
auctions and syndications in a transparent manner – for example, by publishing details of bids received following each auction.
The planned funding requirement for each year is set out in an annual debt management report published by HM Treasury at each Budget. This provides a remit for the DMO for the coming year, including the amounts to be raised, the proportion of different types of gilts to be issued and the balance between auctions and syndications.
The 1995 debt management review was written before the establishment of the DMO in 1998, which was necessitated as a consequence of the decision to grant operational independence to the Bank of England in 1997. However, HM Treasury concluded at the time that the approach set out in the 1995 debt management review remained appropriate and this was reconfirmed in a strategic ‘landscape’ review in 2003–04.
A Treasury Committee briefing by the National Audit Office in 2007 concluded that the DMO’s activities were consistent with debt management objectives and with International Monetary Fund (IMF) guidance, but made a number of recommendations on how the DMO could improve the measurement and reporting of its performance.
However, no reviews appear to have been conducted since the financial crisis in 2008 and the significant increase in the government’s indebtedness since then.
With the UK having voted to leave the European Union, now may be a good time to review the government’s approach to debt management to ensure that it is robust in the face of increased economic uncertainty.
Sources of funding As a sovereign debt issuer, the government has a theoretically unlimited ‘credit line’ available to it in the form of the Bank of England’s ability to print money by creating new bank deposits. However, if used for non-monetary-policy reasons, this could have adverse economic consequences, and so in practice the government seeks to obtain the funds it needs by borrowing.
The most effective and cheapest way to borrow money is to do so directly from debt investors. Hence the primary routes through which the government seeks to raise funds are by selling government securities directly to institutional and other debt investors and by taking deposits directly from retail investors.
Local government’s more limited funding requirements are in most cases funded in the same way, with funds obtained through gilt markets supplied to local authorities through Public Works Board and other loans. A limited number of other public bodies, such as Network Rail, have obtained bank loans and issued their own corporate bonds, but these are generally at effective interest rates that are much lower than those available to non-publicly-owned entities.
The government has used Private Finance Initiative (PFI) arrangements to provide funds for the building of schools, hospitals and other assets. These are a more expensive form of financing, which has been justified by government on the basis of the risks assumed by PFI providers as part of these arrangements.
The IFS Green Budget: February 2017
288 © Institute for Fiscal Studies
Liquidity In order to ensure cash is available as required to fund government activities and to repay debts as and when they fall due, the DMO seeks to ensure that there is an open and effective market for government securities.
It does this by offering gilts that are attractive to investors, by conducting operations in a transparent fashion, and by supporting an efficient market – for example, by purchasing or selling gilts on a daily basis in order to provide liquidity to investors. Together these actions are designed to provide confidence to investors to purchase gilts as a safe haven investment and so to continue to keep gilt markets open to the government.
There is no obligation on debt investors to continue to lend to the government, and so the DMO seeks to ensure that gilts continue to be attractive – for example, by ensuring gilts are classified as high investment grade, so that institutional investors that limit their exposure to riskier forms of investment can continue to invest.
The DMO also aims to limit the risk of oversupply by minimising the amount that needs to be refinanced at any one point in time. For example, by spreading out maturity dates over a longer period, the DMO has sought to minimise the refinancing required each year, with substantially reduced refinancing requirements from 2022–23 onwards.
In addition, the DMO has sought to ensure that only a relatively small proportion of overall debt is repayable on demand or needs to be refinanced within the very near term. For example, many National Savings & Investments products are repayable on demand, while Treasury bills need to be refinanced every month, three months or six months. In each case, the amount of exposure is relatively small in the context of the overall volume of debt outstanding.
Despite those actions, investors do have choices and there remains the possibility that if demand falls then interest rates would need to rise to make gilts more attractive. Alternatively, the government could seek to obtain finance from other sources, such as syndicated bank loans. In each case, this would likely involve paying more to obtain funding than is possible today.
Maturity profile The choice made by the DMO over the length of the bonds it issues is one of the key drivers in determining the cost of debt and the level of refinancing required each year. Box 9.4 explains some of the trade-offs made by the DMO in deciding between short-term and long-term finance.
Over the last decade, the DMO has adopted a policy of increasing the length of the gilts it issues.
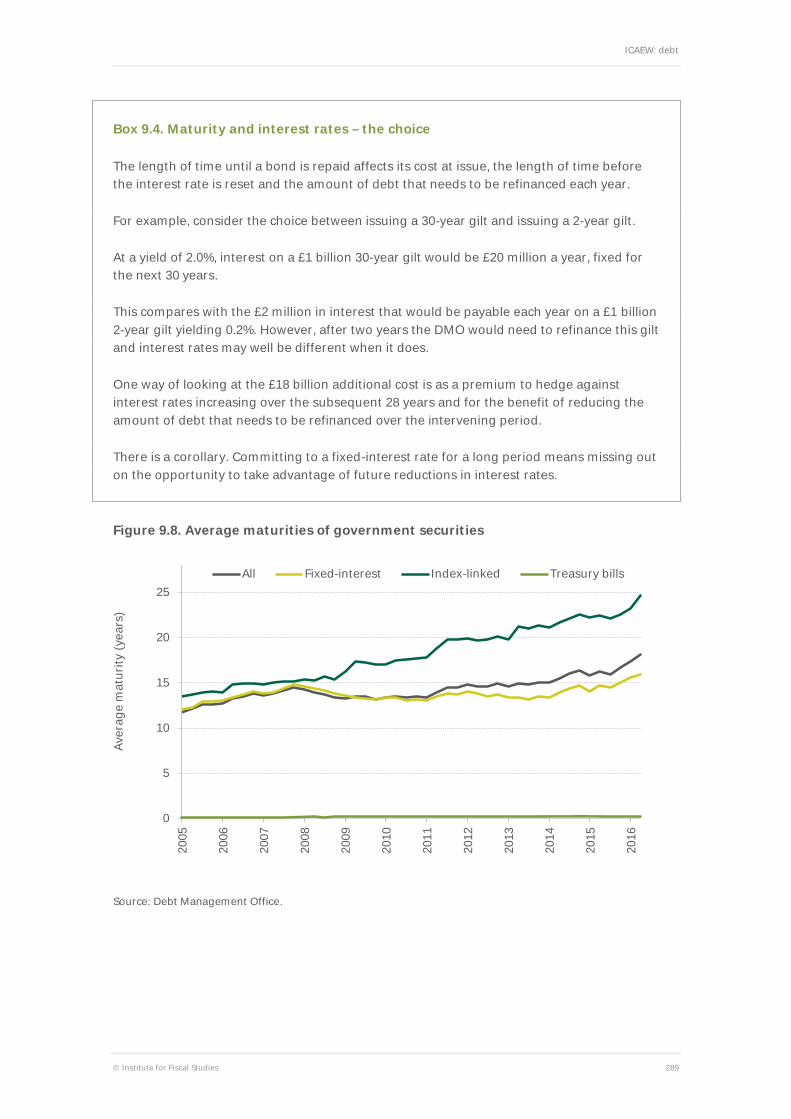
As a consequence, average maturities of government securities increased from 11.7 years at 30 June 2005 to 18.2 years as of 30 September 2016, as illustrated by Figure 9.8. This reflects fixed-interest gilts, where maturities have increased from an average of 12.1 years to 15.9 years, and index-linked gilts, where average maturities have increased from 13.5 years to 24.7 years. Average maturities for Treasury bills increased slightly from 0.13 years to 0.21 years.
ICAEW: debt
© Institute for Fiscal Studies 289
Box 9.4. Maturity and interest rates – the choice
The length of time until a bond is repaid affects its cost at issue, the length of time before the interest rate is reset and the amount of debt that needs to be refinanced each year.
For example, consider the choice between issuing a 30-year gilt and issuing a 2-year gilt.
At a yield of 2.0%, interest on a £1 billion 30-year gilt would be £20 million a year, fixed for the next 30 years.
This compares with the £2 million in interest that would be payable each year on a £1 billion 2-year gilt yielding 0.2%. However, after two years the DMO would need to refinance this gilt and interest rates may well be different when it does.
One way of looking at the £18 billion additional cost is as a premium to hedge against interest rates increasing over the subsequent 28 years and for the benefit of reducing the amount of debt that needs to be refinanced over the intervening period.
There is a corollary. Committing to a fixed-interest rate for a long period means missing out on the opportunity to take advantage of future reductions in interest rates.
Figure 9.8. Average maturities of government securities
Source: Debt Management Office.
0
5
10
15
20
25
2005
2006
2007
2008
2009
2010
2011
2012
2013
2014
2015
2016
Aver
age
mat
urity
(yea
rs)
All Fixed-interest Index-linked Treasury bills
The IFS Green Budget: February 2017
290 © Institute for Fiscal Studies
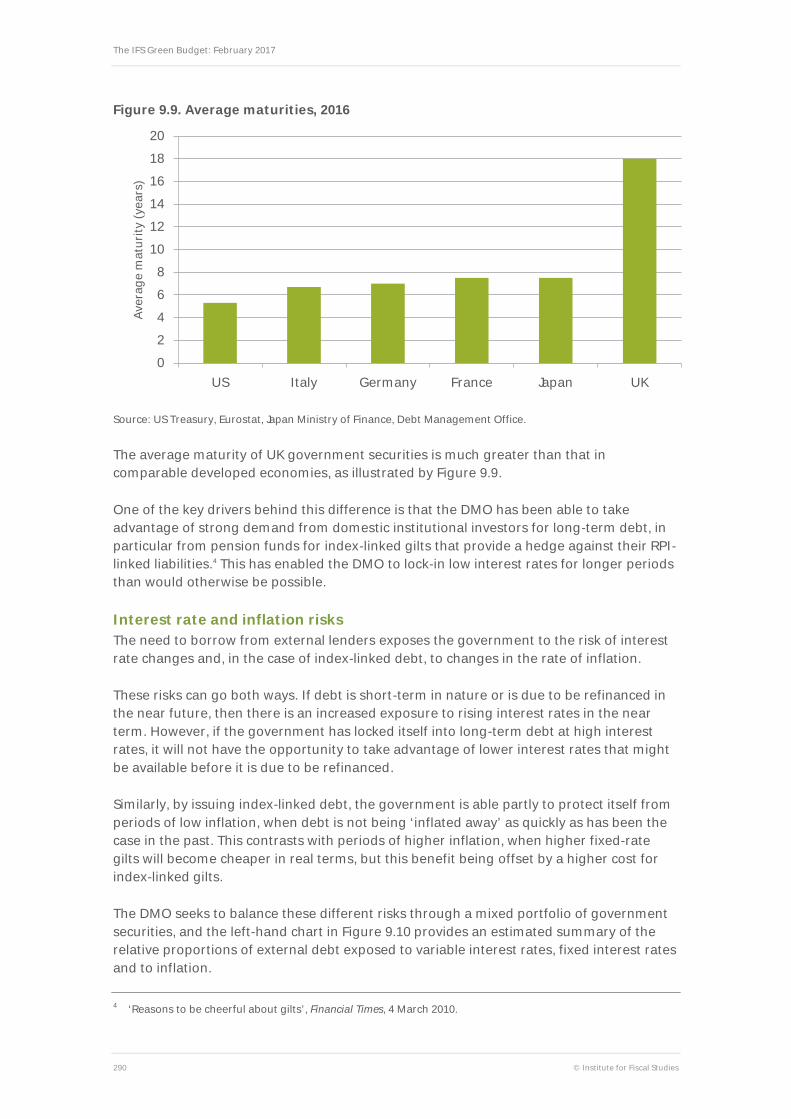
Figure 9.9. Average maturities, 2016
Source: US Treasury, Eurostat, Japan Ministry of Finance, Debt Management Office.
The average maturity of UK government securities is much greater than that in comparable developed economies, as illustrated by Figure 9.9.
One of the key drivers behind this difference is that the DMO has been able to take advantage of strong demand from domestic institutional investors for long-term debt, in particular from pension funds for index-linked gilts that provide a hedge against their RPI-linked liabilities.4 This has enabled the DMO to lock-in low interest rates for longer periods than would otherwise be possible.
Interest rate and inflation risks The need to borrow from external lenders exposes the government to the risk of interest rate changes and, in the case of index-linked debt, to changes in the rate of inflation.
These risks can go both ways. If debt is short-term in nature or is due to be refinanced in the near future, then there is an increased exposure to rising interest rates in the near term. However, if the government has locked itself into long-term debt at high interest rates, it will not have the opportunity to take advantage of lower interest rates that might be available before it is due to be refinanced.
Similarly, by issuing index-linked debt, the government is able partly to protect itself from periods of low inflation, when debt is not being ‘inflated away’ as quickly as has been the case in the past. This contrasts with periods of higher inflation, when higher fixed-rate gilts will become cheaper in real terms, but this benefit being offset by a higher cost for index-linked gilts.
The DMO seeks to balance these different risks through a mixed portfolio of government securities, and the left-hand chart in Figure 9.10 provides an estimated summary of the relative proportions of external debt exposed to variable interest rates, fixed interest rates and to inflation.
4 ‘Reasons to be cheerful about gilts’, Financial Times, 4 March 2010.
0 2 4 6 8
10 12 14 16 18 20
US Italy Germany France Japan UK
Aver
age
mat
urity
(yea
rs)

ICAEW: debt
© Institute for Fiscal Studies 291
Figure 9.10. Exposure profile, before and after Bank of England gilt holdings
Note: Variable exposure for this purpose is defined as exposure to Treasury bills, ‘ultra-short’ fixed-interest gilts with maturities of less than three years, or to bank base rates.
Source: Debt Management Office, Office for National Statistics, National Savings & Investments, Bank of England; ICAEW calculations.
The right-hand chart reflects how this profile is changed by the Bank of England’s gilt holdings, which replace gilts owned by external investors with deposits paying the bank base rate. This is very similar to an interest rate swap, which, in the case of the government, has been executed by an operationally independent Bank of England.
In practice, this swap in interest rate exposures is currently benefiting the exchequer by replacing higher rates payable on gilts for the much lower bank base rate.
However, this comes with a significant sensitivity to changes in base rates. For example, in November 2016, the OBR decreased its forecast for debt interest in 2020–21 by £3.5 billion
Table 9.7. OBR debt interest ‘ready reckoner’, change in £ billion 2016–17
(£bn) 2017–18
(£bn) 2018–19
(£bn) 2019–20
(£bn) 2020–21
(£bn) 2021–22
(£bn)
1ppt increase in gilt rates 0.6 1.6 2.5 3.4 4.3 5.2
1ppt increase in short rates 5.3 5.6 5.6 5.6 5.6 5.6
1ppt increase in inflation 3.6 4.3 4.8 5.5 5.9 6.8
£5bn more borrowing 0.0 0.1 0.2 0.2 0.3 0.5
Assumed gilt rates 1.2% 1.3% 1.5% 1.6% 1.8% 1.9%
Assumed short rates 0.4% 0.3% 0.5% 0.6% 0.8% 1.0%
Assumed RPI 2.0% 3.2% 3.5% 3.1% 3.2% 3.2%
Note: Increases are assumed to commence at the start of 2016–17 and continue throughout the forecast period. Short rates are for three-month LIBOR.
Source: Office for Budget Responsibility, Economic and Fiscal Outlook Supplementary Fiscal Tables, November 2016.
Variable 23%
RPI 21%
Fixed 56%
Variable 42%
RPI 21%
Fixed 37%

The IFS Green Budget: February 2017
292 © Institute for Fiscal Studies
to reflect the reduction in base rate from 0.5% to 0.25%.5 If the MPC were to increase the base rate, the consequence would be an increase in debt interest.
The OBR provides a debt interest ‘ready reckoner’ to allow the effect of interest rates and inflation on debt interest costs to be understood, as shown in Table 9.7. This illustrates how an increase in gilt rates above the rates included in the OBR’s forecasts would result in a gradual increase in debt interest as existing debts are refinanced, while changes in short rates and inflation would have a more immediate impact.
The OBR uses the term ‘short rates’ in this context to refer to commercial lending rates represented by three-month London Interbank Borrowing Rate (LIBOR), which is influenced by the bank base rate as well as by yields on Treasury bills and gilts.
Credit ratings For many debt issuers, credit ratings are an important factor in the effective interest rates that can be obtained. These provide debt investors with a framework within which they can assess, manage and price their credit risk exposures. This is reflected within the investment profiles of institutional investors, which typically will limit the proportion of the funds they will put into riskier investments, based on the assessments of one or more of the credit rating agencies.
For sovereign debt issuers, credit ratings are less relevant, particularly in the case of developed economies where downgrades in credit ratings do not necessarily result in higher effective interest rates for the countries concerned. The UK is a good example of this, as although three of the main credit rating agencies no longer rate UK sovereign debt as AAA, the UK continues to be able to obtain finance at very low interest rates and gilt auctions and syndications are oversubscribed.
Credit rating agencies generally rate debt issuers on a 24-point scale, from C (close to default) to AAA (prime) depending on their assessment of the credit risks to debt investors in lending money to the organisations concerned. The top 10 ratings from BBB– to AAA are described as ‘investment grade’, while the top four from AA– to AAA are described as ‘high investment grade’.
Although credit ratings appear to have less influence over the pricing of and demand for government debt, there may be an exception to this. Many institutional investors limit the
Table 9.8. Credit ratings for UK government debt Agency Rating Outlook Rating scale position
(C = 24, BB = 12, AAA = 1)
DBRS AAA Stable 1
Fitch AA+ Negative 2
Moody’s Aa1 Negative 2
Standard & Poor’s AA Negative 3
Source: Fitch, Moody’s, Standard & Poor’s and DBRS.
5 Page 168 of Office for Budget Responsibility, Economic and Fiscal Outlook: November 2016.
ICAEW: debt
© Institute for Fiscal Studies 293
amount they will invest in debts rated below high investment grade, and so a downgrade to A+ or below might reduce the demand for government securities from such investors, especially if they are from overseas.
Credit default swaps Market sentiment remains positive towards UK government securities.
This view is supported by the current price of credit default swaps (CDSs), which are one of the most widely used forms of credit derivatives. They pay out in the event of a negative credit event or default, such as a failure to repay debt on time or where less is paid back than the full amount due. The seller of a credit default swap agrees to step in and pay in full the interest and principal that should have been paid by the defaulting borrower, in exchange for receiving any payments (if any) still being made. In certain circumstances, credit default swaps may instead be settled for a single cash payment, based on market values at the date of default.
For debt investors, credit default swaps provide an insurance policy – protecting them from the risk that they may not receive all of the interest and principal that they are due, in exchange for a premium in the form of the purchase price for a credit default swap contract.
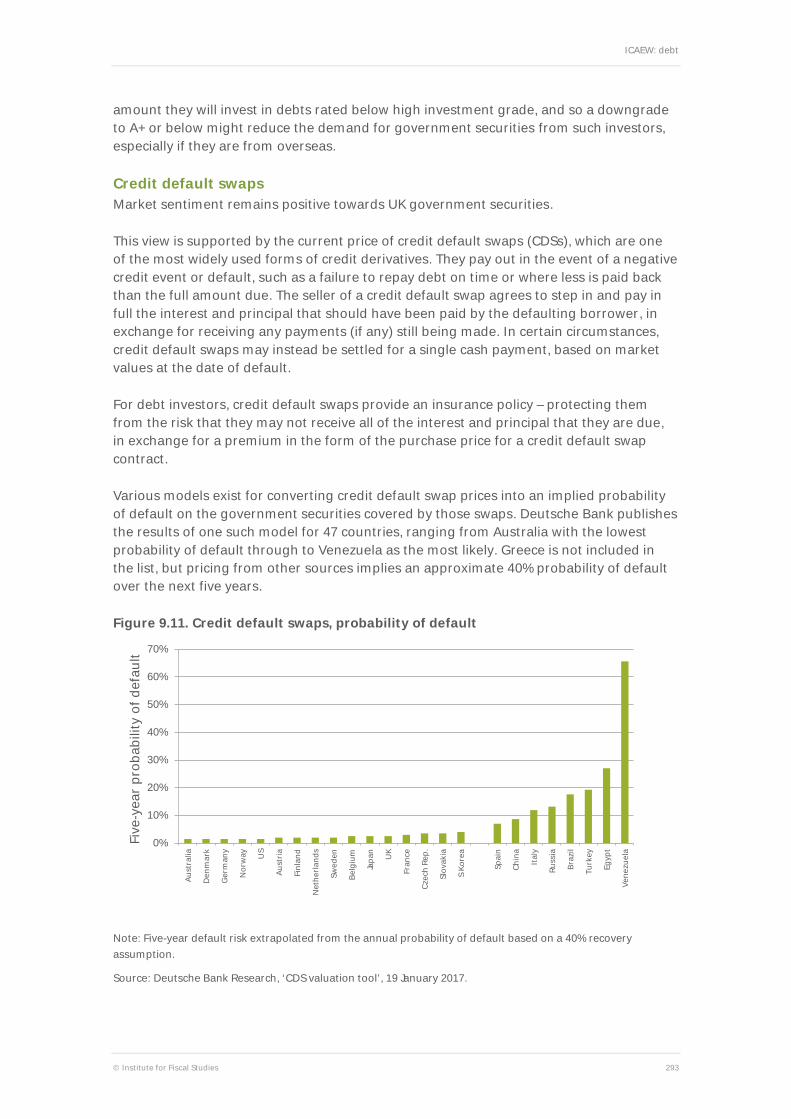
Various models exist for converting credit default swap prices into an implied probability of default on the government securities covered by those swaps. Deutsche Bank publishes the results of one such model for 47 countries, ranging from Australia with the lowest probability of default through to Venezuela as the most likely. Greece is not included in the list, but pricing from other sources implies an approximate 40% probability of default over the next five years.
Figure 9.11. Credit default swaps, probability of default
Note: Five-year default risk extrapolated from the annual probability of default based on a 40% recovery assumption.
Source: Deutsche Bank Research, ‘CDS valuation tool’, 19 January 2017.
0%
10%
20%
30%
40%
50%
60%
70%
Aust
ralia
Denm
ark
Ger
man
y
Nor
way
US
Aust
ria
Finl
and
Net
herla
nds
Swed
en
Belg
ium
Japa
n
UK
Fran
ce
Czec
h Re
p.
Slov
akia
S Ko
rea
Spai
n
Chin
a
Italy
Russ
ia
Braz
il
Turk
ey
Egyp
t
Vene
zuel
a
Five
-yea
r pro
babi
lity
of d
efau
lt

The IFS Green Budget: February 2017
294 © Institute for Fiscal Studies
Figure 9.11 summarises the implied probability of default for the top 16 countries in the Deutsche Bank Research analysis, together with selected other countries.
The UK’s position at 12th in the list, with an implied five-year probability of default of 2.5% or 1 in 40, reflects the market view of the UK as a relatively safe place to invest, with only 11 other countries seen to be safer.6
These prices relate to five-year swaps and so do not reflect longer-term risks that could affect the UK economy and its ability to pay its debts. However, they do encompass the immediate fundraising peak expected over the next five years, providing an indication that current market sentiment is positive towards UK government securities.
9.5 Conclusion
Market confidence remains strong Although credit rating agencies are cautious given the scale of funding needing to be raised over the next five years, market sentiment remains strong towards investing in UK government securities.
Retaining that market confidence is important as the government faces the challenge of continuing to raise substantial sums from investors at the same time as executing a successful departure from the European Union and negotiating new trading arrangements with other nations. Other factors, such as instability in the eurozone and continuing conflict in the Middle East, may also increase global economic and political uncertainty.
Quantitative easing has a significant effect on interest rate risk The DMO’s objective of balancing exposures to interest rates and to inflation has seen it increase the average maturity of gilts in issue, taking advantage of low interest rates as it has refinanced debt over the last five years. It has the opportunity to do the same over the next five years.
However, the effect of quantitative easing is to swap a substantial proportion of that profile into an exposure to bank base rates.
This has benefited the government over the last few years as bank base rates have been so low, but this is at a consequence of a much higher immediate exposure to changes in interest rates.
An omission from recent debt management reports is any consideration of the impact of the Bank of England’s quantitative easing programme on the government’s overall debt risk profile.
It may be that it is right, for monetary policy reasons, that the DMO should not attempt to counteract or mitigate the effect that quantitative easing has had on government’s overall
6 This probability is calculated based on the assumption that at least 40% of the debt investment would be recovered. The five-year probability of less serious defaults at a 60% recovery level for the UK is 3.5% or around 1 in 30, while the likelihood of more serious defaults implied by a 20% recovery level is 2.0% or around 1 in 50.
ICAEW: debt
© Institute for Fiscal Studies 295
risk exposure. However, it is important that the government addresses this as part of an up-to-date treasury management strategy.
Strategy is important The government’s objectives and debt management strategy were last fully reviewed in 1995, before operational independence was granted to the Bank of England, the financial crisis occurred and the decision was taken by the British public to leave the European Union.
The consequences of these events should be considered as part of a fresh review, which should also take account of developments in treasury management over the last 20 years since the last review.
A review should also address the need for robust scenario planning, with ‘country-level stress tests’ to consider a range of potential scenarios, including low-probability high-impact events such as a weakening in sovereign debt markets or a loss of confidence by investors in the UK.
With significant debt funding required over the next five years – a period that is expected to involve significant changes in the UK economy – having a robust treasury management strategy in place is important.