Onexamination 2012 - GENITOURINARY - (Www.mymrcp.blogspot.com)
Upload
azmal-sarkerCategory
view
312download
1description

Chapter 9
Genitourinary System
168
Since the 1950s, it has been possible to measure renal func-tion with radiopharmaceuticals. Techniques have evolved from urine counting and crude probe detectors to measure-ments of plasma clearance, dynamic functional imaging, and single-photon emission computed tomography (SPECT) cortical imaging. In recent years, some indications previously reserved for renal scintigraphy have been shifted to ultra-sound, computed tomography (CT), or magnetic resonance imaging (MRI). However, the ability to image and quantify function can provide information not available by anatomical imaging methods. Nuclear medicine techniques still provide the best problem-solving tools in many clinical situations.
Indications for renal scintigraphy (Box 9-1) include differ-entiating obstructive from nonobstructive hydronephrosis, assessing the significance of renal artery stenosis, searching for postoperative leaks, and the evaluation of infection and scarring. Quantifying differential function and assessing viability is useful in the evaluation of complications that can occur after surgery or trauma. The ability to quantify func-tion by effective renal plasma flow (ERPF) and glomerular filtration rate (GFR) can provide a better measurement of function than estimations based on serum creatinine.
Over the years, many radiopharmaceuticals have been developed to assess different aspects of renal function based on binding characteristics and clearance pathways. It is criti-cal to have a solid understanding of renal anatomy and physi-ology to perform and interpret these examinations correctly.
RENAL ANATOMY AND FUNCTION
The kidneys are responsible for regulating water and electro-lyte balance, excreting waste, secreting hormones (renin, erythropoietin), and activating vitamin D. They lie in the posterior abdomen at the level of L1-3, with the right kidney often slightly inferior to the left. The outer cortex contains the glomeruli and proximal convoluted tubules. The renal pyramids, consisting of the collecting tubules and the loops of Henle, make up the medulla. At the apex of the pyramids, papillae drain into the renal calyces. Cortical tissues between the pyramids are known as the columns of Bertin (Fig. 9-1, A).
The renal artery supplies blood flow to the kidney. End arterioles lead to tufts of capillaries forming glomeruli in the renal cortex (Fig. 9-1, B). The most proximal end of the renal tubule, Bowman capsule, surrounds the glomeru-lus. Each kidney contains more than 1 million of these basic functional units of the kidney—the nephron.
Normally, the kidneys receive 20% of cardiac output, with renal plasma flow (RPF) averaging 600 mL/min. The kidneys clear the plasma and body of waste products. The clearance, or rate of disappearance, of a substance can be measured as:
Clearance (mL/min) =Urine concentration (mg/mL) × Urine flow (mL/min)
Plasma concentration (mg/mL)
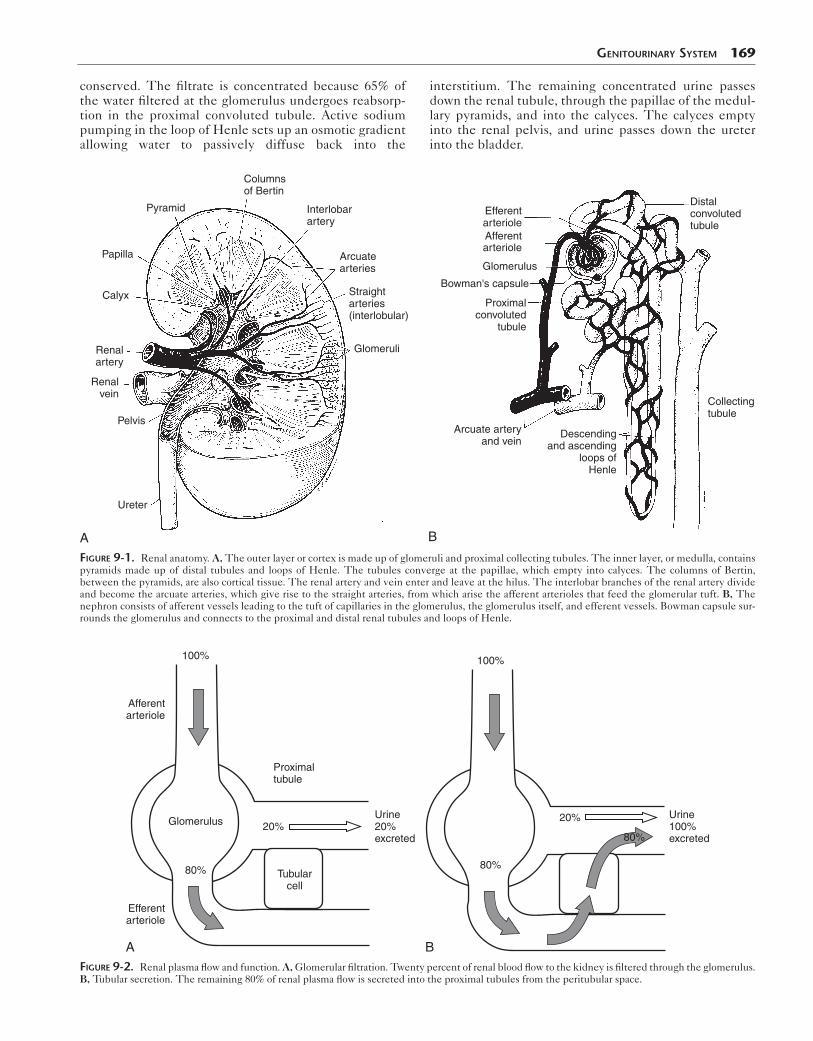
Plasma clearance occurs by glomerular filtration and tubular secretion (Fig. 9-2). If an agent undergoes 100% first-pass extraction, it can be used to measure RPF. How-ever, because the actual extraction possible clinically is less than 100%, the term effective renal plasma flow (ERPF) is used to describe the measurement.
Approximately 20% of RPF (120 mL/min) is filtered through the semipermeable membrane of the glomerulus. A pressure gradient created by the RPF and resistance in the vessel drives filtration from the vascular space into the renal tubules. Larger material, such as protein-bound com-pounds, will not be filtered, whereas small molecules with a polar charge will be filtered. The resulting ultrafiltrate consists of water and crystalloids but no colloids or cells. The molecule inulin is the gold standard for glomerular filtration measurement.
The remaining plasma moves into the efferent arteriole, where active secretion occurs at the tubular epithelial cells. Molecules that could not be filtered may be cleared into the tubular lumen by active tubular secretion. Overall, tubular secretion accounts for 80% of renal plasma clear-ance. Paraaminohippurate (PAH) is the classic method for measuring ERPF because its high extraction mirrors the distribution of RPF—20% of PAH is cleared by glomerular filtration, and 80% is secreted into the renal tubules. PAH is actively secreted by anionic transporters on the proximal convoluted tubular cell membranes. It is not metabolized or retained in the kidney and is not highly protein-bound, so plasma extraction is high. However, PAH does have some plasma protein binding so clearance is 85% to 95%.
When urine passes along the tubule, essential sub-stances such as glucose, amino acids, and sodium are
Box 9-1. Clinical Indications for Genitourinary Scintigraphy
Blood flow abnormalitiesFunction quantification
Differential functionGlomerular filtration rate, effective renal plasma flow
Mass vs. column of BertinObstruction: Uteropelvic junction, ureteralPyelonephritisRenal failure: Acute and chronicRenovascular hypertension/renal artery stenosisRenal vein thrombosisSurgical complicationsTransplant rejectionTransplant anastomosis assessmentTraumaVesicoureteral refluxVolume quantification: Bladder residual volume
conserved. The filtrate is concentrated because 65% of the water filtered at the glomerulus undergoes reabsorp-tion in the proximal convoluted tubule. Active sodium pumping in the loop of Henle sets up an osmotic gradient allowing water to passively diffuse back into the
Genitourinary SyStem 169
interstitium. The remaining concentrated urine passes down the renal tubule, through the papillae of the medul-lary pyramids, and into the calyces. The calyces empty into the renal pelvis, and urine passes down the ureter into the bladder.
Columnsof Bertin
Pyramid
Papilla
Calyx
Renalartery
Renalvein
Pelvis
Ureter
Interlobarartery
Arcuatearteries
Straightarteries(interlobular)
Glomeruli
A
Efferentarteriole
Distalconvolutedtubule
Collectingtubule
Afferentarteriole
Glomerulus
Bowman's capsule
Proximalconvoluted
tubule
Arcuate arteryand vein
Descendingand ascending
loops ofHenle
B
FiGure 9-1. Renal anatomy. A, The outer layer or cortex is made up of glomeruli and proximal collecting tubules. The inner layer, or medulla, contains pyramids made up of distal tubules and loops of Henle. The tubules converge at the papillae, which empty into calyces. The columns of Bertin, between the pyramids, are also cortical tissue. The renal artery and vein enter and leave at the hilus. The interlobar branches of the renal artery divide and become the arcuate arteries, which give rise to the straight arteries, from which arise the afferent arterioles that feed the glomerular tuft. B, The nephron consists of afferent vessels leading to the tuft of capillaries in the glomerulus, the glomerulus itself, and efferent vessels. Bowman capsule sur-rounds the glomerulus and connects to the proximal and distal renal tubules and loops of Henle.
Afferentarteriole
Efferentarteriole
100%
Glomerulus
Tubularcell
20%Urine20%excreted
80%
Proximaltubule
A
Urine100%excreted
100%
20%
80%
80%
BFiGure 9-2. Renal plasma flow and function. A, Glomerular filtration. Twenty percent of renal blood flow to the kidney is filtered through the glomerulus. B, Tubular secretion. The remaining 80% of renal plasma flow is secreted into the proximal tubules from the peritubular space.

170 Nuclear Medicine: The Requisites
RENAL RADIOPHARMACEUTICALS
Numerous radiopharmaceuticals have been developed over the years that can assess renal function, some by measuring clearance in blood samples and others by imag-ing on a gamma camera (Box 9-2). Renal radiopharmaceu-ticals are classified by their uptake and clearance mechanisms as agents for glomerular filtration, tubular secretion, or cortical binding. A list of currently important renal imaging agents is found in Table 9-1. Because of their different clearance mechanisms (Fig 9-3), character-istic renal imaging patterns vary considerably (Fig. 9-4), as do clinical protocols used.
Technetium-99m Mercaptoacetyltriglycine
In the past, iodine-131 and subsequently I-123 hippuran were used to image and quantify renal function. Hip-puran had a high first-pass extraction of 85%, but image quality was poor. Once Tc-99m mercaptoacetyltrigly-cine (MAG3) received approval from the U.S. Food and Drug Administration (FDA), it rapidly replaced hippuran.
Currently, Tc-99m MAG3 is the most commonly used renal radiopharmaceutical (Fig. 9-5). It is cleared almost entirely by tubular secretion and therefore does not measure
Box 9-2. Agents Used to Quantify Renal Function
AGENTS FOR GLOMERULAR FILTRATION RATEC-14 or H-3 inulinI-125 diatrizoateI-125 iothalamateCo-57 vitamin B12Cr-51 EDTAIn-111 or Yb-169 DTPATc-99m DTPA
AGENTS FOR EFFECTIVE RENAL PLASMA FLOWH-3 or C-14 paraaminohippurate (PAH)I-125 or I-131 iodopyracetI-123, or I-131orthoiodohippurate (hippuran)Tc-99m mercaptoacetyltriglycine (MAG3)
table 9-1 Mechanism of Uptake for Renal Scintigraphy Imaging Agents
Clearance Agent (%)
Glomerular filtration Tc-99m DTPA 100
Tubular secretion Tc-99m MAG3 100
Tubular secretion and glomerular filtration
I-131 hippuran 80 tubular
20 filtered
Cortical binding Tc-99m DMSA 40-50
DMSA, Dimercaptosuccinic acid; DTPA, diethylenetriaminepentacetic acid; MAG3, mercaptoacetyltriglycine.
GFR. The extraction efficiency is considerably higher than that of filtration agents, which results in better performance and less radiation exposure when function is compromised. Tc-99m MAG3 images show significant anatomical detail while assessing function (Figs. 9-6 and 9-7).
PharmacokineticsBecause Tc-99m MAG3 is protein-bound and not filtered, it is exclusively cleared from the kidney by tubular secre-tion. It has a much higher first-pass extraction than a glomerular filtration agent such as Tc-99m diethylenetri-aminepentacetic acid (DTPA). Plasma protein binding is 97% for Tc-99m MAG3, keeping Tc-99m MAG3 in the vascular space and improving renal target-to-background ratios compared to those of Tc-99m DTPA. However, the clearance is only about 60% that of hippuran. The alterna-tive path of Tc-99m MAG3 excretion is via the hepatobili-ary route. Liver activity and biliary tract clearance are frequently noted. The normal time to peak activity is 3 to 5 minutes, with a time to half peak (T½) of 6 to 10 min-utes. Clearance is bi-exponential, and in patients with normal renal function, 90% of the dose is cleared in 3 hours.
Technetium-99m Diethylenetriaminepentaacetic Acid
The clinical applications of Tc-99m DTPA and Tc-99m MAG3 are often interchangeable, because they can both
Glomerular filtration:51Cr-EDTA,99mTc-DTPA,125I-iothalamate
Tubular secretion:123I-OIH,131I-OIH,99mTc-MAG3
Tubular fixation:99mTc-DMSA,99mTc-glucoheptonate
Cortex
Medulla
FiGure 9-3. Different mechanisms of renal radiopharmaceutical uptake and excretion include glomerular filtration, tubular secretion, and cortical tubular binding.

examine flow and renal function. However, only Tc-99m DTPA can be used to calculate GFR. Images also differ because the higher background activity and slower clear-ance lead to inferior images in comparison with Tc-99m MAG3. In cases in which renal function is impaired, the
Genitourinary SyStem 171
difference in quality is significant, and in such cases, tar-get-to-background ratios may be so poor that no diagnostic information is gained. The lower extraction efficiency also results in higher patient radiation doses, which is particu-larly significant in cases of renal failure.
A
B
C
FiGure 9-4. Radiopharmaceutical comparison in a renal transplant patient. A, I-131 hippuran provides excellent functional information but has poor image quality compared to technetium agents. B, Tc-99m DTPA image from the same day shows higher resolution. C, Tc-99m MAG3 done 30 hours later reveals the highest level of detail as well as an improved target-to-background ratio compared to DTPA.

Renogram
Cou
nts
19,976
14,982
9,988
4,994
00 7
Time (min)
14 20 27
Left kidneyRight kidneyBladder
B
A
FiGure 9-5. Normal Tc-99m MAG3. A, Normal dynamic functional images with prompt symmetric radiotracer uptake and rapid clearance over the study. B, Normal time-activity curves with a steep uptake slope, distinct peak, and rapid clearance confirming image analysis.
A
B
FiGure 9-6. Abnormal Tc-99m MAG3 examples revealing cortical anatomic detail. A, Multiple cortical defects are seen throughout the examination from polycystic kidney disease in poorly functioning kidneys. B, Asymmetric cortical uptake, decreased on the right, with a right upper pole scar in a patient with a history of reflux and infection.
Genitourinary SyStem 173
A B
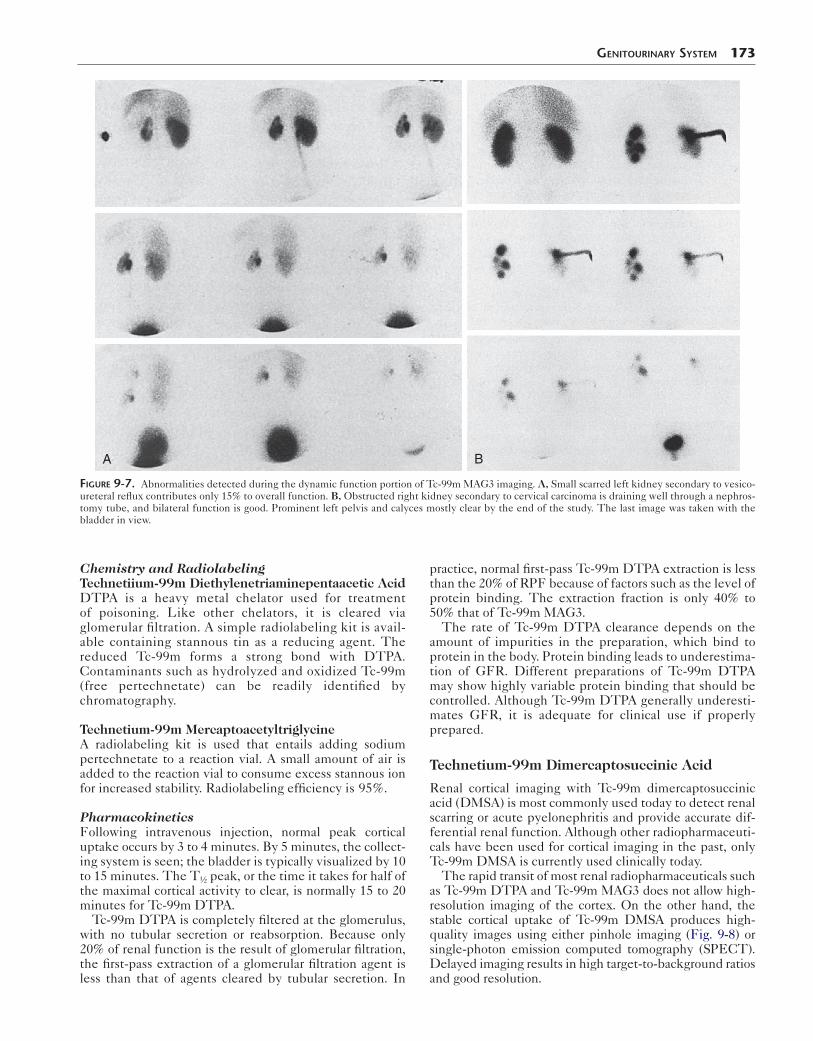
FiGure 9-7. Abnormalities detected during the dynamic function portion of Tc-99m MAG3 imaging. A, Small scarred left kidney secondary to vesico-ureteral reflux contributes only 15% to overall function. B, Obstructed right kidney secondary to cervical carcinoma is draining well through a nephros-tomy tube, and bilateral function is good. Prominent left pelvis and calyces mostly clear by the end of the study. The last image was taken with the bladder in view.
Chemistry and RadiolabelingTechnetiium-99m Diethylenetriaminepentaacetic AcidDTPA is a heavy metal chelator used for treatment of poisoning. Like other chelators, it is cleared via glomerular filtration. A simple radiolabeling kit is avail-able containing stannous tin as a reducing agent. The reduced Tc-99m forms a strong bond with DTPA. Contaminants such as hydrolyzed and oxidized Tc-99m (free pertechnetate) can be readily identified by chromatography.
Technetium-99m MercaptoacetyltriglycineA radiolabeling kit is used that entails adding sodium pertechnetate to a reaction vial. A small amount of air is added to the reaction vial to consume excess stannous ion for increased stability. Radiolabeling efficiency is 95%.
PharmacokineticsFollowing intravenous injection, normal peak cortical uptake occurs by 3 to 4 minutes. By 5 minutes, the collect-ing system is seen; the bladder is typically visualized by 10 to 15 minutes. The T½ peak, or the time it takes for half of the maximal cortical activity to clear, is normally 15 to 20 minutes for Tc-99m DTPA.
Tc-99m DTPA is completely filtered at the glomerulus, with no tubular secretion or reabsorption. Because only 20% of renal function is the result of glomerular filtration, the first-pass extraction of a glomerular filtration agent is less than that of agents cleared by tubular secretion. In
practice, normal first-pass Tc-99m DTPA extraction is less than the 20% of RPF because of factors such as the level of protein binding. The extraction fraction is only 40% to 50% that of Tc-99m MAG3.
The rate of Tc-99m DTPA clearance depends on the amount of impurities in the preparation, which bind to protein in the body. Protein binding leads to underestima-tion of GFR. Different preparations of Tc-99m DTPA may show highly variable protein binding that should be controlled. Although Tc-99m DTPA generally underesti-mates GFR, it is adequate for clinical use if properly prepared.
Technetium-99m Dimercaptosuccinic Acid
Renal cortical imaging with Tc-99m dimercaptosuccinic acid (DMSA) is most commonly used today to detect renal scarring or acute pyelonephritis and provide accurate dif-ferential renal function. Although other radiopharmaceuti-cals have been used for cortical imaging in the past, only Tc-99m DMSA is currently used clinically today.
The rapid transit of most renal radiopharmaceuticals such as Tc-99m DTPA and Tc-99m MAG3 does not allow high-resolution imaging of the cortex. On the other hand, the stable cortical uptake of Tc-99m DMSA produces high-quality images using either pinhole imaging (Fig. 9-8) or single-photon emission computed tomography (SPECT). Delayed imaging results in high target-to-background ratios and good resolution.
174 Nuclear Medicine: The Requisites
C
D
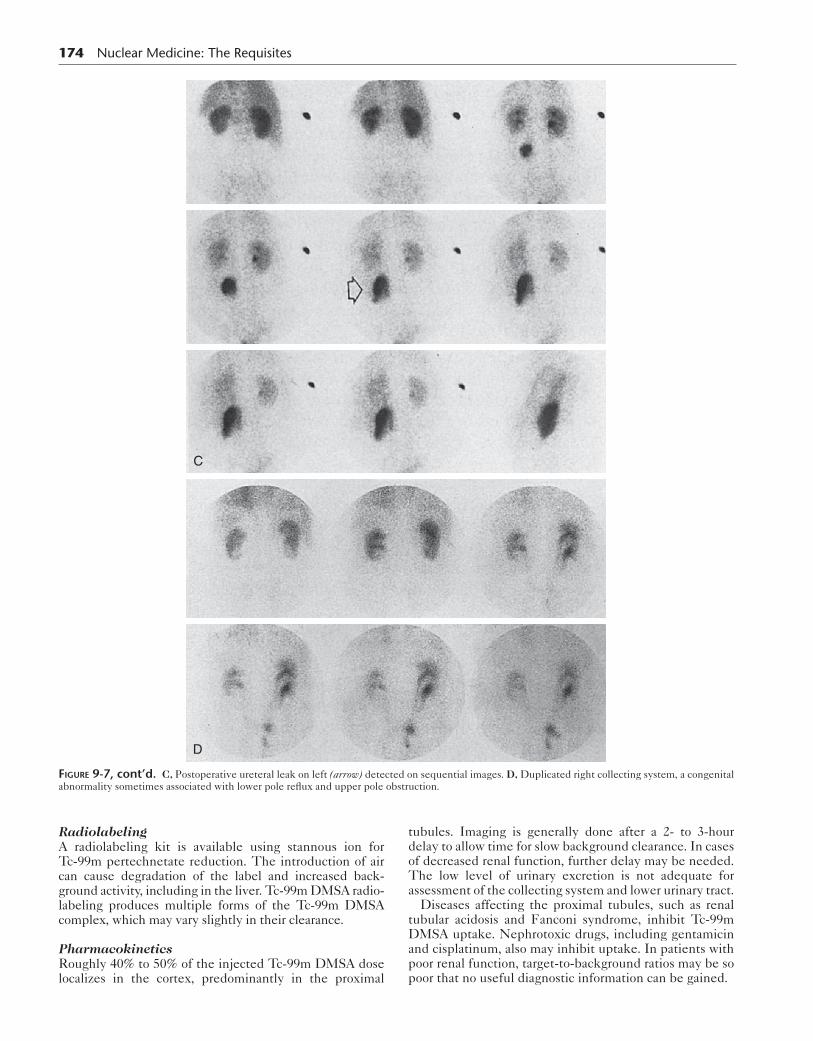
FiGure 9-7, cont’d. C, Postoperative ureteral leak on left (arrow) detected on sequential images. D, Duplicated right collecting system, a congenital abnormality sometimes associated with lower pole reflux and upper pole obstruction.
RadiolabelingA radiolabeling kit is available using stannous ion for Tc-99m pertechnetate reduction. The introduction of air can cause degradation of the label and increased back-ground activity, including in the liver. Tc-99m DMSA radio-labeling produces multiple forms of the Tc-99m DMSA complex, which may vary slightly in their clearance.
PharmacokineticsRoughly 40% to 50% of the injected Tc-99m DMSA dose localizes in the cortex, predominantly in the proximal
tubules. Imaging is generally done after a 2- to 3-hour delay to allow time for slow background clearance. In cases of decreased renal function, further delay may be needed. The low level of urinary excretion is not adequate for assessment of the collecting system and lower urinary tract.
Diseases affecting the proximal tubules, such as renal tubular acidosis and Fanconi syndrome, inhibit Tc-99m DMSA uptake. Nephrotoxic drugs, including gentamicin and cisplatinum, also may inhibit uptake. In patients with poor renal function, target-to-background ratios may be so poor that no useful diagnostic information can be gained.
Genitourinary SyStem 175
RIGHTLEFT
POST Right Left
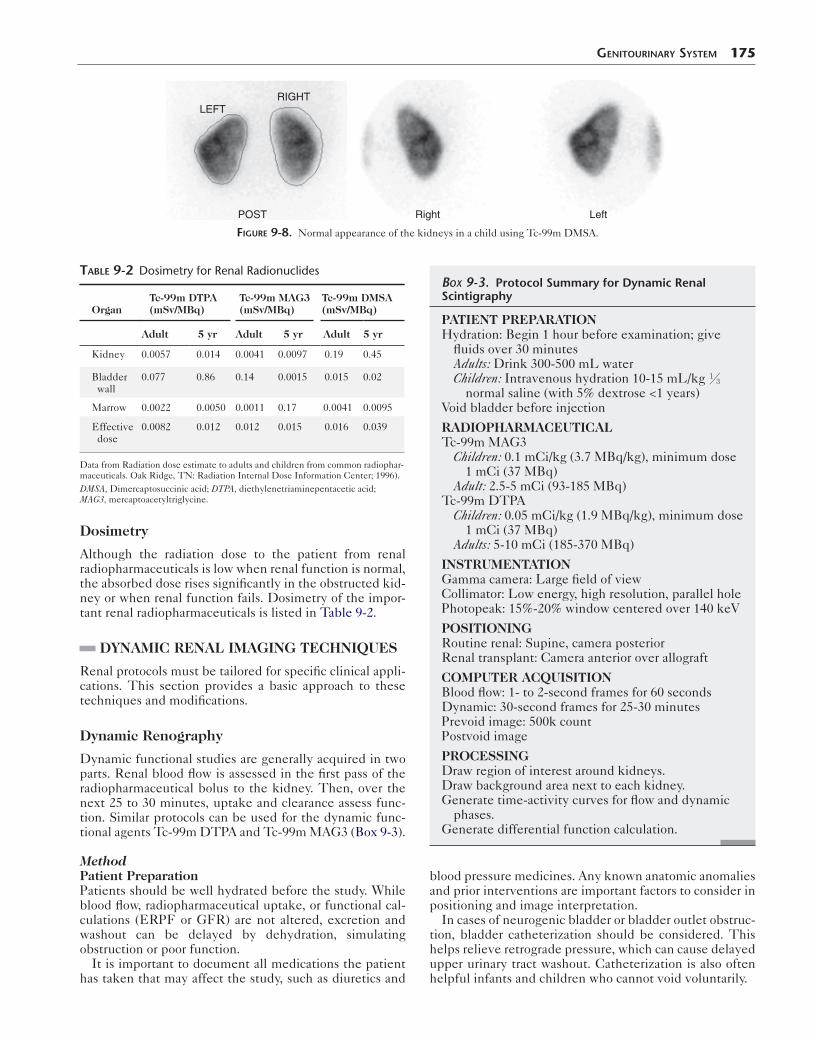
FiGure 9-8. Normal appearance of the kidneys in a child using Tc-99m DMSA.
Dosimetry
Although the radiation dose to the patient from renal radiopharmaceuticals is low when renal function is normal, the absorbed dose rises significantly in the obstructed kid-ney or when renal function fails. Dosimetry of the impor-tant renal radiopharmaceuticals is listed in Table 9-2.
DYNAMIC RENAL IMAGING TECHNIQUES
Renal protocols must be tailored for specific clinical appli-cations. This section provides a basic approach to these techniques and modifications.
Dynamic Renography
Dynamic functional studies are generally acquired in two parts. Renal blood flow is assessed in the first pass of the radiopharmaceutical bolus to the kidney. Then, over the next 25 to 30 minutes, uptake and clearance assess func-tion. Similar protocols can be used for the dynamic func-tional agents Tc-99m DTPA and Tc-99m MAG3 (Box 9-3).
MethodPatient PreparationPatients should be well hydrated before the study. While blood flow, radiopharmaceutical uptake, or functional cal-culations (ERPF or GFR) are not altered, excretion and washout can be delayed by dehydration, simulating obstruction or poor function.
It is important to document all medications the patient has taken that may affect the study, such as diuretics and
table 9-2 Dosimetry for Renal Radionuclides
OrganTc-99m DTPA (mSv/MBq)
Tc-99m MAG3 (mSv/MBq)
Tc-99m DMSA (mSv/MBq)
Adult 5 yr Adult 5 yr Adult 5 yr
Kidney 0.0057 0.014 0.0041 0.0097 0.19 0.45
Bladder wall
0.077 0.86 0.14 0.0015 0.015 0.02
Marrow 0.0022 0.0050 0.0011 0.17 0.0041 0.0095
Effective dose
0.0082 0.012 0.012 0.015 0.016 0.039
Data from Radiation dose estimate to adults and children from common radiophar-maceuticals. Oak Ridge, TN: Radiation Internal Dose Information Center; 1996).DMSA, Dimercaptosuccinic acid; DTPA, diethylenetriaminepentacetic acid; MAG3, mercaptoacetyltriglycine.
blood pressure medicines. Any known anatomic anomalies and prior interventions are important factors to consider in positioning and image interpretation.
In cases of neurogenic bladder or bladder outlet obstruc-tion, bladder catheterization should be considered. This helps relieve retrograde pressure, which can cause delayed upper urinary tract washout. Catheterization is also often helpful infants and children who cannot void voluntarily.
Box 9-3. Protocol Summary for Dynamic Renal Scintigraphy
PATIENT PREPARATIONHydration: Begin 1 hour before examination; give
fluids over 30 minutesAdults: Drink 300-500 mL waterChildren: Intravenous hydration 10-15 mL/kg ⅓
normal saline (with 5% dextrose <1 years)Void bladder before injection
RADIOPHARMACEUTICALTc-99m MAG3
Children: 0.1 mCi/kg (3.7 MBq/kg), minimum dose 1 mCi (37 MBq)
Adult: 2.5-5 mCi (93-185 MBq)Tc-99m DTPA
Children: 0.05 mCi/kg (1.9 MBq/kg), minimum dose 1 mCi (37 MBq)
Adults: 5-10 mCi (185-370 MBq)
INSTRUMENTATIONGamma camera: Large field of viewCollimator: Low energy, high resolution, parallel holePhotopeak: 15%-20% window centered over 140 keV
POSITIONINGRoutine renal: Supine, camera posteriorRenal transplant: Camera anterior over allograft
COMPUTER ACQUISITIONBlood flow: 1- to 2-second frames for 60 secondsDynamic: 30-second frames for 25-30 minutesPrevoid image: 500k countPostvoid image
PROCESSINGDraw region of interest around kidneys.Draw background area next to each kidney.Generate time-activity curves for flow and dynamic
phases.Generate differential function calculation.

176 Nuclear Medicine: The Requisites
Patient PositioningA supine position is preferred because kidneys are fre-quently mobile (or “ptotic”) and can move to the anterior pelvis when patients are upright. Patients are placed so that the kidneys are closest to the camera, with the camera posterior for normal native kidneys and anterior for trans-plants, pelvic kidneys, and horseshoe kidneys.
DoseThe administered dose of radiopharmaceutical varies with the agent. Doses of Tc-99m MAG3 range from 2 to 5 mCi (74-185 MBq). For Tc-99m DTPA, higher amounts are generally used, ranging from 10 to 20 mCi (370-740 MBq).
Image AcquisitionAfter a bolus injection of radiopharmaceutical, the image acquisition begins when activity is about to enter the abdom-inal aorta. Images are acquired at a rate of 1 to 3 seconds per frame for 60 seconds to assess renal perfusion. Then images are acquired at 60 seconds per frame for 25 to 30 minutes to evaluate parenchymal radiotracer uptake and clearance.
Computer Processing of Renal Studies
The uptake and clearance of radiopharmaceuticals is a dynamic process. Mentally integrating all the information in the many images of a renal scan is challenging, even for experienced clinicians. Computer-generated time-activity curves (TACs) provide a dynamic visual presentation of changes in activity over the course of the study. Usually, separate TACs are drawn for the blood flow and dynamic function portions of the study.
Perfusion Time-Activity CurveThe first-pass perfusion TAC shows the blood flow to each kidney compared with arterial flow. A region of interest is drawn around each kidney and the closest major artery (aorta for native kidneys, iliac artery for transplanted kid-neys) on the initial 60-second portion of the study. Although absolute flow (milliliters per kilogram per min-ute) cannot be calculated with the radiotracers discussed, relative flow can be visualized or calculated using the upslope of the perfusion curve. A ratio of the activity
compared to the aorta or kidney to arterial (K/A) ratio can help follow changes in perfusion.
Dynamic Renal Function Time-Activity CurveA TAC is generated for the remaining portion of the examination by drawing on the computer a region of interest (ROI) around each kidney (Fig. 9-9). The selec-tion of kidney ROI depends on the information needed. Whole-kidney regions can be used if the collecting sys-tem clears promptly. When a whole-kidney ROI is used in a patient with retained activity in the collecting system, clearance will appear delayed on the TAC. In cases of hydronephrosis and obstruction, a 2-pixel-wide periph-eral cortical region of interest, excluding the collecting system, can be helpful, although some overlap with calyces is inevitable.
Various methods of background correction have been employed using a 2-pixel-wide region of interest. It may be placed beneath the kidneys, around the kidneys, or in a crescent configuration lateral to the region of interest. Background correction is less critical with delayed images, such as those obtained with Tc-99m DMSA, because of their high target-to-background ratio.
At any point in time, the renogram represents a summa-tion of uptake and excretion. Three phases are normally seen in TACs. These include blood flow, cortical uptake, and clearance phases (Fig. 9-10). The TAC must be
FiGure 9-9. Regions of interest (ROI) for time-activity curves. Left, An image at 3 minutes with peak cortical activity is chosen for the ROIs. Right, Regions of interest are drawn for the kidney (dark lines) and for background correction (gray lines).
0
Cou
nts
8 16
Time (min)
24
L
R
2
31
Time
Cou
nts
FiGure 9-10. Normal renogram (left) can be divided into phases. Right, Initial blood flow (30-60 seconds). 2, Cortical uptake phase (normally 1-3 minutes). 3, Clearance phase representing cortical excretion and collecting system clearance.
interpreted in conjunction with the images because the curves may be affected by many factors, such as retained activity in hydronephrosis, which can alter the slope.
Numerous values can be derived from TACs and are used to help track functional changes. These include time to peak activity, uptake slope, rate of clearance, and per-cent clearance at 20 minutes. Ratios such as the cortical activity at 20 minutes divided by the peak activity (20/peak) and the amount of activity at 20 minutes or the activ-ity at 3 minutes (20/3) are relative but can help follow
Genitourinary SyStem 177
function over time. For example, when a 20/3 gets very high (e.g., greater than 0.8), this suggests obstruction or marked cortical retention caused by a variety of disease conditions.
Differential FunctionDifferential or split function is a universally performed cal-culation. This calculation is particularly useful because estimated GFR and serum creatinine may not identify unilateral lesions (Fig 9-11). From the ROI drawn after the
D
A
C
Cou
nts/
seco
nd
Left kidneyRight kidney
Time (min)
0 7 14 20 270
18115
36230
54345
72460
B
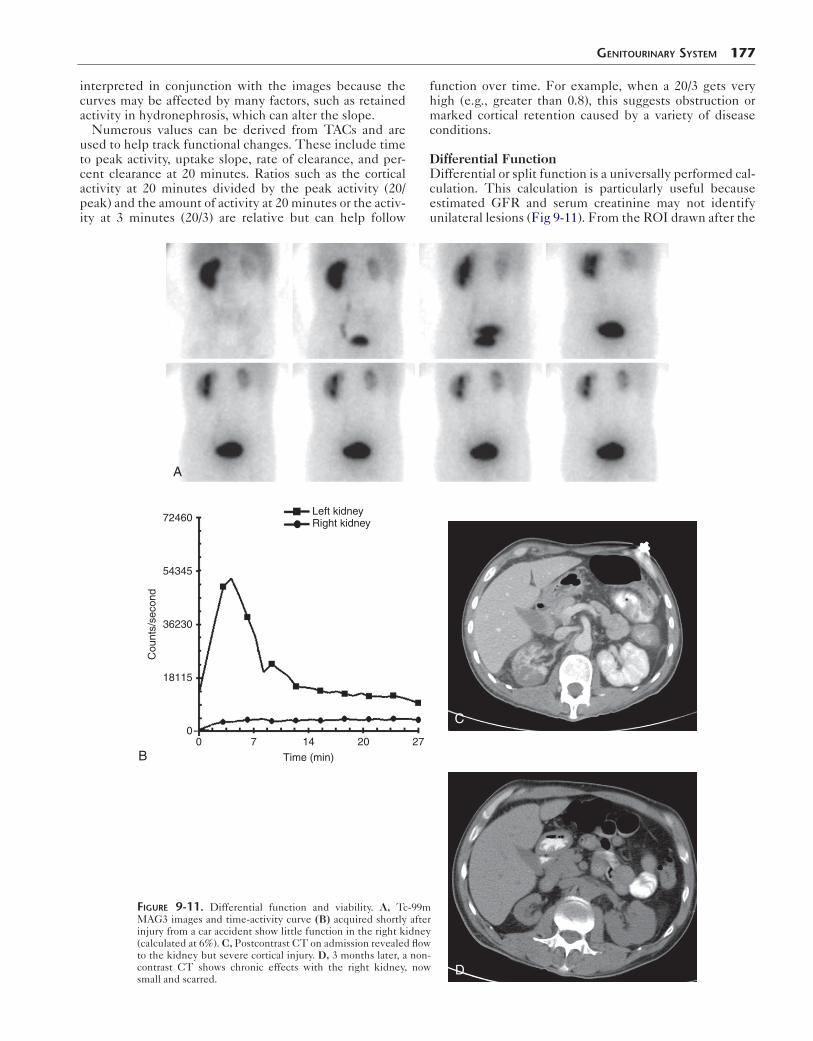
FiGure 9-11. Differential function and viability. A, Tc-99m MAG3 images and time-activity curve (B) acquired shortly after injury from a car accident show little function in the right kidney (calculated at 6%). C, Postcontrast CT on admission revealed flow to the kidney but severe cortical injury. D, 3 months later, a non-contrast CT shows chronic effects with the right kidney, now small and scarred.
178 Nuclear Medicine: The Requisites
Act
ivity
0 20 40 60Time (sec)
L
A
R
B
A
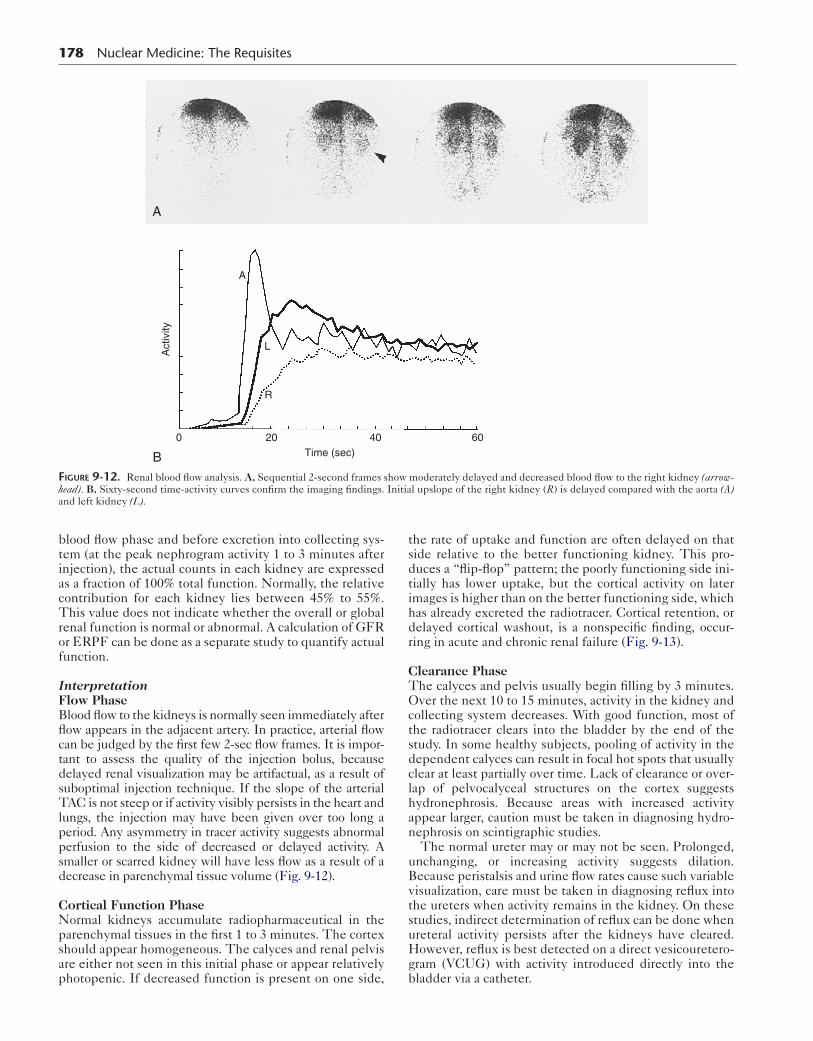
FiGure 9-12. Renal blood flow analysis. A, Sequential 2-second frames show moderately delayed and decreased blood flow to the right kidney (arrow-head). B, Sixty-second time-activity curves confirm the imaging findings. Initial upslope of the right kidney (R) is delayed compared with the aorta (A) and left kidney (L).
blood flow phase and before excretion into collecting sys-tem (at the peak nephrogram activity 1 to 3 minutes after injection), the actual counts in each kidney are expressed as a fraction of 100% total function. Normally, the relative contribution for each kidney lies between 45% to 55%. This value does not indicate whether the overall or global renal function is normal or abnormal. A calculation of GFR or ERPF can be done as a separate study to quantify actual function.
InterpretationFlow PhaseBlood flow to the kidneys is normally seen immediately after flow appears in the adjacent artery. In practice, arterial flow can be judged by the first few 2-sec flow frames. It is impor-tant to assess the quality of the injection bolus, because delayed renal visualization may be artifactual, as a result of suboptimal injection technique. If the slope of the arterial TAC is not steep or if activity visibly persists in the heart and lungs, the injection may have been given over too long a period. Any asymmetry in tracer activity suggests abnormal perfusion to the side of decreased or delayed activity. A smaller or scarred kidney will have less flow as a result of a decrease in parenchymal tissue volume (Fig. 9-12).
Cortical Function PhaseNormal kidneys accumulate radiopharmaceutical in the parenchymal tissues in the first 1 to 3 minutes. The cortex should appear homogeneous. The calyces and renal pelvis are either not seen in this initial phase or appear relatively photopenic. If decreased function is present on one side,
the rate of uptake and function are often delayed on that side relative to the better functioning kidney. This pro-duces a “flip-flop” pattern; the poorly functioning side ini-tially has lower uptake, but the cortical activity on later images is higher than on the better functioning side, which has already excreted the radiotracer. Cortical retention, or delayed cortical washout, is a nonspecific finding, occur-ring in acute and chronic renal failure (Fig. 9-13).
Clearance PhaseThe calyces and pelvis usually begin filling by 3 minutes. Over the next 10 to 15 minutes, activity in the kidney and collecting system decreases. With good function, most of the radiotracer clears into the bladder by the end of the study. In some healthy subjects, pooling of activity in the dependent calyces can result in focal hot spots that usually clear at least partially over time. Lack of clearance or over-lap of pelvocalyceal structures on the cortex suggests hydronephrosis. Because areas with increased activity appear larger, caution must be taken in diagnosing hydro-nephrosis on scintigraphic studies.
The normal ureter may or may not be seen. Prolonged, unchanging, or increasing activity suggests dilation. Because peristalsis and urine flow rates cause such variable visualization, care must be taken in diagnosing reflux into the ureters when activity remains in the kidney. On these studies, indirect determination of reflux can be done when ureteral activity persists after the kidneys have cleared. However, reflux is best detected on a direct vesicouretero-gram (VCUG) with activity introduced directly into the bladder via a catheter.

Genitourinary SyStem 179
A
0-3 min 9-12 min 21-24 min
0-3 min 9-12 min 21-24 min
B
Left kidney Left kidneyRight kidney
Cou
nts
Cou
nts
Right kidney
Time (min) Time (min)
FiGure 9-13. Acute and chronic renal failure. A, Tc-99m MAG3 images in a patient with newly elevated creatinine initially showed slow uptake and clearance with bilateral cortical retention (top row). It is not possible to predict whether any improvement can be expected. No improvement occurred 6 months later, and uptake slightly diminished as function gradually worsened (bottom row). B, The time-activity curves show poor uptake and clearance with a slight worsening between the two studies, with a more gradually rising slope on the right. In long-standing renal failure, uptake tends to diminish over time with kidneys appearing small, scarred, and less intense. cts, Counts.
The bladder must be monitored as well. Prevoid and postvoid bladder images evaluate emptying and postvoid residual. A distended bladder can cause an obstructed pat-tern. In a patient with neurogenic bladder or outlet obstruc-tion, the renal scan is best performed with a urinary catheter in place. In infants and small children, the bladder may appear quite large and higher in position than might be expected when looking at the outline of the child’s body
Clinical Applications of Renal Scintigraphy
Because the renal scan can monitor function over time and provides some quantitative information, it can provide data difficult to get by other means. Functional information
from the scan is often needed after trauma or vascular pro-cedure. In many patients, the nuclear medicine scintigram compliments anatomical assessment done with CT, ultra-sound, or angiography.
Urinary Tract ObstructionBackgroundObstruction can lead to recurrent infection, diminished function, progressive loss of nephrons, and parenchymal atrophy. Upper urinary tract obstruction results in back-pressure from the pelvis onto the tubules and vessels. Within hours of onset, renal blood flow, glomerular filtra-tion, and renal output are decreased. If a high-grade obstruction is corrected promptly, function can recover

180 Nuclear Medicine: The Requisites
fully; however, if it is left uncorrected for more than a week, only partial recovery is expected.
Ultrasound is a sensitive method of identifying hydro-nephrosis but cannot reliably indicate whether the dila-tion is due to mechanical obstruction or merely nonobstructive hydronephrosis (such as from reflux, pri-mary megaureter, or a previous obstruction that has been relieved). Retrograde pyelography, endoscopy, and CT scans often can identify the cause of an obstructed sys-tem such as a ureteral calculus or tumor. However, assessment of the residual function and of the effects of treatment using radionuclide imaging is still often important. Contrast studies such as intravenous pyelo-gram and conventional radionuclide renography show findings that overlap between obstructed and nonob-structed systems: delayed filling, dilation, and decreased washout.
In a dilated system, prolonged retention of contrast or radiopharmaceutical is seen because of a reservoir effect. The addition of furosemide (Lasix) to the protocol allows accurate identification of patients affected by obstruction. Furosemide, a loop diuretic that inhibits sodium and chlo-ride reabsorption, markedly increases urine flow and wash-out in normal patients. If mechanical obstruction is present, the narrowed lumen prevents augmented washout; pro-longed retention of tracer proximal is seen and can be quantified on the time-activity curves. The ability to per-form quantitation is an important advantage of functional radiotracer studies over those done with intravenous con-trast dye. Box 9-4 lists conditions for which furosemide renography is indicated.
MethodsNumerous protocols for diuretic renography exist, and attempts to standardize methodology have been made by comparing data from multiple institutions, resulting in several consensus papers. Although some variability still exists among institutions, many general areas have been agreed on. An example protocol is listed in Box 9-5.
The furosemide injection is given slowly over 1 to 2 minutes, with an onset of action within 30 to 60 seconds, and a maximal effect is seen at 15 minutes. The time of diuretic administration varies at different centers—for example, 20 minutes after the radiopharmaceutical (F+20), at the same time as the radiopharmaceutical (F+0), and 15 minutes before the study (F-15). A com-monly used method is the F+20 furosemide protocol,
Box 9-4. Urological Conditions Studied by Diuresis Renography
Ureteropelvic junction obstruction
Megaureter: Obstructive, nonobstructive, refluxing
Horseshoe kidneyPolycystic kidneyPrune-belly syndromeEctopic ureterocele
Urethral valvesPostoperative statesPyeloplastyUreteral reimplantationUrinary diversionRenal transplant ureteral
obstructionObstructing pelvic massIleal loop diversion
which allows an identifiable of washout of pooled activ-ity. However, earlier administration may be useful in cases with diminished renal function, because this gives additional time for the diuretic effect to occur allowing radiotracer washout.
InterpretationThe interpretation of diuretic renography can be complex (Box 9-6). In a normal, nondilated kidney, the TAC rapidly reaches a sharp peak and spontaneously clears rapidly. Furosemide diuresis accelerates the rate of radiotracer washout in a normal kidney. If a region of interest is placed over the ureter, a transient spike after diuretic injection indicates passage of a bolus of accumulated activity from the renal pelvis.
A dilated but nonobstructed system may initially look like a normal kidney with a steep TAC uptake slope. However, a sharp peak is not seen and, as the dilated system fills, the TAC may show continued accumulation or a plateau 20 to 30 minutes after tracer injection. After furosemide infusion, a nonobstructed hydronephrotic kidney clears promptly as a result of increased urine flow (Fig. 9-14). An obstructed system, on the other hand,
Box 9-5. Diuretic Renography: Protocol Summary
PATIENT PREPARATIONHydration should be as described in dynamic
renography protocol.Place Foley catheter in children; consider in adults.If not catheterized, complete bladder emptying
before diuretic injection.
FUROSEMIDE DOSEChildren: 1 mg/kg to maximum 40 mg (may require
more in severe azotemia)Adults: Base dose on creatinine level
Serum Creatinine (mg/dL)
Creatinine CLearanCe (mL)
FuroSemide doSe (mg)
1.0 100 20
1.5 75 40
2.0 50 60
30 30 80
IMAGING PROCEDUREInject Tc-99m MAG 3-5 mCi (111-185 MBq).Acquire study for 20 minutes.Slowly infuse furosemide intravenously over 60
seconds.Continue imaging 10 to 30 min.Obtain prevoid and postvoid image in uncatheterized
patients.
IMAGE PROCESSINGOn computer, draw region of interest around entire
kidney and pelvis.Generate time-activity curves.Calculate a half-emptying time or fitted half-time.

will not respond to the diuretic challenge; activity will continue to accumulate or sometimes stays at a plateau (Fig. 9-15). Different patterns can be seen in response to furosemide (Fig 9-16).
The distinction between obstruction and nonobstructed hydronephrosis decreases as the collecting system volume becomes larger. In very distended systems, delayed wash-out may be seen regardless of whether obstruction is pres-ent. An “indeterminate” clearance pattern is seen with little change on the images or TAC (Fig. 9-16, D).
Diuretic response may also be diminished in patients with azotemia. An increased furosemide dose or early diuretic infusion (F-15) may be used. However, even with additional modifications, it may not be possible to induce sufficient diuresis to exclude obstruction in a poorly functioning kidney (Figs. 9-17 and 9-18). Although elevated serum creatinine may indicate severe renal dys-function, GFR or ERPF may be more accurate, espe-cially is the lesion is unilateral. If the GFR on the affected side is less than 15 mL/min, diuretic renography is unreliable.
At times, it is useful to quantitate collecting system clearance half time or washout half time (T½). Numerous
Genitourinary SyStem 181
Box 9-6. Diuretic Renography Pearls and Pitfalls
Diminished response to furosemideDehydrationPressure from distended bladderMassive hydronephrosisAzotemiaInfants
Insufficient time for diuretic actionDiuretic given at T0 or before Tc-99m MAG3
Acts steadily, does not give visible drop in curveT½ values not applicableUseful with azotemia
Uteropelvic junction may present with partial obstruc-tion, but often detected on serial examinations.
Use of diuretics in patients with spinal cord injury can result in dangerous hypotension.
Postoperative obstruction in renal transplants can be best assessed with diuretic scans.External fluid collectionsAnastamotic swelling or stricture
MAG3, Mercaptoacetyltriglycine.
A
B
Cou
nts/
seco
nd
0 7 14 20 27
Time (min)
FiGure 9-14. Diuretic renography with no obstruction. A right pelvic renal transplant was noted to have new hydronephrosis on ultra-sound. The Tc-99m MAG3 diuretic examina-tion (A) and time-activity curves (B) with furosemide (Lasix) given at 10 minutes shows the prominent collecting system clearing promptly without evidence of obstruction.
B
D
Cou
nts
Cou
nts
Left kidneyRight kidney
Time (min)
Time (min)
Left kidneyRight kidney
A
C
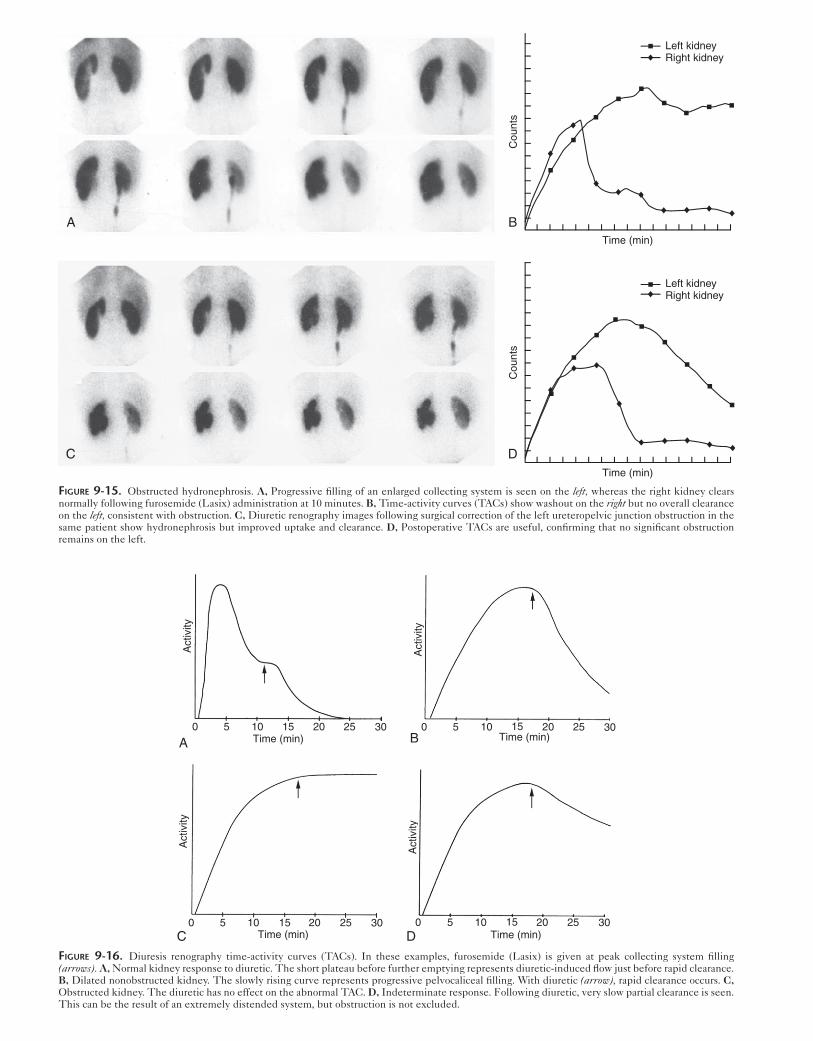
FiGure 9-15. Obstructed hydronephrosis. A, Progressive filling of an enlarged collecting system is seen on the left, whereas the right kidney clears normally following furosemide (Lasix) administration at 10 minutes. B, Time-activity curves (TACs) show washout on the right but no overall clearance on the left, consistent with obstruction. C, Diuretic renography images following surgical correction of the left ureteropelvic junction obstruction in the same patient show hydronephrosis but improved uptake and clearance. D, Postoperative TACs are useful, confirming that no significant obstruction remains on the left.
A
Act
ivity
0 5 10 15 20 25 30Time (min)
Act
ivity
C0 5 10 15 20 25 30
Time (min)
Act
ivity
D Time (min)0 5 10 15 20 25 30
B
Act
ivity
Time (min)0 5 10 15 20 25 30
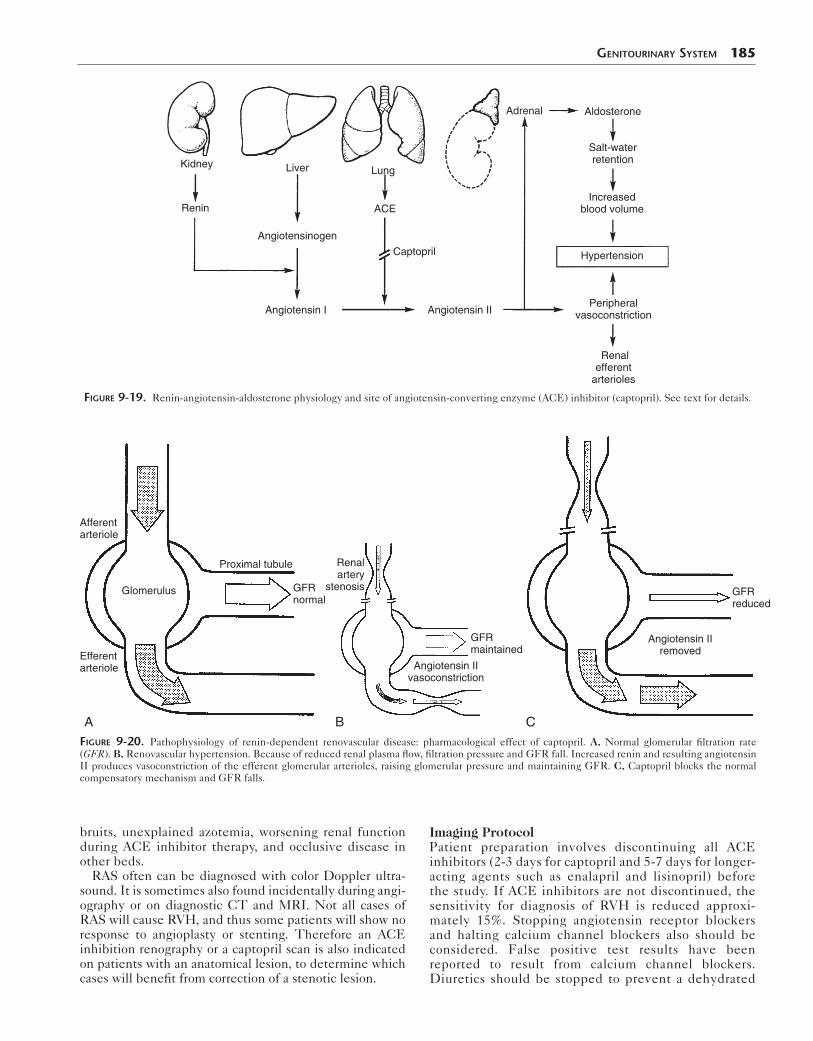
FiGure 9-16. Diuresis renography time-activity curves (TACs). In these examples, furosemide (Lasix) is given at peak collecting system filling (arrows). A, Normal kidney response to diuretic. The short plateau before further emptying represents diuretic-induced flow just before rapid clearance. B, Dilated nonobstructed kidney. The slowly rising curve represents progressive pelvocaliceal filling. With diuretic (arrow), rapid clearance occurs. C, Obstructed kidney. The diuretic has no effect on the abnormal TAC. D, Indeterminate response. Following diuretic, very slow partial clearance is seen. This can be the result of an extremely distended system, but obstruction is not excluded.

Genitourinary SyStem 183
A
Cou
nts/
seco
nd
Time (min)B
Right kidneyLeft kidney
FiGure 9-17. Decreased function resulting from high-grade obstruction. A, Dynamic sequential Tc-99m MAG3 images performed 15 minutes after giving furosemide (Lasix) reveal normal function on the right. The left kidney shows only a thin rim of cortex with delayed uptake, a photopenic hydro-nephrotic collecting system, and continual collecting system filling without washout consistent with obstruction. B, Findings are confirmed on the time-activity curve.
methods for calculating the T½ have been described. The activity can be measured when the diuretic is given; then the length of time it takes to reach half that level can be used. However, this does not account for the delay in furo-semide effect, a more precise method might be to fit a curve to the steepest portion of the washout time-activity curve. In general, a T½ less than 10 minutes indicates that no clinically significant obstruction is present, whereas val-ues greater than 20 minutes are considered obstructed. Values between 10 and 20 minutes fall in a gray zone or indeterminate range. Large capacitance collecting systems will clear slowly, even if not obstructed.
Serial studies may be used to monitor patients with par-tial obstruction, previously treated obstruction, or those at risk for worsening obstruction. Some situations in which this might be needed include cervical carcinoma and known partial ureteropelvic junction obstruction. Also, patients at high risk for functional deterioration from reflux, such as ileal loop diversions of the ureters, may be followed with interval studies. Periodic diuresis renogra-phy can help determine at what point aggressive interven-tion is needed. In neonates, congenital problems often result in irreparable damage. Surgeons generally prefer to wait until the child is larger for surgery when possible.

184 Nuclear Medicine: The Requisites
A
B
FiGure 9-18. Impact of chronic obstruction. Untreated high-grade vesicoureteral junction obstruction secondary to tumor resulting in severely com-promised renal function on the left. A, Flow study shows very decreased perfusion to the left kidney (arrowhead). B, Dynamic sequential images show only a thin rim of cortex with poor uptake (open arrowhead) and a large photopenic collecting system consistent with hydronephrosis. Diuresis renogra-phy would not be useful as no tracer enters the collecting system.
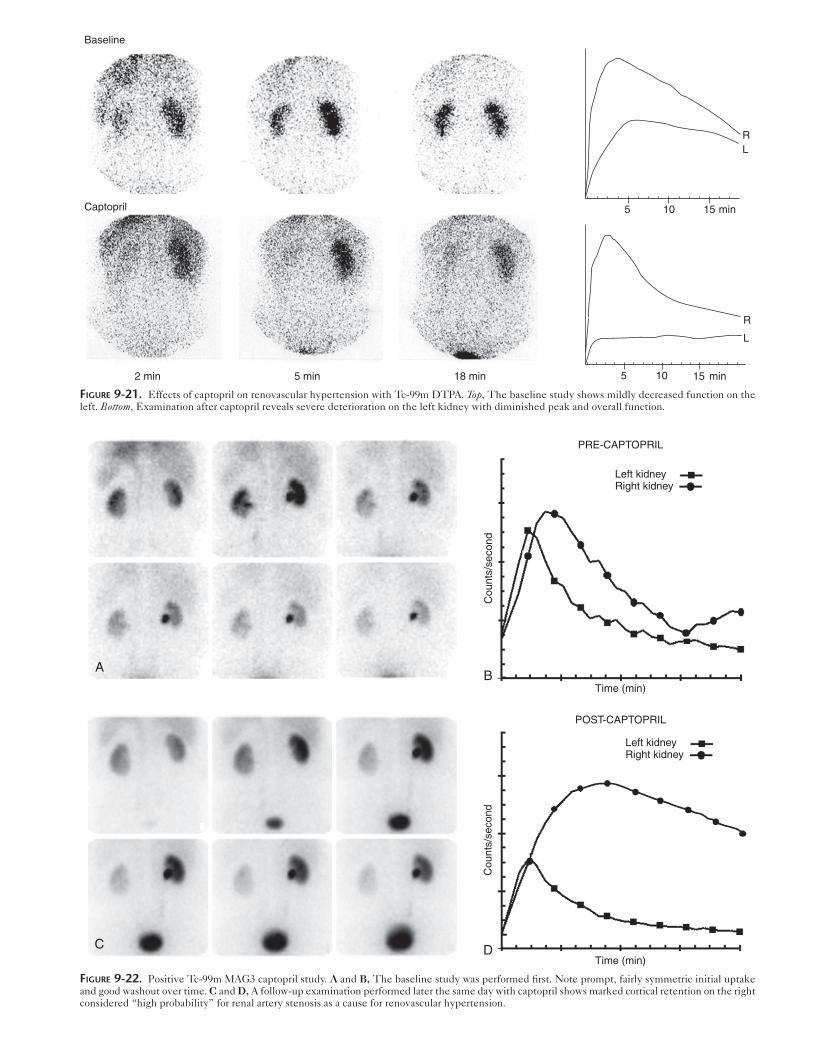
Renovascular HypertensionPhysiologyWhen an arterial lesion causes significant vascular renal artery stenosis (RAS), glomerular perfusion pressure drops, causing the GFR to fall. The kidney responds by releasing the hormone renin from the juxtaglomerular apparatus. Renin converts angiotensinogen made in the liver to angiotensin I. In the lungs, angiotensin I is con-verted by angiotensin converting enzyme (ACE) to vasoactive angiotensin II, which acts as a powerful vasoconstrictor. This constriction raises blood pressure peripherally and acts on the efferent arterioles of the glomerulus to raise filtration pressure, thus maintaining GFR (Fig. 9-19). If renal blood flow remains low, the kid-ney will become scarred and contracted with time. If renovascular hypertension (RVH) is present, early inter-vention decreases arteriolar damage and glomerulosclero-sis, increasing the chance for cure.
The development of ACE inhibition renography using captopril led to a sensitive, noninvasive functional method for diagnosing RVH. ACE inhibitors work by blocking the conversion of angiotensin I to angiotensin II (Fig. 9-20). This causes the GFR to fall in patients with RVH who rely on the compensatory mechanism to maintain perfu-sion pressure. Functional changes can be seen on the scintigram.
IndicationAlthough more than 90% of patients with hypertension have essential hypertension, RVH is common among patients who have a correctable cause. ACE inhibition renography should be considered for patients at moder-ate to high risk for RVH. This includes patients with severe hypertension, hypertension resistant to medical therapy, abrupt or recent onset, onset under the age of 30 years or over the age of 55 years, abdominal or flank
Genitourinary SyStem 185
Renin
Kidney Liver
ACE
Captopril
Adrenal Aldosterone
Salt-waterretention
Hypertension
Increasedblood volume
Peripheralvasoconstriction
Renalefferent
arterioles
Lung
Angiotensinogen
Angiotensin I Angiotensin II
FiGure 9-19. Renin-angiotensin-aldosterone physiology and site of angiotensin-converting enzyme (ACE) inhibitor (captopril). See text for details.
Afferentarteriole
Efferentarteriole
Glomerulus
Proximal tubule
GFR normal
A
GFRmaintained
Angiotensin IIvasoconstriction
Renalartery
stenosis
B
GFRreduced
Angiotensin IIremoved
CFiGure 9-20. Pathophysiology of renin-dependent renovascular disease: pharmacological effect of captopril. A, Normal glomerular filtration rate (GFR). B, Renovascular hypertension. Because of reduced renal plasma flow, filtration pressure and GFR fall. Increased renin and resulting angiotensin II produces vasoconstriction of the efferent glomerular arterioles, raising glomerular pressure and maintaining GFR. C, Captopril blocks the normal compensatory mechanism and GFR falls.
bruits, unexplained azotemia, worsening renal function during ACE inhibitor therapy, and occlusive disease in other beds.
RAS often can be diagnosed with color Doppler ultra-sound. It is sometimes also found incidentally during angi-ography or on diagnostic CT and MRI. Not all cases of RAS will cause RVH, and thus some patients will show no response to angioplasty or stenting. Therefore an ACE inhibition renography or a captopril scan is also indicated on patients with an anatomical lesion, to determine which cases will benefit from correction of a stenotic lesion.
Imaging ProtocolPatient preparation involves discontinuing all ACE inhibitors (2-3 days for captopril and 5-7 days for longer-acting agents such as enalapril and lisinopril) before the study. If ACE inhibitors are not discontinued, the sensitivity for diagnosis of RVH is reduced approxi-mately 15%. Stopping angiotensin receptor blockers and halting calcium channel blockers also should be considered. False positive test results have been reported to result from calcium channel blockers. Diuretics should be stopped to prevent a dehydrated

186 Nuclear Medicine: The Requisites
condition. Otherwise, most antihypertensive agents have little or no effect on the results.
A decision must be made as to which imaging protocol to use. A 1-day protocol can be used by first doing a baseline examination using a low dose of 1 mCi (37 MBq) of Tc-99m MAG3 radiopharmaceutical followed by a post–ACE inhibitor study using 5 mCi (185 MBq) of Tc-99m MAG3 (185-370 MBq). Although this is convenient, interpretation is sometimes more difficult, and because most patients will have a negative post-captopril examination, they receive extra radiation from an unnecessary baseline examination. Alternatively, the two studies can be performed on sepa-rate days with 3 to 5 mCi (111-185 MBq) of Tc-99m MAG3 on the first day with the ACE inhibitor. A baseline study is done only in patients with an abnormal ACE inhibitor study. The radiotracer should be allowed to clear and decay, so at least 24 hours between the studies is needed.
In addition, a choice must be made as to which ACE inhibitor to use. Although oral captopril (25-50 mg) has been used traditionally, intravenous enalapril (Vasotec) examinations are faster and ensure reliable absorption of the drug. Intravenous access must be gained, which can be used for hydration and in hypotensive emergencies. After the ACE inhibitor is given, serial blood pressures measure-ments are taken, and the patient should be monitored until imaging is completed. An example ACE inhibitor renography protocol is listed in Box 9-7.
Image InterpretationIn patients with renin-dependent RVH, decreased blood flow to the affected kidney is most often not seen. In particu-lar, on any noncaptopril renography, any decreased perfu-sion is usually related to a decrease in tissue volume being perfused. ACE inhibitors cause a drop in GFR, which leads to decreased urine flow that can be visualized during the functional portion of the study as a diminished function. However, because the kidney could have abnormal function from numerous causes, a baseline study is done. In patients with RVH, function generally improves in the absence of ACE inhibitors. In normal patients and those with renal dis-ease from other causes (such as chronic scarring from pyelo-nephritis), function does not improve on a baseline study compared to the ACE inhibitor examination.
The diagnostic pattern seen depends on the type of radiopharmaceutical. If the glomerular agent Tc-99m DTPA is used, the ACE inhibitor–induced drop in GFR leads to a marked drop in radiotracer filtration and uptake. The most common pattern is an overall drop in function seen as slower uptake and a lower peak (Fig. 9-21). Look-ing at the degree of change from baseline is critical with Tc-99m DTPA, and the greater the change, the higher the probability that RAS is causing significant RVH. A 10% decrease in relative function (differential function or split renal function) or a decrease in absolute function (calcu-lated GFR) greater than 10% is considered “high probabil-ity” or positive; a change of 5% to 9% is intermediate or borderline in significance.
Tc-99m MAG3 tubular uptake and secretion are not affected by GFR changes from the ACE inhibitor. The decreased urine flow causes delayed Tc-99m MAG3 washout and the primary finding will be cortical retention (cortical staining) (Fig. 9-22).
If bilateral cortical retention is seen, the finding is likely artifact and not bilateral renal artery stenosis. Among patients with bilateral cortical retention undergoing arterio-gram, roughly two thirds had no significant stenosis. Usu-ally, the causes are dehydration or hypotension (Fig. 9-23).
If the protocol has been properly followed, sensitivity and specificity of ACE inhibitor renography is reportedly 90% and 95%, respectively. However, the sensitivity and specificity are lower in patients with elevated creatinine. The kidney must function well enough to actually show a change in function when ACE inhibitors are given. There-fore a small shrunken kidney or one with poor baseline function can be difficult to interpret. In general, ACE inhibitor renography is accurate when the serum
Box 9-7. Angiotensin-Converting Enzyme Inhibitor (Captopril) Renography Protocol Summary
PATIENT PREPARATIONPatient should have liquids only for 4 hours before
the study.Hydration:
7 mL/kg water 30-60 minutes before the studyorIntravenous hydration 10 mL/kg (maximum
500 mL) half normal saline over 1 hourMaintain access during study in case of hypotension.Medications to discontinue
ACE inhibitors: 3 days for short-acting or 5-7 days for longer-acting agents
Angiotensin receptor blockersConsider stopping: Calcium channel blockers
and diuretics
RADIOPHARMACEUTICAL2-Day protocol: Tc-99m MAG3 3-5 mCi
(111-185 MBq)1-Day protocol: 1-2 mCi (37-74 MBq) for baseline
then 5-8 mCi (185-296 MBq) ACE inhibitor study
IMAGING PROCEDURE 1. Check baseline blood pressure 2. Administer ACE inhibitor
CaptoprilChildren: 0.5 mg/kg, maximum 25 mgAdults: 25-50 mg orally 1 hour before studyEnalapril 40 μg/kg (maximum 2.5 mg) intrave-
nously infused over 3-5 minutes 3. Monitor and record blood pressure every
15 minutes for oral medication and every 5 minutes for intravenous enalapril.
A large drop in pressure may require fluids intravenously.
4. Administer furosemide 20-40 mg intravenously at the time of injection.
5. Inject radiopharmaceutical 60 minutes after oral captopril or 15 minutes after enalapril.
6. Imaging protocol is similar to dynamic renography (Box 9-3).
ACE, Angiotensin-converting enzyme.
5 10 15 min
RL
5 10 min
R
L
15
Baseline
Captopril
2 min 5 min 18 min
FiGure 9-21. Effects of captopril on renovascular hypertension with Tc-99m DTPA. Top, The baseline study shows mildly decreased function on the left. Bottom, Examination after captopril reveals severe deterioration on the left kidney with diminished peak and overall function.
AB
Time (min)
Cou
nts/
seco
nd
PRE-CAPTOPRIL
Left kidneyRight kidney
C D
POST-CAPTOPRIL
Left kidneyRight kidney
Time (min)
Cou
nts/
seco
nd
FiGure 9-22. Positive Tc-99m MAG3 captopril study. A and B, The baseline study was performed first. Note prompt, fairly symmetric initial uptake and good washout over time. C and D, A follow-up examination performed later the same day with captopril shows marked cortical retention on the right considered “high probability” for renal artery stenosis as a cause for renovascular hypertension.

188 Nuclear Medicine: The Requisites
creatinine is normal or only mildly elevated (creatinine <1.7 mg/dL). False positive results are rare but have been reported in patients on calcium channel blockers.
ReportingA normal ACE inhibitor study should be read as “low probability” of renin-dependent RVH. This means the posttest chance of RVH is less than 10%. In general, no additional workup is needed. If the 2-day protocol was used, the patient need not return for a baseline study. An “indeterminate” reading can be used for patients with very poor renal function or when an abnormal-appearing kidney does not change between baseline and ACE inhib-itor examinations. When function markedly worsens on the ACE inhibitor challenge compared to the baseline study, the study is “high probability,” with a greater than 90% chance of RVH. These patients are highly likely to improve with angioplasty or surgery.
Renal Transplant Evaluation
Renal transplantation is a well-established procedure (Fig. 9-24). When complications occur, transplanted kidneys are
now usually evaluated by ultrasound and biopsy. However, radionuclide scintigraphy has been widely used to evalu-ate renal allograft function and remains an important screening tool.
Kidneys for transplantation come from one of three sources: a deceased donor (cadaveric kidney), a living related donor, or a living unrelated donor. All potential donors are carefully screened with immunological match-ing and undergo functional and anatomical evaluation. Although cadaveric kidneys are carefully screened and transported, allografts from living donors generally have the best prognosis. Allograft 1-year survival rates are 90% to 94% for living related donor kidneys and 88% to 90% for cadaveric transplants.
The development of improved immunosuppressive drug therapy over the years has resulted in a marked increase in allograft survival. These drugs act largely by suppressing the CD4 T-cell activity. Glucocorticoid ste-roids remain essential in the treatment and prevention of rejection. Additional agents used include calcineurin inhibitors (tacrolimus or cyclosporine), antiproliferative agents (such as azathioprine) that prevent mitosis and non-specifically suppress lymphocyte proliferation, and
A B
C D
Cou
nts
Cou
nts
0 8 16 24
Time (min)
0 8 16 24
Time (min)
R
L
R
L
FiGure 9-23. Bilateral cortical retention from dehydration. A, Captopril-stimulated study with Tc-99m MAG3 and the captopril time-activity curve (TAC) (B) show marked bilateral cortical retention and minimal urinary bladder clearance over 30 minutes. Further investigation revealed the patient had abstained from food and drink for nearly 12 hours before the examination. Repeat captopril images (C) and TAC (D) after the usual hydration protocol show normal cortical function and good clearance. The previous dehydration was presumed to cause the initial false-positive imaging pattern.

antiinterleukin (IL)-2 monoclonal antibodies and T-cell specific monoclonal antibody muromonab-CD3 (OKT3). However, it is critical to determine precisely when these agents are needed and how to monitor patients because of the potential serious acute and long-term side effects of these medications.
FiGure 9-24. Renal transplant surgery. For technical reasons, the initial allograft is usually placed in the right iliac fossa. The vessels are attached end to end for the artery and side to side for the vein. The ureter is usu-ally directly implanted into the recipient’s bladder. After an initial failure, a second graft is usually placed in the left. If a pancreas is transplanted simultaneously, the pancreas is usually placed on the right.
Genitourinary SyStem 189
Transplant ComplicationsA summary of transplant complications is provided in Table 9-3.
Vasomotor NephropathyA common early transplant complication is acute vasomotor nephropathy (also properly called ischemic nephropathy or delayed graft function). Although commonly referred to as acute tubular necrosis (ATN), ATN is just one possible com-ponent of the process. Ischemia before transplantation dam-ages the kidney, worsening if the time between the donor’s death and transplantation is prolonged. Vasomotor nephrop-athy is most common in cadaveric kidneys, occurring up to 50% of the time. However, it can be seen in grafts from living donors (5%), especially if the surgery was complicated. The functional impact ranges from a mild, rapidly resolving disor-der to a slower recovery or total anuria. Although renal func-tion will be impaired at the time of transplant in these cases, it should recover spontaneously during the first 2 weeks.
Hyperacute RejectionCareful human leukocyte antigen (HLA) immunological matching has eliminated hyperacute rejection. Preformed antibodies in the recipient’s circulation from a major histo-compatibility or blood group mismatch cause renal vascula-ture thrombosis. The classic story is that of the surgeon witnessing the kidney turning blue in the operating room after performing the vascular anastomosis. The allograft can-not be salvaged, and the chance of patient survival is grim.
Accelerated Acute RejectionAccelerated acute rejection is also uncommon but occurs in patients with antibodies already in their system, as in sensitization from pregnancy or multiple blood
table 9-3 Complications After Renal Transplantation
ComplicationUsual time of occurrence postoperatively Comments
PRESURGICAL INSULT
Vasomotor nephropathy (acute tubular necrosis) Minutes to hours Cadaveric transplants; may recover, days to weeks
AUTOIMMUNE: REJECTION
Hyperacute rejection Minutes to hours Preformed antibodies; irreversible
Accelerated acute rejection 1-5 days History of prior transplant or transfusion
Acute rejection After 5 days, most common during first 3 months
Cell mediated, responsive to treatment
Chronic allograft nephropathy (chronic rejection) Months to years Humoral, irreversible, inevitableCyclosporine toxicity Months Reversible with drug withdrawal
SURGICAL
Urine leak/urinoma Days or weeksHematoma First few daysInfection First few daysLymphocele 2-4 months
VASCULAR
Renal artery stenosis After first monthVascular occlusion Days to weeksInfarctsRenalObstruction (extrinsic mass, stricture or calculi) Days, months, yearsVesicoureteral reflux

190 Nuclear Medicine: The Requisites
transfusions. The patient presents with clinical signs of acute rejection earlier than expected, in the first few days after transplantation. Unlike hyperacute rejection, acceler-ated rejection often responds to therapy.
Acute RejectionAcute rejection is a relatively frequent transplant compli-cation. Although it can occur at any time, acute rejection does not typically occur until 10 to 14 days (minimum of 5-7 days) after transplantation and is most common in the first 3 months. Two immunological pathways, T cells and humoral antibodies, can be involved causing arteritis, microinfarcts, hemorrhage, and lymphocytic infiltration. It is common for the patient to be febrile and the allograft to be swollen and painful. Typically, the patient becomes desensitized to the allograft over time, and acute rejection is rarely seen after 1 year in a patient taking appropriate immunosuppressive therapy.
Chronic Allograft NephropathyCommonly referred to as chronic rejection, chronic renal allograft nephropathy is a cumulative, delayed, and irre-versible process. Vascular constriction, chronic fibrosis, tubular atrophy, and glomerulosclerosis from immunologi-cal and nonhumoral causes occur. Over months to years, this fibrosis causes cortical loss and decreased function. Dilation of the collecting system may occur as the cortex thins. Risk factors for early development (<1 year) include damage from early ischemic injury (severe ATN), prior severe acute rejection episodes, subclinical rejection, and long-term calcineurin-inhibitor therapy. No effective ther-apy exists for chronic renal allograft nephropathy, and it is now the leading cause of graft failure, given improved therapy and early transplant survival.
Immunosuppressive Drug ToxicityAnother important cause of allograft dysfunction is drug nephrotoxicity of therapeutic drugs. In the past, this was often due to high levels of cyclosporine. Cyclosporine tox-icity is seldom seen because it has been largely replaced with other agents or is prescribed at lower, safer levels. Similar changes can be seen with other antirejection agents.
Surgical ComplicationsThe rare arterial thrombosis demonstrates no flow or func-tion. Renal vein thrombosis can occur as a postoperative complication or related to autoimmune problems. Unlike in renal vein thrombosis in native kidneys, there are no venous collaterals to drain the kidney and allow spontaneous recov-ery to occur. The thrombus leads to infarct and hemorrhage, and the effect is often severe, with loss of the allograft.
Postoperative RAS should be suspected in patients who develop hypertension after transplantation surgery and may occur in up to 10% of patients. Although the anastomosis is the most common site, stenosis in other locations (includ-ing the iliac artery) must be considered. The imaging proto-col is similar to the renovascular hypertension workup for native kidneys described in Box 9-7, with anterior position-ing of the camera over the allograft. Interpretation criteria are the same as for native kidneys.
Fluid collections associated with the transplant can be seen from necrosis of the ureteral anastomosis in the
immediate postoperative period with urinary leakage. Although other imaging modalities, such as ultrasound, can identify fluid in the pelvis, nuclear medicine tech-niques are better able to specifically identify the source. Because the transplanted kidney has no lymphatic connec-tions, lymphoceles can form in the transplant bed. This may occur in up to 10% of transplants and is seen typically 2 to 3 months after transplant. These are only clinically important if they impinge on the ureter or vasculature.
Although uncommon, ureteral obstruction may be caused by kinking of the ureter, extrinsic mass compres-sion (e.g., hematoma, lymphocele), intraluminal obstruc-tion (from blood clot or calculus), or periureteral fibrosis. Some degree of collecting system dilation without signifi-cant mechanical obstruction often is seen from postopera-tive hematomas and seromas. Hydronephrosis from obstruction can be differentiated from dilation caused by reflux or related to chronic rejection using diuretic renog-raphy. Ureteral obstruction often resolves spontaneously.
MethodsRenal allograft evaluation is performed using the dynamic scintigraphy protocol with Tc-99m MAG3 listed in Box 9-3, with the camera anterior, centered over the allograft in the lower pelvis. It is useful to include at least some of the native kidneys in the field of view because they may con-tribute to overall function. Some portion of the bladder should be seen, and the entire bladder is included on pre-void and postvoid images.
The protocol can be modified to answer any question that arises. If concern for RAS exists, the ACE inhibitor protocol is used. The diuretic renography protocol can be followed when hydronephrosis develops or obstruction is suspected. Delayed images over the course of 1 to 2 hours can help clarify the cause of fluid collections and assess possible urine leaks.
InterpretationBecause the medical and surgical complications described previously occur at certain times, renal transplant scinti-grams must be interpreted with the age of the transplant as well as the clinical context (including physical symptoms, laboratory values, and current medications) in mind. The type of allograft (cadaveric or living related donor trans-plant) is especially important and needs to be considered when evaluating vasomotor nephropathy or the expected level of renal function. The expected level of perfusion and function will typically diminish over the years.
During the perfusion phase, the transplanted kidney normally becomes the “hottest” structure within 2 to 4 seconds of activity appearing in the adjacent iliac artery after a good bolus of radiopharmaceutical. However, achieving good perfusion images is extremely difficult, especially because most patients with renal transplants have limited vascular access as a result of prior dialysis. A living related donor allograft will usually function better and clear radiotracer more rapidly than a cadaveric allograft. However, both will normally clear slightly slower than a healthy native kidney.
The two most common issues to consider in the early posttransplant period are vasomotor nephropathy and acute rejection (Table 9-4). Both conditions manifest with

Genitourinary SyStem 191
table 9-4 Comparison of Acute Rejection and Vasomotor Nephropathy
Disease Baseline scan Follow-up scan Perfusion Renal transit time
Acute rejection Normal Worsens ↓ ↑
Vasomotor nephropathy (acute tubular necrosis) Abnormal Improves Normal ↑
decreased function and marked cortical retention: a dimin-ished initial slope on the TAC, progressively increasing cortical activity over time, and a delay in appearance of col-lecting system and bladder activity from the expected 3- to 6-minute time frame. Unlike vasomotor nephropathy, acute rejection affects small renal parenchymal vessels, and the allograft should show diminished blood flow on the perfusion portion of the examination. The classic dynamic imaging pattern of acute rejection is decreased perfusion and then marked cortical retention with Tc-99m MAG3 (Fig 9-25). Vasomotor nephropathy, on the other hand, shows normal perfusion but poor function with delayed cortical clearance and decreased urine excretion immediately after surgery (Fig. 9-26).
Vasomotor nephropathy is the result of damage occur-ring before transplant insertion and so is present from the start. Usually, function improves in the first couple of weeks (Fig 9-27). However, dysfunction often persists, especially in severe cases, overlapping with the time frame expected of acute rejection. In these cases, wors-ening function suggests another process is developing. The degree of renal dysfunction can vary widely. Severe cortical retention or function that does not rapidly improve on serial studies has strong negative prognostic implications with increased transplant loss in the first 6 months.
When function is initially normal and then deterio-rates, diagnosis of acute rejection is more certain, because it is not seen in the first several days (Fig 9-28). If the initial transplant function is not known or was poor from initial vasomotor nephropathy, it may be difficult to dif-ferentiate developing acute rejection from persisting vasomotor nephropathy or to identify acute rejection superimposed on persisting vasomotor nephropathy. For this reason and given the difficulty in ensuring a high-quality perfusion image, a 24- to 48-hour baseline study is extremely helpful, though seldom performed. While biopsy is quite sensitive, it is not without risk for complications.
Nephrotoxic effects of immunosuppressive therapy demonstrate a pattern of prompt uptake and delayed clear-ance similar to that of vasomotor nephropathy. The time frame of the examination usually allows these two pro-cesses to be differentiated. Vasomotor nephropathy is seen immediately, whereas time is required for nephrotoxicity or true ATN to occur.
In chronic renal allograft nephropathy, the blood flow and function images may initially appear normal, with change first revealed through quantitative means such as ERPF and GFR measurement (Fig. 9-29). As the chronic renal allograft nephropathy worsens on serial examina-tions, parenchymal retention is seen. Although mild to moderate cortical retention is often seen, more marked
retention is likely the result of another process. Over time, nephron loss and scar in chronic rejection causes the cortex to appear thinned and the central collecting system promi-nent. Uptake appears patchy or less intense than normal, the allograft appears small or scarred, and clearance is delayed (Fig. 9-30).
Although acute vascular complications are rare, they must be suspected in the patient with anuria. Renal artery occlusion leads to absent perfusion and a photope-nic defect on the functional portion of scintigraphy. Although renal vein thrombosis in native kidneys has a variable appearance depending on severity and stage of resolution, the classic appearance is of an enlarged kid-ney with intense cortical retention initially. In a trans-planted kidney, there are no venous collaterals to drain the kidney so the impact is more severe, causing the kid-ney to have an appearance similar to that of renal artery occlusion (Fig 9-31).
A postoperative leak may occur at the anastomotic site or result from rupture of an obstructed allograft. A progres-sive accumulation of activity occurs outside of the urinary tract on dynamic scintigraphic images. A slow leak may be seen as a photopenic defect from a nonradiolabeled uri-noma (Fig. 9-32). If Tc-99m DTPA is being used or if func-tion is poor, delayed imaging at 2 hours or later may be needed to detect increasing activity in this fluid collection. Delayed images with Tc-99m MAG3 may be misinter-preted as showing a leak because of the normal bowel activity appearance over time. Other fluid collections such as lymphoceles and hematomas may be noted as fixed pararenal, photon-deficient areas.
An obstructed allograft may present with hydronephro-sis or diminished urine output. Diuretic renography can be useful in evaluating suspected obstruction in a manner similar to that in native kidneys (Fig. 9-33). It is important that acute rejection is not present and that function is ade-quate to respond to the diuretic.
MEASURING RENAL FUNCTION: EFFECTIVE RENAL PLASMA FLOW AND GOMERULAR FILTRATION RATE
Normal GFR varies according to age, sex, and body size. Estimated GFR can be fairly reliably calculated using these factors and the serum creatinine (http://www.kidney.org/professionals/kdoqi/gfr_calculator.cfm). However, these estimations may not be reliable when function is very abnormal and changes from a unilateral abnormality may be difficult to detect.
Accurate quantification of GFR and ERPF with nonra-dioactive inulin and PAH is possible with continuous infu-sion to achieve a steady state and multiple blood and urine samples. Nuclear medicine techniques have evolved using

192 Nuclear Medicine: The Requisites
A B
C D
A
RA
R
E
0
Cou
nts
Cou
nts
168 24
Time (min)
8 160 24
Time (min)FFiGure 9-25. Acute allograft rejection. Postoperative Tc-99m MAG3 images of a right iliac fossa cadaveric transplant show good baseline blood flow (A) and reasonably good function (B). Six days later, the patient developed fever, allograft tenderness, and elevated serum creatinine. Repeat blood flow is diminished (C), and functional images show cortical retention (D). These findings are consistent with acute rejection. E, Perfusion time-activity curves show initial good blood flow (left) that falls on the follow-up study (right) as a result of acute rejection. F, The time-activity curves over the 25-minute study show adequate baseline function (left), which deteriorates at the time of rejection (right). A, Artery; R, right renal transplant.
Genitourinary SyStem 193
A
B
Cou
nts
Transplant
Time (min)
0 7 14 20 270
19,098
38,197
57,295
76,393
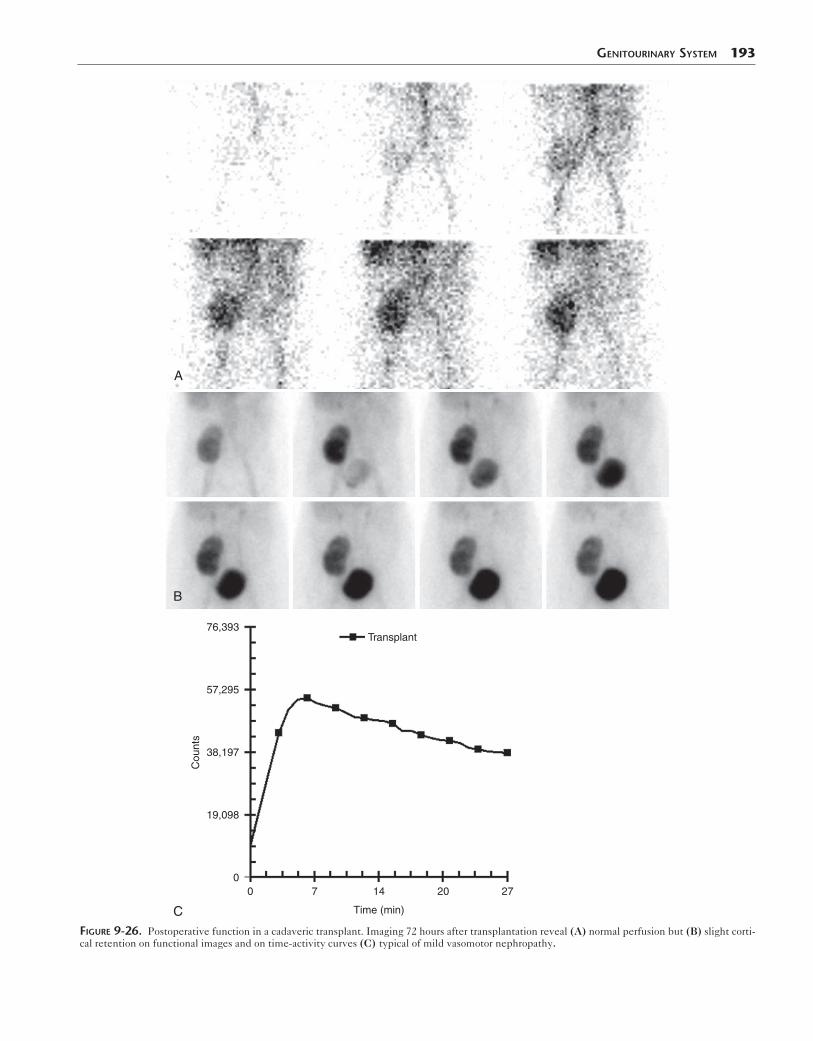
CFiGure 9-26. Postoperative function in a cadaveric transplant. Imaging 72 hours after transplantation reveal (A) normal perfusion but (B) slight corti-cal retention on functional images and on time-activity curves (C) typical of mild vasomotor nephropathy.
194 Nuclear Medicine: The Requisites
Cou
nts
Cou
nts
Time (min)
B
Time (min)D
A
C
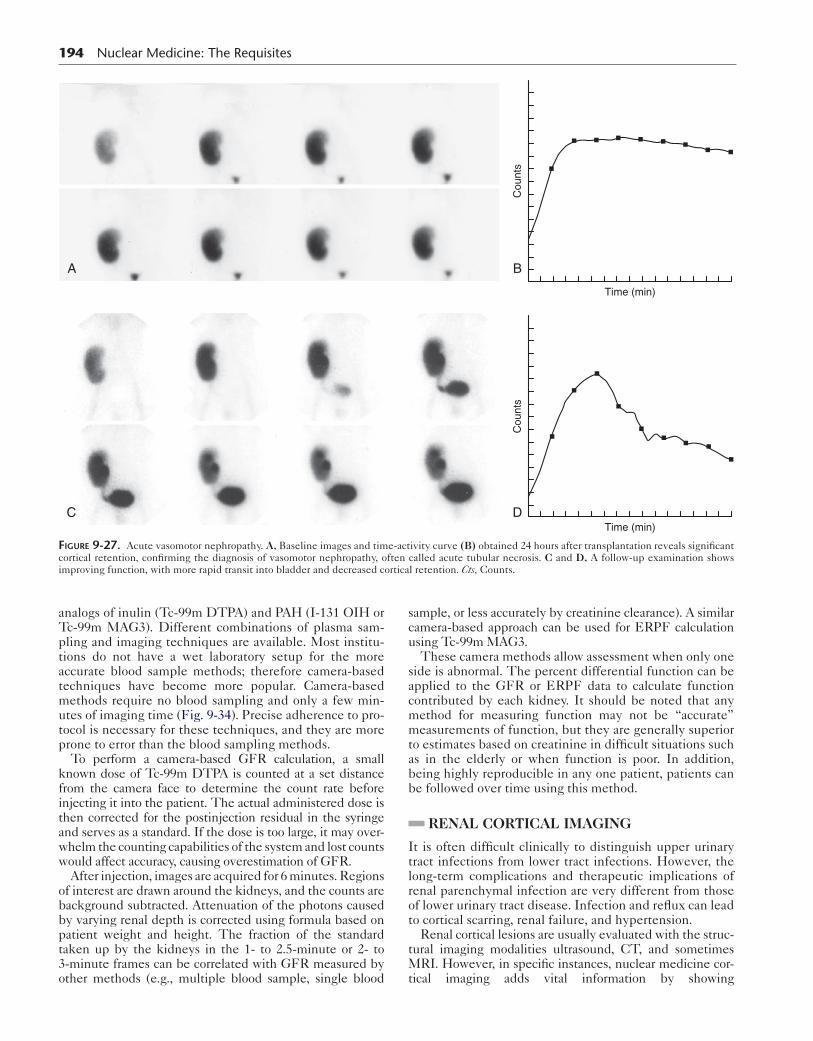
FiGure 9-27. Acute vasomotor nephropathy. A, Baseline images and time-activity curve (B) obtained 24 hours after transplantation reveals significant cortical retention, confirming the diagnosis of vasomotor nephropathy, often called acute tubular necrosis. C and D, A follow-up examination shows improving function, with more rapid transit into bladder and decreased cortical retention. Cts, Counts.
analogs of inulin (Tc-99m DTPA) and PAH (I-131 OIH or Tc-99m MAG3). Different combinations of plasma sam-pling and imaging techniques are available. Most institu-tions do not have a wet laboratory setup for the more accurate blood sample methods; therefore camera-based techniques have become more popular. Camera-based methods require no blood sampling and only a few min-utes of imaging time (Fig. 9-34). Precise adherence to pro-tocol is necessary for these techniques, and they are more prone to error than the blood sampling methods.
To perform a camera-based GFR calculation, a small known dose of Tc-99m DTPA is counted at a set distance from the camera face to determine the count rate before injecting it into the patient. The actual administered dose is then corrected for the postinjection residual in the syringe and serves as a standard. If the dose is too large, it may over-whelm the counting capabilities of the system and lost counts would affect accuracy, causing overestimation of GFR.
After injection, images are acquired for 6 minutes. Regions of interest are drawn around the kidneys, and the counts are background subtracted. Attenuation of the photons caused by varying renal depth is corrected using formula based on patient weight and height. The fraction of the standard taken up by the kidneys in the 1- to 2.5-minute or 2- to 3-minute frames can be correlated with GFR measured by other methods (e.g., multiple blood sample, single blood
sample, or less accurately by creatinine clearance). A similar camera-based approach can be used for ERPF calculation using Tc-99m MAG3.
These camera methods allow assessment when only one side is abnormal. The percent differential function can be applied to the GFR or ERPF data to calculate function contributed by each kidney. It should be noted that any method for measuring function may not be “accurate” measurements of function, but they are generally superior to estimates based on creatinine in difficult situations such as in the elderly or when function is poor. In addition, being highly reproducible in any one patient, patients can be followed over time using this method.
RENAL CORTICAL IMAGING
It is often difficult clinically to distinguish upper urinary tract infections from lower tract infections. However, the long-term complications and therapeutic implications of renal parenchymal infection are very different from those of lower urinary tract disease. Infection and reflux can lead to cortical scarring, renal failure, and hypertension.
Renal cortical lesions are usually evaluated with the struc-tural imaging modalities ultrasound, CT, and sometimes MRI. However, in specific instances, nuclear medicine cor-tical imaging adds vital information by showing

Genitourinary SyStem 195
Transplant
272014700
14,917
29,835
44,752
59,669 Renogram
BA
C
Transplant
272014700
8,212
16,425
24,637
32,849 Renogram
D
E
Transplant
27201470
11,627
23,253
34,880
46,506 Renogram
FFiGure 9-28. Time course of acute rejection. Baseline functional images (A) and time-activity curves (TACs) (B) are unremarkable. Two months later, images show delayed uptake and cortical retention (C). This is confirmed on the TAC (D). Function improves 1 week later with immunosuppressive therapy on the follow-up scan (E) and TAC (F).
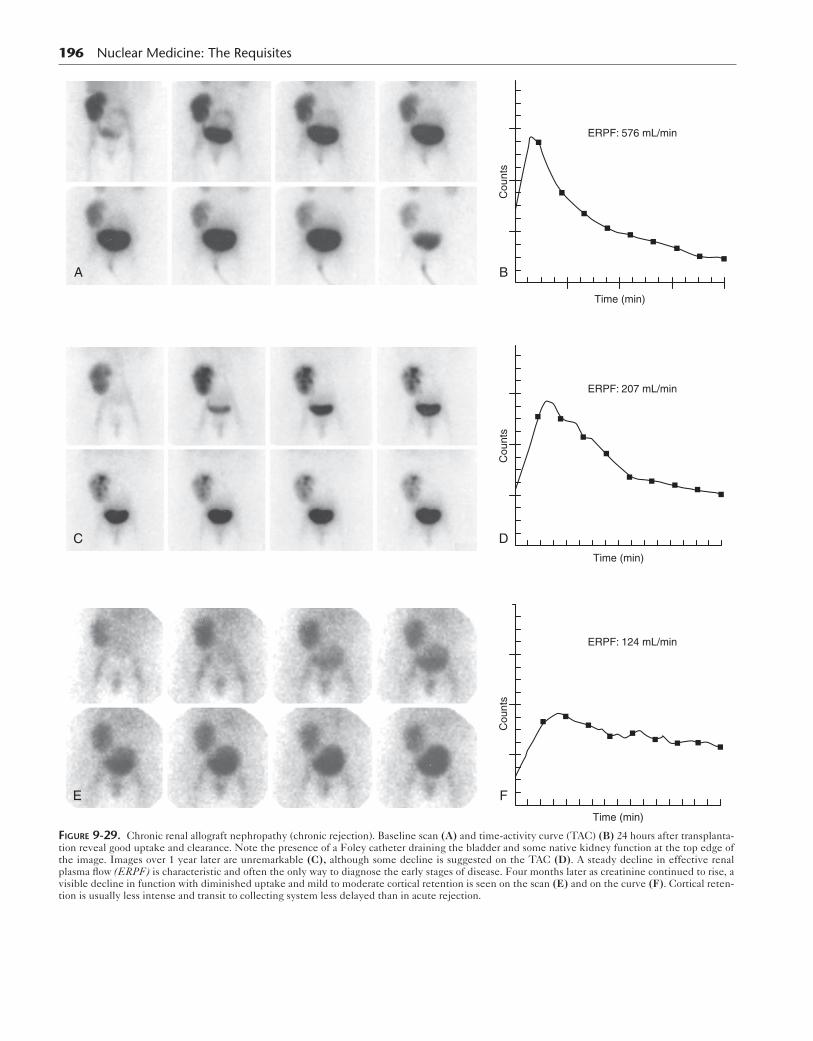
196 Nuclear Medicine: The Requisites
A
Cou
nts
Cou
nts
Cou
nts
C
E
ERPF: 576 mL/min
Time (min)
B
ERPF: 207 mL/min
Time (min)
D
ERPF: 124 mL/min
Time (min)
F
FiGure 9-29. Chronic renal allograft nephropathy (chronic rejection). Baseline scan (A) and time-activity curve (TAC) (B) 24 hours after transplanta-tion reveal good uptake and clearance. Note the presence of a Foley catheter draining the bladder and some native kidney function at the top edge of the image. Images over 1 year later are unremarkable (C), although some decline is suggested on the TAC (D). A steady decline in effective renal plasma flow (ERPF) is characteristic and often the only way to diagnose the early stages of disease. Four months later as creatinine continued to rise, a visible decline in function with diminished uptake and mild to moderate cortical retention is seen on the scan (E) and on the curve (F). Cortical reten-tion is usually less intense and transit to collecting system less delayed than in acute rejection.

Genitourinary SyStem 197
FiGure 9-30. Chronic renal allograft nephropathy (chronic rejection) in a 3-year-old transplanted kidney showing cortical scarring and retention with diminished washout. The prominent collecting system often present at this stage is not well seen in this particular case.
A
B
C
D
FiGure 9-31. Renal vein thrombosis. A, Renal vein thrombosis in a native kidney. The Tc-99m DTPA scan reveals poor uptake and delayed clearance in the left native kidney. B, Function improves on a follow-up scan 4 months later. C, D Images from a renal allograft with renal vein thrombosis. The radionuclide angiogram (C) demonstrates no perfusion to the transplanted kidney. D, Dynamic images acquired immediately after the flow study and sequentially every 5 minutes show a photopenic defect (arrowheads) resulting from nonviable allograft causing attenuation but having no uptake. LPO, Left posterior oblique; RPO, right posterior oblique.
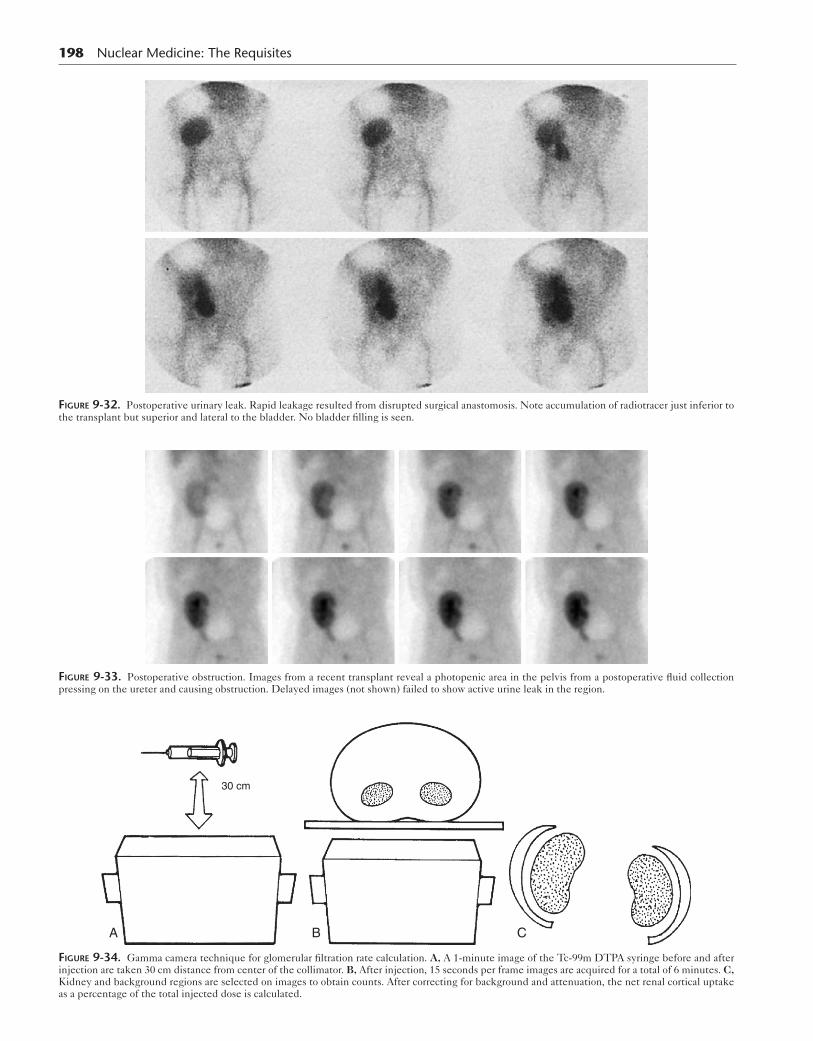
198 Nuclear Medicine: The Requisites
FiGure 9-32. Postoperative urinary leak. Rapid leakage resulted from disrupted surgical anastomosis. Note accumulation of radiotracer just inferior to the transplant but superior and lateral to the bladder. No bladder filling is seen.
FiGure 9-33. Postoperative obstruction. Images from a recent transplant reveal a photopenic area in the pelvis from a postoperative fluid collection pressing on the ureter and causing obstruction. Delayed images (not shown) failed to show active urine leak in the region.
30 cm
A B C
FiGure 9-34. Gamma camera technique for glomerular filtration rate calculation. A, A 1-minute image of the Tc-99m DTPA syringe before and after injection are taken 30 cm distance from center of the collimator. B, After injection, 15 seconds per frame images are acquired for a total of 6 minutes. C, Kidney and background regions are selected on images to obtain counts. After correcting for background and attenuation, the net renal cortical uptake as a percentage of the total injected dose is calculated.
improvements and changes over time that are difficult to see with anatomical imaging modalities. Tc-99m DMSA offers superior cortical resolution over Tc-99m MAG3 because of its significant cortical binding. Commonly, Tc-99m DMSA is used to evaluate suspected pyelonephritis or to possibly detect renal scarring in a patient with reflux. Occasionally, cortical scintigraphy is used to differentiate a prominent col-umn of Bertin seen on ultrasound from a true mass.
Acute Pyelonephritis
Acute pyelonephritis usually results from reflux of infected urine. The clinical diagnosis of acute pyelonephritis based on fever, flank pain, and positive urine cultures is unreli-able and especially difficult in infants. Therefore recurrent infections often occur and lead to significant damage and scarring. This process is a significant cause of long-term morbidity, causing hypertension and chronic renal failure.
CT can often identify the inflammatory change in the kid-ney, as can radiolabeled white blood cells and gallium-67 citrate. However, these tests are not suitable for frequent use, especially in children. Ultrasound is widely used to assess the kidney and is generally considered an essential part of the pyelonephritis workup. However, sonography is relatively insensitive to the inflammatory changes of acute pyelone-phritis and the residual cortical defects and scars. Reported ultrasound sensitivities range from 24% to 40% for pyelone-phritis and are approximately 65% for the detection of scars.
Cortical scintigraphy with Tc-99m DMSA is significantly more sensitive than sonography. Sensitivities for acute pyelonephritis are difficult to determine because Tc-99m DMSA is considered the gold standard. Most frequently, cortical scanning is done in children with acute pyelone-phritis, but it also may be performed as part of the workup in patients with vesicoureteral reflux who have no evidence of active pyelonephritis.
Method
With Tc-99m DMSA, dynamic imaging is not performed because background clearance is slow, and the kidney clears only a small percentage of the radiotracer. Delayed cortical planar or SPECT imaging is acquired. An example protocol is listed in Box 9-8.
Planar imaging usually requires at least both posterior and posterior oblique views. A pinhole collimator or con-verging collimator provides magnification and improved resolution. SPECT affords excellent image detail. How-ever, children may require sedation for SPECT because they must be completely still for the entire acquisition.
Image InterpretationThe normal Tc-99m DMSA scan should show a homoge-neous distribution throughout the renal cortex. The shape of the kidney is variable, as is the thickness of the cortex. The upper poles often may appear less intense because of splenic impression, fetal lobulation, and attenuation from liver and spleen. The central collecting system and medul-lary regions are photon deficient because Tc-99m DMSA tubular binding occurs in the cortex. The columns of Bertin will show radiopharmaceutical uptake and may appear quite prominent. In a study performed to differen-tiate the prominent column of Bertin from true mass, the
Genitourinary SyStem 199
Tc-99m DMSA scan will show radiotracer uptake in a col-umn of Bertin but not in a mass caused by tumor.
Areas of cortical tubular dysfunction from infection or scar present as cortical defects (Figs. 9-35 and 9-36). This may be caused by localized mass effect and edema from the inflammatory process and by actual tubular dysfunc-tion and ischemia. A tumor will present as a defect because cortical scanning is not specific. Therefore comparison with ultrasound is advisable.
Infection may present as a focal, ill-defined lesion or as a multifocal process. A diffuse decrease in activity also may be seen; if it occurs without volume loss, it would suggest a diffuse inflammatory process. Scars would be expected to have localized, sharp margins and may occur in a small kid-ney with associated cortical loss. However, it is extremely difficult to tell an area of acute inflammation from a scar without serial images, particularly in patients with clini-cally silent infections (Fig 9-37).
In the workup of acute abnormalities resulting from acute pyelonephritis, serial scans may also be useful to assess the extent of recovery. In general, it is advisable to wait 6 months from the acute infection to allow recovery. The acute inflammatory changes in pyelonephritis will usually resolve over time (nearly 40%) or significantly
Box 9-8. Renal Cortical Imaging Protocol Summary
RADIOPHARMACEUTICALTc-99m DMSA
Child: 50 μCi/kg (minimum dose of 600 μCi)Adult: 5 mCi (185 MBq)
INSTRUMENTATIONPlanar gamma camera: Large-field-of-view, parallel-hole
collimator for differential calculation. Pinhole collima-tor for cortical images. Converging collimator may be used for adults.
SPECT: Dual- or triple-head preferred
IMAGING PROCEDUREPatient should void before starting.Inject radiopharmaceutical intravenously.Image at 2 hours after injection.Acquire parallel collimator images for 500k on anterior
and posterior views for differential calculation.Pinhole images acquire for 100k counts per view.Position patient so each kidney is imaged separately,
but camera is equidistance from patient.Quantify function as geometric mean (square root
of the product of anterior and posterior counts).
SPECTCamera: Low-energy high-resolution collimatorMatrix: 128 × 128Zoom: As neededOrbit: Noncircular body contour, rotate 180 degrees,
step and shoot 40 views/head, 3 degrees/stop, 40-second/stop
Reconstruction: 64 × 64 Hamming filter with high cutoff
Smoothing kernelAttenuation correction
SPECT, Single-photon emission computed tomography.
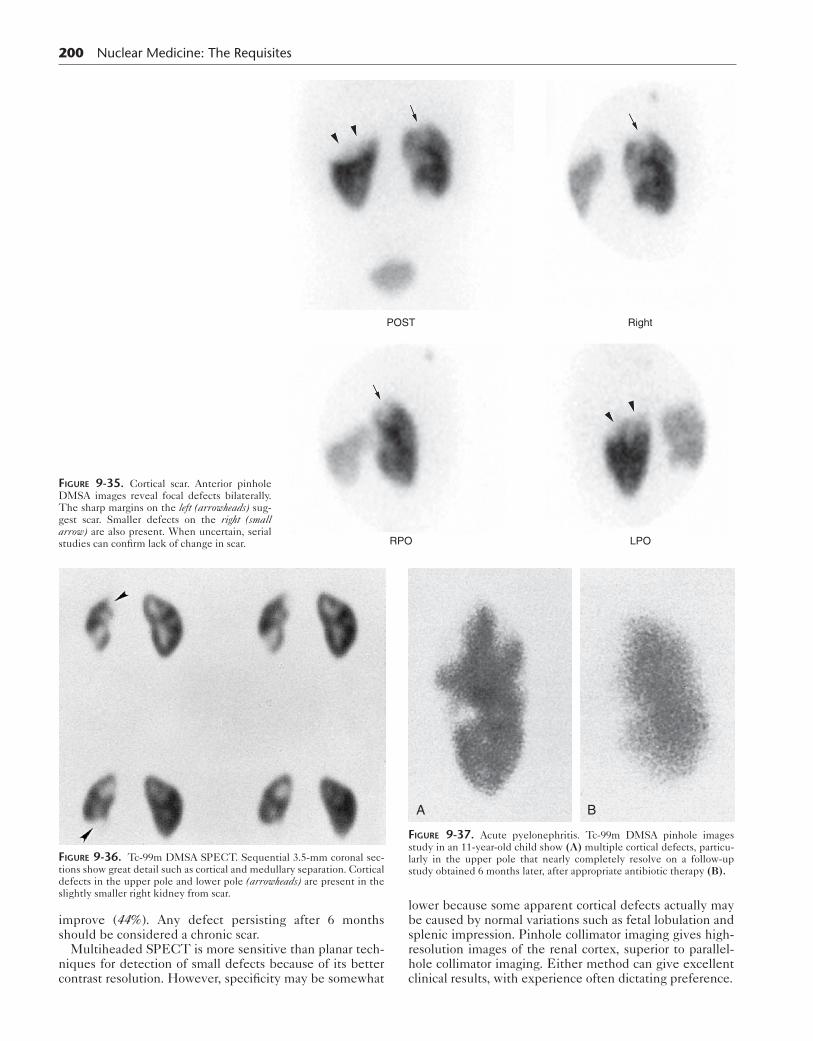
200 Nuclear Medicine: The Requisites
POST Right
RPO LPO
FiGure 9-35. Cortical scar. Anterior pinhole DMSA images reveal focal defects bilaterally. The sharp margins on the left (arrowheads) sug-gest scar. Smaller defects on the right (small arrow) are also present. When uncertain, serial studies can confirm lack of change in scar.
improve (44%). Any defect persisting after 6 months should be considered a chronic scar.
Multiheaded SPECT is more sensitive than planar tech-niques for detection of small defects because of its better contrast resolution. However, specificity may be somewhat
FiGure 9-36. Tc-99m DMSA SPECT. Sequential 3.5-mm coronal sec-tions show great detail such as cortical and medullary separation. Cortical defects in the upper pole and lower pole (arrowheads) are present in the slightly smaller right kidney from scar.
lower because some apparent cortical defects actually may be caused by normal variations such as fetal lobulation and splenic impression. Pinhole collimator imaging gives high-resolution images of the renal cortex, superior to parallel-hole collimator imaging. Either method can give excellent clinical results, with experience often dictating preference.
A B
FiGure 9-37. Acute pyelonephritis. Tc-99m DMSA pinhole images study in an 11-year-old child show (A) multiple cortical defects, particu-larly in the upper pole that nearly completely resolve on a follow-up study obtained 6 months later, after appropriate antibiotic therapy (B).

RADIONUCLIDE CYSTOGRAPHY
Vesicoureteral Reflux
Untreated reflux and infection are associated with subse-quent renal damage, scarring, hypertension, and chronic renal failure. Vesicoureteral reflux (VUR) occurs in approx-imately 1% to 2% of the pediatric population. In patients with acute pyelonephritis, VUR is present in approxi-mately 40% of patients. In untreated patients, VUR is responsible for 5% to 40% of end-stage renal disease in patients under 16 years of age and 5% to 20% of adults younger than 50 years of age.
VUR is caused by a failure of the ureterovesical valve. The normal ureter passes obliquely through the bladder wall and submucosa to its opening at the trigone. As urine fills the bladder, the valve passively closes, preventing reflux. If the intramural ureteral length is too short in rela-tion to its diameter or if the course is too direct, the valve will not close completely and reflux results. As a child grows, the ureter usually grows in length more than in diameter, resulting in decreased reflux and eventual reso-lution in 80% of patients. Spontaneous resolution by 2 to 3 years of age is seen in 40% to 60% of VUR diagnosed pre-natally. Even among patients with severe reflux, resolution occurs spontaneously in 20% within 5 years.
Renal damage is more likely in patients with severe rather than mild or moderate grades of reflux. Reflux by itself is not pathological; that is, sterile low-pressure reflux does not cause renal injury. The intrarenal reflux of infected urine is required for damage to develop. In patients with-out reflux, pyelonephritis has been presumed to be sec-ondary to causes such as fimbriated bacteria, which can climb the ureter. Antibiotic therapy is the first line of defense. Renal scaring has been decreased from 35% to 60% in untreated patients down to 10% with therapy. The goal of therapy is to prevent infection of the kidney until reflux resolves spontaneously. However, antibiotics do not completely protect the kidney from infection and scar. Therefore patients must be carefully monitored, and serial Tc-99m DMSA scans may be helpful.
Radionuclide cystography was introduced in the late 1950s to diagnose VUR and is widely accepted as the tech-nique of choice for evaluation and follow-up of children with UTIs and reflux. The radionuclide method is more sensitive than contrast-enhanced cystography for detect-ing reflux and results in considerably less radiation expo-sure to the patient. In many centers, contrast-voiding urethrocystography is reserved for the initial workup of male patients to exclude an anatomical cause for reflux, such as posterior urethral valves.
VCUG screening is recommended for siblings of patients with reflux. It must be remembered that reflux and pyelo-nephritis may be clinically silent. These siblings are at an increased risk of approximately 40% for VUR.
Methodology
Indirect radionuclide cystography can be performed as part of routine dynamic renal scintigraphy done with Tc-99m MAG3. The child is asked to not void until the bladder is maximally distended. When the bladder is as full as can be tolerated, a prevoiding image is obtained. Then dynamic
Genitourinary SyStem 201
images are acquired during voiding. A postvoid image is obtained once voiding is done. Although this test has an advantage because the bladder is not catheterized, upper-tract stasis often poses a problem for interpretation. In addition, the indirect method cannot detect the reflux that occurs during bladder filling (20%).
Direct radionuclide cystography is the most commonly used method for diagnosing reflux. It is done as a three-phase process with continuous imaging during bladder filling, dur-ing micturition, and after voiding. Besides diagnosing reflux, this procedure can quantitate postvoid bladder residuals.
The protocol for radionuclide retrograde cystography and residual bladder volume calculation is listed in Box 9-9. The high sensitivity depends on rapid and continuous imaging. Tc-99m sulfur colloid and Tc-99m DTPA are the radiophar-maceuticals most commonly used. Tc-99m pertechnetate may be absorbed through the bladder, particularly if the bladder is inflamed. A solution of 1 mCi of radiotracer in 500 mL normal saline provides sufficient concentration.
Box 9-9. Radionuclide Retrograde Cystography Protocol Summary
RADIOPHARMACEUTICALTc-99m sulfur colloid, 1 mCi (37 MBq)
PATIENT PREPARATIONInsert Foley aseptically, inflate balloon, tape to
secure.Use clean weighed diaper for infants.
POSITIONPatient supine with bladder and kidneys in field of
view. Camera under table.
INSTRUMENTATIONCamera: Single-head, large field of viewCollimator: Converging for newborns younger than
1 year; low energy, high resolution otherwiseComputer: 64 × 64 word matrixFilling phase: 10-second frame for 60 second; prevoid
30-second; voiding 2-second/frame for 120 second; postvoid 30-second
IMAGING PROCEDUREHang 500-mL bag of normal saline 25 cm above table.Inject radiotracer into tubing connected to bladder
catheter.Filling phase: Fill bladder to maximal capacity
(age + 2) × 30 = volume instill (milliliters).Fill until drip slows or voids around catheter.
VOIDING PHASEPlace camera perpendicular to table.Place patient sitting on bedpan, back against camera
(infants stay supine and void into diaper).Deflate Foley balloon, and have patient void.Measure urine volume (or weigh diaper to determine
output).
INTERPRETATIONTotal bladder volume residual postvoid volume
and bladder volume at initiation of reflux can be measured.

202 Nuclear Medicine: The Requisites
table 9-5 Radiation Dosimetry for Technetium-99m Direct Cystography
Suggested doseMBq (mCi)
Organ receiving highestmGy/MBq (rad/mCi)
Effective dosemSv/MBq (rem/mCi)
18.5-37 (0.5-1.0)
Bladder
0.028 (0.10) 0.0024 (0.0089)
Data from the 2003 Society of Nuclear Medicine Procedure Guidelines. Available at: http://www.snm.org for children 5 years of age.
Fb
Dosimetry
The absorbed radiation dose is quite low. A list is provided in Table 9-5. From 50 to 200 times less radiation is deliv-ered to the gonads from the radionuclide method than with contrast cystography.
Image Interpretation
In a normal study, no radiotracer is seen in the ureters or kidneys. Any reflux is abnormal and readily detected by the presence of activity above the bladder (Fig. 9-38).
B
A
iGure 9-38. Vesicoureteral reflux. A, During the filling phase, reflux is seen first on the right, then bilaterally in B. On voiding, the left side clears etter than the right. Reflux is seen in the renal pelvic region bilaterally from grade II to III reflux.

Reflux grades have been described for radiographic con-trast studies (Fig. 9-39). In this system, criteria include the level the reflux reaches, the dilation of the renal pel-vis, and ureteral dilation and tortuosity. However, ana-tomical resolution is much lower with scintigraphic methods and calyceal morphology is not well defined.
A radionuclide grading system would report activity con-fined to the ureter grade I reflux, similar to the radiographic grade I. A scintigraphic grade II would include reflux to the renal pelvis and corresponds to x-ray cystography grades II and III. If a diffusely dilated system is seen on the scintigrams, it corresponds to grades IV and V seen with contrast cystography.
I II III IV V
FiGure 9-39. Vesicoureteral contrast grading system (International Reflux Study Committee). I, Ureteral reflux only. II, Reflux into ureter, pelvis, and calyces without dilation. III, Mild to moderate dilation/tortu-osity of ureter and calyceal dilatation. IV, Moderate dilation and tortuosity of ureter and moderate dilation of the renal pelvis. The angles of the fornices obliterated, but the papillary impressions maintained. V, Gross dilation and tortuosity of the ureter and gross dilation of the renal pelvis and calyces. Papillary impressions no longer visible in most calyces.
Genitourinary SyStem 203
Radionuclide cystography is more sensitive than the radiographic contrast technique. The radionuclide tech-nique permits detection of reflux volumes on the order of 1 mL. In one study comparing the two techniques, 17% of reflux events were seen only on the radionuclide examina-tion. Although radionuclide voiding cystography can miss low level I reflux because of the adjacent bladder activity, it is generally accepted that level I reflux is of little conse-quence. If a study is negative but clinical suspicion is high, refilling the bladder will improve sensitivity. This is not routinely done, however.
SuggeSted readingS
Blaufox MD, Aurell M, Bubeck B, et al. Report of the Radionuclides in Nephrology Committee on Renal Clearance. J Nucl Med. 1996;37(11):1883-1890.
Dubovsky EV, Russell CD, Bischof-Delaloye A, et al. Report of the radionuclides in nephrology committee for evaluation of transplanted kidney (review of techniques). Semin Nucl Med. 1999;29(2):175-188.
Fouzas S, Krikelli E, Vassilakos P, et al. DMSA scan for revealing vesicoureteral reflux in children with urinary tract infections. Pediatrics. 2010;126(3):e513-e519.
Gates GF. Glomerular filtration rate: estimation from fractional renal accumulation of Tc-99m DTPA (stannous). AJR Am J Roentgenol. 1982;138:565-570.
Liu Y, Blaufox MD. Use of radionuclides to study renal function. Methods Mol Med. 2003;86:79-117.
Maisey M. Radionuclide renography: a review. Curr Opin Nephrol Hypertens. 2003;12(6):649-652.
Perez-Brayfield MR, Kirsch AJ, Jones RA. A prospective study comparing ultrasound, nuclear scintigraphy and dynamic contrast enhanced magnetic resonance imaging in the evaluation of hydronephrosis. J Urol. 2003;170(4 Pt 1):1330-1334.
Prigent A, Cosgriff P, Gates GF, et al. Consensus report on quality control of quantitative measurements of renal function obtained from the renogram. International Committee from the Scientific Committee of Radionuclides in Nephrology. Semin Nucl Med. 1999;29(2):146-159.
Russell CD, Bischoff PG, Kontzen F, et al. Measurement of glomerular filtration rate using Tc-99m-DTPA and the gamma camera method. Eur J Nucl Med. 1985;10(11-12):519-521.
Sfakianakis GN, Sfakianakis E, Georgiou M, et al. A renal protocol for all ages and indications: mercapto-acetyl-triglycine (MAG3) with simultaneous injection of furosemide (MAG3-F0)—a 17 year experience. Semin Nucl Med. 2009;39(3):156-173.
Taylor A, Manatunga A, Morton K, et al. Multicenter trial of a camera-based method to measure Tc-99m mecaptoacetyltriglycine, or Tc-99m MAG3, clearance. Radiology. 1997;204(1):47-54.
Taylor A, Nally J, Aurell M, et al. Consensus report on ACE inhibitor renography for detecting renovascular hypertension. J Nucl Med. 1996;37(11):1876-1882.