Anc3a1lisis de Sistemas de Potenciasolucionario John Grainger William Stevenson
Upload
jared-jenningsCategory
view
356download
15
9-1 Management of Quality
William J. Stevenson
Operations Management
8th edition
9-2 Management of Quality
CHAPTER9
Management of Quality
McGraw-Hill/IrwinOperations Management, Eighth Edition, by William J. StevensonCopyright © 2005 by The McGraw-Hill Companies, Inc. All rights
reserved.
9-3 Management of Quality
Quality ManagementQuality Management
What does the term quality mean?
Quality is the ability of a product or service to consistently meet or exceed customer expectations.
9-4 Management of Quality
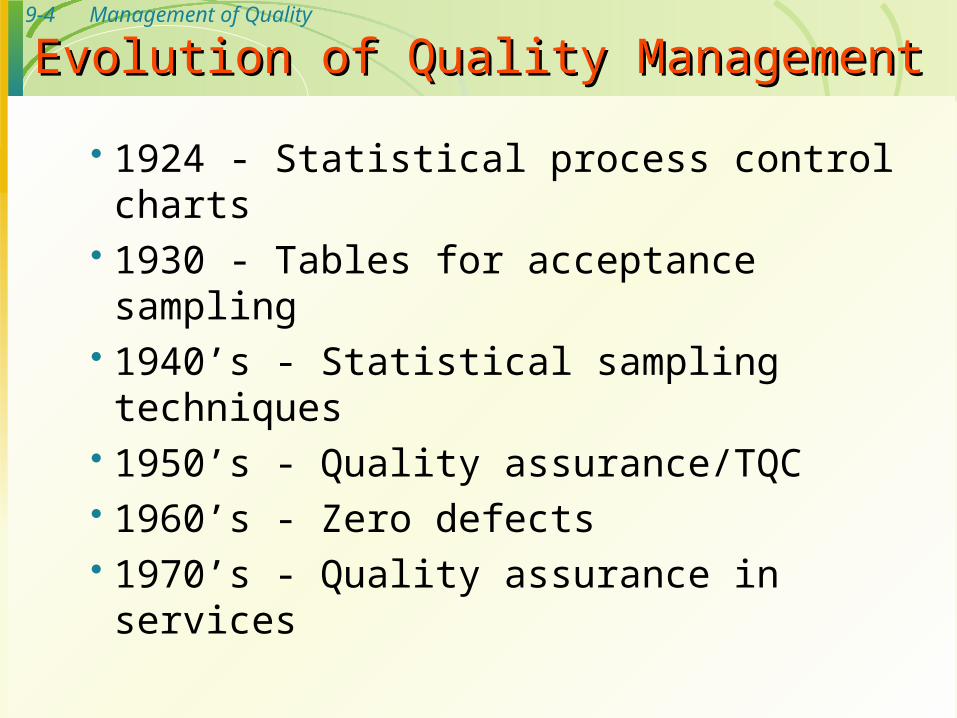
Evolution of Quality ManagementEvolution of Quality Management
1924 - Statistical process control charts 1930 - Tables for acceptance sampling 1940’s - Statistical sampling techniques 1950’s - Quality assurance/TQC 1960’s - Zero defects 1970’s - Quality assurance in services

9-5 Management of Quality
Quality Assurance vs. Strategic ApproachQuality Assurance vs. Strategic Approach
Quality Assurance Emphasis on finding and correcting defects
before reaching market Strategic Approach
Proactive, focusing on preventing mistakes from occurring
Greater emphasis on customer satisfaction

9-6 Management of Quality
The Quality GurusThe Quality Gurus
Walter Shewhart “Father of statistical quality control”
W. Edwards Deming Joseph M. Juran Armand Feignbaum Philip B. Crosby Kaoru Ishikawa Genichi Taguchi

9-7 Management of Quality
Key Contributors to Quality ManagementKey Contributors to Quality Management
Contributor
Deming Juran Feignbaum Crosby Ishikawa Taguchi
Known for
14 points; special & common causes of variation Quality is fitness for use; quality trilogy Quality is a total field Quality is free; zero defects Cause-and effect diagrams; quality circles Taguchi loss function
Quality
Table 9.2

9-8 Management of Quality
Dimensions of QualityDimensions of Quality
Performance - main characteristics of the product/service
Aesthetics - appearance, feel, smell, taste Special Features - extra characteristics Conformance - how well product/service
conforms to customer’s expectations Reliability - consistency of performance

9-9 Management of Quality
Dimensions of Quality (Cont’d)Dimensions of Quality (Cont’d)
Durability - useful life of the product/service
Perceived Quality - indirect evaluation of quality (e.g. reputation)
Serviceability - service after sale

9-10 Management of Quality
Examples of Quality DimensionsExamples of Quality Dimensions
Dimension
1. Performance 2. Aesthetics 3. Special features
(Product) Automobile
Everything works, fit & finish Ride, handling, grade of materials used Interior design, soft touch Gauge/control placement Cellular phone, CD player
(Service) Auto Repair
All work done, at agreed price Friendliness, courtesy, Competency, quickness Clean work/waiting area Location, call when ready Computer diagnostics
9-11 Management of Quality
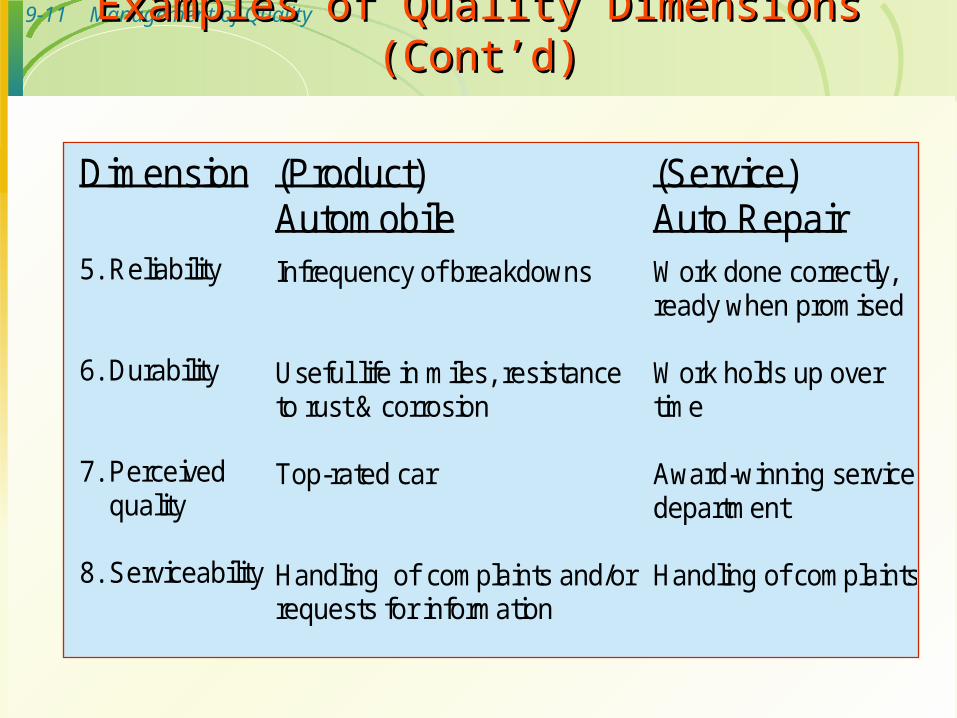
Examples of Quality Dimensions (Cont’d)Examples of Quality Dimensions (Cont’d)
Dimension
5. Reliability 6. Durability 7. Perceived quality 8. Serviceability
(Product) Automobile
Infrequency of breakdowns Useful life in miles, resistance to rust & corrosion Top-rated car Handling of complaints and/or requests for information
(Service) Auto Repair
Work done correctly, ready when promised Work holds up over time Award-winning service department Handling of complaints

9-12 Management of Quality
Service QualityService Quality
Tangibles Convenience Reliability Responsiveness Time Assurance Courtesy

9-13 Management of Quality
Examples of Service QualityExamples of Service Quality
Dimension Examples1. Tangibles Were the facilities clean, personnel neat?
2. Convenience Was the service center conveniently located?
3. Reliability Was the problem fixed?
4. Responsiveness Were customer service personnel willing and able to answer questions?
5. Time How long did the customer wait?
6. Assurance Did the customer service personnel seem knowledgeable about the repair?
7. Courtesy Were customer service personnel and the cashierfriendly and courteous?
Table 9.4

9-14 Management of Quality
Determinants of QualityDeterminants of Quality
Service
Ease ofuse
Conforms to design
Design

9-15 Management of Quality
Determinants of Quality (cont’d)Determinants of Quality (cont’d)
Quality of design Intension of designers to include or exclude
features in a product or service Quality of conformance
The degree to which goods or services conform to the intent of the designers

9-16 Management of Quality
The Consequences of Poor QualityThe Consequences of Poor Quality
Loss of business Liability Productivity Costs

9-17 Management of Quality
Top management Design Procurement Production/operations Quality assurance Packaging and shipping Marketing and sales Customer service
Responsibility for QualityResponsibility for Quality
9-18 Management of Quality
Costs of QualityCosts of Quality
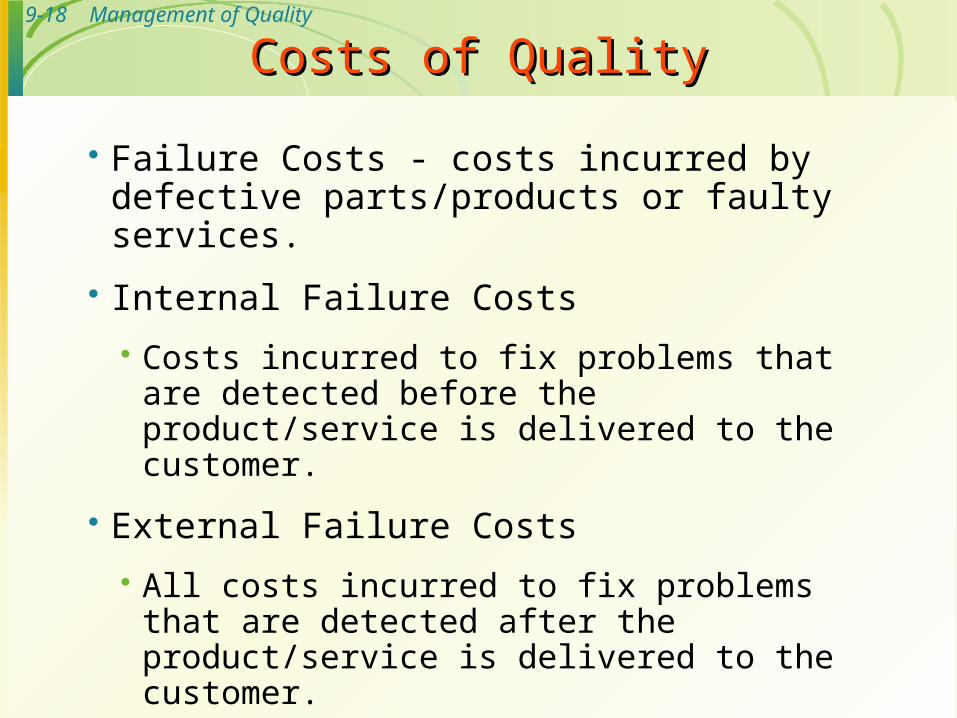
Failure Costs - costs incurred by defective parts/products or faulty services.
Internal Failure Costs
Costs incurred to fix problems that are detected before the product/service is delivered to the customer.
External Failure Costs
All costs incurred to fix problems that are detected after the product/service is delivered to the customer.

9-19 Management of Quality
Costs of Quality (continued)Costs of Quality (continued)
Appraisal Costs Costs of activities designed to ensure quality
or uncover defects Prevention Costs
All TQ training, TQ planning, customer assessment, process control, and quality improvement costs to prevent defects from occurring

9-20 Management of Quality
Substandard work Defective products Substandard service Poor designs Shoddy workmanship Substandard parts and materials
Ethics and QualityEthics and Quality
Having knowledge of this and failing to correctand report it in a timely manner is unethical.
9-21 Management of Quality
Quality AwardsQuality Awards
Baldrige Award
Deming Prize

9-22 Management of Quality
Malcolm Baldrige National Quality AwardMalcolm Baldrige National Quality Award
1.0 Leadership (125 points)
2.0 Strategic Planning (85 points)
3.0 Customer and Market Focus (85 points)
4.0 Information and Analysis (85 points)
5.0 Human Resource Focus (85 points)
6.0 Process Management (85 points)
7.0 Business Results (450 points)

9-23 Management of Quality
Benefits of Baldrige CompetitionBenefits of Baldrige Competition
Financial success Winners share their knowledge The process motivates employees The process provides a well-designed quality
system The process requires obtaining data The process provides feedback
9-24 Management of Quality
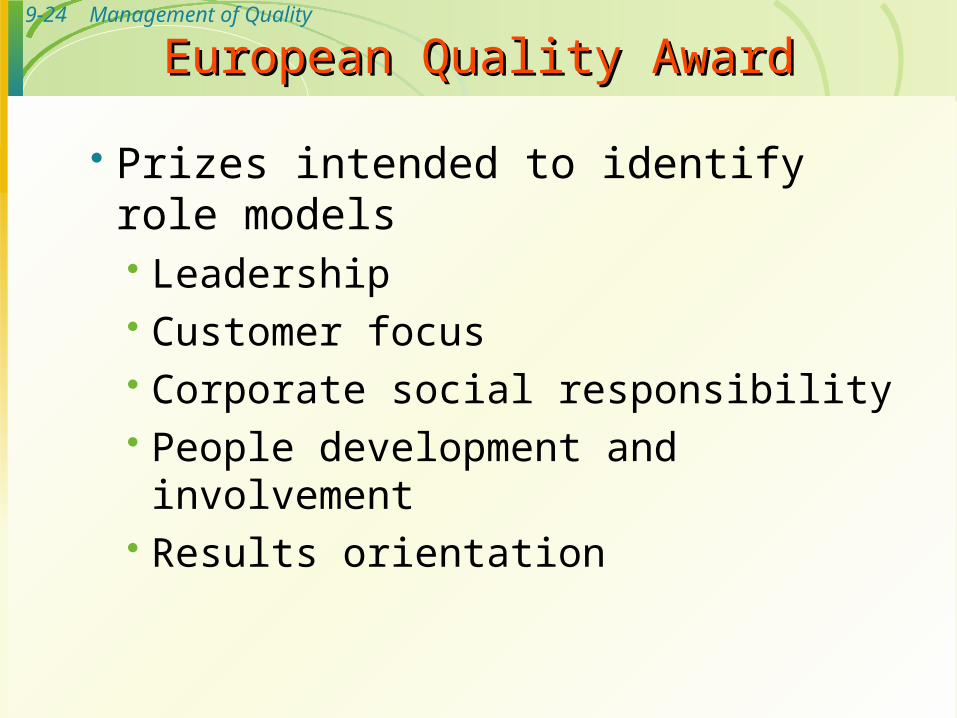
European Quality AwardEuropean Quality Award
Prizes intended to identify role models Leadership Customer focus Corporate social responsibility People development and involvement Results orientation

9-25 Management of Quality
The Deming PrizeThe Deming Prize
Honoring W. Edwards Deming
Japan’s highly coveted award
Main focus on statistical quality control

9-26 Management of Quality
Quality CertificationQuality Certification
ISO 9000 Set of international standards on quality
management and quality assurance, critical to international business
ISO 14000 A set of international standards for assessing
a company’s environmental performance

9-27 Management of Quality
ISO 9000 StandardsISO 9000 Standards
Requirements
System requirements
Management
Resource
Realization
Remedial

9-28 Management of QualityISO 9000 Quality Management ISO 9000 Quality Management PrinciplesPrinciples
A systems approach to management Continual improvement Factual approach to decision making Mutually beneficial supplier relationships Customer focus Leadership People involvement Process approach

9-29 Management of Quality
ISO 14000 - A set of international standards for assessing a company’s environmental performance
Standards in three major areas Management systems Operations Environmental systems
ISO 14000ISO 14000

9-30 Management of Quality
Management systems Systems development and integration of
environmental responsibilities into business planning
Operations Consumption of natural resources and energy
Environmental systems Measuring, assessing and managing
emissions, effluents, and other waste
ISO 14000ISO 14000

9-31 Management of Quality
Total Quality ManagementTotal Quality Management
A philosophy that involves everyone in an organization in a continual effort to improve quality and achieve customer satisfaction.
T Q M

9-32 Management of Quality
1. Find out what the customer wants
2. Design a product or service that meets or exceeds customer wants
3. Design processes that facilitates doing the job right the first time
4. Keep track of results
5. Extend these concepts to suppliers
The TQM ApproachThe TQM Approach

9-33 Management of Quality
Elements of TQMElements of TQM
Continual improvement Competitive benchmarking Employee empowerment Team approach Decisions based on facts Knowledge of tools Supplier quality Champion Quality at the source Suppliers

9-34 Management of Quality
Continuous ImprovementContinuous Improvement
Philosophy that seeks to make never-ending improvements to the process of converting inputs into outputs.
Kaizen: Japanese word for continuous improvement.

9-35 Management of Quality
Quality at the SourceQuality at the Source
The philosophy of making each worker responsible for the quality of his or her work.

9-36 Management of Quality
Six SigmaSix Sigma
Statistically Having no more than 3.4 defects per million
Conceptually Program designed to reduce defects Requires the use of certain tools and
techniques

9-37 Management of Quality
Six Sigma ProgramsSix Sigma Programs
Six Sigma programs Improve quality Save time Cut costs
Employed in Design Production Service Inventory management Delivery
9-38 Management of Quality
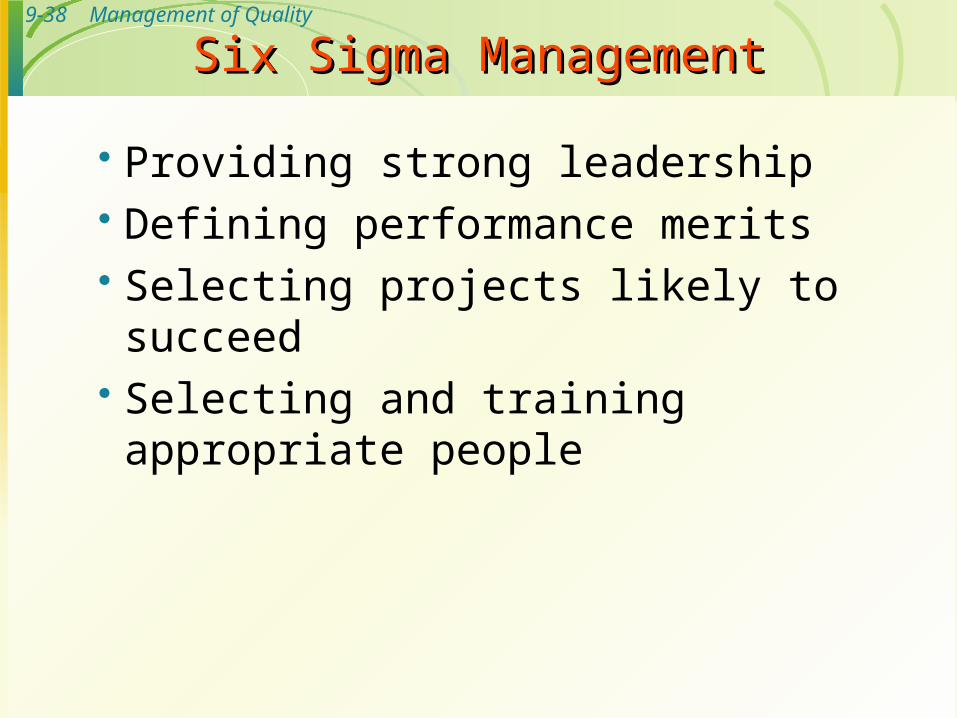
Six Sigma ManagementSix Sigma Management
Providing strong leadership Defining performance merits Selecting projects likely to succeed Selecting and training appropriate people

9-39 Management of Quality
Six Sigma TechnicalSix Sigma Technical
Improving process performance Reducing variation Utilizing statistical models Designing a structured improvement strategy

9-40 Management of Quality
Six Sigma TeamSix Sigma Team
Top management Program champions Master “black belts” “Black belts” “Green belts”

9-41 Management of Quality
Six Sigma ProcessSix Sigma Process
Define Measure Analyze Improve Control
DMAIC
9-42 Management of Quality
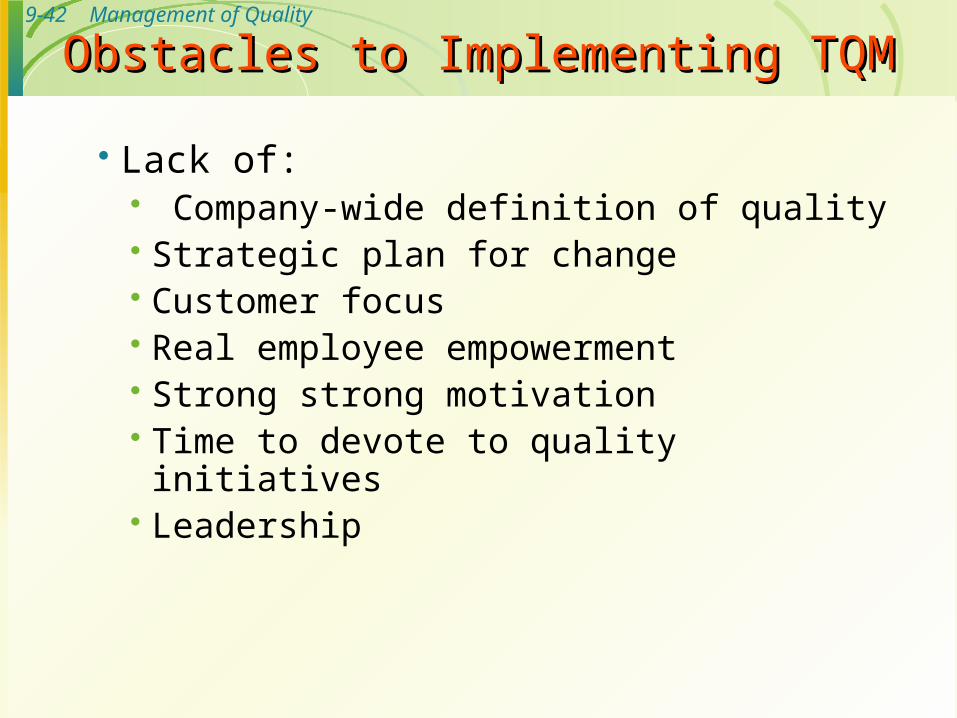
Lack of: Company-wide definition of quality Strategic plan for change Customer focus Real employee empowerment Strong strong motivation Time to devote to quality initiatives Leadership
Obstacles to Implementing TQMObstacles to Implementing TQM

9-43 Management of Quality
Poor inter-organizational communication View of quality as a “quick fix” Emphasis on short-term financial results Internal political and “turf” wars
Obstacles to Implementing TQMObstacles to Implementing TQM

9-44 Management of Quality
Criticisms of TQMCriticisms of TQM
Blind pursuit of TQM programs Programs may not be linked to strategies Quality-related decisions may not be tied to
market performance Failure to carefully plan a program

9-45 Management of Quality
Basic Steps in Problem SolvingBasic Steps in Problem Solving
1. Define the problem and establish an improvement goal
2. Collect data
3. Analyze the problem
4. Generate potential solutions
5. Choose a solution
6. Implement the solution
7. Monitor the solution to see if it accomplishes the goal

9-46 Management of Quality
The PDSA CycleThe PDSA Cycle
Plan
Do
Study
Act

9-47 Management of Quality
Process Improvement: A systematic approach to improving a process
Process mapping Analyze the process Redesign the process
Process ImprovementProcess Improvement
9-48 Management of Quality
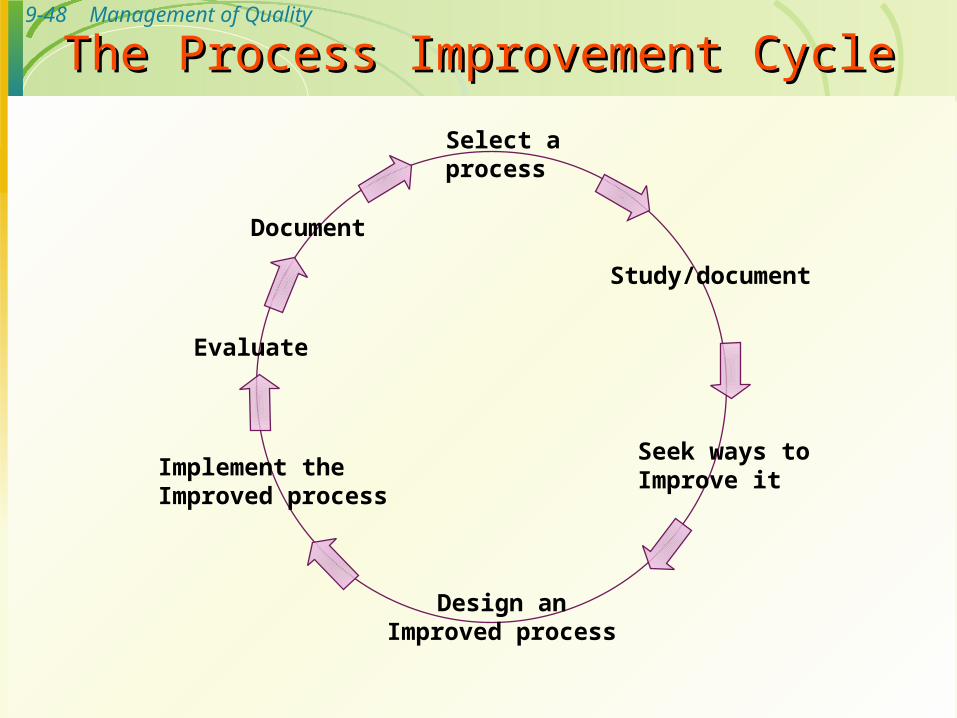
The Process Improvement CycleThe Process Improvement Cycle
Implement theImproved process
Select aprocess
Study/document
Seek ways toImprove it
Design anImproved process
Evaluate
Document

9-49 Management of Quality
Process Improvement and ToolsProcess Improvement and Tools
Process improvement - a systematic approach to improving a process Process mapping Analyze the process Redesign the process
Tools There are a number of tools that can be used for problem solving and process
improvement Tools aid in data collection and interpretation, and provide the basis for decision
making

9-50 Management of Quality
Basic Quality ToolsBasic Quality Tools
Flowcharts Check sheets Histograms Pareto Charts Scatter diagrams Control charts Cause-and-effect diagrams Run charts

9-51 Management of Quality
Check SheetCheck Sheet
Billing Errors
Wrong Account
Wrong Amount
A/R Errors
Wrong Account
Wrong Amount
Monday

9-52 Management of Quality
Pareto AnalysisPareto Analysis
80% of the problems may be
attributed to 20% of the
causes.
80% of the problems may be
attributed to 20% of the
causes.
Smearedprint
Nu
mb
er o
f d
efec
ts
Offcenter
Missinglabel
Loose Other

9-53 Management of Quality
Control ChartControl Chart
970
980
990
1000
1010
1020
0 1 2 3 4 5 6 7 8 9 10 11 12 13 14 15
UCL
LCL
Figure 9.11

9-54 Management of Quality
Cause-and-Effect DiagramCause-and-Effect DiagramFigure 9.12
Effect
MaterialsMethods
EquipmentPeople
Environment
Cause
Cause
Cause
Cause
Cause
CauseCause
Cause
CauseCause
Cause
Cause
9-55 Management of Quality
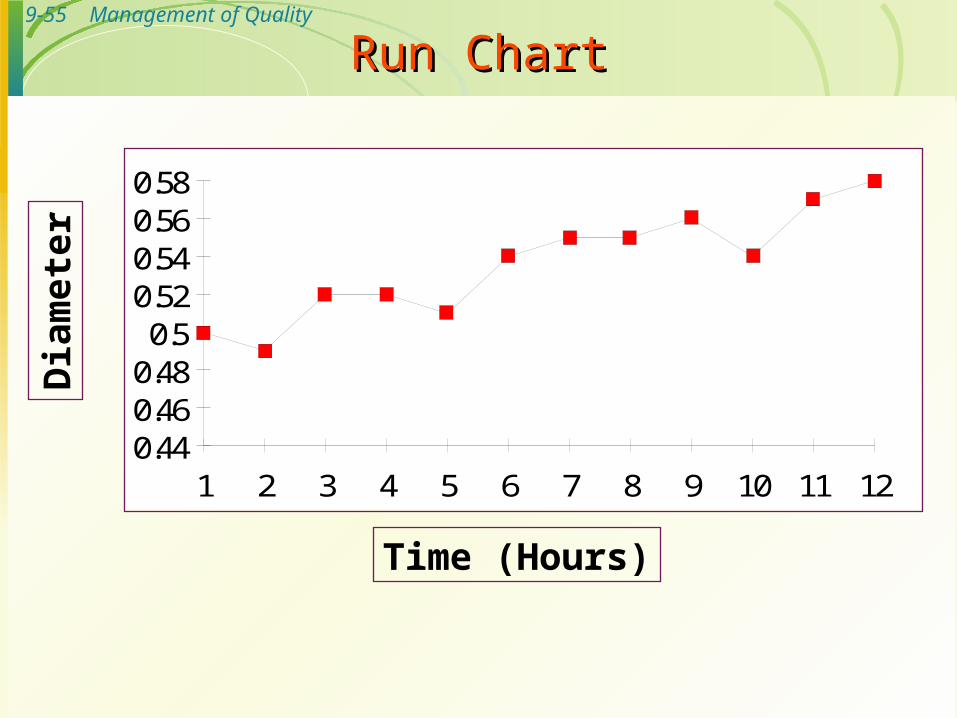
Run ChartRun Chart
Time (Hours )
0.440.460.480.5
0.520.540.560.58
1 2 3 4 5 6 7 8 9 10 11 12
Time (Hours)
Dia
met
er

9-56 Management of Quality
Tracking ImprovementsTracking Improvements
UCL
LCL
LCLLCL
UCLUCL
Process not centeredand not stable
Process centeredand stable
Additional improvementsmade to the process
Figure 9-17

9-57 Management of Quality
Methods for Generating IdeasMethods for Generating Ideas
Brainstorming
Quality circles
Interviewing
Benchmarking
5W2H

9-58 Management of Quality
Team approach List reduction Balance sheet Paired comparisons
Quality Circles Quality Circles
9-59 Management of Quality
Identify a critical process that needs improving
Identify an organization that excels in this process
Contact that organization Analyze the data Improve the critical process
Benchmarking ProcessBenchmarking Process

9-60 Management of Quality
Additional PowerPoint slides contributed by Geoff Willis, University of Central Oklahoma.
CHAPTER9

9-61 Management of Quality
GURUSGURUS
DEMING JURAN CROSBY ISHIKAWA

9-62 Management of Quality
7 Basic Tools7 Basic Tools
Flow Chart Check Sheet Histogram Pareto Chart Scatter Diagram Cause & Effect Diagram Statistical Process Control

9-63 Management of Quality
Flow Chart Example: Flow Chart Example: Self-Serve Gas Before ImprovementSelf-Serve Gas Before Improvement
Drive in check price self serve? to pumpshut offengine
walk to paystation
yes
no
check card transmit approved?turn onpump
yesno
backto car
pumpgas
walk tobooth
wait
employeetotalscharges
checkaccuracy
preparereceipt
signcopy
copy tofile
copy towallet
return to car
on the roadagain

9-64 Management of QualityFlow Chart Example:Flow Chart Example:
Self-Serve Gas After ImprovementSelf-Serve Gas After Improvement
Drive incheckprice self-serve?
no
yes
go topump
shut offengine insert
cardin pump
checkcredit card
wait
approved?
no
yes
wait forreceipt
store in system
copy towallet
on the roadagainpump gas

9-65 Management of Quality
ExampleExampleE
xam
Sco
re
Homework Problems

9-66 Management of Quality
Quality/SafetyQuality/Safety
STA09
Pixux systems

9-67 Management of Quality
Service, PersonnelService, Personnel
SDHM5
Training, guestware support


![[John Grainger, William D. Stevenson] Power System(BookZZ.org)](https://static.fdocuments.net/doc/165x107/55cf916d550346f57b8d7bbf/john-grainger-william-d-stevenson-power-systembookzzorg.jpg)