9 - 1© 2011 Pearson Education, Inc. publishing as Prentice Hall 9 9 Layout Strategies PowerPoint...
55
9 - 1 © 2011 Pearson Education, Inc. publishing as Prentice Hall 9 Layout Strategies PowerPoint presentation to PowerPoint presentation to accompany accompany Heizer and Render Heizer and Render Operations Management, 10e Operations Management, 10e Principles of Operations Principles of Operations Management, 8e Management, 8e PowerPoint slides by Jeff Heyl
-
Upload
victoria-hawkins -
Category
Documents
-
view
214 -
download
0
Transcript of 9 - 1© 2011 Pearson Education, Inc. publishing as Prentice Hall 9 9 Layout Strategies PowerPoint...

9 - 1© 2011 Pearson Education, Inc. publishing as Prentice Hall
99 Layout StrategiesLayout Strategies
PowerPoint presentation to accompany PowerPoint presentation to accompany Heizer and Render Heizer and Render Operations Management, 10e Operations Management, 10e Principles of Operations Management, 8ePrinciples of Operations Management, 8e
PowerPoint slides by Jeff Heyl

9 - 2© 2011 Pearson Education, Inc. publishing as Prentice Hall
Strategic Importance of Strategic Importance of Layout DecisionsLayout Decisions
The objective of layout strategy The objective of layout strategy is to develop an effective and is to develop an effective and
efficient layout that will meet the efficient layout that will meet the firm’s competitive requirementsfirm’s competitive requirements

9 - 3© 2011 Pearson Education, Inc. publishing as Prentice Hall
Layout Design Layout Design ConsiderationsConsiderations
Higher utilization of space, equipment, and people
Improved flow of information, materials, or people
Improved employee morale and safer working conditions
Improved customer/client interaction
Flexibility

9 - 4© 2011 Pearson Education, Inc. publishing as Prentice Hall
Types of LayoutTypes of Layout
1. Office layout
2. Retail layout
3. Warehouse layout
4. Fixed-position layout
5. Process-oriented layout
6. Work-cell layout
7. Product-oriented layout

9 - 5© 2011 Pearson Education, Inc. publishing as Prentice Hall
Types of LayoutTypes of Layout
1. Office layout: Positions workers, their equipment, and spaces/offices to provide for movement of information
2. Retail layout: Allocates shelf space and responds to customer behavior
3. Warehouse layout: Addresses trade-offs between space and material handling

9 - 6© 2011 Pearson Education, Inc. publishing as Prentice Hall
Types of LayoutTypes of Layout
4. Fixed-position layout: Addresses the layout requirements of large, bulky projects such as ships and buildings
5. Process-oriented layout: Deals with low-volume, high-variety production (also called job shop or intermittent production)

9 - 7© 2011 Pearson Education, Inc. publishing as Prentice Hall
Types of LayoutTypes of Layout
6. Work cell layout: Arranges machinery and equipment to focus on production of a single product or group of related products
7. Product-oriented layout: Seeks the best personnel and machine utilizations in repetitive or continuous production

9 - 8© 2011 Pearson Education, Inc. publishing as Prentice Hall
Layout StrategiesLayout StrategiesObjectives Examples
Office Locate workers requiring frequent contact close to one another
Allstate Insurance
Microsoft Corp.
Retail Expose customer to high-margin items
Kroger’s Supermarket
Walgreen’s
Bloomingdale’s
Warehouse (storage)
Balance low cost storage with low-cost material handling
Federal-Mogul’s warehouse
The Gap’s distribution center
Project (fixed position)
Move material to the limited storage areas around the site
Ingall Ship Building Corp.
Trump Plaza
Pittsburgh Airport
Table 9.1

9 - 9© 2011 Pearson Education, Inc. publishing as Prentice Hall
Layout StrategiesLayout StrategiesObjectives Examples
Job Shop (process oriented)
Manage varied material flow for each product
Arnold Palmer Hospital
Hard Rock Cafe
Olive Garden
Work Cell (product families)
Identify a product family, build teams, cross train team members
Hallmark Cards
Wheeled Coach
Standard Aero
Repetitive/ Continuous (product oriented)
Equalize the task time at each workstation
Sony’s TV assembly line
Toyota Scion
Table 9.1

9 - 10© 2011 Pearson Education, Inc. publishing as Prentice Hall
Good Layouts ConsiderGood Layouts Consider
Material handling equipment
Capacity and space requirements
Environment and aesthetics
Flows of information
Cost of moving between various work areas
9 - 11© 2011 Pearson Education, Inc. publishing as Prentice Hall
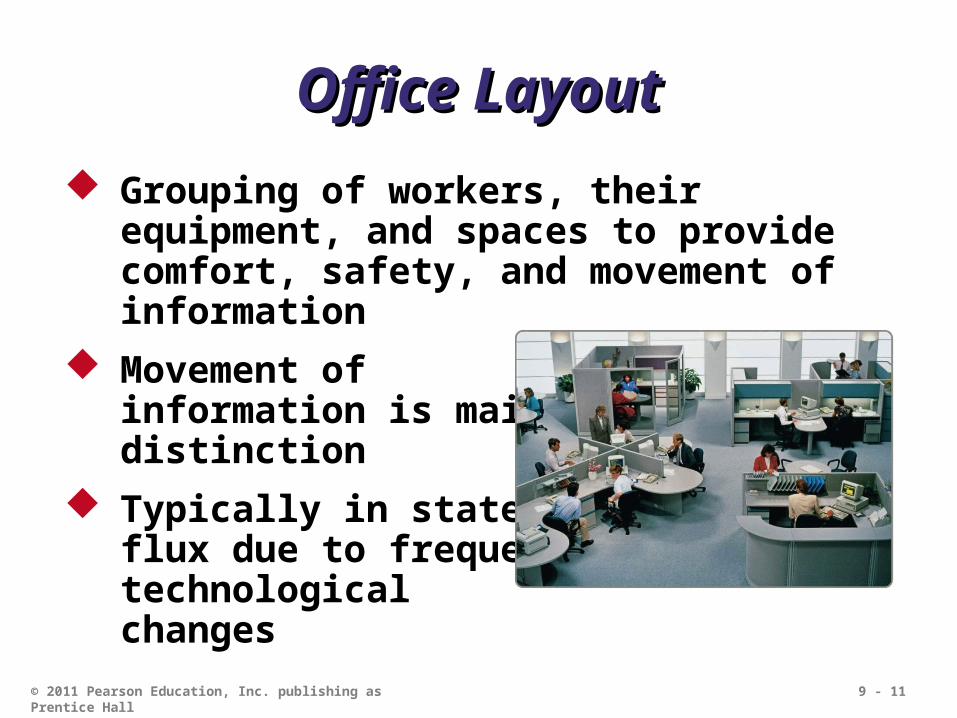
Office LayoutOffice Layout
Grouping of workers, their equipment, and spaces to provide comfort, safety, and movement of information
Movement of information is main distinction
Typically in state of flux due to frequent technological changes

9 - 12© 2011 Pearson Education, Inc. publishing as Prentice Hall
Relationship ChartRelationship Chart
Figure 9.1

9 - 13© 2011 Pearson Education, Inc. publishing as Prentice Hall
Supermarket Retail LayoutSupermarket Retail Layout
Objective is to maximize profitability per square foot of floor space
Sales and profitability vary directly with customer exposure

9 - 14© 2011 Pearson Education, Inc. publishing as Prentice Hall
Five Helpful Ideas for Five Helpful Ideas for Supermarket LayoutSupermarket Layout
1. Locate high-draw items around the periphery of the store
2. Use prominent locations for high-impulse and high-margin items
3. Distribute power items to both sides of an aisle and disperse them to increase viewing of other items
4. Use end-aisle locations
5. Convey mission of store through careful positioning of lead-off department

9 - 15© 2011 Pearson Education, Inc. publishing as Prentice Hall
Store LayoutStore Layout
Figure 9.2

9 - 16© 2011 Pearson Education, Inc. publishing as Prentice Hall
Retail SlottingRetail Slotting Manufacturers pay fees to retailers
to get the retailers to display (slot) their product
Contributing factors Limited shelf space
An increasing number of new products
Better information about sales through POS data collection
Closer control of inventory

9 - 17© 2011 Pearson Education, Inc. publishing as Prentice Hall
Retail Store Shelf Space Retail Store Shelf Space PlanogramPlanogram
Computerized tool for shelf-space management
Generated from store’s scanner data on sales
Often supplied by manufacturer
5 facings
Sh
amp
oo
Sh
amp
oo
Sh
amp
oo
Sh
amp
oo
Sh
amp
oo
Co
nd
ition
er
Co
nd
ition
er
Sh
amp
oo
Sh
amp
oo
Sh
amp
oo
Sh
amp
oo
Co
nd
ition
er
2 ft.

9 - 18© 2011 Pearson Education, Inc. publishing as Prentice Hall
ServicescapesServicescapes1.1. Ambient conditionsAmbient conditions - background
characteristics such as lighting, sound, smell, and temperature
2.2. Spatial layout and functionalitySpatial layout and functionality - which involve customer circulation path planning, aisle characteristics, and product grouping
3.3. Signs, symbols, and Signs, symbols, and artifactsartifacts - characteristics of building design that carry social significance

9 - 19© 2011 Pearson Education, Inc. publishing as Prentice Hall
Warehousing and Storage Warehousing and Storage LayoutsLayouts
Objective is to optimize trade-offs between handling costs and costs associated with warehouse space
Maximize the total “cube” of the warehouse – utilize its full volume while maintaining low material handling costs

9 - 20© 2011 Pearson Education, Inc. publishing as Prentice Hall
Warehousing and Storage Warehousing and Storage LayoutsLayouts
All costs associated with the transaction Incoming transport
Storage
Finding and moving material
Outgoing transport
Equipment, people, material, supervision, insurance, depreciation
Minimize damage and spoilage
Material Handling CostsMaterial Handling Costs

9 - 21© 2011 Pearson Education, Inc. publishing as Prentice Hall
Warehousing and Storage Warehousing and Storage LayoutsLayouts
Warehouse density tends to vary inversely with the number of different items stored
Automated Storage and Retrieval Systems (ASRSs) can significantly improve warehouse productivity by an estimated 500%
Dock location is a key design element

9 - 22© 2011 Pearson Education, Inc. publishing as Prentice Hall
Cross-DockingCross-Docking Materials are moved directly from
receiving to shipping and are not placed in storage in the warehouse
Requires tight scheduling and accurate shipments, bar code or RFIDidentification used foradvanced shipmentnotification as materialsare unloaded
9 - 23© 2011 Pearson Education, Inc. publishing as Prentice Hall
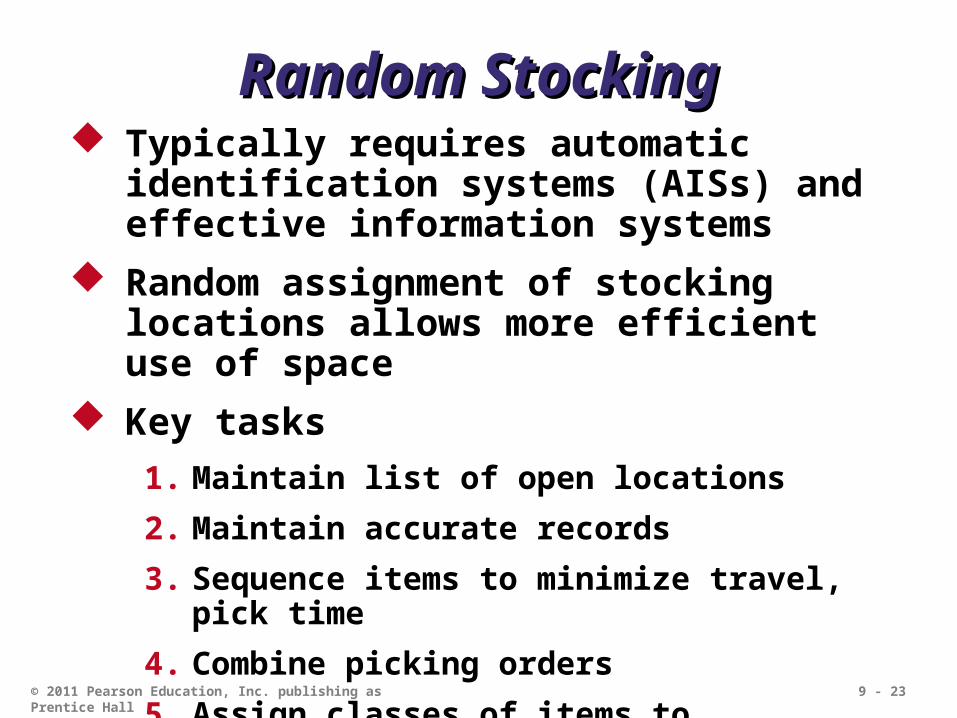
Random StockingRandom Stocking Typically requires automatic identification
systems (AISs) and effective information systems
Random assignment of stocking locations allows more efficient use of space
Key tasks
1. Maintain list of open locations
2. Maintain accurate records
3. Sequence items to minimize travel, pick time
4. Combine picking orders
5. Assign classes of items to particular areas

9 - 24© 2011 Pearson Education, Inc. publishing as Prentice Hall
CustomizingCustomizing Value-added activities performed at
the warehouse
Enable low cost and rapid response strategies Assembly of components
Loading software
Repairs
Customized labeling and packaging

9 - 25© 2011 Pearson Education, Inc. publishing as Prentice Hall
Shipping and receiving docks
Office
Cu
sto
miz
atio
n
Conveyor
Storage racks
Staging
Warehouse LayoutWarehouse LayoutTraditional Layout

9 - 26© 2011 Pearson Education, Inc. publishing as Prentice Hall
Warehouse LayoutWarehouse LayoutCross-Docking Layout
Shipping and receiving docks
Off
ice
Shipping and receiving docks
9 - 27© 2011 Pearson Education, Inc. publishing as Prentice Hall
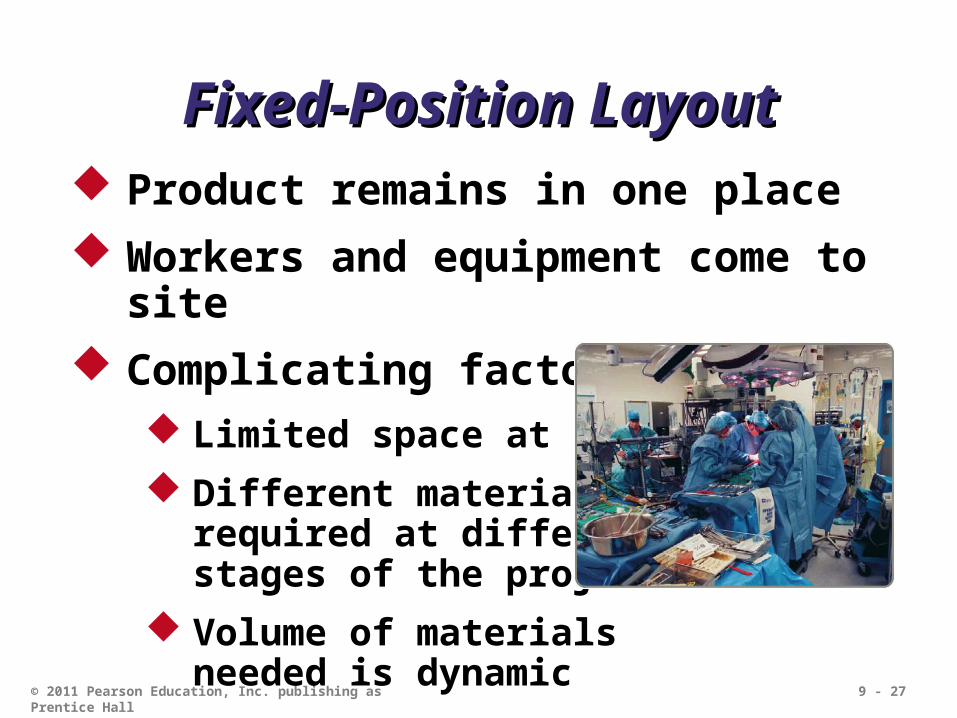
Fixed-Position LayoutFixed-Position Layout Product remains in one place
Workers and equipment come to site
Complicating factors Limited space at site
Different materials required at different stages of the project
Volume of materials needed is dynamic

9 - 28© 2011 Pearson Education, Inc. publishing as Prentice Hall
Process-Oriented LayoutProcess-Oriented Layout
Like machines and equipment are grouped together
Flexible and capable of handling a wide variety of products or services
Scheduling can be difficult and setup, material handling, and labor costs can be high

9 - 29© 2011 Pearson Education, Inc. publishing as Prentice Hall
Surgery
Radiology
ER triage room
ER Beds Pharmacy
Emergency room admissions
Billing/exit
Laboratories
Process-Oriented LayoutProcess-Oriented Layout
Patient A - broken legPatient A - broken leg
Patient B -Patient B - erratic heart erratic heart pacemakerpacemaker
Figure 9.3

9 - 30© 2011 Pearson Education, Inc. publishing as Prentice Hall
Layout at Arnold Palmer HospitalLayout at Arnold Palmer Hospital
Central break and medical
supply rooms
Local linen supply
Local nursing pod
Pie-shaped rooms
Central nurses station

9 - 31© 2011 Pearson Education, Inc. publishing as Prentice Hall
Process-Oriented LayoutProcess-Oriented Layout
Arrange work centers so as to minimize the costs of material handling
Basic cost elements are Number of loads (or people)
moving between centers
Distance loads (or people) move between centers

9 - 32© 2011 Pearson Education, Inc. publishing as Prentice Hall
Process-Oriented LayoutProcess-Oriented Layout
Minimize cost = ∑ ∑ Xij Cij
n
i = 1
n
j = 1
where n = total number of work centers or departments
i, j = individual departments
Xij = number of loads moved from department i to department j
Cij = cost to move a load between department i and department j

9 - 33© 2011 Pearson Education, Inc. publishing as Prentice Hall
Process Layout ExampleProcess Layout Example
1. Construct a “from-to matrix”
2. Determine the space requirements
3. Develop an initial schematic diagram
4. Determine the cost of this layout
5. Try to improve the layout
6. Prepare a detailed plan
Arrange six departments in a factory to minimize the material handling costs. Each department is 20 x 20 feet and the building is 60 feet long and 40 feet wide.

9 - 34© 2011 Pearson Education, Inc. publishing as Prentice Hall
Department Assembly Painting Machine Receiving Shipping Testing(1) (2) Shop (3) (4) (5) (6)
Assembly (1)
Painting (2)
Machine Shop (3)
Receiving (4)
Shipping (5)
Testing (6)
Number of loads per week
50 100 0 0 20
30 50 10 0
20 0 100
50 0
0
Process Layout ExampleProcess Layout Example
Figure 9.4

9 - 35© 2011 Pearson Education, Inc. publishing as Prentice Hall
Area 1 Area 2 Area 3
Area 4 Area 5 Area 660’
40’
Process Layout ExampleProcess Layout Example
Receiving Shipping TestingDepartment Department Department
(4) (5) (6)
Figure 9.5
Assembly Painting Machine ShopDepartment Department Department
(1) (2) (3)

9 - 36© 2011 Pearson Education, Inc. publishing as Prentice Hall
Process Layout ExampleProcess Layout Example
Interdepartmental Flow Graph
Figure 9.6
100
50
20
50
50
2010
100
30 Machine Shop (3)
Testing (6)
Shipping (5)
Receiving (4)
Assembly(1)
Painting (2)

9 - 37© 2011 Pearson Education, Inc. publishing as Prentice Hall
Process Layout ExampleProcess Layout Example
Cost = $50 + $200 + $40(1 and 2) (1 and 3) (1 and 6)
+ $30 + $50 + $10(2 and 3) (2 and 4) (2 and 5)
+ $40 + $100 + $50(3 and 4) (3 and 6) (4 and 5)
= $570
Cost = ∑ ∑ Xij Cij
n
i = 1
n
j = 1

9 - 38© 2011 Pearson Education, Inc. publishing as Prentice Hall
Process Layout ExampleProcess Layout Example
Revised Interdepartmental Flow Graph
Figure 9.7
30
50
20
50
10 2050 100
100 Machine Shop (3)
Testing (6)
Shipping (5)
Receiving (4)
Painting(2)
Assembly (1)

9 - 39© 2011 Pearson Education, Inc. publishing as Prentice Hall
Process Layout ExampleProcess Layout Example
Cost = $50 + $100 + $20(1 and 2) (1 and 3) (1 and 6)
+ $60 + $50 + $10(2 and 3) (2 and 4) (2 and 5)
+ $40 + $100 + $50(3 and 4) (3 and 6) (4 and 5)
= $480
Cost = ∑ ∑ Xij Cij
n
i = 1
n
j = 1

9 - 40© 2011 Pearson Education, Inc. publishing as Prentice Hall
Area 1 Area 2 Area 3
Area 4 Area 5 Area 660’
40’
Process Layout ExampleProcess Layout Example
Receiving Shipping TestingDepartment Department Department
(4) (5) (6)
Figure 9.8
Painting Assembly Machine ShopDepartment Department Department
(2) (1) (3)

9 - 41© 2011 Pearson Education, Inc. publishing as Prentice Hall
Computer SoftwareComputer Software
Graphical approach only works for small problems
Computer programs are available to solve bigger problems CRAFT
ALDEP
CORELAP
Factory Flow

9 - 42© 2011 Pearson Education, Inc. publishing as Prentice Hall
CRAFT ExampleCRAFT Example
Figure 9.9
TOTAL COST 20,100EST. COST REDUCTION .00ITERATION 0
(a)
A A A A B B
A A A A B B
D D D D D D
C C D D D D
F F F F F D
E E E E E D
TOTAL COST 14,390EST. COST REDUCTION 70ITERATION 3
(b)
D D D D B B
D D D D B B
D D D E E E
C C D E E F
A A A A A F
A A A F F F

9 - 43© 2011 Pearson Education, Inc. publishing as Prentice Hall
Computer SoftwareComputer Software Three dimensional visualization
software allows managers to view possible layouts and assess process, material handling, efficiency, and safety issues

9 - 44© 2011 Pearson Education, Inc. publishing as Prentice Hall
Repetitive and Product-Repetitive and Product-Oriented LayoutOriented Layout
1. Volume is adequate for high equipment utilization
2. Product demand is stable enough to justify high investment in specialized equipment
3. Product is standardized or approaching a phase of life cycle that justifies investment
4. Supplies of raw materials and components are adequate and of uniform quality
Organized around products or families of Organized around products or families of similar high-volume, low-variety productssimilar high-volume, low-variety products

9 - 45© 2011 Pearson Education, Inc. publishing as Prentice Hall
Product-Oriented LayoutsProduct-Oriented Layouts Fabrication line
Builds components on a series of machines
Machine-paced
Require mechanical or engineering changes to balance
Assembly line
Puts fabricated parts together at a series of workstations
Paced by work tasks
Balanced by moving tasksBoth types of lines must be balanced so that the time to perform the work at each station is the same

9 - 46© 2011 Pearson Education, Inc. publishing as Prentice Hall
Product-Oriented LayoutsProduct-Oriented Layouts
1. Low variable cost per unit
2. Low material handling costs
3. Reduced work-in-process inventories
4. Easier training and supervision
5. Rapid throughput
AdvantagesAdvantages
1. High volume is required
2. Work stoppage at any point ties up the whole operation
3. Lack of flexibility in product or production rates
DisadvantagesDisadvantages

9 - 47© 2011 Pearson Education, Inc. publishing as Prentice Hall
McDonald’s Assembly LineMcDonald’s Assembly Line
Figure 9.12

9 - 48© 2011 Pearson Education, Inc. publishing as Prentice Hall
Disassembly LinesDisassembly Lines
Disassembly is being considered in new product designs
“Green” issues and recycling standards are important consideration
Automotive disassembly is the 16th largest industry in the US

9 - 49© 2011 Pearson Education, Inc. publishing as Prentice Hall
Assembly-Line BalancingAssembly-Line Balancing Objective is to minimize the imbalance
between machines or personnel while meeting required output
Starts with the precedence relationships Determine cycle time
Calculate theoretical minimum number of workstations
Balance the line by assigning specific tasks to workstations

9 - 50© 2011 Pearson Education, Inc. publishing as Prentice Hall
Wing Component ExampleWing Component Example
This means that tasks B and E cannot be done until task A has been completed
Performance Task Must FollowTime Task Listed
Task (minutes) Below
A 10 —B 11 AC 5 BD 4 BE 12 AF 3 C, DG 7 FH 11 EI 3 G, H
Total time 66

9 - 51© 2011 Pearson Education, Inc. publishing as Prentice Hall
Wing Component ExampleWing Component Example
Performance Task Must FollowTime Task Listed
Task (minutes) Below
A 10 —B 11 AC 5 BD 4 BE 12 AF 3 C, DG 7 FH 11 EI 3 G, H
Total time 66 I
GF
C
D
H
B
E
A
10
1112
5
4 3
711 3
Figure 9.13

9 - 52© 2011 Pearson Education, Inc. publishing as Prentice Hall
I
GF
C
D
H
B
E
A
10
1112
5
4 3
711 3
Figure 9.13
Performance Task Must FollowTime Task Listed
Task (minutes) Below
A 10 —B 11 AC 5 BD 4 BE 12 AF 3 C, DG 7 FH 11 EI 3 G, H
Total time 66
Wing Component ExampleWing Component Example480 available
mins per day40 units required
Cycle time =
Production time available per day
Units required per day
= 480 / 40= 12 minutes per unit
Minimum number of
workstations=
∑ Time for task i
Cycle time
n
i = 1
= 66 / 12= 5.5 or 6 stations
9 - 53© 2011 Pearson Education, Inc. publishing as Prentice Hall
Wing Component ExampleWing Component Example
I
GF
C
D
H
B
E
A
10
1112
5
4 3
711 3
Figure 9.13
Performance Task Must FollowTime Task Listed
Task (minutes) Below
A 10 —B 11 AC 5 BD 4 BE 12 AF 3 C, DG 7 FH 11 EI 3 G, H
Total time 66
480 available mins per day
40 units required
Cycle time = 12 mins
Minimum workstations = 5.5 or 6
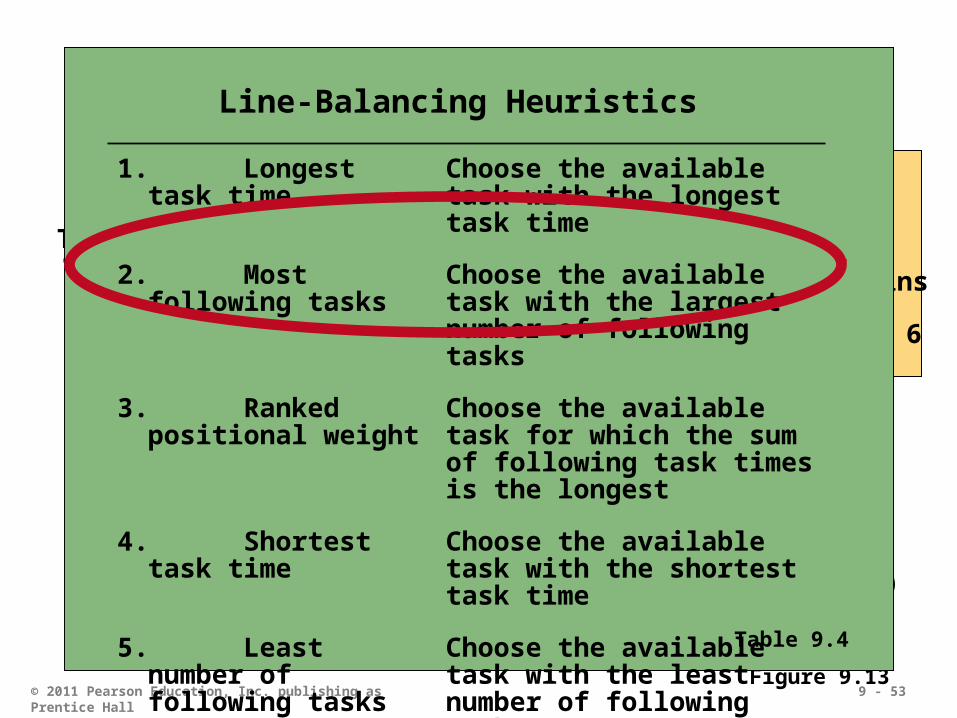
Line-Balancing Heuristics
1. Longest task time Choose the available task with the longest task time
2. Most following tasks Choose the available task with the largest number of following tasks
3. Ranked positional weight
Choose the available task for which the sum of following task times is the longest
4. Shortest task time Choose the available task with the shortest task time
5. Least number of following tasks
Choose the available task with the least number of following tasks
Table 9.4

9 - 54© 2011 Pearson Education, Inc. publishing as Prentice Hall
480 available mins per day
40 units required
Cycle time = 12 mins
Minimum workstations = 5.5 or 6
Performance Task Must FollowTime Task Listed
Task (minutes) Below
A 10 —B 11 AC 5 BD 4 BE 12 AF 3 C, DG 7 FH 11 EI 3 G, H
Total time 66Station 1
Wing Component ExampleWing Component Example
Station 2
Station 3Station 3
Station 4
Station 5
Station 6Station 6
I
GF
H
C
D
B
E
A
10 11
12
5
4
3 7
11
3
Figure 9.14

9 - 55© 2011 Pearson Education, Inc. publishing as Prentice Hall
Performance Task Must FollowTime Task Listed
Task (minutes) Below
A 10 —B 11 AC 5 BD 4 BE 12 AF 3 C, DG 7 FH 11 EI 3 G, H
Total time 66
Wing Component ExampleWing Component Example480 available
mins per day40 units required
Cycle time = 12 mins
Minimum workstations = 5.5 or 6
Efficiency =∑ Task times
(Actual number of workstations) x (Largest cycle time)
= 66 minutes / (6 stations) x (12 minutes)
= 91.7%


![Heizer 9 ch8 f.ppt [Read-Only] - · PDF file© 2008 Prentice Hall, Inc. 8 – 1 Operations Management Chapter 8 – Location Strategies PowerPoint presentation to accompany Heizer/Render](https://static.fdocuments.net/doc/165x107/5a9dd7dd7f8b9a85318d5053/heizer-9-ch8-fppt-read-only-2008-prentice-hall-inc-8-1-operations.jpg)