8.important mrketing model
15
Important Marketing models Mr. Pankaj Kusum Ramdas Khuspe Page 1 Important Marketing Models Syllabus: BCG matrix Porter’s 5 force model Objectives: Upon completion of this Chapter, you will be able to: Understand various model of marketing. Understand concept of BCG matrix with its all detail. Understand concept of Porter’s 5 force model with its all detail Mr. Pankaj Kusum Ramdas Khuspe M. Pharmacy (Pharmaceutics)
-
Upload
pankaj-kishori-kusum-ramdas-khuspe -
Category
Education
-
view
27 -
download
0
Transcript of 8.important mrketing model

Important Marketing models
Mr. Pankaj Kusum Ramdas Khuspe Page 1
Important Marketing Models
Syllabus: BCG matrix
Porter’s 5 force model
Objectives: Upon completion of this Chapter, you will be able to:
Understand various model of marketing.
Understand concept of BCG matrix with its all detail.
Understand concept of Porter’s 5 force model with its all detail
Mr. Pankaj Kusum Ramdas Khuspe M. Pharmacy (Pharmaceutics)
Important Marketing models
Mr. Pankaj Kusum Ramdas Khuspe Page 2
Introduction
Today’s organizations find themselves operating in an environment that is changing faster than
ever before. The process of analyzing the implications of these changes and modifying the
way that the organization reacts to them is known as business strategy.
‘Strategy is the direction and scope of an organization over the long term, which achieves
advantage in a changing environment through its configuration of resources and competences’
Johnson et al. (2009).
While your role as a manager is unlikely to require you to make decisions at the strategic level,
you may be asked to contribute your expertise to meetings where strategic concerns are being
discussed. You may also be asked to comment on pilot schemes, presentations, reports, or
statistics that will affect future strategy.
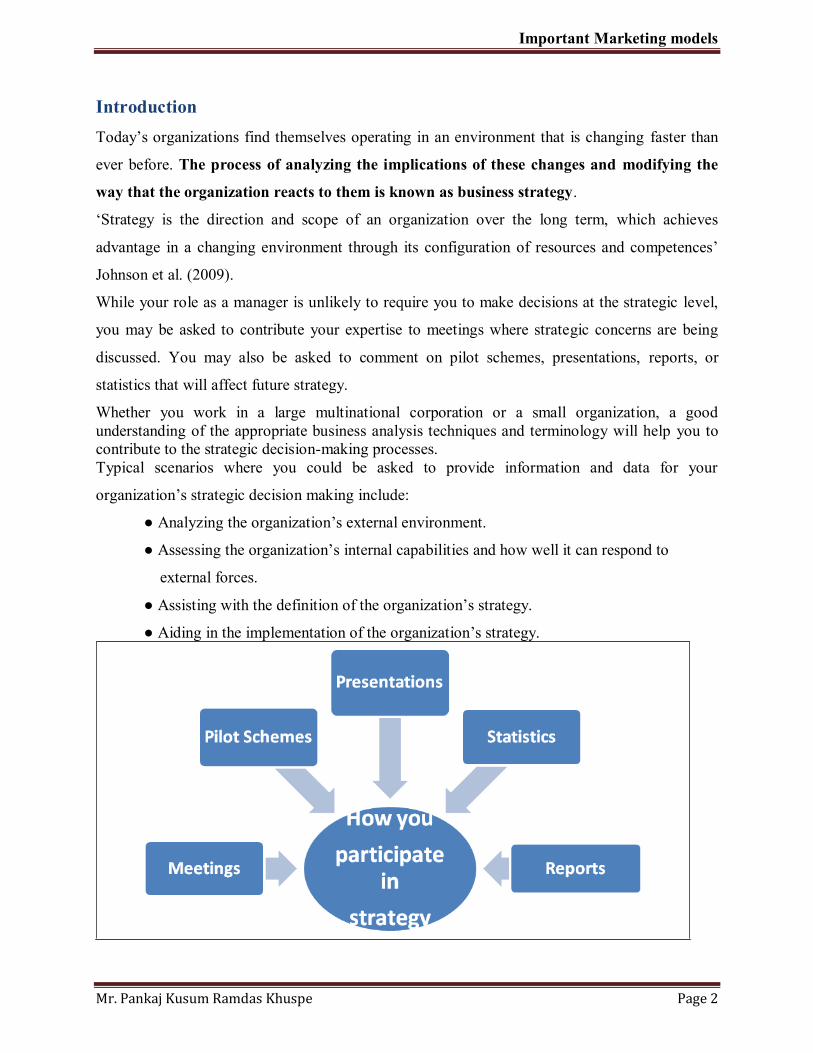
Whether you work in a large multinational corporation or a small organization, a good understanding of the appropriate business analysis techniques and terminology will help you to contribute to the strategic decision-making processes. Typical scenarios where you could be asked to provide information and data for your
organization’s strategic decision making include:
● Analyzing the organization’s external environment.
● Assessing the organization’s internal capabilities and how well it can respond to
external forces.
● Assisting with the definition of the organization’s strategy.
● Aiding in the implementation of the organization’s strategy.
Important Marketing models
Mr. Pankaj Kusum Ramdas Khuspe Page 3
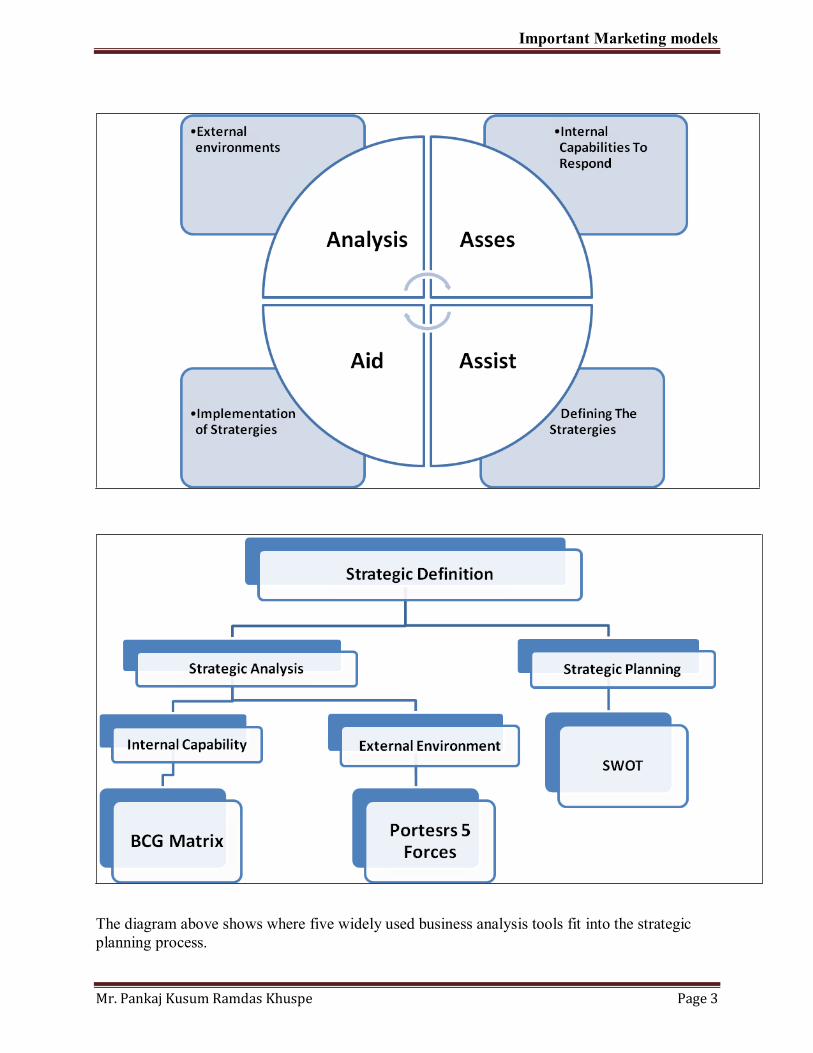
The diagram above shows where five widely used business analysis tools fit into the strategic planning process.

Important Marketing models
Mr. Pankaj Kusum Ramdas Khuspe Page 4
BCG Matrix
INTRODUCTION
In the early 1970’s the Boston Consulting Group (BCG) developed a model for managing a
portfolio of different strategic business units (SBUs) or major product lines. The BCG
Growth-Share Matrix is a four-cell (2 by 2) matrix used to perform business portfolio
analysis as a step in the strategic planning process.
It is a well-known Portfolio Management tool.
It is based on product life cycle theory.
The BCG Matrix can be used to determine what priorities should be given in the product
portfolio of a business unit.
To ensure long-term value creation, a company should have a portfolio of products that
contains both high-growth products in need of cash inputs and low-growth products that
generate a lot of cash.
This technique is particularly useful for multi-divisional or multiproduct companies.
The composition of the portfolio can be critical to the growth and success of the
company.
The BCG Growth-Share Matrix positions the various SBUs/product lines based on
Market Growth Rate and Market Share relative to the most important competitor.
The Boston Consulting Group Matrix has two dimensions:
Market share and
Market growth.
The market growth rate is shown on the vertical (y) axis. It is generally expressed in %. The
range is set somewhat arbitrarily. The overhead shows a range of 0 to 20% with division between
low and high growth at 10%.
The horizontal (x) axis shows relative market share. The share is calculated by reference to the
largest competitor in the market. Again the range and division between high and low shares is
arbitrary.
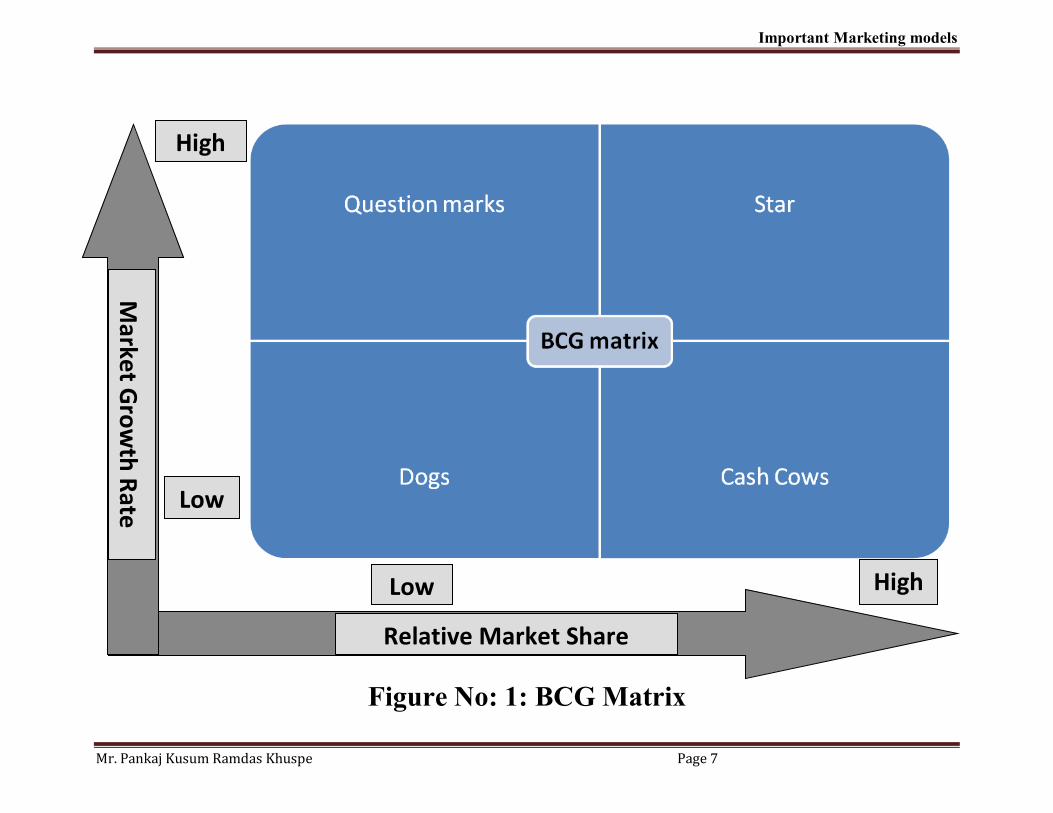
The BCG growth/share matrix is divided into four cells or quadrants, each of which represent a
particular type of business. (As shown in figure: 1)
Important Marketing models
Mr. Pankaj Kusum Ramdas Khuspe Page 5
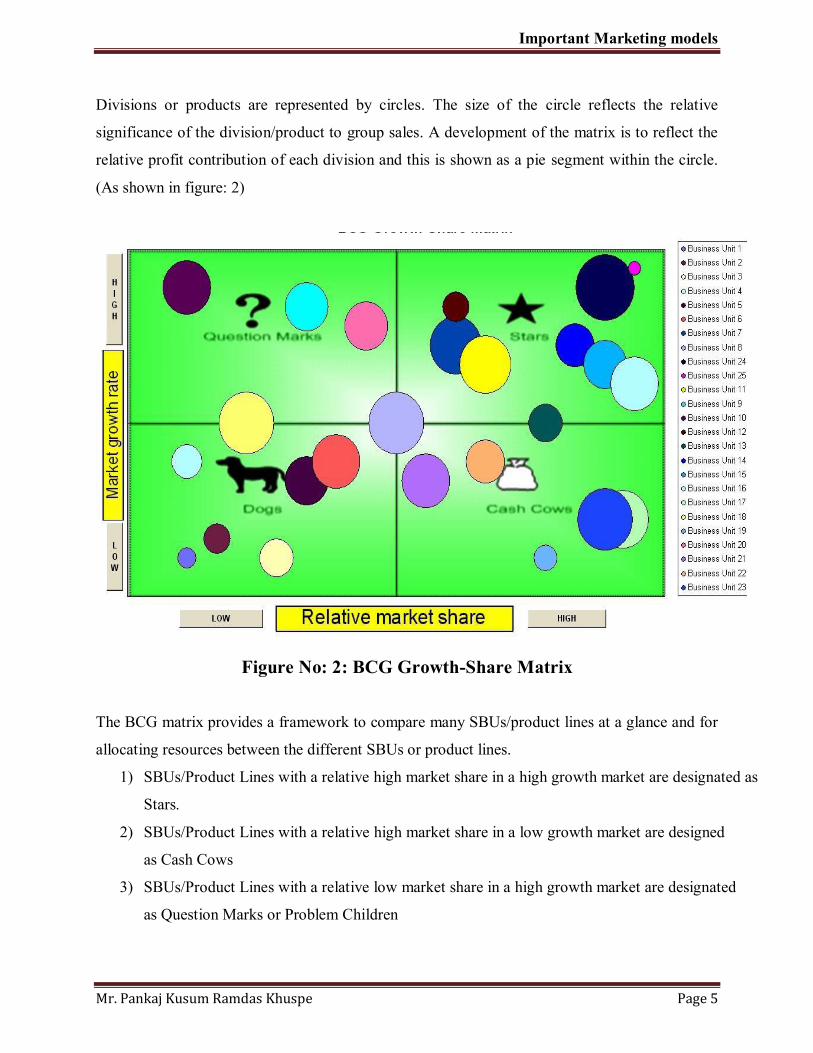
Divisions or products are represented by circles. The size of the circle reflects the relative
significance of the division/product to group sales. A development of the matrix is to reflect the
relative profit contribution of each division and this is shown as a pie segment within the circle.
(As shown in figure: 2)
Figure No: 2: BCG Growth-Share Matrix
The BCG matrix provides a framework to compare many SBUs/product lines at a glance and for
allocating resources between the different SBUs or product lines.
1) SBUs/Product Lines with a relative high market share in a high growth market are designated as
Stars.
2) SBUs/Product Lines with a relative high market share in a low growth market are designed
as Cash Cows
3) SBUs/Product Lines with a relative low market share in a high growth market are designated
as Question Marks or Problem Children
Important Marketing models
Mr. Pankaj Kusum Ramdas Khuspe Page 6
4) SBUs/Product Lines with a relative low market share in a low growth market are
designated as Dogs.
STARS High Growth, High Market Share
Successful question marks become stars. i.e. market leaders in high growth industries.
Stars are using large amounts of cash. Stars are leaders in the business. Therefore they
should also generate large amounts of cash
However, investment is normally still required to maintain growth and to defend the
leadership position.
Stars are frequently only marginally profitable but as they reach a more mature status in
their life cycle and growth slows, returns become more attractive.
The stars provide the basis for long term growth and profitability.
Strategic options for stars include:
Integration – forward, backward and horizontal
Market penetration
Market development
Product development
Joint ventures
Cash Cows Low Growth, High Market Share
These are characterized by high relative market share in low growth industries. As the
market matures the need for investment reduces.
Cash Cows are the most profitable products in the portfolio.
The situation is frequently boosted by economies of scale that may be present with
market leaders.
Cash Cows may be used to fund the businesses in the other three quadrants.
It is desirable to maintain the strong position as long as possible
Important Marketing models
Mr. Pankaj Kusum Ramdas Khuspe Page 7
Figure No: 1: BCG Matrix
High
High Low
Low
Marke
t Gro
wth
Rate
Relative Market Share
Important Marketing models
Mr. Pankaj Kusum Ramdas Khuspe Page 8
Strategic options for stars include:
Product development
Concentric diversification
If the position weakens as a result of loss of market share or market contraction then
options would include.
Retrenchment (or even divestment).
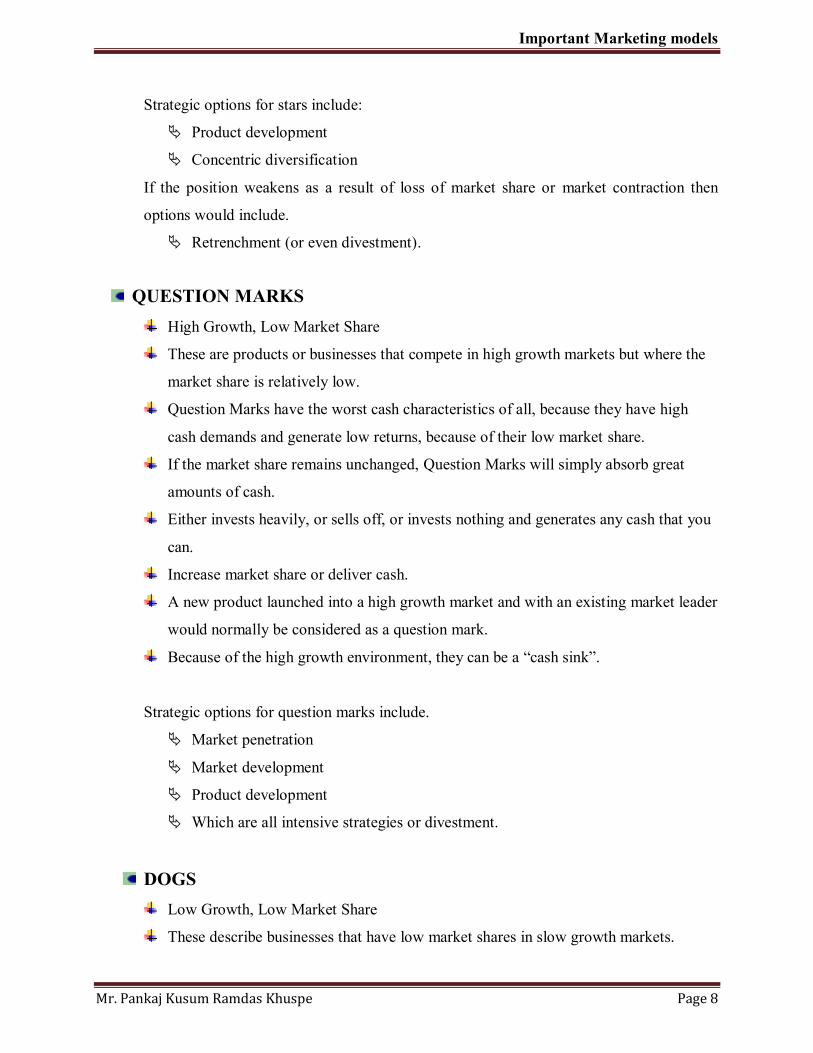
QUESTION MARKS
High Growth, Low Market Share
These are products or businesses that compete in high growth markets but where the
market share is relatively low.
Question Marks have the worst cash characteristics of all, because they have high
cash demands and generate low returns, because of their low market share.
If the market share remains unchanged, Question Marks will simply absorb great
amounts of cash.
Either invests heavily, or sells off, or invests nothing and generates any cash that you
can.
Increase market share or deliver cash.
A new product launched into a high growth market and with an existing market leader
would normally be considered as a question mark.
Because of the high growth environment, they can be a “cash sink”.
Strategic options for question marks include.
Market penetration
Market development
Product development
Which are all intensive strategies or divestment.
DOGS Low Growth, Low Market Share
These describe businesses that have low market shares in slow growth markets.

Important Marketing models
Mr. Pankaj Kusum Ramdas Khuspe Page 9
They may well have been Cash Cows.
Avoid and minimize the number of Dogs in a company.
Watch out for expensive ‘rescue plans’
Often they enjoy misguided loyalty from management although some Dogs can be
revitalised.
Profitability is, at best, marginal.
Strategic options would include..
Retrenchment (if it is believed that it could be revitalised)
Liquidation
Divestment (if you can find someone to buy!)
Successful products may well move from question mark though star to Cash Cow and
finally to Dog.
Less successful products that never gain market position will move straight from
question mark to Dog.
The basic idea behind it is: if a product has a bigger market share, or if the
product's market grows faster, it is better for the company.
The BCG is simple and useful technique for strategic analysis.
It is convenient for multi-product or multi-divisional companies.
It focuses on cash flow and is useful for investment and marketing decisions.
Other uses and benefits of the BCG Matrix
√ If a company is able to use the experience curve to its advantage, it should be able
to manufacture and sell new products at a price that is low enough to get early
market share leadership. Once it becomes a star, it is destined to be profitable.
√ BCG model is helpful for managers to evaluate balance in the firm’s current
portfolio of Stars, Cash Cows, Question Marks and Dogs.
Important Marketing models
Mr. Pankaj Kusum Ramdas Khuspe Page 10
√ BCG method is applicable to large companies that seek volume and experience
effects.
√ The model is simple and easy to understand.
√ It provides a base for management to decide and prepare for future actions.
Limitations of the BCG Matrix
Some limitations of the Boston Consulting Group Matrix include:
× It neglects the effects of synergy between business units.
× High market share is not the only success factor.
× Market growth is not the only indicator for attractiveness of a market.
× Sometimes Dogs can earn even more cash as Cash Cows.
× The problems of getting data on the market share and market growth.
× There is no clear definition of what constitutes a "market".
× A high market share does not necessarily lead to profitability all the time.
× The model uses only two dimensions –market share and growth rate. This may
tempt management to emphasize a particular product, or to divest prematurely.
× A business with a low market share can be profitable too.

Important Marketing models
Mr. Pankaj Kusum Ramdas Khuspe Page 11
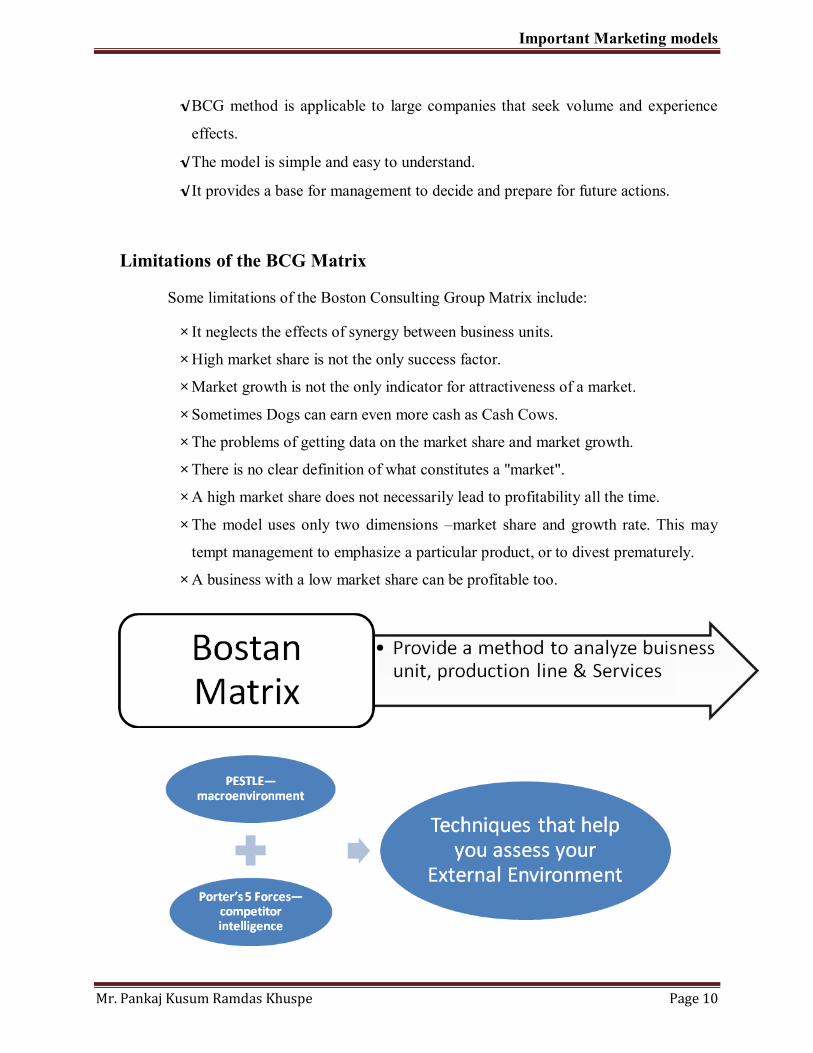
PORTER’S 5 FORCE MODEL
Any organizational strategy that you develop needs to include gaining a thorough understanding
of the external environment that the organization is operating in. The two most widely used tools
that can help you to do this are the PESTLE Analysis and Porter’s Five Forces Analysis.
The PESTLE Analysis enables you to create a list of the potential issues within your macro-
environment that have or could have implications for your organization.
Whilst understanding the macro-environment is essential for developing your strategy it
only gives you half of the picture. You also need to have a thorough understanding of your
competitors and the impact they can have on your organization. To gain this knowledge
you need to conduct Porter’s Five Forces Analysis.
In 1979 Michael E. Porter of Harvard Business School identified five key forces that determined
the fundamental attractiveness of a market or a market sector in the long term.
This became known as Porter’s Five Forces Analysis and it provides a model that enables
organizations to analyze their industry in a way that takes your competitors’ activities
into account. This is a vital part of creating a strategy, and it is important that managers
understand how it works and how to contribute to it.
One of the most crucial aspects of using this technique is your organization’s ability to define its
market properly. Defining your market too narrowly, known as ‘marketing myopia,’ can make it
impossible to work out who your competitors are in terms of market need and opportunities.
Porter’s analysis technique has become popular with business and strategy analysts and is often
regarded as a credible and more practical alternative to the widely used SWOT Analysis. This is
because it looks at the forces your competitors can exert on your market and how this could
affect your organization and its long-term success.
In today’s highly competitive markets any successful organization will have a reasonable level of
intelligence on its known competitors. But as recent events have shown, the greatest harm to
your organization is unlikely to come from this quarter. Your greatest threats are more likely to
come from new and emerging competitors or new technologies. Porter’s model considers five
forces that determine the ‘attractiveness’ of your market by analyzing the competitive intensity.
Important Marketing models
Mr. Pankaj Kusum Ramdas Khuspe Page 12
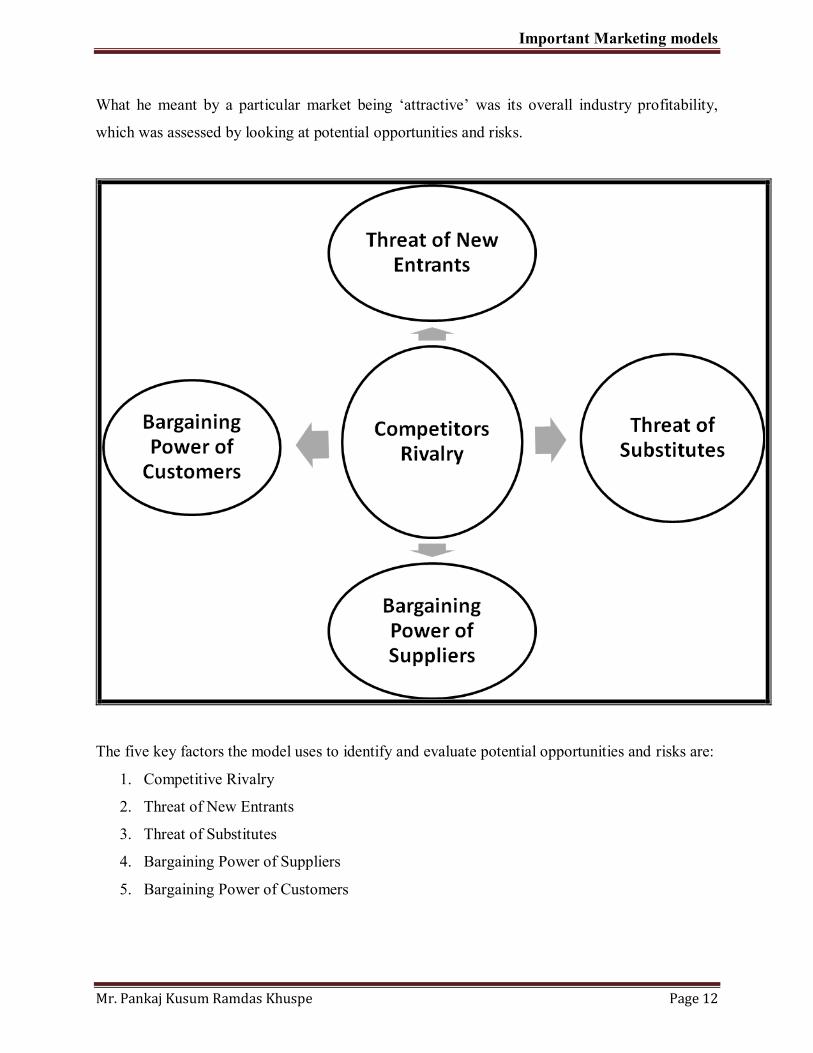
What he meant by a particular market being ‘attractive’ was its overall industry profitability,
which was assessed by looking at potential opportunities and risks.
The five key factors the model uses to identify and evaluate potential opportunities and risks are:
1. Competitive Rivalry
2. Threat of New Entrants
3. Threat of Substitutes
4. Bargaining Power of Suppliers
5. Bargaining Power of Customers
Important Marketing models
Mr. Pankaj Kusum Ramdas Khuspe Page 13
The first three are considered to be ‘horizontal’ competition (shown as dark blue in the diagram)
because each force is operating in the same way within the market. The remaining two forces are
classified as ‘vertical’ competition (light blue) because they operate within the supply chain.
It is important to remember when using Porter’s Five Forces as part of your strategic analysis
that the method was designed for use at the line-of-business level. ‘Line-of business’ is defined
as applying to a set of one or more highly related products that service a particular customer
transaction or business need.
Organizations use this Five Forces Analysis to help them make a qualitative evaluation of their
strategic position at the start of the development or review process. This technique is suited to
helping you identify potential opportunities, especially if you are considering entering a new
market, or you are seeking effective ways to differentiate yourself from the competition.
Why use the tool?
The Porter’s Five Forces tool is a simple but powerful tool for understanding where power lies in
a business situation. This is useful, because it helps you understand both the strength of your
current competitive position, and the strength of a position you’re looking to move into.
With a clear understanding of where power lies, you can take fair advantage of a situation of
strength, improve a situation of weakness, and avoid taking wrong steps. This makes it an
important part of your planning toolkit.
Conventionally, the tool is used to identify whether new products, services or businesses have
the potential to be profitable. However it can be very illuminating when used to understand the
balance of power in other situations.
How to use the tool:
Five Forces Analysis assumes that there are five important forces that determine competitive
power in a situation. These are:-
1. Competitive Rivalry:
What is important here is the number and capability of your competitors – if you have
many competitors, and they offer equally attractive products and services, then you’ll
most likely have little power in the situation. If suppliers and buyers don’t get a good deal

Important Marketing models
Mr. Pankaj Kusum Ramdas Khuspe Page 14
from you, they’ll go elsewhere. On the other hand, if no-one else can do what you do,
then you can often have tremendous strength.
Number and size of firms/ Number of competitors Quality differences Switching costs Industry size and trends Fixed variable cost bases Product/service ranges Differentiation strategy
2. Threat of New Entry:
Power is also affected by the ability of people to enter your market. If it costs little in
time or money to enter your market and compete effectively, if there are few economies
of scale in place, or if you have little protection for your key technologies, then new
competitors can quickly enter your market and weaken your position. If you have strong
and durable barriers to entry, then you can preserve a favorable position and take fair
advantage of it.
Time & cost of entry Specialist knowledge Economics Scale Cost advantages Technology protection Barriers to entry etc
3. Threat of Substitution:
This is affected by the ability of your customers to find a different way of doing what you
do – for example, if you supply a unique software product that automates an important
process, people may substitute by doing the process manually or by outsourcing it. If
substitution is easy and substitution is viable, then this weakens your power.
Substitute performance Cost of change

Important Marketing models
Mr. Pankaj Kusum Ramdas Khuspe Page 15
4. Supplier Power (Bargaining Power of Suppliers):
Here you assess how easy it is for suppliers to drive up prices. This is driven by the
number of suppliers of each key input, the uniqueness of their product or service, their
strength and control over you, the cost of switching from one to another, and so on. The
fewer the supplier choices you have, and the more you need suppliers' help, the more
powerful your suppliers are.
Name of the supplier Size of suppliers Uniqueness of services Brand reputation Geographical coverage Product/service level quality Relationships with customers Bidding processes/capabilities
5. Buyer Power (Bargaining Power of Customers):
Here you ask yourself how easy it is for buyers to drive prices down. Again, this is driven
by the number of buyers, the importance of each individual buyer to your business, the
cost to them of switching from your products and services to those of someone else, and
so on. If you deal with few, powerful buyers, they are often able to dictate terms to you.
Buyer choice Buyers size/number Change cost/frequency Product/service importance Volumes, JIT scheduling
Questions asked:
1. Short note on BCG matrix. (4) *
2. Short note on Porters five force model. (3/4) *