89.188.43.7589.188.43.75/agricultforest/20171003-Volume 63 Issue 3.pdf89.188.43.75
234
Transcript of 89.188.43.7589.188.43.75/agricultforest/20171003-Volume 63 Issue 3.pdf89.188.43.75
Agriculture and Forestry, Volume 63. Issue 3: 1-234, Podgorica, 2017 2
Agriculture and Forestry - Poljoprivreda i šumarstvo PUBLISHER - IZDAVAČ
University of Montenegro – Univerzitet Crne Gore Biotechnical faculty, Podgorica - Biotehnički fakultet, Podgorica
Bul. M. Lalića 1, 81000 Podgorica, Crna Gora (Montenegro), P.Box 97, Tel.: +382 20 268434; +382 20 268437; Fax: +382 20 268432 Web: www.agricultforest.ac.me; E-mail: [email protected]
EDITORIAL BOARD - REDAKCIJA
Milić ČUROVIĆ, Editor in chief - glavni i odgovorni urednik (BTF),
Miomir JOVANOVIĆ, Co-Editor, Secretary General - sekretar redakcije (BTF), Igor PAJOVIĆ, Co-Editor, Technical editor - tehički urednik (BTF),
Luka FILPOVIĆ, Technical editor - tehički urednik (CIS, UCG),
Ana TOPALOVIĆ (BTF), Slavko MIJOVIĆ (BTF), Momčilo RADULOVIĆ (BTF), Nataša MIRECKI (BTF), Božidarka MARKOVIĆ (BTF), Jelena LATINOVIĆ (BTF),
Radmila PAJOVIĆ (BTF), Aleksandra DESPOTOVIĆ (BTF)
Ardian MACI (ALB), Che Fauziah ISHAK (MYS), Drago CVIJANOVIĆ (SRB), Dusan KOVACEVIC (SRB), Dusan PETRIC (SRB), Elazar FALLIK (ISR), Emil ERJAVEC (SLO), Franc BAVEC (SLO), Goran BAROVIC (MNE),
Gordan KARAMAN (MNE), Guangyu SUN (CHN), Hamid CUSTOVIC (BIH), Hubert HASENAUER (AUT), Ignacio DIAZ-MAROTO (ESP),
Jasmina HAVRANEK (CRO), Joachim Müller (GER), Juan Antonio Ballesteros Canovas (CH), Lydia PEREVEDENTSEVA (RUS),
Mico OLJACA (SRB), Mihailo NIKOLIĆ (SRB), Milan MEDAREVIC (SRB), Naser SABAGHNIA (IRI), Naldo ANSELMI (ITA), Naveen KUMAR, (USA),
Paraskevi LONDRA (GRE), Peter DOVC (SLO), Reinhard EDER (AUT), Renzo MOTTA (ITA), Sead ŠABANADŽOVIĆ (USA), Sinisa BERJAN (BIH),
Shkelqim KARAJ (GER), Svetislav POPOVIC (MNE), Vlatka VAJS (SRB), Vjekoslav TANASKOVIK (MKD), Vojislav TRKULJA (BIH),
Zvonimir BOŽINOVIĆ (MKD) Technical design: Marija MARKOČ
Indexed in (by alphabethical order): AGRICOLA, AGRIS, CAB Abstracts, CAB Direct, CABI full text, COBISS, CrossRef, DOI, DOAJ, Directory of Research Journal Indexing (DRJI), Directory Indexing of International Research Journals, EBSCO (currently included in EDS EBSCO Discovery Service), Elektronische Zeitschriftenbibliothek EZB (Electronic Journals Library), Genamics JournalSeek, Global impact factor (GIF), Google Scholar, HathiTrustt, Index Copernicus, International Scientific Indexing (ISI), Israel Union List of Electronic Journals (ULE), J-Gate, JournalRate (Academic journal search tool), Journals Impact factor (JIF) by Global Society for Scientific Research (GSSR), KoBSON, MALMAD, National Agricultural Library – USA, ProQuest, Research bible, RoMEO, Regional Information Center for Science and Technology (RICeST) – Iran, Rubriq database, The Open University Library, The Rudjer Bošković Institute Library, Ulrichsweb, Universal Impact Factor, WorldCat, XML, Zeitschriftendatenbank (ZDB), Zoological Record of the Thomson Reuters, ... The journal “Agriculture and Forestry” is funded by the Biotechnical faculty, Co-funded by the Architecture Faculty of the University of Montenegro, the Ministry of Science & the Ministry of Agriculture and Rural Development of Montenegro
CIP – Каталогизација у публикацији Централна народна библиотека Црне Горе, Цетиње ISSN 0554-5579 COBIS.CG-ID 3758082

Agriculture and Forestry, Volume 63. Issue 3: 1-234, Podgorica, 2017 3
CONTENT
Ivan ŠIMUNIĆ, Palma ORLOVIĆ-LEKO, Ankica SENTA MARIĆ, Irena CIGLENEČKI, Tatiana MINKINA, Vilim FILIPOVIĆ QUALITY OF SURFACE WATER IN THE AGRICULTURAL DISTRICT LONJA FIELD (CROATIA) ................................................................. 005-014
Marina VUKŠA, Goran JOKIĆ, Tanja BLAŽIĆ, Suzana ĐEDOVIĆ, Bojan STOJNIĆ COMBATING HARMFUL RODENTS IN FOREST OAK SAPLING PLANTATIONS ........................................................... 015-021
Abdulvahed KHALEDI DARVISHAN, Morteza BEHZADFAR, Velibor SPALEVIC, Patrick KALONDE, Abdessalam OUALLALI, Sabri el MOUATASSIME CALCULATION OF SEDIMENT YIELD IN THE S2-1 WATERSHED OF THE SHIRINDAREH RIVER BASIN, IRAN ......................... 023-032
Seyed Hamid Reza SADEGHI SOIL EROSION IN IRAN: STATE OF THE ART, TENDENCY AND SOLUTIONS ...................................... 033-037
Șerban CHIVULESCU, Ionuț SCHITEANU ESTIMATION OF CARBON STOCK IN SOUTH OF WESTERN CARPATHIANS FROM MOLDOVA NOUA FOREST DISTRICT USING G.I.S. DATA FROM MANAGEMENTS PLANS ..................................... 039-046
Aleksandra DESPOTOVIĆ, Miljan JOKSIMOVIĆ, Kristina SVRŽNJAK and Miomir JOVANOVIĆ RURAL AREAS SUSTAINABILITY: AGRICULTURAL DIVERSIFICATION AND OPPORTUNITIES FOR AGRI-TOURISM DEVELOPMENT..................... 047-062
Mykola NAZARENKO, Yuri LYKHOLAT, Ivan GRIGORYUK, Nina KHROMYKH CONSEQUENCES OF MUTAGEN DEPRESSION CAUSED BY DIMETHILSULFATE ...................................................................... 063-073
VALENTINA PELIVANOSKA, BILJANA JORDANOSKA-ŠIŠKOSKA, ILIJA RISTESKI, JORDAN TRAJKOSKI SOME MANUFACTURING PROPERTIES OF SEMI-ORIENTAL TOBACCOS BRED IN THE REGION OF PRILEP,WESTERN MACEDONIA ........................ 075-084
Farnaz ALASVANDYARI and Batool MAHDAVI EFFECT OF GLYCINEBETAINE ON GROWTH AND ANTIOXIDANT ENZYMES OF SAFFLOWER UNDER SALINITY STRESS CONDITION ........ 085-095
Mandizvo TAKUDZWA, Svotwa EZEKIA, Gabriel SOROPA, Shylet TSEKENEDZA, Tsitsi NDOWORA, Musiyandaka SHEPHERD, Anold Bray MASHINGAIDZE EVALUATION OF COMMON BEAN (PHASEOLUS VULGARIS L.) GENOTYPES FOR DISEASE TOLERANCE UNDER RAIN-FED CONDITIONS ...................................................................................... 097-108
Miljan VELJIĆ, Dušica RADONJIĆ, Milena ĐOKIĆ EFFECT OF LIGHTING PERIOD AND DIETS DENSITY OF BROILES ON THE APPEARANCE OF LESIONS ON THE FOOT PADS ........................... 109-116

Agriculture and Forestry, Volume 63. Issue 3: 1-234, Podgorica, 2017 4
Bijan ABADI A REVIEW OF THE IMPACT OF THE TARGETING SUBSIDY PLAN ON THE INPUT USE BEHAVIOR OF FARMERS IN IRAN ................... 117-126 Ajuma Inelo USMAN, Blessing Ajala OTALU, Lucky Dartsa WAKAWA PRELIMINARY ASSESSMENT OF GERMINATION AND EARLY GROWTH CHARACTERISTICS OF ALBIZIA ZYGIA (DC.) MACBR INFLUENCED BY DIFFERENT GROWTH MEDIA ........................... 127-135 Dragoljub MITROVIĆ, Radisav DUBLJEVIĆ, Milan JUGOVIĆ, Marija MARKOČ, Nenad ĐORĐEVIĆ ENERGY CONSUMPTION AND ENERGY EFFICIENCY IN LUCERNE ENSILING .............................................................. 137-146 Cristian Mihai ENESCU, Aureliu-Florin HĂLĂLIȘAN THE ECONOMIC CONTRIBUTION OF HUNTING PRODUCTS TO THE TURNOVER OF THE FORESTRY UNITS IN ROMANIA ................... 147-153 Dragana MILOŠEVIĆ, Trajče TALEVSKI, Drago MARIĆ PHENOTYPIC PLASTICITY OF RUTILUS PRESPENSIS (KARAMAN, S., 1924) FROM LAKE PRESPA AND LAKE SKADAR ............. 155-165 Majid BAGNAZARI, Mehdi SAIDI, Prakash HARISHCHANDRA SRIPATHY, Geetha NAGARAJA ESTABLISHMENT OF AN IMPROVED, EFFICIENT AND ECO-FRIENDLY MICROPROPAGATION SYSTEM IN SALACIA CHINENSIS L. AN ENDANGERED ANTI-DIABETIC MEDICINAL PLANT ............................ 167-176 Jelena GOLIJAN, Aleksandar POPOVIĆ, Bojan DIMITRIJEVIĆ, Ljubiša KOLARIĆ, Ljubiša ŽIVANOVIĆ THE STATUS OF THE FORAGE ORGANIC PRODUCTION IN THE REPUBLIC OF SERBIA ................................................ 177-187 Mykola KHARYTONOV, Oleksandr VELYCHKO CROPS ADAPTATION MANAGEMENT IN THE CONDITIONS OF STEPPE LANDSCAPE OF UKRAINE ................................... 189-198 Sabrija ČADRO, Jasminka ŽUROVEC, Salwa CHERNI-ČADRO SEVERITY, MAGNITUDE AND DURATION OF DROUGHTS IN BOSNIA AND HERZEGOVINA USING STANDARDIZED PRECIPITATION EVAPOTRANSPIRATION INDEX (SPEI) ............................. 199-206 Lenche VELKOSKA-MARKOVSKA, Biljana PETANOVSKA-ILIEVSKA, Aleksandar MARKOVSKI APPLICATION OF RAPID RESOLUTION LIQUID CHROMATOGRAPHY TO THE ANALYSIS OF SOME PESTICIDE RESIDUES IN APPLE JUICE ..... 207-219 Hamed HASSANZADEH KHANKAHDANI, Somayeh RASTEGAR, Behrooz GOLEIN, Morteza GOLMOHAMMADI and Abdolhossein ABOUTALEBI JAHROMI GENETIC DIVERSITY IN PERSIAN LIME (CITRUS LATIFOLIA TANAKA) ACCESSIONS USING MORPHOLOGICAL AND MOLECULAR MARKERS .................................................................................... 221-231 Instructions to authors ......................................................................................... 233-234

Agriculture & Forestry, Vol. 63 Issue 3: 5-14, 2017, Podgorica 5
DOI: 10.17707/AgricultForest.63.3.01
Ivan ŠIMUNIĆ, Palma ORLOVIĆ-LEKO, Ankica SENTA MARIĆ, Irena CIGLENEČKI, Tatiana MINKINA, Vilim FILIPOVIĆ1
QUALITY OF SURFACE WATER IN THE AGRICULTURAL DISTRICT LONJA FIELD (CROATIA)
SUMMARY
The objective of this study was to estimate the impact of land use on the surface water quality. Water samples were collected in the main drainage channel, in the agricultural area of Lonja field, Croatia. Lonja field is the largest protected wetland in both Croatia and the entire Danube basin. It extends along the river Sava and the lower course of the river Lonja. Sampling was performed during the spring months in 2015, 2016 and 2017. Investigation was done through the measurements of physicochemical indicators: pH value, biochemical oxygen demand (BOD), concentration of oxygen, nitrate, phosphate, trace metals (Zn, Pb and Cd), dissolved organic carbon (DOC), and surface active fraction of DOC. The obtained results were compared with those of the Lonja and Sava rivers. The significant higher concentrations of DOC (up to about 13 mg C dm-3) have been observed in the water from main drainage channel. It is known that, high DOC concentrations in surface waters have negative effects on the water quality and water habitats.
Keywords: surface water quality, agricultural area, physicochemical indicators, dissolved organic matter.
INTRODUCTION
Water quality for a particular purpose is determined on the basis of indicators of the composition, properties and concentration of individual substances in water (Šimunić, 2016).
In various soil-plant systems, pollutants may constitute a potential risk to the environment through their uptake by plants and subsequent input the food chain and, and the danger ensuing from their tendency to accumulate in vital organs of human, animals and plants, or because of possible contamination of drinking water.
1Ivan Šimunić, (corresponding author: [email protected]) Vilim Filipović, University of Zagreb, Faculty of Agriculture, Department of Soil Amelioration, Zagreb, CROATIA, Palma Orlović-Leko University of Zagreb, Faculty of Mining, Geology and Petrology Engineering, Zagreb, CROATIA, Ankica Senta Marić University of Zagreb, Medical Faculty, School of Public Health "Andrija Štampar", Zagreb, CROATIA, Irena Ciglenečki Divisin of Marine and Environmental Reasearch, Ruđer Bošković Institute, Zagreb, CROATIA, Tatiana Minkina Southern Federal University, Soil Science and Agrochemistry Department, Rostov-on-Don, RUSSIA. Presented at the 7th International Symposium of Ecologists (ISEM7), Sutomore, Montenegro. Notes: The authors declare that they have no conflicts of interest. Authorship Form signed online.

Šimunić et al. 6
Excessive nitrate and phosphorus concentration in water may lead to eutrophication of watercourses or stock watering places. If such water is used for human consumption, it may cause methemoglobinemia in infants and animals (Pratt and Jury, 1984; Matson et al., 1997). Potencial cancer risk from nitrate and nitrite in water and food has been reported Rademacher et al. (1992). Leaching of nitrates from soil depends on many factors, such as amount, frequency and intensitety of precipitation, soil properties, crop type and it's development, evaporation, soil tillage and nitrogen fertilization (Vidaček et al., 1999; Nemeth, 2006; Josipović et al., 2006; Nemčić et al., 2007; Šimunić at al., 2011). The problem of nitrate (and other pollutants) leaching is even pronounced in agrecosystems of hydroameliorated fields, especially in drained soils because of changed infiltration and filtration capabilities of these soils.
One of the parameters in evaluation criteria of the natural waters ecological status is trace metals concentrations (Water Framework Directive, 2000). Metals may include non-essential ones, such as Cd and Pb that can be toxic even at trace levels, and biologically essential elements, such as Cu, Fe, Mn and Zn, which might cause toxic effects at elevated concentrations (Wong et al., 2006; Jakovčić at al., 2003). The essential heavy metals exert biochemical and physiological functions in plants and animals. Metals are non-biodegradable and accumulative in nature (Tchounwou et al., 2012). Although the speciation of metals is important because has a profound effect on their biological availability, the total/dissolved concentration gives a general overview of the particular water body (Cukrov et al., 2008).
Dissolved organic matter (DOM), one of the most complex naturally occurring mixtures, plays a central role in the biogeochemistry and the photochemistry of natural waters. Dissolved organic carbon (DOC) is the measurable elemental organic carbon content of DOM
(Filella, 2009) and is generally defined as compounds that can pass through a 0.45 μm or 0.7 μm filter. DOC provides a nutritional and energy base for life i.e. micro-and macro-organisms, and is a source for nutrient regeneration, ion exchange capacity, light and heat absorption, having major impact on the speciation of many trace elements. However, high DOC concentrations in surface waters have negative effects on the water quality and water habitats. Further, in the biogeochemical processes in aquatic environment, the physicochemical properties of organic matter are often more important than the amount present. The fraction of DOC which possesses surface active properties may be very important for natural freshwater. The molecules of surface active substances (SAS) have their hydrophilic parts oriented towards the water phase while the hydrophobic ends are located on the air, which is a thermodynamically favourable configuration. Organic SAS are concentrated by adsorption processes on natural phase boundaries: water–atmosphere, water-sediment, water–suspended particles, where they greatly affect transfer of mass and energy (Ćosović and Vojvodić, 1998). Research on the DOC and SAS provides an important tool for better understanding of the content, distribution, physico-

Quality of surface water in the agricultural district Lonja field (Croatia) 7
chemical characteristics as well as dynamics of the complex mixture of DOM in the natural waters (Orlović-Leko et al., 2016).
The objective of this study was to estimate the impact of the use of hydromeliorated agricultural land for cultivation of agricultural crops on the surface water quality.
MATERIAL AND METHODS
Hydroameliorated agricultural land is located in the central part of the river Sava valley and partially borders the Lonja field Nature Park, which is the largest protected wetland both in Croatia and the entire Danube basin. It extends along the river Sava and the lower course of the river Lonja. Total area of the hydroameliorated land is about 4.000 ha.
Water samples were collected in the main drainage channel and rivers Sava and Lonja. Sampling was performed during the spring months in 2015, 2016 and 2017. Investigation was done through the measurements of physicochemical and chemical indicators: pH value, biochemical oxygen demand (BOD), concentration of oxygen, nitrate, phosphate, trace metals (Zn, Pb and Cd), dissolved organic carbon (DOC), and surface active fraction of DOC.
• pH value was measured by pH meter-HRN ISO 10523:2012. • Electrical conductivity is determined by norm HRN EN 27888:2008. • Biochemical oxygen demand by norm HRN ISO 5815:1998 en. • Concentration of oxygen by HRN EN 25813:1998 en. • Nitrate was determined by spectrophotometrically method-HRN ISO
13395:1996. • Phosphorus was determined by method continous flow analysis-HRN
ISO 15681-2:2008. • Trace elements were determined by AAS- HRN ISO 8288:1998 (ISO
8288:1986). • Dissolved organic carbon (DOC) concentrations were determined by
using a high-temperature • Catalytic oxidation analyzer (TOC-5000 Model, Shimadzu, Japan). • Surface active substances (SAS) were measured by the electrochemical
method (AC voltammetry, out of phase). For the quantification of the SAS content in samples a calibration plot of the nonionic surfactant Triton-X-100 was used (Ćosović and Vojvodić, 1998; Orlović-Leko et al., 2016).
• The quality of the surface waters is determined on the basis of the Water Classification Decree (National Gazette, 137/08).
RESULTS
Water quality is determined by a number of indicators that can be divided into pyisicochemical, oxygen regime indicators, nutrients and biological indicators.
Results of investigation are presented in Tables 1 - 5. Pysicochemical indicators are presented through pH value, electrical conductivity (EC) (Table 1).

Šimunić et al. 8
Oxygen regime indicators are presented through concentration of oxygen and biochemical oxygen demand (Table 2). Nutrients through nitrates, ammonia and phosphorus (Table 3). Trace metals (Zn, Pb and Cd) are listed in Table 4. Additionally, organic matter is investigated through the study of surface activity (SA) of dissolved organic carbon (DOC), Table 5 and the ratio SAS/DOC values (Table 6).
DISCUSSION
Pysicochemical indicators Value of pH is an important indicator of water quality. If the pH values of
water are in the range between pH = 6.5 and pH = 8.5, it means that water can be used for all purposes. If the pH value falls between pH= 6.0 and pH= 6.5 than water have to be purifed before for any purpose of use and outside these pH values, water is a undesirable environment for plants and animal world and is not recommended for use in technological purposes. In Table 1 are presented the pH values of the investigated water samples.
According to the pH values, the water were in first class and were rated as a high state. Electrical conductivity (EC) is an indicator of salt concentration in water, i.e. water salinity. Informations about salt concentration in water indicates its usability in irrigation, since a higher salt concentration can cause soil salinity, that is, higher concentration of salt in soil solutions has an adverse effect on water uptake through plant roots, which in turn causes a drop in turgor pressure. Reduced turgor leads to plant limpness, drying and falling of leaves, as well as lower yields. As most plants are sensitive to the presence of salts, it is recommended that salt concentration in irrigation water should not surpass limit value of 3 dS/m (Ayers and Westcot, 1985), or more precisely salt concentration to 0.7 dS/m there are no limitations.
Table 1: Pysicochemical indicators
Water system pH Electrical conductivity – EC (dS/m)
2015 2016 2017 2015 2016 2017 Main drainage channel 7.6 7.7 7.5 0.380 0.356 0.370 Rating for each indicator I I I I I I
River Lonja 7.7 7.8 7.8 0.440 0.439 0.453 Rating for each indicator I I I I I I
River Sava 7.7 7.7 7.7 0.420 0.442 0.438 Rating for each indicator I I I I I I
From the Table 1, it is evident that the EC in all surface water were less
than 0.5 dS/m and puts water in the first class and was rated as a high state. Based on physico-chemical indicators, surface water of all water bodies
are classified into the first class and their condition is marked as high.

Quality of surface water in the agricultural district Lonja field (Croatia) 9
Oxygen regime indicators Organic matter in water refers to all substances that are in natural water in
dissolved and suspended form. Total organic matter is divided into biologically degradable and nondegradable substances. According to its origin, organic matter in water can be a product of biochemical processes or a product of human activities. Occurrence of water pollution is a consequence of soil leaching by precipitation water as well as of components of urban and industrial westwaters. Indicator of organic matter degradability in water by microorganisms is called the biochemical oxygen demand (BOD). Total biochemical oxygen consumption is the amount of oxygen required for complete organic matter degradation (Šimunić, 2016).
As evident from Table 2, the oxygen concentration in the water channel was in the category of the third class and the water status was rated as moderately, while according to biochemical oxygen demand water channel was in the category of the second class and the water status was rated as good.
According to the indicator group, the channel water corresponds to the third category and the water status is rated as moderate.
In all years of research the oxygen concentrations in the rivers of Lonja and Sava were in the category of the first class and the water status was rated as high, while according to biochemical oxygen demand water were in the category of the third class and the water status was rated as moderate. According to the indicator group, the water of rivers Lonja and Sava are classified in the third category and the water status is rated as moderate.
Table 2: Oxygen regime indicators
Water system Oxygen (mg O2/L) Biochemical oxygen demand–BOD5 (mg O2/L)
Rating by indicator
group 2015 2016 2017 2015 2016 2017 Main drainage
channel 5.54 4.69 5.90 3.09 3.16 3.87
Rating for each indicator III III III II II II III
River Lonja 8.01 9.61 9.49 4.76 5.53 4.33 Rating for each
indicator I I I III III III III
River Sava 8.17 8.32 8.06 4.82 5.12 4.12 Rating for each
indicator I I I III III III III
Nutrients Nutrients in water mostly refer to dissolved nitrogen and phosphorus
compounds. Nutrients can get into water by leaching from agricultural soils where they are used as mineral fertilizers and from household and industrial wastewater. Increased concentration of nutrients in water causes intensified production of primary organic matter, namely, eutrophication, These compounds

Šimunić et al. 10
are found in water in different forms and are subject to changes, in dependence on the amount of oxygen in water.
In the investigated period, concentration of nitrates in main water channel was in the category of the third class and the water status was rated as moderately, while according to concentration of ammonia, it was in the category of the fifth class and the water status was rated as bad. According to the concentration of phosphorus it was in the second class and was rated as good. (Table 3). According to the indicator group, the water channel is classified into the fifth category and the water status is rated as bad.
Table 3: Nutrients
Water system
Nitrates NO3-N (mg/L)
Ammonia NH4-N (mg/L)
Phosphorus PO4–P (mg/L)
Rating by indicator
group 2015 2016 2017 2015 2016 2017 2015 2016 2017 Main
drainage channel
2.52 3.17 3.43 3.62 1.55 2.27 0.15 0.13 0.16
Rating for each
indicator III III III V V V II II II V
River Lonja 1.69 1.72 1.57 1.47 1.20 1.30 0.08 0.11 0.14
Rating for each
indicator III III III IV IV IV I II II IV
River Sava 1.45 1.69 1.70 1.37 1.24 1.22 0.10 0.11 0.13
Rating for each
indicator II III III IV IV IV II II II IV
Concentrations of nitrates in the rivers of Lonja and Sava were in the
category of the third class and the water status was rated as moderate, while according to concentration of ammonia water were in the fourth category and the water status was rated as poor and according to the concentration of phosphorous in water, they are classified into second category. According to the indicator group, the water of rivers Lonja and Sava are classified in the fourth category and the water status is rated as poor. It is evident that the concentration of nitrates and ammonia in the water channels was higher in all years than in the Lonja and Sava river waters, which could have caused a lower oxygen concentration in the water channel, or a weaker nitrification process. The concentration of nitrates and ammonia in the rivers was similar to that of phosphorus concentrations, while the phosphorus concentration in the water channel was somewhat higher. Another reason for increased nutrient concentration in water channel is fertilization and cultivation of agricultural crops on hydromeliorated areas. Nutrient concentrations and their leaching depend on several factors, such as the amount

Quality of surface water in the agricultural district Lonja field (Croatia) 11
of mineral fertilizer input, hydrological conditions, soil type, cultured crops and so on (Vidaček et al., 1999; Mesić et al., 2007; Šimunić et al., 2011).
Trace metals Concentrations of trace metals (Zn, Pb and Cd) in all water samples did
not indicate water pollution (Table 4), which is in agreement with the results obtained by Moore (1981), Đumija et al. (1989), Čoga (1998) and Šimunić et al. (2002). Different mean concentrations of Zn and Cd were recorded both between years and between different aquatic bodies. The same may be assumed for Pb due to detection limit (< 1.0 μg/L).
Based on concentrations of Zn, the investigated surface water are classified into the first class and their state is marked as high. According to the concentrations Pb and Cd, water are classified into the second class and their state is marked as good.
Table 4: Trace metals
Water system Zn (μg/L) Pb (μg/L) Cd (μg/L) 2015 2016 2017 2015 2016 2017 2015 2016 2017
Main drainage channel
15.2 12.7 11.6 <1.0 <1.0 <1.0 0.25 0.18 0.21
Rating for each
indicator I I I I or II I or II I or II II II II
River Lonja 22.1 10.5 10.8 <1.0 <1.0 <1.0 0.23 0.20 0.35 Rating for
each indicator
I I I I or II I or II I or II II II II
River Sava 22.9 18.4 14.2 <1.0 <1.0 <1.0 0.19 0.23 0.27 Rating for
each indicator
I I I I or II I or II I or II II II II
Organic matter Data on the dissolved organic carbon, DOC and surface active substances,
SAS are presented in Table 5.
Table 5: Concentrations of DOC and SAS
Water system DOC mg C dm−3
SAS mg dm−3 eq. Triton-X-100
Main drainage channel 9.48 - 13.35 0.195– 0.197 River Lonja 4.62 - 7.75 0.209–0.211
River Sava 1.60 1.57 - 3.30*
0.200 0.017–0.620*
*Orlović-Leko et al., 2004.

Šimunić et al. 12
Concentration of DOC in the main water channel were in the range of 9.48 to 13.35 mg C dm−3 (Table 5). These DOC concentrations are significant higher (2 to 8 times) than those measured in the surface freshwater systems of the rivers Lonja and Sava. In comparison, concentrations of DOC in the drainage water of hydroameliorated agricultural areas in the central Sava river valley, Croatia, were in the range from 1.07 do 9.93 mg C dm-3 (Orlović-Leko et al., 2016). Concentrations of DOC in natural fresh waters range from ~1 to 60 mg C dm-3, but are commonly from 1-5 mg C dm-3 (McDonald et al., 2004). Table 6: The ratio SAS/DOC values obtained in investigated water samples and
in different model substances (Ćosović et al., 2007; Orlović et al, 2016)
SAS SAS eq T-X-100/ DOC
Dominant SAS in the water samples
Triton-X-100 1.54 Lignosulphonate 6,8 x 10 -4
Monocarboxylic acids Caprylic acid (pH=4) 0.016 Capric acid (pH=4) 0.17
Capric acid (pH=6.5) 0.015 Oleic acid 2.7
3-Hydroxybutanoic acid 0.05 3-Hydroxybenzoic acid 8.2x10⁻⁴
cis-Pinonic acid 0.001 Polycarboxylic acids
Humic acid 0.04 Fulvic acid 0.17
Protein Albumine 0,20
Polysaccharide Xanhtan 0.04
Water samples in this work Main drainage channel 0.017 Monocarboxylic acids
River Lonja 0.03 Xanhtan, Humic acid River Sava 0.16 Fulvic acid
A quantification of adsorbable organic substances was performed by using
a calibration plot of Triton-X-100 (Ćosović and Vojvodić, 1998; Orlović-Leko et al., 2016). The relative concentrations of surface active substances (SAS) for all investigated water samples were relatively low (Table 5). The relative concentrations of SAS values obtained in the drainage water samples were between 0.11 and 0.45 mg dm-3 eq. Triton-X-100, with the average value of 0.36

Quality of surface water in the agricultural district Lonja field (Croatia) 13
± 0.10 mg dm-3 (Orlović-Leko et al., 2016). However, the concentration of SAS also depends on the nature of the organic molecules in the samples.
The rapid and rough SAS characterization in the studied samples was done by comparisson of its SAS/DOC ratio values with SAS/DOC ratios of different model substances, possible constituents and/or pollutants in aquatic system (Table 6). Triton X-100, here presented as a model of strongly adsorbable surfactant, it is reasonable to expect that very small amounts of some strongly adsorbable substances, for example pollutants, could markedly increase surfactant activity of water samples (Orlović-Leko, 2004).
As can be seen from Table 6, SAS in the main drainage channel water were with similar adsorption behaviour like monocarboxylic acids, while in the river Lonja, SAS/DOC = 0.03 and are very close to the ones determined for xanhtan and humic acid. Further, from the result for Sava river (SAS/DOC = 0.16) can be concluded that fulvic acid represent a predominant class of surface active material. Generaly, in the freshwater samples humic and fulvic acid main class of surface active material, mainly from terrestrial input (Orlović-Leko et al., 2016). The presence of the monocarboxylic acids in the main drainage channel can be probable consequence proceses of the decomposition of complex organic material.
CONCLUSION On the basis of the indicators for determining water quality in the main
drainage channel and rivers of Lonja and Sava, the following can be concluded that the impact of the use of hydromeliorated agricultural land for cultivation of agricultural crops on the surface water quality has been established for nutrient which is obviously a consequence of mineral fertilization and organic matter.
ACKNOWLEDGMENTS This work is supported by the projects "The Sulphur and Carbon Dynamics
in the Sea and Fresh-Water Environment" (IP-11-2013-1205 SPHERE) and "Financings of scientific activity (No. 1-14-900)-University of Zagreb.
REFERENCES
Ayers, R., Westcot, D.W. (1985) Water quality for agriculture. FAO Irrigation and Drainage paper. Food and agriculture organization of the United nations, No.29, Roma.
Cukrov, N., Cmuk, P., Mlakar, M., Omanovic, D. (2008) Spatial distribution of trace metals in the Krka River, Croatia: An example of the self-purification. Chemosphere, 72; 1559–1566.
Ćosović B, Vojvodić V. (1998) Voltammetric analysis of surface active substances in natural seawater. Electroanalysis, 10; 429-434.
Ćosović B., Orlović-Leko, P., Kozarac, Z. (2007) Rainwater Dissolved Organic Carbon: Characterization of Surface Active Substances by Electrochemical Method. Electroanalysis, 19-20; 2077–2084.
Čoga, L., Vidaček, Ž., Poljak, M., Kovačević, V. (1998) Cadmium and lead in the system drained soil-plant-water in the Drava-Danube catchment area. 16thWorld Congress of Soil Science, 1;13 (Summary), Montpellier, August 20–26.
Đumija, LJ., Manitašević, J. (1989) Determination of heavy metals and inorganic pollutants in water of canals on experimental field Ježevo. Agrohemija, 1-3; 69–77.

Šimunić et al. 14
Filella, M. (2009) Freshwaters: which NOM matters. Environmental Chemistry Letters, 7; 21–35.
Jakovčić,T., Marijanović Rajčić, M., Senta, A. (2003) Assessment of Anthropogenic Influence on Pollution of River Water Drava and Mura by Heavy Metals. Proceedings- 3th Croatian Conference on Waters. 291-294. Osijek, May 28–31.
Josipović, M., Kovačević, V., Šoštarić, J., Plavšić, H., J. Liović. (2006) Influences of irrigation and fertilization on soybean properties and nitrogen leaching. Cereal Research Communications, 34 (1); 513-516.
Matson, P.A., Parton, W.J., Power, A.G., Swift, M.J. (1997) Agricultural intensification and ecosystem properties. Science, 277; 504–509.
McDonald, S., Bishop, A.G., Prenzler, P.D., Robards, K. (2004) Analytical chemistry of freshwater humic substances. Analytica Chimica Acta 527, 2; 105–124.
Mesić, M., Bašić, F., Kisić, I., Butorac, A., Gašpar, I. (2007): Influence of mineral nitrogen fertilization on corn grain yield and nitrogen leaching. Cereal Research Communications 35 (2); 773–776.
Moore, J.W. (1981): Influence of water movements and other factors on distribution and transport heavy metals in a shallow bay (Canada). Arch Environ Contam Toxicol, 10; 7–15.
Nemčić, J.J., Mesić, M., Bašić, F., Kisić, I., Zgorelec, Z. (2007) Nitrate concentration in drinking water from wells at three different locations in Northwest Croatia. Cereal Research Communication, 35 (2); 533–536.
Nemeth, T. (2006) Nitrogen in the soil-plant system nitrogen balances. Cereal Research Communications, 34 (1); 61–64.
Orlović-Leko, P., Kozarac, Z., Ćosović, B. (2004) Surface active substances (SAS) and dissolved organic matter (DOC) in atmospheric precipitation of urban area of Croatia (Zagreb). Water Air and Soil Pollution, 158; 295–310.
Orlović-leko, P., Vidović, K., Plavšić, M., Ciglenečki, I., Šimunić, I., Minkina, T. (2016) Voltammetry as a tool for rough and rapid characterization of dissolved organic matter in the drainage water of hydroameliorated agricultural areas in Croatia. Journal of Solid State Electrochemistry, 20; 3097–3105.
Pratt, P., Jury, W.A. (1984) Pollution of the unsaturated zone with nitrate. Ecological Stududies, 47; 52–67.
Rademacher, J.J., Young, T.B., Kanarek, M.S. (1992) Gastric cancer mortality and nitrate levels in Wisconsin drinking water. Archives of Environmental Health, 47; 292–294.
Šimunić, I., Tomić, F., Kisić, I., Romić, M. (2002) The content of Pb, Zn and Cd in hydroameliorated soil and drainage water and their uptake by plants. Rostlina vỳroba, 48 (9); 401–406.
Šimunić, I., Mesić, M., Sraka, M., Likso, T., Čoga, L. (2011) Influence of drainage on nitrate leaching and maize yield. Cereal Research Communications, 39 (2); 273–282.
Šimunić, I. (2016) Water quality. In book: Regulation and protection of water. Croatian University Press, Zagreb, 165 p.
Vidaček, Z., Sraka, M., Čoga, L., Mihalić, A. (1999) Nitrates, heavy metals and herbicides in soil and water of Karasica-Vucica catchment area. Agriculturae Conspectus Scientificus, 64 (2); 143–150.
Tchounwou, P.B., Yedjou, C.G., Patlolla, A.K., Sutton, D.J.(2012): Heavy Metals Toxicity and the Environment. Experientia Supplementum, 101; 133–164.
Wong, S.C., LI, X., Thornton, I. (2006) Urban enviromental geochemistry of trace metals. Enviromental Pollution, 142; 1–16.
Water Framework Directive (Directive 2000/60/EC) Official Gazette of the Republic of Croatia - Water Classification Decree (National Gazette,
137/08).

Agriculture & Forestry, Vol. 63 Issue 3: 15-21, 2017, Podgorica 15
DOI: 10.17707/AgricultForest.63.3.02
Marina VUKŠA, Goran JOKIĆ, Tanja BLAŽIĆ, Suzana ĐEDOVIĆ, Bojan STOJNIĆ1
COMBATING HARMFUL RODENTS IN FOREST OAK SAPLING PLANTATIONS
SUMMARY
During any forest renewal process, human activity disturbs forest ecosystems and creates conditions for development of certain species of rodents. At the beginning of recovery process in forest areas, sources of seed material or herbaceous plant cover rich in nutrients are readily available, favoring populations of small rodents, especially mice and voles.
We tested the effectiveness of a preparation based on the active ingredient difenacoum for applications in forests under rodent infestation category four. The rodenticide Ratak Forst, difenacoum (0.005%), a granular bait GB, was tested in comparison with a pellet formulation of BRODISAN-A, bromadiolone (0.005%). The experiments were performed according to EPPO Standards (2004) methodology, in a randomized complete block design with four replications at two locations. Plot size was 20x20 m2. Baits were laid in amount of 30 g (one bag) per commercial plastic box. One hundred and five boxes were installed per plot, i.e. a total of 420 boxes per preparation.
The results show that the tested Ratak Forst (76.46%) and the standard preparation BRODISAN-A (79.85%) had very good efficacy in controlling rodents.
Keywords: forest damage, harmful rodents, rodenticide, difenacoum, bromadiolone, efficacy, control.
INTRODUCTION
Forests are complex ecosystems, rich in a variety of plant and animal species, often protected ones. Due to specific ecological conditions, forest ecosystems make a suitable environment for habitation of various species of rodents. In stable ecosystems, the presence of rodents may ensure natural regulation, preservation and renewal in forest areas.
Human activities destabilize forest ecosystems under renewal and create favorable conditions for various species of rodents. At the beginning of forest renewal, seeds and green plant cover rich in nutrients are readily available, offering a suitable environment for development of harmful small rodent species,
1Vukša Marina (corresponding author: [email protected]), Jokić Goran, Blažić Tanja, Đedović Suzana, Institute of Pesticides and Environmental Protection, Zemun, SERBIA, Stojnić Bojan, University of Belgrade, Faculty of Agriculture, SERBIA. Presented at 7th International Symposium of Ecologists (ISEM7), Sutomore, Montenegro. Notes: The authors declare that they have no conflicts of interest. Authorship Form signed online.

Vuksa et al. 16
especially voles and mice. From seeding until stable ecosystem establishment, the activity of rodents may cause significant losses in oak saplings during the renewal process. Initial losses are associated with the collection and consumption of acorns in newly established sapling plots. Such activities lead to thinning and spreading of resulting clearings. Further damaging of roots, root necks and stems of oak saplings, more evident during winter months, carries on the thinning in stands and expands bare areas. In oak forests grown for produce, rodents may cause significant losses by dispersing, consuming and damaging uneaten seeds.
Considering the perennial and specific technology of oak cultivation, various activities are expected to ensure a sufficient number of trees until their periodic planned thinning. An acceptable form of protection of oak forests from damaging rodents, before using any control measures, should include an identification of species that are present in any such environment, as well as their biological properties and mutual competition. Such knowledge is a basis for measures of protection that will include preventive and curative activities.
Protection of oak forests from harmful rodents begins with preparing an area for seeding and lasts until a stable ecosystem, i.e. competitive relations among the present species, have been established.
Over a period of several years, we monitored the levels of rodent infestation, presence of species, and degrees of damage caused by rodents, and suggested measures of protection from rodents in a number of locations throughout Vojvodina Province of Serbia. Our research resulted from a need to protect forests, especially oak sapling stands and renewed forest stands. Determination of the presence and abundance of harmful species of small rodents in selected sites was carried out using Longworth traps. The results confirmed a predominance of the herbivorous common vole, Microtus arvalis, and the granivorous small forest mouse Apodemus sylvaticus, as the most damaging species of small rodents, compared to all other rodent species found (field mouse Apodemus agrarius, yellow-necked wood mouse Apodemus flavicolis, and ginger Poland vole Chletrionomys glareolus). This kind of population structure indicates abnormal interspecific relationships that call for measures of protection in order to reduce their numbers. Considered from a geomorphological point of view, large numbers of Apodemus agrarius may be attributed to the insufficient number of oak saplings in renewed stands in the vicinity of their habitats in field crops. A comparison with the harmful species of small rodents present in old plantations inferred that a natural balance requires a greater representation of species that are typical for forest habitats, especially of the yellow-necked mouse. Further research should be directed towards ensuring a required representation of that species, i.e. the number sufficient to establish competitive relationships and so naturally regulate the abundance of the most damaging species found in oak plantings under renewal. Considering forest stands under renewal, higher representation of the yellow-necked forest mouse is desirable. In 2013, a significant damage was reported in the locations Morović and Kupinovo in May-June (more than 30%). In parts of these sites with very favorable microclimate,

Combating harmful rodents in forest oak sapling plantations 17
small rodents were responsible for a 60% reduction in the number of oak saplings. At a number of sites, we found increased numbers of rodents (category four), and we considered it necessary to apply anticoagulant rodenticides based on bromadiolone, brodifacoum and difenacoum. For lower categories, properly applied rodenticides based on the trace elements selenium and vitamin D3 achieved adequate efficiency (determined by EPPO methods 2004). (Draganić et al, 2008.; Đedović, et al, 2012.; Jokić et al, 2010.; Vukša et al. 2010.).
We tested the effectiveness of a difenacoum-based product in forests exposed to category four of rodent infestation. Tested was the rodenticide Ratak Forst, difenacoum (0.005%), as a granular bait GB, in comparison to BRODISAN-A in a pellet formulation, bromadiolone (0.005%). (BASF, 2013.; HSDB, 2013.; Liste 2013. Greaves, 1995.; Lund 1984.).
In accordance with findings on site, the difenacoum-based product was tested in 2013 for product registration for use in forests under rodent infestation category four.
MATERIALS AND METHODS The rodenticide product Ratak Forst BAS 405 09 I based on difenacoum
(0.005%), formulated as granular bait (GB), was tested in comparison to BRODISAN–A, a standard bromadiolone product in pellet formulation, because no difenacoum-based product was registered in Serbia at the time. The experiments were conducted according to EPPO Standards (2004) methodology, using a randomized block design with four replicates.
Plot size depended on area cover and abundance of small rodent species, and was set to 20x20 m2. Baits in the amount of 30 g (1 bag) were laid in commercial plastic boxes.
A total of 105 boxes were laid in each plot, i.e. a total of 420 boxes per product.
•Standard methods: Biological efficacy: EPPO (2004): PP1 Vol 5 pp 36-48; 48-57; Phytotoxicity: EPPO 2004b: PP 1/135 (2).Vol. 1, pp. 32-37.
•Crop/forest stand: forest, oak sapling stands; Species, hybrid/cultivar: common oak; Cultivation type: common oak stand under renewal ; Development stage: 3-yr oak stand at Morovići, and 5-yr stand at Kupinovo
•Location (Naziv): „Sremska Mitrovica“ Forest Holding; Morović (N45000'03; E 019008'997") and Kupinovo (N 44042'20"; E 20039'25"); Soil data (corresponding to method): chernozem
•Harmful rodent species: Common vole (Microtus arvalis), Striped field mouse (Apodemus agrarius), Yellow-necked mouse (Apodemus flavicolis); Wood mouse (Apodemus sylvaticus); Bank vole (Clethrionomys glareolus)
•Experimental design: complete randomized block •Replicates: four • Plot size: 20x20 m •Meteorological data at time of application: precipitation and temperature
suitable for activity of high numbers of rodents

Vuksa et al. 18
•Application time: 20 May 2013 – baits laid •Application rate: 30 g (1 bag)/box of tested product; 30 g/box of standard
product Application: The product Ratak Forst BAS 405 09 I was laid at places frequently visited
by rodents. Prior to laying the product, a detailed examination of the infested area was required to discover rodent tracks and hiding places after their active (inhabited) holes have been found. Baits were laid near the holes, i.e. 30 g of bait per box or plastic bag per active hole. The tested product was laid in bait boxes to prevent accidental poisoning of wildlife and other non-target organisms and protect the product from moisture occurring in forest habitats. The standard product was applied in the same way as the test product.
•Character observed and assessment method: average number of rodents per forest plot calculated from the number of active holes. •Time of assessment of rodent infestation: 18 May 2013; Time of bait
laying: 20 May 2013; Efficacy assessment timing: 3, 7, 14 and 28 days after treatment, i.e. on 23 May, and 3, 6 and 17 June 2013.
•Statistical processing: Means, standard deviation, Henderson-Tilton (1955) formula.
RESULTS The efficacy of the test product Ratak Forst BAS 405 09 I was low in the
early stage (3.96%), similar to the standard product BRODISAN-A, (1.03%) at the locality Morović.
Table 1. Average number of rodents (M. arvalis, A. agrarius, A. flavicolis, A. Sylvaticus and C. glareolus) prior to treatment at MOROVIĆ location
Product Replicates Sv± sd Efficacy % I II III IV
Ratak Forst BAS 22 30 26 23 25.25 ± 3.59 - BRODISAN-A 19 26 25 27 24.25 ± 3.59 -
Control 19 22 24 22 21.75 ± 2.06 - Fourteen days after treatment, a significant increase in efficacy was noted
both for the tested and standard products, as compared to their initial effects.
Table 2. Average number of rodents (M. arvalis, A. agrarius, A. flavicolis, A. sylvaticus and C. glareolus) 3 days after treatnebt abd rodenticide efficacy (EF %) at MOROVIĆ location
Product Replicates Sv ± sd Efficacy % I II III IV Ratak Forst BAS 21 29 26 21 24.25 ± 3.95 3.96 BRODISAN-A 19 25 25 27 24.00 ± 3.46 1.03
Control 19 22 24 22 21.75 ± 2.06 - The results showed that the test product Ratak Forst BAS 405 09 I
(78.74%) and the standard product BRODISAN-A (76.70%) achieved good
Combating harmful rodents in forest oak sapling plantations 19
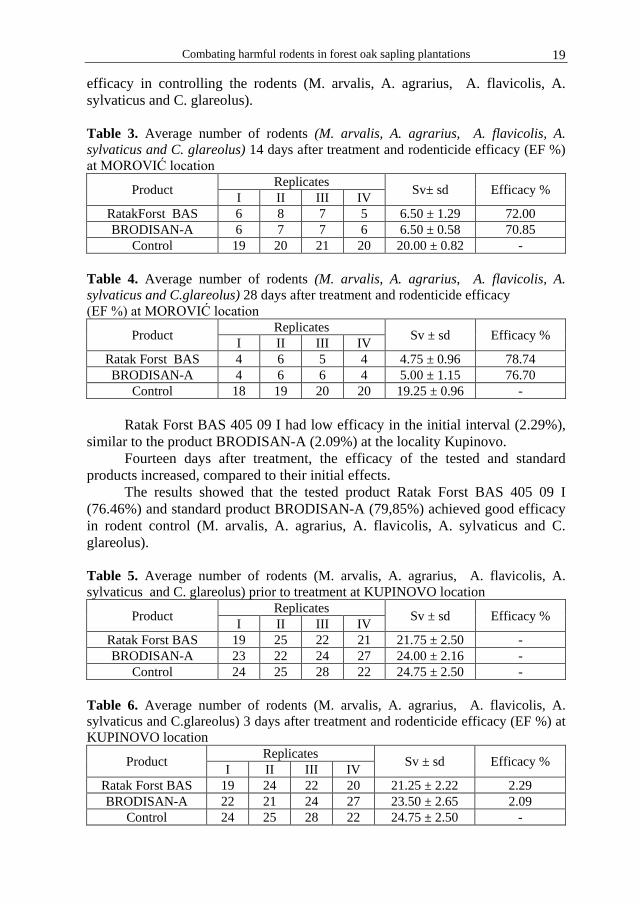
efficacy in controlling the rodents (M. arvalis, A. agrarius, A. flavicolis, A. sylvaticus and C. glareolus).
Table 3. Average number of rodents (M. arvalis, A. agrarius, A. flavicolis, A. sylvaticus and C. glareolus) 14 days after treatment and rodenticide efficacy (EF %) at MOROVIĆ location
Product Replicates Sv± sd Efficacy % I II III IV RatakForst BAS 6 8 7 5 6.50 ± 1.29 72.00 BRODISAN-A 6 7 7 6 6.50 ± 0.58 70.85
Control 19 20 21 20 20.00 ± 0.82 -
Table 4. Average number of rodents (M. arvalis, A. agrarius, A. flavicolis, A. sylvaticus and C.glareolus) 28 days after treatment and rodenticide efficacy (EF %) at MOROVIĆ location
Product Replicates Sv ± sd Efficacy % I II III IV Ratak Forst BAS 4 6 5 4 4.75 ± 0.96 78.74 BRODISAN-A 4 6 6 4 5.00 ± 1.15 76.70
Control 18 19 20 20 19.25 ± 0.96 - Ratak Forst BAS 405 09 I had low efficacy in the initial interval (2.29%),
similar to the product BRODISAN-A (2.09%) at the locality Kupinovo. Fourteen days after treatment, the efficacy of the tested and standard
products increased, compared to their initial effects. The results showed that the tested product Ratak Forst BAS 405 09 I
(76.46%) and standard product BRODISAN-A (79,85%) achieved good efficacy in rodent control (M. arvalis, A. agrarius, A. flavicolis, A. sylvaticus and C. glareolus). Table 5. Average number of rodents (M. arvalis, A. agrarius, A. flavicolis, A. sylvaticus and C. glareolus) prior to treatment at KUPINOVO location
Product Replicates Sv ± sd Efficacy % I II III IV Ratak Forst BAS 19 25 22 21 21.75 ± 2.50 - BRODISAN-A 23 22 24 27 24.00 ± 2.16 -
Control 24 25 28 22 24.75 ± 2.50 - Table 6. Average number of rodents (M. arvalis, A. agrarius, A. flavicolis, A. sylvaticus and C.glareolus) 3 days after treatment and rodenticide efficacy (EF %) at KUPINOVO location
Product Replicates Sv ± sd Efficacy % I II III IV Ratak Forst BAS 19 24 22 20 21.25 ± 2.22 2.29 BRODISAN-A 22 21 24 27 23.50 ± 2.65 2.09
Control 24 25 28 22 24.75 ± 2.50 -

Vuksa et al. 20
Table 7. Average number of rodents (M. arvalis, A. agrarius, A. flavicolis, A. sylvaticus and C. glareolus) 14 days after treatment and rodenticide efficacy (EF %) at KUPINOVO location
Product Replicates Sv ± sd Efficacy % I II III IV
Ratak Forst BAS 8 8 6 8 7.50 ± 1.00 61.64 BRODISAN-A 7 7 9 11 8.50 ± 1.91 60.60
Control 20 22 25 22 22.25 ± 2.06 -
Table 8. Average number of rodents (M. arvalis, A. agrarius, A. flavicolis, A. sylvaticus and C. glareolus) 28 days after treatment and rodenticide efficacy (EF %) at KUPINOVO location
Product Replicates Sv± sd Efficacy % I II III IV RatakForstBAS 2 7 3 6 4.50 ± 2.38 76.46 BRODISAN-A 3 5 5 4 4.25 ± 0.96 79.85
Control 20 22 24 21 21.75 ± 1.71 -
DISCUSSION The data show that the efficacy of the tested product Ratak Forst BAS 405
09 I was either higher or on a par with the standard product. The monitoring results had indicated that infestation with small rodents
reached category four in a number of locations. Based on hitherto research data on the efficacy of naturally-occurring rodenticides and available literature it is possible to infer that their use has proved insufficiently effective in reducing rodent numbers to acceptable economic levels. It is especially important in areas in which category four infestation was reported. At lower infestation categories, regularly applied rodenticides based on naturally-occurring compounds achieve adequate efficacy.
The data available so far show that, in areas with high rodent infestation, i.e. categories four and five, rodenticide treatments should be made based on second-generation anticoagulant products such as Ratak Forst BAS 405 09 I. (Jokić et al, 2010.; Vukša et al. 2010.).
Figure 1. Damage caused
by rodents Figure 2. Bait boxes Figure 3. Longworth live trap

Combating harmful rodents in forest oak sapling plantations 21
CONCLUSION Rodenticides are not to be applied in moist habitats, i.e. immediately after
rain- or snowfall. Such applications would stimulate bait degradation and deactivation of its active ingredient, and reduce bait attractiveness and palatability. Insufficient efficacy and soil pollution are the consequences of such inadequate application. When weather conditions include precipitation, special encapsulated formulations are recommended, especially paraffin pellets (PEF) or bags. Bait application on bare surface is excluded. Baits need to be laid in commercial plastic boxes because it reduces possible accidental poisoning of humans, as well as domestic and wild animals. It also extends bait persistence, its attractiveness and successfulness in rodent control.
REFERENCES
BASF (2013): Prijava za ispitivanje biološke efikasnosti preparata Ratak Forst BAS 405 09 I
Draganić M., Čović I., Vukša M., Đedović S., Jokić G. (2008): Efikasnost rodenticida na bazi selena i vitamina D3 u suzbijanju glodara u šumskim staništima. Zbornik rezimea IX savetovanja o zaštiti bilja, Zlatibor, 113-114.
Đedović S., Vukša M., Jokić G., Stojnić B. (2012): Morfološke odlike sitnih glodara u hrastovim šumama u zanavljanju. Zbornik rezimea XIV simpozijuma o zaštiti bilja i IX Kongresa o korovima, Zlatibor, 38-39.
Greaves, J.H. (1995): Managing resistance to anticoagulant rodenticides: An appraisal. Pestic. Sci., 43, 72-82.
EPPO (2004): Efficacy evaluation of rodenticides. Field tests against Synanthropic Rodents (Mus musculus, Rattus norvegicus, R. rattus). EPPO Standards PP1 Vol 5 (2nd edition): Efficacy evaluation of plant protection products, Miscellaneous p.36-47 .
EPPO (2004): Efficacy evaluation of rodenticides Field rodents (Microtus, Arvicola), EPPO Standards PP1 Vol 5 (2nd edition): Efficacy evaluation of plant protection products, Miscellaneous p 48-57 .
EPPO 2004b: Phytotoxicity assessment, PP 1/135 (2). In: EPPO Standards - Guidelines for the Efficacy Evaluation of Plant Protection Products, Vol. 1 (General Standards), pp. 32-37.
HSDB Hazardous Substances Data Bank TOXNET Home National Library of Medicine (2013): Difenacoum
Henderson, C. F., Tilton, E. W. (1955): Test with acaricides against Brown mite. J. Jokić G., Vukša P, Vukša M. (2010): Comparative efficacy of conventional and new
rodenticides against Microtus arvalis (Pallas, 1778) in wheat and alfalfa crops. Crop Protection, 29(5), 487-491
Liste aktivnih supstanci, odnosno osnovnih supstanci u Srbiji (2013): Prilog 1, De A1: Lista aktivnih supstanci, odnosno osnovnih supstanci koje su uključene u dodatak 1 Uputstva Saveta br. 91/414/EEC, www.vladars.net/sr-SP-Czrl/VLADA/MINISTARSTVA/ZSZ/PAO/DOCUMENTS/Prilog%201%20i%202%20PRAVILNIKA%20IZR.
Lund, M. (1984): Resistance to the second generation anticoagulant rodenticides. In: Proceedings of Eleventh Vertebrate Pest Conference. Sacramento, California (Ed. by D.O.Clarck), pp. 89-94.
Vukša M., Jokić G., Đedović S., Vukša P., Stojnić B. (2012): The justification for application and development trends of non-conventional rodenticides in protection of alfalfa from rodents. Biotechnology in Animal Husbandry Vol 28, 4, 659-673.
Vukša M., Jokić G, Đedović S., Stojnić B. (2012): Primena rodenticida na bazi bromadiolona i brodifakuma u šumskim sastojinama hrasta u zanavljanju. Zbornik rezimea XIV simpozijuma o zaštiti bilja i IX Kongresa o korovima, Zlatibor, 77-78.


Agriculture & Forestry, Vol. 63 Issue 3: 23-32, 2017, Podgorica 23
DOI: 10.17707/AgricultForest.63.3.03
Abdulvahed KHALEDI DARVISHAN, Morteza BEHZADFAR, Velibor SPALEVIC, Patrick KALONDE, Abdessalam OUALLALI, Sabri el MOUATASSIME1
CALCULATION OF SEDIMENT YIELD IN THE S2-1 WATERSHED OF THE SHIRINDAREH RIVER BASIN, IRAN
SUMMARY
Soil erosion by water as a natural process can occur in all climates and zones and change all landforms. As the measuring of soil erosion is costly and time consuming process, dozens of erosion prediction models have been developed and the aim of the majority of all of them is to predict average rates (often an annual average rate) of soil loss from an area such as a plot, a field or a catchment/watershed under various land management techniques. On the other hand, outflow is the most important element of the hydrological cycle and that is why it is important to determine it as accurately as possible by measuring and predicting. Therefore, the IntErO (Intensity of Erossion and Outflow) model based on the EPM (Erosion Potential Method) method was used for calculation of outflow and sediment yield in the S2-1 watershed of Shirindareh River Basin in the Northeast Iran with the area of 46.77 km2. According to the results, the predicted peak discharge was 101 m3 s-1 for the incidence of 100 years and the specific sediment yield was 267 m3 km-2 year-1. According to the previous studies and topographic characteristics, the river basin watershed belongs to the V category and has very weak erosion. The results of the present study and previous experiences of the other researchers revealed that the IntErO model can be used to estimate soil loss in the other regions similar to Shirindareh River Basin.
Keywords: IntErO, Runoff, Specific sediment yield, Shirindareh Watershed, Soil erosion
INTRODUCTION
Watersheds are in fact often affected by natural disasters, above all floods, overflows, inundations, erosion problems, landslides and pollution (Tazioli et al.
1Abdulvahed Khaledi Darvishan (corresponding author: a. [email protected]), Department of Watershed Management Engineering, Faculty of Natural Resources, Tarbiat Modares University, Noor, IRAN, Morteza Behzadfar, Faculty of Natural Resources, Tarbiat Modares University, Noor, IRAN, Velibor Spalevic Department of Geography, Faculty of Philosophy, University of Montenegro, Niksic, MONTENEGRO, Patrick Kalonde Environmental Science and Management Department, Lilongwe University of Agriculture and Natural Resources, Faculty of Natural Resources, Lilongwe, MALAWI, Abdessalam Ouallali Department of geology, Abdelmalek Essaadi University, Faculty of Science, Tetouan, MOROCCO, Sabri el Mouatassime Faculty of Technical Sciences, University Soltane Moulay Slimane, Béni Mellal, MOROCCO. Presented at the 7th International Symposium of Ecologists (ISEM7), Sutomore, Montenegro. Notes: The authors declare that they have no conflicts of interest. Authorship Form signed online.

Khaledi Darvishan et al. 24
2015). There are several stages/types of water erosion, including splash, sheet, interrill, rill, gully and stream bank erosion (Khaledi Darvishan et al. 2012; Khaledi Darvishan et al. 2014 and 2015, Gholami et al. 2016). Soil erosion and sediment yield studies are therefore of great interest in Asia (especially in arid and semi-arid regions), because of their effects on soil thickness and fertility, plant cover, runoff coefficient and flood risk. The widespread environmental impacts of soil erosion and loss are often not enough faced by the governments (Behzadfar et al. 2014). The problem of soil loss and land degradation, with their huge impact on the environment is a key point for agriculture, ecology, hydrology and hydrogeology studies.
Knowing or estimating the accurate quantity of soil erosion in a watershed is therefore essential and one of the basic steps of all studies to encompass lots of environmental problems and to evaluate the amount of sediment moved, transported and deposited in and out of the basin. On the other hand, direct measurements of erosion in a watershed are possible with multi-years measurement of solid transport in the closing-section (Tazioli, 2009).
The suspended load can be measured through different techniques (Edwards and Glysson 1999; IAEA; 2005), for instance tracing techniques, nuclear probes, optical and acoustic probes, digital imaging analysis and direct sampling (IAEA, 2005).
Sediment load measurements are useful to calibrate soil erosion models (Tazioli et al. 2005; Khaledi Darvishan et al. 2010; Tazioli, 2009; Spalevic, 2011; Sadeghi et al. 2013, 2014). Modelling, in fact, is a good, often necessary and proven tool useful to evaluate the amount of discharge and erosion in a watershed, especially when hydrometric and discharge data are not available (Behzadfar et al. 2014). Mathematical erosion models were therefore developed to predict soil erosion and sediment yield in a sub-catchment area, based on simple mathematical equations such as Universal Soil Loss Equation (USLE), or based on some modified and updated versions (Wischmeier and Smith, 1965, 1978).
Evaluation of the applicability of soil erosion models to a watershed is not easy, as it is difficult to accurately measure soil erosion in the field (Conoscenti et al. 2008, Rawat et al. 2011). In contrast, sediment yield models are easier to apply, because the data for these models can be measured at the watershed outlet (Kinnell and Riss 1998; Erskine et al. 2002; Kinnell, 2010).
Among several models, Erosion Potential Method – EPM, originally developed for Yugoslavia by Gavrilovic (1972), was in recent times repeatedly applied in the watersheds of Apennine and in the Balkan Peninsula (Blinkov and Kostadinov, 2010; Kostadinov et al. 2006, 2014; Lenaerts, 2014; Milevski et al. 2008; Ristic et al. 2012; Sekularac, 2000, 2013; Spalevic et al. 2012a, 2012b, 2013a, 2013b, 2013c, 2013d, 2013e, 2013f, 2013g, 2014a, 2014b, 2014c, 2014d, 2014e, 2014f; Stefanovic, 2004; Tazioli, 2009, Zorn and Komac, 2008), but also in the other regions in the world, for example in arid and semi-arid areas of the south-western USA (Gavrilovic Z., 1988). The method is based on the factors affecting erosion in a catchment; its parameters dependent on the temperature,

Calculation of sediment yield in the S2-1 watershed of the Shirindareh river basin, Iran 25
the mean annual rainfall, the soil use, the geological properties and some other features of the catchment.
The Intensity of Erosion and Outflow - IntErO program package (Spalevic, 2011), developed to predict the intensity of soil erosion and the runoff peak discharge in a watershed, is a computer-graphic method based on the Erosion Potential Method - EPM, which is embedded in its algorithm.
In the present research, the IntErO model was verified and tested in a small sub-catchment of Shirindareh watershed in Iran, which is one of the main tributaries of the River Atrak.
MATERIAL AND METHODS
Study area The present study was conducted in a small sub-catchment of Shirindareh
watershed in north eastern part of Iran, which is mountainous, with the presence of deep incised valleys (in Limestone Mountains) but also hilly. Rivers in this region drain to the Caspian Sea (Behzadfar et al. 2014).
Shirindareh is one of the main tributaries of the river Atrak. Atrak originates from Hezar-Masjed Mountains in the region of Razavi Khorasan and lies between steep slopes and plains till to enter the territory of Turkmenistan on Chaat region and finally drain to Caspian Sea in the Gulf of Hasan Ghuly. Shirindareh river basin area has the important strategic values for North Khorasan province (Behzadfar et al. 2014; Gholami et al. 2016). A rock fill dam has been constructed on the main river of the basin, because of need to supply of drinking water and agriculture. So, the management of upland areas is very important to increase performance of the dam.
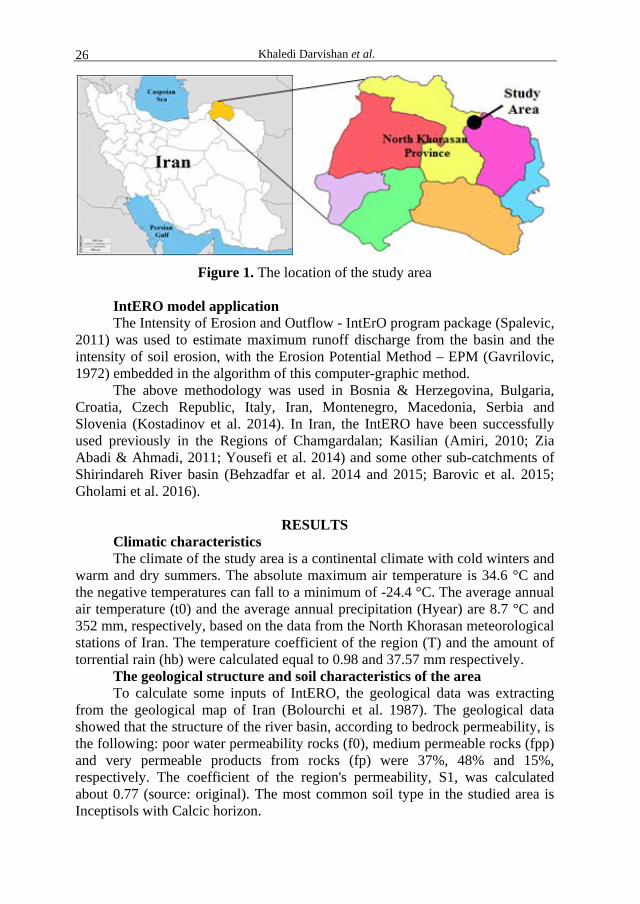
The studied sub-catchment (S2-1) encompasses an area of 46.77 km2 and is categorized in the group of the small watersheds of the natural entity of the Shirindareh river basin (Figure 1).
The average slope gradient in the river basin, Isr, is calculated on 28.46%, indicating that in the river basin prevail steep slopes. The average river basin altitude (Hsr), the average elevation difference of the river basin (D), the natural length of the main watercourse (Lv) and the shortest distance between the fountainhead and the mouth (Lm) are 1912.59 m, 441.59 m, 12.87 km, 10.59 km, respectively which were calculated by the IntErO program package (source: original).
Fieldwork & laboratory analysis During the field work, using a morphometric methods, various data on
intensity and forms of soil erosion, land use, and the measures taken to reduce or mitigate erosion were recorded. Different forms including the shape of the slope, the depth of the erosion base and the density of erosion rills were determined.
Pedological survey was based on the research of the National Geological Survey Organization (NGS) led by Bolourchi et al. (1987), who analyzed the physical and chemical properties of all geological formations of North Khorasan province, including those in the study area of the Shirindareh Basin and all it’s sub-catchments.
Khaledi Darvishan et al. 26
Figure 1. The location of the study area
IntERO model application The Intensity of Erosion and Outflow - IntErO program package (Spalevic,
2011) was used to estimate maximum runoff discharge from the basin and the intensity of soil erosion, with the Erosion Potential Method – EPM (Gavrilovic, 1972) embedded in the algorithm of this computer-graphic method.
The above methodology was used in Bosnia & Herzegovina, Bulgaria, Croatia, Czech Republic, Italy, Iran, Montenegro, Macedonia, Serbia and Slovenia (Kostadinov et al. 2014). In Iran, the IntERO have been successfully used previously in the Regions of Chamgardalan; Kasilian (Amiri, 2010; Zia Abadi & Ahmadi, 2011; Yousefi et al. 2014) and some other sub-catchments of Shirindareh River basin (Behzadfar et al. 2014 and 2015; Barovic et al. 2015; Gholami et al. 2016).
RESULTS
Climatic characteristics The climate of the study area is a continental climate with cold winters and
warm and dry summers. The absolute maximum air temperature is 34.6 °C and the negative temperatures can fall to a minimum of -24.4 °C. The average annual air temperature (t0) and the average annual precipitation (Hyear) are 8.7 °C and 352 mm, respectively, based on the data from the North Khorasan meteorological stations of Iran. The temperature coefficient of the region (T) and the amount of torrential rain (hb) were calculated equal to 0.98 and 37.57 mm respectively.
The geological structure and soil characteristics of the area To calculate some inputs of IntERO, the geological data was extracting
from the geological map of Iran (Bolourchi et al. 1987). The geological data showed that the structure of the river basin, according to bedrock permeability, is the following: poor water permeability rocks (f0), medium permeable rocks (fpp) and very permeable products from rocks (fp) were 37%, 48% and 15%, respectively. The coefficient of the region's permeability, S1, was calculated about 0.77 (source: original). The most common soil type in the studied area is Inceptisols with Calcic horizon.

Calculation of sediment yield in the S2-1 watershed of the Shirindareh river basin, Iran 27
Vegetation and land use The studied area is located in Middle-East of the Kope-Dagh geographical
region. According to the analysis, the main portion of the river basin is totally under mountain pastures (55.78%). The coefficient of the river basin planning, (Xa) and the coefficient of the vegetation cover (S2) were calculated about 0.64 and 0.77, respectively. Part of the detailed report for the S2-1 watershed is shown in Table 1
Table 1. Part of the IntErO report (inputs and outputs) for the S2-1 watershed INPUTS
River basin area F 46.77 km² The length of the watershed O 36.33 km Natural length of the main watercourse Lv 12.87 km The shortest distance between the fountainhead and mouth Lm 10.59 km The total length of the main watercourse with tributaries of I and II class ΣL 71.79 km
River basin length measured by a series of parallel lines Lb 12.18 km The area of the bigger river basin part Fv 31.84 km² The area of the smaller river basin part Fm 14.94 km² Altitude of the first contour line h0 1500 m The lowest river basin elevation Hmin 1471 m The highest river basin elevation Hmax 2514 m A part of the river basin consisted of a very permeable products from rocks fp 0.15 A part of the river basin area consisted of medium permeable rocks fpp 0.48 A part of the river basin consisted of poor water permeability rocks fo 0.37 A part of the river basin under the forests fs 0.30 A part of the river basin under grass, meadows, pastures and orchards ft 0.56 A part of the river basin under plough-land and without vegetation fg 0.14 The volume of the torrent rain hb 37.57 mm Average annual air temperature t0 8.70 °C Average annual precipitation Hyr 352 mm Types of soil products and related types Y 1.10 River basin planning, coefficient of the river basin planning Xa 0.64 Numeral equivalents of visible and clearly exposed erosion process φ 0.57
OUTPUTS Coefficient of the river basin form A 0.55 Coefficient of the watershed development m 0.56 Average river basin width B 3.84 km (A)symmetry of the river basin a 0.72 Density of the river network of the basin G 1.53 Coefficient of the river basin tortuousness K 1.22 Average river basin altitude Hsr 1912.59 m Average elevation difference of the river basin D 441.59 m
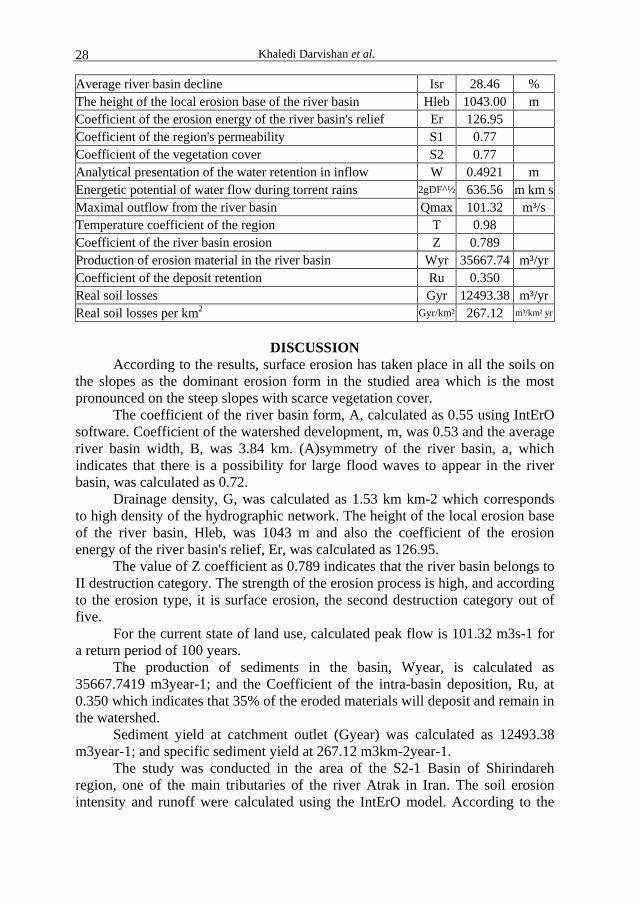
Khaledi Darvishan et al. 28
Average river basin decline Isr 28.46 % The height of the local erosion base of the river basin Hleb 1043.00 m Coefficient of the erosion energy of the river basin's relief Er 126.95 Coefficient of the region's permeability S1 0.77 Coefficient of the vegetation cover S2 0.77 Analytical presentation of the water retention in inflow W 0.4921 m Energetic potential of water flow during torrent rains 2gDF^½ 636.56 m km s Maximal outflow from the river basin Qmax 101.32 m³/s Temperature coefficient of the region T 0.98 Coefficient of the river basin erosion Z 0.789 Production of erosion material in the river basin Wyr 35667.74 m³/yr Coefficient of the deposit retention Ru 0.350 Real soil losses Gyr 12493.38 m³/yr Real soil losses per km2 Gyr/km² 267.12 m³/km² yr
DISCUSSION
According to the results, surface erosion has taken place in all the soils on the slopes as the dominant erosion form in the studied area which is the most pronounced on the steep slopes with scarce vegetation cover.
The coefficient of the river basin form, A, calculated as 0.55 using IntErO software. Coefficient of the watershed development, m, was 0.53 and the average river basin width, B, was 3.84 km. (A)symmetry of the river basin, a, which indicates that there is a possibility for large flood waves to appear in the river basin, was calculated as 0.72.
Drainage density, G, was calculated as 1.53 km km-2 which corresponds to high density of the hydrographic network. The height of the local erosion base of the river basin, Hleb, was 1043 m and also the coefficient of the erosion energy of the river basin's relief, Er, was calculated as 126.95.
The value of Z coefficient as 0.789 indicates that the river basin belongs to II destruction category. The strength of the erosion process is high, and according to the erosion type, it is surface erosion, the second destruction category out of five.
For the current state of land use, calculated peak flow is 101.32 m3s-1 for a return period of 100 years.
The production of sediments in the basin, Wyear, is calculated as 35667.7419 m3year-1; and the Coefficient of the intra-basin deposition, Ru, at 0.350 which indicates that 35% of the eroded materials will deposit and remain in the watershed.
Sediment yield at catchment outlet (Gyear) was calculated as 12493.38 m3year-1; and specific sediment yield at 267.12 m3km-2year-1.
The study was conducted in the area of the S2-1 Basin of Shirindareh region, one of the main tributaries of the river Atrak in Iran. The soil erosion intensity and runoff were calculated using the IntErO model. According to the

Calculation of sediment yield in the S2-1 watershed of the Shirindareh river basin, Iran 29
findings, it can be concluded that there is a possibility for large flood waves to appear in the studied S2-1 river basin.
Calculated peak flow is 101.32 m3s-1 for a return period of 100 years. The value of Z coefficient of 0.789 indicates that the river basin belongs to the second destruction category out of five. The calculated net soil loss from the river basin was 12493 m3 per year, specific 267 m3km-2 per year. The strength of the erosion process is strong, and according to the erosion type, it is surface erosion.
CONCLUSION
This study further confirmed the findings of Amiri (2010), Zia Abadi & Ahmadi, (2011), Yousefi et al. (2014), Behzadfar et al. (2014 and 2015) as well as Gholami et al. (2016) in successful implementation of the Erosion Potential Method – EPM and/or IntERO model in Iran, what leads to the conclusion that the IntErO model may be a useful tool for researchers in calculation of runoff and sediment yield at the level of the river basins draining to the Caspian Sea.
ACKNOWLEDGEMENTS Field work was carried out in 2014 and 2015, funded by the Natural
Resources and Watershed Management Office, North Khorasan province of Iran. Authors would like to thank all the experts contributed in filed works.
REFERENCES
Amiri, F. (2010) Estimate of Erosion and Sedimentation in Semi-arid Basin using Empirical Models of Erosion Potential within a Geographic Information System. Air, Soil and Water Research, 3, 37-44.
Barovic, G. Leandro Naves Silva, M. Veloso Gomes Batista, P. Vujacic, D. Soares Souza, W. Cesar Avanzi, J. Behzadfar M. & Spalevic, V. (2015) Estimation of sediment yield using the IntErO model in the S1-5 Watershed of the Shirindareh River Basin, Iran. Agriculture and Forestry, 61(3), 233-243.
Behzadfar, M. Tazioli, A. Vukelic-Shutoska, M. Simunic, I. & Spalevic, V. (2014) Calculation of sediment yield in the S1-1 Watershed, Shirindareh Watershed, Iran. Agriculture and Forestry, 60(4), 207-216.
Behzadfar, M. Curovic, M. Simunic, I. Tanaskovik, V. & Spalevic, V. (2015) Calculation of soil erosion intensity in the S5-2 Watershed of the Shirindareh River Basin, Iran. International Conference on Soil, Tirana, Albania; 4-7 May 2015.
Blinkov, I. & Kostadinov, S. (2010) Applicability of various erosion risk assessment methods for engineering purposes, BALWOIS 2010 Conference - Ohrid, Republic of Macedonia. 25-29 May 2010.
Bolourchi, M. Mehr Parto, M. & Afsharharb, A. (1987) Geological quadrangle map of Iran no. J5 (Bojnurd sheet), scale 1:250,000, Geological Survey of Iran.
Conoscenti, C. Di Maggio, C. & Rotigliano, E. (2008) Soil erosion susceptibility assessment and validation using a geostatistical multivariate approach: a test in Southern Sicily. Natural Hazards, 46(3), 287-305.
Edwards TK. & Glysson GD. (1999) Field methods for measurement of fluvial sediment. In: Techniques of water-resources investigation of the U.S. Geological Survey, Chap. 2, pp. 89.

Khaledi Darvishan et al. 30
Erskine, W.D. Mahmoudzadeh, A. & Myers, C. (2002) Land use effects on sediment yields and soil loss rates in small basins of Triassic Sandstone near Sydney, NSW, Australia. Catena, 49, 271-287.
Gavrilovic, S. (1972) Inzenjering o bujicnim tokovima i eroziji. Izgradnja. Beograd. Gavrilović, Z. (1988) The use of empirical method (erosion potential method) for
calculating sediment production and transportation in unstudied or torrential streams. In: White, W. R. (ed.), International Conference on River Regime; 411–422. Chichester.
Gholami, L. Batista, P.V.G. Behzadfar, A. Khaledi Darvishan, A. & Behzadfar, M. (2016) Application of Intero Model for Soil Loss Estimation Case Study: S7-1 Watershed of Shirindareh River Basin, Iran. Agrosym 2016, 2169-2177.
International Atomic Energy Agency (IAEA), (2005) Fluvial sediment transport: Analytical techniques for measuring sediment load. IAEA-TECDOC-1461. ISBN 92–0–107605–3.
Khaledi Darvishan, A. Banasik K. Sadeghi S.H.R. Gholami, L. & Hejduk L. (2015) Effects of rain intensity and initial soil moisture on hydrological responsesin laboratory conditions. International Agrophisics, 29, 165-173.
Khaledi Darvishan, A. Sadeghi S.H.R. & Gholami, L. (2010) Efficacy of Time-Area Method in Simulating Temporal Variation of Sediment Yield in Chehelgazi Watershed, Iran. Annals of Warsaw University of Life Sciences, 42(1), 51-60.
Khaledi Darvishan, A. Sadeghi, S.H.R. Homaee, M. & Arabkhedri, M. (2012) Potential Use of Synthetic Color-Contrast Aggregates and a Digital Image Processing Technique in Soil Splash Measurements, IAHS Publication, No. 356, 364-368.
Khaledi Darvishan, A. Sadeghi, S.H.R. Homaee, M. & Arabkhedri, M. (2014) Measuring Sheet Erosion using Synthetic Color-Contrast Aggregates. Hydrological Processes, 28(15), 4463-4471.
Kinnell, P.I.A. & Riss, L.M. (1998) USLE-M: empirical modeling rainfall erosion through runoff and sediment concentration. Soil Science Society of America Journal, 62, 1662-1672.
Kinnell, P.I.A. (2010) Event soil loss, runoff and the Universal Soil Loss Equation family of models: a review. Journal of Hydrology, 385, 384–397.
Kostadinov, S. Zlatic, M. Dragicevic, S. Novkovic, I. Kosanin, O. Borisavljevic, A. Lakicevic, M. & Mladjan, D. (2014) Anthropogenic influence on erosion intensity changes in the Rasina river watershed - Central Serbia. Fresenius Environmental Bulletin, 23(1a), 254-263
Kostadinov, S. Zlatic, M. Dragovic, N. & Gavrilovic, Z. (2006) Soil Erosion in Serbia and Montenegro. In Boardman, J., Poesen, J. (eds), Soil Erosion in Europe. John Wiley & Sons, Ltd, London, pp. 271-277.
Lenaerts, T. (2014) Geomorphological mapping of Montenegro: Landform genesis and present processes. Master thesis, University of Gent, Faculty of Geography, 128 pp.
Milevski, I. Blinkov, I. & Trendafilov, A. (2008) Soil erosion processes and modeling in the upper Bregalnica catchment. XXIVth Conference of the Danubian Countries. On the hydrological forecasting and hydrological bases of water management, 2-4 June 2008, Bled, Slovenia. 190 pp.
Rawat, P.K. Tiwari, P.C. Pant, C.C. Sharama, A.K. & Pant, P.D. (2011) Modelling of stream run-off and sediment output for erosion hazard assessment in Lesser Himalaya: need for sustainable land use plan using remote sensing and GIS: a case study. Natural Hazards, 59, 1277-1297.

Calculation of sediment yield in the S2-1 watershed of the Shirindareh river basin, Iran 31
Ristic, R. Kostadinov, S. Abolmasov, B. Dragicevic, S. Trivan, G. Radic, B. Trifunovic, M., & Radosavljevic, Z. (2012) Torrential floods and town and country planning in Serbia. Natural Hazards and Earth System Sciences, 12, 23-35.
Sadeghi, S.H.R. Gholami, L. & Khaledi Darvishan, A. (2013) Suitability of MUSLT for Storm Sediment Yield Prediction in Chehelgazi Watershed, Iran. Hydrological Sciences Journal, 58(4), 892-897.
Sadeghi, S.H.R. Gholami, L. Khaledi Darvishan, A. & Saeidi, P. (2014) A Review of the Application of the MUSLE Model World-Wide. Hydrological Sciences Journal, 59(1-2), 365-375.
Sekularac G. (2000) Odnos intenziteta erozije i stepena erodiranosti zemljišta sliva reke Kamenice. Doktorska disertacija. Agronomski fakultet, Čačak, Srbija.
Sekularac, G. Jelic, M. Kulina, M. Jakisic, T. & Jugovic, M. (2013) Soil erosion of the Cuverak River Basin (West Serbia). IV International Symposium, Agrosym 2013, 807-810.
Spalevic, V. (2011) Impact of land use on runoff and soil erosion in Polimlje. Doctoral thesis, Faculty of Agriculture of the University of Belgrade, Serbia, 260 pp.
Spalevic, V. Curovic, M. Andjelkovic, A. Djekovic, V. & Ilci, S. (2014a) Calculation of soil erosion intensity in the Nedakusi Watershed of the Polimlje Region, Montenegro. International Scientific conference: Challenges in modern agricultural production, December 11, 2014, Skopje, Macedonia.
Spalevic, V. Čurović, M. Borota, D. & Fuštić, B. (2012a) Soil erosion in the river basin Zeljeznica, area of Bar, Montenegro. Agriculture and Forestry, 54(1-4), 5-24.
Spalevic, V. Curovic, M. Simunic, I. Behzadfar, M. & Tanaskovic, V. (2014b) Land degradation, land use and soil erosion: the case of Montenegro. CIHEAM, The Watch Letter: Land Issues in the Mediterranean Countries, 28(1), 58-62.
Spalevic, V. Curovic, M. Tanaskovik, V. Oljaca, M. & Djurovic, N. (2013a) The impact of land use on soil erosion and run-off in the Krivaja river basin in Montenegro. The First International Symposium on Agricultural Engineering, 4th - 6th October 2013, Belgrade–Zemun, Serbia, VI, 1-14.
Spalevic, V. Curovic, M. Tanaskovik, V. Pivic, R. & Djurovic, N. (2013b) Estimation of soil erosion intensity and runoff in the river basin of Bijeli Potok, Northeast of Montenegro. In proceeding of the 1st International Congress on Soil Science, XIII Congress of Serbian Soil Science Society “SOIL – WATER – PLANT”, October, 2013. Belgrade, Serbia.
Spalevic, V. Curovic, M. Uzen, N. Simunic, I. & Vukelic-Shutoska, M. (2013c) Calculation of soil erosion intensity and runoff in the river basin of Ljesnica, Northeast of Montenegro. In proceeding of the 24th International Scientific-Expert Conference on Agriculture and Food Industry, Sarajevo, Bosnia and Herzegovina.
Spalevic, V. Djurovic, N. Mijovic, S. Vukelic-Sutoska, M. & Curovic, M. (2013d). Soil Erosion Intensity and Runoff on the Djuricka River Basin (North of Montenegro). Malaysian Journal of Soil Science, 17, 49-68.
Spalevic, V. Grbovic, K. Gligorevic, K. Curovic, M. & Billi, P. (2013e) Calculation of runoff and soil erosion on the Tifran watershed, Polimlje, North-East of Montenegro. Agriculture and Forestry, 59(4), 5-17.
Spalevic, V. Hübl, J. Hasenauer, H. & Curovic, M. (2014c) Calculation of soil erosion intensity in the Bosnjak Watershed, Polimlje River Basin, Montenegro. The 5th International Symposium “Agrosym 2014”, Jahorina, 23-26 October 2014, Bosnia and Herzegovina, 730-738.
Spalevic, V. Nyssen, J. Curovic, M. Lenaerts, T. Kerckhof, A. Annys, K. Van Den Branden, J. & Frankl, A. (2013f) Тhe impact of land use on soil erosion in the
Khaledi Darvishan et al. 32
river basin Boljanska Rijeka in Мontenegro. In proceeding of the 4th International Symposium, Agrosym 2013, 54-63.
Spalevic, V. Mahoney, W. Djurovic, N. Üzen, N. & Curovic, M. (2012b). Calculation of soil erosion intensity and maximum outflow from the Rovacki river basin, Montenegro. Agriculture and Forestry, 58(3), 7-21
Spalevic, V. Radanovic, D. Behzadfar, M. Djekovic, V. Andjelkovic, A. & Milosevic, N. (2014d) Calculation of the sediment yield of the Trebacka Rijeka, Polimlje, Montenegro. Agriculture and Forestry, 60(1), 259-272.
Spalevic, V. Railic, B. Djekovic, V. Andjelkovic, A. & Curovic, M. (2014e) Calculation of the Soil Erosion Intensity and Runoff of the Lapnjak watershed, Polimlje, Montenegro. Agriculture and Forestry, 60(2), 261-271.
Spalevic, V. Simunic, I. Vukelic-Sutoska, M. Uzen, N. & Curovic, M. (2013g) Prediction of the soil erosion intensity from the river basin Navotinski, Polimlje (Northeast Montenegro). Agriculture and Forestry, 59(2), 9-20.
Spalevic, V. Tazioli, A. Djekovic, V. Andjelkovic, A. & Djurovic, N. (2014f) Assessment of soil erosion in the Lipnica Watershed, Polimlje, Montenegro. The 5th International Symposium, Agrosym 2014, 723-729.
Stefanovic, M. Gavrilovic, Z. & Milojevic, M. (2004) Erosion Potential method and erosion risk zoning in mountainous regions. In Internatioales Symposion Iterprevent-RIVA\TRIENT.
Tazioli, A. (2009) Evaluation of erosion in equipped basins: preliminary results of a comparison between the Gavrilovic model and direct measurements of sediment transport. Environmental Geology, 56(5), 825-831.
Tazioli A. Mattioli A. Nanni T. & Vivalda P.M. (2015) Natural hazard analysis in the Aspio equipped basin. Engineering geology for Society and Territory, 3, 431-435.
Wischmeier, W.H. & Smith, D.D. (1965) Predicting rainfall-erosion losses from cropland east of the Rocky Mountains. Agricultural Handbook No. 282, US Department of Agriculture, Washington, DC.
Wischmeier, W.H. & Smith, D.D. (1978) Predicting rainfall erosion losses. Agriculture Handbook, n. 537. Agriculture Research Service, US Department of Agriculture, Washington, DC.
Yousefi, S. Kivarz, N. Ramezani, B. Rasoolzadeh, N. Naderi, N. & Mirzaee, S. (2014) An Estimation of Sediment by Using Erosion Potential Method and Geographic Information Systems in Chamgardalan Watershed: A Case Study of Ilam Province, Iran. Geodynamics Research International Bulletin, 2(2): XXXIV to XLI.
Zia Abadi, L. & Ahmadi, H. (2011) Comparison of EPM and geomorphology methods for erosion and sediment yield assessment in Kasilian Watershed, Mazandaran Province, Iran. Desert, 16, 103-109.
Zorn, M. & Komac, B. (2008) Response of soil erosion to land use change with particular reference to the last 200 years (Julian Alps, Western Slovenia). XXIVth Conference of the Danubian Countries. Hydrological forecasting & hydrological bases of water management, June 2008, Bled, Slovenia. 205 pp.

Agriculture & Forestry, Vol. 63 Issue 3: 33-37, 2017, Podgorica 33
DOI: 10.17707/AgricultForest.63.3.04
Seyed Hamid Reza SADEGHI1
SOIL EROSION IN IRAN: STATE OF THE ART, TENDENCY AND SOLUTIONS
SUMMARY
Soil erosion mirrors the complex interactions among living and non-living elements in a watershed system. Any type of imbalance in watershed components leads to unexpected and unwished outcomes causing loss of infrastructures and investments. Different figures from 0.8 to even 7 billion tones have been given on soil erosion rate in Iran, progressively increased during last decades. Untimely erosive rain, high potential sensitivity of resources, improper infrastructures development, land use changes, and unlawful/over exploitation of resources are the main reasons behind ever-increasing soil erosion. However, many attempts made by authorized organizations and agencies could simply brake down the high rate of the erosion. In the present article, it was aimed to report some managerial approaches for minimizing the soil erosion-related problems towards developing integrated watershed management approach in Iran.
Keywords: CoManagement Practice, Ecosystem Services, Land Use Planning, Sediment Yield
INTRODUCTION
Soil erosion is a very complicated process mirrors the resultant of complicated interactions among many existing factors in a watershed system. Elucidating soil erosion phenomenon and magnitude can therefore represents balance level in the watershed systems and provides a useful index of land degradation, soil erosion severity and trends. Accurate estimates of sediment yield and its temporal variation are needed for various purposes, including the design of impoundments and erosion control structures, river morphological computations, and evaluation studies of the effects of various land use management practices (Kothyari et al., 1997; Lana-Renault et al., 2007; Emadodin et al., 2012; Eskandarie, 2012; Zakerinejad and Maerker, 2015).
There are many controlling factors on the severity and extension the soil erosion many of which either originates or accelerates by the human (Hudson and Alcantara-Ayala, 2006; Sadeghi et al., 2008; Sadeghi, 2009; Emadodin et al., 2012). In the present paper, an attempt is firstly made to minutely picture and elaborate the existing problems in the country. Some scientific reports on drastic
1Sadeghi Sayed Hamid Reza (corresponding author: [email protected]), Department of Watershed Management Engineering, Faculty of Natural Resources, Tarbiat Modares University, Noor 4641776489, Mazandaran, President of the Watershed Management Society of Iran, IRAN. Presented at the 7th International Symposium of Ecologists (ISEM7), Sutomore, Montenegro. Notes: The authors declare that they have no conflicts of interest. Authorship Form signed online.

Seyed Hamid Reza Sadeghi 34
changes in sediment fluxes due to natural and human induced factors will also be presented. The appropriate solutions will also be presented to combat or minimize the problems towards developing effective sediment management strategies.
RESULTS AND DISCUSSION
Soil Erosion in Iran Collecting an appropriate data set on soil erosion is essential to draw the
sustainable managerial strategies for a watershed management, since soil erosion stands at the top priority (Singh, 2003; Ghazanfari et al. 2003; Emadodin et al., 2012; Eskandarie, 2012; Sadeghi and Cerda, 2015; Zakerinejad and Maerker, 2015) among different types of land degradation. It is used for the integrated watershed management which aims at coordinating various sectors in the national level in order to protect the safety of the people and arriving at economically productive, socially equitable, and environmentally sustainable watershed needs.
Iran, with an area of ca 1800000 km2, encounters soil erosion problems. Some 100 Mha of Iranian territory are exposed to erosion or other types of chemical and physical degradation (Kheyrodin, 2016). Water erosion is one of the most important types of land degradation in most parts of Iran destroying fertile soils and agricultural land. Nearly 35 Mha of the Iran is influenced by different types of water erosion (Zakerinejad and Maerker, 2015). Since 1960's serious soil erosion problem was initially considered by watershed managers and experts. Since then many attempts were made to picture a proper view of soil erosion in the country led to many progressing figures and mainly horribly unreliable from 0.8 to even 8 billion tons per annum i.e., some inundation rates of 7 to 70 t.ha-1.Y-1. On average, soil erosion in Iran is three times more than other Asian countries and 20 times over the global average, and it is one of the highest in the world. (www.tehrantimes.com/news; www.financialtribune.com/articles/environment).
According to official statistics of Ministry of Energy of Iran (www.daminfo.wrm.ir/tabularview-fa.html), there are 281 functioning dams in Iran, though some 700 other small and large dams are also under construction or study. As per bathymetric surveys of 27 large dams with watershed area of some 27 Mha and total volume of 24.2 bm3, almost 132.7 Mm3 (~ 172.5 Mt) sediment enters the dams reservoirs annually. It verifies a denudation rate of 6.28 t ha-1y-1 and annual volume reduction of 0.54 %. These figures clearly represent very severe soil erosion rates in Iran. It not only has been causing rapid reduction of reservoirs life time but also causes some 400 Mm3 sedimentation in downstreams with an important loss of irrigation lands and power generation capacity (Sharifi and Ghafouri, 2007).
Soil erosion in Iran is so high that it is costing the country USD 56 to 112 billion every year depending on different rates of soil erosion (www.tehrantimes.com/news). So that it costs more than oil revenue in Iran (www.financialtribune.com/articles/environment).
Soil erosion in Iran: State of the art, tendency and solutions 35
Controlling Factors There are many affecting factors controlling the severity and extension of
soil erosion in Iran. Iran, as one of the progressing countries, currently faces many soil erosion issues. Iran natural environment is under increasing strain due to the combined effects of over-exploitation by communities and industry and changes in climate patterns (MENARID, 2017). High potential sensitivity of resources, improper and unnecessary infrastructures development, land use changes and unlawful exploitation of resources all are supposed as main reasons behind soil erosion in Iran (Sadeghi, 2009). However, inattention to soil value, limited numbers of hydrometry stations, short term data collection period, unreliable and opponent data and information, misunderstanding of the sediment yield processes and people's and experts' apathies mask the severity and intensity of the problem. As it is seen most of the affecting factors are similar to those oft-reported throughout the globe instead some of them may be very specific. Nowadays, increase in watershed sediment yields resulting from human activities is a major concern in Iran like many other progressing countries (Sadeghi et al., 2008; Sadeghi and Saeidi, 2009; Sadeghi et al., 2009; UNESCO, 2009; Emadodin et al., 2012; Eskandarie, 2012; Sadeghi and Cerda, 2015; Zakerinejad and Maerker, 2015). In the following some important affecting factors on soil erosion in Iran have been listed.
•Very diversified natural conditions •High potential sensitivity of resources •Improper and unsuitable developmental activities •Land use changes and unlawful exploitation of resources •Not existing proper marketing of soil and ecosystem services •Technical factors Mitigating Soil Erosion Despite many serious issues related soil erosion in Iran, still no practical,
comprehensive country-wide strategy has been tried to manage soil erosion. Though many watershed management activities have been sparsely implemented throughout the country whose effectiveness have not been accurately and scientifically assessed yet. However, the following approaches can be suggested to control soil erosion in Iran (Sadeghi et al., 2008; Sadeghi and Saeidi, 2009; Sadeghi et al., 2009; UNESCO, 2009; Emadodin et al., 2012; Eskandarie, 2012; Sadeghi and Cerda, 2015; Zakerinejad and Maerker, 2015).
Proper understanding and conceptualizing the system leading to adaptive management
Limiting unnecessary infrastructures development and off-region activities Controlling land use changes and stopping illogical exploitation of
resources Monitoring hydrological behavior of watersheds Designating specific soil erosion measures for different agroecologic
regions

Seyed Hamid Reza Sadeghi 36
CONCLUSION An attempt was made to picture soil erosion rates in Iran. Accordingly,
affecting factors and related solutions were also concluded. The progressing inundations rates of soil erosion and hardening the related issues were also proved in Iran. A national level strategy and comanagement approaches with intimate belief of decision makers, experts and managers for drawing appropriate plans are essentially needed to control soil erosion related issues in Iran.
REFERENCES
Emadodin, I., Narita, D. & Bork, H.R. (2012) Soil Degradation and Agricultural Sustainability: An Overview from Iran. Environ. Dev. Sustain. Doi: 10.1007/s10668-012-9351-y.
Eskandarie, B. (2012) Country Report on History and Status of Soil Survey in Iran. In: GSP regional workshop, Jordan, Amman 1-5 April 2012, 25p.
Ghazanfari, H., Namiranian, M., Sobhani, H. & Mohadjeri, R. (2003) Traditional forest management and its application to encourage public participation for sustainable management of forest resources in northern Zagros (Kurdistan-Iran), In: Abstract Proceedings of The international IUFRO Workshop: The Forest Science/Policy Interface in Europe, Africa and the Middle East, June 23–27, 2003, Copenhagen, Denmark, www.flec.kvl.dk/scipol/Abstracts.pdf
Hudson P.F. & Alcantara-Ayala, I. (2006) Ancient and modern perspectives on land degradation, Catena, 65, 102-106.
Kheyrodin, H. (2016). Modeling Soil Erosion in Iran. Innovat Intl. J. Med. Pharmac. Sci., 1(1): 1-12.
Kothyari, U.C., Tiwari, A.K. & Singh, R. (1997) Estimation of temporal variation of sediment yield from small catchments through the kinematic method, J. Hydrol., 203, 39-57.
Lana-Renault, N., Regüés, D., Martí-Bono, C., Beguería, S., Latron, J., Nadal, E., Serrano, P. & García-Ruiz, J.M. (2007) Temporal variability in the relationships between precipitation, discharge and suspended sediment concentration in a small Mediterranean mountain catchment, Nordic Hydrol., 38 (2), 139-150.
MENARID (2017) Reducing Ecosystem Degradation in Iran. 2p. Sadeghi, S.H.R. (2009). An overview on sediment problems and management in
Iran. Sediment Problems and Sediment Management in Asian River Basins, In: Proceedings of the ICCE Workshop, Hyderabad, India, Sep. 2009. IAHS Publ. 349, 2011:14-20.
Sadeghi, S.H.R. & Cerda, A. (2015). Soil erosion in Iran: Issues and solutions. Geoph. Res. Abs., Vol. 17, EGU2015-15840-1, 2p.
Sadeghi, S.H.R., Mizuyama, T., Miyata, S., Gomi, T., Kosugi, K., Fukushima, T., Mizugaki, S. & Onda, Y. (2008) Determinant factors of sediment graphs and rating loops in a reforested watershed, J. Hydrol., 356, 271-282.
Sadeghi, S.H.R. & Saeidi, P. (2009) Accuracy of decentation technique for estimation of different suspended sediment concentrations, In: Abstracts Proceedings of International Conference on Land Conservation-

Soil erosion in Iran: State of the art, tendency and solutions 37
LANDCON0905, Serbia, Tara Mountain Park, May 26 to 30, 2009: 118 (Full paper published in CD, 4p).
Sadeghi, S.H.R., Saeidi, P., Noor, H. & Raeisi, M.B. (2009) Understanding sediment yield processes in a Hyrcanian Forest Watershed, In: Abstracts Proceedings of International Conference on Land Conservation-LANDCON0905, Serbia, Tara Mountain Park, May 26 to 30, 2009: 119.
Sharifi I, F. & Ghafouri, M. (2007) Assessment of causes and effects of disastrous erosion and sediment flows and mitigation measures in Caspian Sea Watersheds-Iran, In: Proceedings of Expert Meeting on Erosion and Sedimentation in Arid and Semi-Arid Regions, Chaloos, Iran, April 15-19, 2007:1-17.
Singh, R.V. (2003) Watershed Planning and Management, Yash Publishing House, India, 625p.
UNESCO (2009) Integrated Water Resources Management Guidelines at River Basin Level, Part 1, 24p.
Zakerinejad, R. & Maerker, M. (2015) An Integrated Assessment of Soil Erosion Dynamics with Special Emphasis on Gully Erosion in the Mazayjan Basin, Southwestern Iran. Nat. Hazards 79:S25–S50.
www.daminfo.wrm.ir/tabularview-fa.html www.financialtribune.com/articles/environment/33787 www.tehrantimes.com/news

Agriculture & Forestry, Vol. 63 Issue 3: 39-46, 2017, Podgorica 39
DOI: 10.17707/AgricultForest.63.3.05 Șerban CHIVULESCU, Ionuț SCHITEANU 1
ESTIMATION OF CARBON STOCK IN SOUTH OF WESTERN CARPATHIANS FROM MOLDOVA NOUA FOREST DISTRICT
USING G.I.S. DATA FROM MANAGEMENTS PLANS
SUMMARY Analysis of above-ground biomass and carbon stock was performed in
South-West of Western Carpathians. Data from two management plans of Moldova Noua Forest District (10 years between) were used. Total above-ground biomass and carbon stock was calculated using allometric equations. Forests from Moldova Noua Forest District stored 1.814.297 tonnes of biomass in 2006 and in 2016 stored 1.706.545 tonnes of biomass. Also, total equivalent of CO2 decreased from 852.720 tonnes in 2006 to 802.076 tonnes in 2016. The theoretical functions Gamma 3P, Lognormal 3P and Weibull 3P have not been suitable to describe the experimental distribution of carbon stock. A GIS based method was used to assess the geographic distribution of quantity of carbon stock and was established the evolution of carbon stock between 2006 and 2016. The results are promising and were obtained with a minimum effort, encouraging further research.
Keywords: Carbon stock, allometric equation, above-ground biomass, South-West of Western Carpathians, Management plans.
INTRODUCTION
Lately, concerns about carbon stored by forest vegetation have intensified since it has an important role in producing climatic changes (Tolunay, 2009).
The negative impact of climatic changes has also been identified in Romania (Pienaru et al, 2009, Ciuvăț et al, 2013). Romania has a commitment to report CO2 emissions to the UNFCCC and to the European Union, and this can be done through forest inventories, yield tables and allometric equations. Allometric equations are recognized as the best method to estimate the amount of atmospheric CO2 stored by forest vegetation (Ciuvăț, 2013).
The purpose of this analysis is to assess the impact of the forest vegetation in the study area on CO2 emissions. The research objective is to determine the CO2 stock stored by forest vegetation using expeditious methods with a minimum cost.
1Șerban Chivulescu (corresponding author: [email protected]), Ionuț Schiteanu, National Institute for Research and Development in Forestry “Marin Drăcea” Bucharest, ROMANIA. Notes: The authors declare that they have no conflicts of interest. Authorship Form signed online.
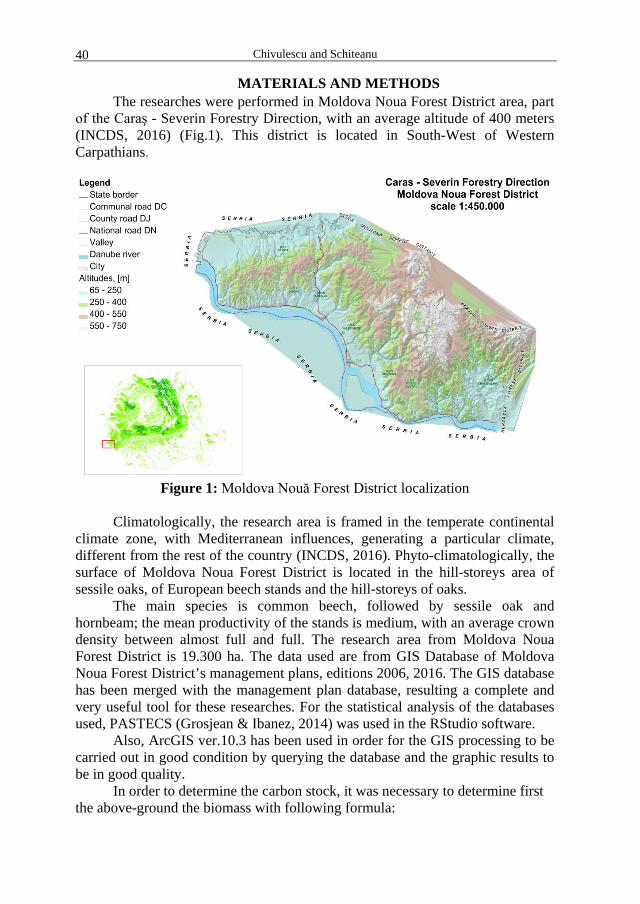
Chivulescu and Schiteanu 40
MATERIALS AND METHODS The researches were performed in Moldova Noua Forest District area, part
of the Caraş - Severin Forestry Direction, with an average altitude of 400 meters (INCDS, 2016) (Fig.1). This district is located in South-West of Western Carpathians.
Figure 1: Moldova Nouă Forest District localization
Climatologically, the research area is framed in the temperate continental
climate zone, with Mediterranean influences, generating a particular climate, different from the rest of the country (INCDS, 2016). Phyto-climatologically, the surface of Moldova Noua Forest District is located in the hill-storeys area of sessile oaks, of European beech stands and the hill-storeys of oaks.
The main species is common beech, followed by sessile oak and hornbeam; the mean productivity of the stands is medium, with an average crown density between almost full and full. The research area from Moldova Noua Forest District is 19.300 ha. The data used are from GIS Database of Moldova Noua Forest District’s management plans, editions 2006, 2016. The GIS database has been merged with the management plan database, resulting a complete and very useful tool for these researches. For the statistical analysis of the databases used, PASTECS (Grosjean & Ibanez, 2014) was used in the RStudio software.
Also, ArcGIS ver.10.3 has been used in order for the GIS processing to be carried out in good condition by querying the database and the graphic results to be in good quality.
In order to determine the carbon stock, it was necessary to determine first the above-ground the biomass with following formula:

Estimation of carbon stock in south of western Carpathians from Moldova … 41
B = V x D x BEF (IPCC, 2003) Where: B - above-ground biomass (tonnes) V – stand's volume from management plans (m3) D – wood density according to the main species (Giurgiu et al, 2006)
(tonnes /m3) BEF – biomass expansion factor. The value used is for temperate climatic
forests of 1,4 (IPCC, 2006, Volume 4, Table 4.5) The carbon stock was determined with the formula:
C = B x CF (IPCC, 2003) Where: C - carbon stock (tonnes) CF – carbon fraction (value equal to 0,47 from IPCC 2006 GL, V4, CH4,
Table 4.3.) Analysis of carbon stock distributions for the two periods with
experimental distributions Gamma 3P, Lognormal 3P and Weibull 3P was done using the EasyFit application.
RESULTS AND DISCUSSION Biomass and carbon stock structure distribution The research area is statistically covered, due to the relatively large
number of observations (2984) with a low coefficient of variation of biomass and carbon stock, indicating high homogeneity (between 1.93 and 1.95).
Table 1: Main statistic indicator of experimental Biomass and Carbon stock Year Indicators Nbr. Val. min (T) Max (T) Sum (T)
2006 Biomass 2984 0.0763 9419.99 1814297.91 Carbon stock 2984 0.035 4427.39 852720.0177
2016 Biomass 2984 0.06 10049.47 1706545.07 Carbon stock 2984 0.03 4723.25 802076
Year Mean (T) Var. Std. dev. Coef. var
2006 Biomass 1411002.66 1187.85 1.95 Carbon stock 311690.489 558.29 1.95
2016 Biomass 1249118.47 1117.63 1.93 Carbon stock 275930.161 525.29 1.93
Regarding to the minimum values of above-ground biomass, it varies from
0.06 (2016) to 0.076 (2006) and the minimum carbon stock values range from 0.03 (2016) to 0.035 (2016). It can also be noticed that the maximum values of above-ground biomass and carbon stock are increasing in 2016 as compared to 2006 due to the aging of the stands.
Biomass and carbon stock distribution For choice of the most suitable theoretical frequency functions necessary
to adjust experimental distributions was used Kolmogorov-Smirnov, Anderson-Darling significance testing and the χ2 criterion for a 95% coverage probability
Chivulescu and Schiteanu 42
(Table 2). Gamma 3P, Lognormal 3P and Weibull 3P were the theoretical functions for adjusting the experimental distributions used to describe the carbon stock distribution (Fig. 2).
Comparing the two types of distributions (experimental and theoretical) using the three above-mentioned significance tests, can notice that there are differences between theoretical and experimental values, and the stand not having any of the studied theoretical distribution laws. This is due to the silvicultural operations that took place on the forest district territory between 2006 and 2016, as well as the post-communist retrocession of forest areas.
Table 2: Main indicators of theoretical distributions
Year Theoretical Function Theoretical values Experimental values
Kolmogorov – Smirnov
2006 Lognormal3P 0.024 0.033
Weibull3P 0.024 0.057 Gamma3P 0.024 0.098
2016 Weibull 3P 0.024 0.033
Lognormal 3P 0.024 0.037 Gamma 3P 0.024 0.078
Anderson – Darling
2006 Lognormal3P 2.501 10.083
Weibull3P 2.501 11.02 Gamma3P 2.501 50.43
2016 Weibull 3P 2.501 9.897
Lognormal 3P 2.501 11.818 Gamma 3P 2.501 30.122
χ2 Criterion
2006 Lognormal3P 19.675 10.083
Weibull3P 19.675 80.868 Gamma3P 19.675 74.245
2016 Weibull 3P 19.675 44.254
Lognormal 3P 19.675 59.52 Gamma 3P 19.675 200.31
Map of evolution of carbon stock in Moldova Noua Forest District The carbon stock's evolution in Moldova Noua Forest District was based
on data from the two management plans, 2006 and 2016 editions, and the graphical representation (Fig. 3) was performed using GIS techniques. These GIS techniques have also been successfully used in other research as a dynamic power tool useful for identifying and quantifying the parameters that may affect the carbon stock (Gil et al, 2011).

Estimation of carbon stock in south of western Carpathians from Moldova … 43
Figure 2: Fitting experimental carbon stock distribution using Gamma 3P, Lognormal 3P and Weibull 3P functions.
For a detailed analysis, the carbon stock was divided into 6 categories, by size. It can be seen that the carbon stock drops in 2016 compared to 2006.
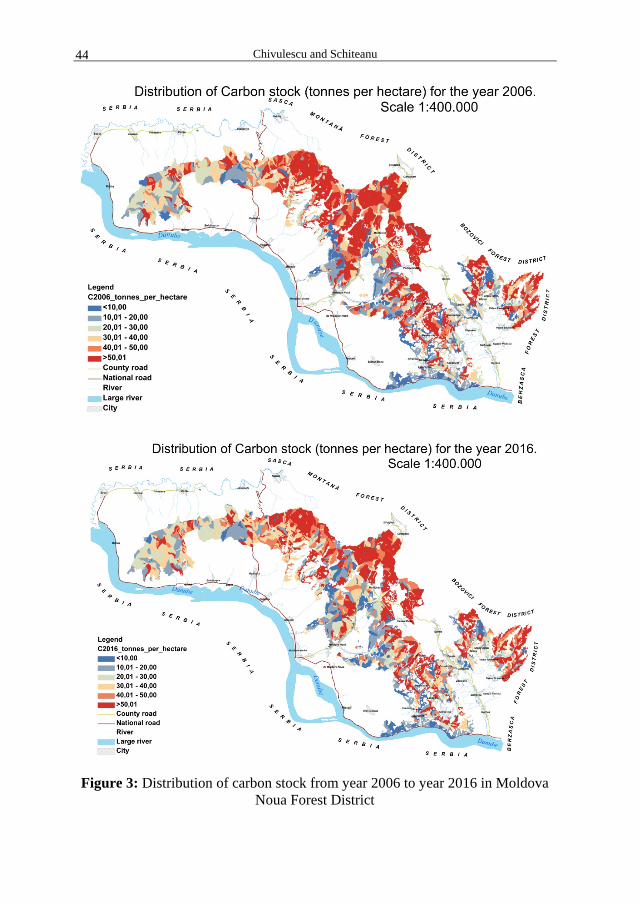
Chivulescu and Schiteanu 44
Figure 3: Distribution of carbon stock from year 2006 to year 2016 in Moldova Noua Forest District
Estimation of carbon stock in south of western Carpathians from Moldova … 45
The stand's volume evolution, the above-ground biomass evolution and the carbon stock evolution, in Moldova Noua Forest District, have a downward trend (Table 3) between the two analyzed periods.
Table 3: Volume, Above-ground biomass and Carbon stock evolution between
2006 and 2016
Year Volume (m3) Above-ground biomass (Tonnes) CO2 stock (Tonnes)
2006 2376182 1814297 852720 2016 2234466 1706545 802076
The previous table shows that the volume has decreased by 141.716 m3,
this decrease being due to the silvicultural operations that took place on the forest district territory like the exploitation forestry works. During this decade 188.710 m3 were exploited, the current volume increment of about 4,8 m3∙year-1∙ha-1 didn't fully cover this deficit. This fact was also found in above-ground biomass and carbon stock, with lower values in 2016 compared to 2006. This deficit is due to the imbalance produced in forest administration/management, through management plans, by the post-communist retrocession of forest areas failing to fully fulfil one of the most important principles of forest management activities, namely the principle of continuity.
CONCLUSIONS
Due to global warming, concerns about carbon stored by forest vegetation have intensified, materializing through high-level commitments with institutions such as the EU and the UNFCCC to report CO2 emissions. The best method of estimating carbon stocks in forest vegetation was found to be allometric equations, the method used in this research.
The researches were performed in Moldova Noua Forest District area, in South-West of Western Carpathians, data used to make this research from two management plans, 2006 and 2016 editions (management plans in Romania are made once every 10 years) for identical areas.
The data used for this research indicated high homogeneity values, the above-ground biomass mean values are between 576 and 608 tonnes. The quantity from 270 to 285 tonnes were determined for the carbon stock stored by forest ecosystems average.
The frequency theoretical functions Gamma 3P, Lognormal 3P and Weibull 3P were used, for the two researched periods, to describe better the carbon stock distribution. Following the goodness of fit test (K-S, A-D and χ2 Criterion), the carbon stock distribution did not follow any of the theoretical distributions studied. This is due to silvicultural operations carried out during this period and to the imbalance produced by post-communist retrocession of forest areas from the Moldova Noua Forest District.

Chivulescu and Schiteanu 46
This also indicates a decrease in carbon stocks in 2016 compared with 2006 observed through representation of the carbon stock evolution maps.
Through this research we have been able to determine and analyze the carbon stock for two different periods of 10 years between them, through a process with minimum effort but with promising results.
REFERENCES
Ciuvat, A. L., Abrudan, I. V., Blujdea, V., Dutca, I., Nuta, I. S., &Elena, EDU. (2013): Biomass Equations and Carbon Content of Young Black Locust. Notulae Botanicae Horti Agrobotanici Cluj-Napoca, 41(2), 590.
Ciuvăț, A.L.(2013): Producția de biomasă și stocarea carbonului înarboreteletinere de salcâm (Robiniapseudoacacia L.) dinsudul României, Teză de doctorat, Universitatea Transilvania din Brașov, 142p.
Gil, M. V., Blanco, D., Carballo, M. T., &Calvo, L. F. (2011): Carbon stock estimates for forests in the Castilla y León region, Spain. A GIS based method for evaluating spatial distribution of residual biomass for bio-energy. biomass and bioenergy, 35(1), 243-252.
Grosjean, P., & Ibanez, F. (2014): Package for Analysis of Space-Time Ecological Series. PASTECS version 1.3-18 for R v. 3.1. 1
ICAS (2006): Studiu General O. S. Moldova Nouă, 230 p. INCDS (2016): Studiu General O. S. Moldova Nouă, 203 p. IPCC (2003): Good Practice Guidance for Land Use, Land-Use Change and
Forestry, Chapter 3, Section 3.2, equation 3.2.3, 590p. IPCC (2006): Guidelines for National Greenhouse Gas Inventories, Volume 4,
Chapter 2, Forest Land, 46p. Pienaru A, Iancu P, Căzănescu S (2009): Desertification and its effects on
environment and agricultural production in Romania. Annals of Food Science and Technology 10(2):624-629.
Tolunay, D. (2011): Total carbon stocks and carbon accumulation in living tree biomass in forest ecosystems of Turkey. Turkish Journal of Agriculture and Forestry, 35(3), 265-279.

Agriculture & Forestry, Vol. 63 Issue 3: 47-62, 2017, Podgorica 47
DOI: 10.17707/AgricultForest.63.3.06 Aleksandra DESPOTOVIĆ, Miljan JOKSIMOVIĆ, Kristina SVRŽNJAK and Miomir JOVANOVIĆ 1
RURAL AREAS SUSTAINABILITY: AGRICULTURAL DIVERSIFICATION AND OPPORTUNITIES
FOR AGRI-TOURISM DEVELOPMENT
SUMMARY The paper analyses socio-demographic and production potentials and
opportunities for agri-tourism development. The research was carried out on holdings in the northern regions of Montenegro and Croatia. The focus is placed on family holdings with agriculture being the primary activity. The results show presence of certain production and socio-demographic preconditions for development of agri-tourism as a supplementary activity on holdings. In future, agri-tourism could encourage development of rural communities surveyed. Respondents identify state institutions as the key players in agri-tourism development. Agricultural holdings are not sufficiently networked, either vertically or horizontally, with the state and local institutions. Future agri-tourism development in Montenegro and Croatia should be based on sustainable development principles.
Keywords: agri-tourism, agriculture, sustainable development, rural community
INTRODUCTION Over the past few decades, rural areas have been affected by exploitation
of natural resources, depopulation and fall in agricultural production [1]. Agriculture is particularly important for mountainous areas [2]. It is not only about food production, but it also contributes to environmental protection and valorisation of human and natural resources [3,4]. The specific character of the agricultural production stipulates the main bottleneck: possibilities to replace labour and land with capital in rural areas are limited [5]. Agri-tourism can initiate the process of agriculture diversification and influence revitalisation of rural areas [6].
The agricultural activity has always contributed to the creation of rural landscapes which we can enjoy today, to human permanence in areas which are otherwise exposed to degradation, to determine and social values, to create a body of knowledge that are typical of specific areas, to valorise the human, economic and environmental resources of the various rural communities, to
1Aleksandra Despotović, Miljan Joksimović, Miomir Jovanović (corresponding author: [email protected]), University of Montenegro, Biotechnical Faculty, Department for Agro-Economic Research, Podgorica, MONTENEGRO; Kristina Svržnjak, College of Agriculture, Križevci, CROATIA. Notes: The authors declare that they have no conflicts of interest. Authorship Form signed online.

Despotovic et al. 48
qualify and promote the image of many territories, increasing their attractive capacities and contributing to their development [7].
Multifunctionality of agriculture is important for balanced regional development [8]. According to Binder and Wit [9] the multifuncionality of agriculture is a way to indicate evolutionary paths of differentiation and integration of income for farmers, especially in marginal areas where the business competitiveness is particularly difficult to achieve in function of territorial structural weaknesses. In many developing countries agriculture is vital for sustainable rural development and recognized as a main means for reducing poverty and ensuring economic growth. In this sense, reducing poverty in rural areas depends significantly on sustainable agricultural development [10]. In developed economies, agriculture is increasingly considered in a systemic approach, able to produce food commodities and meet the new needs of the consumer, providing both public goods (biodiversity, agricultural landscape) and services (tourism, energy, educational services) and foods with specific attributes (typical products) [11,12]. In the last years, to promote rural development policies the public operator has established a multifunctional vision of agricultural activity, attributing its multiple functions and responding to the new society needs [13]. According to Ficher [14] in this way there are farms which, at the same time, contribute to food production, preservation of natural resources, employment and sustainable development of the rural territory.
Intensive development of urban areas contributes to increased demand for holidays in rural areas [15,16]. In developed countries, agri-tourims has a long tradition [17]. Tourism, especially in rural areas, is one of the developing sectors in the European Union (EU) economy. Throughout the world, the countryside has become a common tourism destination [17,18]. Farm owners in rural areas perform a variety of activities by, for instance, combing agricultural production and tourism [19,20].
There are different definitions of agri-tourism in literature. Agri-tourism is an activity organised by agricultural producers [21]. Working farms with growing crops and livestock are one of the most important attractions during a stay on an agri-tourism farm [22]. In the context of sustainable rural development, agriculture as a tourism and recreation source can be considered an opportunity for rural areas. Any tourism or recreation enterprise on a working farm or form of rural tourism whereby paying guests can participate in farming life either as staying guests or day visitors on working farms can be seen as a new income source for agricultural societies [15,16]. Agri-tourism is a valued option protecting the rural environment, sustaining small sized enterprises and providing income and job opportunities [23]. With the post–industrial revolution, urbanisation and increased leisure time, tourism and recreation activities in rural areas also increased. Agri-tourism, which is defined as any tourism or recreation enterprise on a working farm, or a form of rural tourism whereby paying guests can participate in farming life either as staying guests or day visitors on working farms, can be seen as a new income source for agricultural societies [15,16]. Sale of own products and enlargement of farms is an important motive of agricultural

Rural areas sustainability: agricultural diversification and opportunities… 49
producers for engaging in agri-tourism [24,25,26]. In short, agri-tourism is one of the forms of rural tourism that allows tourists to spend leisure time by staying on a working farm [27].
The advantages of agri-tourism development are reflected in preservation of agricultural areas in rural regions as well as on-farm selling of own products [28]. Agri-tourism is becoming an important factor for survival of small agricultural holdings that are not able to compete under conditions imposed by market globalisation [29]. Agri-tourism is an important instrument for improving the social status of women and creating conditions for their inclusion in agri-tourism activities [23].
The research presented in this paper was carried out on family agricultural holdings in the northern regions of Montenegro and Croatia. The region disposes of significant natural resources. Agricultural soil is among the most important ones. The Koprivnica-Križevci County covers an area of 1,746 km2, of which arable land accounts for 59% [30]. The situation is similar in the northern region of Montenegro [31]. Agriculture is the basis of social, economic and local development. Income from agriculture is unstable and agri-tourism provides an opportunity for supplementing the income in the holdings surveyed [32].
The theoretical approach for this paper takes agri-tourism as a supplementary activity enabling sale of own products, board and lodging as well as other active holidays services on a holding [1,33]. These activities enable better utilisation of production and human resources on a holding [34]
The objective of the research presented in this paper is analysis of socio-demographic and production potentials on agricultural holdings and opportunities for agri-tourism development.
MATERIALS AND METHODS
Study Area Although Montenegro and Croatia had a different historical development,
decades long joint state legal framework contributed to suppression of numerous differences in the way of living of rural communities. The reason for addressing this topic is based on the fact that Montenegro and Croatia recognized tourism as the basis of economic development. In that context, agri-tourism is particularly important.
The northern region covers more than 50% of the entire territory of Montenegro, and accounts for one-third of the entire population. Towns of Bijelo Polje, Pljevlja and Kolašin, where the survey was conducted, account for 23% of the entire area of Montenegro (Fig.1). The Koprivnica-Križevci County is situated in the north of Croatia and covers 3.2% of the total territory of Croatia. It includes the following towns: Križevci, Koprivnica and Đurđevci (Fig. 2). The areas surveyed have moderate continental climate with pronounced extremes of certain climatic elements. The area disposes of hydrographic potentials of the rivers Drava, Tara, Lim and Bistrica.
Agricultural production is the core activity of family holdings in the northern region of Montenegro and Croatia. An average agricultural holding in

Despotovic et al. 50
Montenegro disposes of 4.6 ha of agricultural land, and in Croatia of 5.6 ha [30, 31, 35]. The main characteristic of holdings is fragmentation of land parcels, traditional way of living, hospitality and a diverse offer of home-made specialties. Demographic situation is unfavourable as a result of pronounced migratory trends towards southern and central regions.
Figure 1. Figure 2. Tables 1 and 2 below provide an overview of socio-demographic factors as
well as number of family holdings by municipalities in which surveys presented in this paper were carried out.
Table 1. Socio-demographic factors – northern region of Montenegro and
the Koprivnica-Križevci County Geographic distribution Area, km2 Population Population
density per km2 Montenegro 13,812 620,029 45
Pljevlja 1,346 36,918 23 Bijelo Polje 924 46,051 50
Kolašin 897 8,380 9 Croatia 56,542 4,284,889 76
Koprivnica 90.94 30,854 340 Križevci 263.70 21,122 80 Đurđevac 157.19 8,264 53 *Source [64, 65] Natural, social and transport factors are important for agri-tourism
development [34]. The northern regions of Montenegro and Croatia dispose of significant natural resources (mountains, lakes, caves, national parks, flora and fauna, rivers abundant with fishery resources). The national park Biogradska Gora in the vicinity of Kolašin is one of three last old-growth forests in Europe. The Biogradsko Lake, which belongs to the group of glacial lakes, is in the centre of the National Park. The Mountain Bjelasica is rich in flora and fauna (26 plant communities with around 2000 species and subspecies of higher plants) as well as mountain lakes. The County has Šoderica and Čambina lakes, Fortress Kalnik,
The Križevci – Koprivnica County

Rural areas sustainability: agricultural diversification and opportunities… 51
Đurđevečki Peski etc. Existing resources provide an opportunity for various tourist attractions, such as mountaineering, hunting, fishing, etc. [36].
Table 2. Number of family agricultural holdings in the area surveyed
Geographic distribution Number of family holdings
% share in total number of holdings
Montenegro 48,824 100.00 Pljevlja 4,001 8.19
Bijelo Polje 6,404 13.11 Kolašin 1,574 3.22 Croatia 230,000 100.00
Koprivnica 10,238 4.45 Križevci 7,001 3.04 Đurđevac 2,857 1.25
*Source [65,16]
Natural, social and transport factors are important for agri-tourism development [34]. The northern regions of Montenegro and Croatia dispose of significant natural resources (mountains, lakes, caves, national parks, flora and fauna, rivers abundant with fishery resources). The national park Biogradska Gora in the vicinity of Kolašin is one of three last old-growth forests in Europe. The Biogradsko Lake, which belongs to the group of glacial lakes, is in the centre of the National Park. The Mountain Bjelasica is rich in flora and fauna (26 plant communities with around 2000 species and subspecies of higher plants) as well as mountain lakes. The County has Šoderica and Čambina lakes, Fortress Kalnik, Đurđevečki Peski etc. Existing resources provide an opportunity for various tourist attractions, such as mountaineering, hunting, fishing, etc. [36].
In the region surveyed, cultural and historical heritage and thematic events throughout the year are important social factors. In Montenegrin municipalities, there are monuments dating back to 16th century: the Monastery of the Holy Trinity and Husein Pasa’s Mosque, as well as the Monastery Morača, built in 1252. The County has sacred structures (Church of the Assumption of Blessed Virgin Mary, chapel St. Mark of Križevci) and a strongly developed artistic tradition. Cultural and historical monuments are situated in urban and suburban zones. Events of importance for the region are: the Days of Pljevlja Cheese, the Tara River Rafting, Picokijada in Đurđevac, Renaissance Festival in Koprivnica, etc. Well-known agricultural products are: pljevaljski cheese, lisnati cheese and prgica cheese [1].
From the viewpoint of transport factors, the family holdings surveyed have infrastructure connection with zones with cultural and historical monuments. However, current road infrastructure requires major investments for the purpose of modernization.
Material The first part of the paper is based on available literature sources. The
results of the survey conducted on 120 agricultural holdings (60 agricultural

Despotovic et al. 52
holdings in the northern region of Montenegro and the Koprivnica–Križevci County, each) are presented in the second part of the paper. The survey questionnaire includes questions on socio-demographic characteristics, while the second part concerns production characteristics and potentials of the holdings. The survey was carried out in the course of 2015 by trained poll takers.
Method The survey was carried out in the form of interviews. The survey covered
age groups of 18 years and over. The respondents were selected by random sampling. According to methodology, persons surveyed can be holders of family holdings or their members. Similarities and differences on agricultural holdings in Montenegro and Croatia were analysed by the method of comparison. Data was processed using SPSS software, and the methods used included descriptive statistics, outlier detection, five maximum and five minimum variables, frequency, correlation and cross-tabulation.
Hypotheses The following hypotheses were formulated in this paper: H1: Agriculture is
the core activity in the holdings surveyed; H2: Holdings dispose of socio-demographic and production potentials for development of agri-tourism as supplementary activity; H3: The main motives of respondents for engaging in agri-tourism include: sale of own products on holdings and income increase.
RESULTS AND DISCUSSION Socio-demographic data on holdings Respondents were predominantly male, accounting for 78.4% of all
respondents (Tab.3). Most of the respondents fell within the age group of up to 30, with secondary education. Most of respondents (63.6%) stated that their main occupation is agricultural producer, with 16.4 ha on average, with highest share of producers with 5.5 ha. Respondents who are not agricultural producers dispose of largest land areas. Smaller villages with population of up to 500 is the residence of 48.8% of respondents who dispose of 136.7 ha, on average, within which respondents with 66.7 ha have the highest frequency. The key preconditions for development of agri-tourism in family holdings are: agriculture as the core activity, available land resources and location in rural areas [37,17].
Land is the most important means of production on holdings [38]. According to the production type (Tab.4), purely agricultural holdings prevail. Agriculture is the core activity and the driving force of agri-tourism development [38].
From the viewpoint of agri-tourism development in the holdings surveyed, agricultural producers have the opportunity to rent the land and thus strengthen further their production capacity. On the other hand, a part of the land resources can be used for tourism purposes (for construction of smaller tourist accommodation facilities, sports grounds, etc. [38]. Most of respondents stated that currently, they do not dispose of appropriate tourist accommodation facilities.

Rural areas sustainability: agricultural diversification and opportunities… 53
Table 3. Socio-demographic data of holdings surveyed in Montenegro and Croatia
Socio-demographic data on holdings
Montenegro Croatia Structure Average Pondered value
according to number of ha
% % % ha ha
Sex Male 90.0 68.0 78.4 37.7 29.6 Female 10.0 32.0 21.6 282.2 61.0
Age
Age 15-30 3.3 94.0 50.4 167.6 84.5 Age 31-50 51.6 6.15 28.0 11.07 3.3 Age 51-65 33.3 0 16.0 13.8 2.2 Above 65 11.8 0 5.6 12.7 0.7
Educational structure of the population
Elementary - incomplete 3.30 - 1.6 14.5 0,2
Elementary education completed 18.30 3.30 8.8 13.5 1.2
Secondary education completed 63.30 85.30 82.4 107.1 88.3
College, University degree 15.0 11.40 7.2 12.0 0.9
Master of Science, Doctor of Philosophy - - - -
Occupation Agricultural producer 63.30 58.90 63.6 16.4 5.5
Pensioner 7.60 10.78 3.2 4.2 0.1 Other 29.10 30.32 33.2 130.9 82.7
Residential status Smaller village
(population up to 500) 55.0 43.0 48.8 136.7 66.7
Medium-sized village (population 500-1,000) 3.30 26.5 12 49.8 6.0
Larger village (population 2,000-
5,000) 36.7 27.5 23.2 19.1 4.4
Larger town (population 5,000-
10,000) 5.0 3.0 16 83.55 13.4
Large town (population 10,000 ) - - - -
In the ownership structure, parents have the highest share (60%), while
respondents account for 30%. Under the frequency distribution, parents dispose of 15.9 ha, and respondents with 4.3 ha (Tab.4). The results show the link between respondents and the work and life on a family holding. Taking into account the share of respondents of up to 30 years of age in the ownership structure, they can respond to the needs of provision of tourism-hospitality services [39].
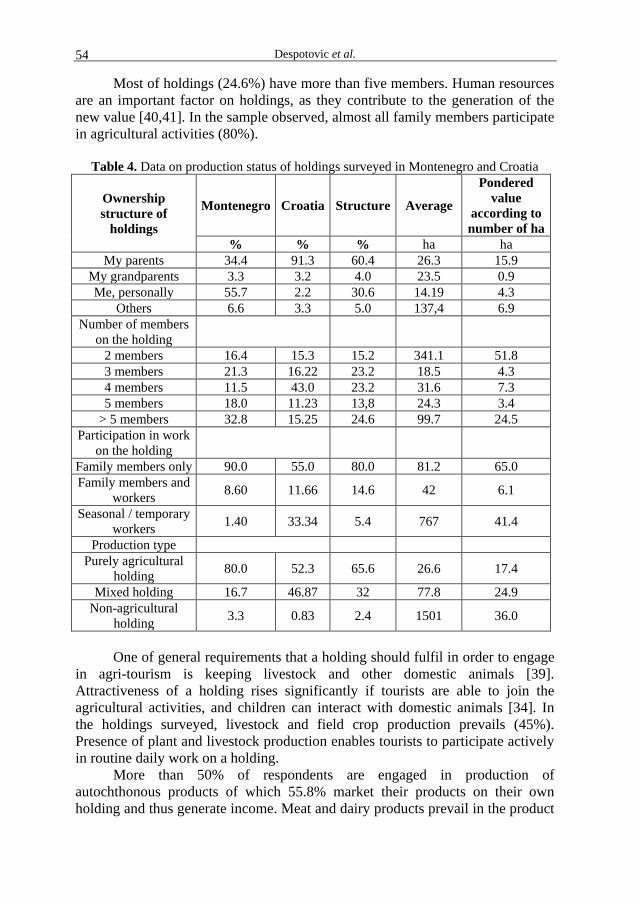
Despotovic et al. 54
Most of holdings (24.6%) have more than five members. Human resources are an important factor on holdings, as they contribute to the generation of the new value [40,41]. In the sample observed, almost all family members participate in agricultural activities (80%).
Table 4. Data on production status of holdings surveyed in Montenegro and Croatia
Ownership structure of
holdings
Montenegro Croatia Structure Average
Pondered value
according to number of ha
% % % ha ha My parents 34.4 91.3 60.4 26.3 15.9
My grandparents 3.3 3.2 4.0 23.5 0.9 Me, personally 55.7 2.2 30.6 14.19 4.3
Others 6.6 3.3 5.0 137,4 6.9 Number of members
on the holding
2 members 16.4 15.3 15.2 341.1 51.8 3 members 21.3 16.22 23.2 18.5 4.3 4 members 11.5 43.0 23.2 31.6 7.3 5 members 18.0 11.23 13,8 24.3 3.4
> 5 members 32.8 15.25 24.6 99.7 24.5 Participation in work
on the holding
Family members only 90.0 55.0 80.0 81.2 65.0 Family members and
workers 8.60 11.66 14.6 42 6.1
Seasonal / temporary workers 1.40 33.34 5.4 767 41.4
Production type Purely agricultural
holding 80.0 52.3 65.6 26.6 17.4
Mixed holding 16.7 46.87 32 77.8 24.9 Non-agricultural
holding 3.3 0.83 2.4 1501 36.0
One of general requirements that a holding should fulfil in order to engage
in agri-tourism is keeping livestock and other domestic animals [39]. Attractiveness of a holding rises significantly if tourists are able to join the agricultural activities, and children can interact with domestic animals [34]. In the holdings surveyed, livestock and field crop production prevails (45%). Presence of plant and livestock production enables tourists to participate actively in routine daily work on a holding.
More than 50% of respondents are engaged in production of autochthonous products of which 55.8% market their products on their own holding and thus generate income. Meat and dairy products prevail in the product

Rural areas sustainability: agricultural diversification and opportunities… 55
structure (41.4%). The share of processed fruit, vegetable and other products is significant as well. Taking into account the existing production on holdings, gastronomic offer is an important element that can significantly increase the income.
The preconditions analysed provide an opportunity for integration of agri-tourism as a supplementary activity in holdings surveyed. Socio-economic and natural factors are an important generator of agri-tourism turnover.[42]
The respondents in the survey are market oriented. The respondents stated on-farm sale of own products and increase of income as the most important motives for engaging in agri-tourism [24,25,26,32,38,43].
Table 5. Motives for launching agri-tourism activity in holdings surveyed
Motives Montenegro Croatia Structure Average
Pondered value
according to number of ha
% % % ha Sale of own
products, easier marketing
85.5 54.5 70.0 124.5 87.15
Income increase 5.5 20.0 12.75 44.75 5.6
Reduction of agricultural production
risks
1.8 7.3 4.55 86.5 3,9
Employment for family members
1.8 9.1 5.45 21.83 1.2
Other 5.5 9,1 7.3 22.4 1.63 Development of contemporary product distribution channels create the
potential risk of complete disappearance of local produce that is produced in small quantities. Agri-tourism is an activity that provides market opportunities for products from the small production volume [38].
Engaging in agri-tourism requires interest in and knowledge of family members in numerous areas [43]. Most of respondents (80%) are not familiar with the legislation and procedures for launching agri-tourism activities; nevertheless, 76% expressed interest in engaging in this activity. That is why training is necessary for work in agri-tourism as well as inclusion of stakeholders in tourism who possess the know-how and experience [43]. The stakeholders in agri-tourism are representatives of government institutions, local communities, tourist agencies and holdings connected with agri-tourism [44,45]. The support of local communities and co-operation among business operators are important preconditions for integration of agri-tourism as a supplementary activity on
Despotovic et al. 56
holdings [46]. Public and private sectors play different roles. The public sector is in charge of enforcement of laws and implementation of standards, while the private sector plays an important role in development of facilities for implementation of agri-tourism activities [47]. An important feature of holdings engaged in agri-tourism is that their operations depend on their own resources and that members of the holding are responsible for the services provided to tourists [48].
Agri-tourism requires a dynamic harmony in operations of all stakeholders participating in the business. Organization and interaction are important for holdings, agri-tourism associations and institutions. This implies vertical, horizontal and territorial integration of the stakeholders and their joint activities [38].
Management of agri-tourism potential in the region surveyed falls under the authority of the Ministry of Agriculture and local secretariats for economy and agriculture. The role of the Ministry of Agriculture is to create an environment and provide incentives for agri-tourism development. The incentives take the form of measures of support to rural development. In Croatia, those support measures include grant support to launching agri-tourism activities as well as financing of existing tourism-related activities on holdings. In addition to subsidies, the local administrations assist producers in organization of events and include them in cross-border projects, shares information on the programmes of the Ministry of Agriculture, etc. The flow of information is “top-down”. Tourism organizations work on promotion of local communities, but far more extensive promotion of agri-tourism potential is needed. In the view of respondents (60%), self-initiative of holding members can influence significantly the demand in agri-tourism, while 36.4% of respondents attributes it to the state policy. Local community as a factor in agri-tourism development is identified by a small number of respondents (3.6%). Research activities carried out thus far indicate the need for better involvement of local community members in order to ensure development of a tourist destination in accordance with the local character and values [49].
A number of non-governmental organizations invest significant efforts in order to connect agricultural holdings and interested tourists. Local Action Group (LAG) is important for establishing of local partnership, while LAG is important for the LEADER program. LEADER – Links between actions for the development of the rural economy, is a European Union initiative to support rural development in rural communities through public-private partnership (LAGs). The main LEADER characteristic is that the emphasis is placed on local population and its ability to identify what suits best their tradition, skills, culture, environment [50]. The basic LEADER principle is “bottom-up” approach. It is based on LAGs, networking, local financing, etc.
There are three LAGs on the territory of the Koprivnica-Križevci County: LAG Prigorje, LAG Podravina and LAG Prizak. LAG Prigorje is currently inactive. In Montenegro, LAGs are at the initial stage. The Rural Development

Rural areas sustainability: agricultural diversification and opportunities… 57
Network in Montenegro plays an important role in mobilizing civil society in rural areas and promotion of the rural development concept. The network currently has 18 members, interested in promotion of cultural and historical heritage, education, etc. The network aspires to extend its membership with a view to promoting the natural potential for agri-tourism in the region observed. Thus far, networking of producers and cooperatives through setting up of local associations on the territory of Montenegro has not fully met the expectations.
There have been initiatives for establishing of agri-tourism clusters in the surveyed regions of Montenegro and Croatia. Concrete steps in that regard have not been taken yet.
On the territory of Croatia, agri-tourism development is monitored by the Croatian Chamber of Economy, and the Association of Tourism Agricultural Holdings was established as well. A specific body in charge of agri-tourism development has not been established in Montenegro yet. Its establishing falls under the authority of the Ministry of Agriculture, more precisely, of the Directorate for Rural Development.
Dissemination of importance and role of agri-tourism requires inclusion of educational institutions and experts in this field. It is important to work on development of specialized know-how in information and communication technologies, management, marketing, trade, etc. [1]. The ultimate objective of training (courses, discussions, workshops, etc.) is that trainees understand the contribution that agri-tourism can make to their region. Education and training is needed for direct service providers as well as for employees in the national and local administration.
As major obstacle to agri-tourism development, the respondents highlight the lack of funds (57%). Failure factors in development of agri-tourism activity are mainly referred to the national institutions. Rural population in Montenegro and Croatia almost entirely relies on agriculture as the basis of the rural economy. That is why their expectation that agri-tourism development should be the objective of the Ministry of Agriculture is logical. Thus far, the incentives offered by the state have not been sufficiently encouraging. In Montenegro and in Croatia, agri-tourism is still not developed endogenously, but is for the most part relying on “external” investments, through applications for European funds, such as IPARD and similar.
Respondents (85%) note that agri-tourism entails certain risks. The risks faced by holdings can be financial, legal, market related, etc. Studies show that in some communities, local population is more interested in environment than in economic benefits that agri-tourism brings [38,43]. The views range from concerns with regard to environmental consequences on one side to the pronounced optimism regarding economic development on the other. However, regardless of the risks, (84.75%) of respondents believe that demand in agri-tourism will grow in the future. Entrepreneurs, private land/house owners and local community will express more interest in development of agri-tourism. They are searching for new developmental and employment opportunities for the local

Despotovic et al. 58
population. It can be in conflict with interests of owners of holiday homes, ecologists and national environmental protection agencies who are concerned that agri-tourism could cause harm to the environment [51].
That agri-tourism contributes positively to socio-economic development of rural communities is the view shared by 56% of respondents. As main contributions, they indicate marketing of own products and income increase, increase in volume of agricultural production, preservation of tradition, improvement of the conditions and quality of life. Taking into account the natural and cultural diversity of the region observed, agri-tourism can become a driving force of a range of activities on family holdings (organic food production, revitalization of old artisan skills, etc.).
The survey conducted confirmed the hypotheses presented in the paper. In holdings observed, agriculture is the main activity, which confirms the first hypothesis. The potential that holdings dispose of confirm the hypothesis that preconditions for development of agri-tourism as a supplementary activity exist. Respondents state easier marketing and sale of own products as the main motivation for engaging in agri-tourism in order to increase income. Thus, the last hypothesis is confirmed.
CONCLUSION Northern region of Montenegro and Croatia are traditional agricultural
areas. The paper analyses the production and socio-demographic potentials and opportunities for development of agri-tourism on holdings. The survey was carried out in the northern regions of Montenegro and Croatia. The results of the survey show that the holdings surveyed dispose of land and human resources, but their accommodation capacity is insufficient. One of drawbacks is lack of quality infrastructure and connection with the urban areas.
Majority of holdings are situated in smaller villages with population of up to 500. Agriculture is the core activity, where livestock and field crop production prevail. Holdings are able to sell their own products directly on farms, as well as to offer active participation in routine daily farm activities. The respondents state on-farm sale of products and income increase as the main motive for engaging in agri-tourism. The holdings are in vicinity of towns with rich cultural heritage.
The respondents lack knowledge on agri-tourism and are not familiar with legislation and procedures. They state lack of financial means as an obstacle to engaging in agri-tourism. They see national institutions as the main “culprits” for insufficient development of agri-tourism, but they also see them as the key players in future development. Respondents believe that local communities and family holdings are far less responsible for agri-tourism development.
In order to put in place a more complex agri-tourism product, cooperation among all stakeholders in a local community is necessary. There is a need for both vertical and horizontal networking of stakeholders in agri-tourism development, both at the national and the local levels.

Rural areas sustainability: agricultural diversification and opportunities… 59
Development of agri-tourism as a supplementary activity on holdings requires stronger institutional support. It is reflected in easier access to finances and loans, provision of technical and advisory services to producers, support to project development and management. All agri-tourism stakeholders should have in mind that no sector is able to cope with major social, economic and environmental challenges on its own. Each partner contributes with its qualities and competences and plays a specific role in designing and implementation of projects and activities.
Agri-tourism development in destinations surveyed provides opportunities for establishing of contacts among people, exchange of experiences, contributes to preservation of the local heritage and multicultural character. The benefits of the local community from agri-tourism development include better social infrastructure (schools, libraries, health care institutions, etc.). Furthermore, agri-tourism initiates better valorisation of natural resources of rural communities. In order to increase the attractiveness of the region surveyed, it is necessary to valorise the available natural potentials through various activities (fishing, swimming, boating, bird watching, collection of medicinal herbs, visits to protected natural areas, etc.).
On the other hand, the tourist offer that a destination should promote requires bringing together a long chain of stakeholders. Agri-tourism development must not be random and unplanned, but planned, controlled and continued.
In future, establishing of agri-tourism clusters is necessary in order to meet the joint interests and promote agri-tourism activities. Joint efforts should contribute to improvement of the quality of services in holdings. Association in clusters results in linking of agriculture with artisanship and other activities; specialized production; raising awareness on importance of agri-tourism for rural communities; offering of new services on farms; better infrastructure. Thus, holdings become more attractive.
Particular attention needs to be paid to setting up of a national database on agri-tourism in Montenegro. Such data are needed because statistical data are of immense importance for monitoring of economic and social situation in a country. Monitoring of the number of visitors, estimate of tourist consumption, tourist polls (consumption, motivation, satisfaction) and key players in tourist offer are recommended. Availability of statistical data on agri-tourism is essential for rural development policy making.
The results obtained in this survey are important for decision-makers and agricultural policy makers. They provide information on existing preconditions (production, socio-demographic) and opportunities for agri-tourism development. Results of this paper can be used in the process of planning and implementation of rural development measures. This survey is the first of its kind in Montenegro. Its importance stems from the fact that it was carried out in two neighbouring countries – one is a Member State of the EU, the other is on its path towards the EU.
Despotovic et al. 60
ACKNOWLEDGEMENTS This work result of a bilateral project with the Republic of Croatia.
REFERENCES 1.Kantar, S. Razvoj održivog ruralnog turizma: potencijal Koprivničko-križevačke
županije. Doktorska disertacija, 2016, Zagreb, pp. 1-279 2.Ribeiro, M.; and Marques, C. Rural Tourism and the Development of Less Favoured
Areas – between Rhetoric and Practice. Int.J. Tourism Res. 2002, 4, 211-220 . 3.Lee, K. A. and FrzipoorSaen R. Measuring corporate sustainability management: A
data envelopment analysis approach. Int. J.Product Econom. 2012, 140, 219-226 . 4.Wiengarten, F.; and Pagell, M.; The importance of quality management for the success
of enviromental management initiatives. Int. J.Product Econom. 2012, 140, 407-415.
5.Erokhin, V.; Heijman, W.; Ivolga, A. Sustainable rural development in Russia throught diversification: The case of Stavropol Region. Visegr. Bioecon. Sustain. Dev. 2014, I, 20-25.
6.Sidali, K.I.; Kastenholz, E.; Bianchi,R. Food tourism, niche markets and products in rural tourism: Combining the intimacy model and the experience economy as a rural development strategy. J. Sustain. Tour. 2015, 23, 1179-1197.
7.Lanfranchi, M. and Giannetto, C. Sustainable development in rural areas: The new model of social farming. Quality – Access Success. 2014, 15, p. 219-223.
8.Sgroi, F.; Trapani.A.M., Testa, R. and Tudisca, S. The rural tourism as development opportunity or farms. The case of direct sales in Sicily. American Journal of Agriculture and Biological Sciences. 2014, 9 (3) , 407-419.
9.Binder, M. and Witt, U. A Critical note on the role of the capability approach for sustainability economics. J. Socio- Econom. 2012, 41, 721 -725.
10.Anonymous: Promoting Sustainable Rural Development Through Agriculture. Canadian International Agency (CIDA). Minister of public Works and Goverment Services, 2003, N0: CD4-8/2003, Canada.
11.Ageron, B.; Gunasekaran, A.; Spalanzani, A. Sustainable supply management: An empirical study. Int. J.Product.Econom. 2012, 140, 168-182.
12.Ginaldy, F.; Danuso, F., Rosa, Rocca, A. and Bashanova, O. Agro-energy supple chain planning: A procedure to evaluate economic, energy and enviromental sustainability. Italian J. Agronomy. 2012. 7, 221-228.
13.Gray, J. The Common agricultural policy and the re-ivention of the rural in the European community. Sociol. Ruralis. 2000, 40, 30-52.
14.Fichera,C.R. Mulzifunzionlita e Svilluppo Sostenibile Del Territorio Rurale-Innovazione Technologica e Valorizzazione Delle Tipicita, IN: Aree Marginali. 1 st Edn, Iriti Editore, Reggio Calabria, 2007 ISBBN -10: p. 68-88.
15.Dernol, L.A. Farm tourism in Europe. Tourism Managment. 1983, 4(3), 155-156. 16.Busby, G.; and Rendle, S. The transition from tourism on farms to farma tourism.
Tourism Managment. 2000, 21, 635- 642. 17.Hall, D.; Mitchell, M., and Roberts, L. Tourism and the ciuntryside: dynamic
relationships, in Hall, D.; Roberts, L. and Mitchell, M. (eds), New Directions in Rural Tourism, 2003, pp. 3-16.
18.Ainley, S.; and Smale, B.A. Profile of Canadian agritourists and the benefits they seek. Journal of Rural and Community Development. 2010, Vol 5, N0 1, 58-75.
Rural areas sustainability: agricultural diversification and opportunities… 61
19.Fennel,D.A., and Weaver, D.B. Vacation farms and ecotourism in Sascatchewan, Canada. Journal of Rural studies. 1997, Vol 13, N0 4, 467 -475.
20.Brandth, B.; and Huagen, M.S. Farm diversification into-tourism-implications for social identity?Journal of Rural studies. 2011, 27, N0 1, 35-44.
21.Brščić, K.;, Franić, R., Ružić, D. Hy agrotourism –owner,s opinion. Journal of Central Europen Agriculture. 2010, Vol.11, N0 1, 1-42.
22.Majewski, J. Agroturystyka to tez biznes, Fundacja, Wspomagania Wsi, 2000,Warszawa.
23.Akpinar, N.; Talay, I.; Ceylan, C.; and Gunduz, S. Rural women and agrotourism in the context of sustainaible rural development: A case study from Turkey. Kluwer Jornal. 2004, 6, 473-486.
24.Cawley, M.; Gillmor, D. A.; Leavy, A., and McDonagh, P. Farm diversification:Studies relating to the west of Ireland. 1995, Dublin. Teagasc.
25.Davies, E.T. and Gilbert, D.C. A case study of the development of farm tourism in Wales.Tourism Management.1992, 13(1), 56-63.
26.Lobo, R. E.; Goldman, G.E. Jolly, D.A.; Wallace, B.D.; Schrader, W.L., and Parker, S.A. Agritourism benefits agriculture in San Diego County. 1999, California-Agriculture, 53(6), 20-24.
27.Sikora, J. Organizacja rucbu turystycznego na wsi, Wydawnictwo WsiP, 1999, Warszawa.
28.Welford, R.; Ytterhus, B. and Eligh,J. Tourism and sustainable development: An analysis of policy and guidelines for managing provision and consumption. Sustainable Development. 1999, 7, 165-177.
29.Goebel, P.; Reuter, C.; Pibernik. R.; and Sichtmann, C. The influence of ethical culture on supplier selection in the context of sustainable sourcing. Int.J. Product. Econom. 2012, 140, 7-17.
30.Državni zavod za statistiku – Hrvatska, popis stanovništva 2011. 31.Zavod za statistiku Crne Gore (MONSTAT). Poljoprivredni popis 2010, Struktura
poljoprivrednih gazdinstava, 2011b; Zavod za statistiku Crne Gore, Podgorica, Crna Gora , 2011.
32.LaPan, C., and Barbieri, C.; The role of agritourism in heritage preservation. Current Issues in Tourism, (2014), Vol.17, N0. 8, 666-672.
33.Jelinčić, D. A. Agroturizam u evropskom kontekstu. Stud .ethnol. Croat. 2007, Vol 19,.269-291.
34.Ruzić,P.; Ruralni turizam Istre, (2011), Institut za poljoprivredu i turizam, Poreč 35.Zavod za statistiku Crne Gore (MONSTAT). Statistički godišnjak Crne Gore, .2015;
Zavod za statistiku Crne Gore, Podgorica, Crna Gora , 2016 36.Kušen, E. Terminologija ruralnog razvoja u: Prvi hrvatski kongres ruralnog turizma-
Perspektive razvoja ruralnog turizma. Zbornik radova. 2007, p.100. 37.Lane, B.;. “What is rural tourism?” Journal of sustainable tourism, 1994, Vol. 2(7),
pp.7-21. 38.Njegovan, Z.; Ekonomika turizma i seoskog turizma, 2016, Poljoprivredni fakultet,
Novi Sad, p.1-243 39.Klarić, Z; Gatti, P. (2006). Ekoturizam. U: Hrvatski turizam: Plavo,bijelo,zeleno
(ur.Čorak, Sanda i Mikačić, Vesna), 2006, str. 149-166, Zagreb: Institut za turizam
40.Tudisca, S.; Di Trapani, A.M.; Sgroi, F.; Testa, R.and Squtrito, R. Economic analysis of PV systems on buildings in Sicilian farms. Renewable Sustainable Energy Rev. 2013, 28, 691- 701.

Despotovic et al. 62
41.Ballarin, A.; Vechiato, D.; Tempesta, T.; Marangon,F.; and Troiano, S. Biomass energy production in agriculture: A weighed goal programming analysis. Energy policy. 2011, 39, 1123-1131.
42.Dwyer, L.; Forsyth, P., Rao, P.; The price competitiveness of travel and tourism: acomparison of 19 destinations. Tourism Management, 2000, Vol. 21(1), pp. 9-22.
43.Demirović,D.: Konkurentnost Vojvodine kao destinacije ruralnog turizma, Doktorska disertacija, 2016, Novi Sad, pp 1-327
44.Conaghan, A.; Hanrahan, J; .Global Conformity of Indicators for Eco-Certification Programs. In: Contemporary Issues in Irish and Glbal Tourism and Hospitality (ed.G.Gorman and Z Mottiar), 2010, pp. 93-106. Dublin: DIT
45.Byrd, E.T.; Bosley, H.; E., Dronberger, M.G;. Comparisons of stakeholder perceptions of tourism impact in rural eastern North Carolina. Tourism Management, 2009, Vol. 30(5), pp.693 – 703.
46.Wilson, S.; Fesenmaier, D., Fesenmaier, J., Van Es, J. Factors for success in rural tourism development. Journal of Travel Research, 2001, Vol. 40(2), pp. 132-138.
47.Ahmad, N.A.A., Habibah, A., Hamzah, J., Mohd Y.H.. Understanding the Role of Stakeholder in the Formation of Tourist Friendly Destination Concept. Journal of Management andSustainability, 2012, Vol. 2(2), pp. 69 – 74.
48.Aragón-Sánchez, A.; Sánchez-Marín, G.; Strategic orientation, management characteristics, and performance: A study of Spanish SMEs. Journal of Small Business Management, 2005, Vol. 43(3), pp. 287-308
49.Sheldon, P. J., Abenoja, T. Resident Attitudes in a Mature Destination: The Case of Waikiki. Tourism Management, 2001, Vol. 22(5), pp. 435
50.Štifranić, L.; Debelić, B.; Leader program: Evropskom praksom do vlastitih prilika, 2009, Rijeka.
51.Kaltenborn, B.P.; Andersen, O.; Nellemann, C.; Resident Attitudes Towards Mountain Second-Home Tourism Development in Norway: The Effect of Environmental Attitues. Journal of Sustainable Tourism, 2008, Vol. 16(6), pp. 664-680.

Agriculture & Forestry, Vol. 63 Issue 3: 63-73, 2017, Podgorica 63
DOI: 10.17707/AgricultForest.63.3.07 Mykola NAZARENKO, Yuri LYKHOLAT, Ivan GRIGORYUK, Nina KHROMYKH1
CONSEQUENCES OF MUTAGEN DEPRESSION CAUSED BY DIMETHILSULFATE
SUMMARY
The strategy of investigation combined the effects of mutation depression evident at first generation on cell and plant level and peculiarities of recurrent mutagen action. The main purposes of investigations in this area were determination genotype-mutagen interaction for modern Ukrainian winter wheat varieties, identify sensitive of genotypes for DMS (dimethylsulfate) genotypes and evolution repeat action of mutagen as a method in difference alteration on firs step of mutation breeding program, which limited next stages by quantity of material for breeding. Here we report cytogenetic, plant growth and development characteristics of mutation induction variability of the new wheat varieties and some relationships between means of plants grows and developments, morphometrical parameters, cytogenetic characteristics and different concentrations and types of mutagens at first generation after DMS action.
Keywords: chemical mutagenesis, winter wheat, dimethylsulfate, chromosomal aberrations.
INTRODUCTION
DMS (dimethylsulfate) as a mutagen is widely used for special investigations in plant genetics structure, it the one of the most often used for reverse genetic approach mutagens in modern functional genomics (other exploited substance is related to DMS (in the same group of chemical mutagens) ethilmethansulfate (EMS) and for programs for genetic improving indigenous cultivars in South-East Asia (FAO-IAEA programs for coordinating investigations in chemical mutagens) (Shu et al, 2011). DMS as a mutagen factor is traditionally related to the same family of mutagens (supremutagens), which used in our previous investigations due to mechanism of action on DNA-level, but with a little distinguishes (Jankowicz-Cieslak et al, 2017).
1Mykola Nazarenko (corresponding author: [email protected]), Department of Plant Breeding and Seeds Management, Faculty of Agronomy, Dnipropetrovsk State Agrarian and Economic University, Dnipro, UKRAINE; Yuri Lykholat, Nina Khromykh, Department of Plant Physiology and introduction, Faculty of Biology, Oles Honchar Dnipropetrovsk National University, Dnipro, UKRAINE; Ivan Grigoryuk, Department of Plant Physiology and Biochemistry, Bioenergetics, National University of Life and Environmental Sciences of Ukraine, Kyiv, UKRAINE. Notes: The authors declare that they have no conflicts of interest. Authorship Form signed online.

Nazarenko et al. 64
Mutagen effects on cell and whole plant level (named as mutagen depression) are the key factors which limited either winter wheat productivity for agricultural purpose at first generation (due to some modern investigations at next generations too (Mangi et all, 2016) or quantity of materials obtained for next stapes of mutation breeding programs after mutagen action for identification and selection of mutants. Consequences of mutagen action on cell level (chromosomal aberrations) are closely connected with future mutations rate. Influence of mutagen factors action is depended on next parameter: physiological parameter of mutagen action object, genotype of object, type of mutagen action (acute, chronicle), nature of mutagen, doses or concentration of mutagen, fractional of dose or concentration, time of exposure, concentration or appearance of free active oxygen, temperature and other environmental conditions (Zhang et al, 2015; Nazarenko, Kharytonov, 2016).
This article is a part of our investigation of recurrent mutagen treatment of winter wheat varieties. In previous parts we developed effects of genotype-mutagen interaction after gamma-ray irradiation and nitrosomethilurea (NMU) nitrosoethilurea (NEU), 1,4- bisdiazoatsetilbutan (DAB) (Nazarenko, 2017a; Nazarenko et al, 2017)
Recurrent mutagenesis includes the exposure to mutagen action of progeny of plants that had been treated in previous generation. The strategy of treating the progeny of previously treated plants is well-known as recurrent action. Investigators studied a wide range of mutagens including different types of physical mutagens (different types of radiation) and the chemical mutagen (EMS); the alternation of EMS with irradiation was also studied. The results of these experiments did not bear out the expected results and were at best mixed. In most cases, radiosensitivity, mutation rate and spectra remained unaffected with repeated irradiation of subsequent generations. In our investigations we used other types of chemical mutation factors (nitrosoalkylureas, DAB, DMS) and alteration these mutagens with gamma-rays. We obtained new results according to reduce radiosensetivity, mutagen depression after recurrent mutagenesis and determined some new laws for recurrent mutagen action. In case of mutagen alteration we ran on with trivial, normal reaction on mutagen action (Chaima et al, 2012, Nazaenko, 2017b).
DMS are related to special group of mutagens “supermutagens” too (as classified by Rapoport). Special ability of this group is induction mutations on level of comparable mutagen without high damages, which influence on survival ability of plant material (Jovtcheva et al, 2002; Özel et al, 2015). Supermutagens induct 50-60 times more mutations than relevant by their consequences for surviving and plant development doses of gamma rays or fast neutrons (Albokari, 2014). But DAB in spite of previous chemical mutagens (nitrosoalkylureas), by its action more similar to physical mutagens (like as gamma-rays) than for other chemical mutagens and don’t so site-specific.
Other feature (general for all chemical mutagens) is induction of gen mutations on peculiar DNA-sequence rather than structural changes. It is depends
Consequences of mutagen depression caused by dimethilsulfate 65
on chemical nature of specific mutagen. That’s why chemical mutagenesis is one of the important methods for modern genetics investigations (as for example for reverse genetics, for different types of tilling’s methods). We can predict (in certain limits) more probably types of future mutations with higher rates (according to preferable DNA sequences for mutagen action) (Juchimiuk-Kwasniewska, 2002; Natarajan, 2005).
Mutagenic effects of chemicals have been assessed by both analysis of chromosomal aberrations (Rakhmatullina and Sanamyan, 2007) and investigation plant development and grows at first generation under field conditions.
Parameters traditionally used to estimate the degree of plant injury in the M1 generation are: 1. Seedling height, determined at a particularly stage soon after germination. 2. Root length, determined soon after germination in controlled environment conditions. 3. Emergence under field conditions or germination. 4. Survival under field or controlled environment conditions. 5. Number of florets, flowers or inflorescences per plant. 6. Number of florets or flower parts per inflorescence. 7. Number of seed set. 8. Number of seeds per plant (Khaled et al, 2016; Jankowicz-Cieslak et al, 2017).
Mutated plants typically show reduced fertility, mainly caused by chromosomal changes during meiosis. Plant surviving, pollen fertility and yield structure were studied for identification of mutagen depression evident at first generation (Karthika and Subba, 2006; Nazarenko, 2016; Nazarenko, 2017b).
Analysis of variability of chromosomal aberrations after mutagen action of any type of mutagens by anaphases method is one of the well-known and the most precision methods which we can exploited for determine fact of mutagen action, identify nature of mutagen. For example, this method is widely used as for determine of radionuclide’s pollution of environment, its level, danger of this pollution as for identification optimal doses of radiation and concentrations of chemical mutagens in breeding practice. A relation amid clastogenic adaptation shown in descending of chromatid type of changes, micronuclei and changes in number of chromosomes in cells, and the clastogenic effect has been appeared (Rakhmatullina and Sanamyan, 2007). For crops like wheat, individual tillers (side branches) originate from different cells of the embryo of the treated seeds. If an aberration occurs in one of these cells, it will be carried in the tiller developed from that cell. Influence of different types of chemical mutagens or any type ionizing radiation according to this method can be analyzed by summarized number and kinds of chromosomal damages. Changes in chromosome number and structure in mitotic cells is initiated after mutagen action. Chromosomal changes rank from breaks, through exchanges, laggards and anaphase bridges, dicentric and centric ring formations, terminal fragments with telomeric signal at only one end and interstitial fragments that appear as double minutes without any telomeric signals changes in irradiated mitotic cells (Rakhmatullina, 2007). Both structural and numerical aberrations occur spontaneously due to intraneous and extraneous factors and appear in terms of last mitotic cell division phases (Nikolova et al, 2015).

Nazarenko et al. 66
The main purposes of investigations in this area were determination genotype-mutagen interaction for modern ukrainian winter wheat varieties, identify less sensitive for DMS genotypes and evolution repeated mutagenesis as a method in difference alteration on firs step of mutation breeding program, which limited next stages by quantity of material for breeding.
MATERIAL AND METHODS
Seeds of (in brackets method of obtaining varieties or used mutagens) Favoritka, Lasunya, Hurtovina (irradiation of initial material by gamma rays), line 418, Kolos Mironovschiny (field hybridization), Sonechko (chemical mutagenesis, nitrosodimethilurea (NDMU) 0.005%) and Kalinova (chemical mutagenesis, DAB 0.1%), Voloshkova (termomutagenesis – low plus temperature at plant development stage of vernalizaion has been used as mutagen factor) of winter wheat (Triticum aestivum L.) were subjected to chemical mutagen dimethylsulfate (DМS) – 0.0125, 0.025 and 0.05 % presoaked. Each treatment was comprised of 1000 wheat seeds. Exposition of chemicals mutagens was 18 hours. These concentrations and exposure are optimal for the breeding process that has been repeatedly established earlier. (Ahloowalia et al, 2004; Nazarenko, 2016). Non-treated varieties were used as a check for each variety.
Treated seeds were sown in rows with inter and intra-row spacing of 50 and 15 cm, respectively, to raise the M1 population. M1 plant rows were grown in three replications with check-rows of untreated varieties in every ten-row interval. Data on seed germination and surviving plants were recorded considering whole plots of M1 population. Data on yield structure components (plant height, general number of culms, number of productive culms, spike length, spikelets per spike, number of grain per spike, grain weight per spike and plant, 1000 grains weight) were taken from 50 randomly selected plants of each treatment representing more or less all types of morphological plants (Sanamyan et al, 2010).
The seeds used in this study were of the M0 generation. After mutagen treatment dry seeds were germinated in Petri dishes under 24 – 72 hours (depends on presoaking and mutagen action), temperature +250С. After wards central primary roots were cut and fixed in solution of alcohol and acetic acid (in proportion 3:1) for 24 hours. Fixation material was stored in 70% alcohol solution under temperature 2 0C (20 – 25 roots per variant). Cytological analysis was carried out by the standard method at temporary press-time preparations of root tips (1 – 1.5 mm) stained with acetocarmine (has been prepared by Remsderh). Tissue maceration (if it needs for analysis) was carried out at 45% solution of acetic acid (during 5 minutes on bane-marie under 600С). Anaphase of cell division was observed by light microscope JNAVAL. No less than 500 cells in proper phases of mitosis (anaphase) were observed in each variant, number of samples were about 20 – 25 per variant (Lifang et al, 2001; Rank et al, 2002; Natarajan, 2005; Nikolova et al, 2015).
Mathematical processing of the results was performed by the method of analysis of variance, the variability of the mean difference was evaluated by
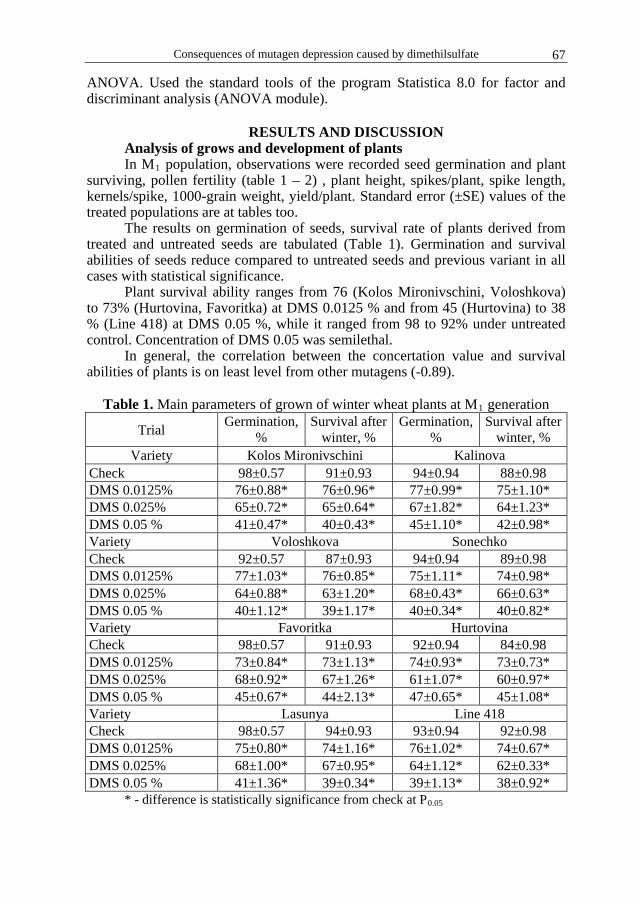
Consequences of mutagen depression caused by dimethilsulfate 67
ANOVA. Used the standard tools of the program Statistica 8.0 for factor and discriminant analysis (ANOVA module).
RESULTS AND DISCUSSION
Analysis of grows and development of plants In M1 population, observations were recorded seed germination and plant
surviving, pollen fertility (table 1 – 2) , plant height, spikes/plant, spike length, kernels/spike, 1000-grain weight, yield/plant. Standard error (±SE) values of the treated populations are at tables too.
The results on germination of seeds, survival rate of plants derived from treated and untreated seeds are tabulated (Table 1). Germination and survival abilities of seeds reduce compared to untreated seeds and previous variant in all cases with statistical significance.
Plant survival ability ranges from 76 (Kolos Mironivschini, Voloshkova) to 73% (Hurtovina, Favoritka) at DMS 0.0125 % and from 45 (Hurtovina) to 38 % (Line 418) at DMS 0.05 %, while it ranged from 98 to 92% under untreated control. Concentration of DMS 0.05 was semilethal.
In general, the correlation between the concertation value and survival abilities of plants is on least level from other mutagens (-0.89).
Table 1. Main parameters of grown of winter wheat plants at M1 generation
Trial Germination,%
Survival after winter, %
Germination,%
Survival after winter, %
Variety Kolos Mironivschini Kalinova Check 98±0.57 91±0.93 94±0.94 88±0.98 DMS 0.0125% 76±0.88* 76±0.96* 77±0.99* 75±1.10* DMS 0.025% 65±0.72* 65±0.64* 67±1.82* 64±1.23* DMS 0.05 % 41±0.47* 40±0.43* 45±1.10* 42±0.98* Variety Voloshkova Sonechko Check 92±0.57 87±0.93 94±0.94 89±0.98 DMS 0.0125% 77±1.03* 76±0.85* 75±1.11* 74±0.98* DMS 0.025% 64±0.88* 63±1.20* 68±0.43* 66±0.63* DMS 0.05 % 40±1.12* 39±1.17* 40±0.34* 40±0.82* Variety Favoritka Hurtovina Check 98±0.57 91±0.93 92±0.94 84±0.98 DMS 0.0125% 73±0.84* 73±1.13* 74±0.93* 73±0.73* DMS 0.025% 68±0.92* 67±1.26* 61±1.07* 60±0.97* DMS 0.05 % 45±0.67* 44±2.13* 47±0.65* 45±1.08* Variety Lasunya Line 418 Check 98±0.57 94±0.93 93±0.94 92±0.98 DMS 0.0125% 75±0.80* 74±1.16* 76±1.02* 74±0.67* DMS 0.025% 68±1.00* 67±0.95* 64±1.12* 62±0.33* DMS 0.05 % 41±1.36* 39±0.34* 39±1.13* 38±0.92*
* - difference is statistically significance from check at P0.05

Nazarenko et al. 68
Correlation between the concentration of mutagens and pollen fertility was -0.82 (table 2). It was significantly higher in comparison to other chemical mutagens. For some varieties such as Hurtovina, line 418 there were not statistically difference between DMS 0.0125 % and untreated check. As we can see from these tables parameters of surviving and pollen fertility are responsible for mutagen action (in spite of DAB) and suitable for evolution mutagen depression in case this mutagen. Table 2. Pollen fertility after mutagen action, %
Trial
Kol
os M
ironi
vsch
ini
Kal
inov
a
Vol
oshk
ova
Sone
chko
Favo
ritka
Hur
tovi
na
Lasu
nya
Line
418
Check 95.0 93.1 89.7 96.7 95.7 98.6 96.8 93.0 DMS 0.0125% 93.8 89.8* 82.3* 83.0* 80.0* 85.3* 83.1* 83.6* DMS 0.025% 92.0* 83.7* 77.3* 78.6* 75.7* 78.6* 70.9* 70.2* DMS 0.05 % 88.7* 78.0* 69.1* 71.2* 65.2* 64.7* 62.6* 58.3*
* - difference is statistically significance from check at P0.05 All parameters of the crop yield structure have been studied. Components
such as plant height, 1000 grain weight, grain weight per plant, number of grains per spike, grain weight per spike, general number of culms, number of productive culms, spike lengths have been developed. Only four (plant height, grain weight per spike, grain weight per plant and 1000 grain weight) showed statistically difference level of mutagen depression under any concentration action.
Regarding the plant height, correlation between the concentration and the indicator constituted -0.82, (high invert correlation). This parameter decreases if the concentration increases. Gradual decrease in height is a tendency for all varieties. Table 3. Correlation between DMS concentrations and some components of yield structure of М1 varieties
Parameter Plant height
Number of culms
Spike lengths
Number of
spikelets
Number of grains per spike
Grain weight
per spike
Grain weight
per plant
1000 grain
weight
Concentr. -0.82 -0.22 0.8 -0.05 -0.64 -0.82 -0.71 -0.91
The indicator of grain weight per spike was informative in case of DMS at all concentrations. The correlation coefficient was -0.82.

Consequences of mutagen depression caused by dimethilsulfate 69
The indicator of grain weight per plant was not so reliable and sometimes in case of low concentration (DMS 0.0125 %) mutagen depression hasn’t been appeared. The correlation coefficient was -0.71.
The thousand grain weight is the most reliable for mutagen depression evaluation (similar as other mutagens). We observed depression in all variants. The correlation coefficient was -0.91 (similar to gamma-rays).
No one variety was statistically more sensitive to DMS action, for all varieties mutagen depression by morphometric parameters was on the comparable level.
Chromosomal aberrations analysis At table 4 we represent dates of the results of next parameters analyzed:
general number of observing mitosis in primary roots tips, number of cells in appreciate phase with visible chromosomal aberrations rearrangements, total rate of chromosomal aberrations. Standard error (± SE) values of the treated variants are shown at table 1 too. As we can see from table 1 frequencies of aberrations were changed from 9,96 % (Lasunya, DMS 0,0125 %) to 29,98 % (line 418, DMS 0,05 %) percent from total number of cells in division in experimental microscope samples. All the variants are statistically substantially dissimilar from each other and from the check.
In spite of previous investigation level of rates of aberrations in any cases peculiar to varieties obtained by chemical mutation breeding (Sonechko, Kalinova) didn’t differ from other varieties and we can predict that rates of mutations at next generations wouldn’t change. The higher frequency of aberrations has been obtained by used DMS 0.05 % as usual. It gives us a possibility to conclude about high level of specific of genotype-mutagen interaction (for chemical mutagens) and confirm that only sensitive to chemical mutagen (or very closely related by nature) which used for obtaining this genotype is lower under re-exposure.
Rates of chromosomal aberrations in all cases were on comparable level. No one variety didn’t stand out against other. Influence of DMS is compared with gamma-rays (in spite of other chemical mutagens) and, not only by aberration rates, but by parameters of spectra of chromosomal aberrations is very similar to gamma-irradiated. We can range mutagens in next sequence by its genetic activity (from least to pick) DAB → NEU → NMU → gamma-rays, DMS.
From the Table 3 we can see that we cannot identify in any way varieties or group of varieties more or less sensitive to DMS action. Changeability on cell level was on comparable mean for all genotypes. Distinct from previous investigation not recurrent, only repeat mutagen action doesn’t depend on object genotype. We developed next types of aberrations of chromosomes after investigation of spectra in our samples: chromosomal bridges and double-bridges, fragments of chromosomes and double-fragments, micronucleus, lagging chromosomes. Cases with complicated aberrations (two or more kinds of changes
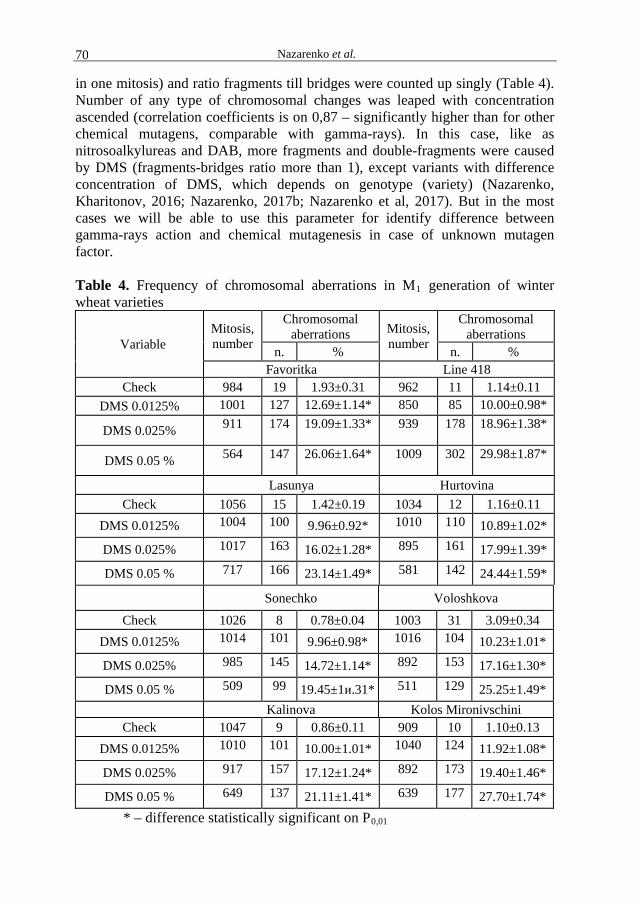
Nazarenko et al. 70
in one mitosis) and ratio fragments till bridges were counted up singly (Table 4). Number of any type of chromosomal changes was leaped with concentration ascended (correlation coefficients is on 0,87 – significantly higher than for other chemical mutagens, comparable with gamma-rays). In this case, like as nitrosoalkylureas and DAB, more fragments and double-fragments were caused by DMS (fragments-bridges ratio more than 1), except variants with difference concentration of DMS, which depends on genotype (variety) (Nazarenko, Kharitonov, 2016; Nazarenko, 2017b; Nazarenko et al, 2017). But in the most cases we will be able to use this parameter for identify difference between gamma-rays action and chemical mutagenesis in case of unknown mutagen factor.
Table 4. Frequency of chromosomal aberrations in M1 generation of winter wheat varieties
Variable Mitosis, number
Chromosomal aberrations Mitosis,
number
Chromosomal aberrations
n. % n. % Favoritka Line 418
Check 984 19 1.93±0.31 962 11 1.14±0.11 DMS 0.0125% 1001 127 12.69±1.14* 850 85 10.00±0.98*
DMS 0.025% 911 174 19.09±1.33* 939 178 18.96±1.38*
DMS 0.05 % 564 147 26.06±1.64* 1009 302 29.98±1.87*
Lasunya Hurtovina Check 1056 15 1.42±0.19 1034 12 1.16±0.11
DMS 0.0125% 1004 100 9.96±0.92* 1010 110 10.89±1.02*
DMS 0.025% 1017 163 16.02±1.28* 895 161 17.99±1.39*
DMS 0.05 % 717 166 23.14±1.49* 581 142 24.44±1.59*
Sonechko Voloshkova
Check 1026 8 0.78±0.04 1003 31 3.09±0.34 DMS 0.0125% 1014 101 9.96±0.98* 1016 104 10.23±1.01*
DMS 0.025% 985 145 14.72±1.14* 892 153 17.16±1.30*
DMS 0.05 % 509 99 19.45±1и.31* 511 129 25.25±1.49* Kalinova Kolos Mironivschini
Check 1047 9 0.86±0.11 909 10 1.10±0.13 DMS 0.0125% 1010 101 10.00±1.01* 1040 124 11.92±1.08*
DMS 0.025% 917 157 17.12±1.24* 892 173 19.40±1.46*
DMS 0.05 % 649 137 21.11±1.41* 639 177 27.70±1.74* * – difference statistically significant on P0,01

Consequences of mutagen depression caused by dimethilsulfate 71
Number of complicated (or combined) aberrations was significantly higher as well as micronucleus and lagging chromosomes then for previous mutagens. Moreover, in some cases number of complicated aberrations was more than for gamma-rays. But for some varieties we cannot observe any difference with this parameter between DMS 0,025 % and 0,05 %. Generally, when concentration of DMS was increased the rate of fragments and bridges also has increased. Complicated aberrations for this type of action is a value parameter for mutagen influence evaluation. Significance of parameters was satisfied by discriminant analyze (table 5). Table 5. Results of discriminant analysis parameters of rate and spectra of chromosomes rearrangements
Parameter in model λ F-remove (4,51)
p-level
Rate of aberrations 0.61 9.01 0.00 Fragments (single and double) 0.44 7.12 0.01 Bridges (chromosome and chromatide)
0.31 6.03 0.02
Micronucleus, lagging chromosomes 0.07 0.89 0.35 Complicated aberrations 0.22 5.83 0.04
The results of two-factor analysis (“genotype” and “concentration” shown
us that, prevalently, on the rate of chromosome aberrations factor “concentration” influenced, the “genotype”. Genotype strong influenced on parameter fragments/bridges ratio (F= 18.92; Fcr= 4.92; p-level 0.01; F= 12.64; Fcr= 4.92; p-level 0.01).
Thus, we developed that repeated exposure to the other mutagen (DMS on the variety obtained by the action of other mutagen) doesn’t lead to important difference between genotypes.
Thereby, investigation of DMS action confirmed reliability of fragments-bridges ratio (prevalence of fragments under bridges for chemical mutagens and vise versa for gamma-rays) for mutagen nature identification. Complicated (or combined) aberrations is a valuable parameter for dose evaluation under DMS action. Genotype-mutagen interaction has been shown in bridge – fragments ratio. Previous rules for other mutagens were confirmed for DMS (with some peculiarities).
CONCLUSIONS
The most informative parameters to determine the degree of mutagenic depression in the first generation for plant growth and development were germination and survival rates, pollen sterility, grain weight per spike, 1000 grain weight, less reliable grain weight per plant. Therefore, chemical mutation varieties are not sensible for to repeated action with other mutagen, then used for obtained initial variety.

Nazarenko et al. 72
DMS as a mutagen substantially higher in mutagen depression parameters induction in comparison with previous chemical mutagens and comparable with gamma-rays irradiated. We ranged mutagens in next sequence (from least to pick) DAB → NEU → NMU → gamma-rays, DMS. We can predict numder of mutations at next generations on the level similar to gamma-rays.
To sum it up, DMS as a mutagen substantially stronger in chromosomal aberrations induction in comparison with previous chemical mutagens (DAB and nitrosoalkylureas) and compare with gamma-rays by its action on cells. We ranged mutagens in next sequence (from least to pick) DAB → NEU → NMU → gamma-rays, DMS. We can predict high level of gens changes if we use DMS for mutation breeding purpose.
Repeated action of chemical mutagen doesn’t lead to the same consequences for mutation varieties as recurrent action. There isn’t any statistical significance difference between genotypes regarding method of breeding.
Comparing between bridges and fragments after DMS action confirmed reliability of fragments-bridges ratio (prevalence of fragments under bridges for chemical mutagens and opposite situation for gamma-rays) for mutagen nature identification, but for this mutagen other situation may observance in case of some genotypes (0.9 – 1.0). In spite of other mutagens, for DMS genotype-mutagen interaction has been shown in such way. In general, the rate of chromosomal aberrations is linearly increased with increase concentration of the mutagen.
REFERENCES
Albokari M., 2014. Induction of mutants in durum wheat using gamma irradiation. In: Pakistan Journal of Botany, 46, 317–324.
Bolzaґn, A. D., Bianchi, M. S., 2006. Telomeres, interstitial telomeric repeat sequences, and chromosomal aberrations. In: Mutation Research, 612, 189 – 214.
Chaima, S., Girard, L., Ezzeddine, F., Pascale, G., 2012. Exposure of Vicia faba to sulcotrione pesticide induced genotoxicity. In: Pesticide Biochemistry and Physiology, 103, 9–14.
Jovtcheva, G., Stergiosa, M., Schubert, I., 2002. A comparison of N-methyl-N-nitrosourea-induced chromatid aberrations and micronuclei in barley meristems using FISH techniques. In: Mutation Research, 517, 47–51.
Juchimiuk-Kwasniewska, J., Brodziak, L., Maluszynska, J., 2011. FISH in analysis of gamma ray-induced micronuclei formation in barley. In: Journal of Applied Genetics, 52, 23–29.
Jankowicz-Cieslak I., Tai T. H., Kumlehn J., Till B. J., (Editors), (2017). Biotechnologies for Plant Mutation Breeding, International Atomic Energy Agency, Vienna.
Huaili Q., Lanming X., Fei H., 2005. Biological effect of the seeds of Arabidopsis thaliana irradiated by MeV protons. In: Radiation Effects & Defects in Solids, 160, 131–136.
Karthika I R., Subba B., 2006. Effect of Gamma Rays and EMS on Two varieties of Soybean. In: Asian Journal of Biological Sciences, 5, 721–724.
Khaled, H., Anderson, D., Brinkworth, M., 2016. Detection of phase specificity of in vivo germ cell mutagens in an in vitro germ cell system. In: Toxicology, 16, 1–10.
Consequences of mutagen depression caused by dimethilsulfate 73
Lifang Y., Zengliang W., 2001. Radiobiological effects of a low-energy ion beam on wheat. In: Radiat Environ Biophys, 40, 53–57.
Mangi N., Baloch A. W., Arain S.M., Baloch M., Kandhro M.N., Abro T. F., BALOCH S. N., Mari S.N. (2016). Evaluation of Advance Mutant Genotypes and Interrelationship Analysis of Yield and Yield Associated Traits in Bread Wheat Genotypes. Sindh university research journal (Science Series), 48, 3, 783–786.
Natarajan, A.T., 2005. Chromosome aberrations: Plants to human and feulgen to FISH. In: Current Science 89, 335-340.
Nazarenko, M., 2016. Parameters of winter wheat growing and development after mutagen action. In: Bulletin of Transilvania University of Brasov - series II – Forestry, Wood Industry, Agricultural, Food Engineering, 9 (58), 2, 109–116.
Nazarenko, M., Kharytonov, M., 2016. Characterization of wheat mutagen depression after gamma-rays irradiated. In: Agriculture and Forestry, 62, 4, 267–276.
Nazarenko, M., 2017. Specific Features in the Negative Consequences of a Mutagenic Action. In:Russian Journal of Genetics: Applied Research, 7, 2, 195–196.
Nazarenko, M., Lykholat Y., Grigoryuk I., Andrusevych K., 2017. Mutagen depression after recurrent chemical mutagen action at first winter wheat generation. In: Agriculture and Forestry. 63, 2, 161 –170.
Nazarenko, M., 2017. Influence of nitrosoalkylureas on winter wheat plants at first generation after mutagen action. In: Agriculture and Forestry, 63, 1, 319–328.
Nikolova, I., Georgieva, M., Kruppa, K., Molnor-Long, M., Liu, L., Manova, V., Stoilov, L., 2015. Cytogenetic effects in barley root apical meristem after exposure of dry seeds to lithium ion beams. In: Genetics and Plant Physiology, 5, 3 – 9.
Özel, H.B., Kirdar, E., Bilir, N. 2015. The effects of magnetic field on germination of the seeds of oriental beech (Fagus orientalis Lipsky.) and growth of seedlings. Agriculture and Forestry, 61 (3): 195-206.
Rakhmatullina, E.M., Sanamyan, M.F., 2007. Estimation of efficiency of seed irradiation by thermal neutrons for inducing chromosomal aberration in M2 of cotton Gossypium hirsutum L. In: Russian Journal of Genetics 43(5), 518-524.
Rank, J., Lopez, L.C., Nielsen M.H., 2002. Genotoxicity of maleic hydrazide, acridine and DEHP in Allium cepa root cells performed by two different laboratories. In: Hereditas 136, 13–18.
Sanamyan, M. F., Petlyakoval, J. E., Sharipoval, E. A., Abdurakhmonov, I. Y., 2010. Morphological characteristics and identification of new monosomic stocks for cotton (Gossypium hirsutum L.) In: Advances in Bioscience and Biotechnology 1, 372-383.
Shu, Q.Y., Forster B.P., Nakagava H., 2011 Plant Mutation breeding and Biotechnology, Vienna, CABI publishing.
Zhang, J., Jiang, Y., Guo, Y., Li, G., Yang, Z., Xu, D., 2015. Identification of Novel Chromosomal Aberrations Induced by 60Co-γ-Irradiation in Wheat-Dasypyrum villosum Lines. In: International Journal of Molecular Sciences, 16, 29787–29796.

Agriculture & Forestry, Vol. 63 Issue 3: 75-84, 2017, Podgorica 75
DOI: 10.17707/AgricultForest.63.3.08 Valentina PELIVANOSKA, Biljana JORDANOSKA-ŠIŠKOSKA, Ilija RISTESKI, Jordan TRAJKOSKI1
SOME MANUFACTURING PROPERTIES OF SEMI-ORIENTAL TOBACCOS BRED IN THE REGION OF PRILEP,
WESTERN MACEDONIA
SUMMARY The need for this research was imposed by the increased interest of
tobacco companies to restart production of semi-oriental tobacco in R. Macedonia. The aim of the research was to study the impact of agrotechnics on some manufacturing properties of semi-oriental varieties Otlja O9-18/2 and Otlja-Zlatovrv produced in agro-ecological conditions of the Prilep production region. Three-year trial was set up on deluvial-colluvial soil type in 12 variants with three replications. The trial was bi-factorial, with three rates of nitrogen (25, 30 and 45 kg N/ha), constant amount of phosphorus (80 kg/ha) and potassium (100 kg/ha) and two irrigation regimes (45 and 60% FC). The following characteristics were subject of investigation: dry tobacco yield per hectare, plant height, leaf number per stalk and average length/width of the fifth, tenth and fifteenth leaf. The obtained results confirm that fertilization and irrigation have positive impact on the manufacturing properties of both varieties. Compared to the check variety, the yield was increased by 86.89% in Otlja O9-18/2 and 89.98% in Otlja-Zlatovrv variety. Fertilization and irrigation have statistically significant impact on the increase of plant height in all three years of investigations. Regarding the character leaf number per stalk, the applied agricultural practices did not show statistical significance at 5% only in 2008. Fertilization and irrigation have positive impact on increase of the leaf length, width and their average relative surface. Based on the results it can be concluded that the manufacturing properties of semi-oriental tobacco can be managed by application of proper agrotechnics. It can be concluded that the yield and quality of semi-oriental tobacco can be improved by application of proper agrotechnics.
Keywords: Semi-oriental tobacco, fertilization, irrigation, manufacturing properties.
INTRODUCTION Semi-oriental tobacco is characterized by fine leaf tissue, low midrib
content and good yield. In fabrication, it is treated as neutral raw material with
1Valentina Pelivanoska (corresponding author: [email protected]), Biljana Jordanoska-Šiškoska Department of agrotechnics, Scientific Tobacco Institute – Prilep, Kičevska bb, Prilep, MACEDONIA. Ilija Risteski, Department of genetics, selection and seed control, Scientific Tobacco Institute – Prilep, Kičevska bb, Prilep, MACEDONIA. Jordan Trajkoski Department of agrotechnics, Scientific Tobacco Institute – Prilep, Kičevska bb, Prilep, MACEDONIA. Notes: The authors declare that they have no conflicts of interest. Authorship Form signed online.

Pelivanoska et al. 76
full, sweet to neutral flavour that does not burn and scratches the throat while smoking. Therefore, Otlja tobacco is marked as an additional type of tobacco (Uzunoski, 1985). Dry tobacco is used in cigarette manufacture to improve the taste and charge (Naumoski et al., 1977). The same author highlights that, due to the great taste, very good thread, good combustion etc., the variety Otlja stands in front of Virginia tobacco variety’s (Naumoski, 1985).
In R. Macedonia varieties Otlja O9-18/2 and Otlja-Zlatovrv are grown in Kumanovo, Tetovo and Skopje production area. Semi-oriental tobaccos are also grown in Kosovo (Prizren and Dzakovica region), South Serbia and Montenegro (Uzunoski, 1985). According to Klikovac (Klikovac, 1994), soil in most parts of Montenegro is suitable for production of semi-oriental tobacco variety’s such as Ravnjak, Tanche, Krajina, as well as local varieties such as Lekichi, Momichishi, Cheginovac etc.
Semi-oriental tobacco Otlja accounts for 25% of cigarette mixture. In the Republic of Macedonia, Otlja tobacco has been produced for a long period of time on restricted areas. Morphological properties of semi-oriental tobaccos are closely related to their quality properties and use value (Bogdanceski, 1981).
Spasovski points out that Otlja tobacco is grown as an additional material (Spasovski, 1957). Its lower, middle and upper middle leaves are ranked as first-class material and by application of proper agrotechnics, irrigation and curing a high-quality tobacco material can be obtained. Patche reported that Otlja tobacco should be grown on slope, light, permeable and loose soils, which provide good conditions for watering (Patche, 1960).
The increased interest of tobacco companies along with rational production of this tobacco, its use value in fabrication and the ability to burn without removing the leaf midrib (which is not the case with large-leaf tobaccos) is yet another reason for increased production of the semi-oriental tobacco in R. Macedonia.
The main objective of our research was to study the influence of fertilization and watering upon manufacturing properties of the semi-oriental varieties Otlja O9-18/2 and Оtlja-Zlatovrv and to make contribution to the prospects for production of these varieties in the producing region of Prilep.
MATERIALS AND METHODS Three-year field trials (2007-2009) with semi-oriental tobacco varieties
Otlja O9-18/2 and Otlja-Zlatovrv were performed on the experimental field of the Scientific Tobacco Institute – Prilep. The experiment was bi-factorial, with three different nitrogen fertilizer rates (25, 30 and 45 kg N/ha), constant amounts of phosphorus (80 kg/ha), potassium (100 kg/ha) and two irrigation regimes (45% and 60% FWC), set up in randomized complete block design with three replications. The following variants were included (Table 1):
Soil preparation was performed with one autumn (30 cm depth) and two spring ploughings (8-20 cm depth). Before the trial was set up, the soil was tested to determine its agrochemical and physical properties.
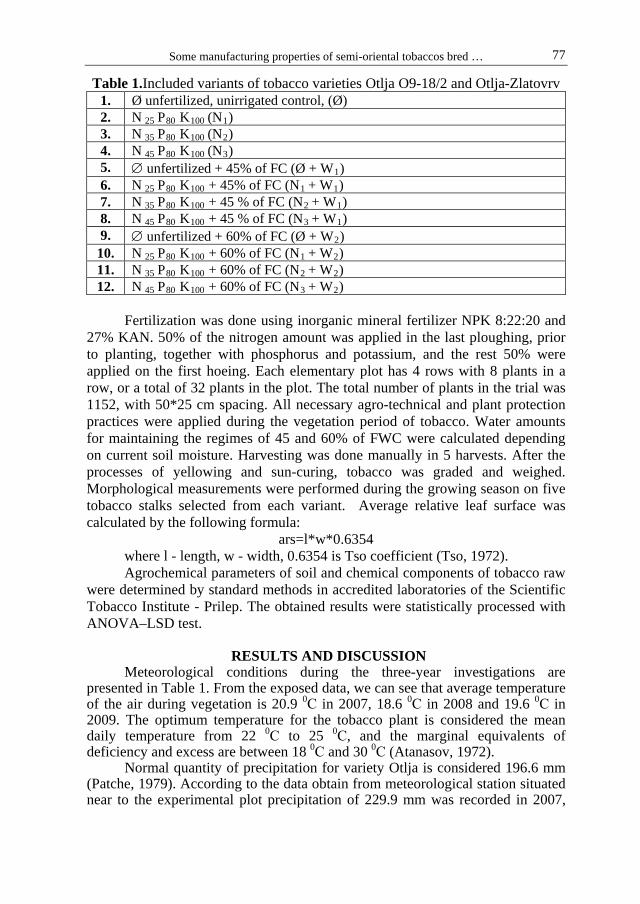
Some manufacturing properties of semi-oriental tobaccos bred … 77
Table 1.Included variants of tobacco varieties Otlja O9-18/2 and Otlja-Zlatovrv 1. Ø unfertilized, unirrigated control, (Ø) 2. N 25 P80 K100 (N1) 3. N 35 P80 K100 (N2) 4. N 45 P80 K100 (N3) 5. ∅ unfertilized + 45% of FC (Ø + W1) 6. N 25 P80 K100 + 45% of FC (N1 + W1) 7. N 35 P80 K100 + 45 % of FC (N2 + W1) 8. N 45 P80 K100 + 45 % of FC (N3 + W1) 9. ∅ unfertilized + 60% of FC (Ø + W2)
10. N 25 P80 K100 + 60% of FC (N1 + W2) 11. N 35 P80 K100 + 60% of FC (N2 + W2) 12. N 45 P80 K100 + 60% of FC (N3 + W2)
Fertilization was done using inorganic mineral fertilizer NPK 8:22:20 and
27% KAN. 50% of the nitrogen amount was applied in the last ploughing, prior to planting, together with phosphorus and potassium, and the rest 50% were applied on the first hoeing. Each elementary plot has 4 rows with 8 plants in a row, or a total of 32 plants in the plot. The total number of plants in the trial was 1152, with 50*25 cm spacing. All necessary agro-technical and plant protection practices were applied during the vegetation period of tobacco. Water amounts for maintaining the regimes of 45 and 60% of FWC were calculated depending on current soil moisture. Harvesting was done manually in 5 harvests. After the processes of yellowing and sun-curing, tobacco was graded and weighed. Morphological measurements were performed during the growing season on five tobacco stalks selected from each variant. Average relative leaf surface was calculated by the following formula:
ars=l*w*0.6354 where l - length, w - width, 0.6354 is Tso coefficient (Tso, 1972). Agrochemical parameters of soil and chemical components of tobacco raw
were determined by standard methods in accredited laboratories of the Scientific Tobacco Institute - Prilep. The obtained results were statistically processed with ANOVA–LSD test.
RESULTS AND DISCUSSION Meteorological conditions during the three-year investigations are
presented in Table 1. From the exposed data, we can see that average temperature of the air during vegetation is 20.9 0С in 2007, 18.6 0С in 2008 and 19.6 0С in 2009. The optimum temperature for the tobacco plant is considered the mean daily temperature from 22 0С to 25 0С, and the marginal equivalents of deficiency and excess are between 18 0С and 30 0С (Atanasov, 1972).
Normal quantity of precipitation for variety Otlja is considered 196.6 mm (Patche, 1979). According to the data obtain from meteorological station situated near to the experimental plot precipitation of 229.9 mm was recorded in 2007,

Pelivanoska et al. 78
183.3 mm in 2008 and 196.0 mm in 2009. In all years there was irregular pattern of precipitation.
During the warmest months (July and August) when the tobacco need for water is at its peak, there were long periods without precipitation. Without irrigation, was impossible to secure normal growth and profitable yield. To eliminate the negative effect of drought, in all observed periods, 4 irrigations were set with different quantity of water for the variants with 45% and 60% of the PVK, depending on the current humidity in the soil.
Table 2. Meteorological data during the growing season
Month Year Average air
temperature (o С) Precipitations mm
Days with precipitations Daily Min Max
Average/Total (V - IX)
2007 20.9 14.4 27.4 229.9 33 2008 19.7 11.9 28.1 183.3 29 2009 18.9 11.8 27.5 196.0 35
Annual average
2007-2009 19.8 12.7 27.7 203.1 32 1999 -2008 19.9 13.4 26.5 205.7 34
According to the obtained data (Table 2), the soil is poorer and will not
meet the needs of semi-oriental tobacco, so it can be expected that fertilization and irrigation will give a more pronounced effect. For the medium-leaf (semi-oriental) and for large leaf tobaccos, a richer in nutrition soils are needed, as they are expected to provide bigger organic production (Lazareski et. al., 1982).
Table 3. Agrochemical properties of the soil
Depth (cm) pH Humus %
mg/100 g soil Physical clay, % H2O KCl P2O5 K2O 0 - 30 6.64 5.98 0.81 15.69 13.30 24.5
30 - 60 6.46 5.78 0.65 11.81 12.22 26.8
Classification Low acid
Moderately acid Low Medium Medium Light loamy
According to Risteski (Risteski et.al., 2013), the yield is a very important
segment in tobacco production which directly affects the productional costs and net profit of the farmers Irrigation and fertilization as basic agro-technic activities have the purpose to increase yield and quality of the tobacco. Yield and quality of tobacco, with the genetic potential of cultivar, significantly depend on the current soil fertility, applied agricultural practices and climatic conditions during the vegetation period correlate with water and nutrition deficit in the soil (Turšić 2010, Pelivanoska 2012, Kochovska 2014). Tobacco yield mainli depends on leaves, their number and size (Risteski et. al 2017). Fertilization and irrigation, separately as well as their interaction had strong influence in yield growth compared to the control (Table 4).
From the results, it can be noted that increase in yield correlates with the increase of nitrogen quantities. Fertilized varieties with the highest quantity of nitrogen had yield increase of 29.35% and 26.68% respectively, as opposite to

Some manufacturing properties of semi-oriental tobaccos bred … 79
the control. Irrigation without fertilisation increased the yield for 15%. Lower effects are due to lower nutritional values of the soil on which examinations were conducted.
Table 4. Average tobacco yield (kg/ha)
No Variant О9-18/2
2007 2008 2009 _ Х
Difference Aps %
1 Ø 38.33 39.70 42.47 40.17 - 100,00 2 N1 41.33 48.80 44.41 44.85 +4.68 111.64 3 N2 42.67 55.37 45.37 47.80 +7.63 119.00 4 N3 49.33 60.47 47.00 52.27 +12.10 130.11 5 Ø+W1 69.33 58.33 64.00 63.89 +23.72 159.05 6 N 1+W1 69.33 61.67 66.00 65.67 +25.50 163.47 7 N 2+W1 75.77 65.00 68.33 69.70 +29.53 173.51 8 N3 +W1 76.90 76.67 79.40 77.66 +37.49 193.32 9 Ø+W2 74.67 62.33 65.67 67.56 +27.39 168.17 10 N 1+W2 73.67 70.00 69.03 70.90 +30.73 176.50 11 N 2+W2 81.00 73.33 67.34 73.89 +33.72 183.95 12 N3+W2 82.67 76.67 79.33 79.56 +39.39 198.05
No Variant
Оtlja-Zlatovrv
2007 2008 2009 _ Х Difference
Aps. % 1 Ø 78.33 51.00 78.67 69.33 - 100,00 2 N1 79.00 54.33 80.80 71.38 +2.05 102.95 3 N2 90.00 56.67 100.67 82.44 +13.11 118.92 4 N3 97.33 58.33 101.67 85.78 +16.45 123.72 5 Ø+W1 155.67 109.00 127.33 130.67 +61.34 188.47 6 N 1+W1 178.67 126.67 134.33 146.56 +77.23 211.39 7 N 2+W1 149.67 135.00 143.67 142.78 +73.45 205.94 8 N3 +W1 148.00 145.00 151.67 148.22 +78.89 213.79 9 Ø+W2 168.00 138.33 135.00 147.11 +77.78 212.19 10 N 1+W2 176.00 143.33 151.67 157.00 +87.67 226.45 11 N 2+W2 176.00 150.00 157.33 161.11 +91.78 232.38 12 N3+W2 177.00 153.33 162.33 164.22 +94.89 236.87
Interaction effect from fertilization and irrigation is manifested with yield
increase from 40.99% (var. 7) to 88.98% (var. 12) at O9-18/2 and from 5.17% to 89.99% respectively at variety Otlja-Zlatovrv. Based on the conducted statistical analysis on yearly yield it can be concluded that variants fertilized, irrigated as well as fertilized and irrigated have statistically significant influence at all three levels of probability, which indicated on total justification of the used agro-technical measures in cultivation of Otlja variety.
According to Uzunoski (1985) height of plants from the standard variety Otlja O9-18/2 is in the range from 50 cm to 70 cm, and that of the Otlja-Zlatovrv variety from 80 cm to 100 cm. In conducted research height of the control plants (unfertilized, unirrigated) was lower. Height of the Otlja O9-18/2 plants, with inflorescence was 40.17 cm, and the height of the Otlja-Zlatovrv was 69.33 cm.

Pelivanoska et al. 80
Fertilization and irrigation had significant positive effect on the plants heights within all examined varieties. Highest plants were measured within variant 12, where height of Otlja O9-18/2 was increased by 98.05%, and height of the Otlja-Zlatovrv was increased by 136.87%. Applied agro-technics produced better effects within the newer Otlja-Zlatovrv variety compared with the standard Otlja O9-18/2 variety.
Table 5. Height of the stalk with inflorescence (in cm)
No Variant О9-18/2
2007 2008 2009 _ Х
Difference Aps %
1 Ø 21.00 21.33 21.00 21.11 - 100,00 2 N 1 23.67 22.33 23.33 23.11 +2.00 109.48 3 N 2 24.67 23.33 23.33 23.78 +2.67 112.64 4 N3 25.33 23.33 24.00 24.22 +3.11 114.74 5 Ø+W1 22.33 23.67 23.33 23.11 +2.00 109.48 6 N 1+W1 24.33 24.00 25.33 24.56 +3.45 116.32 7 N 2+W1 25.33 25.00 26.33 25.56 +4.45 121.06 8 N3 +W1 24.67 25.00 27.00 25.56 +4.45 121.06 9 Ø +W2 24.67 23.00 23.00 23.56 +2.45 111.58
10 N 1+W2 26.33 23.33 25.00 24.89 +3.78 117.90 11 N 2+W2 26.67 23.67 25.33 25.22 +4.11 119.48 12 N3+W2 27.33 23.67 26.33 25.78 +4.67 122.11
No Variant
Оtlja-Zlatovrv
2007 2008 2009 _ Х Difference
Aps. % 1 Ø 30.33 30.00 30.00 30.11 - 100,00 2 N 1 32.33 31.67 31.00 31.67 +1.56 105.17 3 N 2 32.67 31.67 33.33 32.56 +2.45 108.12 4 N3 33.00 32.67 32.33 32.67 +2.56 108.49 5 Ø+W1 33.33 31.33 29.67 31.44 +1.33 104.43 6 N 1+W1 34.00 32.33 31.67 32.67 +2.56 108.49 7 N 2+W1 35.00 33.67 31.00 33.22 +3.11 110.34 8 N3 +W1 35.33 34.67 31.33 33.78 +3.67 112.18 9 Ø +W2 32.67 30.67 29.67 31.00 +0.89 102.96
10 N 1+W2 35.33 31.00 32.00 32.78 +2.67 108.86 11 N 2+W2 35.00 32.33 33.00 33.44 +3.33 111.07 12 N3+W2 36.00 34.00 33.67 34.56 +.45 114.76
According the obtained results (Table 6) and according classification by
Uzunoski (Uzunoski, 1985), examined semi-oriental tobacco varieties, belongs in the middle group based on the number of leaves (23-35 leaves). The number of leaves by plant varies according to the growth conditions and applied agro-technical measures, and is in the boundaries of genetic potential. The number of leaves at Otlja O9-18/2 is ranges from 22.11 (control) to 25.78 (variant 12), where applied agro-technical measures increased the number of leaves by

Some manufacturing properties of semi-oriental tobaccos bred … 81
22.11%. The number of leaves at Otlja-Zlatovrv ranges from 30.11 (control) to 34.56 (variant 12) and applied agro-technical measures increased the number of leaves by 14.76%. This characteristic does not show statistically significant results at a 0.05% level, only in 2008. Mitreski (Mitreski, 2012) point out that number of leaves on stalk is variable from stalk to stalk but this qualitative attribute is variety characteristic. According to Atanasov (Atanasov, 1972) number of leaves within a selected variety is mostly constant.
Based on the results it can be concluded that fertilization and irrigation have positive impact on height increase of the plant and the number of leaves on ply within both varieties.
Table 6. Leaf number per stalk
No Variant О9-18/2
2007 2008 2009 x¯ Difference Aps %
1 Ø 21.00 21.33 21.00 21.11 - 100,00 2 N 1 23.67 22.33 23.33 23.11 +2.00 109.48 3 N 2 24.67 23.33 23.33 23.78 +2.67 112.64 4 N3 25.33 23.33 24.00 24.22 +3.11 114.74 5 Ø+W1 22.33 23.67 23.33 23.11 +2.00 109.48 6 N 1+W1 24.33 24.00 25.33 24.56 +3.45 116.32 7 N 2+W1 25.33 25.00 26.33 25.56 +4.45 121.06 8 N3 +W1 24.67 25.00 27.00 25.56 +4.45 121.06 9 Ø +W2 24.67 23.00 23.00 23.56 +2.45 111.58
10 N 1+W2 26.33 23.33 25.00 24.89 +3.78 117.90 11 N 2+W2 26.67 23.67 25.33 25.22 +4.11 119.48 12 N3+W2 27.33 23.67 26.33 25.78 +4.67 122.11
No Variant Оtlja-Zlatovrv
2007 2008 2009 Difference Aps. %
1 Ø 30.33 30.00 30.00 30.11 - 100,00 2 N 1 32.33 31.67 31.00 31.67 +1.56 105.17 3 N 2 32.67 31.67 33.33 32.56 +2.45 108.12 4 N3 33.00 32.67 32.33 32.67 +2.56 108.49 5 Ø+W1 33.33 31.33 29.67 31.44 +1.33 104.43 6 N 1+W1 34.00 32.33 31.67 32.67 +2.56 108.49 7 N 2+W1 35.00 33.67 31.00 33.22 +3.11 110.34 8 N3 +W1 35.33 34.67 31.33 33.78 +3.67 112.18 9 Ø +W2 32.67 30.67 29.67 31.00 +0.89 102.96
10 N 1+W2 35.33 31.00 32.00 32.78 +2.67 108.86 11 N 2+W2 35.00 32.33 33.00 33.44 +3.33 111.07 12 N3+W2 36.00 34.00 33.67 34.56 +.45 114.76
LSD 2007 2008 2009 2007 2008 2009 0.05 2.02 n.s. 2.10 2.32 n.s. 1.94 0.01 n.s. n.s. n.s. 3.15 n.s. n.s.
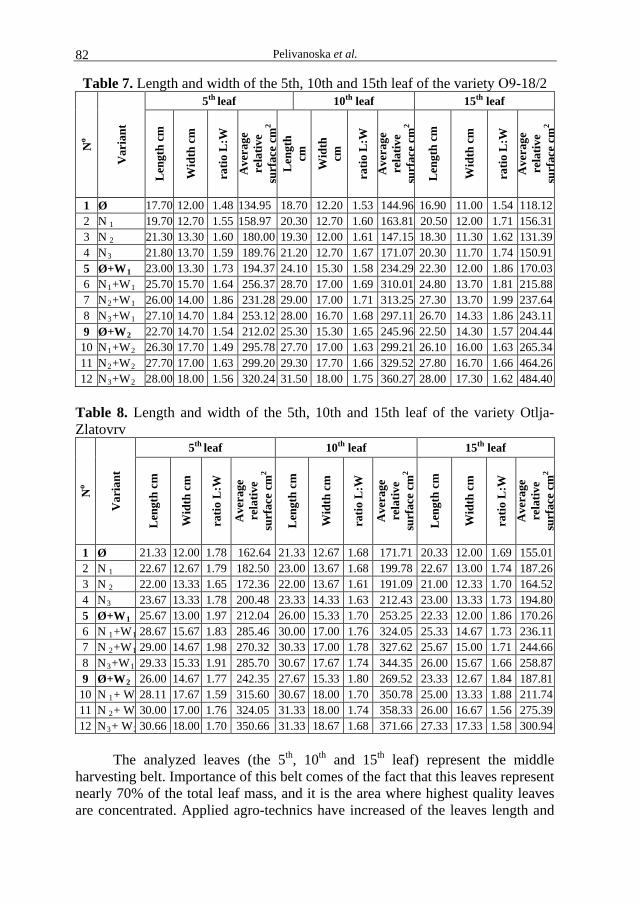
Pelivanoska et al. 82
Table 7. Length and width of the 5th, 10th and 15th leaf of the variety О9-18/2 N
o
Var
iant
5th leaf 10th leaf 15th leaf
Len
gth
cm
Wid
th c
m
ratio
L:W
Ave
rage
re
lativ
e su
rfac
e cm
2 L
engt
h cm
Wid
th
cm
ratio
L:W
A
vera
ge
rela
tive
surf
ace
cm2
Len
gth
cm
Wid
th c
m
ratio
L:W
A
vera
ge
rela
tive
surf
ace
cm2
1 Ø 17.70 12.00 1.48 134.95 18.70 12.20 1.53 144.96 16.90 11.00 1.54 118.12 2 N 1 19.70 12.70 1.55 158.97 20.30 12.70 1.60 163.81 20.50 12.00 1.71 156.31 3 N 2 21.30 13.30 1.60 180.00 19.30 12.00 1.61 147.15 18.30 11.30 1.62 131.39 4 N3 21.80 13.70 1.59 189.76 21.20 12.70 1.67 171.07 20.30 11.70 1.74 150.91 5 Ø+W1 23.00 13.30 1.73 194.37 24.10 15.30 1.58 234.29 22.30 12.00 1.86 170.03 6 N1+W1 25.70 15.70 1.64 256.37 28.70 17.00 1.69 310.01 24.80 13.70 1.81 215.88 7 N2+W1 26.00 14.00 1.86 231.28 29.00 17.00 1.71 313.25 27.30 13.70 1.99 237.64 8 N3+W1 27.10 14.70 1.84 253.12 28.00 16.70 1.68 297.11 26.70 14.33 1.86 243.11 9 Ø+W2 22.70 14.70 1.54 212.02 25.30 15.30 1.65 245.96 22.50 14.30 1.57 204.44 10 N1+W2 26.30 17.70 1.49 295.78 27.70 17.00 1.63 299.21 26.10 16.00 1.63 265.34 11 N2+W2 27.70 17.00 1.63 299.20 29.30 17.70 1.66 329.52 27.80 16.70 1.66 464.26 12 N3+W2 28.00 18.00 1.56 320.24 31.50 18.00 1.75 360.27 28.00 17.30 1.62 484.40
Table 8. Length and width of the 5th, 10th and 15th leaf of the variety Otlja-Zlatovrv
No
Var
iant
5th leaf 10th leaf 15th leaf
Len
gth
cm
Wid
th c
m
ratio
L:W
Ave
rage
re
lativ
e su
rfac
e cm
2
Len
gth
cm
Wid
th c
m
ratio
L:W
Ave
rage
re
lativ
e su
rfac
e cm
2
Len
gth
cm
Wid
th c
m
ratio
L:W
A
vera
ge
rela
tive
surf
ace
cm2
1 Ø 21.33 12.00 1.78 162.64 21.33 12.67 1.68 171.71 20.33 12.00 1.69 155.01 2 N 1 22.67 12.67 1.79 182.50 23.00 13.67 1.68 199.78 22.67 13.00 1.74 187.26 3 N 2 22.00 13.33 1.65 172.36 22.00 13.67 1.61 191.09 21.00 12.33 1.70 164.52 4 N3 23.67 13.33 1.78 200.48 23.33 14.33 1.63 212.43 23.00 13.33 1.73 194.80 5 Ø+W1 25.67 13.00 1.97 212.04 26.00 15.33 1.70 253.25 22.33 12.00 1.86 170.26 6 N 1+W1 28.67 15.67 1.83 285.46 30.00 17.00 1.76 324.05 25.33 14.67 1.73 236.11 7 N 2+W1 29.00 14.67 1.98 270.32 30.33 17.00 1.78 327.62 25.67 15.00 1.71 244.66 8 N3+W1 29.33 15.33 1.91 285.70 30.67 17.67 1.74 344.35 26.00 15.67 1.66 258.87 9 Ø+W2 26.00 14.67 1.77 242.35 27.67 15.33 1.80 269.52 23.33 12.67 1.84 187.81
10 N 1+ W 28.11 17.67 1.59 315.60 30.67 18.00 1.70 350.78 25.00 13.33 1.88 211.74 11 N 2+ W 30.00 17.00 1.76 324.05 31.33 18.00 1.74 358.33 26.00 16.67 1.56 275.39 12 N3+ W2 30.66 18.00 1.70 350.66 31.33 18.67 1.68 371.66 27.33 17.33 1.58 300.94
The analyzed leaves (the 5th, 10th and 15th leaf) represent the middle
harvesting belt. Importance of this belt comes of the fact that this leaves represent nearly 70% of the total leaf mass, and it is the area where highest quality leaves are concentrated. Applied agro-technics have increased of the leaves length and

Some manufacturing properties of semi-oriental tobaccos bred … 83
width in both examined variety’s (Table 7 and Table 8) which lead to enlargement of average relative leaves surface.
These leaves are important for the fabrication process because they have good thread which improves the tobacco connection in the cigarette. Also, this parameter combined with the data of total leaf number for the variety, can be used for roughly assessing the yield.
The results clearly show that highest average relative leaf surface is achieved at variant 12, at the both examined varieties. Variety O 9-18/2 have highest average relative surface on the 15th leaf (484.40cm2), and variety O. Zlatovrv on the 10th leaf (371.66cm2).
CONCLUSION
Based on the obtained results, it can be concluded that fertilization and irrigation are indispensable measures in breeding of semi-oriental varieties О9-18/2 and Оtlja-Zlatovrv in tobacco producing region of Prilep.
•Fertilization and irrigation considered separately and in interaction have a strong impact on increasing the tobacco yield, compared to the check variant.
•Compared to the check variety, yield has been increased by 86.89% in Otlja O9-18/2 and 89.98% in Otlja-Zlatovrv variety.
•Statistical analysis of the achieved yield by years reveals that all three variants (fertilized, irrigated and fertilized-irrigated) have statistically significant impact at all three levels of probability, confirming the justification of all agro-technical measures applied in cultivation of tobacco varieties О9-18/2 and Оtlja-Zlatovrv.
•Fertilization and irrigation have a positive effect on other manufacturing properties as stalk height, leaf number per stalk, length/width of the 5th, 10th and 15th leaf and average relative surface.
•According to the obtained results, the newly created variety Otlja-Zlatovrv has better manufacturing properties compared to the standard variety О9-18/2.
REFERENCES Atanasov D, 1972. Tjutjunoproizvodstvo, Plovdiv Bogdanceski M, 1981. Rezultati od komparativni ispituvanja na nekoi
poluorientalski sorti tutun vo reonot na Kumanovo, vo 1979 godina, Тутун/Tobacco, N0 1-2, p 15-28, Institut za tutun - Prilep.
Klikovac R, 1994. Duvan i duvanska privreda u Crnoj Gori, ITP ”UNIREX” DD, Nikšić
Kocoska K, 2014. Productional characteristics of some varieties of basmak tobacco, Тутун/Tobacco Vol. 64, N 7-12, 19-26, Scientific tobacco institut Prilep.
Lazareski T, Pashovski D, Todoroski P, Filiposki K, 1982. Vlijanie na gjubreweto i navodnuvanjeto vrz prinosot i kvalitetot na tutunot tip otlja, Тутун/Tobacco, N0 3-4, 41-51, Institut za tutun – Prilep.
Pelivanoska et al. 84
Mitreski M, 2012. Komparativni proucuvanja na povaznite proizvodni, tehnoloski i kvalitetni svojstva kaj nekoi sorti tutun od tipot prilep, Doktorska disertacija. Scientific tobacco institut Prilep.
Naumoski K, Boceski D, Grdanoski M, Karajankov S, Ackovski B, 1977. Sovremeno proizvodstvo na tutun, Skopje.
Naumoski K, 1985. Aspekti na selekcionata dejnost na tutunot, Тутун/Tobacco Vol. 35, N 9-10, 271-279, Institut za tutun – Prilep.
Patce L, 1960., Mestoto na tipot otlja vo jugoslovenskoto proizvodstvo na tutun, Tutun br.5. str 149-161, JNU Institut za tutun – Prilep.
Patce L,1979. Prilog kon proucuvanje na nekoi fizicki i hemiski karakteristiki na tutunskata surovina od tipot “Otlja” vo zavisnost od negovoto poteklo. Tutun br. 1-12, str. 249-318, JNU Institut za tutun – Prilep.
Pelivanoska V, Jordanoska B, Mitreski M, Mavroski R, 2012. Change in quantitative and qualitative characteristics of tobacco variety JK-48 depending on mineral nutrition, Тутун/Tobacco Vol. 62, N 7-12, 72-78, Scientific tobacco institut Prilep.
Pelivanoska V, Jordanoska B, 2016. Comparative investigations on the effects of fertilization and irrigation of the semi-oriental varieties Otlja O9-18/2 and Olja-Zlatovrv. Тутун/Tobacco Vol. 66, N 7-12, 51-60, Scientific tobacco institut Prilep.
Ristesk I, Kocoska K, Pelivanoska V, 2017. Results of investigations of genotype and its influence on the yield, quality and economic effect oof virginia tobacco in r. Macedonia. Agriculture & Forestry, Vol 63, Issue 1: 205-210, Podgorica
Ristesk I, Kocoska K, Srbinoska M, 2013. Directions and goals in the selection of large-leaf tobaccos in the scientific institute of tobacco prilep - republic of macedonia. Agriculture and Forestry, Vol. 59. Issue 2: 73-81, Podgorica
Spasovski B, 1957. Opit so odgleduvanje na tutunot od tipot olja vo polskiot del na podreonot na grad Bitola. Tutun, godina, VII, N0 12, p 449-453, JNU Institut za tutun – Prilep
Tso T.С, 1972. Phisiology and Biochemistry of Tobacco Plant. Dowden, Huthinson and Ross Inc. Stroudsburg, Pa.
Turšić I, Mesić M, Kisić I, Husnjak S, 2010. The influence of secondarz tillage on soil compaction and the zield of flue cured tobacco, Тутун/Tobacco Vol. 60, N 1-6, 22-26, Institut za tutun - Prilep
Uzunoski M., 1985. Proizvodstvo na tutun, Skopje.

Agriculture & Forestry, Vol. 63 Issue 3: 85-95, 2017, Podgorica 85
DOI: 10.17707/AgricultForest.63.3.09
Farnaz ALASVANDYARI and Batool MAHDAVI 1
EFFECT OF GLYCINEBETAINE ON GROWTH AND ANTIOXIDANT ENZYMES OF SAFFLOWER UNDER SALINITY STRESS CONDITION
SUMMARY
In the current study, the effect of glycinebetaine (GlyBet) on some vegetative and physiological characteristics of safflower under salinity stress conditions. Salinity (0 (non-stress), 50, 100, and 150 mM sodium chloride (NaCl)) was applied via the nutrient solution, and GlyBet (0, 10, 30, and 60 mM) was applied as foliar spray to safflower plant's leaves. The results showed that salinity reduced growth traits, relative water content (RWC), and peroxidase (POD) activity and increased malondialdehyde (MDA), proline, total soluble sugars, catalase (CAT), and superoxide dismutase (SOD) activity. Glycinebetaine at 60 mM increased root length, shoot length and RWC content compared to the control (0 mM GlyBet) under all salinity levels. Foliar spraying of salt-stressed plants with 30 and 60 mM GlyBet increased root and shoot dry weight, total soluble sugars and proline contents compared to the control. Foliar application of GlyBet induced activity of CAT and inhibited POD and MDA contents under all stress levels whereas it had no effect on SOD activity.
Keywords: antioxidant enzymes, growth, safflower, saline conditions
INTRODUCTION Safflower (Carthamus tinctorius L.) is an herbaceous, perennial, and
broad-leaved plant from the family Asteraceae. The shoot, seeds, flowers and leaves of safflower are used as industrial and vegetable oil, forage plant, bird feed, medicinal purpose and for its colourful petals used as food colouring, flavouring agent and preparing textile dyes (Dordas and Sioulos, 2008). Safflower oil preferred for its higher poly unsaturated fatty acid (78% linoleic acid) which reduces blood cholesterol level (Belgin et al., 2007).
Salinity is one of the considerable and limiting factors in crop efficiency. Salinity stress in a plant affects all the major processes such as photosynthesis, protein synthesis, and energy and lipids metabolism (Parida and Das, 2005). Plants exposed to salinity stress usually produce some types of reactive oxygen species including hydrogen peroxide, hydroxyl and singlet oxygen radicals (Verma and Mishra, 2005). These free radicals can suddenly disturb natural cell performance and plant metabolism through lipid peroxidation of membrane and denaturation of nucleic acids and proteins. To eliminate free radicals, there is an
1Farnaz Alasvandyari, Agriculture College, Vali-e-Asr University of Rafsanjan, Rafsanjan, IRAN. Batool Mahdavi (corresponding author: [email protected]), Department of Agronomy, Agriculture College, Vali-e-Asr University of Rafsanjan, Rafsanjan, IRAN. Notes: The authors declare that they have no conflicts of interest. Authorship Form signed online.

Alasvandyari and Mahdavi 86
antioxidant defense mechanism in plants exposed to stress. This defense mechanism includes enzymatic and non-enzymatic antioxidant (Ashraf, 2009(. In addition, accumulation of osmolytes such as proline, glycinebetaine, sugars, and polyols also plays a remarkable role in protecting plants against salinity stress (Parida and Das, 2005). The SOD is a major scavenger which catalyzes the dismutation of superoxide, which could cause membrane damage, to hydrogen peroxide and oxygen. Meanwhile, hydrogen peroxide is also toxic and has to be scavenged by CAT or POD to water and oxygen (Sairam et al., 2005). The mechanisms that decrease reactive oxygen species (ROS) and enhance antioxidant enzyme system in plants have important roles in imparting tolerance in plants under environmental stress conditions (Abd El-baky et al., 2003).
Glycinebetaine is an important osmolyte in plants, which is accumulated in cytosol and chloroplast (Ashraf and Foolad, 2007) and acts as defensive responses to extreme conditions of salt, drought, temperature, or light stress (Holmstrom et al., 2000). In nature, it is in the form of a bipolar compound but is electrically neutral molecule and much soluble in water. Due to these characteristics, GlyBet protects structure of enzymes and membrane proteins by interacting with both hydrophile and hydrophobic (Sakamoto and Murata, 2002). Furthermore, exogenous application of GlyBet increases tolerance to salinity in some plants which are not able to accumulate GlyBet (Hayashi and Murata, 1998). Glycinebetaine protects the plant cells against the damage of salinity stress by preserving the osmotic balance (Gadallah, 1999), and protecting the photosynthetic apparatus, such as functioning as radical oxygen scavengers (Heuer, 2003).
This study aimed to investigate the effects of foliar application of GlyBet to reduce the effects of salt stress in safflower.
MATERIAL AND METHODS
Plant Cultivation and Experimental Treatments A pot experiment was conducted at the research greenhouse of agriculture
faculty of Vali-e-Asr University of Rafsanjan, Iran. The plastic pots (diameter: 20 cm, height: 30 cm and 8 liters) were filled with perlite and cocopeat (1:1), and 10 safflower seeds of Soffeh cultivar were planted in them. Nine days after germination, the pots were irrigated with a nutrient solution with half strength Hoagland's solution. Irrigation at intervals of 2 days was applied to the plant (Figure 1). Then plants thinned to keep five plants in each pot. After the fourth true leaves appeared (20 days after planting), salinity stress in the pot was created by adding 10, 30, and 60 mM NaCl, to half strength Hoagland’s solution. Control plants (Non-stress treatment) were only irrigated with half strength Hoagland’s solution. Glycinebetaine was applied to plants at approximately the six-leaf stage (28 days after planting). Plants were sprayed with GlyBet (0, 10, 30, and 60 mM in 0.1% Tween-20 solution) solutions using a hand-held sprayer in three stages with 7 day interval. Plant growth was carried out in a glasshouse with 14-h d-1 photoperiod, irradiance of 250 µmol m-2 s-1, 32/20°C day/night temperature,

Effect of glycinebetaine on growth and antioxidant enzymes of safflower 87
50–55% air humidity. After 50 days of sowing, leave samples were collected and frozen in liquid nitrogen and stored at −80◦C until biochemical and physiological analysis was done. Then, the plants were harvested and separated into the shoot and root parts. Dry weights of roots and shoots were determined after drying in a hot-air oven at 70°C for 24 h.
Figure 1. The growing plants on greenhouse in two leaf stage.
Determination of Relative Water Content (RWC) A fully developed and young leaf from each plant was taken, and the fresh
weight of each leaf was recorded. All the samples were immersed in distilled water for 24 h, and then turgid weight of each leaf was recorded. Then, all the samples were oven dried at 80 oC, and the dried weights were measured. Then, RWC was calculated as below (Ritchie et al., 1990):
Total Soluble Sugars Assay 0.2 g of frozen leaves was homogenized with 3 ml of 95% ethanol. The
homogenate was centrifuged at 3 000 rpm for 10 min. The reaction mixture consisted of 2.5 mL of concentrated sulfuric acid (96%), 0.5 mL of phenol (5%), and 50 μL from the extract. Total soluble sugar content was measured using a spectrophotometer (Spectrophotometry, PG Instrumented Limited, England) at 490 nm (Dubois et al., 1956) and expressed in milligrams of glucose per gram of fresh matter.
Proline Content Determination Frozen leaves (0.2 g) were homogenized in 3% sulfosalicylic acid. Then,
the homogenate was centrifuged at 10 000 rpm. The content of proline was analyzed in reactions containing 2 ml of acid ninhydrin, 2 ml of glacial acetic acid and 2 ml of the extract. This was heated at 100 °C for 1 h. The reaction

Alasvandyari and Mahdavi 88
mixture was extracted with 4 ml of toluene; absorbance was read at 520 nm. To determine the proline content of corn cultivars, a standard curve was made using pure proline (Bates et al., 1973).
Malondialdehyde (MDA) Assay The concentration of MDA was determined using the extinction coefficient
of 155 mM-1 cm-1 according to the technique described by Health and Packer (1968). 0.2 g frozen leaves were homogenized in an aqueous solution of trichloroacetic acid (5% w:v). Then, the homogenate was centrifuged at 14 000 rpm for 20 min and the supernatant were heated in 0.25% thiobarbituric acid. The amount of MDA was measured using a spectrophotometer at 532 nm. The value for non-specific absorption at 600 nm was subtracted.
Enzyme Activities Assays 0.2 g frozen leaves was crushed using mortar and pestle at 4 °C; and was
homogenized with 4 ml of 50 mM potassium phosphate buffer (pH 7.0). The homogenate was centrifuged at 20 000 rpm for 20 min at 4 °C. Then supernatant was used for enzyme activity assay as crude extract.
Activities of catalase (CAT) and peroxidase (POD) activity were measured according to the technique described by Cakmak and Marschner (1988) and Pandolfini et al. (1992) with some modification. The CAT activity was analyzed in reactions containing 50 mM potassium phosphate buffer (pH 6.8), 10 mM H2O2, and enzyme extract. Decrease in absorbance was recorded at 240 nm for 1 min. The POD activity was analyzed in reactions containing 50 mM phosphate buffer (pH 6.8), 28mM guaiacol, 5 mM H2O2 and an enzyme extract. The increase in absorbance was recorded at 470 nm for 1 min (U- 2000, Hitachi Instruments, Tokyo, Japan). Activity of superoxide dismutase (SOD) was measured using the method of Giannopolitis and Ries (1977). The reaction solution contained 50 mM potassium phosphate buffer (pH= 7.8), 12 mM L-methionine, 1 mM riboflavin, 50 mM calcium carbonate, 75 mM nitro blue tetrazolium (NBT), and 200 µl of the enzyme extract with non-enzyme solution as control. The test tubes containing the reaction mixture were irradiated under white fluorescent lamps (120 W) at the distance of 40 cm for 15 min. One unit of SOD was defined as the amount of enzyme required to induce a 50% inhibition of NBT reduction as measured at 560 nm.
Statistical Analysis Values presented are mean ± SE of obtained three replicates. The
experiments were performed in a randomized complete block design arranged as a factorial with three replications. All statistical analyses were performed using the SAS software. Means were compared with LSD test with a 0.05 level of significance.
RESULTS
With increasing salinity, root and shoot length and root and shoot dry weight decreased. In non-salt stress conditions, application of 60 mM and 30 mM GlyBet increased root length compared to the control (0 mM GlyBet) (Figure
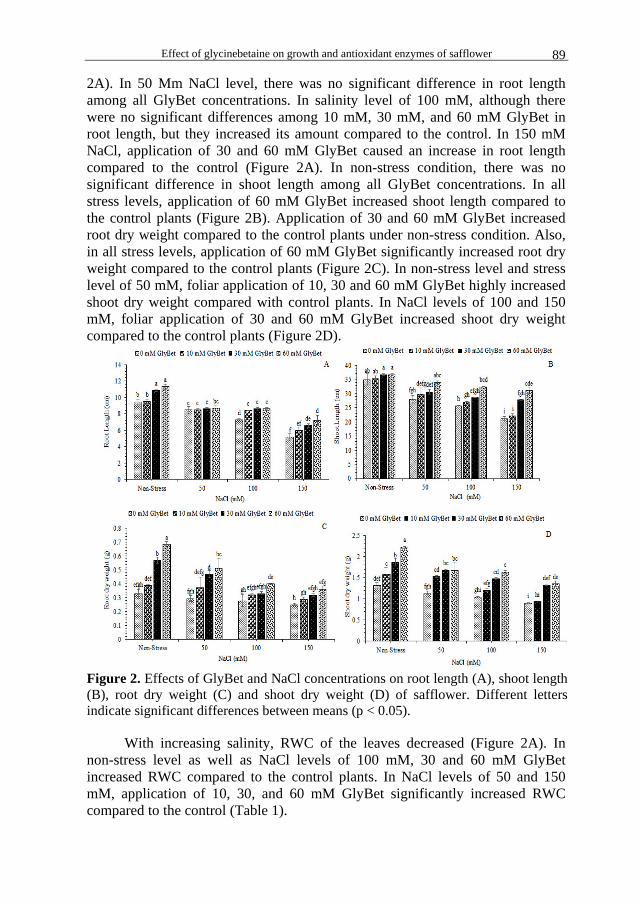
Effect of glycinebetaine on growth and antioxidant enzymes of safflower 89
2A). In 50 Mm NaCl level, there was no significant difference in root length among all GlyBet concentrations. In salinity level of 100 mM, although there were no significant differences among 10 mM, 30 mM, and 60 mM GlyBet in root length, but they increased its amount compared to the control. In 150 mM NaCl, application of 30 and 60 mM GlyBet caused an increase in root length compared to the control (Figure 2A). In non-stress condition, there was no significant difference in shoot length among all GlyBet concentrations. In all stress levels, application of 60 mM GlyBet increased shoot length compared to the control plants (Figure 2B). Application of 30 and 60 mM GlyBet increased root dry weight compared to the control plants under non-stress condition. Also, in all stress levels, application of 60 mM GlyBet significantly increased root dry weight compared to the control plants (Figure 2C). In non-stress level and stress level of 50 mM, foliar application of 10, 30 and 60 mM GlyBet highly increased shoot dry weight compared with control plants. In NaCl levels of 100 and 150 mM, foliar application of 30 and 60 mM GlyBet increased shoot dry weight compared to the control plants (Figure 2D).
Figure 2. Effects of GlyBet and NaCl concentrations on root length (A), shoot length (B), root dry weight (C) and shoot dry weight (D) of safflower. Different letters indicate significant differences between means (p < 0.05).
With increasing salinity, RWC of the leaves decreased (Figure 2A). In non-stress level as well as NaCl levels of 100 mM, 30 and 60 mM GlyBet increased RWC compared to the control plants. In NaCl levels of 50 and 150 mM, application of 10, 30, and 60 mM GlyBet significantly increased RWC compared to the control (Table 1).

Alasvandyari and Mahdavi 90
In this experiment, an increase in NaCl levels was followed by an increase in total soluble sugars, proline and MDA content. In non-stress level, no significant differences were observed among different concentrations of GlyBet on total content of soluble sugars. In 50 and 100 mM levels of NaCl, 30 and 60 mM GlyBet increased total soluble sugars content in these levels compared to that of the control. Also, application of 10, 30 and 60 mM GlyBet had significant difference with the control plants and increased total soluble sugars content at 150 mM level NaCl (Table 1). In non-stress level as well as 50 Mm NaCl, 30 and 60 Mm GlyBet increased proline content compared to the controls. In 100 and 150 Mm NaCl level, all concentrations of GlyBet increased proline content compared to the control plants (Table 1). In non-stress level and 100 mM salinity, GlyBet had no significant effect on MDA. In salinity level of 50 mM, 60 mM GlyBet reduced MDA content compared to the control plants. In the highest salinity level (150 mM), there were also no significant differences among concentrations of 10, 30, and 60 mM GlyBet, but they reduced MDA content compared to the control plants (Table 1).
The results showed that increasing NaCl increased CAT activity but
reduced POD activity. As observed in non-stress conditions, application of 30 and 60 mM GlyBet increased CAT activity compared to the control plants (Figure 3A) and reduced POD activity (Figure 3B). In NaCl levels of 100 and 150 mM, application of 10, 30, and 60 mM GlyBet increased the activity of CAT
Table 1. Effects of GlyBet and NaCl concentrations on RWC, total soluble sugars, proline and MDA content of safflower.
NaCl (mM)
GlyBet (mM) RWC (%)
Total soluble sugars (mg g-
1 FW)
Proline (mg.g-1 FW)
MDA (µM g-1
FW)
0
0 69.48ef±0.884 2.89f±0.451 0.156i±0.036 0.596cd±0.003 10 72.37cde±7.742 3.1ef±0.078 0.175hi±0.027 0.571d±0.015 30 78.77bc±1.564 3.26ef±0.083 0.331fg±0.020 0.566d±0.003 60 87.48a±0.199 4.06def±0.087 0.634cd±0.036 0.545d±0.053
50
0 60.33gh±0.615 3.47ef±0.044 0.269ghi±0.031 0.704b±0.001 10 71.24cde±2.922 4.54de±0.777 0.309gh±0.088 0.671bc±0.006 30 78.31bcd±1.046 6.6c±0.080 0.539de±0.030 0.658bc±0.022 60 85.8ab±1.942 7.53c±0.935 0.751abc±0.005 0.548d±0.012
100
0 59.22gh±2.420 3.73def±0.116 0.287ghi±0.004 0.726b±0.036 10 62.48fg±1.328 5.11d±0.310 0.678bcd±0.150 0.727b±0.003 30 70.25def±1.979 7.13c±0.555 0.754abc±0.027 0.688b±0.061 60 77.98bcd±0.385 10.39b±0.341 0.824ab±0.016 0.676b±0.037
150
0 37.56i±2.883 4.15def±0.008 0.473ef±0.004 0.879a±0.012 10 53.89h±3.997 7.43c±0.199 0.681bcd±0.050 0.731b±0.016 30 62.79gf±1.881 10.21b±0.791 0.808ab±0.003 0.699b±0.002 60 76.54cd±1.856 13.29a±1.229 0.847a±0.050 0.680b±0.023
Different letters indicate significant differences between means (p < 0.05).
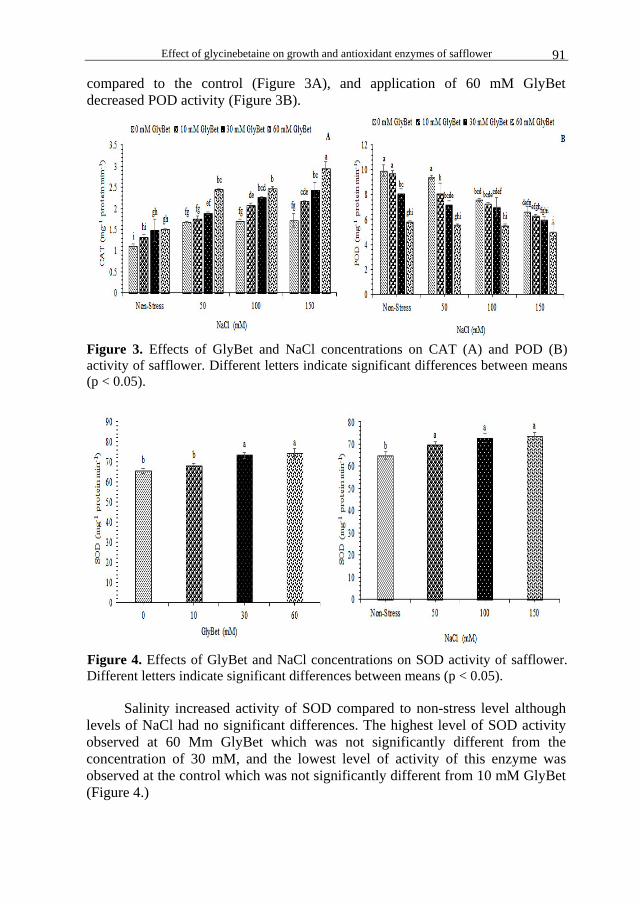
Effect of glycinebetaine on growth and antioxidant enzymes of safflower 91
compared to the control (Figure 3A), and application of 60 mM GlyBet decreased POD activity (Figure 3B).
Figure 3. Effects of GlyBet and NaCl concentrations on CAT (A) and POD (B) activity of safflower. Different letters indicate significant differences between means (p < 0.05).
Figure 4. Effects of GlyBet and NaCl concentrations on SOD activity of safflower. Different letters indicate significant differences between means (p < 0.05).
Salinity increased activity of SOD compared to non-stress level although
levels of NaCl had no significant differences. The highest level of SOD activity observed at 60 Mm GlyBet which was not significantly different from the concentration of 30 mM, and the lowest level of activity of this enzyme was observed at the control which was not significantly different from 10 mM GlyBet (Figure 4.)

Alasvandyari and Mahdavi 92
DISCUSSION The results of our studies showed that increasing NaCl levels reduced root
and shoot growth followed by reduced length and dry weight of root and shoot whereas, application of GlyBet improved size and dry weight of the plants under salinity stress (Figure 2). Shoot and root growth reduction of safflower has been reported with increasing salinity (Erdal and Cakirlar, 2014). Also, Shafi et al. (2009) reported that undesirable effects of salinity on plants may disturb plant metabolism and result in reduced growth. The results of study on peanut showed that GlyBet increased length of shoot and root, dry weight, and growth rate in peanut under salinity stress conditions (Sailaja, 1998). Other studies have reported the beneficial role of GlyBet in improving dry biomass of shoot and root under saline stress conditions in wheat (Badran et al., 2015).
In our studies, RWC reduced with increasing NaCl concentration whereas, foliar application of GlyBet increased RWC under salinity stress conditions (Table 1). The decrease in RWC may be as a result of lower water availability under stress conditions (Shalhevet, 1993), or root systems, which are not able to compensate for water lost by transpiration through a decrease of the absorbing surface (Gadallah, 2000). Also, reduced RWC in safflower under saline conditions was reported by Erdal and Cakirlar (2014). GlyBet inhibited K+ leak induced by salinity stress (Cuin and Shabala, 2005) and thus, indirectly aided water retention in plant tissues (Kaya et al., 2013).
In this work, salinity-stressed safflower plants accumulated significantly more total soluble sugars and proline content than non-stressed plants. Also, application of GlyBet to salt-stressed plants resulted in an increase in total soluble sugars and proline contents (Table 1). Soluble sugars play a major role in osmotic protection and adjustment, carbon storage, and scavenging of free radicals under salinity stress (Khavarinejad and Mostofi, 1998). Increased total soluble sugars during salinity stress were reported in some safflower cultivars by Jabeen and Ahmad (2013). Similarly, foliar application of GlyBet resulted in increased soluble sugars’ content in canola plants growing under drought condition (Dawood and Sadak, 2014). Increased proline content during salinity stress was also reported by in safflower (Jabeen and Ahmad, 2013; Erdal and Cakirlar, 2014). Increasing proline accumulation due to application of GlyBet has been also observed in rice (Demiral and Tu¨rkan, 2006) and tomato (Heuer, 2003) under salinity stress conditions.
The results of this study showed that salinity stress increased lipid peroxidation and foliar application of GlyBet reduced lipid peroxidation under salt stress conditions (Table 1). Increased lipid peroxidation under saline conditions has been reported in barley (Huang et al., 2006) and safflower (Erdal and Cakirlar, 2014). Peroxidation of membrane lipids in higher plants reflects free radical-induced oxidative damage at the cellular level under salt stress conditions (Meloni and Martínez, 2009). Demiral and Tu¨rkan (2004) reported decreased MDA after GlyBet application in rice under salinity stress. Also,
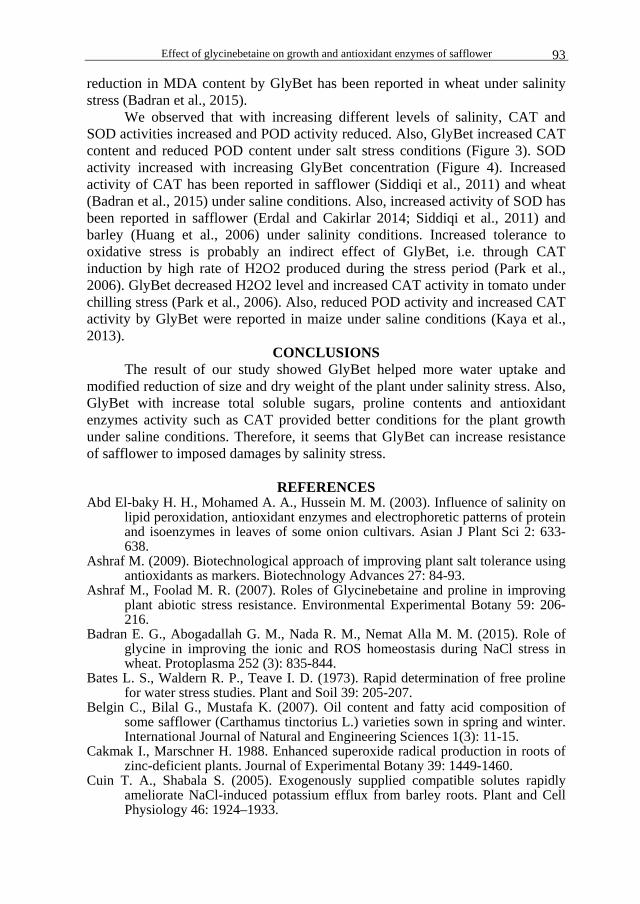
Effect of glycinebetaine on growth and antioxidant enzymes of safflower 93
reduction in MDA content by GlyBet has been reported in wheat under salinity stress (Badran et al., 2015).
We observed that with increasing different levels of salinity, CAT and SOD activities increased and POD activity reduced. Also, GlyBet increased CAT content and reduced POD content under salt stress conditions (Figure 3). SOD activity increased with increasing GlyBet concentration (Figure 4). Increased activity of CAT has been reported in safflower (Siddiqi et al., 2011) and wheat (Badran et al., 2015) under saline conditions. Also, increased activity of SOD has been reported in safflower (Erdal and Cakirlar 2014; Siddiqi et al., 2011) and barley (Huang et al., 2006) under salinity conditions. Increased tolerance to oxidative stress is probably an indirect effect of GlyBet, i.e. through CAT induction by high rate of H2O2 produced during the stress period (Park et al., 2006). GlyBet decreased H2O2 level and increased CAT activity in tomato under chilling stress (Park et al., 2006). Also, reduced POD activity and increased CAT activity by GlyBet were reported in maize under saline conditions (Kaya et al., 2013).
CONCLUSIONS The result of our study showed GlyBet helped more water uptake and
modified reduction of size and dry weight of the plant under salinity stress. Also, GlyBet with increase total soluble sugars, proline contents and antioxidant enzymes activity such as CAT provided better conditions for the plant growth under saline conditions. Therefore, it seems that GlyBet can increase resistance of safflower to imposed damages by salinity stress.
REFERENCES
Abd El-baky H. H., Mohamed A. A., Hussein M. M. (2003). Influence of salinity on lipid peroxidation, antioxidant enzymes and electrophoretic patterns of protein and isoenzymes in leaves of some onion cultivars. Asian J Plant Sci 2: 633-638.
Ashraf M. (2009). Biotechnological approach of improving plant salt tolerance using antioxidants as markers. Biotechnology Advances 27: 84-93.
Ashraf M., Foolad M. R. (2007). Roles of Glycinebetaine and proline in improving plant abiotic stress resistance. Environmental Experimental Botany 59: 206-216.
Badran E. G., Abogadallah G. M., Nada R. M., Nemat Alla M. M. (2015). Role of glycine in improving the ionic and ROS homeostasis during NaCl stress in wheat. Protoplasma 252 (3): 835-844.
Bates L. S., Waldern R. P., Teave I. D. (1973). Rapid determination of free proline for water stress studies. Plant and Soil 39: 205-207.
Belgin C., Bilal G., Mustafa K. (2007). Oil content and fatty acid composition of some safflower (Carthamus tinctorius L.) varieties sown in spring and winter. International Journal of Natural and Engineering Sciences 1(3): 11-15.
Cakmak I., Marschner H. 1988. Enhanced superoxide radical production in roots of zinc-deficient plants. Journal of Experimental Botany 39: 1449-1460.
Cuin T. A., Shabala S. (2005). Exogenously supplied compatible solutes rapidly ameliorate NaCl-induced potassium efflux from barley roots. Plant and Cell Physiology 46: 1924–1933.
Alasvandyari and Mahdavi 94
Dawood M. G., Sadak M. S. (2014). Physiological Role of Glycinebetaine in Alleviating the Deleterious Effects of Drought Stress on Canola Plants (Brassica napus L.). Middle East Journal of Agriculture Research 3(4): 943-954.
Demiral T., Tu¨rkan I. (2006). Exogenous glycinebetaine affects growth and proline accumulation and retards senescence in two rice cultivars under NaCl stress. Environmental and Experimental Botany 56: 72–79.
Demiral T., Türkan I. (2004). Does exogenous glycinebetaine affect antioxidative system of rice seedlings under NaCl treatment? Journal Plant Physiology 161: 1089-1100
Dordas C., Sioulas C. (2008). Safflower yield, chlorophyll content, photosynthesis, and water use efficiency response to nitrogen fertilization under rainfed conditions. Indian Crop Production 27: 75-85.
Dubois M., Gilles K. A., Hamilton J. K., Reber P. A., Smith F. (1956). Colorimetric method for determination of sugars and related substances. Analytical Chemistry 28 (3): 350–356.
Erdal S. C., Cakirlar H. (2014). Impact of salt stress on photosystem II efficiency and antioxidant enzyme activities of safflower (Carthamus tinctorius L.) cultivars. Turkish Journal of Biology 38: 549-560.
Gadallah M. A. A. (1999). Effect of proline and glycine betaine on Vicia faba responses to salt stress. Biologia Plantarum 42: 249-257.
Gadallah M. A. A. (2000). Effects of indole-3-acetic acid and zinc on the growth, osmotic potential and soluble carbon and nitrogen components of soybean plants growing under water deficit. Journal of arid environments 44: 451–467.
Giannopolitis C. N., Ries S. K. (1977). Superoxide dismutases occurrence in higher plants. Plant Physiology 59(2): 309–314.
Hayashi H., Murata N. (1998). Genetically engineered enhancement of salt tolerance in higher plants, In: Satoh K, Murata N. (Eds.), Stress Responses of Photosynthetic Organisms 133–148.
Health R. L., Packer L. (1968). Photoperoxidation in isolated chloroplasts. I. Kinetics and stoichiometry of fatty acid peroxidation. Archives Of Biochemistry And Biophysics 125: 189-198.
Heuer B. (2003). Influence of exogenous application of proline and glycinebetaine on growth of salt-stressed tomato plants. Plant Science 165: 693-699.
Huang Y., Zhang G. P., Wu F. B., Chen J., Xiao Y. (2006). Interac¬tion of salinity and cadmium stresses on antioxidant enzymes, sodium, and cadmium accumulation in four barley genotypes. Journal of Plant Nutrition 29: 2215–2225.
Jabeen N., Ahmad R. (2013). Variations in accession of sunflower and safflower under stress condition. Pakistan Journal of Botany 45(2): 383-389.
Kaya C., Sönmez O., Aydemir S., Dikilitas M. (2013). Mitigation effects of glycinebetaine on oxidative stress and some key growth parameters of maize exposed to salt stress. Turkish Journal of Agriculture and Forestry 37: 188-194.
Khavarinejad R. A., Mostofi Y. (1998). Effects of NaCl on photosynthetic pigments, saccharides, and chloroplast ultrastructure in leaves of tomato cultivars. Photosynthetica 35: 151–154.
Meloni D. A., Martínez C. A. (2009). Glycinebetaine improves salt tolerance in vinal (Prosopis ruscifolia Griesbach) seedlings. Brazilian Journal of Plant Physiology 21(3): 233-241.

Effect of glycinebetaine on growth and antioxidant enzymes of safflower 95
Pandolfini T, Gabbrielli R, Comparini C. (1992). Nickel toxicity and peroxidase activity in seedlings of Triticum aestivum L. Plant and Cell and Environment 15: 719-725.
Parida A. K., Das A. B. (2005). Salt tolerance and salinity effects on plants: a review. Ecotoxicology and Environmental Safety 60: 324–349.
Park E. J., Jeknic Z., Tony H., Chen H. (2006). Exogenous application of glycinebetaine increases chilling tolerance in tomato plants. Journal of Central European Agriculture 47(6): 706–714.
Ritchie S. W., Nguyen H. T., Haloday A. S. (1990). Leaf water content and gas exchange parameters of two wheat genotypes differing in drought resistance. Crop Science 30: 105-111.
Sailaja K. (1998). Effect of Glycinebetaine in the alleviation of abiotic stresses in groundnut genotypes. PhD thesis, Acharya N G Ranga Agricultural University.
Sairam R. K., Srivastava G. C., Agarwal S., Meena R. C. (2005). Differences in antioxidant activity in response to salinity stress in tolerant and susceptible wheat genotypes. Biologia Plantarum 49: 85-89.
Sakamoto A., Murata N. (2002). The role of Glycinebetaine in the protection of plants from stress: clues from transgenic plants. Plant and Cell Environment 25: 163-171.
Shafi M., Bakht J., Khan M. J., Khan M. A. (2010). Effect of salinity on yield and ion accumulation of wheat genotypes. Pakistan Journal of Botany 42(6): 4113-4121.
Shalhevet J. (1993). Plants under salt and water stress. In: L. Fowden, T. Mansfield, J. Stoddart (Eds). Plant Adaptation to Environmental Stress. Chapman and Hall, London, 133–154.
Siddiqi E. H., Ashraf M., Al-urainy F., Aisha Akram N. (2011). Salt-induced modulation in inorganic nutrients, antioxidant enzymes, proline content and seed oil composition in safflower (Carthamus tinctorius L. Journal of the Science of Food and Agriculture 91(15): 2785–2793.
Verma S., Mishra S. N. (2005). Putrescine alleviation of growth in salt stressed Brassica juncea by inducing antioxidative defense system. Journal of Plant Physiology 162: 669-677.

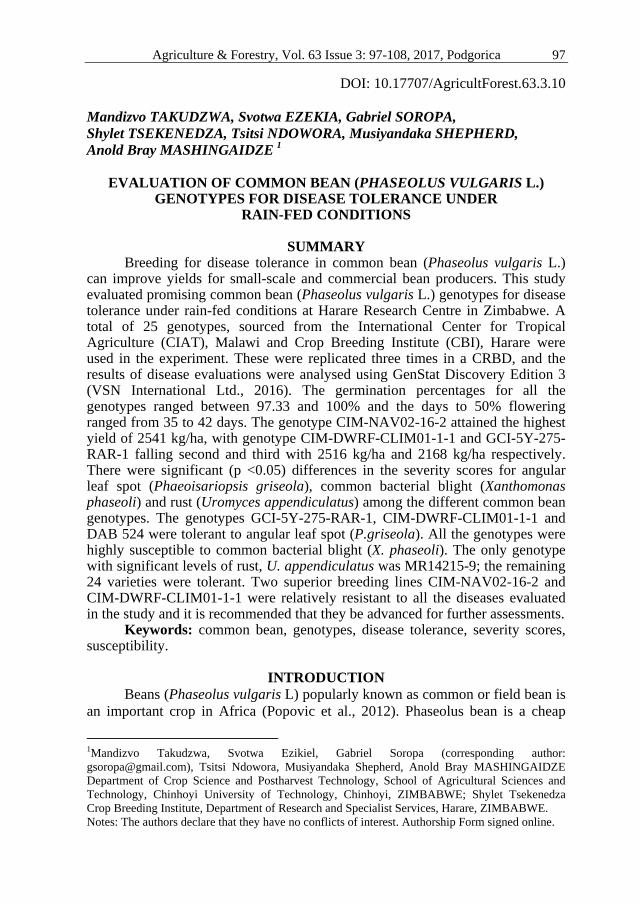
Agriculture & Forestry, Vol. 63 Issue 3: 97-108, 2017, Podgorica 97
DOI: 10.17707/AgricultForest.63.3.10 Mandizvo TAKUDZWA, Svotwa EZEKIA, Gabriel SOROPA, Shylet TSEKENEDZA, Tsitsi NDOWORA, Musiyandaka SHEPHERD, Anold Bray MASHINGAIDZE 1
EVALUATION OF COMMON BEAN (PHASEOLUS VULGARIS L.) GENOTYPES FOR DISEASE TOLERANCE UNDER
RAIN-FED CONDITIONS
SUMMARY Breeding for disease tolerance in common bean (Phaseolus vulgaris L.)
can improve yields for small-scale and commercial bean producers. This study evaluated promising common bean (Phaseolus vulgaris L.) genotypes for disease tolerance under rain-fed conditions at Harare Research Centre in Zimbabwe. A total of 25 genotypes, sourced from the International Center for Tropical Agriculture (CIAT), Malawi and Crop Breeding Institute (CBI), Harare were used in the experiment. These were replicated three times in a CRBD, and the results of disease evaluations were analysed using GenStat Discovery Edition 3 (VSN International Ltd., 2016). The germination percentages for all the genotypes ranged between 97.33 and 100% and the days to 50% flowering ranged from 35 to 42 days. The genotype CIM-NAV02-16-2 attained the highest yield of 2541 kg/ha, with genotype CIM-DWRF-CLIM01-1-1 and GCI-5Y-275-RAR-1 falling second and third with 2516 kg/ha and 2168 kg/ha respectively. There were significant (p <0.05) differences in the severity scores for angular leaf spot (Phaeoisariopsis griseola), common bacterial blight (Xanthomonas phaseoli) and rust (Uromyces appendiculatus) among the different common bean genotypes. The genotypes GCI-5Y-275-RAR-1, CIM-DWRF-CLIM01-1-1 and DAB 524 were tolerant to angular leaf spot (P.griseola). All the genotypes were highly susceptible to common bacterial blight (X. phaseoli). The only genotype with significant levels of rust, U. appendiculatus was MR14215-9; the remaining 24 varieties were tolerant. Two superior breeding lines CIM-NAV02-16-2 and CIM-DWRF-CLIM01-1-1 were relatively resistant to all the diseases evaluated in the study and it is recommended that they be advanced for further assessments.
Keywords: common bean, genotypes, disease tolerance, severity scores, susceptibility.
INTRODUCTION
Beans (Phaseolus vulgaris L) popularly known as common or field bean is an important crop in Africa (Popovic et al., 2012). Phaseolus bean is a cheap
1Mandizvo Takudzwa, Svotwa Ezikiel, Gabriel Soropa (corresponding author: [email protected]), Tsitsi Ndowora, Musiyandaka Shepherd, Anold Bray MASHINGAIDZE Department of Crop Science and Postharvest Technology, School of Agricultural Sciences and Technology, Chinhoyi University of Technology, Chinhoyi, ZIMBABWE; Shylet Tsekenedza Crop Breeding Institute, Department of Research and Specialist Services, Harare, ZIMBABWE. Notes: The authors declare that they have no conflicts of interest. Authorship Form signed online.

Takudzwa et al. 98
source of high-quality protein, with highest consumption among the poor. It is the leading protein source in Brazil and in parts of equatorial Africa, sometimes contributing up to 30 % of protein intake and 10-15% of calories ((Broughton et al., 2003). This crop belongs to the legume tribe Phaseoleae within the Papilionoideae-Leguminose family (Freytag and Debouck, 2002). Its centers of origin are the Andean and Mesoamerica regions of Latin America (Cortes et al., 2013). Beans from these two centers constitute the two main biotypes; that is the Andean and Mesoamerican types. According to Bitocchi et al. (2012), beans of Andean origin are predominantly large seeded types whilst Mesoamerican types vary in seed size from small to medium. Common beans are warm season plants that can be either short day or day neutral and grow in a wide range of environments from sea level to more than 3000 m above sea level (Gray, 2013).
The climatic requirements for dry beans were summarized by Makini (1994). The dry bean is an annual crop which thrives under warm climatic conditions, with an optimum temperature for growth ranging from 18 to 24°C. Maximum temperatures during flowering should not exceed 30°C for Phaseolus vulgaris L. and 26°C for Phaseolus coccineus. High temperatures during the flowering stage lead to abscission of flowers and low pod set, resulting in yield loss. Day temperatures below 20 °C delay maturity and result in poor pod filling. Under rain-fed conditions dry beans require a minimum of 400 to 500 mm of rain during the growing season, but an annual total of 600 to 650 mm is ideal. According to Liebenberg (2002) dry beans should be planted in warm soils (minimum temperatures preferably above 13°C) after all danger of frost has passed. They complete their phenological growth smoothly in well drained fertile soils with a depth of at least 90 cm. Suitable soils for beans are sandy loam, sandy clay loam and clay loam with clay contents of between 15 and 35% and soil pH (water) of 5.8 to 6.5 as the crop is very sensitive to acidic soil below pH < 5.2 (Freytag and Debouck, 2002). However, with sandy soils, problems of low fertility and nematode damage may occur.
Beans have been grown in Zimbabwe for decades but yields have been declining because of factors such as low rainfall during planting time and high disease prevalence during vegetative and reproductive stages (Mupepereki, 2002). Low rainfall results in reduced availability of plant nutrients, resulting in depressed biomass yield, while diseases have an impact by lowering the potential yield of beans. Of the diseases caused by fungi, bacteria and viruses in beans, the most prevalent ones are the fungal diseases such as rust, anthracnose, angular leaf spot, web blight and root rots (Tadesse et al., 2009). These diseases affect the duration, efficiency and size of the various photosynthesis system. The partitioning coefficient of allocating dry matter to the economic part of the plant (the pod) is reduced. Phaseoriopsis griseola, a leaf pathogen which causes angular leaf spot is a major problem under conditions of terminal drought (Frahm et. al., 2004), whereas Xanthomonas phaseoli and Uromyces appendiculatus are major pod and leaf pathogens causing common bacterial blight and leaf rust respectively in regions where intermittent drought occurs (Navarrete-Maya et al.,

Evaluation of common bean (Phaseolus vulgaris l.) genotypes for disease tolerance… 99
2002). Similarly, water stressed bean crops may become prone to damage by leafhoppers (Empoasca kraemeri) in the tropics and subtropics (Musyimi, 2014).
Angular leaf spot (ALS), common bean blight (CBB) and rust diseases are persistent problems that growers lack tools to control. There are few practical and economic means to reduce the severity of infection, which is conditioned in part by environmental stress and decline in soil quality. In climatically variable years, including under high rainfall or drought conditions, common bean blight often suppresses bean yields by 25%, and up to 80% (Deshpande and Deshpande, 1991). Current fungicide options are too expensive and becoming highly regulated. Integrated management control options are required that are profitable and environmentally friendly. Disease effects are also exacerbated by the fact that poor disease tolerant cultivars are planted with poor sanitation. This study sought to evaluate common bean (Phaseolus vulgaris L.) genotypes for disease tolerance under rain-fed conditions. In the study we hypothesis that Andean Bean (DAB) lines with good adaptability to local conditions in addition to tolerance to angular leaf spot (ALS), common bacterial blight (CBB) and bean rust can be identified. We also hypothesize that genotypes with the ability to attain high yield under disease pressure can also be identified. The DAB were selected as suitable genotypes with suitable sources of disease tolerance for use in breeding programmes in Zimbabwe.
MATERIALS AND METHODS
The study was carried out at Crop Breeding Institute (CBI), Department of Research and Specialist Services, in Harare, Zimbabwe. The study site is located in Natural Region (NR) II and lies at an altitude of 1 625 m (Google earth, 2015). Natural regions in Zimbabwe are based on the relationship between physical attributes particularly the amount of rainfall, its reliability and distribution, and farming potential (Vincent et al., 1960). Rainfall amounts decrease from NR I to NR V, ranging from at least 900 mm per annum in NR 1 to less than 450 mm per annum in NR V. Agricultural potential also decreases from NR 1 to NR V. The soils in the experimental area are derived from granitic alluvial.
Genotypes A total of 25 common bean varieties sourced from International Centre for
Tropical Agriculture (CIAT), Malawi and CBI, Harare, were used in the study (Table 1). Twenty two (22) were breeding lines whilst 3 were check varieties.
Experimental design and layout The experiment was laid out in a completely randomized design (CRD)
with three replications at the study site. Planting of the genotypes was done manually on 1.8 m x 3 m prepared plots, consisting of 4 rows. The inter row spacing of 0.45 m used was whilst inner row spacing was 0.05 m. Compound D (7:14:7) fertilizer was applied at sowing at a rate of 300 kg/ha then ammonium nitrate (34.5% N) fertilizer was applied at a rate of 80 kg/ha before the flowering stage as top dressing. Weeding was done whenever necessary to minimize weed infestation.

Takudzwa et al. 100
Table1. Summary of the common bean (Phaseolus vulgaris L.) genotypes used in the study
Genotype Number Identity Source Status (2015)
1 GCI-5Y-275-RAR-1 CIAT Breeding line 2 CIM-DWRF-CLIM01-1-1 CIAT Breeding line 3 CIM-NAV02-16-2 CIAT Breeding line 4 DAB 70 CIAT Breeding line 5 DAB 194 CIAT Breeding line 6 GLORIA CBI Check variety 7 DAB 84 CIAT Breeding line 8 DAB 524 CIAT Breeding line 9 DAB 487 CIAT Breeding line
10 DAB 366 CIAT Breeding line 11 DAB 311 CIAT Breeding line 12 NUA 45 CBI Check variety 13 DAB 539 CIAT Breeding line 14 DAB 221 CIAT Breeding line 15 DAB 416 CIAT Breeding line 16 MICHIGAN PEA BEAN CIAT Breeding line 17 DAB 482 CIAT Breeding line 18 MR14215-9 CIAT Breeding line 19 DAB 82 CIAT Breeding line 20 DAB 58 CIAT Breeding line 21 DAB 302 CIAT Breeding line 22 DAB 287 CIAT Breeding line 23 PAN 148 CBI Check variety 24 SEQ 1039 CIAT Breeding line 25 DAB 16 CIAT Breeding line
Introduction of diseases The multiple needle puncture inoculation method was used to initiate
angular leaf spot (Phaseoriopsis griseola), common bacterial blight (Xanthomonas phaseoli) and leaf rust (Uromyces appendiculatus) diseases one week after germination. Small holes were punched on the leaves of the bean plants using needles infected with the disease as described by (Andrus 2008) and by Pompeau and Crowder (2010).
Measurements Germination Percentage The germination percentage was calculated as the number of plants
emerged per plot divided by the total number of seed sown per plot multiplied by 100.
Days to 50 % flowering These are days when 50 % of plants in each plot had one or more first
flowers and coincides with the initiation of reproductive development stage.

Evaluation of common bean (Phaseolus vulgaris l.) genotypes for disease tolerance… 101
Disease scoring Diseases scores were taken on three different regimes which were: •First regime: before flowering commenced •Second regime: at pod filling and •Third regime: towards crop maturity Diseases that were scored were angular leaf spot (Phaseoriopsis griseola),
common bacterial blight (Xanthomonas phaseoli) and leaf rust (Uromyces appendiculatus). All these diseases were scored on a scale from 1-9 where 1=no symptoms of the disease and 9= severely affected by the disease.
Pod height Pod clearance from the ground was measured in centimeters using a meter
rule. This was done six weeks after germination. Days to 95 % maturity These are number of days from date of planting to date when 50 % of
plants in each plot attained physiological maturity. Pods will be dry and they turn brown in colour.
Harvesting Harvesting was done by hand in 4 m x 2 row plots. Grain yield data was
taken from the two central rows in each plot and expressed on a hectare basis (kg/ha). Weight of harvested clean seed from the net plot was measured in grams using Nicholas scale and recorded in the field book. The weight was then converted to yield by dividing the seed mass by plot size and then converted to kg/ha.
Statistical analysis Data for germination percentage, days to 50 %, pod clearance, disease
scores, days to 95 % physiological maturity and grain yield data were subjected to analysis of variance (ANOVA) using GenStat statistical analysis software version 10.3.0.0. Error bars for bar graphs were drawn using calculated standard error of differences (s.e.d) and were used for further analysis. In most cases the data had to be transformed using square root transformation √(x+1) to make it normally distributed before analysis.
RESULTS
The results for (1) germination percentage; (2) pod height (cm); (3) disease scores [1-10 from least to most severe] for (a) angular leaf spot (ALS), (b) common bacterial blight (CBB) and (c) rust; (4) days to 50% flowering and to (5) 95% physiological maturity and finally (6) grain yield in kg/ha are shown in Table 2. The germination percentage for all genotypes ranged between 97.33 and 100%. Seven of the genotypes were able to attain 100% germination.
Days to 50% flowering ranged from 35 to 42 days, genotype GCI-5Y-275-RAR-1 recorded the highest number of days to 50% flowering (42 days). The pod least clearance of 2.7 cm was recorded for genotype (CIM-DWRF-CLIM01-1-, while the highest was 9 cm recorded on DAB 539. Disease scores for angular leaf spot on the Cobb scale which ran from 1 to 9 recorded between 1.67 and

Takudzwa et al. 102
6.67. Common bacterial blight scores ranged from 4 to 6.67 and for rust most scores were in the resistant zone (1to 3) except for alarming score of 6 recorded on genotype (MR14215-9). The genotype (CIM-NAV02-16-2) attained the highest yield of 2541 kg/ha with genotype CIM-DWRF-CLIM01-1-1 and GCI-5Y-275-RAR-1 falling second and third with 2516 kg/ha and 2168 kg/ha respectively. Most of the genotypes yielded between 1365 kg/ha and 2128 kg/ha. The least yielding genotype was DAB 539 with a yield of 1365 kg/ha.
Table 2. Combined means on data collected for the 25 common bean
(Phaseolus vulgaris L.) genotypes
Genotype Germi-nation
(%)
50 % flowering
(no of days)
Pod height in
cm
ALS (scale 1-10)
CBB (scale 1-10)
Rust (scale 1-10)
95% maturity (no
of days)
Grain yield
(kg/ha)
1 100 42 2.33 1.67 4 1 91.33 2168 2 100 39 2.33 2.67 4.67 1.333 90 2516 3 100 39.67 4 3 4.33 1 89.67 2541 4 99.67 36.33 4 3 5.33 1.333 87.67 1681 5 99.33 34.67 7 2.67 6.33 1.667 85 1743 6 99 38 7 4 5.67 2 88.67 1794 7 100 36.33 5.33 3.67 6.67 1.667 87.33 2128 8 99.33 35 6 2.67 6 2.333 85.67 1619 9 98 35 5 3 6 1.333 85 1530
10 99.33 35 5.33 2.67 6 1.333 85.67 1536 11 97.33 35 5.33 2.67 5.33 1.333 85.67 1448 12 99.67 35 5.33 6.67 5.33 1 85.67 1912 13 98 34.67 9 3.33 4.67 1.333 85.33 1365 14 98.33 34.67 3.33 2.67 6.33 1 85.33 1582 15 99.67 35 3 4 6 1.333 85 1874 16 99.67 39.67 5 3 5.67 1 90 1787 17 100 35 5 3.67 6.67 1.333 86 1911 18 100 38.33 6.67 2.33 6 6 88.67 1847 19 98.33 35 6.33 4.67 5.33 1 86.67 1375 20 99 37.33 4.33 3.33 5.33 1.333 88.33 1680 21 98.67 34.67 4.67 4.33 6.33 1.667 84.67 1590 22 99 35 5 5.33 6.33 1 85.33 1856 23 99.67 40 6 5.33 5.33 1 90 1906 24 99.67 37 2.67 2.67 5.33 1.667 91.67 1823 25 100 40 4 3 4 2.667 91.33 1976
Germination Percentage The twenty five common bean (Phaseolus vulgaris L.) genotypes that were
evaluated had the similar (p < 0.05) germination percentages as shown in Figure 1. The analysis of variance at 5 % level of significance indicated that there is no significant difference across the three replications for both released local varieties

Evaluation of common bean (Phaseolus vulgaris l.) genotypes for disease tolerance… 103
and breeding lines (P>0.05). The standard error of difference (s.e.d) which was used to draw error bars was ± 0.914.
Figure 1. The germination percentage of the common bean (Phaseolus
vulgaris L.) genotypes Days to 50 % flowering The analysis of variance for days to 50 % flowering at 5 % level of
significance proved that there was a significant difference among the genotypes which were used as experimental units. The standard error of difference (s.e.d) which was used to draw error bars on the bar chart in Figure 2 was ± 1.147.
Figure 2. Bar graph on days to 50% flowering for the 25 common bean
(Phaseolus vulgaris L.) genotypes. Pod clearance For pod clearance, the analysis of variance at 5 % level of significance
showed that there was a significant difference between genotypes (P<0.05) as shown in Figure 3. The standard error of differences that used for error bars is ± 1.178.
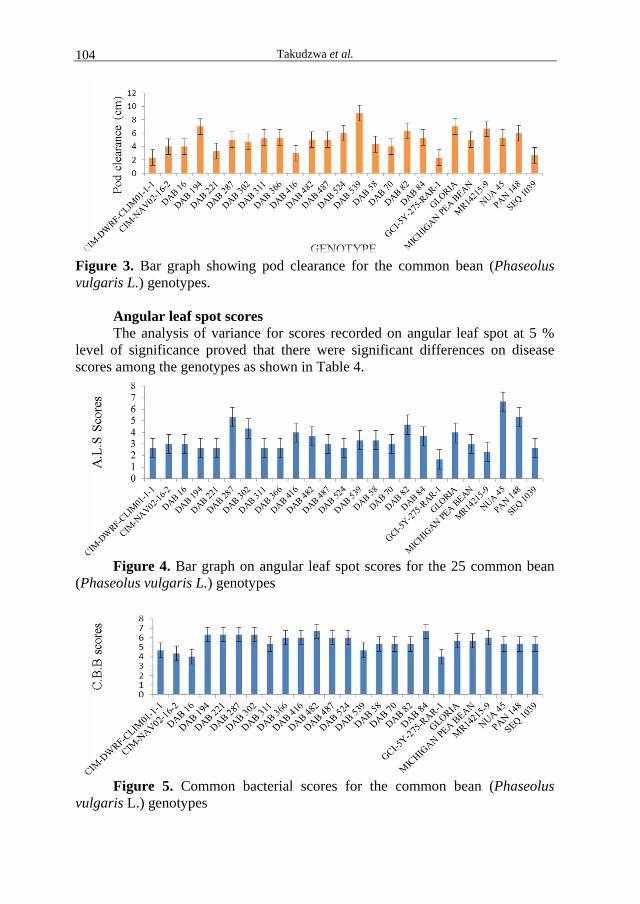
Takudzwa et al. 104
Figure 3. Bar graph showing pod clearance for the common bean (Phaseolus vulgaris L.) genotypes.
Angular leaf spot scores The analysis of variance for scores recorded on angular leaf spot at 5 %
level of significance proved that there were significant differences on disease scores among the genotypes as shown in Table 4.
Figure 4. Bar graph on angular leaf spot scores for the 25 common bean
(Phaseolus vulgaris L.) genotypes
Figure 5. Common bacterial scores for the common bean (Phaseolus
vulgaris L.) genotypes

Evaluation of common bean (Phaseolus vulgaris l.) genotypes for disease tolerance… 105
Common bacterial blight scores The analysis of variance for scores recorded for common bacterial blight at
5 % level of significance proved that there were significant differences on disease scores among the genotypes as shown in Figure 5. Error bars were drawn using standard error of differences value of ± 0.766.
Rust scores At 5 % level of significance the analysis of variance for rust severity on
bean genotypes sourced from CIAT and local released varieties showed that there were significant differences (P<0.05) as shown on Figure 6. The error bars were drawn using standard error of difference of ± 0.6394.
Figure 6. Rust scores for the 25 common bean (Phaseolus vulgaris L.)
genotypes
Days to 95 % physiological maturity The analysis of variance for days taken to attain 95 % physiological
maturity by genotypes was found to be significantly different at 5% level of significance (P<0.05) as shown in Figure 7. The error bars on the bar graph (figure 7) were drawn from standard error of difference (s.e.d) of ± 1.523.
Figure 7. Days to 95% physiological maturity for the 25 common bean (Phaseolus vulgaris L.) genotypes

Takudzwa et al. 106
Seed yield (kg/ha) Analysis of variance on grain yield (kg/ha) indicates that there is a
significant difference in yield attained by breeding lines and local check varieties (P <0.05) as shown in Figure 8. Error bars were drawn from standard error of difference value of ± 241.
Figure 8. Grain yield for the 25 common bean (Phaseolus vulgaris L.) genotypes
DISCUSSION The twenty five bean genotypes that were evaluated had the same capacity
to germinate as evidenced by similar emergence counts that were obtained in this study. Results obtained suggest that these bean genotypes do not differ in terms of plant hormones that stimulate germination. Some of the germination stimulants that have been identified are electro and sorgoleone produced by cowpea and sorghum respectively (Rambakudzibga, 2000). This would suggest that bean genotypes evaluated in this study are very resistant to stem maggot infection due to their ability to produce high levels of germination percentage. Common bacterial blight and angular leaf spot infection reduced shoot biomass, pod numbers, pod weight and grain yield. Only two genotypes, CIM-DWRF-CLIM01 and CIM-NAV02-16-2 managed to produce pods and grain under infection. These results concur with findings by Mugabe (2008) and Alonge et al. (2001) who reported that early infection delayed the onset of flowering, reduced number of flowers and resulted in a concomitant decrease in the number of pods per plant and low grain yield.
Whilst common bacterial blight prevalence in this study suggested that all the bean genotypes were highly susceptible; the ability of the two breeding genotypes, CIM-DWRF-CLIM01 and CIM-NAV02-16-2 to produce pods and grain under Xanthomonas phaseoli infection suggests that these genotypes have some degree of tolerance to this bacterium pathogen. Haussman et al. (2000) reported that the susceptibility of the host may not be explained by the disease score on plants but probably by the host genotype. Infection of plants by Xanthomonas phaseoli results in an increase in sink demand in the leaves. This carbon transfer from the leaves to the photosynthetic system due to changes in sink demands largely accounts for the reduction in pod biomass and was reported to be responsible for the reduction in pod formation (Rambakudzibga, 2000). Similar findings were obtained in other host parasite associations involving tomato and tobacco infected with Orobanche aegyptiaca (Hibberd et al., 1996) and sorghum infected with S. hermonthica (Cechin and Press, 1993).

Evaluation of common bean (Phaseolus vulgaris l.) genotypes for disease tolerance… 107
For angular leaf spot, disease development started during the third week after inoculation. The more resistant genotypes to Phaseoriopsis griseola were GCI-5Y-275-RAR-1, CIM-DWRF-CLIM01-1-1 and DAB 524 while NUA 45 was the most susceptible genotype to Phaseoriopsis griseola. Angular leaf spot is not an important disease in most bean producing areas, however, under favorable environmental conditions, disease epidemics can occur. Optimal temperatures for germination of conidia of P. griseola range between 23 to 27°C, and infection occurs from 16 to 28°C with the optimum for infection and disease development at 24°C (Belete and Bastas, 2017) Frequent rain and high humidity are important for the initiation of disease and are considered more important than temperature. The results are similar to Pastor-Corrales et al. (2007) who screened 22,832 cultivated and wild common bean accessions for resistance to ALS and found most were susceptible, with only 59 showing an intermediate response and 64 showing a resistant response.
Transmission of pathogens which causes bacterial diseases in common beans is accelerated by low pod clearance. In this study, although there was a significant difference between commercial varieties and breeding lines in relation to pod height, DAB 539, Gloria and DAB 194 had the highest clearance from the ground. These genotypes have the potential to be crossed with other breeding lines with high yielding ability so as to come up with a superior variety with both high yield and pod clearance. Photoperiod (Ppd) controlling genes had a large effect on the height of the crop and thus on the environment, and degree of infection, that leaves were exposed to during their emergence and expansion. Disease severity at a given calendar date, for a given leaf layer was consistently greater on the more mature lines due to the longer period of exposure. It is generally assumed that, when screening for resistance, this maturity effect can be adjusted for by regressing disease severity with date of heading. However, our observations suggest that this might only be appropriate if infection conditions are consistent over time, or vary progressively due to rainfall seasonality. During the period which the project was done, rainfall was sporadic. A more appropriate method of screening would therefore be to compare leaves that emerge concurrently and therefore share similar rainfall.
CONCLUSIONS The study concludes that the performance of advanced common bean
genotypes and commercial varieties differs in relation to agronomic factors. Moreover, it can be concluded that all the common bean genotypes evaluated are susceptible to common bacterial blight infection. However, it can also be concluded that the two breeding lines CIM-NAV02-16-2 and CIM-DWRF-CLIM01-1-1 are moderately susceptible because they were able to produce highest grain yield. Therefore further selection and studies need to be done on these genotypes before release for commercial production. Genotypes GCI-5Y-275-RAR-1, DAB 311, DAB 366, MR14215-9 and DAB 524 were found to be less susceptible to angular leaf spot pathogen Phaseoriopsis griseola; with scores of less than 3 on the Cobb’s scale. Effect of inoculating the bean genotypes with Uromyces appendiculatus in this experiment was not much significant, scores for most genotypes ranged between 1 and 2 except for MR14215-9 which was exceptional recording 6 on the Cobb’s scale.
Takudzwa et al. 108
REFERENCES Alonge. S. O, Lagoke, S. T. O. and Ajakaiye, G. O. (2001). Cowpea reaction to Alectra vogelii II.
Crop Protection, 20(4): 283-290. Belete T and Bastas KK (2017) Common Bacterial Blight (Xanthomonas axonopodis pv. phaseoli)
of Beans with Special Focus on Ethiopian Condition. J Plant Pathol Microbiol 8: 403. doi: 10.4172/2157-7471.1000403
Bitocchi, E, Nanni, L Bellucci, E, Rossi, M, Giardini, A, Spagnoletti, P, Giuseppina L, Stougaard, J McClean, P, Attene, G and Papa, R (2012). Mesoamerican origin of the common bean (Phaseolus vulgaris L.) is revealed by sequence data. Proceedings of Academy of Sciences of the United States of America, doi: 10.1073/pnas.1108973109
Broughton WJ, Hernandez G, Blair M, Beebe S, Gepts P, et al. (2003) Beans (Phaseolus spp.) model food legumes. Plant Soil 252: 55-128.
Cechin, I. and Press, M. C. (1993). Nitrogen relations of the sorghum-Striga hermonthica host-parasite association: growth and photosynthesis. Plant,Cell and Environment, 16: 237-247.
Cortes A.J, Monserrate F.A, Ramírez-Villegas J, Madriñán S, Blair M (2013). Drought tolerance in wild plant populations: The case of common beans (Phaseolus vulgaris L.). PLoS ONE 8: e6289.
Deshpande, S. S., 1991. Legumes. In Salukhe, D. K (ed.). Foods of plant origin. Springer International Publishing, New York.
Frahm, M.A., J.C. Rosas,N. Mayek-Perez, E. Lopez-Salinas, J.A. Acosta-Gallegos, J.D. Kelly. 2004. Breeding Beans for Resistance to Terminal Drought in the Lowland Tropics. Euphytica 136:223-232.
Freytag, G.F and DG Debouck. (2002). Taxonomy, Distribution and Ecology of the genus Phaseolus (Leguminosae- Papilionoideae) in North America, Mexico and Central America. SIDA, Botanical Miscellanious No. 23:1-300.
Gray, S (2013). Vegetables: Growing Green Beans in Home Gardens. Washington State University extension fact sheet • FS088E. WSU Lewis County Extension, Chehalis, WA. USA
Haussman, B. I. G, Hess, D. E., Reddy, B. V. S., Welze, H. G and Geiger, H. H. (2000). Analysis of resistance to Striga hermonthica in diallel crosses of sorghum. Euphytica, 116: 33-40.
Hibberd, J. M., Quick W. P., Press M. C. Scholes J. D (1996). The influence of the parasitic angiospermStriga gesnerioides on the growth and photosynthesis of its host, Vigna unguiculata. J. Exp. Bot. (1996) 47 (4): 507-512. doi: 10.1093/jxb/47.4.507
Liebenberg, A.J., (Ed.) 2002. Dry bean production. Department of Agriculture and obtainable from Resource Centre, Directorate Agricultural Information Services Private Bag X144, Pretoria, 0001 South Africa.
Makini, F.W., 1994. Bean production and constraints in kenya with emphasis on diseases. In: Breeding for disease resistance with emphasis on durability. Proceedings of the Regional Workshop for Eastern, October 2-6, 1994, Central and Southern Africa, Held at Njoro, Kenya, pp: 104-109.
Mugabe, N. R. (1983). Effect of Alectra vogelii (Benth) on cowpea (Vigna unguiculata (L.) Walp.). Some aspects on reproduction of cowpea. Zimbabwe Journal of Agricultural Research, 21: 35-147.
Mupepereki, S. Javaheri, F. Davis, P. and Giller, K. E. 2000. Soybeans and Sustainable agriculture: promiscuous soyabean in Southern Africa. Field Crop Research 64: 137 - 149.
Musyimi, A. S. marker assisted gamete selection for multiple disease resistence in Andean Bean genotypes and characterization of Colletotrichum lindemuthianum in Kenya. BSc Agriculture (Hons Crop Science), University of Nairobi.
Navarrete-Maya, R.E. Trejo-Albarran. J. Navarrete-Maya, J.M. Prudencio Sains & J.A. Acosta-Gallegos, (2002). Reaction of bean genotypes to Fusarium sp. And Rhizoctonia solani in central Mexico. Annual Report Bean Improvement Cooperative 45:154-155.
Pastor Corrales, M.A., Kelly, J.D., Steadman, J.R., Lindpren, D.T., Stavely, J.R., Coyne, D.P. 2007. Registration of six great northern bean germplasm lines developed for enhanced resistance to rust and bean common mosaic and necrosis potyviruses. Journal of Plant Registrations. 1:77-79.
Rambakudzibga, A. M. (2000). Aspects of the host-parasite association between the grain legume Vigna unguiculata L. (Walp) and the parasitic angiosperm Alectra vogelii Benth. [Phd Thesis]. der Justus-Liebig-Universitat Gieben, Gieben, Germany.
Tadesse T, Ahmed S, Gorfu D, Beshir T, Fininsa C, et al. (2009) Review of research on diseases food legumes. In: Tadesse A (Ed). Increasing crop production through improved plant protection. Volume 1. Proceeding of the 14th annual conference of the plant protection society of Ethiopia (PPSE), Ethiopia.
https://www.ncbi.nlm.nih.gov/pubmed/?term=Bitocchi%20E%5BAuthor%5D&cauthor=true&cauthor_uid=22393017
https://www.ncbi.nlm.nih.gov/pubmed/?term=Bellucci%20E%5BAuthor%5D&cauthor=true&cauthor_uid=22393017

Agriculture & Forestry, Vol. 63 Issue 3: 109-116, 2017, Podgorica 109
DOI: 10.17707/AgricultForest.63.3.11 Miljan VELJIĆ, Dušica RADONJIĆ, Milena ĐOKIĆ1 EFFECT OF LIGHTING PERIOD AND DIETS DENSITY OF BROILES
ON THE APPEARANCE OF LESIONS ON THE FOOT PADS
SUMMARY The experiment involved 320 chickens of the line Cobb 500, both sexes, a
cycle lasted 42 days. The floor area was covered with 10 cm of sawdust. The factors in this experiment were: 1) lighting program (constant light -
CL, declining light - DL and then growing light –GL; and 2) density of diets at a constant energy-protein ratio (mixture of lower energy and protein - LEP and mixtures with a higher content of energy and protein - HEP).
The chickens were divided into four groups in the form of two-factorial trial randomized block design (2x2) - four repetitions with 20 birds per repetition.
Chickens in control group „LE'' were fed with standard starter and grower mixtures. Chickens in ,,HEP'' were fed with standard mixtures with addition of oil and soybean meal.
Assessment of damage and the presence of lesions in all experiments were carried out on 21st, 28th, 35th and 42nd day of the cycle. Condition of foot pads of all chickens was assessed by three-step method for assessing dermatitis (Tomas et al. 2004). The applied lighting programs and diets density had no effect on the appearance of lesions on the foot pads.
Keywords: broilers, lighting period, diets density, lesions of the foot pads
INTRODUCTION In order to determine the level of animal welfare for chicken, in addition to
other parameters, the assessment of the condition and appearance of lesions on foot pads, hocks and chest is used. These three parameters represent an indication of accommodation condition, general welfare of chicken and production systems in Europe and the United States (Berg, 2004; Berg and Algers, 2004;). Lesions of the hock and chest indicate bad conditions of keeping and movement of chickens. Poultry with difficult foot pads damages has a reduced growth because reduced food intake, which is due to pain that occurs during moving (Martland, 1984, 1985). Different lighting programs lead to changes in the behavior and physical activity of broilers, and thus affect the welfare of the individuals (Škrbić et al. 2009). Different lighting programs can be used to reduce damage on the pads. Thus, Van Harn (2009) compared the influence of two light modes (constants and alternating) on appearance of damage to the pads. The results of this study have shown that alternating light regime significantly reduces occurrence the
1Miljan Veljić (corresponding author: [email protected]), Dušica Radonjć, Đokić Milena, University of Montenegro, Biotechnical faculty, Podgorica, MONTENEGRO. Notes: The authors declare that they have no conflicts of interest. Authorship Form signed online.

Veljic et al. 110
lesions on foot pads. The author explained this result by increasing activity of chicken when the light is on, resulting in a greater degree disperse of sawdust.
Increased physical activity of the chicken caused by regular changing of light and darkness in alternating lighting program and total duration of the photoperiod of 16 hours leads to an improvement in resistance broiler legs and the reduction of problems with the formation of foot lesions (Škrbić et al., 2009).
Studding the effects of two light programs: a) continuously reduced photoperiod 18L: 6D and b) "step by step" program- gradual extension of the light period after the start of the restriction 16L: 8D, Škrbić et al. (2014) found greater presence of lesions on broiler foot pads at the first than in the second program, and differences were statistically significant.
The higher frequency of severe lesions on foot pads in continuous light program compared to the intermittent light program was determined by Petek i sar. (2010). Unlike the above research, Sirri et al. (2007) did not determine the effects of light on the appearance of lesions on foot pads.
Schwean-Lardner et al. (2013) examined how four light programs with a photoperiod of 14, 17, 20 and 23 hours influenced mortality, foot and eye health. In the 28-day-old chickens, there was no difference between researched light program in terms of the frequency of dermatitis on the foot pads, but the average score was greater and statistically significant in the conditions of prolonged photoperiod. At the age of 35 days, the higher frequency of chickens without lesions (grade 0) was determined at the length of photoperiod from 14 and 17 hours, compared to 20 and 23 hours. Also, the average grade of dermatitis was higher in chickens raring at longer photoperiods. In the age of 49 days, was not determined the effect of light programs on frequency, nor on average assessment of dermatitis on the foot pads.
Feed can influence on damage the foot pads over the quality of the sawdust. The quality sawdust is influenced by ratio of energy / protein, the crude protein content, the ratio of amino acids, the content of crude fats, the type of fat and the balance of electrolytes (Veldkamp and Van Harn, 2009). Except effects of feed on the damages foot pads over the quality of sawdust, it has been shown that the occurrence or absence of certain nutrients is affected by the appearance of the damage (Youssef et al., 2012; Abd El-Wahab et al., 2013).
Škrbić et al. (2014) examined the influence of standard and economical mixture on the occurrence of lesions on the foot pads. The mixes differed in the content of raw fat about 1%, the content of raw cellulose by about 0.5% and slightly higher content of total phosphorus in the starter and grover standard mixture, than to the corresponding economic mix. The authors found a significantly higher percentage of difficult lesions in chickens fed by economic mixtures as a result of the increased moisture content of the sawdust due to poor digestibility and nutritional value of the economic mixture, which affected the viscosity of digest which reduced water absorption and increased water loss by excretion.

Effect of lighting period and diets density of broiles on the appearance... 111
A high level of crude protein has a negative effect on the quality of the sawdust, as confirmed by the results of Ferguson et al. (1998) which show that content of moisture has increased with increasing protein content in the mixtures.
A high level of crude protein leads to greater formation of uric acid in the liver and its renal excretion (De Jong et al., 2010, 2015), which results in poor quality the sawdust and increases the risk of formation the lesions on foot pads. Shepherd and Fairchild (2010) show that diet with unbalanced mixtures in terms of crude protein has the same effect.
Bilgili et al. (2005), in research with 4 different nutritional programs (different concentrations of nutrients in the meal), showed that concentration of nutrients in the meal significantly influenced appearance of lesions on foot pads. To the same conclusion came Bilgili i sar. (2006) researching effect of mixtures with different levels of protein and metabolic energy on the occurrence of lesion foot pads of broiler. They compared the starter and gover mixture with an increased amount of proteins (starter: 21 and 21.5%, grover: 19.76 and 20%) and energy (starter: 3109 and 3193 kcal; grover: 3158 and 3226 kcal). Assessment of the presence and size of lesions on the pads was performed on 35, 42, 49 and 56 days. The results of comparison two types of mixtures at all researched ages showed statistically significantly higher percentage of broilers without lesions when feeding with mixtures with lower levels of proteins and energy.
The aim of this research was to determine the effect of a light program and density meal on the occurrence of lesions on foot pads.
MATERIALS AND METHODS
In research was involved total of 320 chickens of line-shaped hybrid Cobb 500, mixed sex, and research lasted for 42 days. The floor area of the stall was covered with sawdust thickness of 10 cm.
The factors in this experiment were: 1) lighting program (constant light - CL, declining light - DL and then growing light –GL; and 2) density of diets at a constant energy-protein ratio (mixture of lower energy and protein - LEP and mixtures with a higher content of energy and protein - HEP).
The chickens were divided into four groups in the form of two-factorial trial randomized block design (2x2) - four repetitions with 20 birds per repetition: a) chickens fattened in a constant light (CL) and a lower diets density (LEP); b) chickens fattened in a constant light (CL) and higher diets density (HEP); c) chickens fattened in declining-growing light (DGL) and a lower diets density (LEP); d) chickens fattened in declining-growing light (DGL) and higher diets density (HEP).
Chickens in all four groups in the first week were raised on 23 hours of light and 1 hour of darkness.
From the second week to the end of fatting period, chickens in groups a and b were exposed to the CL light program of 18L: 6D, while the chickens in the groups c and d were exposed to the GL light program, as follows: from the

Veljic et al. 112
second week 12L: 12D; third 1LS; 10D; fourth 16L: 8D: fifth 18L: 6D and sixth 20L: 4D.
The floor area was covered with 10 cm of sawdust. The population density was 17 chickens per m2. Chickens in control group „LE'' were fed with standard mixtures.
The starter mixture with which the chickens were feeding from the first to 14 days contained 12,30 MJ / kg ME and 21,22% SP and a ratio E / SP 138; grover mixture contained 12.49 MJ / kg ME and 20.19% SP with E / SP ratio of 147 and finisher with 12.69 MJ / kg ME and 18.64 SP with E / SP ratio of 162.
Chickens in ,,HEP'' were fed with standard mixtures with addition of oil and soybean meal. The starter mixture with wich the chickens were feeding from the first to 14 days contained 12.76 MJ / kg ME and 22.04% SP and a ratio E / SP 138; Grover mixture contained 12.98 MJ / kg ME and 20.98% SP with an E / SP ratio of 147 and a finisher with 13.22 MJ / kg ME and 19.39 SP with an E / SP ratio of 162.
Assessment of damage and the presence of lesions in all experiments were carried out on 21st, 28th, 35th and 42nd day of the cycle. Condition of foot pads of all chickens was assessed by three-step method for assessing dermatitis (Tomas et al. 2004), with marks 1,2,3.
Mark 1 Mark 2 Mark 3
Figure 1. Photo of food pads with estimates in accordance with the applied assessment methodology (Tomas et al 2004)
Exist differences in criterion: mark 1- refers to foot pads without lesions (lesions not exist or with very little surface damage, slight change in color of the restricted area of the foot); mark 2 is assigned for medium-heavy lesions (mild damage, changes in the color of the foot skin, surface damage, dark papillae and thickening) and mark 3 for severe lesions (significant damage, epidermis is affected, the existence of ulcers, there are signs of bleeding or overdoze of foot pad) as shown in the pictures.
The data were processed by the computer program STATISTICA 6. Mean values and variation measures were determined. An analysis of variance (ANOVA) was done, and in the case of statistical significance in the analysis of variance, the LSD test at the level at significance level of 5% and 1% was applied.

Effect of lighting period and diets density of broiles on the appearance... 113
RESULTS AND DISCUSSION Effects of light and density of population on frequency of lesions on foot
pads with marks: 1 - no lesions; 2 - the appearance of mild lesions and the 3 - severe form of lesions in the third, fourth, fifth and sixth week of chick age are shown in Tables 1, 2, 3 and 4.
Table1. Average grade and frequency of occurrence (%) lesions on foot pads at 21 day old chickens
Treatments Factors level Frequency Average grade Grade 1 Grade 2 Grade 3
Light program CL X ± Sd 85,97±2,40 14,03±2,40 0,00±0,00 1,15±0,37
DLP X ± Sd 83,41±6,00 12,78±4,75 3,81±3,57 1,20±0,49
Density of diets LEP X ± Sd 86,74±5,22 12,01±4,52 1,25±2,31 1,14±0,38
HEP X ± Sd 82,64±2,94 14,79±2,08 2,57±4,46 1,21±0,48 LP Ns ns Ns ns DD Ns ns Ns ns
CL – constant light (I week 23L:1D; form II to VI weeks 18L:6D); DLP- decrising - incrising light program (I week 23L:1D; II nedelja12L:12D; III weeks 14L:10D; IV week 16L:8D; V week 18L:6D and VI weeks 20L:4D HEP- high energy and protein content. LEP- low energy and protein content; ns – nonsignificant differences p>0.05;
There were no differences between chickens raised at CL and on DLP, on incidence rate (%) of the lesions and at the average grade in any test period. Our results are in agreement with the results of Sirri and sar. (2007), which also did not determine the impact of a light program on the appearance of lesions on the foot pads. Contrary to these studies, Van Harn (2009) found that the alternating light program significantly reduced the occurrence of lesions of food pads compared to the constant light program, and this is explained by the increased activity of the chickens during the period turn light, resulting in a greater disperse sawdust. The higher incidence of severe lesions on foot pads in the continuous light compared to the intermittent light program was determined by Petek i sar. (2010), while Škrbić et al. (2014) determined a higher presence of lesion on foot pads at a constant-reduced photoperiod (18L: 6D) compared to step-by-step program gradually extending the light period after the start of the restriction 16S: 8M.
The differences between the groups of chickens fed with LE and HEP are not statistically significant (P> 0.05) on appearance of lesions on foot pads of the 21st, 28th, 35th and 42nd days. (Tables 1, 2, 3 and 4).
However, in all study periods, the tendency of reducing difficult forms of lesions was observed (mark 3) in chickens which were fed with lower protein and energy content compared to the group which were fed with higher contents of protein and energy.

Veljic et al. 114
Table 2. Average grade and frequency of occurrence (%) lesions on foot pads at 28 day old chickens
Treatments Factors level Frequency Average grade Grade 1 Grade 2 Grade 3
Light program
CL X ± Sd 73,34±6,56 20,31±6,30 6,35±4,40 1,33±0,59
DLP X ± Sd 72,65±4,34 19,61±6,79 7,74±4,25 1,36±0,62
Density of diets
LEP X ± Sd 74,67±4,75 19,01±4,63 6,32±4,41 1,32±0,59
HEP X ± Sd 71,32±5,76 20,90±7,91 7,78±4,22 1,37±0,63 LP ns ns ns ns DD ns ns ns ns
CL – constant light (I week 23L:1D; form II to VI weeks 18L:6D); DLP- decrising - incrising light program (I week 23L:1D; II nedelja12L:12D; III weeks 14L:10D; IV week 16L:8D; V week 18L:6D and VI weeks 20L:4D HEP- high energy and protein content. LEP- low energy and protein content; ns – nonsignificant differences p>0.05; Table 3. Average grade and frequency of occurrence (%) lesions on foot pads at 35 day old chickens
Treatments Factors level Frequency Average grade Grade 1 Grade 2 Grade 3
Light program
CL X ± Sd 62,80±3,45 24,99±5,60 12,21±4,77 1,49±0,70
DLP X ± Sd 62,72±5,87 25,49±4,26 11,80±3,80 1.49±0,70
Density of diets
LEP X ± Sd 63,16±5,60 25,20±5,34 11,65±4,73 1,48±0,70
HEP X ± Sd 62,36±3,82 25,28±4,59 12,36±3,82 1,50±0,71
LP ns ns ns ns
DD ns ns ns ns CL – constant light (I week 23L:1D; form II to VI weeks 18L:6D); DLP- decrising - incrising light program (I week 23L:1D; II nedelja12L:12D; III weeks 14L:10D; IV week 16L:8D; V week 18L:6D and VI weeks 20L:4D HEP- high energy and protein content. LEP- low energy and protein content; ns – nonsignificant differences p>0.05;
Results of Ferguson et al. (1998) indicate that the increase in protein content in the mixtures resulted an increase moisture content in the sawdust, which caused a greater frequency of the lesions on foot pads.
High level of crude protein leads to a greater formation of uric acid in the liver and its renal excretion (De Jong et al., 2010), which results in poor quality the sawdust and increases the risk of the formation of the lesions on foot pads. Biligili i sar. (2006) found that chickens which were fed at higher energy levels had a higher percentage of lesions on foot pads of the 35th, 42nd, 49th, and 56th days compared to those fed with a lower level of energy. In the research of De Yong et al. (2015), the opposite was found - the higher frequency of lesion on foot pads in chickens which were fed with lower than higher level of energy,
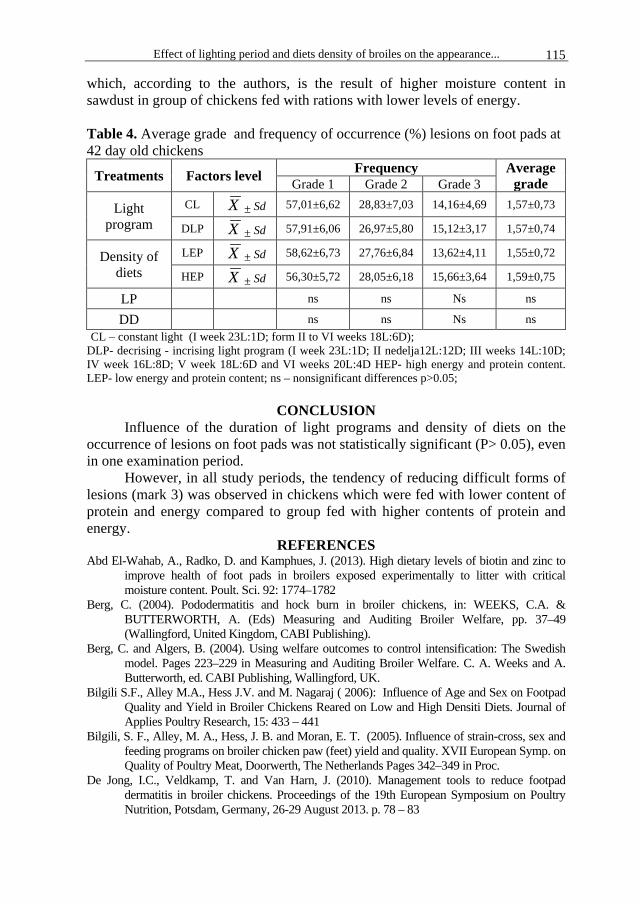
Effect of lighting period and diets density of broiles on the appearance... 115
which, according to the authors, is the result of higher moisture content in sawdust in group of chickens fed with rations with lower levels of energy.
Table 4. Average grade and frequency of occurrence (%) lesions on foot pads at 42 day old chickens
Treatments Factors level Frequency Average grade Grade 1 Grade 2 Grade 3
Light program
CL X ± Sd 57,01±6,62 28,83±7,03 14,16±4,69 1,57±0,73
DLP X ± Sd 57,91±6,06 26,97±5,80 15,12±3,17 1,57±0,74
Density of diets
LEP X ± Sd 58,62±6,73 27,76±6,84 13,62±4,11 1,55±0,72
HEP X ± Sd 56,30±5,72 28,05±6,18 15,66±3,64 1,59±0,75
LP ns ns Ns ns
DD ns ns Ns ns CL – constant light (I week 23L:1D; form II to VI weeks 18L:6D); DLP- decrising - incrising light program (I week 23L:1D; II nedelja12L:12D; III weeks 14L:10D; IV week 16L:8D; V week 18L:6D and VI weeks 20L:4D HEP- high energy and protein content. LEP- low energy and protein content; ns – nonsignificant differences p>0.05;
CONCLUSION
Influence of the duration of light programs and density of diets on the occurrence of lesions on foot pads was not statistically significant (P> 0.05), even in one examination period.
However, in all study periods, the tendency of reducing difficult forms of lesions (mark 3) was observed in chickens which were fed with lower content of protein and energy compared to group fed with higher contents of protein and energy.
REFERENCES Abd El-Wahab, A., Radko, D. and Kamphues, J. (2013). High dietary levels of biotin and zinc to
improve health of foot pads in broilers exposed experimentally to litter with critical moisture content. Poult. Sci. 92: 1774–1782
Berg, C. (2004). Pododermatitis and hock burn in broiler chickens, in: WEEKS, C.A. & BUTTERWORTH, A. (Eds) Measuring and Auditing Broiler Welfare, pp. 37–49 (Wallingford, United Kingdom, CABI Publishing).
Berg, C. and Algers, B. (2004). Using welfare outcomes to control intensification: The Swedish model. Pages 223–229 in Measuring and Auditing Broiler Welfare. C. A. Weeks and A. Butterworth, ed. CABI Publishing, Wallingford, UK.
Bilgili S.F., Alley M.A., Hess J.V. and M. Nagaraj ( 2006): Influence of Age and Sex on Footpad Quality and Yield in Broiler Chickens Reared on Low and High Densiti Diets. Journal of Applies Poultry Research, 15: 433 – 441
Bilgili, S. F., Alley, M. A., Hess, J. B. and Moran, E. T. (2005). Influence of strain-cross, sex and feeding programs on broiler chicken paw (feet) yield and quality. XVII European Symp. on Quality of Poultry Meat, Doorwerth, The Netherlands Pages 342–349 in Proc.
De Jong, I.C., Veldkamp, T. and Van Harn, J. (2010). Management tools to reduce footpad dermatitis in broiler chickens. Proceedings of the 19th European Symposium on Poultry Nutrition, Potsdam, Germany, 26-29 August 2013. p. 78 – 83

Veljic et al. 116
De Jong, Ingrid C , Lourens, A.and van Harn.J. (2015):Effect of hatch location and diet density on footpad dermatitis and growth performance in broiler chickens.J. Appl. Poult. Res. 24:105–114
Ferguson, N. S., Gates, R. S., Taraba, J. L., Cantor, A. H., Pescatore, A. J., Ford, M. J. and Burnham, D. J. (1998). The effect of dietary crude protein on growth, ammonia concentration, and litter composition in broilers. Poult. Sci. 77:1481–1487
Martland, M. F. (1984). Wet litter as a cause of plantar pododermatitis, leading to foot ulceration and lameness in fattening turkeys. Avian Pathol. 13:241–252.
Martland, M. F. (1985). Ulcerative dermatitis in broiler chickens: The effects of wet litter. Avian Pathol. 14:353–364.
PetekMetin,Cibik Recep, Yildiz Huseyin, Sonat AkFisun, Gezen Sule Serife, Orman Adbulkadir, Aydin Cenk. (2010):The influence of different lighting programs, stocking densities and litter amounts on the welfare and producitivity traits of a commercial broiler line. Veterinarija in zootechnika 51(73)
SCHWEAN-LARDNER K., FANCHERB. I.,GOMISS.,VAN KESSELA.,DALAL S.,CLASSEN H.L.(2013):Effectof day lenght on cause of mortality ,leg health,and ocular health in broilers.Poultry Science,92:1-11
Shepherd E. M. and Fairchild B. D. (2010): Footpad dermatitis in poultry. Poultry Science 89 :2043–2051 doi: 10.3382/ps.2010-00770
Siri F., Minelli G., Folegatti E., Lolli S., Meluzzi A. (2007): Foot dermatitis and productive traits in broiler chickens kept with different stocking densities, litter types and light regimen. Ital. J. Anim, Sci. Vol.6 (suppl.1),734-736

Agriculture & Forestry, Vol. 63 Issue 3: 117-126, 2017, Podgorica 117
DOI: 10.17707/AgricultForest.63.3.12 Bijan ABADI 1
A REVIEW OF THE IMPACT OF THE TARGETING SUBSIDY PLAN ON THE INPUT USE BEHAVIOR OF FARMERS IN IRAN
SUMMARY
Subsidies in agriculture are delivered with different purposes, such as increasing monetary revenues, improving productivity, stabilizing prices, and conserving the environment. Witness testimonies indicate that agricultural subsidies are often ineffective in practice due to their negative consequences, like an increase in agricultural input use, degradation of natural resources, decrease in productivity, and addition in costs. The Iranian government has initiated the implementation of a new transformation scheme known as the targeting subsidy plan. In this regard, the study on the impact of such a scheme on farmers’ input use behavior is still inadequate and research should be conducted to fill this knowledge gap. Therefore, this study investigates the impact of the targeting subsidy plan on farmers’ input use behavior. Using archival and library resources, we reviewed recent papers on the impact of such a scheme on farmers’ input use behavior. The reviewed papers include topics such as the definition of subsidy, types of subsidies, agricultural subsidies, the targeting subsidy plan, and the input use behavior of the farmers. Most of the research in this area concludes that the targeting subsidy plan—in the form of the either eliminating or targeting—has substantially influenced farmers’ behavior and altered the way in which farmers use agricultural inputs. Although the social impacts of such a scheme are still ambiguous in the rural areas of Iran, the paper serves as a reference for researchers who would work in the field of subsidy.
Keywords: Targeted subsidy, Agricultural inputs, Farmers, Iran
INTRODUCTION The agricultural sector is rigidly challenged by uncertainties of the
ecological environment such as the mutability of climate and economic environments (e.g. the fluctuations of agricultural input price). In these circumstances, farmers struggle against risky conditions that may threaten their livelihood. Governments around the world implement new enterprises to alter the structure of the economy and improve market situations. For instance, the Iranian government has undertaken the targeting subsidy plan as a purposive initiative to subsidize payments. Regardless of the economic purpose, such schemes may only have environmental aims. In this respect, there are numerous policies that can be implemented for achieving efficient usage behaviors, such as price,
1Bijan Abadi (corresponding author: [email protected]), The University of Maragheh, AmirKabir Highway, Golshahr Town, IRAN. Notes: The authors declare that they have no conflicts of interest. Authorship Form signed online.

Bijan Abadi 118
taxing, reward incentives (Linden et al., 2006), feedback (Martiskainen, 2007), technology and equipment diffusion (Abrahamse et al., 2005), and information (Wood and Newborough, 2003). The targeting subsidy plan is essentially a price-based policy. However, the price interventions may not always be efficient in changing the input use behavior (Bakhshi et al., 2012). The subsidy reform has a number of social, economic, and environmental consequences (Jalalian et al., 2013; Bakhshi et al., 2012). Evidence indicates an increase in energy consumption with a decrease in energy price (i.e. if the energy price is subsidized). For instance, the subsidized power price has increased the Iranian domestic energy consumption over the past three decades, considering a fixed size of population (see Fig. 1, RFE/ RL, 2010). As a result, subsidies are often inefficacious, high-priced, socially disparate, and environmentally damaging (Cox, 2005).
Figure 1: Electric power consumption (kWh per capita) (RFE/ RL, 2010) The present study investigates the impact of the targeting subsidy plan on
farmers’ input use behavior. For this purpose, we reviewed the outlines, such as definition of subsidy, subsidy types, the targeting subsidy plan, farmers’ input use behavior, and the impact of the targeting subsidy plan on farmers’ input use behavior.
MATERIALS AND METHODS
This study used qualitative methods. Library and archival resources were used to examine the impact of the targeting subsidy plan on the input use behavior of farmers. Therefore, we reviewed the literature on empirical papers from 2010 to 2017.
The definition of subsidy Subsidy is defined as the genuine estimated cash flow to and from the
government over a loan life, which is discounted so far (US Government Publishing Office, 2014). Subsidy is also defined as any monetary amount that helps maintain the consumer price below the market prices and the producer price above the market prices. Therefore, the expenditures of the consumers and producers are reduced (Naji Meidani and Sotoodeh Niakarani, 2015; Jalalian et
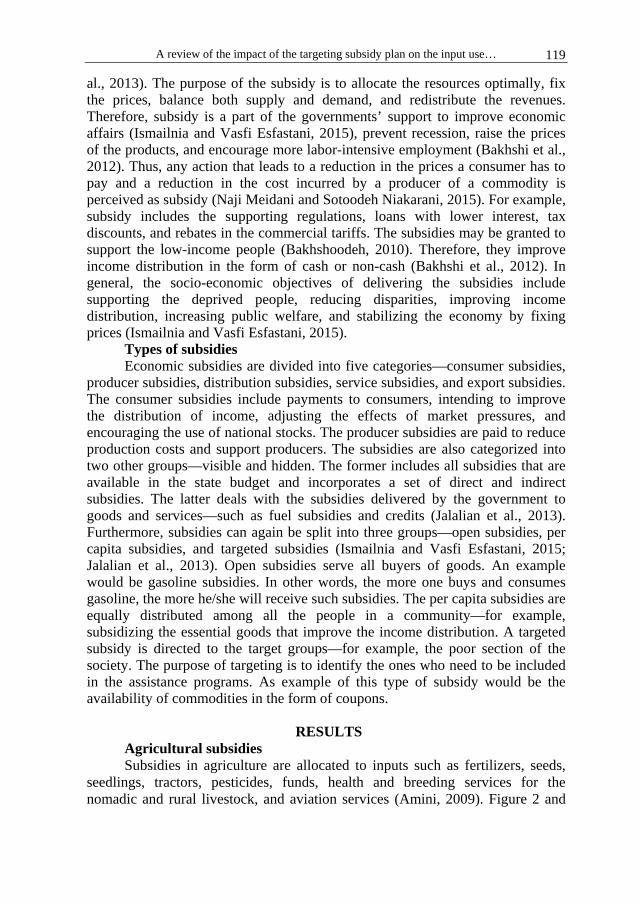
A review of the impact of the targeting subsidy plan on the input use… 119
al., 2013). The purpose of the subsidy is to allocate the resources optimally, fix the prices, balance both supply and demand, and redistribute the revenues. Therefore, subsidy is a part of the governments’ support to improve economic affairs (Ismailnia and Vasfi Esfastani, 2015), prevent recession, raise the prices of the products, and encourage more labor-intensive employment (Bakhshi et al., 2012). Thus, any action that leads to a reduction in the prices a consumer has to pay and a reduction in the cost incurred by a producer of a commodity is perceived as subsidy (Naji Meidani and Sotoodeh Niakarani, 2015). For example, subsidy includes the supporting regulations, loans with lower interest, tax discounts, and rebates in the commercial tariffs. The subsidies may be granted to support the low-income people (Bakhshoodeh, 2010). Therefore, they improve income distribution in the form of cash or non-cash (Bakhshi et al., 2012). In general, the socio-economic objectives of delivering the subsidies include supporting the deprived people, reducing disparities, improving income distribution, increasing public welfare, and stabilizing the economy by fixing prices (Ismailnia and Vasfi Esfastani, 2015).
Types of subsidies Economic subsidies are divided into five categories—consumer subsidies,
producer subsidies, distribution subsidies, service subsidies, and export subsidies. The consumer subsidies include payments to consumers, intending to improve the distribution of income, adjusting the effects of market pressures, and encouraging the use of national stocks. The producer subsidies are paid to reduce production costs and support producers. The subsidies are also categorized into two other groups—visible and hidden. The former includes all subsidies that are available in the state budget and incorporates a set of direct and indirect subsidies. The latter deals with the subsidies delivered by the government to goods and services—such as fuel subsidies and credits (Jalalian et al., 2013). Furthermore, subsidies can again be split into three groups—open subsidies, per capita subsidies, and targeted subsidies (Ismailnia and Vasfi Esfastani, 2015; Jalalian et al., 2013). Open subsidies serve all buyers of goods. An example would be gasoline subsidies. In other words, the more one buys and consumes gasoline, the more he/she will receive such subsidies. The per capita subsidies are equally distributed among all the people in a community—for example, subsidizing the essential goods that improve the income distribution. A targeted subsidy is directed to the target groups—for example, the poor section of the society. The purpose of targeting is to identify the ones who need to be included in the assistance programs. As example of this type of subsidy would be the availability of commodities in the form of coupons.
RESULTS Agricultural subsidies Subsidies in agriculture are allocated to inputs such as fertilizers, seeds,
seedlings, tractors, pesticides, funds, health and breeding services for the nomadic and rural livestock, and aviation services (Amini, 2009). Figure 2 and
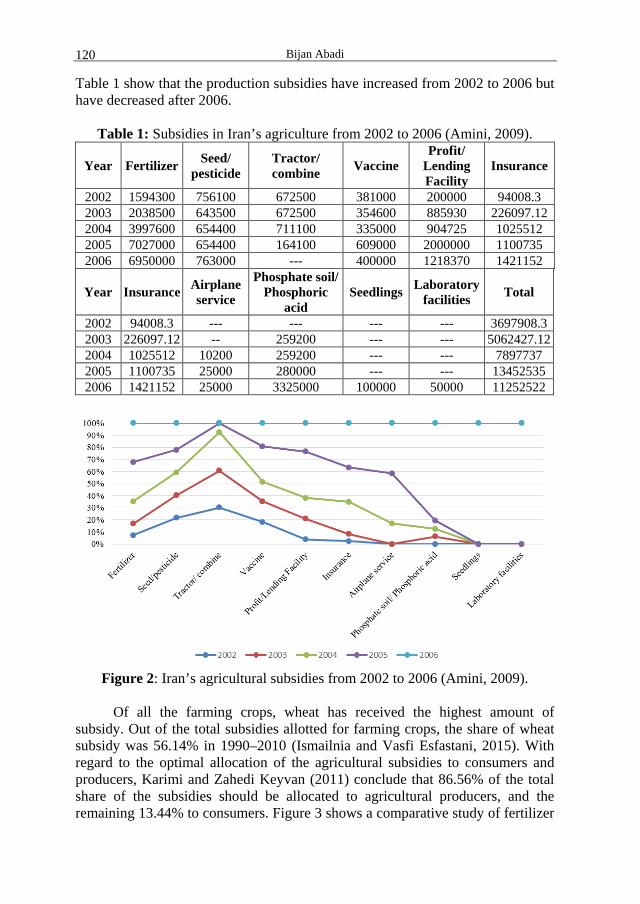
Bijan Abadi 120
Table 1 show that the production subsidies have increased from 2002 to 2006 but have decreased after 2006.
Table 1: Subsidies in Iran’s agriculture from 2002 to 2006 (Amini, 2009).
Year Fertilizer Seed/ pesticide
Tractor/ combine Vaccine
Profit/ Lending Facility
Insurance
2002 1594300 756100 672500 381000 200000 94008.3 2003 2038500 643500 672500 354600 885930 226097.12 2004 3997600 654400 711100 335000 904725 1025512 2005 7027000 654400 164100 609000 2000000 1100735 2006 6950000 763000 --- 400000 1218370 1421152
Year Insurance Airplane service
Phosphate soil/ Phosphoric
acid Seedlings Laboratory
facilities Total
2002 94008.3 --- --- --- --- 3697908.3 2003 226097.12 -- 259200 --- --- 5062427.12 2004 1025512 10200 259200 --- --- 7897737 2005 1100735 25000 280000 --- --- 13452535 2006 1421152 25000 3325000 100000 50000 11252522
Figure 2: Iran’s agricultural subsidies from 2002 to 2006 (Amini, 2009).
Of all the farming crops, wheat has received the highest amount of
subsidy. Out of the total subsidies allotted for farming crops, the share of wheat subsidy was 56.14% in 1990–2010 (Ismailnia and Vasfi Esfastani, 2015). With regard to the optimal allocation of the agricultural subsidies to consumers and producers, Karimi and Zahedi Keyvan (2011) conclude that 86.56% of the total share of the subsidies should be allocated to agricultural producers, and the remaining 13.44% to consumers. Figure 3 shows a comparative study of fertilizer

A review of the impact of the targeting subsidy plan on the input use… 121
usage—such as nitrogen, potash, and phosphate fertilizers—in Iran with five other countries—Egypt, United States, Pakistan, Turkey, and China (Roser, 2017). It indicates that the fertilizer usage in Iran’s agricultural sector after 2009 has been lower than that of the five other countries. This might have been caused by the increased price of fertilizers.
Figure 3: Fertilizer use in kg per hectare of arable land (Roser, 2017).
Figure 4 also reveals the amount of pesticide used in Iran’s agriculture
from 1996 to 2012. According to this figure, the highest amount of pesticide has been used in the form of herbicides in 2006 (SCI, 2013). After 2009—which coincided with the beginning of implementing the targeting subsidy plan—the amount of pesticide use decreased.
The targeting subsidy plan The supply of the subsidy may cause problems like input overuse,
environmental degradation, budget deficits, cost rise, wastage of resources, and the occurrence of economic losses. These problems have forced the decision-makers to approve and pursue the policy of targeting the subsidies in 2010 (Ismailnia and Vasfi Esfastani, 2015). The scheme has affected the Iranian agricultural sector (Maghsoudi and Tohidy Ardahaey, 2012; Shamizadeh et al., 2012; Ismailnia, and Vasfi Esfastani, 2015). Subsidies have often been inefficient, expensive, socially unequal, and environmentally destructive, and have imposed a heavy burden on government budgets (Cox, 2005). With government subsidies, farmers are encouraged to use intensive agricultural practices, such as using chemical fertilizers and pesticides, adopt the irrigation technologies, and producing hybrid agricultural products (Ge et al., 1999). Although these practices increase the yield and reduce costs, they destroy lands and pollute water. Therefore, the elimination of all price supports is an effective way to reform the subsidies (Pye-Smith, 2002). For this reason, most societies

Bijan Abadi 122
are directed to undertake a more sustainable route by eliminating or modifying the input subsidy and combining rational tax structures (United Nations Environment Program, 2008). When the subsidies are eliminated in agriculture, it becomes necessary to deliver the payment of the subsidies directly to farmers, especially those who are poor (Bakhshi et al., 2012).
Figure 4: Pesticide use in Iran’s agriculture from 1996 to 2012 (SCI, 2013)
Input use and input use behavior Agricultural inputs include fertilizers, seeds, pesticides, water, fossil fuels,
extension service, and so on. We observed a difference between agricultural input use and farmers’ input use behavior. The former includes any amount of the agricultural inputs used by the farm appliances. The latter encompasses the farmers’ internal characteristics that influence and determine the amount of agricultural input use. Indeed, a farmer’s psychological properties form basis of the input use behavior. Therefore, it is established that the conservation of the environment cannot be accomplished only by applying modified innovations and technologies; changes in human behavior are also required (Bourdeau, 2004; Oikonomou et al., 2009).
DISCUSSION
The targeted subsidy and input use behavior In this section, we review the empirical witnesses on the impacts of the
targeting subsidy plan on agricultural input use and discuss the results. The targeting subsidy plan has exerted numerous influences on farmers’ behavior, such as input use, input purchasing, product building, and so on. Furthermore, the subsidy reform has led to a more equitable distribution of the revenues (Tracey and Anne, 2008). At the same time, the elimination of the subsidies has forced

A review of the impact of the targeting subsidy plan on the input use… 123
poor farmers feel vulnerable (Bakhshi et al., 2012). The experience of eliminating subsidies in Russia led to economic development, effective allocation of the resources and incomes, and dissemination of clean technologies (Golub and Strukova, 1999). In New Zealand, the removal of subsidies gave rise to unpleasant conditions for farmers. However, such troubles were diminished by reducing production costs (OECD, 2010).
Owing to the elimination of subsidies, an increase in the input price results in an efficient use of agricultural inputs by farmers. Therefore, an increase in the price of inputs—such as chemical fertilizer—reduces the demand for and consumption of the inputs (Jalalian et al., 2013; Manos et al., 2007; Onchan; 2004). However, this may lead to an increase in farmers’ adoption of more sustainable inputs as a way to increase the yield. In a research that examines the short-term impacts of the targeting subsidy plan on rural farming conditions, Jalalian et al. (2013) indicated that the costs of agricultural inputs, like fuel and machinery, have increased after implementing the targeting subsidies. Consequently, the index of usage of the inputs and machinery was in a desirable situation, which caused an accrued and efficient use of these inputs.
Amirnejad et al. (2015) indicated that after targeting the subsidies, the crop pattern of the irrigational products was directed to the products themselves—such as cotton and rice—whereas, the crop pattern of the rain-fed products was replaced with rapeseed. Farmers may show a series of behaviors based on the conditions laid by the targeting subsidy plan. For example, a study in New Zealand (OECD, 2009) shows that under the conditions of the subsidy reform, farmers pursue the organic farming activities along with off-farm activities in order to earn. Under these special circumstances, farmers often would not use the inputs in the same way as used previously. This is done to cope with the increased prices of inputs in conventional agriculture (Sutherland et al., 2012).
With the targeting subsidy plan and reducing subsidies of agricultural inputs, the cost of non-trade inputs has changed (Amirnejad et al. 2015). For example, an increase of 200% in the price of fertilizer is needed to reduce the consumption to an optimal level, which doubles the cost of the fertilizer. This consequently brings net economic losses for farmers and changes the crop pattern (Bakhshi et al., 2010). Therefore, farmers may use the modern technologies to improve the efficiency of input use—such as, fertilizers and pesticides (Picazo-Tadeo and Reig-Martínez, 2007). Bakhshi et al. (2010) have studied the impacts of subsidy elimination of the chemical fertilizer on cropping patterns and consumption of the inputs in Sabzevar city, Iran. They conclude that the complete elimination of the subsidy has reduced the use of chemical fertilizers. Therefore, subsidy reform can create conditions under which environmental improvement and neutral effects are achieved (La Vina et al., 2007).
In general, the effects of the targeting subsidy plan in the agriculture sector can be identified in terms of the time scale—short-term, medium-term, and long-term (Jalalian et al., 2013). In the short term, which ranges from one to two years, an increase in the price of agricultural inputs, like energies and fertilizers, will

Bijan Abadi 124
increase the cost of agricultural production. Therefore, those agricultural activities that require an enormous amount of energy are affected. However, increasing the price cannot be an effective way as it may result in loss of the sales market. Therefore, changing the crop pattern and volume of activities, as well as managing the inputs, can be done in the medium term, which ranges from two to five years. In the long-term scale of more than five years, raising the level of productivity is an effective strategy under conditions of the targeted subsidies.
CONCLUSION
This study qualitatively investigated the impact of the targeting subsidy plan on farmers’ input use behavior. The empirical studies indicated that such a scheme had a substantial impact on the input use behavior of farmers in Iran. As the price of the inputs increases under the targeting subsidy plan conditions, farmers inevitably make more efficient decisions in using agricultural resources. Consequently, increasing the input price is an efficient strategy for ameliorating the farmers’ input use behavior. The empirical evidence also corroborates this. By reviewing the literature, it became clear that the eliminated and targeted subsidy have substantially influenced the input use. A question that should be addressed by future research is whether other input use change strategies should be paid attention to, together with price interventions, or not. Although this intervention improved the agricultural input use behavior, policymakers need to consider other impacts of such plans on farmers’ livelihood, especially for those who are more vulnerable. We recommend future studies to investigate all aspects of the targeting subsidy plan. Therefore, the social, economic, and environmental dimensions should be given attention by policy-makers when subsidizing the agricultural input price. In particular, support should be lent to the farmers who are poor.
REFERENCES Abrahamse, W., Steg, L., Vlek, C., Rothengatter, T. (2005). A review of intervention
studies aimed at household energy conservation. Journal of Environmental Psychology, 25, 273–291.
Anonymous, (2008). Agricultural Biology Study of Organic Agriculture in Iran Part 6. Amini, R. (2009). The analysis of the planned subsidies program in agriculture sector.
Daam-va-Kesht-va-Sanaat, 118, 13-14. Amirnejad, H., Ataei, K., Habibi Tirtashi, F. (2016). Investigating the effects of targeted
subsidy plan on changes in cropping pattern in Mazandaran province. 7(28), 39-59.
Azarbaijani, K., Sharifi, A., Masoudi, A. (2011). The impact of targeted subsides of electricity in the Iranian manufacturing. International Journal of Contemporary Research in Business, 3(8), 1078-1091.
Bakhshi, B., Shahrokh, L., Alikhani, N. (2012). Content analysis of reflection of subsidy in Media. Media studies, 6(15), 111-123.
Bakhshi, M.R. Peykani, G.R., Hosseini, S.S., Saleh. I. (2010). Evaluating effects of removing fertilizer subsidy and direct payment polices on cropping pattern and inputs use (Sabzevar). Iranian Journal of Agricultural Economics. 4(2), 185-207.

A review of the impact of the targeting subsidy plan on the input use… 125
Bakhshoodeh, M. (2012). Identifying beneficiary households for cash payments in Iran based on proxy means test. Agricultural Economics: Iranian Journal of Agricultural Economics, 6(1), 93-108.
Bourdeau, P., (2004). The man-nature relationship and environmental ethics, Journal of Environmental Radioactivity, 72, 9–15.
Ismailnia, A.A., Vasfi Esfastani, S. (2015). Analysis of energy price reform effects on production and price in the agricultural sector. Journal of Management System, 9(32), 45-63.
Ge, C., Gao, S., Wang, J., Yang, J., Cao, D. (1999). Subsidy Policy and the Environment in China. In OECD (Eds). Environmental taxes: Recent Developments in China and OECD Countries. OECD Publications. 330 pp.
Golub, A., and Strukova, E., (1999). Reform of subsidies to the energy sectore: the experience of Russia. In OECD (Eds). Environmental taxes: Recent Developments in China and OECD Countries. OECD Publications. 330 Pp.
Jalalian, H., Hashemi, S., Yaghobi, J. (2013). Study of short-time effects of the targeting subsidies on rural farming status in Neiriz township (Case study: Abadeh TAshk distric). Journal of Regional Planning, 3(10), 45-59.
Karimi, F., Zahedi Keyvan, M. (2011). Optimal pattern for allocation of subsidies to agricultural sector, consumers and producers: application of interval analytic hierarchy process. Journal of Agricultural Economics Research, 2(4), 99-120.
La Vina, A., Fransen, L., Faeth, P., Kurauchi, Y. (2007). Agricultural subsidies, poverty and the environment: supporting a domestic reform agenda in developing countries. WRI Policy Note, 1.
Linden, A, L., Carlsson-Kanyama, A., Eriksson, B. (2006). Efficient and inefficient aspects of residential energy behaviour: What are the policy instruments for change? Energy Policy, 34, 1918–1927.
Maghsoudi, N., Tohidy Ardahaey, F. (2012). Targeting subsidies considering the applied models in Iran. International Journal of Business and Social Science, 3(7), 162-166.
Manos, B., Begum, M. A. A., Kamruzzaman, M., Nakou, I., & Papathanasiou, J. (2007). Fertilizer price policy, the environment and farms behavior. Journal of Policy Modeling, 29(1), 87-97.
Martiskainen, M. (2007). Affecting consumer behaviour on energy demand. Sussex: SPRU–Science and Technology Policy Research, 81.
Naji Meidani, A.A., Sotoodeh Niakarani, S. (2015). The effect of eliminating energy subsidies on industry cost structure in Iran. Economic Modeling, 8(4), 45-62.
OECD, (2010). Making reform happen lessons from OECD countries: Lessons from OECD Countries. OECD Publishing, 296 pp.
OECD, (2009). The role of agriculture and farm household diversification in the rural economy of New Zealand. [Online]. <http://www.oecd.org/agriculture/agriculturalpoliciesandsupport/43245582.pdf.> [Sep 10 2006].
Oikonomou, V., Becchis, F., Steg, L., Russolillo, D. (2009). Energy saving and energy efficiency concepts for policy making. Energy policy, 37(11), 4787-4796.
Onchan, T. (2004). The financial crisis and agricultural productivity in Asia and the Pacific. Report of the APO Study Meeting on Effects of Financial Crisis on Productivity of Agriculture (STM-12-00). [Online]. <http://www.apo-tokyo.org/00e-books/AG-06_FinancialCrisis/AG 06_FinancialCrisis.pdf#page=186> [Aug 22 2011].

Bijan Abadi 126
Picazo-Tadeo, A. J., Reig-Martínez, E., (2007). Farmers' costs of environmental regulation: Reducing the consumption of nitrogen in citrus farming, Economic Modelling 24, 312–328.
Pye-Smith, C., (2002). The Subsidy Scandal: How Your Government Wastes Your Money to Wreck Your Environment. Earthscan, 250 pp.
RFE/RL/Payvand.com: Sanctions and Iran’s Achilles Heel. Retrieved June 11, 2010. Roser, M. (2017). Fertilizer and Pesticides. Published online at OurWorldInData.org.
Retrieved from: https://ourworldindata.org/fertilizer-and-pesticides/ [Online Resource].
SCI, (Statistics Center of Iran). Agricultural Support Services and Joint Stock Company. Office of Budjet and Design. https://www.amar.org.ir/
Tracey, S., Anne, B., (2008). OECD insights sustainable development linking economy, society, environment: Linking economy, society, environment. OECD Publishing, 142 pages.
United Nations Environment Programme, (2008). Reforming Energy Subsidies: Opportunities to Contribute to the Climate Change Agenda. [Online]. <http://www.unep.org/pdf/pressreleases/reforming_energy_subsidies.pdf> [May 25 2005].
US Government Publishing Office. (2014). Fiscal Year 2015: Historical Tables, Budget of the US Government, Washington, DC 49 Page 78.
Wood, G., and Newborough, M. (2003). Dynamic energy-consumption indicators for domestic appliances: environment, behaviour and design. Energy and Buildings, 35, 821–841.

Agriculture & Forestry, Vol. 63 Issue 3: 127-135, 2017, Podgorica 127
DOI: 10.17707/AgricultForest.63.3.13 Ajuma Inelo USMAN, Blessing Ajala OTALU, Lucky Dartsa WAKAWA1
PRELIMINARY ASSESSMENT OF GERMINATION AND EARLY GROWTH CHARACTERISTICS OF ALBIZIA ZYGIA (DC.)
MACBR INFLUENCED BY DIFFERENT GROWTH MEDIA
SUMMARY Albizia zygia is an important multipurpose tree species that has not been
domesticated. Thus, the study investigated the effects of different growth media on seed germination and seedling performance in the nursery for the purpose of domestication. The experiment was divided into two; experiment 1 and 2. Experiment 1 investigates the germination response while experiment 2 investigates the early growth response of Albizia zygia to different growth media. The experiment was conducted at the Forestry Nursery of the University of Agriculture Makurdi, Benue State, Nigeria. Both experiments were arranged in a completely Randomized Design (CRD) with three replicates. Pretreated seeds were sown into different media namely: Topsoil, sawdust, mixture of topsoil and sawdust and a control (river sand) for the germination studies while seedlings were transplanted into polypots filled with sawdust, mixture of topsoil and sawdust and topsoil (control) for the early growth studies. Data were collected on germination emergence, percentage germination, seedling height, number of leaves and stem diameter. The results revealed that germination emergence and percentage were significant at 5% level of probability (p> 0.05), germination emerged earlier in sawdust and mixture of topsoil and sawdust (4th). The highest germination percentage was recorded in sawdust (95%).The growth attributes were influenced significantly by growth media. The highest mean seedling height (9.44cm), number of leaves (12) and stem diameter (0.16cm) were recorded in topsoil. Therefore, from the results topsoil and sawdust are recommended in raising Alzibia zygia seedlings in the nursery for possible domestication on the field.
Keywords: Albizia zygia, germination, seedlings growth, domestication
INTRODUCTION Albizia zygia (DC.) Macbr, belong to the subfamily of Mimosoideae in the
family of Fabaceae. It is a deciduous tree that can attained 9 – 30 cm height with a spreading crown and a graceful architectural form. Its bole is tall and clear having a diameter of about 24 cm, the bark is grey and smooth. It is Native to Cameroon, Democratic republic of Congo, Gabon, Ghana, Kenya, Nigeria,
1Ajuma Inelo Usman (corresponding author: [email protected]) Department of Forest Production and Products, University of Agriculture Makurdi, Benue State, NIGERIA; Blessing Ajala Otalu Department of Forest Production and Products, University of Agriculture Makurdi, Benue State, NIGERIA; Lucky Dartsa Wakawa Department of Forestry and Wildlife Management, Federal University Gashua, Gashua, NIGERIA. Notes: The authors declare that they have no conflicts of interest. Authorship Form signed online.
Usman et al. 128
Sudan, Tanzania and Uganda (Orwa, et al., 2009).Though A. zygia is considered a lesser used species. (Apetorgbor, 2007) or medium wood grade species on the basis of their quality (Ogunwusi, 2012), it produces valuable timber (Zabala, 1997) which has received some level of prominence in the international market (Apetorgbor, 2007). The use of the species in the reclamation of degraded cocoa farm land has been proven to be successful. (Ziblim, et al., 2012). Briquette produced from A. zygia sawdust was reported to have high calorific value (Aina, et al., 2009), the fodder are reported to be palatable for animal feeds (Tabuti and Lye 2009), while the leaves are used in preparing soup by the people of cross river state in Nigeria (Orwa et al, 2009). In local medicine different parts of this species is used for the treatments and remedy of diverse ailments and diseases. The bark sap is instilled in the eyes to treat ophthalmia, a bark decoction is administered to treat bronchial diseases, fever, (including malaria) and female sterility, and as a purgative, stomachic, antidote, vermifuge and aphrodisiac (Orwa et al., 2009). The gum produced from the trunk is used as a binding agent in pharmaceutical industry, reported to produce tablets with better mechanical properties and longer disintegration and dissolution times than those containing gelatin BP. (Kwabena, et al., 2009).
Potting media are the most important factors required for the production and survival of seedlings in the nursery. It has been adjudged to be the most critical factor determining seedling quality in the nursery (Baiyeri and Mbah, 2006).Different potting media have significant effect on the growth of plant seedlings (Vendrameet al., 2005). Healthy and vigorous seedlings can be produced from a balanced media with adequate nutrient supply.The presence of organic matter in a potting media is important. Organic matter performs numerous function in soil such as supply of essential nutrients, improves water holding capacity and aggregation, and prevents erosion (Carter 2002; Osaigboo and Orhue 2012; Khan et al., 2012). A suitable potting media is expected to have good physical and chemical properties that will support optimal growth and development of seedlings. (Abad et al., 2002). Tree establishment in the field and productivity of the Orchard and plantation depend on the quality of seedlings obtained from nursery (Baiyeri 2006).
Despite the versatility of the species, little effort has been made towards its domestication, probably because of the general assumption that tropical tree species has long gestation period and dearth of information on its growth requirements. With high demand and pressure on this important multipurpose tree species, if not domesticated and made available to farmers, the generation yet to come may be deprived of the benefits of this important tree species. This called for research on the growth requirements of A. zygia. Availability of healthy and vigorous seedlings is one of the important stages towards domestication/plantation establishment of tree species. This research was therefore conducted to assess the effects of different growth media on the germination and early growth characteristics of A. zygia in the nursery. This would provide information that will be useful in it domestication.

Preliminary assessment of germination and early growth characteristics of Albizia zygia 129
MATERIALS AND METHODS Study site The experiment was conducted at the Forestry Nursery of the University of
Agriculture, Makurdi. The Nursery is located within the Guinea Savannah zone between latitudes 8o35E and 8o41E and longitudes 7o45N and 7o52N. The mean annual rainfall is between 1000mm-15000m while the mean annual temperature isbetween 29oc -50oc and relative humidity is between 60%and 80% but decreases in the early months of dry season.
Seed Collection and Preparation Matured and ripped pods of Albizia zygia were collected under the mother
tree at Pila village and within the University Staff Quarters. The pods were broken down, seeds were decarped, cleaned and air dried to prevent microbial and fungal infestation. Seed viability test was carried out through floatation method (Wakawa and Usman 2016). Sawdust was collected from sawmill, topsoil was collected at the depth of 0-15cm and riversand (control) were collected from Forestry nursery. Topsoil and sawdust were mixed in the ratio of 1:1. Germination trays and polypots were filled with different growth media.
Plate 1: Albizia zygia Pods. Plate 2: Decarped Seeds of Albizia zygia
Experiment The experiment was divided into two; the first experiment was
germination studies while the second experiment was early growth characteristics studies.
Experiment 1 Three hundred (300) viable seeds obtained by floatation test were
pretreated using Sulphuric acid (H2SO4) of 98% concentration for 10 minutes to break the dormancy (Anim-Kwapong and Teklehaimanot 2001). Twenty five (25) seeds were then randomly selected and sown into different germination tray of 21 × 8 cm size filled with different growth media. The growth media were namely; Topsoil, Sawdust, mixture of topsoil and sawdust and a control (Riversand). This was replicated three (3) times and laid in completely randomized design (CRD). Emergence and germination percentage were recorded after the emergence of the plumule. The experiment was terminated at

Usman et al. 130
third week after noticing no new germination. The experiment was laid out in completely randomized design (CRD) having four (4) treatments and replicated three (3) times.
Experiment 2 Ten (10) Seedlings of relatively even growth from the first experiment
(Experiment 1) were transplanted into polypots of equal dimension filled with different growth media namely; sawdust, mixture of topsoil and sawdust and topsoil only (control) and replicated three (3) times making thirty (30) seedlings for each treatment. This makes the total number of seedlings used to be ninety (90) in all. Watering was done once in a day during the eight (8) weeks duration of the experiment. The experimental was laid out in completely randomized design (CRD) having three (3) treatments and replicated three (3) times
Data Collection and Analysis The emergence of seedlings and number of leaves were counted
physically, seedling height with a meter rule and stem diameter was obtained with the aid of a veneer caliper. Data collected were subjected to analysis of variance (ANOVA) (p 0.05) using STATISTICA package. The observed means were subjected to Least Significant Difference (LSD) for mean separation.
RESULTS
Germination percentage The study revealed that sawdust (SD) and the mixture of topsoil and
sawdust (TS+SD) emerged earlier on the 4thday from the sowing date, topsoil (TS) emerged on the 5th day and the control emerged on the 6th day from the sowing date (Table 1). The results also indicated that at the end of the experiment the highest germination percentage was recorded in SD (95%) followed by TS+SD (91%) and TS (87%).The least was observed in control RS (35%). (Figure 1).
Table 1. Effects of growth media on emergence and germination of A.zygia seeds
Growth Media Number of days taken for first emergence
Number of seeds germinated
TS 5 52 SD 4 57
TS+SD 4 55 Control(RS) 5 22
*Means on the same row with different superscript vary significantly while those having the same superscript did not varies (p<0.05). TS-Topsoil, SD-Sawdust, RS-Riversand
Seedlings height (cm) Seedling height was influenced by the different growth media though the
variation was not significant. The highest mean seedling height was recorded in top soil (Control) (9.47cm), the next was Topsoil +Sawdust (7.80cm) and the least was recorded in Sawdust (7.62cm) (Table 2).
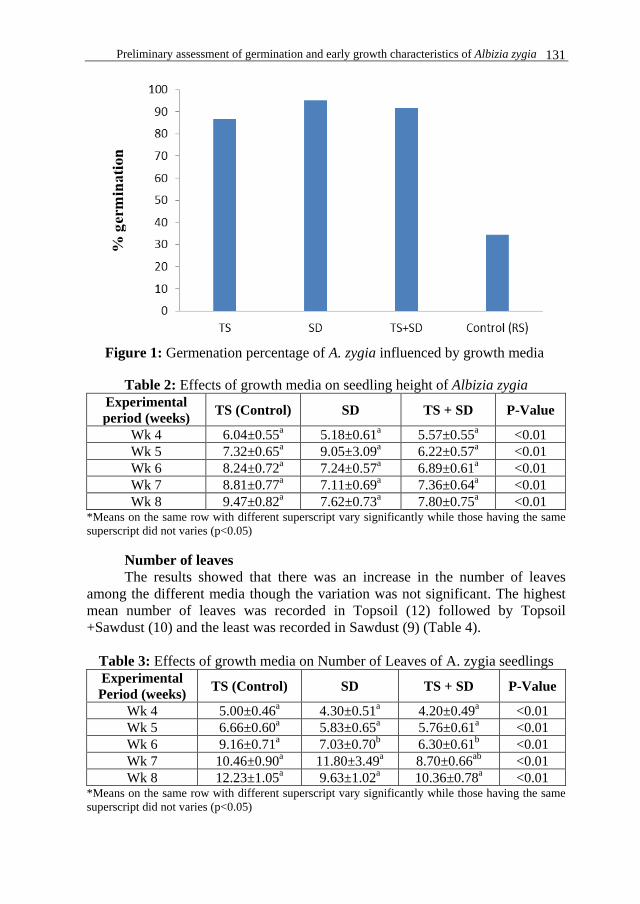
Preliminary assessment of germination and early growth characteristics of Albizia zygia 131
Figure 1: Germenation percentage of A. zygia influenced by growth media
Table 2: Effects of growth media on seedling height of Albizia zygia
Experimental period (weeks) TS (Control) SD TS + SD P-Value
Wk 4 6.04±0.55a 5.18±0.61a 5.57±0.55a <0.01 Wk 5 7.32±0.65a 9.05±3.09a 6.22±0.57a <0.01 Wk 6 8.24±0.72a 7.24±0.57a 6.89±0.61a <0.01 Wk 7 8.81±0.77a 7.11±0.69a 7.36±0.64a <0.01 Wk 8 9.47±0.82a 7.62±0.73a 7.80±0.75a <0.01
*Means on the same row with different superscript vary significantly while those having the same superscript did not varies (p<0.05)
Number of leaves The results showed that there was an increase in the number of leaves
among the different media though the variation was not significant. The highest mean number of leaves was recorded in Topsoil (12) followed by Topsoil +Sawdust (10) and the least was recorded in Sawdust (9) (Table 4).
Table 3: Effects of growth media on Number of Leaves of A. zygia seedlings Experimental Period (weeks) TS (Control) SD TS + SD P-Value
Wk 4 5.00±0.46a 4.30±0.51a 4.20±0.49a <0.01 Wk 5 6.66±0.60a 5.83±0.65a 5.76±0.61a <0.01 Wk 6 9.16±0.71a 7.03±0.70b 6.30±0.61b <0.01 Wk 7 10.46±0.90a 11.80±3.49a 8.70±0.66ab <0.01 Wk 8 12.23±1.05a 9.63±1.02a 10.36±0.78a <0.01
*Means on the same row with different superscript vary significantly while those having the same superscript did not varies (p<0.05)

Usman et al. 132
Stem diameter (cm) The results also showed variation in stem diameter varies significantly
among the different growth media. The highest mean stem diameter was recorded in Topsoil (0.16cm) followed by Topsoil+Sawdust (0.14cm) and the least was recorded in Sawdust (0.11cm). (Table 4)
Table 4: Effects of growth media on Stem Diameter of A. zygia Experimental period (weeks) TS (Control) SD TS + SD P-Value
Wk 4 0.10±0.00a 0.09±0.00a 0.09±0.00a <0.01 Wk 5 0.12±0.00b 0.11±0.01b 0.55±0.45a <0.01 Wk 6 0.13±0.01a 0.12±0.01a 0.10±0.01a <0.01 Wk 7 0.15±0.01a 0.12±0.01a 0.13±0.01a <0.01 Wk 8 0.16±0.01a 0.11±0.01b 0.14±0.01ab <0.01
*Means on the same row with different superscript vary significantly while those having the same superscript did not varies (p<0.05)
DISCUSSION The results obtained from the study indicate that Albizia zygia responded
significantly to the different growth media. It shows the important role of growth media in the germination and domestication of A. zygia. The earlier germination of A. zygia seeds is an indication of the role played by germination media in enhancing germination. The highest germination percentage that was recorded in decomposed sawdust agrees with the work of Omokhua et al., (2015) who reported highest germination percentage in sawdust but disagrees with Okunomo (2010) who obtained the highest germination percentage in topsoil with Parkia bicolor. This also disagrees with the work of Dickens (2011) who reported the highest germination percentage in river sand with Irvingia wombulu. The observed difference in germination response of different species to different media reported by different researchers might be attributed to difference in the type species. Difference in germination and seed viability were observed by Hossain et al., (2014) to vary according to the type of species.
The mean seedling heights are statistically significant among the different media. The highest mean seedling height observed in topsoil supports the work of Egharevba et al., (2005) who obtained highest height in topsoil using African walnut (Plukenetiaco nophorum) and Omokhua et al., (2015) who also obtained highest height of Terminalia ivorensisin topsoil. The result also supports the work of Anber (2011) who also obtained the highest seedling height in topsoil with Bauhimia variegata and Delonix regia. The result is also in conformity with the work of Okunomo et al., (2009) who reported the highest plant height in top soil with Perseaamericana.This could be attributed to the presence of organic matter in topsoil and good aeration and moisture retention ability associated with it. The highest number of leaves recorded in topsoil collaborates with the work of Sabo (2002) and Agbogidiet al., (2007) who highest number of leavesin topsoil. This contradict the work of Olawuyi et al (2002) and Ndor et al., (2012)
Preliminary assessment of germination and early growth characteristics of Albizia zygia 133
who reported highest number of leaves of Telferia occidentalis in sawdust. The high number of leaves recorded in topsoil is similar with the findings of Okunomo et al., (2009) which could be related to the high water retention ability and organic matter content of topsoil.
The highest stem diameter recorded in topsoil is an indicative of the top soil to support plant growth. This collaborates with the findings of Sabo (2002) who recorded the highest stem diameter in topsoil. The result disagrees with the work of Ndoret al., (2012) who obtained highest stem diameter of Telferia occidentalis in riversand. The significant differences observed in the performance of seedlings in top soil indicated that topsoil is rich in organic matter, contains good nutrient supply, aeration and water retention. This assertion had been shown to be true from the work of Usman et al., (2013), Akinyele and Wakawa (2017). Darvish et al., (2015) opined that type of growth media influenced the availability of some nutrients such P and N which will influence growth of a plant.
CONCLUSION Most nursery practitioners are unable to identify the right soil suitable for
growing lesser known species. On the basis of this study, the results have shown that type of growth media significantly influenced the germination and growth performance of Albizia zygia. Decomposed sawdust gave the best in germination percentage while topsoil has shown to be the best in terms of increased in seedling height, number of leaves and stem diameter. Therefore, the results suggested that sawdust and topsoil should be recommended for raising seedlings in nursery for possible distribution to local farmers for the establishment and large scale production of Albizia zygia.
REFERENCES
Abad, M., Noguera, P., Puchades R, Maquireira, A, Noguera V. (2002). Physico -chemical and chemical properties of some coconut dust for use as a peatsubstitudes for containerized ornamental plants. Biores Technol. 82.241-245.
Agbogidi O.M, Onujeke E.C and Eshegbeyi O.F (2007).Germination and Seedling growth of African pear (DacryodesedulisDon.G.LamH.J) as affected by different planting media.American Journal of plant physiology 2:282-286
Aina O. M., Adetogun, A.C and Iyiola, K.A (2009).Heat Energy from Value-added Sawdust Briquettes of Albiziazygia.Ethiopian Journal of Environmental Studies and Management 2(1):42-49
Akinyele, A.O and Wakawa, L.D. (2017). Physiological response of Tetrapleura tetraptera (Schum. and Thonn.) Taub. to soil textural class, moisture and light intensity. Journal of Forest and Environment Science 33(2):97-104. https://doi.org/10.7747/JFES.2017.33.2.97.
Anber M.A H (2011).Improving seed germination growth of some economically important trees by seed.Forest Sci. 7(3):371-382).

Usman et al. 134
Anim-Kwapong and Teklehaimanot, (2001).Albiziazygia (DC) MACBRIDE.A Shade Tree for Cocoa.The Effects of Duration of Acid Scarifications and Substrate Activity on the Germination of Seeds. Forests, Trees and Livelihoods, 11, 47 – 55 1472 – 8028
Apetorgber, M.M. (2007). Albiziazygia (DC) J.F.Macbr.in: Louppe, D., Oteng-Amoaka, A.A. and Brink, M. (Editors). Prota 7(1): Timber/Bois d’ouvre 1. (CD - ROM). PROTA.Wageningen, Netherlands
Baiyeri K.P.(2006). Seedlings emergence and growth of papaya (Carica papaya), grown under different coloured shade polythene. Int. Agrophysis. 20: 77-84
Baiyeri K.P and Mbah B.N (2006). Surface sterilization and duration of seed storage influenced emergence and seedling quality of African breadfruit (Treculiaafricana). Journal of Biotechnology 5(15) 1393-1396.
Carter, M. R.( 2002). Soil Quality for Sustainable Land Management: Organic Matter and Aggregation Interactions that Maintain Soil Functions Agron. J. 94(1): 38–47.
Darvishi, B., Mohammadi, H., Kardan, J., Bayati, E.A. and Sadeghi, A. (2015). The effect of plantlets density and growth mediacomposition on potato mini-tuber production in hydroponic sand culture. Agriculture & Forestry, Vol. 61, Issue 2: 61-71, 2015, Podgorica DOI: 10.17707/AgricultForest.61.2.05
Dickens D (2011). Effect of propagation media on the germination and seedling performance of Irvingiawombolu (Vermoesen) Am. J. Biotechnol. Mol. Sci., 1(2): 51-56
Egharevba R.K., Matilda I. Ikhatua and Kalu C.(2005).The influence of seed treatments and growing media on seedling growth and development of African walnut, Plukenetiaconophorum. African Journal Biotecnology 4(8) 808-811
Hossain, M., Saha, S., Salekin, S., Al-Mamun, A. Siddique, M.R. and Abdullah, S. M. (2014). Salinity influence on germination of four important mangrove species of the sundarbans, bangladesh Agriculture and Forestry, Vol. 60. Issue 2: 125-135, 2014, Podgorica
Khan Z., Tiyagi S.A Mahmood I and Rizvi R (2012). Effects of N fertilization, organic matter and biofertilizers on the growth and yieldofchilli in relation to management of plant=parasitic nematodes.Turkish Journal 36:73-81
Kwabena, O., Emily N.N.A and Samuel Lugrie K (2009).Preparation and In-vitro Characteristics of Tablet Cores Coated with Albizia, Albizia/khaya and Albizia/hpmc Films. Interactional Journal of Applied Pharmaceutics 1 (1):
Ndor, E. Dauda N.S and Chammang H.B (2012).Effect of germination media and seed size on germination and seedling vigour of Fluted pumpkin (Telferiaoccidentalis) Hook.F.)International Journal of Agricultural scienceVol 2(3) pp113-115
Ogunwusi, A.A (2012). Wood properties of Albiziazygia and Anogeissusleiocarpu: Medium Wood Species Found in Timber Markets in Nigeria. Journal of Biology, Agriculture and Healthcare. 2(11):123 – 130
Okunomo K (2010). Germination and seedling growth of Parkia bicolor (A. Cheu).as influenced by various nursery techniques.African Journal of Agriculture.Vol.6.No.4.

Preliminary assessment of germination and early growth characteristics of Albizia zygia 135
Okunomo, K., Ogisi, D.O. and Bosah, B.O.( 2009). Effect of growth media on germination and seedling growth of Perseaamericana(Mill). Journal of food, Agriculture and Environment. 7(1): 111-113.
Olawuyi E.B., Ojo M.O., Ayanran C.I and Agboola F.O (2002): Effect of different soil media on early growth of Afrormosiaalata. Nigeria Journal of Ecology Pp130-134
Omokhua G.E., Ogun A and OyabadeB.A(2015). Effects of different sowing media on germination and early seedling growth of Terminaliaivorensis(A.Chev.)International Journal of Scientific and Technology Research Vol.3
Orwa, C. A., Mutua, K. R., Jamnadass, R. and Anthony, S. (2009): Agroforestry Data-base: a tree reference and selection guide version
Osaigbovo, A. U. and Orhue, E. R. (2012).Effect of potting media and watering frequencies on the growth of paper fruit (Dennetiatripetala) seedlings.Bay. J. Pure Applied Sci. 5(2): 73–78.
Sabo A (2002).Effects of soil medium on the growth and development of Eucalyptus tereticornis.Submitted to the Department of Forestry, University of Agriculture Makurdi.
Tabuti, J.R.S and Lye, K.L (2009) Fodder plants for cattle in kaliro district, Uganda Africa study monographs, 30(3): 161 – 170
Usman, A., Wakawa, L.D., Adeogun, P.F. (2013): The Influences of Soil Types and Watering Regimes on the Early Growth of Moringa oleifera (Lam) in the Semi-Arid Region of Nigeria. In: A Forest Industry in a Dynamic Global Environment: (eds., Labode Popoola, F.O. Idumah, O.Y. Ogunsanwo, I.O. Azeez). Proceedings of 35th Annual Conference of the Forestry Association of Nigeria Sokoto, Sokoto State, Pp. 359 – 364.
Vendrame W.A., Maguire I and Moore K. K(2005).Growth of selected bedding plants as affected by different compost percentages. Proc. Fla.State Hort. Soc.118:268-371.
Wakawa, L.D and Usman, A. (2016).Germination Response of Moringaoleifera (LAM).To Different Soil Textural Classes.Nigerian Journal of Tropical Agriculture 16:1 – 5.
Zabala, N. 1997.International Workshop on Albizia and Paraserianthes Species. Proceedings of a workshop held November 13-19, 1994, in Bislig, Surigao del Sur, Philippines. Forest, Farm, and Community Tree Research Reports (Special Issue). Winrock International, Morrilton, Arkansas, USA.
Ziblim, A.I, Damian, Tom-Dery and Kingsley, A.K (2012). Assessment of Soil Quality Improvement Under Teak and Albizia. Journal of Soil Science and Environmental Management 3(4):91 – 96.


Agriculture & Forestry, Vol. 63 Issue 3: 137-146, 2017, Podgorica 137
DOI: 10.17707/AgricultForest.63.3.14 Dragoljub MITROVIĆ, Radisav DUBLJEVIĆ, Milan JUGOVIĆ, Marija MARKOČ, Nenad ĐORĐEVIĆ 1
ENERGY CONSUMPTION AND ENERGY EFFICIENCY IN LUCERNE ENSILING
SUMMARY
Ensilling represents more successful process of fresh grass mass storage than hay storage. Losses of dry matter in alfalfa silage start from 5 to 15% (Jugović, 2012), and in the technological process of storing hay, drying under the influence of the sun heat are going up to 25-30% of the total leaf mass. Preparation of alfalfa can be done in the form of: hay, silage and haylage.
In this paper, the results of lucerne ensiling and haylaging in several variants using different machines and tractor aggregates are shown:
1. Aggregate tractor IMT-539 + power presses, Agronic Model R-500 combi
2. Aggregate tractor IMT-540 + self-loading wagon Sip Pioneer-17. 3. Aggregate tractor IMT-577 DV + roller presses Deutz – Fahr GP 2.50. Aggregate: tractor IMT-539 + power presses, Agronic Model R-500
combi, represents a significant technological solution in forming cylindrical bales, weighing 60-70 kg, wrapped with polyethylene foil. The average operating speed of an aggregate was 3,4 km/h. Power bale with an average weight of 67,5 kg was formed on the 135,5 m length of the pass, for 2.4 min. The average volume of the formed bale (57cm x 63cm) was 0,16 m3. Consumption of the polyethylene films for forming bales was 51.0m x 0.25m, which represents an area of 12,75 m2 per bale. The average productivity of the tested aggregate was 0,40 ha/h or 3,24 ha/day. Productivity of the formed bales ranged from 21-27 bales/h or 41-60 bales/ha, which represents the daily productivity of 162 bales per day. The average fuel consumption was 6.0 liters per hour or 15 liters per hectare.
Aggregate: tractor IMT – 540 + self-loading wagon Sip Pioneer-17 in the working process performs loading and transport of semi-withered alfalfa plant mass to the trench silos. In the working process, the consumption of the fuel was 8.0 litters per hectare. In the process of lucerne ensiling compression (treading) of the delivered grass mass with the tractor T-40, whose consumption of diesel fuel is 11,5 l/h, is necessary.
1Mitrović Dragoljub, Dubljević Radisav., Markoč Marija (corresponding author: [email protected])., University of Montenegro, Biotechnical faculty, Podgorica, MONTENEGRO; Jugović Milan, Faculty of Agriculture, East Sarajevo, BOSNIA AND HERZEGOVINA; Đorđević Nenad, University of Belgrade, Faculty of Agriculture, Belgrade, SERBIA. Notes: The authors declare that they have no conflicts of interest. Authorship Form signed online.
Mitrovic et al. 138
Aggregate: tractor IMT-577 DV + Power presses Deutz-Fahr GP 2.50 in ensiling achieved a diesel consumption of 15,16 l/h. Power pressing is burden by wrapping power bundle with polyethylene foil. For this technological operation, a tractor IMT-577 DV + layer Sipma Z-557 was used, which has an average diesel fuel consumption of 3,64 liters per hectare.
Keywords: aggregate, tractor, power presses, productivity, energy, alfalfa (lucerne), silage, haylage.
INTRODUCTION
The preparation of silage and haylage represents the replacement for green cattle feed, because with contemporary approach of preparing bulk cattle feed, higher level of preservation in quality and nourishing values is achieved. The ensiling represents more successful process in conserving green mass than the process of making hay. The losses in dry matter during the ensiling process are from 5 to 15% (Jugović, 2012), and during the natural process of drying hay from 25 to 30%. Volume mass (m3) is 700-1000 kg/m3 or 150-300 kg of dry matter, comparing to unbaled hay - 70-80 kg/m3 or 60-70 kg of dry matter (Hnatyszyn et al. 1988).
Preparation of silage and haylage is performing during the physiological phase of semi-withered plant and dry matter content of 35-40 % which make favorable conditions for starting the fermentation process (Jones, 1995). The important factor during the preparation of lucerne ensiling are anaerobic conditions, which stop fungi activities that lead to rotting. In order to get silage and haylage of higher quality, it is recommended to mow alfalfa before flowering phase (Ćupina, Dubljević, 2005). Mowing, crashing and drying the grass mass on time significantly influences the ensiling quality. The success of bale silage depends on quality, thickness and color of foil. According to Lingwall, 1995., the white color foil was more affordable than black foil. Preparation of silage and haylage with roller press, wrapping the bale with polyethylene foil has multiple advantages, because mowing and drying while the moisture is 30-50% last for several hours. In Western Europe, conservation of grass silage in the shape of bales with polyethylene foil is present in 56% (Charney and Cherney, 1988).
Conservation of grass mass requests constant usage of machines during every operation, from mowing and preparing to wrapping and distribution in the object. If the average yield of semi-withered biomass with 45% of moisture is 9,54 t/ha, after finished process of ensiling, a feed with average metabolic energy (ME) of 10,7 MJ/kg will be obtained, which represents 102.078 MJ ME per hectare (Jugović, 2012).
MATERIALS AND METHODS
Testing of the aggregate (A): Tractor-IMT-539 + roll press Agronic model – R 500 combi for forming cylindrical bales was done in 2012., on an area of lucerne (Silvija) production, nearby Nikšić. The production area of p = 10740 m2 (length 358m and width 30m) was determined for testing. Mowing of lucerne

Energy consumption and energy efficiency in lucerne ensiling 139
was done by the rotary mower Sip – 165 that has width of 1,65m, in the aggregate of traction-power machine (tractor) IMT – 539.
Testing of the aggregate (B): tractor IMT 540 + self-loading wagon Sip Pioneer-17; (C): tractor IMT-577 DV + Power presses Deutz-Fahr GP 2.50 layer Sipma Z-557 was done in 2012., on an area in Mokro, region Pala, the Republic of Srpska.
The parameters which were tracked during the aggregate testing in preparation of silage (baling of fresh mowed lucerne) are: aggregate flow length (m), length of the crossed path in order to form bale (m), time needed for forming bale (min), aggregate working speed (km/h), dimensions of formed bale (axb), mass of the formed bale (kg), volume mass of the formed bale (kg/m3), consumption of polyethylene foil (m2), number of formed bales on tested area (piece). The consumption of fuel for an aggregate of power machine is determined by the engine type, engine power and consumption of fuel per hour (l/h).
The aggregate productivity in silage preparation is determined based on chronometric measurements and calculations: aggregate working speed, productivity of tested aggregate (ha/h), (ha/day), (bale/h), (bale/ha), (bale/day), based on the equation:
Wth= 0,1 · B · v (ha/h)
Wd= 0,1 · B · v · n · T · t (ha/day) B - aggregate working width (m) v- aggregate working speed (km/h) n- coefficient of aggregate flow use T- daily time (h) t- coefficient of time use
RESULTS AND DISCUSSION Technical characteristics of the tested aggregates Technical characteristics of the tested aggregates in the silage preparation
are presented in table 1.
Table 1. Technical characteristics of the tested aggregate machines: A, B, C Technical characteristics of
the tested aggregates L/W/H (m) Required power (kW) Mass (kg) Pick – up
(m) A - Agronic model R-500,
combi 3,50/1,85/0,79 30 790 1,50
B – Self – loading wagon SIP Pioneer 17 5,85/2,05/2,85 30 1160 1,50
C – Press for rounded shaped bales Deutz – Fahr
GP 2-50 4,43/2,35/2,21 60 1800 1,67
Bale layer Sipma Z.557 - 26 785 1,1 – 1,6

Mitrovic et al. 140
Technological characteristics of the tested aggregates Technological process of Power press Agronic model R-500, combi Power press Agronic model R-500, combi, is an attached machine, which
is used for preparing hay, silage and haylage, lucerne and shamrock grazing mixtures, in round-shaped bales. Drive of the machine and the movable parts is accomplished from tractor’s power take-off, via universal joint and hydraulic motor. Forming and wrapping the finished bale is automatic, and working progress is controlled on the monitor. During the technological process of work, power press’s pick – up machines, with its elastic tines lift mowed grass mass from the slope and transport it through the pressing chamber. In the pressing chamber, grass mass is being twisted and bale is growing to the planned size. Joining belts lift and automatically pinch the grass mass, which makes the bale thick and solid. When the formed bale reaches planned size and mass, it is being tied up and wrapped with the polyethylene foil, and after that postponed on the agricultural area.
Technological working process of Self-loading wagon SIP Pioneer 17 Technological working process of Self-loading wagon consists of lifting
the grass mass from the slope with a pick-up machine and transporting it to the transporting channel. There is a machine with whom the grass mass is being pushed in the wagon trunk. During the wagon dicharging, back side opens and grass mass is being pushed from the trunk via floor conveyor. The wagon has a system for chopping the grass mass size 40-100mm, for preparing silage and it needs a tracto with a power of 30 – 40 kW.
Technological working process of roller press for round-shaped bales Deutz – Fahr GP 2.50
Technological working process of roller press consists of lifting the grass mass with pick-up machine, transporting to the retractable conveyor or directly inserting in the chamber for bale forming. In that chamber, there are specific working parts for rolling the hay. When the bale grows to the planned compactness and diametar, devices for tying up will be on, and the balle is going to be wrapped with the twine. Then, the chamber opens and bale is being postponed on the agricultural area. Roller bales can be wrapped up with the twine, they can be also wrapped up with the net, which is more traditional way, or tied up with the wire. After this step, bale is formed and it can be wrapped in plastic foil. The device for wrapping the bale with the foil lifts the formed bale to the turning mechanism (turning table or rollers), which wraps it. Wrapping must be equal and tight, and the bale has to be postponed without any damage.
Parameters for working usage of the aggregate Parameters for working usage of the aggregate – A) tractor IMT-539 +
power press Agronic-R 500 for silage preparing are shown in the Table 2. The average working speed was 3,4 km/h. The bale with an average
weight of 67,5 kg was formed on the 135,5 m flow length, which represents the average time of 2,4 min. The average volume mass of the formed bale (57 cm x

Energy consumption and energy efficiency in lucerne ensiling 141
63 cm) was 0,16 m2. Consumption of the polyethylene foil was 51,0 m x 0,25 m, which represents the surface of 12,75 m2/bales.
Table 2: Parameters for working usage of the aggregate A): tractor IMT-539 + power press Agronic R-500
Aggreg. flow
Flow length
(m)
Flow time (min)
Turn time (min)
Bale length form.
Bale time form.
Vol. form. mass
Bale mass (kg)
Bale vol. mass
(kg/m3)
Foil cons. (m2)
Bale Flow
Average 358 6,42 0,32 135,50 2,40 0,16 67,50 422 12,75 2,70 The results of tested aggregate productivity during the silage preparation
are shown in Table 3.
Table 3: Aggregate productivity A): tractor IMT-539 + power press Agronic-R 500
Aggreg. flow
Work speed (km/h)
Prod. (ha/h)
Prod. (ha/day)
Prod. (kg/day)
Prod. (bale/h)
Prod. (bale/ha)
Prod. (bale/day)
Average 3,4 0,40 3,24 10935 25 50 162 Table 4: Energy consumption in working operations
Aggregate Qh (l/h)
Prod. (ha/h)
Prod. (ha/day) (l/ha) Energy
(MJ/ha)
Energy Eha
(kwh/ha) 1.Mower RK 165 +
IMT539 5,5 1,2 - 6,6 270,6 10,50
A)- Tractor IMT539 + roll presonic model
R 500 combi 6,5 0,4 3,24 2,6 106,6 12,50
Cistern Kaiser 2800 + IMT 540 7,9 1,2 9,6 9,5 454,10 9,93
RK 135+ IMT540 6,4 1,03 8,2 6,58 314,52 11,57 Favorit 220 +
IMT540 2,1 1,3 10,4 2,72 130,02 4,72
B.SiP Pioneer 17 + IMT540 26,7 0,3 2,4 8,0 382,40 20,43
T.40 AS for treading - - - 11,5 549,70 - C.Deutz-Fahr GP2,50 + IMT
577DV 33,7 0,45 3,6 15,16 724,65 57,24
SipmaZ-557 + IMT 577DV - - - 3,64 173,99 -
Productivity of the tested aggregate was 0,40 ha/h average or 4,24 ha/day.
The average yield of the lucerne was 3330 kg/h. Productivity in forming bales

Mitrovic et al. 142
was going from 21 to 27 bales/h or from 41 to 60 bales/ha, which represents the daily productivity of 162 bales per day.
In order to determine energetic inputs for agrotechnical operations in silage production (fertilization, mowing, rolling over, collecting the mowed mass), methods for measuring the amount of fuel consumed in working process were applied.
A statistically significant difference in the energy efficiency of direct inputs of grass silage production, depending on the way and selection of the mechanization for storing (round shaped bales wrapped in the foil, silo mass tight in silo and covered with foil) was done by testing, by standard statistical methods of the mean values of the basic energy parameters, tested with t-test.
H0: = 0 =
texp = texp < ttab → accept H0
= texp > ttab → reject H0
Energetic parameters During the energy analysis, the metodology given by Ortiz-Canavante and
Hernanz (1999) was used, and that method predicts the determination of energy input and output, based on the mesured values of fuel consumption and achieved yield. Based on the obtained values, next parameteres are determined: Specific energetic input (EL), Energetic relation (ER) and Energetic productivity (EP).
Specific energetic input (EL) = (MJ/kg)
Energetic relation (ER) =
Energetic productivity (EP)= (kg/MJ)
In the work of the aggregate A: tractor IMT-539 + power press Agronic R-500, total fuel consumption was 6,5 l/h or 2,6 l/ha.
In the work of the aggregate B: self-loading wagon Sip Pioneer 17 + tractor IMT 540, total fuel consumption was 26,7 or 8,0 l/ha.
In the work of the aggregate C: roller pess Deutz-Fahr GP + tractor IMT 577. DV), total fuel consumption was 33,7 l/h or 15, 16 l/ha. It is important to mention that the aggregate B is being burdened by the tractor for silage hitting in trench silo T-40 AS (aggregate Ba) with consumption of 11,5 l/ha of fuel. Also, the aggregate C is being burdened by the tractor IMT 577+layer SIPMA for wrapping the bales, as well as transportation to the object with fuel consumption of 3,64 l/ha. Energy paramters for fertilization, mowing, grabbing and methods of grass harvesting are shown via fuel consumption per area unit Qha (l/ha), and

Energy consumption and energy efficiency in lucerne ensiling 143
for fuel thermal power, the unit of 41,0 MJ/l or 47,8 MJ/kg were taken (Ortiz-Canavate and Hermanz, 1999). Direct energetic inputs in preparation of grass silage were tracked and processed based on the fuel energy for the drive of technical systems.
Table 5. Total direct inputs in silage preparation (MJ/ha)
Operation Fertilization Mowing Grabbing Picking Total
Direct inputs (MJ/ha) 454,10 314,52 130,02
Pioneer 17 + silo wading 932,1
Deutz-fahr GP 2,50 + wrapping
898,64
Aggregate B 1830,74
Aggregate C 1797,28
Energy output of cattle feed production can be determined via achieved
yield and heat value of the given nutrition. Energetic value of grass silage is 0,441 oats units per kilogram or 5,04 MJ/kg of gross energy.
Table 6. Energy balance of direct energetic inputs of haylage production
Self-loading wagon Aggregate - B
Roller press Aggregate - C
Direct energetic inputs (MJ/ha) 1830,74 1797,28 Silage yield (kg/ha)
Energetic output (MJ/ha) 9540
40988,61 9540
43663,63 Specific energetic input (EL)
Energetic relation (ER) Energetic productivity (EP)
0,192 22,389 5,211
0,188 24,294 5,308
Table 7: Share of direct inputs in different variations of silage storing
Operation Energy (MJ/ha)
Percentage share %
Energy (MJ/ha)
Percentage share %
Fertilization 454,10 24,80 454,10 25,27 Mowing 314,52 17,18 314,52 17,50 Grabbing 130,02 7,10 130,02 7,23
Aggregation Aggregate B 382,40 20,89 724,65 - Aggregate C - - - 40,32
Hitting 549,70 30,03 - - Wrapping - - 173,99 9,68
Total 1830,74 100,00 1797,28 100,00 The average yield of lown green mass at tested areas was 21,2 t/ha and the
yield of semi-dried mass with moisture of 45% was 9,54 t/ha. After chemical analysis of given silage examples and yields, it is established:
Energetic value of production (MJ/ha) = 4296,5 kJ/kg x 9,54 kg/ha = 40988,610 kJ/ha = 40988,61 MJ/ha for energetic value of silage from silo.
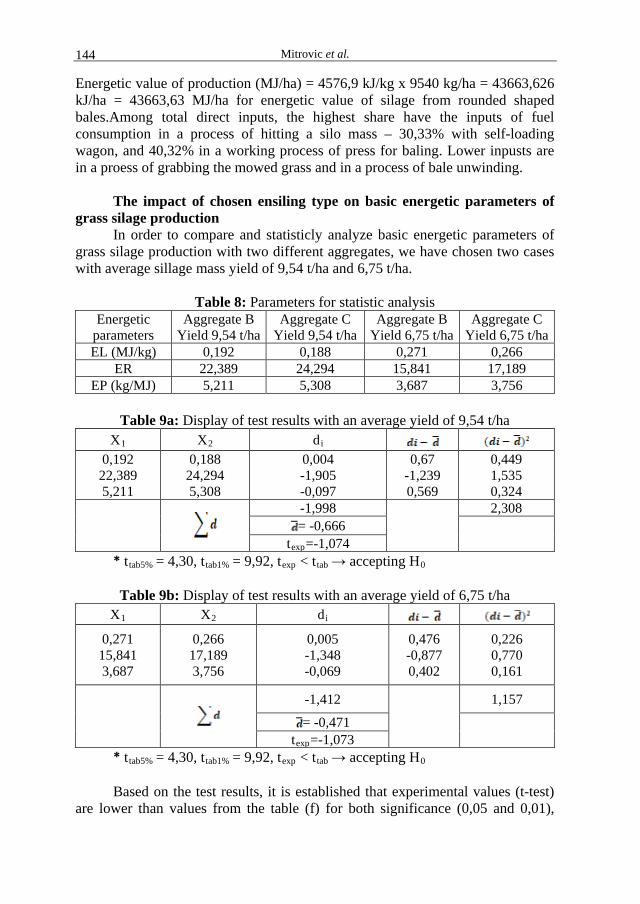
Mitrovic et al. 144
Energetic value of production (MJ/ha) = 4576,9 kJ/kg x 9540 kg/ha = 43663,626 kJ/ha = 43663,63 MJ/ha for energetic value of silage from rounded shaped bales.Among total direct inputs, the highest share have the inputs of fuel consumption in a process of hitting a silo mass – 30,33% with self-loading wagon, and 40,32% in a working process of press for baling. Lower inpusts are in a proess of grabbing the mowed grass and in a process of bale unwinding.
The impact of chosen ensiling type on basic energetic parameters of
grass silage production In order to compare and statisticly analyze basic energetic parameters of
grass silage production with two different aggregates, we have chosen two cases with average sillage mass yield of 9,54 t/ha and 6,75 t/ha.
Table 8: Parameters for statistic analysis
Energetic parameters
Aggregate B Yield 9,54 t/ha
Aggregate C Yield 9,54 t/ha
Aggregate B Yield 6,75 t/ha
Aggregate C Yield 6,75 t/ha
EL (MJ/kg) 0,192 0,188 0,271 0,266 ER 22,389 24,294 15,841 17,189
EP (kg/MJ) 5,211 5,308 3,687 3,756
Table 9a: Display of test results with an average yield of 9,54 t/ha X1 X2 di
0,192 22,389 5,211
0,188 24,294 5,308
0,004 -1,905 -0,097
0,67 -1,239 0,569
0,449 1,535 0,324
-1,998
2,308 = -0,666
texp=-1,074 * ttab5% = 4,30, ttab1% = 9,92, texp < ttab → accepting H0
Table 9b: Display of test results with an average yield of 6,75 t/ha
X1 X2 di 0,271 15,841 3,687
0,266 17,189 3,756
0,005 -1,348 -0,069
0,476 -0,877 0,402
0,226 0,770 0,161
-1,412
1,157
= -0,471 texp=-1,073 * ttab5% = 4,30, ttab1% = 9,92, texp < ttab → accepting H0 Based on the test results, it is established that experimental values (t-test)
are lower than values from the table (f) for both significance (0,05 and 0,01),

Energy consumption and energy efficiency in lucerne ensiling 145
which means that there are no significant difference in the way of grass silage ensiling with aggregate – B and aggregate – C.
CONCLUSION
Tested aggregate A-(power press, Agronic model R-500 combi + tractor IMT-539) in lucerne ensiling in cylindric shaped bales wrapped with polyethylene film, achieved average working speed of 3,4 km/h, with the average time for bale forming of 2,4 min per bale. There was a huge impact of lower alfalfa yield (in 4th swath it was 3330 kg/ha) on time needed for bale forming. In a working process of the aggregate-A: tractor IMT-539+power presses Agronic-R 500, the total fuel consumption was 6,5 l/h or 2,6 l/ha, which represents the energy of 106,6 MJ/ha.
Tested power press Agronic model R-500 combi, represents technical and technological solution in hay, silage and haylage preparation on smaller production areas with fodder crops, lucern and shamrock-grass mixtures. The tested power press is suitable for baling fodder crops on mountain areas, where there is no storages for bulk cattle feed (hay) and on lean terrains of natural and artificial lawns.
Total fuel consumption in aggregate-B working process was 19,5l and in aggregate-C working process, it was 18,80l which leads to conclusion that, in our case, the highest consumption in grass silage preparing is in a process of hitting a silo mass, 30% with self-loading wagon (aggregate 1), or 40% in a process of pressing roller bales (aggregate C).
In the case of total direct inputs, the fuel consumption inputs in the loading process had a maximum load of 30% in the variant with a self-loading trailer (aggregate 1) and 40% for the rolling baling process (aggregate C).
Energy and fuel consumption in the agrotechnical operatios were 20,43 kWh/ha with aggregate B and 57,24 kWh/ha, with high coefficient of fuel utilization of 19,23% and 28,44%.
Total energy value of produced silage from silo is 40988,61 MJ/ha, but the energetic value of silage from rounded shaped bales is 43663,63 MJ/ha.
By the energy analysis of direct inputs in the production of grass silage, we have come to the conclusion that there are no statistical deviations in the mentioned parameters for silage variants (B and C), which was confirmed by the results of testing the hypothesis on the equality of mean values of two basic sets meaning that there is no significant difference in ensiling mode on the total balance of direct inputs of production.
Based on the given data, we see the dependence on the production and preparation of grass silage from direct inputs (fuel consumption) for both preparation methods. However, grass silage, as the basic bulk nutrient in cattle breeding, has a relatively high energy value, and for that reason, it is understandable that a fairly high degree of energy utilization, ie, the ratio of outputs and total direct energy inputs in the production cycle.
Mitrovic et al. 146
REFERENCES Barać S., Đević M., Mratinić B.: Mehanizacija ubiranja. Univerzitet u Prištini,
Poljoprivredni fakultet, Zubin Potok, 2007. Cherny J.H.and Cherney D.J.R.(1998): Grass for Diary Cattl.CAB. Ćupina B.,Dubljević R.(2005): Konzerviranje i čuvanje krme sa prirodnih travnjaka.
Unapređenje proizvodnje krme na prirodnim travnjacima. Sarajevo. Forristal D.(1995): Big Bale Silage ,Cattle Production Semior for Teagase Beet
Adviosors and College Teachers, Tegasc, Ireland. Haingh P.M.(1995): Chemical composition of energy value of big bale silages mode
in England.Journal of Agricultural Research. Jones. R.(1995): Big bale silage, Can We sfford them, Internal Worc
Document.Institute of Grassland and Euvironmetal Recearch (IGER) Aberystwyth.
Lngwall P.(1995): The Balewrapping handbook.Trioplat AB.Smolandsstenor Savoie.P.(1988): Optimization of Plastic Covers for Stack Silos. Jurnal of Agricultural Engeneering Research.
Đukić D., Stevović V., Janjić V.: Proizvodnja stočne hrane na oranicama i travnjacima, Univerzitet u Novom Sadu, Poljoprivredni fakultet, Novi Sad, Univerzitet u Kragujevcu, Agronomski Fakultet, Čačak, 2009.
Fluck, R. C. And C. D. Baird : Agricultural Energetics, Westport, Connecticut, p. 41-71, 1982.
Forristal P.D. and O’ Kiely P.O. (2005): Silage production and utilisation (Update on tehnologies for producing and feeding silage) Proceedings of the XIVth International Silage Conference, a satellite workshop of the XXth International Graasland Congress, July 2005, Belfast, Northern Ireland.
Hnatyszyn M., Guais A. (1988): Les fourrages et l`leleveur. Agriculture d`Aujourd`hui, Paris
Mikkola H., Ahokas J.: Energy Management of Future Farms, University of Helsinki, Department of Agrotechnology, Agronomy Research 2010. Ortiz.Canavate J., Hernanz J. L.: Energy Analysis and Saving, Energy for Biological Systems, CIGR Handbook, 1999.
Radivojević D., Tošić M.: Mehanizacija pripreme stočne hrane, Univerzitet u Beogradu, Poljoprivredni Fakultet, Beograd, 2000.
Zeremski D.,Tošić M.: Silaža i siliranje u stočarstvu, Niro-Zadrugar, Sarajevo, 1981. http://agronomy.emu.ee http://www.imt.co.rs http://www.sano.ba/node/404 http://www.sip.si http://www.izvorienergije.com

Agriculture & Forestry, Vol. 63 Issue 3: 147-153, 2017, Podgorica 147
DOI: 10.17707/AgricultForest.63.3.15 Cristian Mihai ENESCU, Aureliu-Florin HĂLĂLIȘAN 1
THE ECONOMIC CONTRIBUTION OF HUNTING PRODUCTS TO THE TURNOVER OF THE FORESTRY UNITS IN ROMANIA
SUMMARY
Game species are among the main categories of non-wood forest products (NWFPs) in Romania. Thanks to its diversified relief and forests, Romania has a high diversity of wildlife species. The national hunting area is divided into 2.151 hunting grounds that are managed by private-owned or state-owned forestry units and hunting associations. On the current territory of the country, hunting was a regular practice since the Middle Ages, and the first modern regulation dates from the second half of the 19th century. According to currently valid legislation, hunting in Romania is permitted for 18 species of mammals and 39 species of birds. Special attention is given to three species of EU interest, namely brown bear (Ursus arctos L.), gray wolf (Canis lupus L.) and wildcat (Felis silvestris Schreber). The annual contribution of hunting products to the turnover of the forestry units is usually less than 1%. In order to increase this contribution, forest managers should develop and promote other hunting related activities.
Keywords: forestry units, game species, hunting, NWFPs, Romania
INTRODUCTION During the developing of mankind, but especially in the last two centuries,
specific wood and non-wood forest products provided income and job opportunities both for local communities and also for several categories of forest owners and managers from Romania.
Even if the area of Romanian forests (i.e. 6.55 million hectares; MMAP, 2015) is currently lower than it used to be one hundred years ago, forestry remains one of the most important sector from social, cultural, ecological and economic perspectives. There were several factors that have contributed to reduction of the forested area, such as: increasing the farmlands, expansion of communities, payment of war debts, increasing the exports of wood products and diversification of wood use in different industries.
Starting with the application of the first forest management plans and the appearance of the first modern regulation, forest management in Romania is focused on producing high volume of timber, by assuring in the same time the
1Cristian Mihai Enescu, (corresponding author: [email protected]), Forestry Specialization, Department of Soil Sciences, Faculty of Agriculture, University of Agronomic Sciences and Veterinary Medicine, Bucharest, ROMANIA; Aureliu-Florin Hălălișan, Department of Forest Engineering, Faculty of Silviculture and Forest Engineering, Transilvania University of Brașov, ROMANIA. Notes: The authors declare that they have no conflicts of interest. Authorship Form signed online.
Enescu and Hălălișan 148
ecological functions of the forest ecosystems. Little attention was and continues to be given to the management of non-wood forest products (NWFPs). This category of forest products includes: fauna of hunting interest, fish from mountain waters, forest fruits, forest seeds, truffles and edible mushrooms, medicinal and aromatic plants, resin and tree sap. In Romania, according to Article 58 of the Forest Code (Law no. 46/2008), the forest products belong to the owners or their holders, as the case may be, except for the game and fish species.
NWFPs have several uses in food, pharmaceutical, chemical, handicraft, and livestock industries (Enescu, 2017), their sustainable harvesting being currently a matter of concern, especially in the case of edible mushrooms (Vasile et al., 2017) and game species. Regarding the latter category, in Romania, according to Law 407/2006 on Hunting and Protection of Hunting Stock, hunting is permitted for 18 species of mammals and 39 species of birds and every year the hunting quota is revised.
RESULTS AND DISCUSSION
Romanian hunting fund and infrastructure In 2015, in Romania, the total hunting area was 21.9 million hectares and
it was divided into 2.151 hunting grounds that were managed as follows: 1.873 by hunting associations and organizations, 255 by ROMSILVA and 23 by forest research and teaching institutions. Most of the hunting funds are located in the plain region (41.7%), followed by the ones from hilly regions (37.5%) and mountain regions (20.8%) (MMAP, 2015).
The hunting infrastructure is well developed thanks to more than 50 years of investment. For example, in 1964, there was a total of 4.500 kilometers of managed paths, more than 600 hunting chalets and almost 3.000 hunting observatories (Miron, 1964). Recently, sportive fishing and hunting activities represent an important source of income, especially for the rural communities from mountainous areas (Otiman, 2008). In some regions, like Galați County (eastern part of the country), the hunting infrastructure needs to be improved (Camară and Munteanu, 2016).
Diversity of species and population size Romania is known as European country that has important hunting
resources and holds worldwide records in hunting trophies, such as the biggest skulls and valuable brown bear furs (Bouriaud et al., 2005).
According to legislation, the main game species for which the hunting is permitted are: European hare (Lepus europaeus Pallas), red deer (Cervus elaphus L.), common pheasant (Phasianus colchicus L.), European roe deer (Capreolus capreolus L.), wild boar (Sus scrofa L.), fallow deer (Dama dama L.), pheasants, quails, geese, ducks, etc.
Romania is also famous for its brown bear (Ursus arctos L.) and gray wolf (Canis lupus L.) populations, having around 25-35% and 30% of the European

The economic contribution of hunting products to the turnover of the … 149
bear and gray wolf populations, respectively (Predoiu and Ungurean, 2010; Pecineaga et al., 2016). The presence of these large carnivores near livestock is greater than in other European countries and is generating several conflicts (Mertens and Promberger, 2001). The high number of brown bear population was mainly due to certain aspects of wildlife management in Romania that flourished during the Communist Era (Leslie et al., 1995).
According to statistics, the brown bear and gray wolf populations have decreased after the Second World War due to their intense control. In the period 1989-2004, the bear population decreased with 14%, while wolf population increased with 23% (Micu, 2010). Romanian bear population was never less than 800 individuals (Straka et al., 2011). In the past five decades, the minimum number of brown bears was recorded in 1968, i.e. 2.500 individuals, while the maximum number was achieved in 1988, i.e. 7.800 individuals (Ionescu, 2016).
Across Romania, species distribution is not uniform, in the southern-eastern part of the country, mammal species account for 50% of the total number of the known species of the Romanian fauna (Murariu, 2002).
The estimation of the population size for the main game species is done by the administrators of the game management units for more than 60 years (Cazacu et al., 2014). According to recent data provided by the Ministry of Environment, Waters and Forests (MMAP, 2016a), the population size of the most common game species is given in Table 1.
Table 1: Population size of the main game species in Romania
Species Year 2015 2016
Lepus europaeus (hare) 1090882 1089090 Phasianus colchicus (common pheasant) 463054 461464
Perdix perdix (grey partridge) 206032 206613 Capreolus capreolus (European roe deer) 197626 203924
Sus scrofa (wild boar) 90860 96685 Vulpes vulpes (red fox) 64940 65537
Cervus elaphus (red deer) 45233 46702 Ondatra zibethicus (muskrat) 24864 23353
Mustela putorius (European polecat) 22421 21788 Mustela nivalis (least weasel) 21810 20383
Meles meles (European badger) 21494 21210 Martes martes (European pine marten) 14500 14229 Tetrao urogallus (western capercaillie) 10713 10819
Rupicapra rupicapra (chamois) 7538 7693 Martes foina (stone marten) 6395 6326
Mustela erminea (short-tailed weasel) 6286 6069 Dama dama (fallow deer) 6215 6527

Enescu and Hălălișan 150
As in the case of the brown bear, the population of roe deer had also a special dynamic in the last three decades. If nowadays the Romanian roe deer population is around 200.000 individuals, in 1984 there were approximately 287.000 individuals, while in 2006 the population accounted 150.000 roe deers (Burbaitė and Csányi, 2009).
Special attention is given to three species of EU interest, namely brown bear, gray wolf and wildcat. Following the accession of Romania to the European Union and the adoption of the Council Directive 92/43/EEC of 21 May 1992 on the conservation of natural habitats and of wild fauna and flora, starting from 2007 on the basis of ministerial orders, derogations for the three species were approved. So, in the period 2007-2015, the hunting was permitted for a total of 12.169 individuals (Table 2). Starting from 2016, the project of the ministerial order (MMAP, 2016b), which provided derogations for 552 brown bears, 657 gray wolfs and 482 wildcats, was not adopted.
Table 2: Hunting quotas for brown bear, gray wolf and wildcat in Romania
Year Brown bear (Ursus arctos)
Gray wolf (Canis lupus)
Wildcat (Felis silvestris)
Ministerial Order
2015 540 598 496 1439/2015 2014 550 520 440 1575/2014 2013 436 495 420 2187/2013 2012 365 520 430 3456/2012 2011 365 498 402 2278/2011 2010 340 450 400 1423/2010 2009 350 466 474 1223/2009 2008 357 505 459 1092/2008 2007 333 500 460 1386/2007 Total 3636 4552 3981
Legal framework On the current territory of Romania, hunting was a regular practice since
Medieval Period (Bejenaru et al., 2010). The first regulation regarding hunting dates from 3rd of September 1138. According to this act, the people of Transilvania were obliged to offer to Dumis Monastery twenty martens, a bear skin and a horn of aurochs. Three centuries later, other legal regulations appeared. One of the most important was promulgated under the reign of Ștefan cel Mare (1457-1504). Its main objective was to protect the game species and other natural resources in specific regions (Giurescu, 1976).
During the second half of the 19th century, few steps were made. In 1872, the first Hunting Law was promulgated, that prohibited the hunting for some species (Didă, 2010). Also a first attempt to regulate the hunting exercise was done through the 1868 Rural Police Law, which specifies inter alia that the

The economic contribution of hunting products to the turnover of the … 151
hunting season should not be longer than eight months (Goicea and Bouriaud, 1999).
At the beginning of the last century, both the hunting laws from 1921 and 1938 gave the right to individuals with more than 1.000 hectares in the mountains and 100 hectares in the plains to dispose of existing hunting on those areas (Popescu et al., 1973).
Currently, in Romania, the hunting is regulated by the Law no. 407/2006 on Hunting and Protection of Hunting Stock that provides legal framework of practicing it. According to currently valid legislation (Government Emergency Ordinance no. 1/2017 and Government Decision no. 20/2017), the central public authority responsible for game management is the Ministry of Waters and Forests, through the Directorate of Forestry and Hunting Control. This directorate is centralizing the data at national level and is establishing every year the hunting quota for the game species of interest.
The economic value of game species for the forestry units in Romania Contribution of Agriculture, Fisheries and Hunting sectors in national
GDP ranged between 5.8% and 8.4% in the period 2005-2010 (Popescu, 2013). As regards “Hunting” sector, a special category consists in hunting products. According to recent reports of the Romanian National Institute of Statistics (NIS, 2008-2015), the annual contribution of hunting products to the turnover of the forestry units is usually less than 1% (Table 3). There are almost 500 forestry units (districts) in Romania, most of them managing the state-owned forests. For example, in 2015, there were 322 state-owned forestry districts, 149 private-owned forestry districts and 3 districts managed by “Marin Drăcea” National Institute for Research and Development in Forestry (MMAP, 2015). The hunting products include the meat and the furs, the pheasants, the horns (deer, roe deer, etc.), which are sold internally and / or exported.
Table 3: The contribution of game products to the turnover of the forestry units
Year Turnover of forestry units Game products
% (thousands RON)
(thousands Euro*)
(thousands RON)
(thousands Euro*)
2008 1428025.8 317339.1 15402.4 3422.8 1.08 2009 1317345.2 292743.4 8126.6 1805.9 0.62 2010 1381452.5 306989.4 7126.4 1583.6 0.52 2011 1523819 338626.4 7036.8 1563.7 0.46 2012 1626799.4 361511.0 6376.7 1417.0 0.39 2013 1846976.5 410439.2 5709 1268.7 0.31 2014 2017620.9 448360.2 6997.7 1555.0 0.35 2015 2107590 468353.3 5903.4 1311.9 0.28
* An exchange rate of 4.5 RON for one Euro was taken into account

Enescu and Hălălișan 152
In the last five years, National Forest Administration ROMSILVA, which is managing 12.4% of the total hunting area in Romania, sold around 30.000 - 40.000 pheasant, partridge and hare individuals, 160-220 tons of game meat, accounting in total for 1.3 - 1.6 million Euros (RNP 2013-2017).
CONCLUSIONS
Even if Romania has potential in terms of game species, the contribution of this category of NWFPs to the turnover of the forestry units is almost insignificant. Similar contributions have also other NWFPs, especially forests fruits and edible mushrooms. This could be explained by the general view of both state and private forest managers, who are mainly focused on timber production.
A complementary method to attract funds would be to develop and promote other hunting related activities. For example, the modernization of the chalets and hunting infrastructure would attract more hunters who want to benefit from these facilities as close as possible to the hunting ground. In this way, the hunters will spend less time travelling from the accommodation to the hunting ground. This will also promote the local food and beverage products and other traditional activities.
The given results should be considered with caution because they represent only the data summarized from forestry units’ yearly reports. No centralized data regarding the contribution of the game products to the turnover of the private hunting association is available. In this context, a real challenge for Romania is the implementation of national policies for encouraging the increase of the contribution of hunting products to the income of the hunting funds managers, regardless of the nature of the property or the way they are organized.
REFERENCES
Bejenaru L, Stanc S, Zamfirescu SR (2010). Wild Mammals from the Middle Ages in Romania, Archaeofauna, 19, 121-131.
Bouriaud L, Nichiforel L, Năstase C, Drăgoi S, Pădureanu L, Borlea GF (2005). Romania, Acta Silvatica et Lignaria Hungarica, Special Edition, 643-694
Burbaitė L, Csányi S (2009). Roe deer population and harvest changes in Europe, Estonian Journal of Ecology, 58(3), 169-180.
Camară G, Munteanu MV (2016). Exploitation of hunting and fishing tourism in Galați County, Romania. PESD 10(2): 195-206.
Cazacu C, Adamescu MC, Ionescu O, Ionescu G, Jurj R, Popa M, Cazacu R, Coțovelea A (2014). Mapping trends of large and medium size carnivores of conservation interest in Romania, Annals of Forest Research, 57(1), 97-107.
Didă A (2010). Researches in the influence of environmental pollution on the welfare of the animals species (hare-Lepus europaeus) in the Burnuz Plain. Dissertation, Transilvania University of Brașov.
Enescu CM (2017). Which are the most important non-wood forest products in the case of Ialomița County?, AgroLife Scientific Journal, 6(1), 98-103.
Giurescu CC (1976). Istoria pădurii românești din cele mai vechi timpuri pînă astăzi. Editura Ceres, București.
Goicea N, Bouriaud L (1999). The historical evolution of hunting regulation on Romania. Analele Universității “Ștefan cel Mare” Suceava, Secția Silvicultură, 4, 85-90.

The economic contribution of hunting products to the turnover of the … 153
Ionescu O (2016). Large carnivore management in Romania, Habilitation Thesis, Transilvania University of Brașov.
National Institute of Statistics (NIS) (2008-2015). AGR307A – Turnover of the forestry units http://statistici.insse.ro/shop, Accessed 17 March 2017
Leslie DM, Ionescu O, Tissescu Al, Nicolescu NV (1995). Wildlife conservation and education in Romania, Wildlife Society Bulletin, 23(1), 12-17.
Mertens A, Promberger C (2001) Economic Aspects of Large Carnivore-Livestock Conflicts in Romania, Ursus, 12, 173-180.
Micu I (2010). Large carnivores in Romania between passion and reality, Revista de Silvicultură și Cinegetică, 15(26), 64-67.
Ministerul Mediului, Apelor și Pădurilor (MMAP) (2015). Raport privind starea pădurilor României http://mmediu.ro/app/webroot/uploads/files/2016-12-16_Raport_Starea_padurilor_2015.pdf, Accessed 17 March 2017.
Ministerul Mediului, Apelor și Pădurilor (MMAP) (2016a). Centralizatorul efectivelor speciilor de interes cinegetic http://www.mmediu.ro/articol/efective/699, Accessed 5 June 2017.
Ministerul Mediului, Apelor și Pădurilor (MMAP) (2016b). Ordin nr …. / ….. pentru aprobarea derogărilor în cazul speciilor urs, lup și pisică sălbatică, http://www.mmediu.ro/app/webroot/uploads/files/2016-09-21_Ordin_derogari_2016-2017.pdf Accessed 5 June 2017.
Miron V (1964). Vînatul și vînătoarea în R.P.R. In O. Cărare, eds. Aspecte din economia forestieră a Republicii Populare Romîne, pp. 104-111. București, Editura Agro-Silvică, 198 pp.
Murariu D (2002). Contributions to the knowledge of mammal fauna (Mammalia) from South West Romania, Travaux du Muséum National d’Histoire Naturelle «Grigore Antipa», XLIV, 431-441.
Otiman PI (2008). Sustainable Development Strategy of Agriculture and Rural Areas in Romania on Medium and Long Term – Rural Romania XXI, Agricultural Economics and Rural Development, 5(1-2), 4-18.
Pecineaga IR, Popa RG, Gatej BA (2016). Study on monitoring of Canis lupus L. populations within the natural protected area of the north-western Gorj County, Scientific Paper. Series E. Land Reclamation, Earth Observation & Surveying, Environmental Engineering, V, 10-19.
Popescu A (2013). Agro-food trade position in Romania’s foreign trade, Scientific Papers Series Management, Economic Engineering in Agriculture and Rural Development, 13(3), 213-218.
Popescu CC, Almășan H, Văduva I, Manolache L, Pătrășcoiu N, Scărlătescu G (1973). Study regarding the possibility of constitution and management of some cynegetic complexes, Analele ICAS, 29(2), 63-85.
Predoiu G, Ungurean S (2010). Analysis of the institutional frame regarding the bear management in Romanian conditions, Bulletin of Transilvania University of Brașov, Series VII: Social Sciences • Law, 3(52), 49-56.
Regia Națională a Pădurilor ROMSILVA (RNP) (2013-2017). Raport privind modul de îndeplinire a Programului de activitate al RNP-ROMSILVA http://www.rosilva.ro/rnp/comunicate_de_interes_public__p_72.htm.
Straka M, Paula L, Štofik J, Ionescu O, Adamec M (2011). Genetic differentiation of Carpathian brown bear (Ursus arctos) populations reflects the human caused isolation, Beiträge zur Jagd- und Wildforschung, Bd., 36, 77-86.
Vasile D, Dincă L, Enescu CM (2017). Impact of collecting mushrooms from the spontaneous flora on forest ecosystems in Romania, AgroLife Scientific Journal, 6(1), 268-275.


Agriculture & Forestry, Vol. 63 Issue 3: 155-165, 2017, Podgorica 155
DOI: 10.17707/AgricultForest.63.3.16 Dragana MILOŠEVIĆ, Trajče TALEVSKI, Drago MARIĆ 1
PHENOTYPIC PLASTICITY OF RUTILUS PRESPENSIS (KARAMAN, S., 1924) FROM LAKE PRESPA AND LAKE SKADAR
SUMMARY
The phenotypic plasticity of Rutilus prespensis from Lake Prespa and Lake Skadar was evaluated based on 20 morphometric measurements. Analysis of variance and covariance showed that seven morphometric characters were different between populations: maximum body height, head length, horizontal eye diameter, interorbital distance, predorsal distance, dorsal fin height and anal fin length. These seven characters did not show any overlap in size between examined populations, which indicated significant differences between populations in these characters. The present study examines the allometric growth pattern of a number of morphometric characters of R. prespensis. The aim of this study was to examine variability in external morphology of R. prespensis populations from Lake Prespa and Lake Skadar.
Keywords: Balkan, ancient lakes, Allometry, Inter-population variability
INTRODUCTION Ancient lakes Prespa and Skadar are well recognized as European
biodiversity hotspots (Gaston & David, 1994; Griffiths et al, 2004) and are classified into the key biodiversity areas in Mediterranean (Darwall et al, 2014). Despite the general attention that has been given to these biologically rich lacustrine systems, it is apparent that a great deal of general knowledge concerning the most basic units of biodiversity, even among fish species is still lacking. For those reasons, it is invaluable to research every biological aspect of both endemic species and those with a wider range of distribution. Taxonomic status of the species of the genus Rutilus inhabiting extant ancient lakes of Balkans was unclear for many years. Milošević et al. (2011) showed that the Lake Skadar basin is inhabited by two species from genus Rutilus: R. prespensis (Karaman, S., 1924) (local name yellow roach) and R. albus Marić, 2010 (white roach), while Lake Prespa is inhabited by R. prespensis (Prespa roach). Recent studies of these species have been related to taxonomic status and length-weight relationships (Marić & Radujković, 2009; Milošević et al, 2011; Milošević et al, 2012; Milošević & Talevski, 2016). Until now, there was no research dealing
1Dragana Milošević (corresponding author: [email protected]), Drago Marić, University of Montenegro, Faculty of Sciences and Mathematics, Department of Biology, Podgorica, MONTENEGRO; Trajče Talevski, Department of Cyprinid Fauna, Hydrobiological Institute, Ohrid; University "Kliment Ohridski", Bitola, MACEDONIA. Notes: The authors declare that they have no conflicts of interest. Authorship Form signed online.
Milošević et al. 156
with the adaptation of the R. prespensis in this two, in many ways, different environments.
Differences in morphology among species and between populations of the same species can often be interpreted as adaptation to different ecological conditions. Morphometry is one of the most easily accessible means of assessing a species environmental plasticity (Kováč et al, 2009). Individuals of a species in different environments may diverge phenotypically in order to function efficiently in a given environment (McPhail 1984, Schluter & McPhail, 1992; Galis et al, 1994). In forming a phenotype, two interacting factors act on the developmental program – the genome and the environment (Scheiner, 1993). Phenotypic plasticity allows the same genotype to produce a variety of phenotypes in response to different local condition (Komers, 1997). As geographic variation in morphometry has been used to discriminate local forms of fishes (Cadrin, 2000) the aim of this study was to examine variability in external morphology of R. prespensis populations from Lake Prespa and Lake Skadar.
MATERIAL AND METHODS
Study area The Lake Skadar drainage basin is located between 18º41' and 19º47' East
and between 42º58' and 40º10' North in a karstic area in the outer part of the southeastern Dinaric Alps. It is the largest of the Balkan lakes and has a surface area which fluctuates seasonally from approximately 370 to 600 km2. The water level also varies seasonally from 4.7 to 9.8 m above sea level. The lake extends in the NW-SE direction, and it is approximately 44 km long. The Bojana River connects the lake with the Adriatic Sea, and the Drim River provides a link with Lake Ohrid. The exact origin of the lake is unknown but it probably originated by solution and tectonic processes during the Pleistocene (Stanković, 1960). The Southern and southwestern sides of the lake are rocky, barren and steep, having bays in which the sublacustrine springs are usually found (so called “oka” – “eye”).
Lake Prespa is the second largest lake in Macedonia after Lake Ohrid with a depth of 54 meters, and 87.5 km shoreline, maximum length of about 28 km and a maximum width of l7 km (Stilinović, 1987). Today the maximum depth is estimated at 48 m (Stavrić & Popovska, 2008). Lake Prespa consists of two lakes: Great Prespa (273km2, 853 m above sea level) and Small Prespa (41 km2, 857 meters above sea level). These two lakes are located between two mountains Galičica and Baba. Lake Prespa has no surface outflow and it is connected with Lake Ohrid by underground hydraulic connections and karst channels (Anovski et al, l991; Eftimi & Zoto, 1996; Eftimi et al, 2002; Matzinger et al, 2006).
Sample collection Samples were collected in Lake Prespa and Lake Skadar with multi mesh
size gill nets (EU standard EN 14757). The specimens were sampled from several different, primary littoral sites. Fish were removed from the catch and

Phenotypic plasticity of Rutilus prespensis (Karaman, S., 1924) … 157
immediately deep-frozen for later analysis. A total of 20 morphometric characters were analyzed: TL - Total length, SL - Standard length, H - Maximum body height, h - Minimum body height, hc – Head height, lc - Head length, Oh - Horizontal eye diameter, iO - Interorbital distance, prO - Preorbital distance, poO - Postorbital distance, Lpc- Length of caudal peduncle, pV – Preventral distance, pD - Predorsal distance, poD - Postdorsal distance, ID - dorsal fin length, hD - dorsal fin height, IA - Anal fin length, hA - Anal fin height, IP - Pectoral fin length, IV - Ventral fin length. Data were only collected from the left side of the fish. Morphometric measurements were taken to the nearest 0.02 mm using calipers according to and in accordance with Holčik (1989). Measurements were performed on 70 fish (35 of which were from Lake Skadar and 35 from Lake Prespa).
Statistical analyses The resulting data were statistically analyzed using Statistica 7.0. and
Minitab 16.0. All measurements were plotted against TL, in order to eliminate variability that could occur as a result of allometric growth. ANOVA was used to examine interpopulation variability, and statistical significance was determined by Tukey HSD Post-hoc test. ANCOVA was used to examine differences in body shape between populations. The allometric growth relative to TL was calculated from the function Y = aTLb, where a and b are constants and Y is the morphometric variable (Minos et al, 1995). The 95% confidence intervals (Cls) of the parameters and the statistical significance of the regression relationship (r2) were estimated. The morphometric variables were then divided into three categories: positive allometry (+ A), when the slope (b, allometry coefficient) was higher than 1 and the variable increased relatively to TL; negative allometry (- A), when the slope was lower than 1, indicating direct proportionality between the variable and TL. The significance of the slope was tested by means of a t-test (Zar, 1999).
RESULTS
Data obtained from the measurements of morphometric characters of R. prespensis from Lake Prespa and Lake Skadar are provided in Table 1. Analysis of variance (ANOVA) revealed differences between populations for seven morphometric characters (Table 2). Characters H, lc, Oh, iO, pD and hD showed extremely high significant differences (P<0,001) while lA showed high significant differences (P<0,01) (Table 2). Characters H, lc, oH, iO, pD, hD, lA showed no value overlapping, which indicated significant differences between populations in these characters (Figure 1-7).
The parameters of the equation of each morphometric variable versus total length (TL) of R prespensis from Lake Prespa and Lake Skadar are presented in Table 3. In roach from Lake Skadar, two dimensions (pO and lD) revealed a positive allometric relationship, and ten (h, hc, Oh,iO, lpc, hD, lA, hA, lP and lV) had a negative allometric relationship. Six dimensions (H, lc, prO, pD, poD and PV) had an isometric relationship with TL. In roach from Lake Prespa all characters, except lA that showed positive allometric relationship, revealed negative allometric relationship.
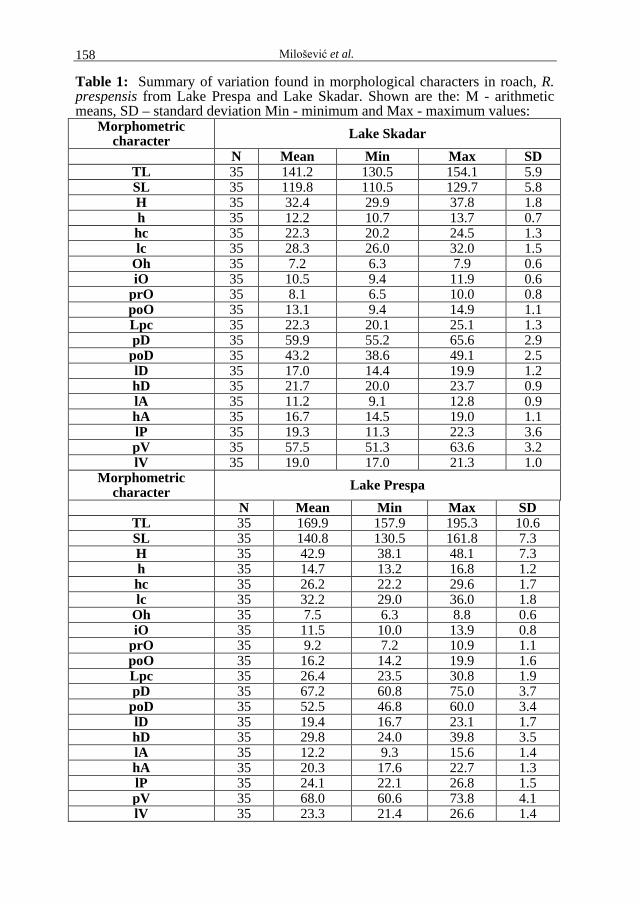
Milošević et al. 158
Table 1: Summary of variation found in morphological characters in roach, R. prespensis from Lake Prespa and Lake Skadar. Shown are the: M - arithmetic means, SD – standard deviation Min - minimum and Max - maximum values:
Morphometric character Lake Skadar
N Mean Min Max SD TL 35 141.2 130.5 154.1 5.9 SL 35 119.8 110.5 129.7 5.8 H 35 32.4 29.9 37.8 1.8 h 35 12.2 10.7 13.7 0.7 hc 35 22.3 20.2 24.5 1.3 lc 35 28.3 26.0 32.0 1.5
Oh 35 7.2 6.3 7.9 0.6 iO 35 10.5 9.4 11.9 0.6
prO 35 8.1 6.5 10.0 0.8 poO 35 13.1 9.4 14.9 1.1 Lpc 35 22.3 20.1 25.1 1.3 pD 35 59.9 55.2 65.6 2.9
poD 35 43.2 38.6 49.1 2.5 lD 35 17.0 14.4 19.9 1.2 hD 35 21.7 20.0 23.7 0.9 lA 35 11.2 9.1 12.8 0.9 hA 35 16.7 14.5 19.0 1.1 lP 35 19.3 11.3 22.3 3.6 pV 35 57.5 51.3 63.6 3.2 lV 35 19.0 17.0 21.3 1.0
Morphometric character Lake Prespa
N Mean Min Max SD TL 35 169.9 157.9 195.3 10.6 SL 35 140.8 130.5 161.8 7.3 H 35 42.9 38.1 48.1 7.3 h 35 14.7 13.2 16.8 1.2 hc 35 26.2 22.2 29.6 1.7 lc 35 32.2 29.0 36.0 1.8
Oh 35 7.5 6.3 8.8 0.6 iO 35 11.5 10.0 13.9 0.8
prO 35 9.2 7.2 10.9 1.1 poO 35 16.2 14.2 19.9 1.6 Lpc 35 26.4 23.5 30.8 1.9 pD 35 67.2 60.8 75.0 3.7
poD 35 52.5 46.8 60.0 3.4 lD 35 19.4 16.7 23.1 1.7 hD 35 29.8 24.0 39.8 3.5 lA 35 12.2 9.3 15.6 1.4 hA 35 20.3 17.6 22.7 1.3 lP 35 24.1 22.1 26.8 1.5 pV 35 68.0 60.6 73.8 4.1 lV 35 23.3 21.4 26.6 1.4

Phenotypic plasticity of Rutilus prespensis (Karaman, S., 1924) … 159
Figure 1. Box & Whisker diagram of morphometric character H of R.prespensis in relation to examines lakes
Figure 2. Box & Whisker diagram of morphometric character lc of R.prespensis in relation to examines lakes
Figure 3. Box & Whisker diagram of morphometric character oh of R. prespensis in relation to examines lakes
Figure 4. Box & Whisker diagram of morphometric character io of R. prespensis in relation to examines lakes
Figure 5. Box & Whisker diagram of morphometric character pD of R.prespensis in relation to examines lakes
Figure 6. Box & Whisker diagram of morphometric character hD of R.prespensis in relation to examines lakes

Milošević et al. 160
Figure 7. Box & Whisker diagram of morphometric character lA of R.prespensis
in relation to examines lakes
Table 2. Analysis of variance and covariance (covariable is standard length SL) of morphometric characters of R.prespensis from Lake Prespa and Lake Skadar
Morphometric character ANOVA Prespa/Skadar ANCOVA Prespa/Skadar
F P F P SL 10.18 0.002**
H 53.55 0.0001*** 88.27 0.000***
h 0.25 0.618 3.66 0.062 hc 2.56 0.116 0.04 0.848 lc 21.95 0.0001*** 9.67 0.003**
Oh 33.46 0.0001*** 22.78 0.000*** iO 27.91 0.0001*** 18.63 0.000***
prO 3.22 0.079 0.75 0.392
poO 1.423 0.238 4.38 0.042 Lpc 1.05 0.311 0.33 0.566 pD 0.51 0.0001*** 28.10 0.000***
poD 2.32 0.477 4.74 0.034* lD 8.51 0.005** 3.95 0.053 hD 33.15 0.0001*** 41.26 0.000*** lA 16.34 0.0002** 10.42 0.002** hA 0.22 0.638 0.09 0.767 lP 0.83 0.366 1.33 0.255 pV 1.50 0.226 0.01 0.915 lV 2.14 0.150 3.83 0.056

Phenotypic plasticity of Rutilus prespensis (Karaman, S., 1924) … 161
Table 3. Morphometric variables versus Total length (TL) of R. prespensis from Lake Prespa and Lake Skadar
Dimension Regression parameters (R.prespensis from Lake Skadar) b 95% Cl of b a 95% Cl of a r2 Slope (b)
H 1.066 0.743-1.389 0.166 -0.100-0.432 0.773 I h 0.434 -0.069-0.937 1.420 -2.1178-4.9578 0.304 -A* hc 0.854 0.418-1.289 0.326 -0.377-1.029 0.345 -A* lc 1.022 0.708-1.335 0.180 -0.100-0.460 0.769 I
Oh 0.186 -0.557-0.928 2.896 -7.766-13.558 0.092 -A* iO 0.568 0.117-1.018 0.634 -0.781-2.049 0.423 -A*
prO 1.058 0.266-1.849 0.043 -0.125-0.211 0.443 I poO 1.249 0.586-1.911 0.027 -0.061-0.115 0.572 +A* pD 0.973 0.728-1.218 0.489 -0.103-1.075 0.826 I poD 0.957 0.578-1.335 0.379 -0.331-1.088 0.683 I pV 1.073 0.788-1.363 0.283 -0.125-0.691 0.807 I Lpc 0.419 -0.098-0.924 2.801 -4.282-9.884 0.291 -A* lD 1.202 0.737-1.666 0.044 -0.057-0.145 0.692 +A* hD 0.434 0.091-0.777 2.526 -1.770-6.822 0.424 -A* lA 0.523 -0.177-1.222 0.840 -2.071-3.751 0.267 -A* hA 0.181 -0.401-0.763 6.780 -12.727-26.287 0.115 -A* lP 0.746 -0.569-2.679 1.325 -1.324-2.985 0.721 -A* lV 0.591 0.152-1.030 1.018 -1.197-3.233 0.446 -A*
Dimension Regression parameters (Lake Prespa)
b 95% Cl of b a 95% Cl of a r2 Slope (b)
H 0.698 0.292-1.103 1.194 -1.287-3.675 0.623 -A* h 0.436 -.0174-1.026 1.653 -3.437-6.743 0.312 -A* hc 0.585 0.154-1.016 1.299 -1.579-4.174 0.531 -A* lc 0.606 0.285-0.927 1.431 -0.928-3.791 0.657 -A*
Oh 0.579 -0.005-1.163 0.385 -0.771-1.541 0.416 -A* iO 0.449 -0.048-0.946 1.149 -1.785-4.083 0.385 -A*
prO 0.306 -0.611-1.227 1.899 -7.060-10.858 0.152 -A* poO 0.770 0.152-1.387 0.310 -0.67-1.29 0.500 -A* pD 0.618 0.310-0.925 2.818 -1.644-7.281 0.679 -A* poD 0.861 0.568-1.153 0.631 -0.316-1.577 0.806 -A* pV 0.594 0.214-0.974 3.222 -3.069-9.514 0.585 -A* Lpc 0.603 0.121-1.085 1.192 -1.765-4.149 0.499 -A* lD 0.710 0.155-1.264 0.506 -0.932-1.944 0.510 -A* hD 0.559 -0.274-1.392 1.678 -5.503-7.181 0.296 -A* lA 1.168 0.468-1.867 0.030 -1.048-1.108 0.611 +A* hA 0.762 0.393-1.130 0.404 -0.362-1.170 0.690 -A* lP 0.649 -0.105-1.404 0.859 -0.742-2.454 0.637 -A* lV 0.701 0.407-0.995 0.638 -0.326-1.602 0.740 -A*
Slope patterns are: +A, positive allometry; -A, negative allometry; I, isometry. *indicates significant difference of b value from 3 (t-test; P<0.05)

Milošević et al. 162
DISCUSSION Rutilus spp. from the extant ancient Balkan lakes (Prespa, Ohrid and
Skadar) share a relatively recent (within the Pleistocene) common ancestry. This ancestral haplotype was found in Lake Prespa and in Lake Skadar individuals of R. prespensis (Milošević et al, 2011). Genetic variation for a fixed phenotype has been hypothesized in stable environments (Smith, 1993). Besides genetic variation for a canalized phenotype, phenotypic plasticity, an environmental-induced phenotypic change that occurs within an organism's lifetime (Stearns, 1989), is also likely to play an important role in the process of diversification (West-Eberhard, 1989). Moreover, phenotypic plasticity is regarded to be more beneficial in variable environments, where a single optimal phenotype may be favored instead of maintaining plasticity in traits (Schlichting & Pigliucci, 1998). Bearing in mind the fact that R. prespensis presumably represents the allochthonous species of the Lake Skadar, the subject of this paper was an analysis of morphological variability, in two significantly different lakes, in order to determine morphological adaptation in a new environment. Phenotypic plasticity allows the same genotype to produce a variety of phenotypes in response to different local condition (Komers, 1997). Indeed, body shape in fishes can be influenced by various factors such as temperature (Martin, 1949; Beacham, 1990; Šumer et al., 2005), food ratio (Currens et al, 1989) and type of food or feeding mode (Day et al, 1994; Robinson & Wilson, 1996).
In this study both ANOVA and ACOVA, showed differences in body morphology (form) of examined populations, indicated by differences in H, lc, oH, iO, pD, hD, and lA. These seven characters did not show any overlap in size between examined populations (Figure 1-7). Roach from Lake Prespa had a deeper body and deeper dorsal fin, while roach from Lake Skadar had larger head, bigger horizontal eye diameter, bigger interorbital distance, bigger predorsal distance and longer anal fin. The obtained results are in agreement with the results of Marić, 1989. Autor has highlighted significant differences between populations from Lake Prespa and Skadar and describes a new subspecies Rutilus prespensis vukovici ssp. new.
Roach from Lake Prespa had a deeper body than roach from Lake Skadar. This result explains the fact that R. prespensis is a long period of time assigned as an endemic species for Lake Prespa, because the phenotypically observed body shape can indicate differences from other taxa. The body form is also related to habitat use. A deeper body is thought to be better for maneuvering in structured habitats, whereas a streamlined body is thought to be adapted for minimizing drag while searching for food in open water (Webb, 1984). Study on perch (Svanbäck & Eklöv, 2002; 2006) indicated that perch caught in the littoral habitat, independent of size, had a deeper body, larger head, and mouth and longer fins than perch caught in the pelagic zone. Bearing in mind that the Lake Skadar is generally shallow and subject to large surface area fluctuations obtained results are in correlation with general littoral distribution of R. prespensis (Milošević et al, 2011).
Phenotypic plasticity of Rutilus prespensis (Karaman, S., 1924) … 163
The analysis of morphometric variables demonstrated a substantial degree of differences between examined populations of R. prespensis concerning the growth pattern. Variability in growth, development and maturation creates a variety of body shapes within a species (Cadrin, 2000) that, along with ecological interactions of organism are directly or indirectly influenced by environmental conditions (Norton et al, 1995). In R. prespensis from Lake Skadar, two characteristics (pO and lD) revealed a positive allometric relationship, and ten (h, hc,Oh, iO, lpc, hD, lA, hA, lP and lV) had a negative allometric relationship. Six dimensions (H, lc, prO, pD, poD and PV) had an isometric relationship with TL. In roach from Lake Prespa all characters, except lA that showed positive allometric relationship, revealed negative allometric relationship. However, comparative analysis of available literature data Simonović, 1995, showed that some characters have relatively constant variability, such as horizontal eye diameter, which often exhibits negative values of correlation coefficient in available literature, and it is ontogenetically determined. The obtained differences in body shape are in correlation with different growth models based on length-weight relationships. The relationship of body weight versus length showed negative allometric growth for R. prespensis from Lake Prespa (Milošević & Talevski, 2016). On the contrary, positive allometric growth has been reported for R. prespensis from Lake Skadar (Milošević et al, 2012). This variation for the same species is obviously attributed to differences in age and stage of growth increment, food, as well as environmental conditions (Weatherley & Gill 1987). Differences in morphology among species and between populations of the same species can often be interpreted as adaptation to different ecological conditions. The specificity of the morphometric characters variable nature often creates difficulties in the precise determination of morphological adaptivity in a new environment. In this study, we showed substantial differences in body morphology (form) of examined populations which are obviously result of ecological conditions in the littoral zones of studied lakes such as water level, temperature, macrophyte vegetation (Talevska et al, 2009), as well as different lakes altitudes, lakes surfaces and lakes depths. Also, the present study examines the allometric growth pattern of a number of morphometric characters of R. prespensis. Bearing in mind the fact that R. prespensis presumably represents the allochthonous species, these findings represent a basis for further research in the area that will contribute in the determination of its distribution in Adriatic drainages and adaptations in different environments.
REFERENCES
Anovski, T., Andonovski, B. & Minceva, B. (1991): Study of the hydrologic relationship between Ohrid and Prespa lakes. Proceedings of IAEA International Symposium IAEA-SM319/62 p.Vienna
Beacham, T. D. (1990): A genetic analysis of meristic and morphometric variation in chum salmon (Oncorhynchus keta) at three different temperatures. Canadian Journal of Zoology. 68, 225-229. Doi: 10.1139/z90-033.
Milošević et al. 164
Cadrin, S. X. (2000): Advances in morphometric identification of fishery stocks. Review in Fish Biology and Fisheries 10, 91-112. Doi: 10.1139/z90-033.
Currens,K. P., Sharpe, C. S., Hjort, R., Schreck, C. B. & Li, H. W. (1989): Effects of different feeding regimes on the morphometric of chinook salmon (Oncorhynchus tshawytscha) and rainbow trout (O. mykiss). Copeia, 689-695.
Darwall, W., Carrizo, S., Numa, C., Barrios, V., Freyhof, J. & Smith, K. (2014): Freshwater Key Biodiversity Areas in the Mediterranean Basin Hotspot: Informing species conservation and development planning in freshwater ecosystems. Cambridge, UK and Malaga, Spain: IUCN. x + 86pp
Day, T., Pritchard, J. & Schluter, D. (1994): A comparison of two sticklebacks. Evolution 48: 1723-1734.
Eftimi, R. &Zoto, J. (1996): Isotope study of the connection of Ohrid and Prespa Lakes. In: International Symposium "Towards integrated Conservation and Sustainable Development of Transboundary Macro and Micro Prespa Lakes", Symposium held in Korcha. Albania, 24-26 October 997. pp 32-37.
Eftimi. R., Skender, P. & Zoto, J. (2002): Isotope Study of Connection of Ohrid and Prespa Lakes. Geologica Balcanica, 32 (1): 43-49.
Galis, F., Terlouw, A., Osse, J.W.M. (1994): The relation between morphology and behaviour during ontogenic and evolutionary changes. Journal of Fish Biology 45: 13-26.
Gaston, K. J. & David, R. (1994): Hotspots across Europe. Biodiversity Letter2:108–116 Griffiths, H. I., Kryštufek, B, Reed, J. M. K. (2004): Balkan Biodiversity. Pattern and
Process in the European Hotspot. Kluwer Academic Publishers Holčik, J. (1989): The Freshwater fishes of Europe. Vol. 1, Part II. General introduction
to fishes-Acipenseriformes. Aula, Weisbaden, 469 pp. Karaman, S. (1924). Pisces Macedoniae. Split, pp 1-90. Komers, P. E. (1997): Behavioural plasticity in variable environments. Canadian Journal
of Zoology 75: 161-169. Doi: 10.1139/z97-023. Kováč, V., Copp, G. H. & Francis, M. P. (1999): Morphometry of the stone loch,
Barbatula barbatula: do mensural characters reflect the species life history thresholds? Environmental Biology of Fishes 56, 105-115. Doi: 10.1023/A:1007570716690
Marić, D. (2010). Rutilus albus sp. n (Cyprinidae, Pisces) from Lake Skadar. Periodicum biologorum, 112 (2): 153-158.
Martin, W. R. (1949): The Mechanism of Environmental Control of Body Form in Fishes. Toronto. ON: University of Toronto Press.
McPhail, J. D. (1984): Ecology and evolution of sympatric sticklebacks (Gasterosteus): morphological and genetic evidence for a species pair in Enos Lake, British Colombia. Canadian Journal of Zoology 62: 1402-1408.
Marić, D. (1989). The species revision of genus Rutilus Rafinesque, 1820 (Pisces) from western part of Balcan Peninsula. Glasnik Republičkog Zavoda za Zaštitu prirode i Prirodnjačkog muzeja u Titogradu., 21 (1988 [1989]): 55-79.
Marić, D. &Radujković, B. (2009): Rutilus ohridanus (Karaman, 1924) (Teleostei, Cyprinidae) from Ohrid, Prespa and Skadar Lakes. Natura Montenegrina 8(3): 137-150.
Matzinger, A., Jordanoski, M., Veljanoska-Sarafiloska, E., Sturm, M., Muller, B. &Wuest, A. (2006): ls Lake Prespa jeopardizing the ecosystem of ancient Lake Ohrid? Hvdrobiologia. 553: 89-109
Milošević, D. &Talevski, T. (2016): Length-weight relationship of 11 fish species from great natural and two artificial lakes in the Former Yugoslav Republic of Macedonia (FYROM). Acta Zoologica bulgarica 68 (3): 391-394
Milošević, D., Winkler, A.K., Marić, D. & Weiss, S. (2011): Genotypic and phenotypic evaluation of Rutilus spp. From Skadar, Ohrid and Prespa lakes supports revision of endemic as well as taxonomic status of several taxa. Journal of Fish Biology (ISSN: 0022-1112), 79: 1094-1110.

Phenotypic plasticity of Rutilus prespensis (Karaman, S., 1924) … 165
Milošević, D., Pešić, V., Petrović, D., Pavićević, A. & Marić, D. (2012): Length-weight relationship and condition factor of two sympatric Rutilus (Rafinesque, 1820) species from Lake Skadar (Montenegro). Archives of Biological Sciences 64 (3): 991-994.
Minos, G., Katselis, G., Kaspiris, P. & Ondrias, I. (1995). Comparison of the change in morphological pattern during the growth in length of the grey mullets Liza ramada and Liza saliens from western Greece. Fisheries Research, 23: 143-155.
Norton, S. F. (1995): Ecomorphological correlates – a functional approach to ecomorphological patterns of feeding in cotteid fishes. Environmental Biology of Fishes 44: 61-78.
Robinson, B. W. & Wilson, D. S. (1996): Genetic variation and phenotypic plasticity in a trophically polymorphic population of pumpkinseed sunfish (Lepomis gibbosus). Evolutionary Ecology 10, 631-652. Doi: 10.1007/BF01237711
Scheiner, S. M. (1993): Genetics and evolution of phenotypic plasticity. Annual Review of Ecology, Evolution, and Systematics,24: 35-68.
Schlichting, C. D. & Pigliucci, M. (1998): Phenotypic Evolution: A Reaction Norm Perspective. Sunderland, MA: Sinauer Associates, Inc.
Schluter, D. & McPhail, J.D. (1992): Ecological character displacement and speciation in sticklebacks. Am Nat 140: 85-108.
Svanbäck, R. &Eklöv, P. (2002). Effect of habitat and food resources on morphology and ontogenetic growth trajectories in perch. Oecologia 131: 61-70. Doi: 10.1007/s00442-001-0861-9.
Simonović, P.D. (1995): Static allometry in Eurasian perch (Perca fluviatilis). Folia Zoologica, 44(4): 335 – 342.
Smith, T. B. (1993): Disruptive selection and the genetic basis of bill size polymorphism in the African finch Pyrenestres. Nature. 363: 618-620.
Stanković, S. (1960): The Balkan Lake Ohrid and its living world. Uitgeverij Dr.W. Junk, Den Haag, Monographia biologicae. 9, 1-357.
Stavrić, V. & Popovska, C. (2008): Water balance of Lake Prespa. III Conference of water observation and information system for decision support. 27-31 May, Ohrid, R. Macedonia
Stearns, S. C. (1989): The evolutionary significance of phenotypic plasticity. BioSciece, 39: 436-445.
Stilinović, M. (1987): Ezera, Prespansko i Ohridsko. Hidrotehmička studija. Zavod za vodostopanstvo na SR Makedonija. Skloplje.
Talevska M., Petrović, D. Milošević, D. Talevski, T. Marić, D. and Talevska, A. (2009). Biodiversity of macrophyte vegetation from Lake Prespa, Lake Ohrid and Lake Skadar. Biotechnology and Biotechnological Equipment. (ISSN 1310-2818), 2 (23): 931-935. Sofija, Bugarska
Šumer, M. S., Kováč, V., Povž, M. & Slatner, M. (2005): External morphology of a Slovenian population of pumpkinseed Lepomis gibbosus (L.) from a habitat with extreme thermal conditions. Journal of Applied Ichtyology 21, 306-311. Doi: 10.1111/j.1439-0426.2005. 00691.x
Webb, P.W. (1884): Body form, locomotion and foraging in aquatic vertebrates. American Zoology, 24:107-120.
West-Eberhard. M. J. (1989). Phenotypic plasticity and the origin of diversity. Annual Review of Ecology, Evolution and Systematics 20: 249-278.
Zar, J.H. (1999): Biostatistical Analysis. Fourth ed. Prentice Hall Inc, pp 663.

Agriculture & Forestry, Vol. 63 Issue 3: 167-176, 2017, Podgorica 167
DOI: 10.17707/AgricultForest.63.3.17 Majid BAGNAZARI, Mehdi SAIDI, Prakash HARISHCHANDRA SRIPATHY, Geetha NAGARAJA1
ESTABLISHMENT OF AN IMPROVED, EFFICIENT AND ECO-FRIENDLY MICROPROPAGATION SYSTEM IN SALACIA CHINENSIS
L. AN ENDANGERED ANTI-DIABETIC MEDICINAL PLANT
SUMMARY An efficient micropropagation system via indirect organogenesis was
developed in Salacia chinensis L., an endangered anti-diabetic medicinal plant. Accurate investigation of the various plant sources (Leaf, node, shoot tip) and plant growth regulators (PGRs) impacts were accomplished in this study. Maximum rate of callus induction (93.43 ± 2.75%) was achieved from nodes inoculated on MS medium fortified with 1.0 mg/l NAA+ 2.0 mg/l BAP. Maximum shoot induction (93.33 ± 2.02%), number of shoots/explant (5.12 ± 0.09) and shoot length (3.17 ± 0.00 cm) were obtained from nodal explants inoculated on MS medium with 1.5 mg/l BAP + 1.0 mg/l NAA. IBA (2.0 mg/l) in ½ MS medium was observed to be the best rooting treatment, which promoted the highest frequency of rooting (91.66 ± 2.33%). The results suggested an efficient regeneration system for conservation and large scale production for pharmaceutical industry demands.
Keywords: Salacia chinensis, Anti-diabetic, Medicinal plant, Indirect organogenesis, In vitro conservation.
INTRODUCTION
Salacia chinensis L. (Celastraceae family) broadly dispersed in tropical and subtropical regions of the world, particularly in Indian subcontinent, China and Southeast Asian countries (Muraoka et al., 2010). Various parts of the plant have been extensively used in various traditional medicinal systems especially as a unique Ayurvedic medicine to treat a broad range of ailments (Singh et al., 2010; Sikarwar and Patil 2012). Phytoconstituents such as mangiferin, salacinol, kotalanol, phenolic glycosides and triterpenes have been isolated from the plant which showed different therapeutic properties (Yoshikawa et al., 2003). Although the plant is renowned for its anti-diabetic property but other activities such as anti-inflammatory, anti-cancer, anti-mutagen, anti-oxidant and cardioprotective are also been well documented (Guha et al., 1996; Yoshimi et al., 2001; Kishino et al., 2009).
1Majid Bagnazari (corresponding author: [email protected]) and Mehdi Saidi, Department of Horticulture Sciences, College of Agriculture, Ilam University, Ilam, IRAN; Prakash Harishchandra Sripathy and Geetha Nagaraja, DOS in Biotechnology, Manasagangotri, University of Mysore, Mysuru, INDIA. Notes: The authors declare that they have no conflicts of interest. Authorship Form signed online.

Bagnazari et al. 168
The plant habitat destruction, excessive and unpredictable collection for supplementation of worldwide demands particularly obvious anti-diabetic property placed S. chinensis on the endangered species category (Sharma et al., 2011). There has been an increased interest using plant tissue culture techniques in mass propagation of medicinal plants for recuperation of endangered species, thus reducing the risk of extinction (Nadeem et al., 2000; Phulwaria et al., 2013).
During last two years, there are only two protocols reported for the in vitro micropropagation of this endangered anti-diabetic medicinal plant (Chavan et al., 2015; Majid et al., 2016). Both the studies were limited to only direct regeneration system which is not applicable for further studies such as establishment of cell suspension culture in this plant. Establishment of an improved, efficient and eco-friendly propagation system using different plant growth regulators (PGRs) and various explant types for conservation and large scale production of S. chinensis for industrial utilization was the main goal of the present study.
MATERIALS AND METHODS
Indirect organogenesis Plant material, surface sterilization and culture conditions Young and healthy shoot tips, nodal segments and leaves collected from
field grown S. chinensis were washed twice in running tap water, pre-washed with concentrated dishwasher gel (3-4 drops/100 ml double-distilled water (ddH2O) (Vim, India) for 5 min. The explants were submerged in 70% (v/v) ethanol for 2 min, sterilized with 1.0% (w/v) sodium hypochlorite (NaOCl) plus 2-3 drops Tween 20 (HiMedia, India) for 15 min (Majid et al., 2014). The explants were washed thoroughly with ddH2O four times and cut into suitable sizes (1.0 - 2.0 cm).The explants were inoculated on Murashige and Skoog (MS) medium (Murashige and Skoog, 1962) with 3% (w/v) sucrose and 0.8% (w/v) agar (HiMedia, India). Before autoclaving at 121oC for 20 min, the medium pH was adjusted to 5.7. Cultures were kept at temperature of 25 ± 2oC for 16-h photoperiod with 40 µmolm-2 s-1 provided by cool-white florescent lamps (Philips, India).
Callus induction To induce callus, the explants were first cultured on MS medium fortified
by various auxins (NAA, 2,4-D, IBA) (0.5- 2.0 mg /l) individually to achieve the optimum concentration. The explants were then inoculated on MS medium supplemented with optimized auxin concentration in combination with various concentrations (0.5-2.0 mg/l) of BAP or Kin.
Shoot regeneration Callus from various explants that gave the optimum level was cut into a
number of segments and sub-cultured on MS shoot regeneration medium supplemented with different concentrations of BAP or Kin (1.0- 4.0 mg /l) individually or in combination with NAA, IAA and IBA (0.5-2.0 mg/l). Subcultures were carried out every 4 weeks. The shoot induction percentage,
Establishment of an improved, efficient and eco-friendly micropropagation system … 169
number of shoots/explant and the mean length of shoots were recorded after 8 weeks.
Rooting and acclimatization of regenerants Elongated shoots (3-5 cm in height) were cultured on full and ½ MS
medium fortified with NAA, IAA or IBA (0.5- 2.5 mg/l) for root formation. The rooting percentage, root number and length were recorded after 6 weeks of inoculation. Well-regenerated plantlets were removed from the medium, washed gently by rinsing in running tap water and transplanted to pots containing organic fertilizer, sand and peat (2:2:1) and covered by transparent plastic bags in culture room for 30 days. Transferring of the plantlets to the pots containing garden soil and maintaining in the glasshouse for another 2 weeks was the final step.
Statistical analysis All the tissue culture experiments of callus induction, shoot proliferation
and root formation were repeated three times with 12 replicates per treatment. One-way analysis of variance (ANOVA) was used for data analyzing in the statistical package of SPSS (Version 20.0. Armonk, NY, USA: IBM Corp.) The significant differences between means were scored using Duncan’s Multiple Range Test (P = 0.05).
RESULTS AND DISCUSSION Callus induction Successful explant surface sterilization without using highly toxic and
environmental-enemy chemical HgCl2 was established in this study. Explants on MS medium in the absence of PGRs failed to initiate callus even 4 weeks after inoculation, but using various auxins (NAA, 2,4-D, IBA) at different concentrations (0.5-2.0 mg/l) initiate the callus induction and showed variation in percentage. Similar results were reported in callus induction in various tissue culture studies of medicinal plants (Raha and Roy, 2003; Simmons et al., 2008; Wei et al., 2015). Callus was initiated after 14, 21 and 28 days after inoculation from the leaf, shoot and nodal explants respectively. All cultures were sub-cultured on the same medium after 4 weeks. According to data among various kind and concentration of auxins individually tested, the maximum callus (51.80 ± 0.70%) was induced on MS medium fortified by 1.0 mg/l NAA in nodal explants (Table 1) after 8 weeks. Variation in callus production and regenerated plantlets may depend on the genotype, source and physiological status of the explants (Nair and Seeni, 2001). Combination of optimum auxin (1.0 ml NAA) with cytokinins markedly improved the callus induction rate. The same influence was reported in previous studies (Jayaraman et al., 2014). Among the two cytokinins (BAP and Kin), BAP was most effective and maximum callus induction percentage (93.43 ± 2.75%) was obtained from nodal explants inoculated on MS medium fortified with 1.0 mg/l NAA and 2.0 mg/l BAP after 8 weeks (Table 1; Fig. 1B). Positive effect of auxin-cytokinin combination is well-documented in medicinal plant tissue culture studies (Rao et al., 2011; Brijwal et al., 2015).
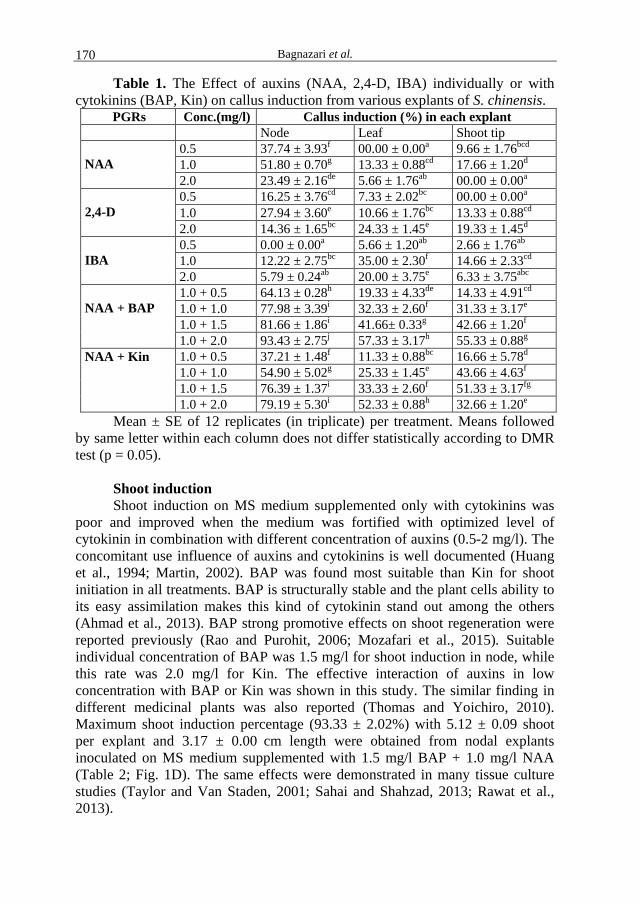
Bagnazari et al. 170
Table 1. The Effect of auxins (NAA, 2,4-D, IBA) individually or with cytokinins (BAP, Kin) on callus induction from various explants of S. chinensis.
PGRs Conc.(mg/l) Callus induction (%) in each explant Node Leaf Shoot tip NAA
0.5 37.74 ± 3.93f 00.00 ± 0.00a 9.66 ± 1.76bcd 1.0 51.80 ± 0.70g 13.33 ± 0.88cd 17.66 ± 1.20d 2.0 23.49 ± 2.16de 5.66 ± 1.76ab 00.00 ± 0.00a
2,4-D
0.5 16.25 ± 3.76cd 7.33 ± 2.02bc 00.00 ± 0.00a 1.0 27.94 ± 3.60e 10.66 ± 1.76bc 13.33 ± 0.88cd 2.0 14.36 ± 1.65bc 24.33 ± 1.45e 19.33 ± 1.45d
IBA
0.5 0.00 ± 0.00a 5.66 ± 1.20ab 2.66 ± 1.76ab 1.0 12.22 ± 2.75bc 35.00 ± 2.30f 14.66 ± 2.33cd 2.0 5.79 ± 0.24ab 20.00 ± 3.75e 6.33 ± 3.75abc
NAA + BAP
1.0 + 0.5 64.13 ± 0.28h 19.33 ± 4.33de 14.33 ± 4.91cd 1.0 + 1.0 77.98 ± 3.39i 32.33 ± 2.60f 31.33 ± 3.17e 1.0 + 1.5 81.66 ± 1.86i 41.66± 0.33g 42.66 ± 1.20f 1.0 + 2.0 93.43 ± 2.75j 57.33 ± 3.17h 55.33 ± 0.88g
NAA + Kin 1.0 + 0.5 37.21 ± 1.48f 11.33 ± 0.88bc 16.66 ± 5.78d 1.0 + 1.0 54.90 ± 5.02g 25.33 ± 1.45e 43.66 ± 4.63f 1.0 + 1.5 76.39 ± 1.37i 33.33 ± 2.60f 51.33 ± 3.17fg 1.0 + 2.0 79.19 ± 5.30i 52.33 ± 0.88h 32.66 ± 1.20e
Mean ± SE of 12 replicates (in triplicate) per treatment. Means followed by same letter within each column does not differ statistically according to DMR test (p = 0.05).
Shoot induction Shoot induction on MS medium supplemented only with cytokinins was
poor and improved when the medium was fortified with optimized level of cytokinin in combination with different concentration of auxins (0.5-2 mg/l). The concomitant use influence of auxins and cytokinins is well documented (Huang et al., 1994; Martin, 2002). BAP was found most suitable than Kin for shoot initiation in all treatments. BAP is structurally stable and the plant cells ability to its easy assimilation makes this kind of cytokinin stand out among the others (Ahmad et al., 2013). BAP strong promotive effects on shoot regeneration were reported previously (Rao and Purohit, 2006; Mozafari et al., 2015). Suitable individual concentration of BAP was 1.5 mg/l for shoot induction in node, while this rate was 2.0 mg/l for Kin. The effective interaction of auxins in low concentration with BAP or Kin was shown in this study. The similar finding in different medicinal plants was also reported (Thomas and Yoichiro, 2010). Maximum shoot induction percentage (93.33 ± 2.02%) with 5.12 ± 0.09 shoot per explant and 3.17 ± 0.00 cm length were obtained from nodal explants inoculated on MS medium supplemented with 1.5 mg/l BAP + 1.0 mg/l NAA (Table 2; Fig. 1D). The same effects were demonstrated in many tissue culture studies (Taylor and Van Staden, 2001; Sahai and Shahzad, 2013; Rawat et al., 2013).
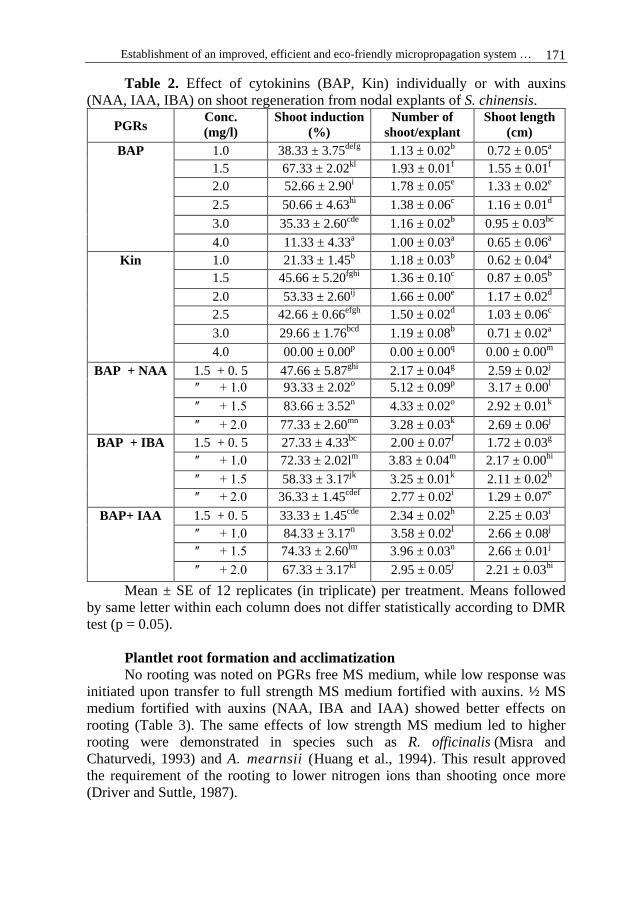
Establishment of an improved, efficient and eco-friendly micropropagation system … 171
Table 2. Effect of cytokinins (BAP, Kin) individually or with auxins (NAA, IAA, IBA) on shoot regeneration from nodal explants of S. chinensis.
PGRs Conc. (mg/l)
Shoot induction (%)
Number of shoot/explant
Shoot length (cm)
BAP 1.0 38.33 ± 3.75defg 1.13 ± 0.02b 0.72 ± 0.05a 1.5 67.33 ± 2.02kl 1.93 ± 0.01f 1.55 ± 0.01f 2.0 52.66 ± 2.90i 1.78 ± 0.05e 1.33 ± 0.02e 2.5 50.66 ± 4.63hi 1.38 ± 0.06c 1.16 ± 0.01d 3.0 35.33 ± 2.60cde 1.16 ± 0.02b 0.95 ± 0.03bc 4.0 11.33 ± 4.33a 1.00 ± 0.03a 0.65 ± 0.06a
Kin
1.0 21.33 ± 1.45b 1.18 ± 0.03b 0.62 ± 0.04a 1.5 45.66 ± 5.20fghi 1.36 ± 0.10c 0.87 ± 0.05b 2.0 53.33 ± 2.60ij 1.66 ± 0.00e 1.17 ± 0.02d 2.5 42.66 ± 0.66efgh 1.50 ± 0.02d 1.03 ± 0.06c 3.0 29.66 ± 1.76bcd 1.19 ± 0.08b 0.71 ± 0.02a 4.0 00.00 ± 0.00p 0.00 ± 0.00q 0.00 ± 0.00m
BAP + NAA 1.5 + 0. 5 47.66 ± 5.87ghi 2.17 ± 0.04g 2.59 ± 0.02j ʺ + 1.0 93.33 ± 2.02o 5.12 ± 0.09p 3.17 ± 0.00l ʺ + 1.5 83.66 ± 3.52n 4.33 ± 0.02o 2.92 ± 0.01k ʺ + 2.0 77.33 ± 2.60mn 3.28 ± 0.03k 2.69 ± 0.06j
BAP + IBA 1.5 + 0. 5 27.33 ± 4.33bc 2.00 ± 0.07f 1.72 ± 0.03g ʺ + 1.0 72.33 ± 2.02lm 3.83 ± 0.04m 2.17 ± 0.00hi ʺ + 1.5 58.33 ± 3.17jk 3.25 ± 0.01k 2.11 ± 0.02h ʺ + 2.0 36.33 ± 1.45cdef 2.77 ± 0.02i 1.29 ± 0.07e
BAP+ IAA 1.5 + 0. 5 33.33 ± 1.45cde 2.34 ± 0.02h 2.25 ± 0.03i ʺ + 1.0 84.33 ± 3.17n 3.58 ± 0.02l 2.66 ± 0.08j ʺ + 1.5 74.33 ± 2.60lm 3.96 ± 0.03n 2.66 ± 0.01j ʺ + 2.0 67.33 ± 3.17kl 2.95 ± 0.05j 2.21 ± 0.03hi
Mean ± SE of 12 replicates (in triplicate) per treatment. Means followed by same letter within each column does not differ statistically according to DMR test (p = 0.05).
Plantlet root formation and acclimatization No rooting was noted on PGRs free MS medium, while low response was
initiated upon transfer to full strength MS medium fortified with auxins. ½ MS medium fortified with auxins (NAA, IBA and IAA) showed better effects on rooting (Table 3). The same effects of low strength MS medium led to higher rooting were demonstrated in species such as R. officinalis (Misra and Chaturvedi, 1993) and A. mearnsii (Huang et al., 1994). This result approved the requirement of the rooting to lower nitrogen ions than shooting once more (Driver and Suttle, 1987).

Bagnazari et al. 172
Table 3. Effect of various auxins (NAA, IBA, IAA) in full and ½ MS medium on plantlet rooting from S. chinensis shoots.
PGRs (mg/l) Rooting (%) Root number/shoot Root length (cm) Full-strength MS + PGRs
0.5 NAA 00.00a 0.00a 0.00a 1.0 NAA 00.00a 0.00a 0.00a 1.5 NAA 04.66 ± 1.20a 1.08 ± 0.28b 0.72 ± 0.01cde 2.0 NAA 22.33 ± 2.33cd 1.11 ± 0.02bc 0.66 ± 0.01bcd 2.5 NAA 00.00a 0.00a 0.00a 0.5 IAA 07.33 ± 1.85ab 1.03 ± 0.07b 0.60 ± 0.02b 1.0 IAA 14.33 ± 4.05bc 1.02 ± 0.11b 0.80 ± 0.02ef 1.5 IAA 00.00a 0.00a 0.00a 2.0 IAA 38.66 ± 2.02fg 1.18 ± 0.02bcd 0.80 ± 0.02ef 2.5 IAA 28.66 ± 4.25de 1.26 ± 0.02cde 0.62 ± 0.04bc 0.5 IBA 19.33 ± 1.45cd 1.41± 0.01ef 0.88 ± 0.02fg 1.0 IBA 40.33 ± 1.85fgh 1.13 ± 0.04bc 0.75 ± 0.01de 1.5 IBA 60.66 ± 0.88kl 1.32 ± 0.02de 0.79 ± 0.04ef 2.0 IBA 67.00 ± 4.01lm 1.59 ± 0.03g 0.97 ± 0.03gh 2.5 IBA 43.33 ± 3.48gh 1.48 ± 0.03fg 0.88 ± 0.01ffg ½ MS + PGRs 0.5 NAA 28.66 ± 0.33de 2.01 ± 0.03h 0.71 ± 0.02cde 1.0 NAA 18.33 ± 1.85cd 2.23 ± 0.05i 0.82 ± 0.02ef 1.5 NAA 33.33 ± 2.02ef 2.47 ± 0.17j 1.01 ± 0.06h 2.0 NAA 46.66 ± 3.52ij 2.88 ± 0.01k 1.11 ± 0.02i 2.5 NAA 38.33 ± 1.45fg 2.79 ± 0.01k 1.17 ± 0.04i 0.5 IAA 51.66 ± 3.38jk 2.84 ± 0.02k 1.17 ± 0.04i 1.0 IAA 58.66 ± 5.45jk 3.16 ± 0.04l 1.31 ± 0.06j 1.5 IAA 53.33 ± 3.17jk 3.24 ± 0.03lm 1.38 ± 0.03jk 2.0 IAA 70.33 ± 2.18m 3.44 ± 0.06n 1.56 ± 0.04lm 2.5 IAA 37.33 ± 3.17fg 3.16 ± 0.05l 1.46 ± 0.01kl 0.5 IBA 36.66 ± 2.60fg 3.35 ± 0.05mn 1.51 ± 0.04l 1.0 IBA 55.53 ± 1.85jk 3.49 ± 0.03n 1.65 ± 0.03m 1.5 IBA 67.00 ± 1.52lm 3.97 ± 0.04o 1.82 ± 0.05n 2.0 IBA 91.66 ±2.33n 4.38 ± 0.05p 2.52 ± 0.03p 2.5 IBA 72.33 ± 2.90m 3.21 ± 0.05lm 2.18 ± 0.02o
Mean ± SE of 12 replicates (in triplicate) per treatment. Means followed
by same letter within each column does not differ statistically according to DMR test (p = 0.05).
Of the auxins tested, IBA was most effective on rooting in both MS mediums. The higher stability of IBA to chemical degradation during autoclaving and at room temperature than the other auxins could be convincing (Cuenca et al., 1999). The best root formation (91.66 ± 2.33%) highest number of roots per shoot (4.38 ± 0.05) with a mean length of 2.52 ± 0.03 cm was obtained in ½ MS

Establishment of an improved, efficient and eco-friendly micropropagation system … 173
with 2.0 mg/l IBA (Table 3; Fig. 1E-F). The IBA stimulatory effect on plantlet rooting were reported in other medicinal plant species (Fracaro and Echeverrigary, 2001; Chandra et al., 2006; Mir et al., 2014).
Hardening of the plantlets was done at room temperature on plastic pots filled with sand, peat and organic fertilizer. Further growth was obtained after transferring into the pots containing garden soil in the glasshouse for more 14 days, led to subsequent shifting to the field. Above 91% survivability in field condition was recorded and no morphological variation was observed from mother plants. The results showed improvement comparing to the previous, survival rates of 87% recorded Majid et al., (2016).
Figure 1. In vitro regeneration of S. chinensis. A-B Induced callus from leaf and nodal explants (MS + 1.0 mg/l NAA + 2.0 mg/l BAP ). C-D Shoot induction from leaf and nodal explants (MS + 1.5 mg/l BAP + 1.0 mg/l NAA). E Pre-culture for rooting of the elongated shoots. F Shoot rooting (½MS + 2.0 mg/l IBA).
In this study, we developed an efficient and eco-friendly propagation
system via accurate investigation of the various explants (Leaf, node, shoot tip) and PGRs impacts in S. chinensis. Overcoming the constraints of the two previous reports (Chavan et al., 2015; Majid et al., 2016) was achieved successfully. Evaluation of the various explant types and NaClO as a disinfectant

Bagnazari et al. 174
instead of using limited type of explants (one type) and highly toxic non eco-friendly surfactant HgCl2 for surface sterilization are the main advantages.
Although Majid et al., (2016) developed a proper micropropagation system but the study was limited to only direct regeneration system which is not applicable for further studies such as establishment of cell suspension culture in this plant, was overcome in this report via indirect regeneration protocol. Above 91% survivability in field conditions showed improvement comparing to the previous survival rates.
CONCLUSIONS
According to the obtained results, this simple, rapid and eco-friendly established protocol could be successfully applied for conservation and large-scale production of S. chinensis in order to supply the daily-growing demand of pharmaceutical industry. Strategies to develop the use of established micropropagation system for this plant as renewable source of raw material for industrial utilization should be focus of the future studies.
ACKNOWLEDGMENTS
The authors acknowledge the support from MHRM and UGC under IOE scheme awarded for the University of Mysore. Majid BN is thankful to UGC for JRF (No. F.19-1/2013(SA-I) to foreign students from developing countries.
REFERENCES
Ahmad, N., Javed, S., Khan, M.& Anis, M. (2013): Rapid plant regeneration and analysis of genetic fidelity in micropropagated plants of Vitex trifolia: an important medicinal plant. Acta. Physiol. Plant. 35: 2493-2500.
Brijwal, L., Pandey, A.& Tamta, S. (2015): In vitro propagation of the endangered species Berberis aristata DC. via leaf-derived callus. In Vitro Cell.Dev.Biol.-Plant 51: 637-647.
Chandra, B., Palni, L.& Nandi, S. (2006): Propagation and conservation of Picrorhiza kurrooa Royle ex Benth.: an endangered Himalayan medicinal herb of high commercial value. Biodivers Conserv. 15: 2325-2338.
Chavan, J., Ghadage, D., Bhoite, A.& Umdale, S. (2015): Micropropagation, molecular profiling and RP-HPLC determination of mangiferin across various regeneration stages of Saptarangi (Salacia chinensis L.). Ind. Crops Prod. 76: 1123-1132.
Cuenca, S., Amo-Marco, J.& Parra, R. (1999.): Micropropagation from inflorescence stems of the Spanish endemic plant Centaurea paui Loscos ex Willk. (Compositae). Plant. Cell. Rep. 18: 674–679.
Driver, J.A.& Suttle, G.R.L., 1987. Nursery handling of propagules. In: Cell and tissue culture in forestry, Springer, Heidelberg, Germany, pp. 320–335.
Fracaro, F.& Echeverrigaray, S. (2001): Micropropagation of Cunila galioides, a popular medicinal plant of south Brazil. Plant. Cell. Tiss. Organ. Cult. 64: 1–4.
Guha, S., Ghosal, S.& Chattopadhyay, U. (1996): Antitumor, immunomodulatory and anti-hiv effect of mangiferin, a naturally occurring glucosylxanthone. Chemotherapy. 42: 443-451.
Huang, F.H., Al-Khayri, J.M.& Gbur, E.E. (1994): Micropropagation of Acacia mearnsii. In Vitro Cell. Dev. Biol-Plant 30: 70–74.

Establishment of an improved, efficient and eco-friendly micropropagation system … 175
Jayaraman, S., Daud, N., Halis, R.& Mohamed, R. (2014): Effects of plant growth regulators, carbon sources and pH values on callus induction in Aquilaria malaccensis leaf explants and characteristics of the resultant calli. J. For. Res. (Harbin) 25: 535-540.
Kishino, E., Ito, T., Fujita, K.& Kiuchi, Y. (2009): A mixture of Salacia reticulata (Kotala himbutu) aqueous extract and cyclodextrin reduces body weight gain, visceral fat accumulation, and total cholesterol and insulin increases in male Wistar fatty rats. Nut. Res. 29: 55-63.
Majid, B.N., Roopa, G., Sampath, K.K.K., Kini, K.R., Prakash ,H.S., Abbagani, S., Kiani, M. & Geetha, N. (2014): Establishment of an efficient explant surface sterilization protocol for in vitro micropropagation of Salacia chinensis L., an endangered anti-diabetic medicinal plant. WJPPS 3: 1266–1274.
Majid, B.N., Sampath, K.K.K., Prakash, H.S. & Geetha, N. (2016): Rapid mass propagation of Salacia chinensis l., an endangered valuable medicinal plant through direct organogenesis. Indian J. Sci. Technol. 9: 1-8.
Martin, K. (2002): Rapid propagation of Holostemma adakodien Schult., a rare medicinal plant, through axillary bud multiplication and indirect organogenesis. Plant Cell. Rep. 21:112–117.
Mir, B.A., Mir, S.A.& Koul, S. (2014): In vitro propagation and withaferin A production in Withania ashwagandha, a rare medicinal plant of India. Physiol. Mol. Biol. Plants 20: 357–364.
Misra, P.& Chaturvedi, H. (1993): Caulogenic efficacy of cytokinin in internodal explants of Rosmarinus officinalis L. as affected by auxin and inorganic salts. J. Plant. Biochem. Biot. 2: 55–60.
Mozafari, A., Vafaee, Y.& Karami, E. (2015): In vitro propagation and conservation of Satureja avromanica Maroofi—an indigenous threatened medicinal plant of Iran. Physiol. Mol. Biol. Plants. 21(3):433-439.
Muraoka, O., Morikawa, T., Miyake, S., Akaki, J., Ninomiya, K., Pongpiriyadacha, Y.& Yoshikawa, M. (2010): Quantitative analysis of neosalacinol and neokotalanol, another two potent α-glucosidase inhibitors from Salacia species, by LC-MS with ion pair chromatography. J. Nat. Med. 65: 142-148.
Murashige, T.& Skoog, F. (1962): A revised medium for rapid growth and bio assays with tobacco tissue cultures. Physiol Plant 15: 473-497.
Nadeem, M., Palni, L., Purohit, A., Pandey, H.& Nandi, S. (2000): Propagation and conservation of Podophyllum hexandrum Royle: an important medicinal herb. Biol. Cons. 92: 121-129.
Nair, L.G.& Seeni, S. (2001): Rapid in vitro multiplication and restoration of Celastrus paniculatus Willd. sub sp. paniculatus (Celastraceae), a medicinal woody climber. Indian J. Exp. Biol. 39: 697–704.
Phulwaria, M., Shekhawat, N., Rathore, J.& Singh, R. (2013): An efficient in vitro regeneration and ex vitro rooting of Ceropegia bulbosa Roxb.—A threatened and pharmaceutical important plant of Indian Thar desert. Ind. Crops Prod. 42: 25-29.
Raha, S.& Roy, S. (2003): Efficient plant regeneration in Holarrhena antidysenterica Wall. from shoot segment-derived callus. In Vitro Cell. Dev. Biol- Plant 39: 151-155.
Rao, K., Chodisetti, B., Gandi, S., Mangamoori, L.& Giri, A. (2011): Direct and indirect organogenesis of Alpinia galanga and the phytochemical analysis. Appl. Biochem. Biotechnol. 165:1366-1378.

Bagnazari et al. 176
Rao, M.& Purohit, S. (2006): In vitro shoot bud differentiation and plantlet regeneration in Celastrus paniculatus Willd. Biol. Plantarum. 50: 501-506.
Rawat, J.M., Rawat, B., Agnihotri, R.K., Chandra, A.& Nautiyal, S. (2013): In vitro propagation, genetic and secondary metabolite analysis of Aconitum violaceum Jacq.: a threatened medicinal herb. Acta Physiol. Plant. 35: 2589–2599.
Sahai, A.& Shahzad, A. (2013): High frequency in vitro regeneration system for conservation of Coleus forskohlii: a threatened medicinal herb. Acta Physiol. Plant. 35: 473–481.
Sharma, K., Bhagya, N., Sheik, S.& Samhitha, M. (2011): Isolation of endophytic Colletotrichum gloeosporioides Penz. from Salacia chinensis and its antifungal sensitivity. J. Phytol. 3: 20-22.
Sikarwar, M.& Patil, M. (2012): Antihyperlipidemic activity of Salacia chinensis root extracts in triton-induced and atherogenic diet-induced hyperlipidemic rats. Indian J. Pharmacol. 44: 88.
Simmons, M., Cappa, J., Archer, R., Ford, A., Eichstedt, D.& Clevinger, C. (2008): Phylogeny of the Celastreae (Celastraceae) and the relationships of Catha edulis (qat) inferred from morphological characters and nuclear and plastid genes. Mol. Phylogenet. Evol. 48: 745-757.
Singh, R.G., Rathore, S.S., Kumar, R., Agarwal, A.& Dubey, G.P. (2010): Nephroprotective role of Salacia chinensis in diabetic CKD patients: A pilot study. Indian J. Med. Sci. 64: 378.
Taylor, J.& Van-Staden, J. (2001): In vitro propagation of Eucomis L’Hérit species-plants with medicinal and horticultural potential. Plant Growth Regul. 34: 317–329.
Thomas, T.D.& Yoichiro, H. (2010): In vitro propagation for the conservation of a rare medicinal plant Justicia gendarussa Burm. f. by nodal explants and shoot regeneration from callus. Acta Physiol. Plant. 32: 943–950.
Wei, Q., Cao, J., Qian, W., Xu, M., Li, Z.& Ding, Y. (2015): Establishment of an efficient micropropagation and callus regeneration system from the axillary buds of Bambusa ventricosa. Plant Cell Tiss. Organ Cult. 122: 1-8.
Yoshikawa, M., Pongpiriyadacha, Y., Kishi, A., Kageura, T., Wang, T., Morikawa, T.& Matsuda, H. (2003): Biological activities of Salacia chinensis originating in Thailand: the quality evaluation guided by alpha-glucosidase inhibitory activity. Yakugaku Zasshi: Journal of the Pharmaceutical Society of Japan. 123: 871–880.
Yoshimi, N., Matsunaga, K., Katayama, M., Yamada, Y., Kuno, T., Qiao, Z., Hara, A., Yamahara, J.& Mori, H. (2001): The inhibitory effects of mangiferin, a naturally occurring glucosylxanthone, in bowel carcinogenesis of male F344 rats. Cancer Lett. 163: 163-170.

Agriculture & Forestry, Vol. 63 Issue 3: 177-187, 2017, Podgorica 177
DOI: 10.17707/AgricultForest.63.3.18 Jelena GOLIJAN, Aleksandar POPOVIĆ, Bojan DIMITRIJEVIĆ, Ljubiša KOLARIĆ, Ljubiša ŽIVANOVIĆ1
THE STATUS OF THE FORAGE ORGANIC PRODUCTION IN THE REPUBLIC OF SERBIA
SUMMARY
Organic agricultural production, as a type of sustainable agriculture, has been permanently growing at the global level. In the Republic of Serbia, this trend is characteristic for all crops, including forage crops. Organic cereal production has a primary role and is performed on the area of 4,251.94 ha. Total areas cultivated with forage crops organically produced amount to 1440.39 ha, but they were, on average, 975.8 ha in the analysed 2012-2015 period. The smallest areas were located near the municipality of Belgrade, while the largest ones were in the region of the Province of Vojvodina (1331.7 ha in 2015) in all four analysed years. The regions of Šumadija and western Serbia were characterised by the reduction of areas cultivated with organic forage crops in the analysed period, so the production of this type of crops was performed only on 4.96ha in 2015, making a decrease of 12.37% in comparison to 2014.
The greatest increase of areas cultivated with organic forage crops was recorded in 2014, when the value of the chain index was 202.5%, indicating the increase of areas of 102.5% in comparison to 2013.
Keywords: forage crops, area, regions, districts
INTRODUCTION The concept of organic agriculture has been designed to protect
biodiversity, the environment and existing resources, and to be technically applicable, socially acceptable and economically sustainable, making an alternative to the conventional production (Veličković et al., 2016). The essential aims of this production system are as follows:
1) the increase of soil fertility, 2) minimising energy inputs, 3) the reduction of environmental risks and
1Jelena Golijan (corresponding author: [email protected]), Department of Genetics, Plant Breeding and Seed Production Faculty of Agriculture, University of Belgrade, Zemun, SERBIA; Bojan Dimitrijević, Department of Management in Agribusiness; Faculty of Agriculture, University of Belgrade, Belgrade, SERBIA; Aleksandar Popović, Maize Research Institute, Zemun Polje, Belgrade-Zemun, SERBIA; Ljubiša Kolarić, Ljubiša Živanović, Department of Field and Vegetable Crops, Faculty of Agriculture, University of Belgrade, Belgrade, SERBIA. Notes: The authors declare that they have no conflicts of interest. Authorship Form signed online.

Golijan et al. 178
4) maintenance of achieved production levels (Popović et al., 2016; Golijan and Popović, 2016).
The goal of organic production is to preserve natural resources of soil, provide the organic food production, increase producers' standards of living, alongside with the production of food of high quality, introduction of constructive relationships of production and natural ecosystem; the reduction and/or the prevention and control of soil erosion and the increase of its fertility; the reduction of all forms of pollution that occur in the production process; the maintenance of genetic diversity within the production system with the protection of crops and natural habitats, as well as affecting social and ecological impacts of farmers (Šiljković, 2001). Among other things, the basic principles of organic production are focused on the production of high-quality food, which as a preventive measure contributes to health protection and welfare of animals and humans (IFOAM, 2016; Golijan, 2016). Furthermore, the emphasis is on providing animals with opportunities to perform natural behaviour, getting feed adapted to their physiology and live in a natural environment (Lund, 2006). The stated principles of organic food are regulated by the European organic regulations (Council Regulation, (EC) No 2092/91), e.g., "…feeding of livestock with organic-farming crop products produced on the holding itself or on neighbouring organic holdings" and "... animals should have, whenever possible, access to open air or grazing areas" (citation by Jacobsen et al., 2015).
The forage crops production has a very important role in organic farms, where it is necessary for livestock breeding based on methods of the organic system, and it is especially significant in respect to ecological and economic sustainability of farms (Will, 2012). Marchall (2002) has stated that "Organic systems of forage production for feeding ruminants are based on a grass plus legume based sward with regular reseeding, placing a high demand on seed of appropriate varieties."
MATERIAL AND METHODS
Organic crop production has been increasing both in the world and in our country. The production of forage crops significantly participates in this segment of plant production. The trend of changes in areas with organic forage crops in Serbia and in certain regions and districts is analysed and graphically presented in this paper for the 2012-2015 period on the basis of relevant literature data and data provided by the Ministry of Agriculture and Environmental Protection of the Republic of Serbia. This presentation was done by the use of the Microsoft Excel 2010. The desk research method was applied. The average values of areas cultivated with organic forage crops and base and chain index were calculated for the analysed period by the use of Microsoft Excel 2010. Base indices were calculated by the division of a value of a parameter in a certain year by the base:
(%)100YYB
B
ii ⋅= . The average value of areas cultivated with organic cereals in the
2012-2015 period was used as the base. The base indices show a relative change

The status of the forage organic production in the Republic of Serbia 179
in areas cultivated with organic crops in relation to the average value. Chain indices are estimated by dividing a value of a parameter in a certain year by a
value of the parameter in the previous year: (%)100YYL
1i
ii ⋅=
−
. They indicate a
relative changes expressed in percentages in relation to the previous year.
RESULTS AND DISCUSSION Areas under organic farming has been permanently increasing both in the
world and Serbia. Total areas under this type of farming amount to 7628.55 ha and to 7669.47 ha in the period of conversion, while these areas in 2015 spread over 15298.02 ha (Ministry of Agriculture and Environmental Protection, 2017; www.makroekonomija.org), which represents the increase of 62% in comparison to 2014. Arable land encompasses 13398 ha (Golijan et al, 2017, Popović et al., 2017a), which is an increase of 81.1% in comparison to 2014, when arable land amounted to 7897 ha, while meadows and pastures spread over1899 ha. Cereals covered the greatest area of 31.1% (Popović et al., 2017), and were followed by vegetables (21.6%) (Veličković and Golijan, 2016). The participation of areas under organic farming in the total cultivated agricultural land amounted to 0.44% in 2015, which was an increase of 0.16% in relation to 2014. In the analysed 2012-2015 period, areas under forage crops spread, on average, over the area of 975.8 ha (Table 1). Organic production of cereals covered the greatest areas (4251.94 ha), while organic production of forage crops covered the area of 1440.39 ha in 2015, which was the increase of 19.6% in comparison to 2014. The greatest increase of areas was recorded in 2014, when the value of the chain index was 202.5%, which was the increase of 102.5% in areas under organic farming of forage crops in comparison to 2013.
Figure 1. The structure of the organic plant production in Serbia (2012-2015)

Golijan et al. 180
Table 1. Fixed base index and chain index for the plant species (2012-2015)
Plant species Base indices Chain indices
Average 2012 2013 2014 2015 2013 2014 2015
Cereals 85.0 76.6 95.2 143.2 90.1 124.4 150.4 2968.7 Fruits 54.4 77.9 115.8 151.9 143.0 148.8 131.1 1906.4
Industrial crops 42.3 52.6 96.0 209.1 124.4 182.5 217.8 1279.0 Forage crops 68.0 61.0 123.5 147.6 89.7 202.5 119.6 975.8
Vegetable crops 83.6 78.5 112.9 125.0 93.9 143.8 110.7 136.0 Medicinal and aromatic plants
36.8 182.1 83.6 97.5 494.2 45.9 116.5 72.9
Figure 2 shows the distribution of organic production of forage crops in
the region of the Republic of Serbia. The smallest areas were placed in the Belgrade municipality in the form of areas in the period of conversion - 3.1 ha in 2015. On the other hand, the greatest areas of forage crops production was located in the Province of Vojvodina (1331.7 ha in 2015) in all four analysed years.
Figure 2: The distribution of areas (ha) under organic forage production over
regions in the period 2012-2015
The base index of forage crops in 2015 for the region of Vojvodina was 211.7%, which meant that the average increase in the production of these crops amounted to 111.7% in relation to the production in the observed period. The greatest increase in the areas of 119.26% was recorded in 2014 in comparison to 2013 (Table 2).

The status of the forage organic production in the Republic of Serbia 181
Table 2. Fixed base index and chain index over regions in the R.Serbia, 2012-2015
Region Base indices Chain indices
Average 2012 2013 2014 2015 2013 2014 2015
Belgrade 100.00 9.94 0.00 308.12 9.94 0.00 / 1.05
Vojvodina 100.00 82.95 181.87 211.70 82.95 219.26 116.40 906.66
Southern and E.S.*
100.00 255.53 215.65 394.16 255.53 84.39 182.78 61.61
Šumadija and W.S.**
100.00 104.09 75.25 65.94 104.09 72.29 87.63 6.49
*S.E.S. - Southern and Eastern Serbia; **W.S. - Western Serbia
The greatest areas under organic forage production in Vojvodina was recorded in the South Bačka District in 2015 (860.13 ha), with the highest base index of 141.59% recorded in 2014 in relation to the average organic forage production in the observed period (Table 3). Unlike previous three years, in which the organic production of forage crops in the Srem District covered the smallest area, these areas were reduced to 0 ha in 2015, i.e. certified organic production of these crops was not recorded (Figure 3).
Table 3. Fixed base index and chain index for Vojvodina (2012-2015)
District Base indices Chain indices
Average 2012 2013 2014 2015 2013 2014 2015
North Bačka 100.00 57.56 7.25 205.75 57.56 12.60 2836.50 121.08
West Bačka 100.00 51.30 54.15 92.03 51.30 105.55 169.94 23.76
South Bačka 100.00 97.12 241.59 196.88 97.12 248.77 81.49 694.20
North Banat 100.00 63.50 176.50 70.00 63.50 277.95 39.66 2.05
Central Banat 100.00 46.83 46.84 18.60 46.83 100.01 39.72 1.14
South Banat 100.00 11.94 211.96 693.91 11.94 1775.93 327.37 62.89
Srem 100.00 99.88 740.01 0.00 99.88 740.91 0.00 1.55
The region of Southern and Eastern Serbia ranked the second according to areas under the organic production of forage crops. Organic farming in 2015 was performed on 100.62 ha (Ministry of Agriculture and Environmental Protection, 2017), which was an increase of 82.78% in relation to 2014 (Table 2). In the
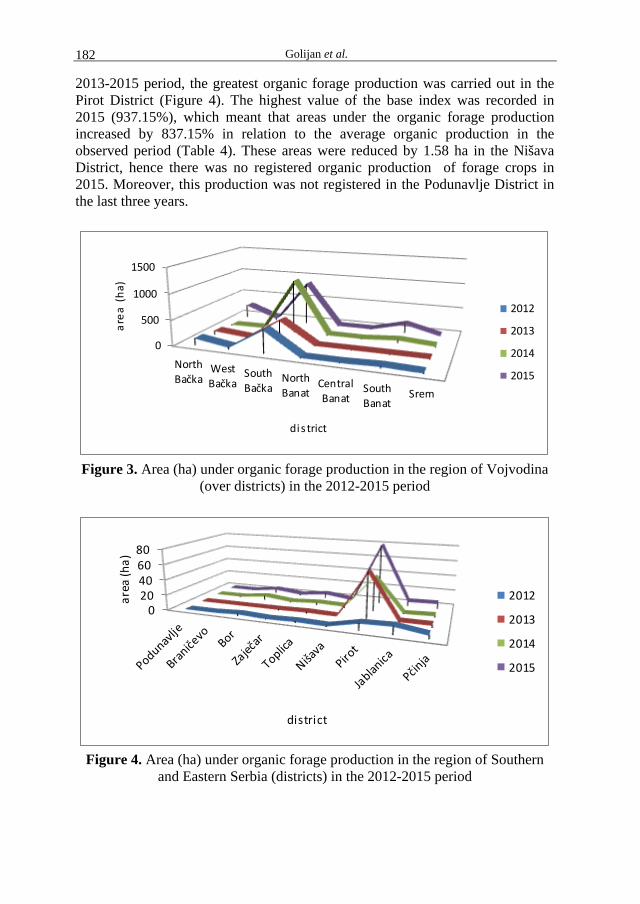
Golijan et al. 182
2013-2015 period, the greatest organic forage production was carried out in the Pirot District (Figure 4). The highest value of the base index was recorded in 2015 (937.15%), which meant that areas under the organic forage production increased by 837.15% in relation to the average organic production in the observed period (Table 4). These areas were reduced by 1.58 ha in the Nišava District, hence there was no registered organic production of forage crops in 2015. Moreover, this production was not registered in the Podunavlje District in the last three years.
0
500
1000
1500
NorthBačka
WestBačka
SouthBačka
NorthBanat
CentralBanat
SouthBanat
Srem
area
(ha
)
di s trict
2012
2013
2014
2015
Figure 3. Area (ha) under organic forage production in the region of Vojvodina
(over districts) in the 2012-2015 period
020406080
area
(ha)
district
2012
2013
2014
2015
Figure 4. Area (ha) under organic forage production in the region of Southern
and Eastern Serbia (districts) in the 2012-2015 period

The status of the forage organic production in the Republic of Serbia 183
Table 4. Fixed base index and chain index for the region of the Southern and Eastern Serbia, for the 2012-2015 period
District Base indices (%) Chain indices (%) Average
(ha) 2012 2013 2014 2015 2013 2014 2015 Podunavlje / / / / / / / 0 Braničevo / / / / / / 10.00 0.06
Bor 100.0 0.00 221.63 240.45 0.00 / 108.49 2.69 Zaječar 100.0 275.0 275.0 450.0 275.00 100.00 163.64 0.33 Toplica 100.0 94.77 223.44 422.54 94.77 235.78 189.11 2.42 Nišava 100.0 0.00 548.61 0.00 0.00 / 0.00 0.47 Pirot 100.0 702.83 527.30 937.15 702.83 75.03 177.73 47.82
Jablanica 100.0 22.97 0.63 55.79 22.97 2.74 8866.67 4.28 Pčinja 100.0 56.80 38.69 152.29 56.80 68.10 393.67 3.55
This type of production decreased in the region of Šumadija and western
Serbia in the 2012-2015 period. The organic farming in 2015, was performed on the area of only 4.96 ha (Ministry of Agriculture and Environmental Protection, 2017), which was the reduction of 12.37% and 27.71% in relation to 2014 and 2013, respectively (Table 2). The organic production is not registered in Moravica District, Raška District, Šumadija District and Rasina District. The greatest average organic production of forage crops in the 2012-2015 period was in the Kolubara District, hence the greatest decrease in areas (of 93.72%) in this period was registered in 2015 (Table 5).
Table 5. Fixed base index and chain index for the region of the Šumadija and western Serbia, for the 2012-2015 period
District Base indices (%) Chain indices (%) Average
(ha) 2012 2013 2014 2015 2013 2014 2015 Mačva 100.0 100.0 2650.0 2100.0 100.0 2650.0 79.25 1.24
Kolubara 100.0 90.51 24.24 6.28 90.51 26.78 25.93 3.69 Zlatibor / / / / 0.0 / 0.22
Moravica 100.0 100.45 156.25 0.00 100.45 155.56 0.00 0.48 Raška / / / / / 0.0 / 0.13
Šumadija / / / / / / / 0 Pomoravlje 100.0 150.0 280.0 950.0 150.0 186.67 339.29 0.74
Rasina / / / / / / / 0
The following species are present in the certified organic production of forage crops: vetch, clover, Italian ryegrass, perennial ryegrass, alfalfa, fodder beet, field pea and Sudan grass (Ministry of Agriculture and Environmental

Golijan et al. 184
Protection, 2017). Alfalfa, Italian ryegrass, field pea, Sudan grass and clover are species with the highest organic production in the Republic of Serbia (Figure 5). Alfalfa is one of the best options for making the three-year transition to certified organic production (Menalled et al., 2009) and alfalfa was equal to or better than many other transition cropping systems in terms of weed control, soil fertility, organic wheat yield following alfalfa, and overall economics (Fuerst et al., 2009).
050
100150200250300350400450
ha
Areas
Figure 5. Participation of species of forage crops in the organic production
Source: Ministry of Agriculture and Environmental Protection, 2017
Organic agricultural production recorded a continuous growth in output and demand, globally speaking, in order to meet consumer needs for quality and safe food. Due to guaranteed quality, demand for organic Food records a continuous trend of growth, and this in parallel with the increase of consumer knowledge about the necessity for food to be of high quality, chemically and microbiologically safe (Popović, 2015; Glamočlija et al., 2015; Popović et al., 2012; 2017a). Food security is a complex sustainable development issue. Ensuring that sufficient nutritious foods are available to all people and that they can access these foods at all times are critical elements of economic and social development (Capone et al., 2016).
In Europe in 2015, arable land encompassed the area of 5.7 million ha, out of which even 2.1 million ha was used for green fodder (Willer and Lernoud, 2017). Cereals and forage crops are mostly grown in the countries of the EU, and these two crops are grown on more than 80% of total areas under organic farming in 14 countries (including areas in the conversion period) (www.fibl.org). In EU-27, arable land accounts for 41% of the agricultural area converted to organic farming with more than four million ha, whereby the greatest areas are under organic cereals and forage crops (1.5 million ha) (Lichtfouse, 2014).
According to the legal regulations effective from January 1, 2004, only seeds organically produced may be used in organic production. As far as forage

The status of the forage organic production in the Republic of Serbia 185
seed production is concerned it is an important technical challenge both to seed growers and the seed industry. These challenges must be overcome if organically produced forage seed of the appropriate varieties is to be available at a reasonable price and quantity for the organic sector (Marshall, 2002). On most organic farms that meet prescribed methods of organic production, nutrition with organic forage crops is of a fundamental significance to the application of good organic farming practices. There are many challenges facing organic farmers, not least the need to produce high quality forage while keeping costs to a minimum (Will, 2012). Prescribed methods used for the conservation, production and utilisation of forage resources have a significant effect on efficiency, productivity and sustainability of organic farms, and therefore this fact should be regarded as one of the highest priorities for economic cost benefit of organic production of these types of crops.
CONCLUSIONS
Organic agricultural production has been increasing worldwide. Cereals and forage crops are grown on more than 80% of total areas under organic farming in 14 countries of the European Union. In the Republic of Serbia, organic farming is performed on the area of 15,298.02 ha. The greatest areas are cultivated with cereals, then fruits and industrial plants, while forage crops rank fourth encompassing the areas of 1,440.39 ha in 2015. In the analysed 2012-2015 period, the greatest increase of areas was recorded in 2014, amounting to 102.5% in comparison to 2013. The greatest organic production of forage crops is carried out in the region of Vojvodina. Nutrition of livestock with organic forage crops on organic farms is necessary for the certification of organic production, but also in terms of ecological and economic sustainability of farms and the application of good organic farming practices. Due to very favourable natural conditions in the Republic of Serbia, as well as sufficient areas with unpolluted soils, there is a great potential in the production and the increase of the areas under organic forage crops. This production is also supported by the unlimited demand of the world's market, which is another major challenge for agricultural producers.
ACKNOWLEDGEMENTS
This project was supported by the Ministry of Education, Science and Technological Development of the Republic of Serbia (Project TR 31078).
REFERENCES
Al-Quraan NA, Al-Sharbati M, Dababneh Y and Al-Olabi M. 2014. Effect of temperature, salt and osmotic stresses on seed germination and chlorophyll contents in lentil (Lens culinaris Medik). Acta horticulturae, 1054:47-54.
Arslan H. 2013. Application of multivariate statistical techniques in the assessment of groundwater quality in seawater intrusion area in Bafra Plain,Turkey. Environmental Monitoring and Assessment, 185(3):2439-2452.
Council Regulation, (EC) No 2092/91. On Organic Production and Labelling of Organic Products and Repealing Regulation, 2007. http://eur-
Golijan et al. 186
lex.europa.eu/LexUriServ/LexUriServ.do?uri=OJ:L:2007:189:0001:0023:EN:PDF (accessed December 29, 2016).
Glamočlija Đ., Janković S., Popović Vera, Kuzevski J., Filipović V., Ugrenović V. (2015). Alternativne ratarske biljke u konvencionalnom i organskom sistemu gajenju. / Alternatively crop plants in conventional and organic growing systems. Monograph. IPN Belgrade, 1-355. p. 30-50.
FAO (2012). Towards the Future We Want: End hunger and make the transition to sustainable agricultural and food systems. FAO, Rome. Available online at: http://www.fao.org/docrep/015/an894e/an894e00.pdf
Fuerst, E. P., Koenig, R. T., Kugler, J., Painter, K., Stannard, M., Goldberger, J. (2009). Organic alfalfa management guide. Washington State University Extension Bulletin EB2039E.[Online]. Available at Web site http://cru. cahe. wsu. edu/CEPublications/EB2039E/EB2039E. pdf (accessed May 10, 2013).
Capone R., El Bilali H., Debs Ph., Bottalico F. (2016). Relations between food and nutrition security, diets and food systems. Agriculture & Forestry, Vol. 62, 1: 49-58, 2016, Podgorica
Golijan, J. 2016. Motivi koji utiču na kupovinu organskih prehrambenih proizvoda. Agroekonomika, 45 (72): 73-80.
Golijan, J., Popović, A. 2016. Basic characteristics of the organic agriculture market. Fifth International Conference Competitiveness of Agro-Food And Environmental Economy, 10-11 November 2016, Bucharest.
Golijan, J., Živanović, Lj., Popović., A. “Status and areas under organic production of vegetables in the Republic of Serbia”. 6th International Symposium on Agricultural Sciences. AgroRes 2017, February 27-March 2, 2017 Banja Luka, Republic of Srpska, Bosnia and Herzegovina, pp 133.
IFOAM. Principles of Organic Agriculture. http://www.ifoam.bio/en/organic-landmarks/principles-organic-agriculture (accessed December 25, 2016).
Jakobsen, M., Preda, T., Kongsted, A. G., Hermansen, J. E. 2015. Increased Foraging in Outdoor Organic Pig Production-Modeling Environmental Consequences. Foods, 4 (4): 622-644.
Lichtfouse, E. (Ed.). (2014). Sustainable agriculture reviews (Vol. 15). Springer. Lund, V. 2006. Natural living-a precondition for animal welfare in organic
farming. Livestock Science, 100 (2): 71-83. Marshall, A. H., Humphreys, M. O. 2002. Challenges in organic forage seed
production. In Proceedings of the UK Organic Research 2002 Conference (pp. 95-96). Organic Centre Wales, Institute of Rural Studies, University of Wales Aberystwyth.
Menalled, F., Jones, C., Buschena, D., Miller, P. (2009). From conventional to organic cropping: What to expect during the transition years. Bozeman, MT: Montana State University Extension Service MontGuide MT200901AG.
Popović, A., Golijan, J., Babić, V., Kravić, N., Sečanski, M. Delić, N. 2016. Organic farming as a factor for biodiversity conservation. In proceedings of International scientific conference on Ecological crisis: Technogenesis and climate change. Beograd, 21-23.april, 2016.
Popović, A., Golijan, J., Sečanski M., Čamdžija, Z. “Current status and prospects of organic production of cereals in the world”. 6th International Symposium on

The status of the forage organic production in the Republic of Serbia 187
Agricultural Sciences. AgroRes 2017, February 27-March 2, 2017 Banja Luka, Republic of Srpska, Bosnia and Herzegovina, pp 102.
Popović V., Vidić M., Tatić M., Glamočlija Đ., Zdjelar G., Kostić M. (2012). Effect of foliar nutrition on soybean yield and quality in organic production. Proceedings, Journal of Institute of PKB Agroekonomik, UDC: 633.34+631.816.3, vol. 18, 1-2, 61-70.
Popović Vera (2015). The concept, classification and importance of biological resources in agriculture. Editor. Milovanovic Jelena, Đorđević Slađana: Conservation and еnhancement of biological resources in the service of ecoremediation. Monograph. Futura. Belgrade. ISBN 978-86-86859-41-9; 1-407. 29-51.
Popović V., Tatić M., Vidić M., Maksimović L., Adamović D., Mekulov-Popadić L., Dragin N. (2017a). Achieving profitable organic production by sowing legumes. 3td International Conference Agro-biodiversity, Organic Agriculture for Agro-biodiversity Preservation, Novi Sad, 1st-3rd June 2017, Faculty of Agriculture, ISBN 978-86—7520-398-8, pp. 58-59.
Šiljković, Ž. 2001. Južna Europa u ostvarenju koncepta organske poljoprivrede. Geoadria, 6: 93-112.
Veličković, M., Golijan, J., Popović, A. (2016). Biodiversity and organic agriculture. Acta Agriculturae Serbica, 21 (42): 123-134.
Veličković, M., Golijan, J. 2016. Organic Fruit Production in Serbia. Agro-knowledge Journal, 17 (3): 289-297.
www.makroekonomija.org (accessed March 19, 2017). Will, J. 2012. Organic Forage: A Strategy for Planning Future Cropping https://businesswales.gov.wales (accessed March 21, 2017). Willer, H. and Lernoud, J. (Eds.) (2017). The World of Organic Agriculture.
Statistics and Emerging Trends. FiBL & IFOAM – Organics International (2017): Frick and Bonn.


Agriculture & Forestry, Vol. 63 Issue 3: 189-198, 2017, Podgorica 189
DOI: 10.17707/AgricultForest.63.3.19 Mykola KHARYTONOV, Oleksandr VELYCHKO 1
CROPS ADAPTATION MANAGEMENT IN THE CONDITIONS OF STEPPE LANDSCAPE OF UKRAINE
SUMMARY
Preformed study approved for studied crops the dependency between crop nutrient uptake and concentration as well the impact of landscape positions, adaptation potential of species, varieties and hybrids occurrence. Perennial legumes (alfalfa, sainfoin) were more unpretentious. Pea varieties are moderately pretentious appeared to be better than cereal crops - megatrophs (barley, corn) in terms of edification for growing on slopes. The consumption of nutrients for the production of 1 ton of corn grain and relative quantity of by-products was lower for the slope of the southern position than for the flat and the northern hill slope of the landscape position. The uneven appearance of the resource potential factors for eroded lands dictates the need for differentiated use of arable lands.
Keywords: hill slopes, soil erosion, landscape position, crop productivity, nutrients, uptake
INTRODUCTION
The steppe zone of Ukraine is known as a zone with intensified development of erosion processes, around 35 % of all arable lands are affected by erosion each year (Kharytonov et al. 2004). Landscape features is a major factor in erosion process. All washed soils are formed on slopes with surface runoff. The intensity of erosion processes depends on the characteristics of hill slopes including angle slope, shape, length and exposition.Intensive land cultivation, complicated relief, large share of cultivated crops in rotation promote the development of erosion processes (Kharytonov et al. 2016; Nazmi et al. 2011; Mehdizade et al. 2013). Excessive densifying of the upper layers of molisoils and drastic reduction in the maximal intensity of water absorption are the main causes of the progressing erosion (Stone et al. 1985; Thelemann et al. 2010). Hillslope processes are defined by unique site characteristics such as soil physical and chemical properties, water retention and flow patterns, biological processes and topographic influences (Molodovskaya et al. 2011; Marques de Silva and Silva. 2008; Rochette et al. 2011; Kaspar et al. 2003) found that in years with below-average rainfall, corn yield was negatively correlated with relative elevation,
1Mykola Kharytonov (corresponding author: [email protected]), Department of Plant Breeding and Seeds Management, Faculty of Agronomy, Dnipropetrovsk State Agrarian and Economic University, Dnipro, UKRAINE. Notes: The authors declare that they have no conflicts of interest. Authorship Form signed online.

Kharytonov et al. 190
slope, and curvature, whereas in years with above-average rainfall, corn yield was positively correlated with relative elevation and slope.
Increasing of the adaptive capacity of crops is based on adaptation mechanisms similar to those for plants, which are representatives of natural flora (Lykholat et al. 2016). The similar data were obtained when crops growth at specific landscape positions is influenced by several interacting hill slope process across a typical soil arena (Schipanski et al. 2010; Snapp and Kravchenko, 2015; Russenes et al. 2016). Influence of landscape position and terrain attributes an annual crop yield has been studied. In particular, corn yield and total plant biomass was greater at foot slopes benefiting from more available soil water at those lower landscape positions (Stone et al. 1985; Marques de Silva and Silva. 2006).
Corn grown yield at the depositional, flat and south-western hill slope positions lower than at all other positions. There were differences in the stover to grain ratio between landscape positions. The flat landscape position had a 6.9:1 ratio of stover to grain, whereas the depositional site had a 9:1 ratio (Thelemann et al. 2010). The same tendency was established in studies showing reduced yield at lower landscapes position with excessive amounts of water tend to collect (Kravchenko and Bullock 2000; Parent et al. 2008).
Means of adaptive macro- and micro-differentiation include the ecological specialization of species and varieties sowing. The cropping plan and crop rotation has been treated using a variety of approaches based on different objectives and handled at very different scales incorporated into agronomic, economic and land-use models (Farquharson and Baldock, 2008; Lazrak et al.. 2010; Ladoni et al. 2016). As follows, the design of agroecosystems based on increasing of species, varieties and hybrid variety is the first rate task. The key element of this approach is the formation of an adaptive species structure for cultivated areas for each particular element of the natural landscape. The choice of crops and their allocation to plots is at the core of the farming system management (Negassa et al.2015; Velychko, 2014). These decisions concentrate all the complexity involved in cropping system design and selection at the farm level because of their many involvements at different stages of the crop production processes (Simic et al. 2016). The large number of possible adaptation options, model-based exploration tools are commonly used to supplement traditional empirical approaches (Schaller et al. 2012; Han et al. 2017) for designing and evaluating innovative agricultural production systems.
Allocation of ecologically similar territories and choosing appropriate crops for those should be considered as the first step. No less important task is the right choice of crops for introduction into the crop rotation for culturing on sloping lands, which characterized by different exposition.
The aim of the research is to provide an assessment of the adaptive potential of crops under the conditions of the steppe agro-landscape of the Ukrainian steppe.

Crops adaptation management in the conditions of steppe landscape of Ukraine 191
MATERIALS AND METHODS Experimental areas were divided according to rate of received solar
irradiation, moisture supply, organics and mineral nutrient content in the soil (Fig. 1). Crops were planted across the main slope on the experimental field. Determination of the dependence of the plants’ reaction of on the flat, northern (N) and southern (S) hill slope landscape position was planned. This approach allows to determine the areas where the same crop, variety or hybrid are grown on maximaly different reliefs, which is considered as major affecting factor. An overland gain of alfalfa, espresso, barley and corn was evaluated in the phase of agricultural maturity.
Figure 1. Digital map of the studied arable land
The green mass of peas was sampled in the phase of branching and
budding. The nitrogen and phosphorus concentration in plant samples was estimated using Kjeldahl method. Total P concentrations of the applied residues were determined by sulfuric acid digestion (Thomas et al. 1967). Potassium was determined with flame photometry.
The intensity of the nitrogen fixation of the nodules of peas was determined by the Hardy acetylene method (Hardy et al. 1968) on the gas chromatograph Chrom-5 (Czech Republic).
Crop uptake rates for nitrogen, phosphorus and potassium are calculated per yield of dry matter for crops.
RESULTS AND DISCUSSION Calculation of release and consumption of the main nutrients by alfalfa and
saffron harvests are presented in the Tables 1 and 2. As it can be concluded from the Table 1, the rates of removal of nitrogen
with aboveground biomass of alfalfa and sainfoin are higher for the hill slope of northern position.
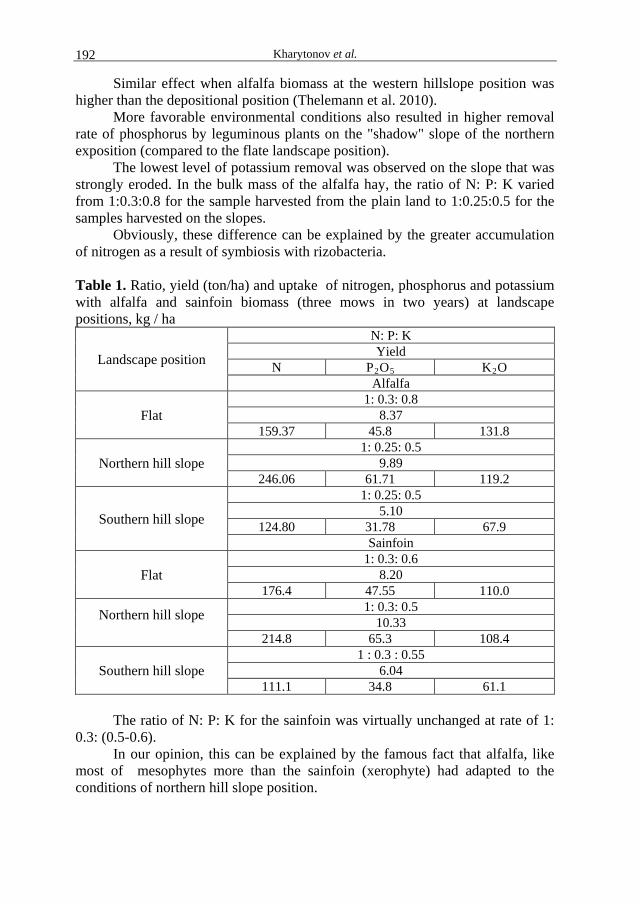
Kharytonov et al. 192
Similar effect when alfalfa biomass at the western hillslope position was higher than the depositional position (Thelemann et al. 2010).
More favorable environmental conditions also resulted in higher removal rate of phosphorus by leguminous plants on the "shadow" slope of the northern exposition (compared to the flate landscape position).
The lowest level of potassium removal was observed on the slope that was strongly eroded. In the bulk mass of the alfalfa hay, the ratio of N: P: K varied from 1:0.3:0.8 for the sample harvested from the plain land to 1:0.25:0.5 for the samples harvested on the slopes.
Obviously, these difference can be explained by the greater accumulation of nitrogen as a result of symbiosis with rizobacteria.
Table 1. Ratio, yield (ton/ha) and uptake of nitrogen, phosphorus and potassium with alfalfa and sainfoin biomass (three mows in two years) at landscape positions, kg / ha
Landscape position
N: P: K Yield
N P2O5 K2O Alfalfa
Flat 1: 0.3: 0.8
8.37 159.37 45.8 131.8
Northern hill slope 1: 0.25: 0.5
9.89 246.06 61.71 119.2
Southern hill slope
1: 0.25: 0.5 5.10
124.80 31.78 67.9 Sainfoin
Flat 1: 0.3: 0.6
8.20 176.4 47.55 110.0
Northern hill slope
1: 0.3: 0.5 10.33
214.8 65.3 108.4
Southern hill slope 1 : 0.3 : 0.55
6.04 111.1 34.8 61.1
The ratio of N: P: K for the sainfoin was virtually unchanged at rate of 1:
0.3: (0.5-0.6). In our opinion, this can be explained by the famous fact that alfalfa, like
most of mesophytes more than the sainfoin (xerophyte) had adapted to the conditions of northern hill slope position.

Crops adaptation management in the conditions of steppe landscape of Ukraine 193
The data on ratio, yield and total removal of main nutritions with the biomass of two varieties of green pea at different landscape positions are shown in the table 2.
From the two mentioned local varieties of peas, “Ukisniy 9” had a lower dependence on the relief than “Lgovsky – zelenozerny”.
Study of the activity of the nitrogenase complex in the root nodules of plants revealed the difference for the three varieties of peas and dependence on the landscape features (Fig. 2).
In particular, certain peas varieties local selection showed high rate of nitrogen fixation. On the northern slope, which was more humid, higher levels of nitrogen fixation (up to 200 μg of nitrogen per hour per plant) was recorded for “Vusaty” variety.
Table 2. Ratio, yield (ton/ha) and uptake of nitrogen, phosphorus and potassium with the biomass of different varieties of green pea at different landscape positions, kg / ha
Landscape position
N: P: K Yield
N P2O5 K2O Pea “ Lgovsky – zelenozerny ”
Flat 1 : 0.3 : 1.4
12.2 171.2 54.65 165.1
Northern hill slope 1 : 0.3 : 0.8
12.4 181.1 76.3 131.8
Southern hill slope
1 : 0.4 : 0.8 10.5
168.0 50.4 100.8 Pea “Ukisniy 9”
Flat 1: 0.25 : 0.5
12.1 355.7 89.2 176.4
Northern hill slope
1: 0.23 :0.4 13.9
437.5 98.3 173.6
Southern hill slope 1: 0.17: 0.36
11.0 287.0 49.0 102.4
The level of nitrogen fixation for peas on the plain land and at the bottom
of the valley was lower than on the slopes in 2 - 8 times.

Kharytonov et al. 194
Figure 2. Dynamics of the nitrogenase activity in peas’ nodules in branching
phase μg N/plant/hour
Figure 3. Dynamics of the nitrogenase activity in peas’ nodules in budding phase
μg N/plant/hour
As it follows from the data presented in the Table 3, barley plants actively responded on the growing conditions of cultivation, which reflected on the harvest and crop nutrient removal.
The uptake of nitrogen, phosphorus and potassium with the barley harvest on the slope of the southern exposition decreased by 48 and 36 % compared to the flat landscape position.
The difference in the macronutrients concentration capacity for the aboveground mass of barley reflected on the ratio of their removal according to

Crops adaptation management in the conditions of steppe landscape of Ukraine 195
the elements of landscape. In particular, the ratio of N:P:K for plant harvested on the plain land was 1: 0.34: 0.74, on the slopes of the northern and southern positions, ratio changed from 1: 0.36: 0.78 to 1: 0.33: 0.76 accordingly. Table 3. Nutrients uptake rate for aboveground mass of barley and the costs required for production of 1 ton of the grain and relative quantity of leaf and steam mass of barley.
Landscape position
Yield, ton/ ha
Nutrition uptake with main and by products,
kg/ha
Demand for production of 1 ton of grain and according amount of
stem and leaf mass, kg N P2О5 K2О N P2О5 K2О
Flat 2.92 101.7 34.7 74.8 34.8 11.9 25.6 Northern hill slope 2.50 80.3 28.8 62. 8 32.1 11.5 25.1 Southern hill slope 1.89 63.0 20.8 48.1 33.3 11.0 25.4
The response of corn hybrids to the culturing conditions was significantly
different from these observed for barley. The ratio of N: P: K, in average, for studied hybrids, was within the range of 1: 0.39: (1.01-1.07).
General features of the NPK removal with aboveground mass of corn and cost required form production of 1 ton of grain and relative leaf and stem mass for corn hybrids are presented in the Table 4 and 5.
Table 4. Corn nutrient uptake with harvest and the cost required to produce 1 ton of grain (numerator) and relative leaf and stem mass for corn hybrids (denominator) on the flat
Hybrid Yield ton / ha
Uptake, kg/ha
Demand for production of 1 ton of grain and according
amount of stem and leaf mass, kg
N P2О5 K2О N P2О5 K2О
Dniprovsky-141 4.15 9.96
117. 4 54.4 110.8 28.3 13.1 26.7
Pioner 3978 4.53 10.87
113. 7 45.0 110.8 25.1 9.9 24.5
Dniprovsky-310 4.84 11.62
113. 8 43.4 117.2 23.5 9.0 24.2
Dniprovsky -505 6.07 14.57
141. 8 49.7 158.1 23.4 8.2 26.0
Krasnodarsky -303 5.75 13.8
136. 6 48.2 142.6 23.8 8.4 24.8
Average 5.07 12.16
124.7 48.1 127.9 24.8 9.7 25.2
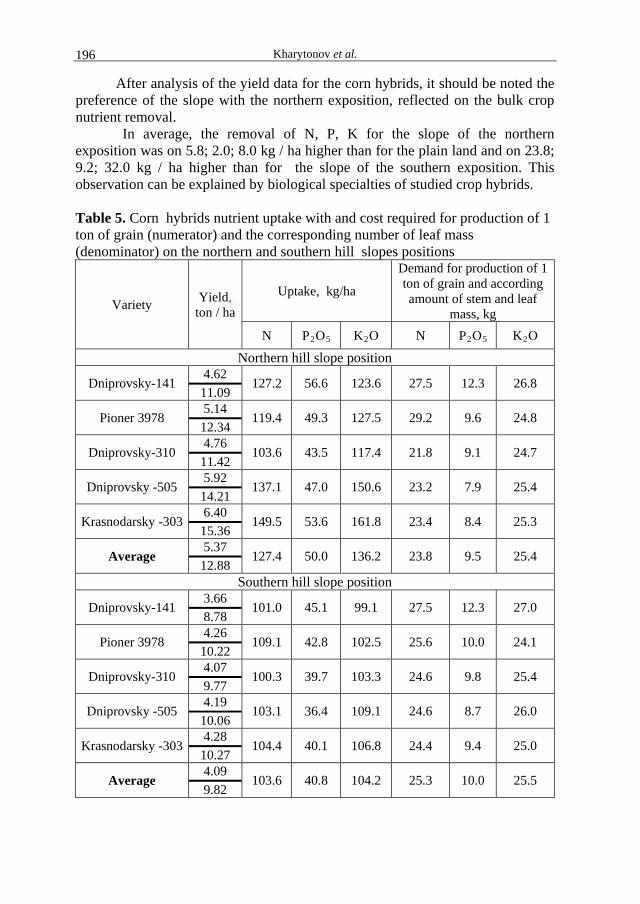
Kharytonov et al. 196
After analysis of the yield data for the corn hybrids, it should be noted the preference of the slope with the northern exposition, reflected on the bulk crop nutrient removal.
In average, the removal of N, P, K for the slope of the northern exposition was on 5.8; 2.0; 8.0 kg / ha higher than for the plain land and on 23.8; 9.2; 32.0 kg / ha higher than for the slope of the southern exposition. This observation can be explained by biological specialties of studied crop hybrids.
Table 5. Corn hybrids nutrient uptake with and cost required for production of 1 ton of grain (numerator) and the corresponding number of leaf mass (denominator) on the northern and southern hill slopes positions
Variety Yield, ton / ha
Uptake, kg/ha
Demand for production of 1 ton of grain and according amount of stem and leaf
mass, kg N P2О5 K2О N P2О5 K2О
Northern hill slope position
Dniprovsky-141 4.62 11.09
127.2 56.6 123.6 27.5 12.3 26.8
Pioner 3978 5.14 12.34
119.4 49.3 127.5 29.2 9.6 24.8
Dniprovsky-310 4.76 11.42
103.6 43.5 117.4 21.8 9.1 24.7
Dniprovsky -505 5.92 14.21
137.1 47.0 150.6 23.2 7.9 25.4
Krasnodarsky -303 6.40 15.36
149.5 53.6 161.8 23.4 8.4 25.3
Average 5.37 12.88
127.4 50.0 136.2 23.8 9.5 25.4
Southern hill slope position
Dniprovsky-141 3.66 8.78
101.0 45.1 99.1 27.5 12.3 27.0
Pioner 3978 4.26 10.22
109.1 42.8 102.5 25.6 10.0 24.1
Dniprovsky-310 4.07 9.77
100.3 39.7 103.3 24.6 9.8 25.4
Dniprovsky -505 4.19 10.06
103.1 36.4 109.1 24.6 8.7 26.0
Krasnodarsky -303 4.28 10.27
104.4 40.1 106.8 24.4 9.4 25.0
Average 4.09 9.82
103.6 40.8 104.2 25.3 10.0 25.5
Crops adaptation management in the conditions of steppe landscape of Ukraine 197
In all environmental conditions, hybrid Dniprovsky-141 always consumed more nitrogen, phosphorus and potassium than any other studied hybrid.
CONCLUSION Preformed study approved for studied agricultural crops the dependency
between crop nutrient removal and concentration as well the impact of landscape positions, adaptation potential of species, varieties and hybrids occurence. Perennial legumes (alfalfa, sainfoin) were more unpretentious. Pea varieties (Ukisniy 9” “Lgovsky – zelenozerny” and “Vusatiy”) are moderately pretentious appeared to be better than cereal crops - megatrophs (barley, corn) in terms of edification for growing on slopes. It can be explained by special adaptation reactions, such as symbiotic nitrogen fixation, better capacity for absorbtion of mobile forms of nutrients from the soil, etc.
ACKNOWLEDGMENTS
This study was supported with Ministry of Education and Science of Ukraine.
REFERENCES Farquharson, R., Baldock, J., (2008) Concepts in modelling N2O emissions from land
use. Plant Soil 309:147–167 Han, Z., Walter, M.T., Drinkwater, L.E., (2017) N2O emissions from grain cropping
systems: a meta-analysis of the impacts of fertilizer-based and ecologically-based nutrient management strategies. Nutr. Cycl. Agroecosyst: 335–355
Hardy R. W. F., Holsten R. D., Jakson E. K. and Burns R. C. (1968) The acetylene-ethylene assay for N2 fixation: laboratory and field evaluation. PI. Physiol. 43, 1185-1207
Kaspar J.C., Colvin T.S., Jaynes D.B., Karlen D.E.James and Meek D.W. (2003) Relationship between six years of corn yields and terrain attributes. Precis.Agric.4:87-101
Kharytonov, M., Bagorka, M., Gibson, P. (2004) Erosion effects in the central steppe chernozem soils of Ukraine. I.Soil Properties. Agricultura. Published by the University of Maribor, Faculty of Agriculture, Slovenia; Vol.3. № 1:12-18.
Kharytonov, M. M., Pashova, V. T., Mitsik, O. O., Nazarenko, M. M., Bagorka, M. O. (2016) Estimation of winter wheat varieties suitability for difference growth of landscape conditions. Agricultural and mechanical engineering: Materials of Interna-tional Symposium ISB-INMA TECH. Bucharest, 27-29.10., INMA, 401 – 406.
Kravchenko and Bullock, (2000) Corellation of corn and soybean grain yield with topography and soil properties. Agron. J. 92: 75-83.
Ladoni, M., Basir, A., Robertson, P.G., Kravchenko, A.N., (2016) Scaling-up: cover crops differentially influence soil carbon in agricultural fields with diverse topography. Agric. Ecosyst. Environ. 225:93–103
Lazrak E.G, Mari J.F, Benoit M (2010) Landscape regularity modelling for environmental challenges in agriculture. Landscape Ecol 25 (2):1–15
Lykholat Y., Khromyk N., Ivan’ko I., Kovalenko I., Shupranova L., Kharytonov M. (2016) Metabolic responses of steppe forest trees to altitude - associated local environmental changes. Agriculture and Forestry, 62 (2): 163-171.

Kharytonov et al. 198
Marques de Silva, J.R. and Silva L.L.. (2006) Evaluation of maize spatial variability based on field flow density. Biosystems Eng. 95:339–347
Marques de Silva, J.R., and Silva L.L.. (2008) Evaluation of the relationship between maize yield spatial and temporal variability and different topographic attributes. Biosystems engineering 101: 183–190
Mehdizade B., Asadi H., Shabanpour M., and Ghadiri H. (2013) Impact of erosion and tillage on the productivity and quality of selected semiarid soils of Iran. International Agrophysics, 27, 291-297
Molodovskaya, M., Warland, J., Richards, B.K., Öberg, G., Steenhuis, T.S.. (2011) Nitrous oxide from heterogeneous agricultural landscapes: source contribution analysis by eddy covariance and chambers. Soil Sci. Soc. Am. J. 75: 1829–1838.
Nazmi, L., Asadi, H., Manukyan, R.. (2011) Changes in soil properties and productivity as affected by land use and slope position in the northwest of Iran. Int. J. Food Agric. Environ. 9: 864–870
Negassa, W., Price, R.F., Basir, A., Snapp, S.S., Kravchenko, A.. (2015) Cover crop and tillage systems effect on soil CO2 and N2O fluxes in contrasting topographic positions. Soil Tillage Res. 154: 64–74.
Parent A.C., Belanger M.C., Parent L.E., Santerre R., Viau A.I., Anctie I., Bolinder M.A. and Tremblay C. (2008) Soil properties and landscapes factors affecting maize yield wetspring conditions in eastern Canada.Biosystems Eng. 99: 134-144.
Rochette, P., Pennock, D.J., Hénault, C., Cellier, P., Richard, G., (2011) Effect of topography on nitrous oxide emissions from winter wheat fields in Central France. Environ. Pollut. 159:3149–3155.
Russenes, A.L., Korsaeth, A., Bakken, L.R., Dörsch, P.. (2016) Spatial variation in soil pH controls off-season N2O emission in an agricultural soil. Soil Biol. Biochem. 99: 36–46.
Schaller D., Reynaud G., Jacques Bergez J. (2012) Models to support cropping plan and crop rotation decisions. A review. Agronomy for Sustainable Development, Springer Verlag/EDP Sciences/INRA, 32 (2):.567-580
Schipanski, M., Drinkwater, L., Russelle, M.. (2010) Understanding the variability in soybean nitrogen fixation across agroecosystems. Plant soil 329: 379–397.
Simic M., Dragicevic, V., Kresovic, B., Videnovic, Z., Dumanovic, Z. (2016): Advanced cropping technology of maize (Zea mays L.) in Serbia. Agriculture and Forestry, 62 (1): 227-240. DOI: 10.17707/AgricultForest.62.1.26
Snapp, S.S., Kravchenko, A.. (2015) Cover crop and tillage systems efect on soil CO2 and N2O fluxes in contrasting topographic positions. Soil Tillage Res. 154: 64–74.
Stone J.R., Gilliam S.W., Cassel D.K., Robarge W.P. 1985. Effect of erosion and landscape position on the productivity of piedmont soils. Soil Sci. Soc. Am. J. 49: 987-991.
Thelemann R., Johnson S., Sheaffer C., Benerjees S., Cai H., Wyse D. (2010) The effect of landscape position on biomass crop yield. Agronomy journal. Vol.102. 2:.513-522.
Thomas R.L, Sheard R.W., Mayer J.R. (1967) Comparison of conventional and automated procedures for nitrogen, phosphorus and potassium analysis of plant material using a single digestion. Agron. J. 59: 240-243.
Velychko, O. (2014) Development of infrastructural objects of providing logistics in the system of storing plant cultivation produce, Economic Annals-ХХІ, Vol. 1-2: 110-113

Agriculture & Forestry, Vol. 63 Issue 3: 199-206, 2017, Podgorica 199
DOI: 10.17707/AgricultForest.63.3.20
Sabrija ČADRO, Jasminka ŽUROVEC, Salwa CHERNI-ČADRO1
SEVERITY, MAGNITUDE AND DURATION OF DROUGHTS
IN BOSNIA AND HERZEGOVINA USING STANDARDIZED
PRECIPITATION EVAPOTRANSPIRATION INDEX (SPEI)
SUMMARY
Drought in Bosnia and Herzegovina (B&H) is mostly analyzed using water deficit obtained from agro-hydrological balance; a ratio between precipitation or
actual evapotranspiration (AET) to potential evapotranspiration (PET); and more recently using Standardized Precipitation Index (SPI).
The main objective of this research is to use the relatively new multiscalar drought index, Standardized Precipitation Evapotranspiration Index (SPEI) to
analyze severity, magnitude, and duration of drought periods in B&H. SPEI is based on precipitation and evapotranspiration data and it has the advantage of
combing multiscalar character with the capacity to include the effects of variability in atmospheric water demand on draught assessment.
Evapotranspiration is calculated with Penman-Monteith method, the standard international procedure for computing reference or potential evapotranspiration
(ET0). In order to assess all four types of drought, SPEI is calculated for shorter
(1, 3 and 6 months) and longer (12 and 24 months) time scales. Weather stations with long-term continuous climate data records were selected - 13 stations across
B&H in total, from which the climate data for 50-year period (1961 – 2010) were collected. A crucial advantage of SPEI over other drought indices previously
used in B&H and its use of potential evapotranspiration and multiscalar characteristics, enabling identification of different drought types.
By using Standardized Precipitation Evapotranspiration Index (SPEI) it was found that severity, magnitude and duration of drought periods in B&H vary
depending on the location and time scale for which drought was calculated. Presence of more severe long lasting droughts in period after 1986 was found for
all 13 analyzed locations across B&H. Keywords: Bosnia and Herzegovina, drought, SPEI.
INTRODUCTION
Bosnia and Herzegovina (B&H) has experienced serious incidences of extreme weather events in the past two decades, causing severe economic losses.
Based on available data and currently available climate projections, exposure to
1Sabrija Čadro (corresponding author: [email protected]), Jasminka Žurovec, Faculty of
Agriculture and Food Sciences, University of Sarajevo, BOSNIA AND HERZEGOVINA; Salwa
Cherni-Čadro, Hydro-Engineering Institute Sarajevo, BOSNIA AND HERZEGOVINA.
Notes: The authors declare that they have no conflicts of interest. Authorship Form signed online.

Čadro et al. 200
threats from climate change will continue to increase (Žurovec et al., 2015). In
order to address properly the challenges represented by climate change and its effects, B&H should develop and implement a national climate change mitigation
strategy and action plan, national Clean Development Mechanism strategy and take tangible steps to implement its international and regional commitments
(Čadro, et al. 2012). The annual average precipitation in B&H is about 1250 mm, which is
higher than the European average of 1000 mm (Vlahinić, 2000), but significant spatial and time variation results in areas which experience heavy flooding in
winter months and drought season in the summer. Drought in B&H is mostly analyzed using water deficit obtained from agro-hydrological balance; a ratio
between precipitation or actual evapotranspiration (AET) to potential evapotranspiration (PET); and more recently using Standardized Precipitation
Index (SPI) and self-calibrated Palmer Drought Severity Index (scPDSI). Agricultural sector of B&H is highly sensitive to droughts due to its socio-
economic relevance. Agriculture has to be protected not only from average droughts but from those occurring once in ten years (Vlahinić et al., 2001).
Because of that, it is necessary to take into account the frequency of drought phenomena. In a study of frequency distribution of drought severity for eight
localities, it was found that the strongest droughts have occurred in the Mostar area, where in 1952 a catastrophic drought with annual soil water deficiency of
over 400 mm occurred. Very mild droughts or no droughts at all have been experienced in Bihać. The sequential order of decreasing drought once in ten
years occurrence is as follows: Mostar > Bijeljina > Bosanski Brod > Tuzla > Sarajevo > Livno > Banja Luka > Bihać (Vlahinić, et al., 2001; INCBH, 2009).
The average yield decrease as a result of drought is about 20%. Drought effect is most strongly expressed in the southern parts of B&H (Vlahinić, 2000). In the
central part (Sarajevo) during the time period 1961–2010, 98 (16.4%) months had drought character, and the last decade (2001-2010) is the driest, with the 24
dry months (Žurovec et al., 2011). Research showed yield reduction for most important crops (e.g. tobacco, pepper, maize, soybean, potato, alfalfa) in the
northern part of B&H (Žurovec et al., 2010). For this area, it was found that as a result of climate change, dry periods that last for a longer period of time occur
more frequently. These results indicate the urgent need to start with climate change adaptation, otherwise, agriculture of the area and therefore the people
engaged in it will face significant negative consequences (Žurovec, et al., 2015). During the last decades, B&H experienced several droughts in the years
2000, 2003, 2007. This produced some severe consequences: In August 2000, B&H suffered the worst drought in 120 years, where about 60% of the
agricultural production was affected, resulting in extreme food insecurity. During the summer of 2003, some regions were hit by drought, which caused around
€200 million in damages of agricultural output and affected close to 200,000 people. In the summer of 2007, extremely high temperatures and the resulting
drought destroyed more than 40% of the agricultural production and caused forest fires, which affected about 250 hectares of land (Hodžić et al., 2013).

Severity, magnitude and duration of droughts in Bosnia and Herzegovina … 201
The severity, magnitude and drought duration may be quantified using a
drought index. A drought index integrates all meteorological, hydrological and agricultural information typically into a number and gives a comprehensible big
picture on drought conditions for decision making (Narasimhan and Srinisvasan, 2005).
Most studies related to drought analysis and monitoring systems worldwide have been conducted using either the Palmer drought severity index
(PDSI; Palmer 1965), or the standardized precipitation index (SPI; McKee et al. 1993) (Vicente-Serrano et al., 2010).
The PDSI is based on water balance concept that includes precipitation and potential evapotranspiration (PET or ETo) data. This index was improved by
development of the self-calibrated PDSI (sc-PDSI; Wells et al. 2004), but the main shortcoming has not been resolved. This relates to its fixed temporal scale
and an autoregressive characteristic (Guttman, 1998). The main criticism of the SPI is that its calculation is based only on
precipitation data. The index does not consider other variables that can influence droughts, such as temperature, evapotranspiration, wind speed and soil water
holding capacity. Therefore, a new drought index - the standardized precipitation evapotranspiration index (SPEI) based on precipitation and ETo has been
proposed by Vicente-Serrano et al. (2010). The SPEI combines the sensitivity of PDSI to changes in evaporation demand with the simplicity of calculation and the
multi-temporal nature of the SPI. The main objective of this research is to use the Standardized Precipitation
Evapotranspiration Index to analyze severity, magnitude, and duration of drought periods in B&H. A crucial advantage of SPEI over other drought indices
previously used in B&H is its use of potential evapotranspiration and multiscalar characteristics, enabling identification of different drought types.
MATERIAL AND METHODS
In order to assess meteorological, agricultural and hydrological drought, SPEI is calculated for shorter (1, 3 and 6 months) and longer (12 and 24 months)
time scales. SPEI1 represents short-term meteorological drought, while SPEI3 represent the drought impact, which influences soil moisture content and
agriculture production. Six months SPEI (SPEI6) is correlated with stream flows, SPEI12, and SPEI24 with ground water and dam storages. Except drought
conditions, SPEI can also show severity of wet spell, and this paper is focused only on severely (index value from -1.5 to -1.99) and extreme dry (index value ≤
-2.00) months. Weather stations (WS) with long-term continuous climate data records
were selected - 13 stations across B&H in total (Table 1), from which the monthly climate data (air temperature, precipitation, relative humidity, solar
radiation and wind speed) for 50-year period (1961 – 2010) or 600 months were collected.

Čadro et al. 202
Table 1: Geographic position of used weather stations (WS)
WS
Ban
ja
L.
Bihać
Bu
gojn
o
Bu
tmir
Dob
oj
Liv
no
Most
ar
Pri
jed
or
San
ski
M.
Sara
jevo
Sok
ola
c
Tu
zla
Zen
ica
Longitude 17o
13'
15o
51'
17o
27'
18o
20'
18o
05'
17o
01'
17o
48'
16o
44'
16o
40'
18o
26'
18o
47'
18o
42'
17o
56'
Latitude 44o
47'
44o
49'
44o
04'
43o
49'
44o
44'
43o
49'
43o
21'
44o
59'
44o
45'
43o
52'
43o
56'
44o
33'
44o
12'
Altitude 160 246 564 518 165 724 70 137 158 630 872 305 344
The SPEI was calculated based on the monthly difference between
precipitation and ETo using the Package ‘SPEI’ in R statistical software
developed by Beguería and Vicente-Serrano (2015). ETo for 13 WS was
calculated with Penman-Monteith equation (Allen et al. 1998) using FAO
EToCalc software.
The number of severely and extreme drought months (1961-2010) for
SPEI3 calculated for 13 WS was converted to a regular grid using spatial
interpolation method which helps to identify drought prone areas, severity and
duration. For this study, the inverse distance weighted method (IDW) was used
and drought map was prepared by ArcGIS 10.2 software.
RESULTS AND DISCUSSION
To determine severity and magnitude of drought events the number of dry
months (SPEI < -1.5) for 13 WS was calculated (Table 2). In total, 600 months
for the time period 1961 – 2010 was included in calculation of SPEI for 1, 3, 6,
12 and 24 month time scale.
Table 2: The occurrence number and percentage of severely and extreme dry months
WS SPEI1 SPEI3 SPEI6 SPEI12 SPEI24
No. % No. % No. % No. % No. %
Banja Luka 40 6.67 41 6.86 41 6.89 45 7.64 46 7.97
Bihać 36 6.00 44 7.36 38 6.39 39 6.62 39 6.76
Bugojno 36 6.00 37 6.19 45 7.56 53 9.00 33 5.72
Butmir 37 6.17 38 6.35 41 6.89 36 6.11 27 4.68
Doboj 36 6.00 44 7.36 34 5.71 37 6.28 41 7.11
Livno 39 6.50 38 6.35 36 6.05 37 6.28 35 6.07
Mostar 32 5.33 43 7.19 42 7.06 41 6.96 36 6.24
Prijedor 41 6.83 40 6.69 45 7.56 49 8.32 28 4.85
Sanski Most 39 6.50 35 5.85 37 6.22 38 6.45 48 8.32
Sarajevo 37 6.17 35 5.85 35 5.88 45 7.64 44 7.63
Sokolac 40 6.67 40 6.69 41 6.89 42 7.13 41 7.11
Tuzla 40 6.67 42 7.02 44 7.39 38 6.45 36 6.24
Zenica 40 6.67 46 7.69 41 6.89 38 6.45 54 9.36
Severity, magnitude and duration of droughts in Bosnia and Herzegovina … 203
For SPEI1, which is considered as meteorological drought, the highest
number of dry months is in Prijedor: 41, while Mostar has the lowest number: 32.
In relation to 600 analyzed months, severely or extreme meteorological drought
in B&H occurs in 5.33 - 6.83 % of them. The sequential order of decreasing
number of dry months in analyzed time period is as follows: Prijedor > Banja
Luka > Sokolac > Tuzla > Zenica > Livno > Sanski Most > Butmir > Sarajevo >
Bihać > Bugojno > Doboj > Mostar.
Number of extreme drought events at specific location can show
susceptibility to the certain type of drought. For drought affecting soil moisture
content or agriculture (SPEI3) the highest number of dry months is in Zenica: 46,
while Sanski Most and Sarajevo have the lowest number: 35 (Table 2).
The spatial representation of severely and extreme SPEI3 drought months
number in B&H (Picture 1) shows that most vulnerable areas to agricultural
drought extend from northeast to south of the country including region of Bihać.
Less vulnerable areas are located on higher altitudes (Dinaric Mountains) from
Sarajevo to Sanski Most. Severely or extreme agricultural drought in B&H
occurs in 5.85 - 7.69 % of the analyzed months.
Picture 1: Number of severely and extreme SPEI3 drought months
in B&H, 1961-2010
For the SPEI6, the highest number of dry months is in Bugojno and
Prijedor - 45. Severely or extreme drought for SPEI6 in B&H occurs in 5.71 -
7.56 % of the analyzed months. The sequential order of decreasing number of
SPEI6 dry months is as follows: Bugojno > Prijedor > Tuzla > Mostar > Banja

Čadro et al. 204
Luka > Butmir > Sokolac > Zenica > Bihać > Sanski Most > Livno > Sarajevo >
Doboj.
Hydrological drought can be shown through longer time series of SPEI.
For SPEI12 the highest number of dry months is in Bugojno: 53, while Butmir has
the lowest number 36 (Table 2). Severely or extreme drought SPEI12 in B&H
occurs in 6.11 - 9.00 % of the analyzed months. The order of decreasing number
of SPEI12 dry months in analyzed time period is as follows: Bugojno > Prijedor >
Banja Luka > Sarajevo > Sokolac > Mostar > Bihać > Sanski Most > Tuzla >
Zenica > Doboj > Livno > Butmir.
-3
-2
-1
0
1
2
3
1961 1966 1971 1976 1981 1986 1991 1996 2001 2006
SPEI
12
SPEI12 - Banja Luka
-3
-2
-1
0
1
2
3
1961 1966 1971 1976 1981 1986 1991 1996 2001 2006
SPEI
12
SPEI12 - Zenica
-3
-2
-1
0
1
2
3
1961 1966 1971 1976 1981 1986 1991 1996 2001 2006
SPEI
12
SPEI12 - Mostar
Figure 1: SPEI12 for Banja Luka, Zenica and Mostar, 1961-2010
The comparison between severity, magnitude and duration of drought
period for the long term time scale (SPEI12) in Banja Luka, Zenica and Mostar is showed in figure 1. Chosen WS with their locations can represent North (Banja Luka), Central (Zenica) and South (Mostar) parts of B&H. Presence of more

Severity, magnitude and duration of droughts in Bosnia and Herzegovina … 205
severe and long lasting droughts in period after 1986 was found for all the analyzed locations.
For Banja Luka, SPEI12 values can be grouped into tree long lasting drought periods. First, from February 1971 until July 1972 (18 months); second, from June 1987 until March 1991 (47 months). Third, in the last decade (2001 – 2010), four short but severe drought period were determined: June 2000 – August 2001; May 2003 – May 2004; April 2007 – March 2008 and; September 2008 – February 2010. The highest SPEI12 value for this location is -2.16, and it happened in February 2001.
Compared to Banja Luka, Zenica has similar severity and duration of drought periods. For the same first drought period, in seventies, drought magnitude was lower in Zenica. Second long drought period lasted like in Banja Luka for 47 months, but with higher severity, especially in period June 1990 – March 1991. Significant drought of the last decade started in November 2006 and lasted for 30 months. The highest SPEI12 value for this location is -2.52, determined for September 1990.
Mostar, compared to other two locations, had two long lasting drought periods: first lasted for 28 months, from May 1982 until August 1984 and; second started in February 1987 and with small period of near 0 values of SPEI12 (in 1988 and 1991) lasted for almost 8 years. The highest SPEI12 value for Mostar is -2.52, determined for June 1989.
For SPEI24 the highest number of dry months is in Zenica: 54, while Butmir has the lowest number: 27 (Table 2). Severely or extreme drought SPEI24 in B&H occurs in 4.68 - 9.36 % of the analyzed months. For the long-term SPEI24 larger differences in the number of dry months between locations were found.
The order of decreasing number of SPEI24 dry months in analyzed time period is as follows: Zenica > Sanski Most > Banja Luka > Sarajevo > Doboj > Sokolac > Bihać > Mosta > Tuzla > Livno > Bugojno > Prijedor > Butmir.
CONCLUSIONS By using Standardized Precipitation Evapotranspiration Index (SPEI) it
was found that severity, magnitude and duration of drought periods in B&H vary depending on the location and time scale for which drought was calculated.
The most vulnerable area to meteorological drought is the northern part of B&H. From 600 analyzed months (1961 – 2010) 6.83 % were severely and extremely dry.
The most vulnerable areas to drought affecting soil moisture content or agriculture (SPEI3) extend from northeast to south of the country including region of Bihać. Less vulnerable areas are located in the parts of the country with the higher altitude (Dinaric Mountains) extending from Sarajevo to Sanski Most.
Most affected areas by hydrological drought according to SPEI6 and SPEI12 are Bugojno (7.56 – 9.00 % of severely and extremely dry months) and Prijedor (7.56 – 8.32 % of severely and extremely dry months), while according to SPEI24 Zenica with 9.36 % of severely and extremely dry months.
Presence of more severe long lasting droughts in period after 1986 was found for all 13 analyzed locations across B&H.

Čadro et al. 206
Analysis like this can help decision-makers to set priorities for water resource planning in B&H, but in future more detailed SPEI research is required.
REFERENCES Allen, R. G., Pereira, L. S., Raes, D. Smith, M. 1998. Crop Evapotranspiration Guidelines for
Computing Crop Water Requirements, FAO Irrigation and Drainage Paper, No. 56, Rome.
Begueria S., Vicente-Serrano, S.M. 2015. Calculation of the Standardised Precipitation-Evapotranspiration Index. Package ‘SPEI’. February 19, 2015.
Čadro S., Berjan S., El Bilali H., Žurovec O., Simić J. and Rajčević B. 2012. Governance of Adaptation to and Mitigation of Climate Change on Agricultural, Forest and Water Resources in Bosnia. Third International Scientific Symposium "Agrosym Jahorina 2012", Jahorina.
INCBH 2009. Initial National Communication of Bosnia and Herzegovina under the United Nations Framework Convention on Climate Change. Ministry of Environmental and Satial Planning.
Guttman, N. B. 1998. Comparing the Palmer Drought Index and the Standardized Precipitation Index. J. Amer. Water Resour. Assoc., 34, 113–121.
McKee, T. B., N. J. Doesken, and J. Kleist, 1993: The relationship of drought frequency and duration to time scales. Preprints, Eighth Conf. on Applied Climatology. Anaheim, CA, Amer. Meteor. Soc.
Narasimhan, B., and Srinisvan, R. 2005. Development and Evaluation of Soil Moisture Deficit Indeks and Evapotranspiration Deficit for Agriculture Drought Monitoring. Agricultural and Forest Meteorology 133: 69-88.
Hodžić S., Marković M., Čustović H. (2013) Drought Conditions and Management. Strategies in Bosnia and Herzegovina - Concise Country Report. UNW-DPC Proceedings No. 11. 1st Regional Workshop on Capacity Development to Support National Drought Management Policies.
Palmer, W. C., 1965 Meteorological droughts. U.S. Department of Commerce, Weather Bureau Research Paper 45, 58 pp.
Vicente-Serrano, S.M., Begueria S., Lopez-Moreno J., I. 2010. A Multiscalar Drought Index Sensitive To Global Warming: The Standardized Precipitation Evapotranspiration Index. Journal of Climate. Volume 23. 1 APRIL 2010
Vicente-Serrano, S.,M., Begueria S., Lorenzo-Lacruz, J., Camarero, J.,J., et al. 2012. Preformance of Drought Indices fpr Ecological, Agricultural, and Hydrological Applications. Earth Interactions. Volume 16. Paper No. 10.
Vlahinić, M. 2000. Hydro accumulation, agriculture, and land and water management in Bosnia and Herzegovina. Voda i mi No. 27, 26-37.
Vlahinić, M., Čustović, H., Alagić, E. 2001. Situation of Drought in Bosnia and Herzegovina (B&H)
Wells, N., Goddard, S. 2004. A Self-Calibrated Palmer Drought Index. Michel J. Hayes – National Drought Mitigation Center, University of Nebrask – Lincoln, Nebraska. 15 June 2004.
Žurovec J., Čadro, S. 2010. Climate Changes: the Need and Importance of Crop Irrigation in Northeastern B&H. 21st Scientific-Expert Conference in Agriculture and Food Industry, Neum.
Žurovec J., Čadro, S., Murtić, S. 2011. Drought Analysis in Sarajevo Using Standardized Precipitation Index (SPI), 22nd International Scientific expert Conference in Agriculture and Food Industry.
Žurovec Jasminka, Čadro, S. 2015. Temporal Drought and Soil Moisture Variability in the Arable Land of Spreča Valley. 26th International Scientific expert Conference in Agriculture and Food Industry, Ilidža, Sarajevo.
Žurovec, O., Vedeld, P.O., Sitaula, B.K. 2015. Agricultural Sector of Bosnia and Herzegovina and Climate Change—Challenges and Opportunities. Agriculture 2015, 5, 245-266

Agriculture & Forestry, Vol. 63 Issue 3: 207-219, 2017, Podgorica 207
DOI: 10.17707/AgricultForest.63.3.21 Lenche VELKOSKA-MARKOVSKA, Biljana PETANOVSKA-ILIEVSKA, Aleksandar MARKOVSKI1
APPLICATION OF RAPID RESOLUTION LIQUID CHROMATOGRAPHY TO THE ANALYSIS OF SOME
PESTICIDE RESIDUES IN APPLE JUICE
SUMMARY This paper presents the application of a new, precise, accurate and reliable
rapid resolution liquid chromatography (RRLC) method with ultraviolet-diode array detection (UV-DAD) for the determination of some organonitrogen and organophosphorus pesticide residues in apple juice samples. The successful separation and quantitative determination of analytes were achieved using a Poroshell EC 120-C18 (50 mm x 3 mm; 2.7 µm) analytical column maintained at 25 0C and the detection was monitored at 220 nm and 270 nm. The mixture of acetonitrile/water (50/50, V/V) was used as a mobile phase, with flow rate of 1 mL/min. Specificity, selectivity, linearity, precision, accuracy and limit of quantification (LOQ) were examined to assess the validity of the developed method according to European Commission guidelines for pesticide residue analytical methods and all the performance characteristics were found within acceptance criteria. The obtained values for multiple correlation coefficients (R2) were > 0.96, relative standard deviation (RSD) of retention times and peak areas were ≤ 1.15 %, and recoveries ranged from 93.98 % - 118.60 %, with RSD ≤ 1.77 %. The proposed method was successfully applied for the determination of investigated pesticides in apple juice samples. The detectable residues of examined pesticides were not found in the analysed samples.
Keywords: RRLC method, UV-DAD, pesticide residues, apple juice
INTRODUCTION Numerous research studies suggest that apples may provide health benefits
linked to lowered risk for many chronic and age-related diseases and the nutrients in whole apples are “passed along” when the fruit is processed into apple juice. Apple juice is rich in phytonutrients, which have powerful antioxidant effects and therefore many scientists suggest its inclusion in a healthy human diet (Barth et
1Lenche Velkoska-Markovska, (corresponding author: [email protected]), Biljana Petanovska-Ilievska, Department of Food Quality and Safety, Food Institute, Faculty of Agricultural Sciences and Food - Skopje, “Ss. Cyril and Methodius” University in Skopje, Blvd. Aleksandar Makedonski nn, 1000 Skopje, MACEDONIA, Aleksandar Markovski, Department of Fruit Growing, Institute of Agriculture - Skopje, “Ss. Cyril and Methodius” University in Skopje, Blvd. 16th Macedonian brigade 3A, 1000 Skopje, MACEDONIA. Notes: The authors declare that they have no conflicts of interest. Authorship Form signed online.

Velkoska-Markovska et al. 208
al. 2005, Boyer and liu 2004, Candrawinata et al. 2012, Crozier et al. 2009, Markowski et al. 2009, Lee et al. 2003).
On the other hand, this fruit is highly susceptible to many insects, pests and diseases, so in order to protect apples from pests, to increase yields and to preserve quality, excessive amounts of pesticides, both pre- and post-harvest are applied in apple production. Apples are on the top of the list of fruits and vegetables with the highest levels of pesticide residues, based on USDA (US Department of Agriculture) and FDA (US Food and Drug Administration) testing data (Grace Communication Foundation, 2017). It is well-known that the exposure to pesticides is dangerous to humans. In other words, the pesticides have been linked to a number of health problems, including neurologic and endocrine (hormone) system disorders, birth defects, cancer, and other diseases. To ensure the food safety and consumers’ health protection in most countries Maximum residue levels (MRLs) of pesticides in foodstuff have been established. There is a wide range of pesticides which are used in apple production, some of them being organonitrogen (e.g., atrazine) and organophosphorus (e.g., malathion, fenitrothion and parathion) pesticides. The MRLs of pesticides in apples were set up by European Union Regulation (EC) No. 396/2005 (2005) and they were estimated at: 0.05 mg/kg for atrazine and parathion, 0.02 mg/kg for malathion, and 0.01 mg/kg for fenitrothion. In order to monitor food safety, it is highly necessary to develop and employ reliable methods for the determination of pesticide residues.
In the literature there are a lot of papers describing numerous techniques and analytical methods for the determination of many pesticide residues (e.g. organophosphorus and organonitrogen) in fruits, vegetables and their juices, among which the most widely used are Gas Chromatography (GC) equipped with different detectors, such as: Mass Spectrometry (MS) (Mercer, 2005, Chua et al. 2005, Cunha et al. 2009, Wang et al. 2006, Hu et al. 2004), Flame Photometric Detector (FPD) (Tseng et al. 2007), Nitrogen Phosphorous Detector (NPD) (Albero et al. 2003, Attallah et al. 2012), and Liquid Chromatography (LC) with Tandem Mass Spectrometry (MS/MS) (Perret et al. 2002, Pang et al. 2006, Borba da Cunha et al. 2004), Fluorescent detector (FD) (Fillion et al. 2000), etc. Although it is characterized by lower sensitivity than GC-MS and LC-MS and is not normally used for the analysis of complex samples, HPLC combined with ultraviolet (UV) and/or Diode Array Detector (DAD) is used for the determination of organophosphorus and triazines in different matrices (Rodriguez-Cuesta et al. 2005, Sanchez-Ortega et al. 2005, Baranowska et al. 2005, Texeira et al. 2004, Melo et al. 2005). The pretreatment of samples involves several extraction and purification steps utilizing the following procedures: Liquid-Liquid Extraction (LLE) (Jeannot et al. 2009), Solid Phase Extraction (SPE) (Topuz et al. 2005, Koal et al. 2003), Liquid-Liquid Microextraction (LLME) (Cunha et al. 2009), Solid Phase Microextraction (SPME) (Kong, 2009, Hercegová and Mőder 2011), Matrix Solid-Phase Dispersion (MSPD) (Chua et al. 2005) and recently used, a quick, easy, cheap, effective, rugged and safe (QuEChERS) method (Zanella et al. 2013).
In a previous study HPLC method was developed for the determination of selected pesticides using DAD (Velkoska-Markovska and Petanovska-Ilievska

Application of rapid resolution liquid chromatography to the analysis … 209
2013). To date, no RRLC method for the determination of target pesticide residues in apple juice has been developed. Hence, the objective of this paper was to develop and validate a new RRLC method that has been applied to the simultaneous determination of atrazine, malathion, fenitrothion and parathion residues in apple juice samples using UV-DAD.
MATERIAL AND METHODS Equipment and Materials The chromatographic analysis was performed on an Agilent 1260 Infinity
Rapid Resolution Liquid Chromatography (RRLC) system equipped with: vacuum degasser (G1322A), binary pump (G1312B), autosampler (G1329B), a column compartment (G1316A), UV-VIS diode array detector (G1316B) and ChemStation software. For the better dissolving of the stock solutions an ultrasonic bath “Elma” was used. The experiments were carried out using Poroshell EC 120-C18 (50 mm x 3 mm; 2.7 µm) analytical column produced by Agilent Technologies (USA). A vacuum manifold Visiprep (Supelco, Sigma Aldrich) was used for solid phase extraction, while the samples were vortexed with IKA Vortex Genius 3 (Germany). The SPE procedure was performed on Supelclean ENVI-18 tubes, 6 mL, 0.5 g (Supelco, Sigma Aldrich, Germany).
The Pestanal analytical standards of atrazinе (98.8% purity), malathion (97.2 % purity), fenitrothion (95.2 % purity) and parathion (98.8 % purity), as well as, HPLC-grade acetonitrile and methanol were purchased by Sigma-Aldrich (Germany). Ultrapure water was produced by TKA Smart - 2Pure 12 UV/UF water purification system (Germany). Formic acid (98 % - 100 % purity) was produced by Merck (Germany).
Various commercial 100 % clear apple juice samples from three different producers (A, B, and C) were purchased in local supermarkets in Macedonia.
Preparation of Standard Solutions Stock solutions were prepared by dissolving adequate mass of the pure
analytical standards of atrazinе (11.3 mg), malathion (33.0 mg), fenitrothion (22.5 mg) and parathion (18.8 mg) in acetonitrile using a 25 mL volumetric flasks. The solutions were degassed for 15 min in an ultrasonic bath and stored in a refrigerator in the dark at 4 °C before use. Stock solutions were used for the preparation of standard mixtures with different pesticide concentrations (4.25 – 170.25 ng/mL for atrazine, 66.74 – 2672.50 ng/mL for malathion, 49.13 – 1967.00 ng/mL for fenitrothion and 62.77 – 2513.26 ng/mL for parathion) in 10 mL volumetric flasks by dilution with the acetonitrile/water mixture (50/50, V/V) and for the spiking of apple juice samples.
Sample preparation The preparation of the samples for analysis was performed in a few steps.
The first step in sample preparation procedures for RRLC determination was filtering of apple juice samples through 0.45 µm nitrocellulose membrane filters (Millipore, Ireland). The solid-phase extraction (SPE) was employed for the concentration and purification of the samples. The SPE procedure was carried out

Velkoska-Markovska et al. 210
using Supelclean ENVI-18 tubes (6 mL, 0.5 g, produced by Supelco, Sigma-Aldrich, Germany).
For the determination of linearity, precision, recovery and limit of quantification (LOQ), spiking samples were prepared by fortifying 1 kg apple juice with six sets of concentrations: 0.0007, 0.007, 0.025, 0.035, 0.05 and 0.06 mg/kg for atrazine and parathion, 0.00028, 0.0028, 0.01, 0.014, 0.02 and 0.024 mg/kg for malathion and 0.00014, 0.0014, 0.007, 0.005, 0.01 and 0.012 mg/kg for fenitrothion. Unspiked samples were used for blanks. The blank samples were prepared from apple juice free of tested pesticides. For each concentration level five samples (n = 5) were prepared.
Prior to use, the SPE cartridges were conditioned with 5 mL of acetonitrile, followed by 5 mL of water at a flow rate of 2 mL/min. Subsequently, 1 kg of filtered apple juice samples were passed through the cartridges at a flow rate of 10 mL/min, and then the tubes were washed with 5 mL of water. The drying process of the cartridges was carried out under a vacuum for 10 minutes. The elution of the cartridges was achieved with 2 × 2 mL of acetonitrile and the eluates were evaporated to dryness in a nitrogen evaporator. The obtained residue was dissolved in 1 mL acetonitrile/water mixture (50/50, V/V) by vortexing for 1 min and filtered through 0.45 µm Iso-Disc PTFE syringe filters (Supelco, Sigma-Aldrich, Germany) just before the RRLC analysis. The injection volume of each sample was 5 µL.
RESULTS AND DISCUSSION
Rapid resolution liquid chromatography (RRLC) method was developed for the simultaneous determination of atrazine, malathion, fenitrothion and parathion residues in apple juice samples. According to their chemical structures (Figure 1) the target pesticides belong to different groups: atrazine (6-chloro-N2-ethyl-N4-isopropyl-1,3,5-triazine-2,4-diamine, IUPAC) is organonitrogen, and malathion (diethyl(dimethoxythiophosphorylthio) succinate; S-1,2-bis(ethoxycarbonyl)ethyl O,O-dimethyl phosphorodithioate, IUPAC), fenitrothion (O,O-dimethyl O-4-nitro-m-tolylphosphorothioate, IUPAC) and parathion (O,O-diethyl O-4-nitrophenyl phosphorothioate, IUPAC) are organophosphorus pesticides (Tomlin, 1997). The identification of these pesticides was accomplished using UV-DAD.
From the UV spectra of investigated pesticides in acetonitrile/water mixture (50/50, V/V) (Figure 1) it can be seen that they have absorption maxima around 220 nm. Also, it is evident that fenitrothion has an absorption maximum at 270 nm, while parathion has a band with higher absorption maximum at 280 nm. Therefore, the chromatographic analysis for their simultaneous determination was carried out at 220 nm and 270 nm.
The successful separation and quantification of examined pesticides were carried out using a reverse phase Poroshell EC 120-C18 (50 mm x 3 mm; 2.7 µm) analytical column. A series of preliminary examinations with different mixtures of acetonitrile/water (80 - 40% acetonitrile), methanol/water (80 – 65%
Application of rapid resolution liquid chromatography to the analysis … 211
methanol), as well as acetonitrile/0.1% formic acid and methanol/0.1 % formic acid as mobile phases in isocratic elution mode were used. The investigations showed that better results in terms of better baseline, a better peak shape and shorter retention time were obtained with a mobile phase composed of acetonitrile/water. The best separation of the analytes with symmetrical peak shapes and satisfying purity indexes was achieved under isocratic elution with acetonitrile/water (50/50, V/V) as a mobile phase, flow rate of 1 mL/min, constant column temperature at 25 °C and UV detection at 220 nm and 270 nm (Figure 2).
Figure 1. Chemical structures of atrazine (a), malathion (b), fenitrothion (c) and
parathion (d) and their UV spectra in acetonitrile/water (50/50, V/V)
To confirm the specificity of the developed method, UV-diode array detection was used to check the peak purity and analyte peak identity. The purity index for all the analytes was greater than 990 (the maximum value for the peak purity index (PPI) should be 1000), which means that the chromatographic peak was not affected by any other compound.
The obtained values for column dead time, retention times of components (tR), the calculated values for retention factors (k’), separation factors (α) and resolution (Rs) are given in Table 1. The values of retention factor below 20 and for resolution above 1.5 indicated that the separation of analytes under used chromatographic conditions was successful (Dong, 2006). Compared with the results of the previous study (Velkoska-Markovska and Petanovska-Ilievska 2013), conducted on the LiChrospher 60 RP-select B (125 mm x 4 mm, 5 µm) column, shorter retention times for components were obtained, which means less time for chromatographic analysis (3.5 min). In other words, this analysis requires a small volume (< 2 mL) of the organic solvent (acetonitrile), thereby reducing the cost of the analysis.
The developed method was applied for the determination of selected pesticide residues in apple juice samples. Prior to the quantitative determination of the content of tested pesticide residues in apple juice samples it is necessary to perform the enrichment and clean-up of analytes. The sample preparation is a crucial step in the analysis, which has great impact on the reliability and accuracy

Velkoska-Markovska et al. 212
of the result. For achieving that goal, a solid-phase extraction was conducted using the Supelclean ENVI-18 tubes. These SPE columns were chosen because C-18 is the most commonly used sorbent for SPE of pesticide residues in various samples (Pico et al. 2004). The method validation was performed in accordance with EU Regulation and EU Guidance documents (Document No SANCO/12495/2011 2011, European Commission 2010) and for that purpose 1 kg 100% clear apple juice samples were fortified by investigated pesticides ranged from 1.4% of MRLs to 20 % above MRLs.
Figure 2. Chromatograms obtained from standard mixtures of atrazine (1), malathion (2), fenitrothion (3) and parathion (4) at 220 nm (a) and 270 nm (b) with developed method
Table 1. Data for retention times (tR), retention factors (k’), separation factors (α)
and resolution (Rs) for the analysed pesticides Compound tR (min) k’ α Rs dead time 0.19 - - - atrazine 0.56 1.95 3.43 21.38
malathion 1.46 6.68 1.07 1.69 fenitrothion 1.55 7.16 1.69 14.25 parathion 2.49 12.10 - -

Application of rapid resolution liquid chromatography to the analysis … 213
Figure 3. Chromatograms from standard mixture of atrazine (1), malathion (2), fenitrothion (3) and parathion (4) at the concentrations which correspond to MRLs (a), matrix blank (b) and samples of apple juice fortified at the concentration equal to MRL for each analyte (c).

Velkoska-Markovska et al. 214
Specificity, selectivity, linearity, precision expressed as repeatability of retention time and peak area, recovery and limit of quantification (LOQ) for all analytes were tested for the method validation.
The chromatograms of the standard mixture of investigated pesticides at the concentrations which correspond to MRLs (a), matrix blank (unspiked apple juice sample, which was apple juice free of investigated pesticides) (b) and sample of apple juice fortified at the concentration equal to MRL for each analyte (c) are presented in Figure 3. The identification of the analytes was done using the values for the retention time and match factor obtained by overlaid spectra of a pure analytical standard and absorption spectra of the same analyte in the apple juice samples.
Table 2. Statistical data for linearity of the method
Compound Linearity range (µg/kg) Regression equation R2
atrazine 0.70 - 60.00 1y = 59103x + 112.16 2y = 30711x + 78.109
0.9924 0.9894
malathion 0.28 - 24.00 1y = 6336.7x + 8.4782 2y = 1478.2x + 2.1872
0.9690 0.9737
fenitrothion 0.14 - 12.00 1y = 10302x + 2.7927 2y = 3008x + 1.1414
0.9951 0.9920
parathion 0.70 - 60.00 1y = 24531x + 88.11
2y = 4766.7x + 16.607 0.9688 0.9698
1y = peak area, 2y = peak height
Table 3. Statistical data for Intra-day precision of retention time and peak area (n = 5)
The linearity of the developed method was determined for all compounds
separately, by construction of calibration curves at 6 concentration levels, with triplicate injections (5 µL) of the spiked standards in the apple juice sample matrix in the range of: 0.0007 - 0.06 mg/kg for atrazine and parathion, 0.00028 - 0.024 mg/kg for malathion and 0.00014 - 0.012 mg/kg for fenitrothion. For these concentration ranges and using the data for the peak areas and peak heights the curves were constructed and the correlation coefficients (R2) were calculated (Table 2). The curves followed Lambert-Beer’s law and the calculated results for
Compound tR (min) ± SD RSD (%) peak area ± SD RSD (%)
atrazine 0.58 ± 0.0004 0.07 2998.84 ± 3.35 0.11
malathion 1.53 ± 0.001 0.09 127.33 ± 0.61 0.48
fenitrothion 1.63 ± 0.002 0.10 101.52 ± 1.16 1.15
parathion 2.61 ± 0.004 0.17 1240.44 ± 2.54 0.20

Application of rapid resolution liquid chromatography to the analysis … 215
multiple correlation coefficients (R2 ≥ 0.96) suggested that the method has a satisfactory linearity for all analytes (Table 2).
Furthermore, the precision was expressed as repeatability of the obtained results from five successive injections (5 µL) of the spiked apple juice samples at MRLs for each of the analytes. The computed values of relative standard deviation (RSD) for retention time were in the interval from 0.07 to 0.17 %, and for the peak area in the range of 0.11 – 1.15%, indicated an excellent precision of the proposed method (Table 3).
Table 4. Results from recovery experiments (n = 5)
Compound Fortification level (mg/kg)
Total analyte found (mg/kg ± SD)
Recovery (%)
RSD (%)
atrazine
0.035 0.038 ± 0.00007 108.90 0.18
0.050 0.049 ± 0.00006 97.66 0.12
0.060 0.058 ± 0.00003 97.27 0.06
malathion
0.014 0.016 ± 0.0001 114.59 0.64
0.020 0.019 ± 0.00009 95.65 0.49
0.024 0.023 ± 0.00008 95.30 0.37
fenitrothion
0.007 0.007 ± 0.0001 107.44 1.21
0.010 0.010 ± 0.0001 95.62 1.21
0.012 0.012 ± 0.0002 98.89 1.77
parathion
0.035 0.041 ± 0.00005 118.60 0.12
0.050 0.047 ± 0.0001 93.98 0.23
0.060 0.057 ± 0.00005 95.34 0.10 The accuracy of the method was determined by the recovery studies of
apple juice samples (pesticides free) spiked with the investigated pesticides at three concentration levels (Table 4). The obtained values for recovery and for relative standard deviation were within the following ranges 93.98 – 118.60% and 0.06 – 1.77%, respectively. The mean recovery at each fortification level in the range of 70 - 120% and relative standard deviation (RSD) ≤ 20% per level are acceptable according to EU criteria (European Commission, 2010). Consequently, it can be concluded that the proposed method is convenient for the determination of the target pesticide residues in apple juice.
The developed RRLC method was successfully applied for the determination of the investigated pesticide residues in apple juice samples under the defined experimental conditions. The typical chromatograms of apple juice samples are presented in Figure 4. The samples from three different producers marked as: A, B and C were purchased from Macedonian market. The samples were concentrated and the clean-up using SPE prior to RRLC analysis. Each analysis was repeated five times.

Velkoska-Markovska et al. 216
Figure 4. Typical chromatograms of apple juice samples A (a), B (b)
and C (c) at 220 nm

Application of rapid resolution liquid chromatography to the analysis … 217
The investigations show that residue of analysed pesticides in concentrations which correspond to MRLs or higher were detected in none of the tested apple juice samples.
CONCLUSIONS
This study describes a new, simple, fast and low-cost rapid resolution liquid chromatography method with ultraviolet - diode array detection that has been successfully applied to the simultaneous determination of atrazine, malathion, fenitrothion and parathion residues in apple juice samples. The best separation of the analytes with symmetrical peak shapes and satisfactory purity indexes was achieved under isocratic elution with acetonitrile/water (50/50, V/V) as a mobile phase, flow rate of 1 mL/min, constant column temperature at 25 °C and UV detection at 220 nm and 270 nm. The developed method has been validated according to the EU Regulation and EU Guidance document and the obtained results revealed that the proposed method has a satisfactory linearity, precision and accuracy for all analytes. The obtained results indicated that the analysed samples did not contain detectable residues of analysed pesticides. The run time of analysis was about 3.5 min.
REFERENCES
Albero, B. Sanchez-Brunete, C. Tadeo, J.L. (2003): Determination of organophosphorus pesticides in fruit juices by matrix solid-phase dispersion and gas chromatography. J. Agric. Food Chem., 51(24): 6915-6921.
Attallah, E.R. Barakat, D.A. Maatook, G.R. Badawy, H.A. (2012): Validation of a quick and easy (QuEChERS) method for the determination of pesticides residue in dried herbs. J. Food. Agric. Environ., 10(1): 755-762.
Baranowska, I. Barchanska, H. Pyrsz, A. (2005): Distribution of pesticides and heavy metals in trophic chain. Chemosphere, 60(11): 1590-1599.
Barth, S.W. Fahndrich, C. Bub, A. Dietrich, H. Watzl, B. Will, F. Briviba, K. Rechkemmer, G. (2005): Cloudy apple juice decreases DNA damage, hyperproliferation and aberrant crypt foci development in the distal colon of DMH-initiated rats. Carcinogenesis, 26: 1414-1421.
Borba da Cunha, A.C. Lopez de Alda, M.J. Barcelo, D. Pizzolato, T.M. dos Santos, J.H. (2004): Multianalyte determination of different classes of pesticides (acidic, triazines, phenyl ureas, anilines, organophosphates, molinate and propanil) by liquid chromatography-electrospray-tandem mass spectrometry. Anal. Bioanal. Chem., 378: 940-954.
Boyer, J. Liu, R.H. (2004): Apple phytochemicals and their health benefits. Nutr. J., 12: 3-5.
Candrawinata, V.I. Blades, B.L. Golding, J.B. Stathopoulos, C.E. Roach, P.D. (2012): Effect of clarification on the polyphenolic compound content and antioxidant activity of commercial apple juices. International Food Research Journal, 19(3): 1055-1061.
Chua, X.G. Hub, X.Z. Yaoa, H.Y. (2005): Determination of 266 pesticide residues in apple juice by matrix solid-phase dispersion and gas chromatography–mass selective detection. J. Chromatogr. A., 1063: 201–210.
Crozier, A. Jaganath, I.B. Clifford, M.N. (2009): Dietary phenolics: chemistry, bioavailability and effects on health. Roy. Soc. Chem., 26: 1001–1043.
Velkoska-Markovska et al. 218
Cunha, S.C. Fernandes, J.O. Oliveira, M.B.P.P. (2009): Fast analysis of multiple pesticide residues in apple juice using dispersive liquid–liquid microextraction and multidimensional gas chromatography–mass spectrometry. J. Chromatogr. A., 1216(51): 8835-8844.
Document No SANCO/12495/2011. (2011): Method validation and quality control procedures for pesticide residues analysis in food and feed.
Dong, M. W. (2006): Modern HPLC for practicing scientists, pp. 17-46. John Wiley & Sons Inc. Hoboken. New Jersey.
European Commission. (2010): Guidance document on pesticide residue analytical methods. SANCO/825/00 rev. 8.1.
Fillion, J. Sauve, F. Selwyn, J. (2000): Multiresidue method for the determination of residues of 251 pesticides in fruits and vegetables by gas chromatography/mass spectrometry and liquid chromatography with fluorescence detection. J. AOAC Int., 83: 698-713.
Grace Communication Foundation. (2017): Pesticides. (available at www.sustainabletable.org).
Hercegová, A. Mőder, M. (2011): Determination of some selected pesticide residues in apple juice by solid-phase microextraction coupled to gas chromatography – mass spectrometry. Acta Univ. Agric. Silvic. Mendelianae Brun., 59: 121-128.
Hu, X. Jianxin, Y. Zhigang, Y. Lansun, N. Yanfei, L. Peng, W. Jing, L. Xin, H. Xiaogang, C. Yibin, Z. (2004): Determination of multiclass pesticide residues in apple juice by gas chromatography-mass selective detection after extraction by matrix solid-phase dispersion. J AOAC Int., 87(4): 972-985.
Jeannot, R. Sabik, H. Sauvard, E. Genin, E. (2009): Application of liquid chromatography with mass spectrometry combined with photodiode array detection and tandem mass spectrometry for monitoring pesticides in surface waters. J Chromatogr A., 879(1): 51-71.
Koal, T. Asperger, A. Efer, J. Engewald, W. (2003): Simultaneous determination of a wide spectrum of pesticides in water by means of fast on-line SPE-HPLC-MS-MS - a novel approach. Chromatographia, 57: 93-101.
Kong, X. H. (2009): Determination of organophosphorous pesticide residues in apple juice concentrate by solid phase microextraction-gas chromatography. Food Science, 30(2): 196-200.
Lee, K.W. Kim, Y.J. Kim, D.O. Lee, H.J. Lee, C.Y. (2003): Major phenolics in apple and their contribution to the total antioxidant capacity. J. Agric. Food Chem., 51: 6516–6520.
Markowski, J. Baron, A. Mieszczakowska, M. Płocharski, W. (2009): Chemical composition of French and Polish cloudy apple juices. J. Hortic. Sci. & Biotech. ISAFRUIT Special Issue, 68-74.
Melo, L.F.C. Collins, C.H. Jardim, I.C.S.F. (2005): High-performance liquid chromatographic determination of pesticides in tomatoes using laboratory-made NH2 and C18 solid-phase extraction materials. J. Chromatogr. A., 1073: 75-81.
Mercer, G.E. (2005): Determination of 112 halogenated pesticides using gas chromatography/mass spectrometry with selected ion monitoring. J. AOAC Int., 88(5): 1452-1462.
Pang, G.F. Fan, C.L. Liu, Y.M. Cao, Y.Z. Zhang, J.J. Fu, B.L. Li, X.M. Li, Z.Y. Wu, Y.P. (2006): Multi-residue method for the determination of 450 pesticide residues in honey, fruit juice and wine by double-cartridge solid-phase extraction/gas chromatography-mass spectrometry and liquid chromatography-tandem mass spectrometry. Food Addit. Contam., 23(8): 777-810.
Application of rapid resolution liquid chromatography to the analysis … 219
Perret, D. Gentili, A. Marchese, S. Sergi, M. D'Asceno, G. (2002): Validation of a method for the determination of multiclass pesticide residues in fruit juices by liquid chromatography/tandem mass spectrometry after extraction by matrix solid-phase dispersion. J AOAC Int., 85(3): 724-730.
Pico, Y. Blasco, C. Font, G. (2004): Environmental and food applications of LC–tandem mass spectrometry in pesticide-residue analysis: an overview. Mass Spectrom. Rev., 23: 45–85.
Regulation (EC) No 396/2005 of the European Parliament and of the Council of 23 February 2005 on maximum residue levels of pesticides in or on food and feed of plant and animal origin and amending Council Directive 91/414/EEC Text with EEA relevance.
Rodrıguez-Cuesta, M.J. Boque, R. Rius, F.X. Martınez-Vidal, J.L. Garrido Frenich, A. (2005): Development and validation of a method for determining pesticides in groundwater from complex overlapped HPLC signals and multivariate curve resolution. Chem. Intel. Lab. Syst., 77: 251-260.
Sanchez-Ortega, A. Sampedro, M.C. Unceta, N. Goicolea, M.A. Barrio, R.J. (2005): Solid-phase microextraction coupled with high performance liquid chromatography using on-line diode-array and electrochemical detection for the determination of fenitrothion and its main metabolites in environmental water samples. J. Chromatogr. A., 1094: 70-76.
Texeira, M.J. Aguiar, A. Afonso, C.M.M. Alves, A. Bastos, M.M.S.M. (2004): Comparison of pesticides levels in grape skin and in the whole grape by a new liquid chromatographic multiresidue methodology. Anal. Chim. Acta., 513: 333-340.
Tomlin, C. (1997): The pesticide manual incorporating the agrochemicals handbook. (11th ed.). pp. 51-52, 271-274, 435-436, 630-631, 787-788. British Crop Protection Council. Royal Society of Chemistry Cambridge.
Topuz, S. Ozhan, G. Alpertunga, B. (2005): Simultaneous determination of various pesticides in fruit juices by HPLC-DAD. Food Control, 16: 87-92.
Tseng, S.H. Lin, Y.J. Lee, H.F. Su, S.C. Chou, S.S. Hwang, D.F. (2007): A multiresidue method for determination 136 pesticides and metabolites in fruit and vegetables: Application of macroporous diatomaceous earth column. J. Food Drug Anal., 15(3): 316-324.
Velkoska-Markovska, L. Petanovska-Ilievska, B. (2013): Optimization and development of SPE-HPLC-DAD method for the determination of atrazine, malathion, fenitrothion and parathion pesticide residues in apple juice. Maced. J. Chem. Chem. Eng., 32(2): 299-308.
Wang, J.H. Zhang, Y.B. Wang, X.L. (2006): Determination of multiclass pesticide residues in apple juice by gas chromatography–mass spectrometry with large-volume injection. Journal of Separation Science, 29(15): 2330-2337.
Zanella, R. Munaretto, J.S. Martins, M.L. (2013): Determination of pesticide multiresidues in apple, pear, and grape using modified QuEChERS and analysis by LC-QTOF MS. Agilent technologies. Inc., pp. 1-11.


Agriculture & Forestry, Vol. 63 Issue 3: 221-231, 2017, Podgorica 221
DOI: 10.17707/AgricultForest.63.3.22 Hamed HASSANZADEH KHANKAHDANI, Somayeh RASTEGAR, Behrouz GOLEIN, Morteza GOLMOHAMMADI and Abdolhossein ABOUTALEBI JAHROMI 1
GENETIC DIVERSITY IN PERSIAN LIME (CITRUS LATIFOLIA TANAKA) ACCESSIONS USING MORPHOLOGICAL AND
MOLECULAR MARKERS
SUMMARY Persian lime (PL), Citrus latifolia Tanaka, is a triploid and WBDL
(Witches Broom Disease of lime) resistant lime which experiences cultivation extension these days. In addition to PL, there are many unknown triploid lime germplasms in the south of Iran, which necessitate to be identified. The current study was conducted to evaluate phylogenetic relationships among PL accessions in Iran. To do so, eighteen known and unknown genotypes of PL and Mexican lime, collected from Fars, Hormozgan and Mazandaran provinces of Iran, as well as eight systematically known citrus varieties were studied by ISSR and morphological markers.
Eight ISSR primers produced 139 polymorphic bands in which Polymorphic Information Content (PIC) varied from 0.384 to 0.499. The morphological study divided examined accessions into two main groups including control accessions (Pummelo, Citron, Lisbon lemon, Sweet lime, Grapefruit and Dancy) and twenty lime and lemon accessions. Both morphological and ISSR markers produced a clear-cut resolution among genotypes and could separate the control accessions from the other ones. Molecular inferred tree grouped all examined accessions and varieties into 7 clades in which Mexican lime accessions (Mexican lime, IFJKh, IFJKMes and Cucumber-shaped lime) and PL accessions grouped in two close groups. As we expected, Persian and Mexican lime accessions showed genetically close relation. The most striking result to emerge from the data was highly correlation between morphological and ISSR data.
Keywords: Deperse lime, IAC, Bearss lime, Microsatellites, Tahiti lime.
1Hamed Hassanzadeh Khankahdani, (corresponding author: [email protected]), Department of Horticultural Science, Agriculture and Natural Science College, University of Hormozgan, Hormozgan, IRAN and Horticulture Crops Research Department, Agricultural and Natural Resources Research and Education Center of Hormozgan, (AREEO), IRAN. Somayeh Rastegar, Department of Horticultural Science, Agriculture and Natural Science College, University of Hormozgan, Hormozgan, IRAN. Behrouz Golein and Morteza Golmohammadi, Citrus and Subtropical Fruits Research Center, Horticultural Sciences Research Institute, Agricultural Research, Education and Extension Organization (AREEO), Ramsar, IRAN. Abdolhossein Aboutalebi Jahromi, Horticulture Department, Jahrom Branch, Islamic Azad University, Jahrom, IRAN. Notes: The authors declare that they have no conflicts of interest. Authorship Form signed online.
Hassanzadeh Khankahdani et al. 222
INTRODUCTION Persian lime (Citrus latifolia Tanaka) is a natural triploid citrus species
(2n=3x=27), which rarely produces seeds and is resistant to WBDL (Witches Broom Disease of Lime). No variety has been seen in this species and commercially cultivated genotypes are known as accessions (Santos et al. 2013). Some PL accessions like Bearss lime, Tahitian lime, IAC and Deperse lime have been introduced to Iran through grafted plants or scions from other countries and propagated via budding in various regions of Iran.
In past, phylogenetic relationships among citrus genera and species was only studied based on morphological characteristics, but application of these traits to recognize citrus cultivars is difficult; however, some of these traits are influenced by the environment. Thus, DNA markers have been extensively used to study phylogenetic relationships in many plants (Golein et al. 2013). The inter-simple sequence repeat (ISSR) markers are dominant markers which have been used profusely in citrus identification. ISSRs have been used substantially in citrus studies (Sharma et al. 2015). It has been also applied for discrimination among very genetically close cultivars (Tripolitsiotis et al. 2013).
Due to resistance of PL to WBDL (Salehi et al. 2005), its cultivation is being increased in south of Iran regions. In contrast, some genetically unknown lime accessions are cultivated by farmers these days as PL that are infected severely by WBDL. This issue shows that these accessions are not PL and its continuation may have serious implications. Respect with the no published information about genetic diversity of PL, the current study was done to identify PL accessions and its genetic diversity to introduce real PL accessions either for cultivation or for breeding programs. We also aimed to check any correlation between morphological and molecular data in PL to determine whether morphological attributes are affected by environmental factors or not.
MATERIALS AND METHODS
Plant material Leaf sample of the studied genotypes were collected from productive and
grafted-seedlings in Fars, Hormozgan and Mazandaran provinces (Table 1). Grapefruit, Pummelo, Lisbon lemon, Citron, Dancy tangerine, Sweet lime and pear-shaped lemon were involved in the study as the control group.
Morphological study Morphological attributes study was done by using IPGRI (1999) descriptor
list for five trees of each accessions in which various plant attributes such as branch angle, density of branches, tree shape, shoot tip color, spine density, spine shape, leaf lamina shape, leaf lamina margin, leaf apex, leaf length, leaf width, leaf length/width ratio, petiole length, petiole wing situation, petiole wing width, petiole wing shape, color of flower, number of petal, petal length, petal width, pedicle length, calyx diameter, color of anther and anther/stigma ratio.

Genetic diversity in persian lime (Citrus latifolia Tanaka) accessions … 223
DNA extraction and ISSR analysis Total genomic DNA was isolated from the young and fresh leaves using
the modified EDWARD method (Edward et al. 1991). A total of 14 ISSR primers previously evaluated by other researchers (Shahsavar et al. 2007, Uzun et al. 2010, Martasari et al. 2012, Golein et al. 2013, Tripolitsiotis et al. 2013) were used (table 2).
Table 1: Plant materials utilized for morphological and ISSR analysis
Genotype name Accession Location Latitude (N) Longitude (E) Citrus sp. IFDF Fars-Darab 28°19´32´´ 55°11´38´´ Citrus sp. IFD Fars-Darab 28°44´58´´ 54°32´59´´ Citrus sp. IFJAb Fars-Jahrom 28°31´14´´ 53°40´40´´
Citrus sp. IHRA1 Hormozgan-Rudan 27°37´06´´ 57°11´30´´ C. latifolia Persian lime (PL) Hormozgan-Rudan 27°37´04´´ 57°11´30´´ Citrus sp. IHRA3 Hormozgan-Rudan 27°37´02´´ 57°11´30´´
Citrus sp. IFJAm Fars-Jahrom 28°32´32´´ 53°36´30´´ Citrus sp. IFJK Fars-Jahrom 28°29´13´´ 53°34´48´´ Citrus sp. IFJM Fars-Jahrom 28°30´02´´ 53°36´07´´
C. grandis Pummelo Mazandaran-Ramsar 36°54´26´´ 50°39´21´´ C. latifolia Tahiti lime Hormozgan-Minab 27°06´27´´ 57°05´39´´ C. paradisi Grapefruit cv. Duncan Mazandaran-Ramsar 36°43´04´´ 50°59´02´´
C. medica Citron Mazandaran-Ramsar 36°43´04´´ 50°59´02´´ C. limon Lisbon lemon Mazandaran-Ramsar 36°43´04´´ 50°59´02´´
C. latifolia Deperse lime Hormozgan-Minab 27°06´27´´ 57°05´39´´
C. latifolia IAC Mazandaran-Ramsar 36°54´26´´ 50°39´22´´ Citrus sp. IFJAn1 Fars-Jahrom 28°27´32´´ 53°31´13´´ Citrus sp. IFJAn2 Fars-Jahrom 28°27´32´´ 53°31´12´´
C. aurantifolia Mexican lime Hormozgan-Rudan 27°37´02´´ 57°11´29´´ Citrus sp. IFJKMes Fars-Jahrom 28°29´13´´ 53°34´46´´ Citrus sp. IFJKh Fars-Jahrom 28°32´32´´ 53°36´32´´
Citrus sp. Cucumber-shaped lime Fars-Darab 28°44´58´´ 54°32´59´´
C. limon Pear-shaped lemon Fars-Darab 28°44´58´´ 54°32´59´´ C. limetta Sweet lime Fars-Darab 28°19´32´´ 55°11´38´´
C. reticulata Dancy tangerine Mazandaran-Ramsar 36°43´04´´ 50°59´02´´ C. latifolia Bearss lime Mazandaran-Sari 36°38´09´´ 53°11´48´´
DNA concentration was measured by NanoDrop 1000 at 260 nm. In
addition, quality and intactness of the isolated DNA was tested by 0.8% Agarose gel. ISSR amplification reactions was prepared to a final volume of 10 μl [25 ng
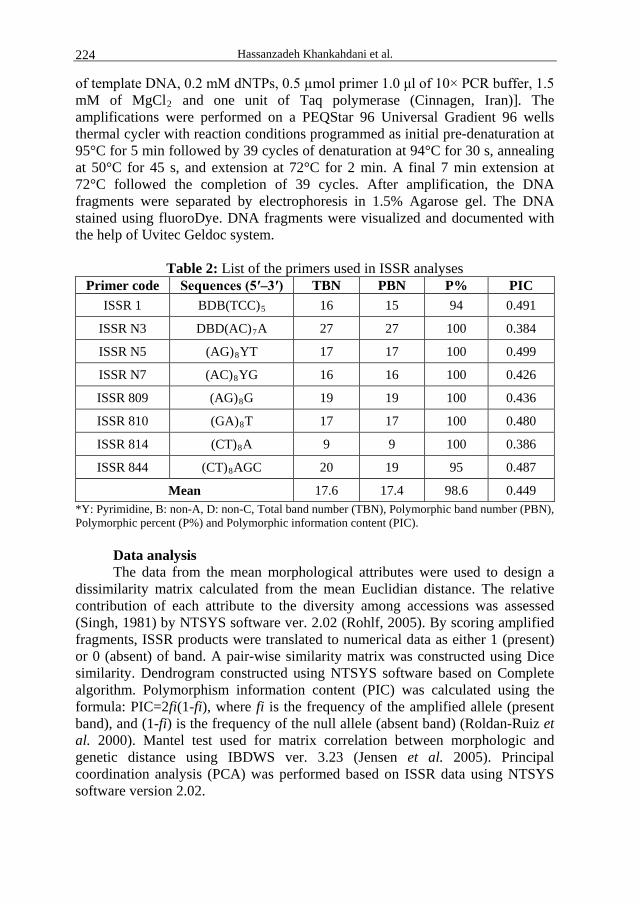
Hassanzadeh Khankahdani et al. 224
of template DNA, 0.2 mM dNTPs, 0.5 µmol primer 1.0 μl of 10× PCR buffer, 1.5 mM of MgCl2 and one unit of Taq polymerase (Cinnagen, Iran)]. The amplifications were performed on a PEQStar 96 Universal Gradient 96 wells thermal cycler with reaction conditions programmed as initial pre-denaturation at 95°C for 5 min followed by 39 cycles of denaturation at 94°C for 30 s, annealing at 50°C for 45 s, and extension at 72°C for 2 min. A final 7 min extension at 72°C followed the completion of 39 cycles. After amplification, the DNA fragments were separated by electrophoresis in 1.5% Agarose gel. The DNA stained using fluoroDye. DNA fragments were visualized and documented with the help of Uvitec Geldoc system.
Table 2: List of the primers used in ISSR analyses
Primer code Sequences (5′–3′) TBN PBN P% PIC ISSR 1 BDB(TCC)5 16 15 94 0.491
ISSR N3 DBD(AC)7A 27 27 100 0.384
ISSR N5 (AG)8YT 17 17 100 0.499
ISSR N7 (AC)8YG 16 16 100 0.426
ISSR 809 (AG)8G 19 19 100 0.436
ISSR 810 (GA)8T 17 17 100 0.480
ISSR 814 (CT)8A 9 9 100 0.386
ISSR 844 (CT)8AGC 20 19 95 0.487
Mean 17.6 17.4 98.6 0.449 *Y: Pyrimidine, B: non-A, D: non-C, Total band number (TBN), Polymorphic band number (PBN), Polymorphic percent (P%) and Polymorphic information content (PIC).
Data analysis The data from the mean morphological attributes were used to design a
dissimilarity matrix calculated from the mean Euclidian distance. The relative contribution of each attribute to the diversity among accessions was assessed (Singh, 1981) by NTSYS software ver. 2.02 (Rohlf, 2005). By scoring amplified fragments, ISSR products were translated to numerical data as either 1 (present) or 0 (absent) of band. A pair-wise similarity matrix was constructed using Dice similarity. Dendrogram constructed using NTSYS software based on Complete algorithm. Polymorphism information content (PIC) was calculated using the formula: PIC=2fi(1-fi), where fi is the frequency of the amplified allele (present band), and (1-fi) is the frequency of the null allele (absent band) (Roldan-Ruiz et al. 2000). Mantel test used for matrix correlation between morphologic and genetic distance using IBDWS ver. 3.23 (Jensen et al. 2005). Principal coordination analysis (PCA) was performed based on ISSR data using NTSYS software version 2.02.
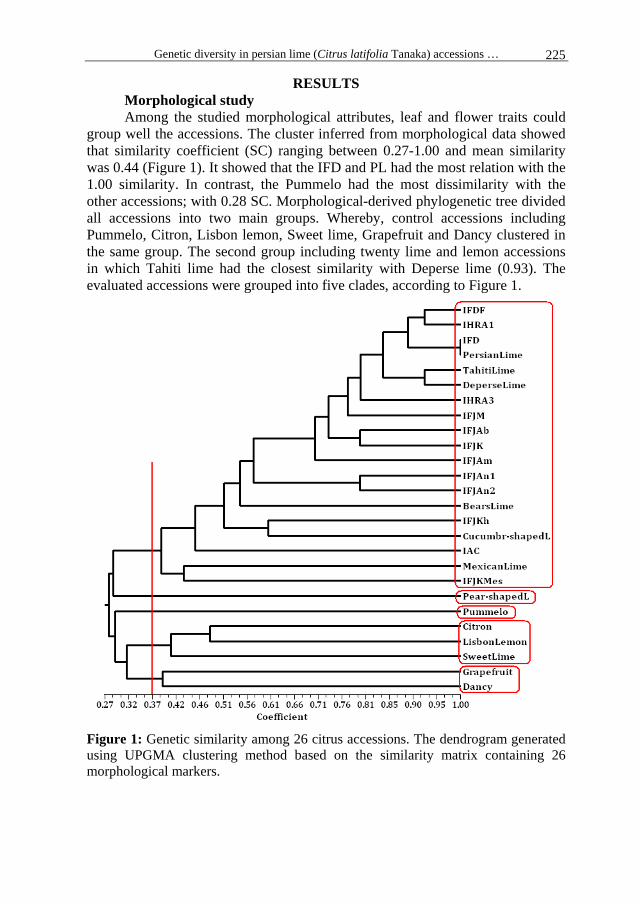
Genetic diversity in persian lime (Citrus latifolia Tanaka) accessions … 225
RESULTS Morphological study Among the studied morphological attributes, leaf and flower traits could
group well the accessions. The cluster inferred from morphological data showed that similarity coefficient (SC) ranging between 0.27-1.00 and mean similarity was 0.44 (Figure 1). It showed that the IFD and PL had the most relation with the 1.00 similarity. In contrast, the Pummelo had the most dissimilarity with the other accessions; with 0.28 SC. Morphological-derived phylogenetic tree divided all accessions into two main groups. Whereby, control accessions including Pummelo, Citron, Lisbon lemon, Sweet lime, Grapefruit and Dancy clustered in the same group. The second group including twenty lime and lemon accessions in which Tahiti lime had the closest similarity with Deperse lime (0.93). The evaluated accessions were grouped into five clades, according to Figure 1.
Figure 1: Genetic similarity among 26 citrus accessions. The dendrogram generated using UPGMA clustering method based on the similarity matrix containing 26 morphological markers.

Hassanzadeh Khankahdani et al. 226
ISSR analysis ISSR data showed that eight out of 14 primers were polymorphic. In total,
141 bands were produced in which 139 were polymorphic (Table 2). The ISSR markers showed 99% polymorphic bands, with a mean of 17.4 polymorphic bands per primer. Polymorphic percent rate (P%) varied from 100% (in N3, N5, N7, 809, 810 and 814) to 94% (in ISSR 1), so that the mean of polymorphic percent was 99%. Average PIC value for the used primers was 0.449 (Figure 2).
Figure 2: ISSR profiles amplified from DNA of Citrus accessions using primer ISSR N5 (above) and ISSR 844 (below). L: Ladder (100-3000 bp), 1: IFDF, 2: IFD, 3: IFJAb, 4:IHRA1, 5: Persian lime, 6: IHRA3, 7: IFJAm, 8: IFJK, 9: IFJM, 10: Pummelo, 11: Tahiti lime, 12: Grapefruit, 13: Citron, 14: Lisbon lemon, 16: Deperse lime, 17: IAC, 18: IFJAn1, 19: IFJAn2, 20: Mexican lime, 21: IFJKMes, 23: IFJKh, 25: Cucumber-shaped lime, 26: Pear-shaped lemon, 27: Sweet lime, 32: Dancy tangerine, 33: Bearss lime.
Molecular analysis clustered all accessions into two main groups: the first group including Dancy, Sweet lime, Citron, Grapefruit and Pummelo, and the second group including all limes and lemons accessions. According to the reference line, all accessions divided into seven clades as shown in Figure 3. In G1, Dancy tangerine separated from the other accessions. In G2, Sweet lime and Citron; in G3, Grapefruit; in G4, Pummelo and in G5, Pear-shaped lemon and Lisbon lemon separated from others. In G6, Deperse lime, four accessions of Mexican lime, Bearss lime, IFJAn1, IFJAn2, IAC and Tahiti lime detached from the other Persian limes with 0.57 SC (Figure 3). G7 clade was consisting the accessions of Persian lime that it has been recently propagated in south of Iran

Genetic diversity in persian lime (Citrus latifolia Tanaka) accessions … 227
(Fars province) and it has been planted in both Fars and Hormozgan provinces. Pairwise similarity coefficient among mentioned accessions varied from 0.73-0.96 (Figure 3).
Figure 3: Dendrogram designed for 26 citrus accessions using ISSR markers based on Complete algorithm and Dice similarity coefficient.
Deperse lime, Bearss lime, Tahiti lime, IAC and PL are well-known
accessions among the studied PL accessions which have been introduced to Iran from other countries. The other PL accessions in the present study have been propagated by budding method using the collected scions from genetically-unknown mother plants cultivated in Fars province.
The lowest similarity coefficient (0.57) was observed between Deperse lime and the other PL accessions (Deperse lime was placed in a separate clade of G6). However, IHRA1 and PL had the highest similarity coefficient (0.96). Bearss lime had the greatest similarity coefficient (0.78) with Tahiti lime, IAC, IFJAn1 and IFJAn2. Tahiti lime had high similarity (0.79) with IAC, IFJAn1 and
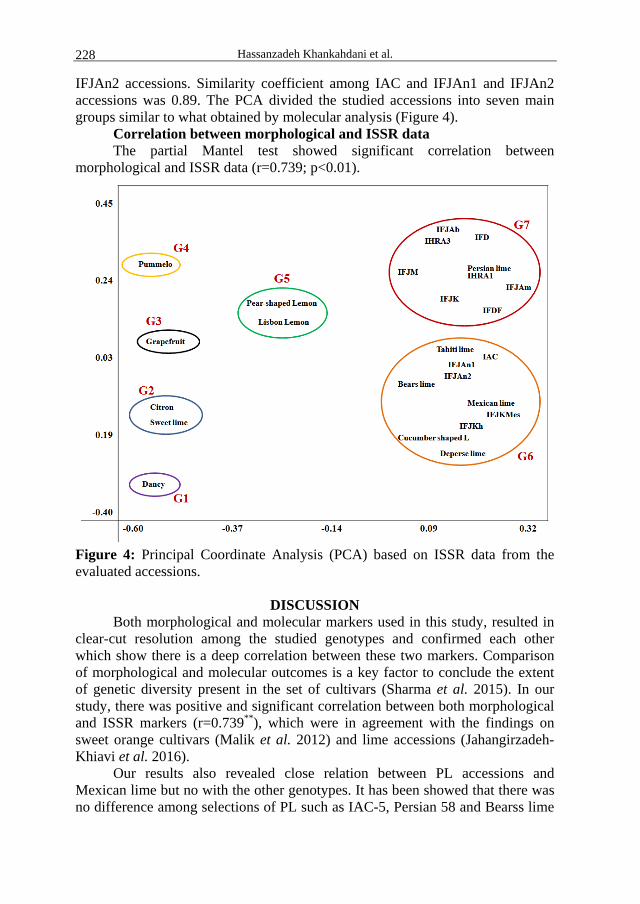
Hassanzadeh Khankahdani et al. 228
IFJAn2 accessions. Similarity coefficient among IAC and IFJAn1 and IFJAn2 accessions was 0.89. The PCA divided the studied accessions into seven main groups similar to what obtained by molecular analysis (Figure 4).
Correlation between morphological and ISSR data The partial Mantel test showed significant correlation between
morphological and ISSR data (r=0.739; p<0.01).
Figure 4: Principal Coordinate Analysis (PCA) based on ISSR data from the evaluated accessions.
DISCUSSION Both morphological and molecular markers used in this study, resulted in
clear-cut resolution among the studied genotypes and confirmed each other which show there is a deep correlation between these two markers. Comparison of morphological and molecular outcomes is a key factor to conclude the extent of genetic diversity present in the set of cultivars (Sharma et al. 2015). In our study, there was positive and significant correlation between both morphological and ISSR markers (r=0.739**), which were in agreement with the findings on sweet orange cultivars (Malik et al. 2012) and lime accessions (Jahangirzadeh-Khiavi et al. 2016).
Our results also revealed close relation between PL accessions and Mexican lime but no with the other genotypes. It has been showed that there was no difference among selections of PL such as IAC-5, Persian 58 and Bearss lime
Genetic diversity in persian lime (Citrus latifolia Tanaka) accessions … 229
(Santos et al. 2013), which is not according to our findings. It has been believed PL is not a separate species, but is a natural hybrid of the group formed by citron-lemon-lime. In Brazil and Florida, USA, it is known as Tahiti lime and in California, USA, as Bearss lime (Rivera-Cabrera et al. 2010). In the present study, the obtained similarity coefficient from ISSR data between lime (Persian and Mexican) and lemons accessions (Lisbon lemon and Pear-shaped lemon) was 0.45, which is in accordance to the findings of other researchers (Santos et al. 2013). They reported a separation between lemon and acid lime trees.
The similarity coefficient from ISSR analyses were 0.86-0.94 between Mexican lime and three unknown lime accessions i.e. IFJKMes, IFJKh and Cucumber-shaped lime. The above mentioned accessions are similar to Mexican lime and they have been derived from sexual propagation of Mexican lime. It has been reported that Cucumber-shaped lime probably generated from hybridization limes and lemons accessions; however, it had far genetic distance from lemons (Shahsavar et al. 2007). Mexican lime was propagated by seed in Iran. Mexican lime seeds are poly-embryonic (Momtaz-Khan et al., 2017), in which one of the embryos has sexual origin and the others result from nucellar tissue of embryo sac. Accordingly, high variation is seen among these seed born accessions and it has been used as a potential tool in WBDL resistance trials. Similarity coefficients between Mexican lime and PL accessions (known and unknown accessions) were 0.57-0.71. Other scholars placed Mexican lime and Tahiti lime in the same cluster with 0.82 SC (Shahsavar et al. 2007).
Tahiti lime resulted from lime by citron or lemon hybridization but they could not recognize its triploid status (Reece and Childs 1962). The identity of Persian, Tahiti and Bearss limes are explained by their diffusion (Morton, 1987). It has been reported that Tahiti lime has been obtained through bud sport selection (Qin et al. 2015). It has been found Citrus latifolia accessions (Tahiti, Bears, Persian, El-Kseur and IAC-5) probably resulted from the fertilization of a haploid gamete of C. limon by a diploid gamete of C. aurantifolia (Curk et al. 2016). Based on our unpublished data, all of the morphological accessions attributed to PL were triploid while Mexican lime, IFJKMes, IFJKh, and Cucumber-shaped lime were diploid.
CONCLUSION Rapid prevalence of WBDL in the south of Iran and high susceptibility of
Mexican lime to that resulted in demanding a WBDL-resistant lime species. PL is a WBDL-resistant lime species which has been considered greatly by farmers for replacing Mexican lime. However, apart from its desired properties, no documented information is available about it. Molecular analysis of PL accessions using ISSR primers revealed divergence of Deperse lime from the other PL accessions. Tahiti lime, Bearss lime, IAC and two morphologically related accessions to PL namely IFJAn1 and IFJAn2 had close relation and placed in the same clade. The other accessions attributed to PL including IFDF, IHRA1, IFJAm, IFJK, IFJAb, IHRA3, IFJM and IFD also placed in the same

Hassanzadeh Khankahdani et al. 230
clade beside PL accession. On the other hand, three accessions related to Mexican lime including IFJKh, IFJKMes and Cucumber-shaped lime had close relation with Mexican lime and high similarity coefficient. Generally, according to both morphological and ISSR markers, the control accessions separated from other accessions. Mexican lime accessions including Mexican lime, IFJKh, IFJKMes and Cucumber-shaped lime placed into the same clade. As we expected, Persian and Mexican lime accessions showed close genetic relation. The most striking result to emerge from the data was highly correlation between morphological and ISSR outcomes, which was supported phylogenetic clustering.
ACKNOWLEDGMENT
This work was a section of enormous design to obtain technical knowledge and production of lime tolerant cultivars against WBDL and to start and revenue from genetic resources of Iran’s lime under design no. 11.65555, which was supported by Vice-Presidency for Science and Technology.
REFERENCES Curk F, Ollitrault F, Garcia-Lor A, Luro F, Navarro L, Ollitrault P. 2016.
Phylogenetic origin of limes and lemons revealed by cytoplasmic and nuclear markers. Ann Bot-London, 1-19.
Edwards K, Johnstone C, Thompson C. 1991. Simple rapid method for the preparation of plant genomic DNA for PCR analysis. Nucleic Acids Res., 19(6): 1349.
Golein B, Ghasemi M, Fattahi Moghadam J, Gholamian E. 2013. Genetic analysis between unknown citrus accessions and commercially important cultivars using ISSR marker. Agri Biotech J., 5(4): 111-124. (In Persian with English abstract)
IPGRI. 1999. Descriptors for Citrus. International Plant Genetic Resources Institute, Rome, Italy.
Jahangirzadeh-Khiavi S, Hamidpghli Y, Golein B, Sabouri A. 2016. Assessment of lime genetic diversity in three regions of Iran, using morphological and ISSR markers. Agri Comm., 4(3): 18-29.
Jensen J, Bohonak A, Kelley S. 2005. Isolation by distance, web service, Version 3.23. BMC Genet., 6: 13.
Malik S, Rohini M, Kumar S, Choudhary R, Pal D, Chaudhury R. 2012. Assessment of genetic diversity in Sweet orange cultivars of India using morphological and RAPD markers. Agri Res., 1: 317-324.
Martasari C, Karsinah R. 2012. Characterization of Indonesian Siam cultivar by morphological and ISSR markers. ARPN J Agri Biol Sci., 7(10): 830-835.
Momtaz-Khan M, Yahyai R, Al-Said F. 2017. Introduction and overview of Lime. CAB International, 11 pp.
Morton J. 1987. Tahiti Lime. In: Morton JF, ed. Fruits of warm climates. Miami, FL. Qin Y, Xu C, Ye Z, DaSilva J, Hu G. 2015. Seedless mechanism of a new citrus
cultivar Huami Wuhegonggan. Pakistan J Bot., 47(6): 2369-2378.
Genetic diversity in persian lime (Citrus latifolia Tanaka) accessions … 231
Reece P, Childs J. 1962. Character differences among seedlings of the Persian lime. P Fl St Hortic Soc., 75: 110-116.
Rivera-Cabrera F, Ponce-Valadez M, Sanchez F, Villegas-Monter A, Perez-Flores L. 2010. Acid limes; a review. Fresh Produce, Global Sci Books, 4(1): 116-122.
Rohlf F. 2005. NTSYS-pc, numerical taxonomy and multivariate analysis system. Version 2.02. Exeter Software, Setauket, New York.
Roldan-Ruiz I, Calsyn E, Gilliland T, Coll R, vanEijk M, DeLoose M. 2000. Estimating genetic conformity between related ryegrass varieties. 2. AFLP characterization. Mol Breeding, 6: 593-602.
Salehi M, Nejat N, Tavakoli A, Izadpanah K. 2005. Reaction of Citrus cultivars to Candidatus Phytoplasma aurantifolia in Iran. Plant Dis., 41: 363-376. (In Persian with English abstract)
Santos M, Passos O, Soares Filho W, Girardi E, Gesteira A, Ferreira C. 2013. Variability analysis of Persian acid lime tree selections using agronomic and molecular markers. Genet Mol Res., 12(4): 4604-4614.
Shahsavar A, Izadpanah K, Tafazoli E, Sayed Tabatabaei B. 2007. Characterization of citrus germplasm including unknown variants by ISSR markers. Sci Hortic-Amsterdam, 112: 310-314.
Sharma N, Dubey A, Srivastav M, Singh B, Singh A, Singh N. 2015. Assessment of genetic diversity in grapefruit cultivars using physico-chemical parameters and microsatellite markers. Aust J Crop Sci., 9(1): 62-68.
Singh D. 1981. The relative importance of characters affecting genetic divergence. Indian J Genet Pl Br., 41: 237-245.
Tripolitsiotis C, Nikoloudakis N, Linos A, Hagidimitriou M. 2013. Molecular characterization and analysis of the Greek citrus germplasm. Not Bot Horti Agro., 41(2): 463-471.
Uzun A, Gulsen O, Yesiloglu T, Aka-cakar Y, Tuzcu O. 2010. Distinguishing grapefruit and pummelo accessions using ISSR markers. Czech J Genet Pl Br., 46(4): 170-177.

Agriculture and Forestry, Vol 63, Issue 3: 233-234, Podgorica, 2017 233
INSTRUCTIONS TO AUTHORS The "Agriculture and Forestry" journal publishes original scientific papers, review
papers, short communications on agriculture, veterinary medicine, forestry, biology and other natural sciences. It is the endeavour of the journal to give place to papers of high scientific quality and international interest, authored by all the scientists from the South Eastern European Region, as well as other international scientist in order to stimulate contacts and exchange of knowledge fostering scientific productivity.
Manuscripts, submitted via electronic journal web system should be prepared in Microsoft Word (Times New Roman font, 11 pt) and submitted in format 17 x 24 cm (File / Page setup / Paper / Width = 17 cm; Height = 24 cm), with single line spacing (Format / Paragraph / Line spacing = Single), 2 cm margins all around (File / Page setup / Margins / Top = 2 cm; Bottom = 2 cm; Left = 2 cm; Right = 2 cm), that is approximately 44 lines per page in this format. All technical details are available in section AUTHORS / Check-list for Authors.
Manuscripts are published in English. Papers that have been published elsewhere, in whole or extracts (excerpts) of their important findings, will not be accepted. A manuscript should not exceed 10 pages. Exceptions can be made if content and quality of the paper justify it (at the discretion of the Editor). Full research papers should include the following sections: - Author/s name/s, Title with DOI number The author's name should be placed above the title and with the author's appellation and affiliation in a footnote at the bottom of the front page. Author(s) affiliation should indicate name and address of institution, including the e-mail address of the corresponding author. Title should provide a concise but also an informative synthesis of the study (recommended not more than 100 characters including spaces). Short title (not more than 70 characters) should also be provided in order to be included in the header of the Manuscript. Ensure that the title contains the most important words that relate to the topic. - Abstract The summary, in English language, should provide basic data on the problem that was treated and the results obtained. It should be brief, preferably one paragraph only, up to 250 words, but sufficient to inform the reader of the character of the work, its results and its conclusions. Include the keywords and phrases you repeated in your abstract. - Key words Keywords should provide 4-6 words or compound words, suitable for an information retrieval system. Choose the appropriate keywords and phrases for your article. Think of a phrase of 2-4 words that a researcher might search on to find your article. Repeat your keywords and phrases 3-4 times throughout the abstract in a natural, contextual way. Main text of the manuscript includes the following sections: - INTRODUCTION
The introduction should answer the questions what was studied, why was it an important question, what was known about it before and how the study will advance our knowledge.
- MATERIAL AND METHODS Material and methods explain how the study was carried: the organism(s) studied; description of the study site, including the significant physical and biological features, and the precise location (latitude and longitude, map, etc); the

Instructions to authors 234
experimental or sampling design; the protocol for collecting data; how the data were analyzed. In this section also should be provided a clear description of instruments and equipment, machines, devices, chemicals, diagnostic kits, plants/animals studied, technology of growing/housing, sampling sites, software used etc.
- RESULTS followed by DISCUSSION Results and Discussion may be combined into a single section (if appropriate) or it can be a separate section. The results objectively present key results, without interpretation, in an orderly and logical sequence using both text and illustrative materials (tables and figures). The discussion interpret results in light of what was already known about the subject of the investigation, and explain new understanding of the problem after taking results into consideration. The International System of Units (SI) should be used.
- CONCLUSIONS The conclusion should present a clear and concise review of experiments and results obtained, with possible reference to the enclosures.
- ACKNOWLEDGMENTS If received significant help in designing, or carrying out the work, or received materials from someone who did a favour by supplying them, their assistance must be acknowledged. Acknowledgments are always brief and never flowery.
- REFERENCES (LITERATURE) References should cover all papers cited in the text. The in-text citation format should be as follows: for one author (Karaman, 2011), for two authors (Erjavec and Volk, 2011) and for more than two authors (Rednak et al., 2007). Use semicolon (Rednak et al., 2012; Erjavec and Volk, 2011) to separate multiple citations. Multiple citations should be ordered chronologically. The literature section gives an alphabetical listing (by first author's last name) of the references. More details you can find in the Annex to the INSTRUCTIONS TO AUTHORS / Bibliographic style on the web page of the Journal: www.agricultforest.ac.me.
Short communication should include the following sections: Title, Abstract, Key words, Main text, Acknowledgments, References, Tables and Figures with captions.
SUPPLY OF ARTWORK, PHOTOS: Diagrams and graphs should be provided as finished black and white line artwork or colour images. Electronic graphics included in your manuscript should be either inserted in the word document or as .gif or .jpg formats. Please check with the editor if you wish to submit any other type of graphic for conversion suitability. Photos should be supplied un-screened in original form or in electronic form. All illustration (diagrams, graphs, tables, photos) must be fully captioned. When there are a number of illustrations, the author should endeavour to reduce the amount of text to accommodate the illustrations in the limited space available for any article.
THE REVIEW PROCESS: Submitted manuscripts are reviewed anonymously by 2 referees (duble blind review): one from the journal Editorial board, one must be an international reviewer, working out of the University of Montenegro. All tracking of manuscripts and reviewers is done by the Editor. All attempts will be made to ensure submissions will be reviewed within three months after the submission. Manuscripts will be returned to the coresponding authors when each review is completed.
Examples available on www.agricultforest.ac.me.


![20171003 Newsletter CISDI revYY · [banner] tujuan pembangunan berkelanjutan (sdg) inisiatif [banner] peta kemitraan website upcoming event [banner] indonesia’s youth food forum](https://static.fdocuments.net/doc/165x107/5cd36c3288c99316318b5640/20171003-newsletter-cisdi-banner-tujuan-pembangunan-berkelanjutan-sdg-inisiatif.jpg)


![· 26 fd.n. 63 27 in. 63 29 63 30 ffn. 63 30 in. 63 30 ffn. 63 31 fJ.n. 63 01 111.8. 63 02 63 04 gxJ.tJ. 63 63 08 63 08 63 10 111.8. 63 11 63 08 63 19 f].n. 63 25 fin. 63 25 ffn.](https://static.fdocuments.net/doc/165x107/60108244c72a76533f3ba5ab/26-fdn-63-27-in-63-29-63-30-ffn-63-30-in-63-30-ffn-63-31-fjn-63-01-1118.jpg)