8630 Cast Steel
17
Fatigue of 8630 cast steel in the presence of porosity K. M. Sigl {, R. A. Hardin, R. I. Stephens and C. Beckermann* Department of Mechanical and Industrial Engineering, The University of Iowa, Iowa City, IA 52242, USA Fatigue and monotonic test specimens having porosity ranging from micro- to macroscopic levels were cast from 8630 steel. Monotonic and fatigue properties were obtained to determine the effect of porosity on the mechanical performance of the cast steel. Axial fatigue tests were conducted under fully reversed conditions in both strain and load control on specimens containing microporosity, and in load control for specimens containing macropores. Monotonic tests revealed that specimens containing microporosity had strength prop- erties comparable to sound material, but with substan- tially reduced ductility (76% less reduction in area). At stress amplitudes of 126 MPa, microporosity speci- mens were found to have lives greater than 5 million cycles (run-out) whereas macroporosity specimens had fatigue lives in the 10 2 –10 4 cycle range at the same stress level. Fatigue lives for macroporosity specimens were in a range from 10 4 to 10 6 cycles when tested at the lowest stress amplitude, 53 MPa. The measured specimen elastic modulus was found to vary with porosity volume. Specimens with higher measured modulus outperformed the lower modulus specimens. Fatigue lives of the cast steel specimens were calculated using conventional models of fatigue behaviour, the strain–life and linear elastic fracture mechanics (LEFM) approaches. Life calculations made using the strain–life approach gave good agreement with measurements for specimens having microporosity, but this approach gave non-conservative results for macro- porosity. LEFM modelling gave non-conservative results for both micro- and macroporosity specimens. For specimens with macroporosity, the calculations are difficult because of the porosity’s complex shape and large size relative to the specimen, and the inability to determine the specific macropores responsible for fatigue failure of the specimens which is necessary for direct model-measurement comparisons. IJCMR/514 # 2004 W. S. Maney & Son Ltd. Manuscript received 27 January 2004; accepted 20 April 2004. Keywords: Porosity; Cast steel; Fatigue; Strain-life; Fracture mechanics Introduction Porosity in steel castings is a central concern of foundries. It results if there is insufficient liquid metal to feed a casting section as molten steel contracts during solidification and dissolved gases come out of solution. All porosity can be detrimental to strength and fatigue life of cast components because the pores act as stress risers within the casting and cracks can nucleate at pores leading to fracture. Despite this, the quantitative impact of porosity on the fatigue behaviour of steel castings is not fully understood, and there is no well accepted method to predict the effect of porosity on casting performance. As a consequence, design engineers have little choice but to use overly large safety factors in many designs, resulting in over-designed, heavy and expensive castings leading to increased costs and lead time, while decreasing casting yield and productivity. Other important features of the metal, such as microstruc- ture, grain size, segregation at grain boundaries, and inclusions influence the fatigue and fracture beha- viour as well, and these effects compete with one another and porosity. However, the objective of the current work is to study the relative effects of only micro- and macroporosity on fatigue behaviour of cast steel, and investigate models to predict their effects. Since there are no performance-based guidelines for design of cast components where the amount or location of porosity is considered, it is difficult to assess during the design stage whether a cast component will be produced at a high enough quality level to meet its performance requirements. Con- versely, a casting might be designed and specified at too high a quality level resulting in an over-designed, over-priced part. Current criteria for the acceptance or rejection of steel castings, such as the ASTM standard casting radiographs, 1–3 define only the ‘qualitative’ amount of porosity allowed in a casting. These standards consider only the relative amount of radiographically detectable macroporosity present in the casting and not the location or the size of the porosity contained within the casting and its relation- ship to the design. Furthermore, the radiographic standards do not address microporosity which may be undetectable, but is known to have a detrimental effect on material properties. In the case of micro- porosity, the engineering approach investigated in this work is to predict the formation of microporosity during the casting process and, then, to design the part considering the impact of microporosity on performance using fatigue and/or fracture mechanics principles. The size and location of porosity and the loading conditions have been shown to influence the fatigue strength and fatigue life of various castings with *Corresponding author, email christoph-beckermann@uiowa. edu {Present address: Lockheed Martin Aeronautics Company, P.O. Box 748, Fort Worth, TX 76101 130 International Journal of Cast Metals Research 2004 Vol. 17 No. 3 DOI 10.1179/136404604225020588
-
Upload
catweazle999 -
Category
Documents
-
view
82 -
download
0
description
8630 steel casting grade
Transcript of 8630 Cast Steel
Fatigue of 8630 cast steel in the presence ofporosity
KM Sigl R A Hardin R I Stephens and C BeckermannDepartment of Mechanical and Industrial Engineering The University of Iowa Iowa City IA 52242 USA
Fatigue and monotonic test specimens having porosityranging from micro- to macroscopic levels were castfrom 8630 steel Monotonic and fatigue properties wereobtained to determine the effect of porosity on themechanical performance of the cast steel Axial fatiguetests were conducted under fully reversed conditions inboth strain and load control on specimens containingmicroporosity and in load control for specimenscontaining macropores Monotonic tests revealed thatspecimens containing microporosity had strength prop-erties comparable to sound material but with substan-tially reduced ductility (76 less reduction in area) Atstress amplitudes of 126 MPa microporosity speci-mens were found to have lives greater than 5 millioncycles (run-out) whereas macroporosity specimens hadfatigue lives in the 102ndash104 cycle range at the samestress level Fatigue lives for macroporosity specimenswere in a range from 104 to 106 cycles when tested atthe lowest stress amplitude 53 MPa The measuredspecimen elastic modulus was found to vary withporosity volume Specimens with higher measuredmodulus outperformed the lower modulus specimensFatigue lives of the cast steel specimens were calculatedusing conventional models of fatigue behaviour thestrainndashlife and linear elastic fracture mechanics(LEFM) approaches Life calculations made usingthe strainndashlife approach gave good agreement withmeasurements for specimens having microporosity butthis approach gave non-conservative results for macro-porosity LEFM modelling gave non-conservativeresults for both micro- and macroporosity specimensFor specimens with macroporosity the calculations aredifficult because of the porosityrsquos complex shape andlarge size relative to the specimen and the inability todetermine the specific macropores responsible forfatigue failure of the specimens which is necessary fordirect model-measurement comparisons IJCMR514
2004 W S Maney amp Son Ltd Manuscript received 27January 2004 accepted 20 April 2004
Keywords Porosity Cast steel Fatigue Strain-life Fracturemechanics
Introduction
Porosity in steel castings is a central concern offoundries It results if there is insufficient liquid metalto feed a casting section as molten steel contracts
during solidification and dissolved gases come out ofsolution All porosity can be detrimental to strengthand fatigue life of cast components because the poresact as stress risers within the casting and cracks cannucleate at pores leading to fracture Despite this thequantitative impact of porosity on the fatiguebehaviour of steel castings is not fully understoodand there is no well accepted method to predict theeffect of porosity on casting performance As aconsequence design engineers have little choice but touse overly large safety factors in many designsresulting in over-designed heavy and expensivecastings leading to increased costs and lead timewhile decreasing casting yield and productivity Otherimportant features of the metal such as microstruc-ture grain size segregation at grain boundaries andinclusions influence the fatigue and fracture beha-viour as well and these effects compete with oneanother and porosity However the objective of thecurrent work is to study the relative effects of onlymicro- and macroporosity on fatigue behaviour ofcast steel and investigate models to predict theireffects
Since there are no performance-based guidelinesfor design of cast components where the amount orlocation of porosity is considered it is difficult toassess during the design stage whether a castcomponent will be produced at a high enough qualitylevel to meet its performance requirements Con-versely a casting might be designed and specified attoo high a quality level resulting in an over-designedover-priced part Current criteria for the acceptanceor rejection of steel castings such as the ASTMstandard casting radiographs1ndash3 define only thelsquoqualitativersquo amount of porosity allowed in a castingThese standards consider only the relative amount ofradiographically detectable macroporosity present inthe casting and not the location or the size of theporosity contained within the casting and its relation-ship to the design Furthermore the radiographicstandards do not address microporosity which may beundetectable but is known to have a detrimentaleffect on material properties In the case of micro-porosity the engineering approach investigated inthis work is to predict the formation of microporosityduring the casting process and then to design thepart considering the impact of microporosity onperformance using fatigue andor fracture mechanicsprinciples
The size and location of porosity and the loadingconditions have been shown to influence the fatiguestrength and fatigue life of various castings with
Corresponding author email christoph-beckermannuiowaedu
Present address Lockheed Martin Aeronautics CompanyPO Box 748 Fort Worth TX 76101
130 International Journal of Cast Metals Research 2004 Vol 17 No 3 DOI 101179136404604225020588
larger pores in the higher tensile stress fields resultingin shorter fatigue lives4ndash8 The primary methods tocalculate fatigue lives of cast specimens containingporosity involve modelling pores as equivalentnotches or cracks479ndash12Modelling of pores as ellipticalor semi-elliptical cracks is the most common tech-nique but modelling pores as three-dimensionalellipsoidal notches has also been evaluated9 Model-ling pores as three-dimensional notches uses a localstrain model to calculate the fatigue lives ofcomponents The local strain model assumes thatcrack nucleation encompasses the majority of the lifeof the component Linear elastic fracture mechanicsLEFM is used to model pores as pre-existing crackswithin the component and assumes that crack pro-pagation will consume the majority of the fatigue life
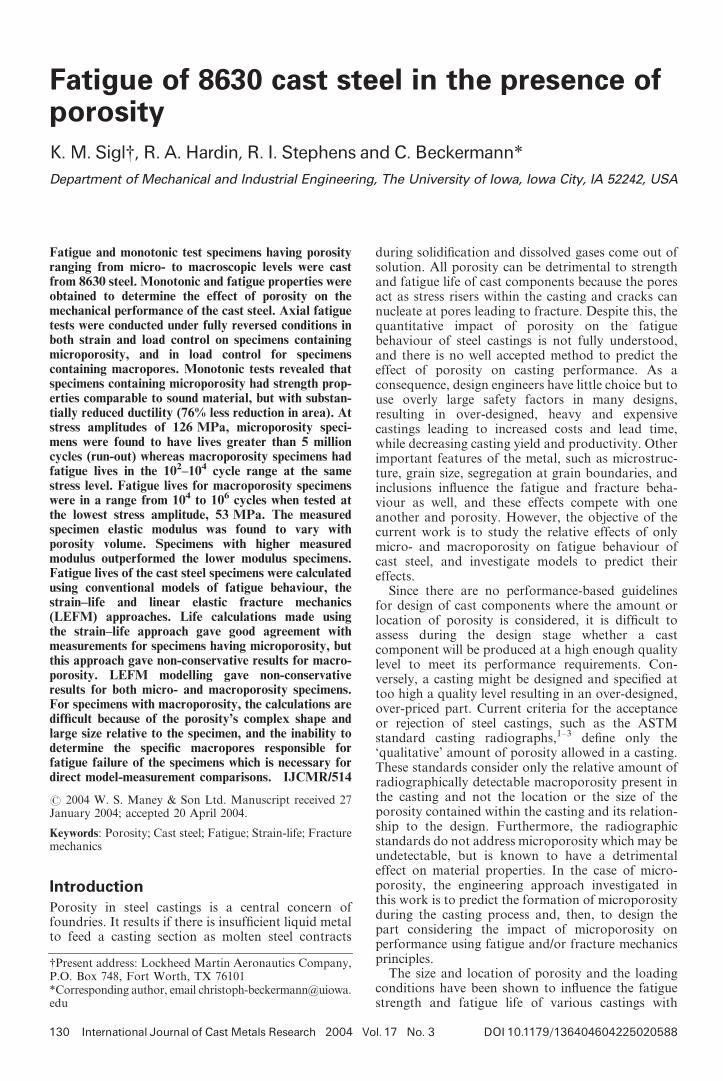
In this investigation the effects of porosity on thefatigue behaviour of axially loaded 8630 quenched andtempered cast steel specimenwere obtained Then typicalmethods were used to calculate the fatigue lives of thespecimens A recently developed porosity predictionalgorithm was used to design and produce cast speci-mens having a wide range of porosity as shown inFig 113 This algorithm has been implemented withinthe commercial casting simulation software MAGMA-soft as a software module14 This computational toolpredicts the location volume percentage and size ofporosity in castings ranging from radiographicallyundetectable microporosity to macroporosity Fourcasting geometries were designed with this software toproduce specimens with three levels of radiographicallydetectable macroporosity (termed lsquoleastrsquo lsquomiddlersquo andlsquomostrsquo) and test specimens with only microporosityOther than porosity level the as cast specimen blankswere produced to reduce as much as possible theirvariability in microstructure and inclusion content bycasting them from the same heat of metal with all typesof specimens together in the same mould box and heattreating them all together Fatigue testing in accordancewith ASTM standards was then performed using 10stressstrain amplitudes for 14 microporosity specimensand four stress amplitudes for 25 macroporosity speci-mens Fractography andmicroscopy were conducted onthe fracture surfaces using a scanning electron micro-scope SEM upon completion of mechanical testing
Microscopy work was conducted on fracturesurfaces and cut and polished sections of themicroporosity and macroporosity porosity speci-mens Analysis was conducted on both the macro-and microscopic levels using microporosity specimensand specimens from each macroporosity porositygroup to understand the fracture morphology andpore geometry Regions of fatigue crack nucleationand growth were of particular interest and werestudied to determine the actual cause of failureDetermination of the pore sizes shapes and locationsresponsible for specimen failure are required infatigue life calculations Microscopy was performedto obtain what could be considered average poregeometries and volumes from ground surfaces fromwithin the gage sections of the specimen groups Thisinformation combined with the crack nucleation datagathered from fractography was used to calculatespecimen fatigue life Calculated and experimentalspecimen fatigue lives were then compared
Experimental procedure
Test specimens
Test specimens used in this investigation wereprepared from AISI 8630 quenched and tempered
1 Typical comparison between a radiographs ofspecimen blanks and b computer model predic-tions of specimen blanks porosity volumepercentages
Sigl et al Fatigue of 8630 cast steel in the presence of porosity 131
International Journal of Cast Metals Research 2004 Vol 17 No 3
cast steel The composition (wt-) was 093 Mn 066Si 050 Ni 048 Cr 029 C 027 Mo 0045 Al 0022 Sand 0027 P Microporosity specimen blanks (Fig 2a)were cast with reservoirs of molten steel at the ends ofthe blank with a narrow gage section located in thecentre in an attempt to minimise the occurrence ofmacroshrinkage in the casting Specimen blanks withmacroporosity (Fig 2b) were cast as 14 mm diacylinders with an approximate 25 mm dia disc locatedat the mid-length of the casting to create a hot spotwhere the porosity would form The amount ofporosity in the casting was controlled by changingthe thickness of the central disc with more porosityoccurring in the castings with thicker discs Castingsimulation (Fig 1b) predicts a maximum porosity ofapproximately 05 in the gage section of themicroporosity specimen blanks and a porosity rangebetween 2 and 25 in the macroporosity specimenblanks depending on the central disc thickness
All cast blanks received identical heat treatmentnormalised at 900uC austenised at 885uC waterquenched and finally tempered for 15 h at 510uCThis heat treatment resulted in a tempered martensiticstructure with a Rockwell C hardness of 34 This heattreatment matched that used on the 8630 steel testedin a 1982 Steel Foundersrsquo Society of America (SFSA)study15 to produce specimens having the samematerial properties as this baseline data Specimensused in the 1982 SFSA report were machined fromlarge cast trapezoidal-shaped keel blocks and datafrom the report15 will be referred to as lsquosoundrsquospecimen data throughout the remainder of thispaper After heat treatment each cast specimen blankwas machined into a round test specimen with thefinal polished dimensions shown in Fig 3 Machiningfollowed the ASTM E60616 standard that providesguidelines for specimen preparation geometry finalsurface finish and uniformity
The machined specimens were examined throughvisual inspection and radiographic analysis to
determine a qualitative measure of the porositypresent in each casting group Typical radiographsof selected specimens are shown in Fig 4 Visualinspection showed that two of the 15 microporosityspecimens and 27 of the 29 specimens with macro-porosity had exposed pores at the specimen surfaceNo porosity was detectable in the radiographs of themicroporosity specimens they appeared to be radio-graphically sound The micropores were too small(v200 mm diameter) to be detectable by the radio-graphic analysis used Based on the radiographs ofthe macroporosity specimens it was observed that thelsquoleastrsquo and lsquomiddlersquo porosity groups contained verysimilar amounts of macroporosity with pore radii ofapproximately 075 mm The lsquomostrsquo porosity group ofspecimens showed the presence of even larger voidsIn a study of the ASTM standard radiographs17 itwas shown that the equivalent radii of the porosity inthe radiographs (determined by two times the area ofa radiographic indication divided by its circumfer-ence) were in a range from 06 to 11 mm over all fiveASTM levels of porosity severity For the three lowestlevels of porosity in the ASTM standard radiographs(including all types A B and C) it was found thatthe average equivalent radius of porosity wasapproximately 075 mm17 which agrees well with
a microporosity specimen blanks b macroporosityspecimen blanks
2 Dimensions of cast blanks in millimetresDimension lsquoXrsquo~5 75 and 10 mm for lsquoleastrsquolsquomiddlersquo and lsquomostrsquo macroporosity specimengroups respectively
3 Final dimensions of fatigue specimens inmillimetres
4 Radiograph images of a microporosity speci-mens b lsquoleastrsquo macroporosity specimens clsquomiddlersquo macroporosity specimens and d lsquomostrsquomacroporosity specimens
132 Sigl et al Fatigue of 8630 cast steel in the presence of porosity
International Journal of Cast Metals Research 2004 Vol 17 No 3
observations of the lsquoleastrsquo and lsquomiddlersquo porositygroups examined here It was concluded17 that thetypical size of macropores detected through theASTM Standards1ndash3 was about 075 mm with largersizes forming in worse porosity through the mergingof pores
Mechanical testing
Testing was performed using a 100 kN closed loopservo-hydraulic test system All fatigue tests wereperformed under fully reversed (R~21) loadingconditions The alignment of the load frame grippingfixtures was verified according to ASTM StandardPractice E1012 Type A Method 1 and meeting therequirements of ASTM E606 which requires that lsquothemaximum bending strains so determined should notexceed 5 of the minimum axial strain range imposedduring any test programrsquo1618
Monotonic and fatigue property data of the 8630steel with microporosity were obtained first beforethe macroporosity specimens Monotonic tests wereconducted in displacement control following standardASTM E08 that provides guidelines on specimenpreparation geometry surface finish diameter mea-surement test machine preparation grips alignmentrate of testing and determination of tensile proper-ties19 Testing procedures for strain controlled lowcycle fatigue (LCF) tests outlined in ASTM E606that provides guidelines for alignment calibrationgrips transducers fixtures cycle counting extens-ometers test environment wave form frequencynumber of specimens and failure criteria werefollowed to gather the needed cyclic and fatigueproperties16 Tests conducted in strain control hadconstant strain rates of 001 s21 with frequenciesvarying between 025 and 125 Hz At smaller strainamplitudes the behaviour of the specimens waspredominantly elastic making it possible to approx-imate strain amplitudes using load control Cyclingspecimens in load control allowed the testing speed tobe increased to 10ndash30 Hz with lower frequencies usedfor higher stress amplitudes
All lsquoleastrsquo lsquomiddlersquo and lsquomostrsquo macroporosityspecimens were run in load control at 10ndash20 HzThe extensometer was also used on these tests toproduce readings for the elastic modulus E Thesedata were collected to determine whether a relation-ship between the apparent elastic modulus and theporosity volume measured from the radiographscould be established Specimens with macroporositywere tested at four different stress levels with the firststress level chosen as 126 MPa note this was the run-out stress amplitude for the specimens with micro-porosity The second stress level of 66 MPa waschosen by converting the strainndashlife endashN curve of themicroporosity specimens to a stressndashlife SndashN curveand then shifting this curve down to the lives of thespecimens with macroporosity previously tested Thisadjusted SndashN curve was then used to estimate stressamplitude and lives of the specimens with macro-porosity The goal was to obtain a life on the order of106 cycles without a run-out occurring The remainingstress levels were chosen to fill in gaps within themacroporosity specimen data All fatigue tests were
performed until fracture of the specimen occurred ora run-out life was achieved at 56106 cycles
Experimental results
Monotonic testing
Monotonic material tensile properties were obtainedfrom two microporosity specimens with the averageresults shown in Table 1 In this table the ultimatetensile strength Su yield strength Sy YoungrsquosModulus E per cent reduction of area RA percent elongation EL true fracture strength sf truefracture ductility ef strength coefficient K and strainhardening exponent n are given for the microporosityspecimens Only values for Su Sy E RA sf and efmay be compared to the sound specimen data15 sinceEL K and n were not given in the earlier studyMonotonic tensile stressndashstrain curves for the speci-mens with microporosity are shown in Fig 5 As isevident in Table 1 both the sound and microporositymaterial gave similar properties for E Su and Syfound by the 02 offset method The RA for themicroporosity specimens was found to be 76 lowerthan the RA for the sound specimens Neithermonotonic microporosity test specimen showed signsof necking and in conjunction with small values ofRA and EL these tests indicate that the speci-mens with microporosity exhibited low ductility
Table 1 8630 steel monotonic properties
Property Micropore material avg Sound material15
Su MPa 1125 1144Sy MPa 1088 985E GPa 197 207EL 25 ^RA 70 29sf MPa 1156 1268ef 0073 035K MPa 1307 ^n 00279 ^
Not thearithmeticmeanbut thebest fit regression to theaggregatedata
5 Monotonic and cyclic stressndashstrain curves ofmicroporosity specimens
Sigl et al Fatigue of 8630 cast steel in the presence of porosity 133
International Journal of Cast Metals Research 2004 Vol 17 No 3
Microporosity specimen fatigue testing
Cyclic and fatigue material properties for the micro-porosity specimens are shown Table 2 and they areagain compared with the results for the soundspecimens15 The first two entries in Table 2 are thefatigue strength (or fatigue limit) Sf at 56106 cyclesand the fatigue ratio SfSu The fatigue ratio isreduced by more than a factor of 2 from the sounddata Via the lsquocompanionrsquo sample method the cyclicstressndashstrain curve shown in Fig 5 was generatedusing the approximate halflife stable hysteresis loopsfrom a series of fatigue tests run at six strainamplitudes ea In this process the tensile points(loop tips) of the stabilised hysteresis loops at thespecimen halflife are connected as shown in Fig 6 toform the curve In Fig 6 only four of the six strainamplitudes tested are discernible the lowest twostrain amplitudes collapse onto the curve forea~0004 The cyclic stressndashstrain curve is used todetermine the material properties which relate thenominal true stress and true strain ranges as given byequation (1)
De~DS
Ez2
DS
2K 0
1nrsquo
(1)
where the symbols DS and De are the nominal trueaxial stress and true axial strain respectively E isYoungrsquos modulus K9 is the cyclic strength coefficientand n9 is the cyclic strain hardening exponent Values
of these parameters are given in Table 2 for the soundand microporosity material The value of cyclic yieldstrength S9
y was found to be 894 MPa which is lessthan Sy (comparing Tables 1 and 2) indicating thatthe material cyclic softened Cyclic softening com-monly occurs with high strength materials and resultsin softening of the material as the cyclic loadingprogresses The majority of softening occurred withinthe first 10ndash20 of specimen life and then slowed toan approximate constant slope of decreasing maxi-mum stress in tension and increasing minimum stressin compression
A strain versus reversals to failure endash2Nf curve(Fig 7) was constructed from the plastic and elasticcurves which when summed produce the total endash2Nf
curve equation
De
2~
Dee2
zDep2
~srsquofE
(2Nf )bzersquof (2Nf )
c (2)
where De2 is the total strain amplitude Dee2 is theelastic strain amplitude Dep2 is the plastic strainamplitude s9f is the fatigue strength coefficient b isthe fatigue strength exponent e9f is the fatigueductility coefficient and c is the fatigue ductilityexponent The values for s9f b e9f and c from themicroporosity specimens are given in Table 2 andwere determined by a curve fit of the test dataComparison between the microporosity and sounddata in Table 2 reveals the largest difference to be thefatigue ductility coefficient In equation (2) the firstaddition term is the equation of the elastic strainamplitude curve and the second term is the equationof the plastic strain amplitude curve Many steelsbehave in a predominantly plastic manner under highstrain amplitudes and in a predominantly elasticmanner at lower strain amplitudes with a transitionpoint where the elastic and plastic curves cross It wasobserved that this transition point never occurred inthe microporosity specimens as the elastic strainamplitudes were always larger than the plastic strainamplitudes At strain amplitudes of 0004 and belowplastic strains were virtually nonexistent and the Dee2data points can be seen to fall directly on top of theDe2 data points
Table 2 8630 steel cyclic properties
Property Micropore material Sound material15
Sf MPa 126 293SfSu 011 026K9 MPa 2550 15022267n9 0167 01220195S9y MPa 894 682661
b 20176 20121c 20908 20693s9f MPa 2390 1936e9f 011 042
Data determined from the companion methodData determined from the companion and incremental stepmeth-ods respectively
6 Halflife hysteresis loops used to create cyclicstressndashstrain curve for microporosity specimens 7 Total elastic and plastic strainndashlife curves of
microporosity specimens
134 Sigl et al Fatigue of 8630 cast steel in the presence of porosity
International Journal of Cast Metals Research 2004 Vol 17 No 3
Macroporosity specimen fatigue testing
The fatigue test conditions and test results for allspecimens with macroporosity are given in Table 3They are grouped by lsquoleastrsquo lsquomiddlersquo and lsquomostrsquoporosity specimen geometry types and then fromlargest to smallest stress amplitude level within eachgroup Experimental fatigue results of the lsquoleastrsquolsquomiddlersquo and lsquomostrsquo macroporosity levels are shownin comparison to the microporosity specimens in thestressndashlife SndashN curve of Fig 8 Scatter bands aredrawn around each of the three porosity groups Thescatterbands for the lsquoleastrsquo and lsquomiddlersquo porositygroups show significant overlap indicating that thegroups had similar fatigue lives The scatterband forthe lsquomostrsquo porosity group falls farther to the left of the
lsquoleastrsquo and lsquomiddlersquo porosity groups and has fewerareas of overlap demonstrating generally lowerexperimental fatigue lives at the same stress levelNote that all of the macroporosity specimens hadconsiderably shorter fatigue lives than the lives of themicroporosity bearing material and were testedbelow the microporosity specimens fatigue limit forthe majority of the fatigue testing
A modulus of elasticity Emeas of each macropor-osity specimen was measured during testing todetermine whether the porosity level and measuredmodulus could be correlated It was also believed thatthis might serve as an indicator of porosity volumeThis lsquoapparentrsquo specimen modulus is reduced from themodulus of sound specimens by the lost sectionthickness associated with porosity The modulus ofthe microporosity test specimens was only 5 lowerthan the sound data15 as seen in Table 1 and thisdifference could be attributable to normal variabilityandor the greater microporosity As determined fromthe data in Table 3 the macroporosity specimenmodulus values were 20ndash63 lower than the soundmaterial modulus and 16ndash61 less than the micro-porosity specimen measured modulus Measuredmodulus ranges of 137ndash153 111ndash166 and 77ndash136 GPa were found in the lsquoleastrsquo lsquomiddlersquo andlsquomostrsquo specimen groups respectively Note that thelsquoleastrsquo and lsquomiddlersquo specimen groupings had meanEmeas of approximately 144 GPa and producedsimilar experimental fatigue results and the meanmeasured modulus of the lsquomostrsquo specimens was113 GPa Both the lsquoleastrsquo and lsquomiddlersquo materialshad a mean measured modulus significantly higherthan the lsquomostrsquo porous material and outperformed thelsquomostrsquo porous specimens in fatigue testing
Table 3 Macroporosity specimen load control test data and results
Specimen ID Porosity level Stress amp MPa Nf E GPa Calculated stress MPa
C4 Least 126 24 320 143 174C8 Least 126 29 023 153 163C2 Least 96 1365 137 138C3 Least 96 79 908 149 127C9 Least 66 216 516 145 90C10 Least 66 4 053 800 141 92C5 Least 53 851 275 138 76H8 Middle 126 7456 148 168G5 Middle 126 13 013 142 175H3 Middle 126 40 896 155 161G2 Middle 96 4392 111 171G8 Middle 96 41 066 125 152H7 Middle 96 333 025 142 134H2 Middle 66 769 074 151 86G1 Middle 66 1 681 018 166 79G7 Middle 53 249 752 143 73G4 Middle 53 1 342 218 145 72E6 Most 126 160 120 207E8 Most 126 11 648 136 183D6 Most 126 37 089 135 184E1 Most 96 1935 90 211E5 Most 96 6042 77 246D10 Most 66 15 419 113 115D4 Most 66 57 566 135 97D8 Most 66 113 503 136 96D5 Most 53 10 812 87 120E10 Most 53 15 868 104 101
8 Porous material fatigue data with scatterbandsdotted pattern lsquoleastrsquo porosity vertical shadinglsquomiddlersquo porosity inclined shading lsquomostrsquo porosity
Sigl et al Fatigue of 8630 cast steel in the presence of porosity 135
International Journal of Cast Metals Research 2004 Vol 17 No 3
Based on the relationship between the measuredspecimen modulus and fatigue life a more appro-priate grouping of specimens would be on the basis ofmeasured modulus rather than specimen castinggeometry Therefore new macroporosity groupingsbased on measured moduli of 140 GPa and greater110ndash139 GPa and moduli less than 110 GPa weremade approximately splitting the total range ofmoduli data into thirds These new groups are plottedin the SndashNf graph of Fig 9 which has scatterbandsdrawn around the measured modulus groupingsGenerally the data when plotted in these three newgroupings show that the higher modulus specimensoutperformed the lower modulus specimens and thatcategorising the data based on measured modulusprovides a better grouping with less overlap than theas cast geometry did in Fig 8
All macroporosity tests were conducted using loadcontrol This meant that the amplitude of the axialforce on the specimen was determined based on thenominal specimen cross-sectional area and the desiredstress amplitude levels before testing The nominalspecimen area was determined from diameter mea-surements made using an optical microscope withoutconsideration of porosity This test amplitude stress islower than the true stresses experienced by thespecimen material since the specimen area is reducedby the macroporosity Assuming that the decrease inmeasured modulus is because of the reduced volumecaused by porosity there is a reduction in the effectivecross-sectional area of the specimen test sectionConsidering this a better representative value of thelsquoeffectiversquo stress amplitude applied to the macropor-osity test specimens is calculated by equation (3)
Scalc~Sa
Emicro
Emeas (3)
where Emicro and Emeas represent the modulus of themicroporosity specimens and macroporosity testspecimens respectively and Scalc and Sa representthe newly calculated lsquonominalrsquo applied stress ampli-tude and the original stress amplitude based on a
sound test specimen respectively Using this equa-tion the calculated test stress amplitudes ranged fromapproximately 70 to 250 MPa instead of the fourstress amplitude groups of 53 66 96 and 126 MPaThe calculated stress is given in Table 3 for each testspecimen New data points using the calculatedstresses shown as open shapes are shown in the SndashNf plot in Fig 10 From Fig 10 the test specimensfall into a power function pattern with the higherstresses generally seeing shorter lives than the lowerstresses as is normally expected with fatigue dataEven with the calculated nominal stress the speci-mens with macroporosity still had significantlyshorter lives than the microporosity specimens withsimilar stress amplitudes It is apparent that using thisrepresentative stress amplitude alone does not entirelyexplain the poor fatigue behaviour of the specimenswith macroporosity The actual stresses responsiblefor failure are even higher than these calculatedstresses The calculated stresses in Fig 10 are basedon a measured modulus arising from the entirespecimen test section and are not determined at thefailure initiation sites
Results of the fatigue testing of the micro- andmacroporosity specimens are compared with thesound material test curve15 in Fig 11 Note that themicroporosity data (dashed curve) depart more fromthe sound data (solid curve) at decreasing levels ofstress and at lower levels of stress (300 MPa) thefatigue life is reduced by a factor of about 100 Sincethis microporosity is difficult to detect it may point toa cause of the overly large safety factor applied bydesigners to cast material throughout an entire castpart in lieu of the ability to predict the presence ofmicroporosity in parts and design for its localisedeffects The ratio of the stress amplitudes of themicroporosity specimens to macroporosity specimensrange from 5 at 102 cycles to failure to 3 at 105 cycleswhich emphasises the dramatically reduced fatigueresistance associated with macroporosity Run-outtests (Nfw56106 cycles) occurred at the 126 MPastress level in the microporosity test specimens
9 Porous material fatigue data grouped by modu-lus Emeas with scatterbands dotted patternmodulus 140 GPa and greater vertical shadingmodulus 110ndash139 GPa inclined shading modu-lus less than 110 GPa
10 Calculated stress amplitude macroporositydata squares lsquoleastrsquo porosity diamondslsquomiddlersquo porosity triangles lsquomostrsquo porosityand test stress amplitude data Sa for (filled cir-cles) microporosity material
136 Sigl et al Fatigue of 8630 cast steel in the presence of porosity
International Journal of Cast Metals Research 2004 Vol 17 No 3
The results of the fatigue testing point to theimportance of integrating the prediction of porosityin the casting process with the casting design In thecase of microporosity since it is difficult to detectusing nondestructive inspection (NDI) predictingmicroporosity in the casting process and consideringits effect on fatigue life of the part will be useful indesigning and producing parts with greater durabilityand reducing overly large factors of safety applied todesign calculations The results for the macroporosityspecimens provide a lower bound or worst caseboundary for property Certainly more research intothe effects of macroporosity and an explanation forthe significant data scatter observed here are war-ranted Unless an engineering approach can bedeveloped to conservatively consider the effects ofmacroporosity on the casting performance goodcasting practices and NDI must be relied upon toprevent it from occurring
Fractography and microscopy
Specimens with microporosity
Following the axial testing the specimen fracturesurfaces were examined with the use of a scanningelectron microscope (SEM) The examinationrevealed two types of cyclic failures for the micro-porosity specimens Specimens tested at strainamplitudes greater than or equal to ea~0003showed essentially no fatigue regions and had veryrough and jagged fracture surfaces These are similarto the monotonic fracture surfaces which despite thelow values of per cent elongation and per centreduction in area were widely covered with ductiledimples as shown in Fig 12 Ductile dimples areformed at discontinuities such as second-phaseparticles inclusions or grain boundaries within thesteel and begin to grow and coalesce into cracks thateventually lead to fracture of the component20 Thismicrovoid coalescence is typically associated withductile fracture
Specimens tested at strain amplitudes belowea~0003 had flat regions in the fracture surfaceindicating areas of fatigue crack growth (FCG) Clearregions of crack nucleation and final fracture werealso observed in these specimens The final fractureregion was composed primarily of ductile dimples(Fig 12) and the FCG region was composed offatigue facets Typical fatigue facets found in theFCG region are shown in Fig 13 Three low strainamplitude specimens were evaluated under the SEMand all were found to have cracks that nucleated fromsurface or near-surface porosity approximately200 mm in diameter such as shown in Fig 14
No indication of unsoundness was observed on theradiographs for all microporosity specimens Three ofthe 15 microporosity specimens were examined under20ndash30006 magnification Pores of 100ndash200 mm dia
11 Stress amplitude versus cycles to failure forsound cast 8630 material property curve15 micro-porosity data and macroporosity data usingcalculated stress amplitude from equation (3)
12 Typical ductile dimples found in final fractureregions of microporosity specimens
13 Typical fatigue facets found in FCG regions
Sigl et al Fatigue of 8630 cast steel in the presence of porosity 137
International Journal of Cast Metals Research 2004 Vol 17 No 3
were observed in the fracture surface of these threespecimens Only after sectioning the microporosityspecimens approximately 5 mm behind the fracturesurface and polishing to a mirror surface finish wasthe widespread presence of micropores revealed Theobserved micropores on the polished surface werenearly spherical in shape with diameters ranging fromapproximately 2ndash20 mm Larger pores on the order of200 mm as found in three specimens on the fracturesurface were not evident in any ground and polishedsections On the polished surfaces the microporeswere not distributed evenly across the surfacetherefore a conservative estimate of total localmicropore volume gathered by measuring the totalmicropore surface area from a high microporeconcentration region is approximately 065 An
image of typical micropores found on the groundsurface is shown in Fig 15
Specimens with macroporosity
Eight specimens with macroporosity were chosen tohave their fracture surfaces examined with the SEMThe fracture surfaces fell into two categories thosethat showed clear evidence of fatigue fractures such asin Fig 16a and those that did not (Fig 17a)Specimens with evidence of fatigue fractures typicallyhad a FCG region as indicated by a large flat regionon a macroscopic view and had the appearance offatigue facets on a microscopic view In severalspecimens a final fracture region was found on themacroscopic level as a shiny region containing a smallbut identifiable shear lip Upon evaluation of the finalfracture region on a microscopic level ductile
14 Near surface micropore of approximately 200 mmdiameter
15 Typical micropores found on ground surface
16 Macroporosity specimen a fracture surface showing signs of FCG near edges of specimen and bground surface
138 Sigl et al Fatigue of 8630 cast steel in the presence of porosity
International Journal of Cast Metals Research 2004 Vol 17 No 3
dimpling was observed as was the case with themicroporosity specimens Unfortunately none of thespecimens showed a clearly identifiable region ofcrack nucleation at a specific pore This introducesuncertainty to the application of predictive fatigue lifemodels
Fracture surfaces of the eight specimens selectedfor study were ground back to more clearly show theporosity present within the specimen The polishedsurfaces of the specimens are shown aligned in thesame orientation as the fracture surfaces in Figs 16band 17b The total macropore surface areas of thepolished surfaces were then measured using imageanalysis dividing this by the total cross-sectional areaof the specimens gives porosity ranging fromapproximately 22 to 309 for the eight specimensAlso a lsquocalculatedrsquo porosity percentage was deter-mined from the measured elastic modulus Emeas ofeach specimen according to equation (4)
Calculated porosity ~100 1Emeas
Emicro
(4)
where the constant Emicro is the modulus of thespecimens with microporosity The measured porearea percentages are compared to calculated porositypercentages in the third and fourth columns ofTable 4 It should be noted that the macroporositywas not uniformly spread throughout the gage sectionof the specimens Therefore the measured pore area
percentages are not entirely representative of the porevolume of these specimens and are merely a snapshotof a section near the region of fracture Though theirmagnitudes are different the calculated and measuredporosities appear to be in somewhat relative agree-ment between specimens
Modelling microporosity in fatigue lifecalculations
Fatigue life calculations for microporosity bystrainndashlife approach
The fatigue lives of the specimens with microporositywere calculated using the strainndashlife approach andmodelling the micropores as notches The poresresponsible for crack nucleation in the three speci-mens examined were spherical-shaped with a dia-meter of approximately 200 mm This pore size issmall compared to the 5 mm dia of the specimen atthe gage section Therefore the micropores weremodelled as a spherical notch contained within aninfinite body giving a stress concentration factorKt equal to 20521 This Kt value was then increasedby 7 according to Eubanks22 to account for thevicinity of the crack nucleation pores near the surfaceof the specimens The final value of Kt was thus takento be 219
The stress concentration factor was used tocalculate a fatigue notch factor Kf Fatigue strength
17 Macroporosity specimen a fracture surface with no signs of macroscopic fatigue and b ground surface
Table 4 Measured macropore and 3-D notch geometries
Ellipsoidal notch information
SpecimenYoungrsquosModulus E GPa Calc porosity
Meas porearea 3-D notch type
Major axis2a mm
Minor axis2b mm Kt Kf
H2 151 234 149 Neuber 225 18 236 223G7 143 274 22 SS 201 043 282 170C4 143 274 105 SS 150 075 247 205C10 141 284 135 Neuber 175 100 297 256C2 137 305 232 SS 333 115 266 221E6 120 391 276 Neuber 235 200 227 217E1 90 543 297 SS 410 179 254 230D5 87 558 309 SS 400 235 237 224
Sigl et al Fatigue of 8630 cast steel in the presence of porosity 139
International Journal of Cast Metals Research 2004 Vol 17 No 3
depends not only on the stress concentration factorbut also on the notch radius material strength andmean and alternating stresses23 Kf was determinedfrom Kt using
2124
Kf~1zKt1
1za=r (5)
a~002542070
Su
18
(6)
where r is the notch root radius inmillimetres Su is theultimate tensile strength of the material in MPa and ais a material constant in mm It should be noted thatequation (6) was originally developed for wroughtsteels24 Extending equation (6) to cast steels was thebest approximation available for the constant a
Nominal stresses were calculated at each strainamplitude tested assuming perfectly sound speci-mens This was accomplished using equation (1)which relates the nominal true stress DS and truestrain ranges De The local notch root stress andstrain ranges were then calculated from the nominalstress and strain ranges by simultaneously solvingNeuberrsquos rule equation (7) and the stable cyclehysteresis loop equation equation (8) given below as
DeDs~K2f De
DS (7)
De~Ds
Ez2
Ds
2K 0
1nrsquo
(8)
where Ds and De are the local axial stress and strain atthe notch root respectively The material propertiesE K9 and n9 were taken as those of the sound lsquokeelblockrsquo material as provided in Table 215 The localnotch strain range from equations (7) and (8) wasthen put into equation (2) to calculate the fatigue lifeof the specimens with microporosity
Spheroid notches of 10 20 100 and 200 mm diawere chosen to represent the range of possible poresizes where the fatigue failure initiates Theserepresentative values were chosen based on observa-tions made on the fracture and polished surfaces anddemonstrate how micropore size data might be usedto determine the effect of microporosity on the steelfatigue resistance The resulting life calculations areshown in Table 5 and in graphical form in Fig 18which plots the strain amplitude ea versus cycles to
failure Nf Note that calculated run-out points are notindicated in Fig 18 and note that life calculationmodelling lines are extended out to 16107 cycles Anynotched fatigue life values that are calculated to begreater than 56106 cycles should be consideredlsquocalculatedrsquo run-outs
The results shown in Fig 18 are encouraging sincemicropores responsible for the failure of the threecircled specimens in Fig 18 were observed to benearly spherical in shape with diameters of approxi-mately 100ndash200 mm and were located at or near thespecimen surface The three experimental data pointsagree better with the 100ndash200 mm pore size calcula-tions than with the 10ndash20 mm pore or sound materialcurves Calculations using micropores of 100ndash200 mmdia result in reasonably accurate and conservative lifecalculations using the strainndashlife approach for allmicroporosity specimens Also the two run-outspecimens that were tested at the lowest strainamplitude agree with the run-out calculation for the200 mm sized pore Examination of the microporespecimen fracture surfaces with a SEM showedthat the specimens tested at high strain amplitudesDe2o0003 showed no clear indication of crack
Table 5 Comparison of experimental microporosity specimen fatigue lives and calculated fatigue lives for200 mm spherical notch using local strainndashlife model
ea ExperimentalNf cycles CalculatedNf (cycles) for a 200 mmnotch
001 10 270008 29 400006 153 and 381 700004 3800 1700003 650 and 3476 3000002 19 299 210000015 62 112 11 8000001 517 015 and 512 858 222 00000008 951 965 1 240 000000065 Run-outrun-out Run-out
Note fatigue lives for runs at repeated strain levels are separated by lsquoandrsquoStrain amplitude approximated using load controlRun-out was taken as 5 000 000 cycles
18 Local strainndashlife curve for sound materialmicroporosity data and model calculations formicroporosity specimens using 10 20 100 and200 mm dia surface notches
140 Sigl et al Fatigue of 8630 cast steel in the presence of porosity
International Journal of Cast Metals Research 2004 Vol 17 No 3
nucleation FCG or final fracture regions whereasthe specimens tested at low strain amplitudes De2v0003 clearly demonstrated all of these features Thismay explain the disagreement with the two points at thefar left in Fig 18 Since the most useful region of thisfigure is the high cycle range these high strain levelswould not be desirable in a design or application
Modelling micropores by linear elastic fracturemechanics (LEFM)
Linear elastic fracture mechanics (LEFM) principleswere used to calculate the microporosity specimenlives and compare with fatigue testing results It isassumed that for the microporosity material a fatiguecrack of size lsquoarsquo has a crack growth rate of dadN thatcan be modelled by the Paris equation
da
dN~A(DK)n (9)
where A and n are material constants and DK isthe mode I stress intensity factor range operatingon the crack The constants A and n are determinedfrom crack test data for a given material andunfortunately it was not feasible to measure fatiguecrack growth properties in the current series ofmaterial testing for the microporosity specimensTherefore properties from the sound material asgiven in Table 615 were used in the LEFM calcula-tions presented here
For fully reversed testing the value of DK wascalculated using equation (10)
DK~Smax
ffiffiffiffiffiffipa
pF (10)
where Smax is the maximum stress a is the crack depthand F represents a shape factor that relates thegeometry of the crack front to the crack depth Equa-tion (10) only takes into account Smax because theminimum stress intensity factor is undefined in com-pression and will have a value of zero Additional crackclosure was not incorporated Substituting equa-tion (10) into equation (9) and integrating from theinitial crack depth ai to the final crack depth af resultsin equation (11) giving the total cycles to failure
Nf~
ethNf
0
dN~
ethafai
da
A(Smax
ffiffiffiffiffiffipa
pF )n
(11)
Cracks responsible for the failure of the specimenswere formed from pores located near or at the surfaceof the round specimens Therefore the cracks weremodelled as semi-circular surface cracks Formancreated a model for semi-circular cracks growing inround bars much like the cracks growing in thesespecimens25 Using this model where Dsp is the
diameter of the round specimen the shape factorF(aDsp) becomes
Fa
Dsp
~g
a
Dsp
0725z202
a
Dsp
z037 1 sinp
2
a
Dsp
3 (12)
ga
Dsp
~092
2
p
tan
p
2
a
Dsp
p
2
a
Dsp
1=2
cosp
2
a
Dsp
The initial crack length was taken as the square rootof the projected area of the pore that nucleatedthe crack1012 For simplicity it was assumed that forall microporosity specimens the cracks leading tofracture nucleated from 200 mm dia pores Thereforean initial crack length of 177 mm was used for allmicropore specimens This assumed initial cracklength is termed lsquophysically smallrsquo by ASTM Stand-ard E647 since it is less than 1 mm26 Five of the eightstress levels resulted in DK below the long crackthreshold stress intensity factor DKth so small crackgrowth behaviour was assumed to exist Since smallcrack growth behaviour was not evaluated for thesound specimens this growth was calculated byextrapolating equations (9) and (11) into the smallcrack growth region from the sound data15 Thespecimens tested at strain amplitudes greater thanea~00015 were run in strain control so the stablecycle stress taken from mid-life of the specimen wasused as an approximation of Smax The maximumstress used during testing must be less than or equal toeight-tenths of the yield strength for LEFM to beapplicable Therefore two of the testing levelsea~001 and ea~0008 could not be evaluated withthis procedure since the stable cycle tensile peaks weretoo large and violated LEFM restrictions
The final crack length of each specimen wasdetermined either at the point where net sectionyielding would occur or at the point where the criticalstress intensity factor Kc was reached Some difficultyarises applying this method for final crack sizedetermination in the Forman crack front modelThe Forman model is only capable of reaching cracksizes equivalent to the radius of the specimen as isdemonstrated by the following equation for determin-ing the crack length
r~a(2Rspa)
2(Rspa) (14)
where r is the radius of the circle describing the crackfront a is the crack length and Rsp is the specimenradius As the crack length a approaches Rsp theequation becomes undefined If net section yieldingcould only be reached when a crack length larger thanRsp was reached the crack shape was assumed tobecome a straight front so net section yielding andconsequently af could be calculated Equations (12)and (13) were used to calculate the stress intensityfactor It was found that all failures occurred by netsection yielding
Table 6 Crack growth properties
Property Data used for calculations
Sy MPa 1088DKth MPa m12 94Kc MPa m12 135A m cycle^1 263610^12n 303
Properties from sound material15 at R~0
(13)
Sigl et al Fatigue of 8630 cast steel in the presence of porosity 141
International Journal of Cast Metals Research 2004 Vol 17 No 3
Table 7 gives specimen test information and theexperimental and calculated fatigue lives using theForman crack front model These results arecompared in Fig 19 It can be seen that LEFMcalculations (dotted line) modelling the micropores ascracks overestimates life compared to all test dataexcept the three longest life specimens In thecalculations five of the eight strain amplitudes werenot large enough to produce a stress intensity factorthat was above the long crack threshold intensityfactor of DKth~94 MPa m12 for the given cracksize Even though the LEFM calculations indicatedthat the initial discontinuities would not lead tospecimen failure if they were treated as long cracksevaluation of the fracture surface indicated that thenear surface porosity did indeed contribute to thefailure Since small crack growth can occur below thisDKth an explanation for this disagreement lies inlooking at small crack growth
Small crack growth is greatly influenced by themicrostructure of the component and is often veryunpredictable It can be approximated by the extra-polation of the Paris equation into the small crackgrowth behaviour lsquoregimersquo as was done here Howeverthis extrapolation may have contributed to unrealisticcalculations Another source of error is the use offatigue crack growth properties that were not meas-ured for the microporosity specimens It was hopedthat the sound material constants A and n used inequation (9) could be used in the material with
microporosity However it appears now that com-pared to sound material material with microporositywill likely have a lower threshold value and a fastercrack growth rate at a given DK as a result of stressconcentrations created around microvoids within thematerial Shorter LEFM calculated specimen lives willresult from either shifting the Paris equation up byincreasing the constant A or from increasing the slopeof the equation by raising the value of the exponent nBoth would lead to shorter calculated specimen life
Fatigue life calculations formacroporosity
Macroporosity fatigue life calculations bystrainndashlife approach
An appropriate notch model must be selected tocalculate the fatigue life of the macroporosity speci-mens using the strainndashlife approach Both size andshape for the notch responsible for the failure must bedefined for the notch Since it was not possible in thepresent study to identify particular notches responsiblefor failures of the macroporosity specimens the courseof action taken was to perform test calculations using avariety of available notch models using notch (pore)size and shape data determined from microscopy
As an initial step specimen C4 was determined tobe a representative specimen for the purpose ofapplying strainndashlife calculations In specimen C4 themacroporosity was encapsulated at the specimencentre and did not extend as near the surface as it didin some specimens Specimen C4 had three largemacropores on the ground-back fracture surfaceBased on the average dimension of the pores in C4 aspherical notch of radius 075 mm was selected as therepresentative notch The cross-sectional area of thisnotch was close to the average pore area in specimenC4 Using the spherical notch model21 for this size ofnotch gave agreement between calculated and meas-ured fatigue life for specimen C4 In the current workthese stress concentration factors were determinedfrom best fit lines to the curves found in the handbookof stress concentration factors by Peterson21 Theseassume the notch to be internal in an infinite bodyand so the surface stress concentration factor Kt wasincreased by 7 as mentioned earlier
As a next step results of the life calculations arecompared with experimental lives in Fig 20 using thislsquorepresentativersquo 075 mm radius notch for all speci-mens Note that the data point for specimen C4 is
Table 7 Results of modelling single 200 mm diameter pore as surface crack
Smax MPa of net section yielding ExperimentalNf cycles af mm CalculatedNf cycles
862 792 153 and 381 157 27 400790 726 3800 180 35 700698 642 650 and 3476 207 51 900395 363 19 299 304 291 000296 272 62 112 342 699 000198 182 517 015 and 52 858 381 2 360 000158 145 951 965 398 4 680 000126 116 Run-out and run-out 415 Run-out
Note fatigue lives for runs at repeated stress levels are separated by lsquoandrsquoRun-out is 56106 cyclesSmall crack growth assumption was needed to make life predictions
19 LEFM model calculations for microporosityspecimens using crack length based on 200 mmpore compared with sound material and micro-porosity data
142 Sigl et al Fatigue of 8630 cast steel in the presence of porosity
International Journal of Cast Metals Research 2004 Vol 17 No 3
indicated in the figure Since an identical notch size isused in all specimens the variables reflecting thedifferent amounts of porosity in each specimen areEmeas and Scalc Macropores cause a substantial lossof cross-sectional area within the specimen and hencea large increase in the applied stress Considering thisthe calculated stress from equation (3) was used as thestress amplitude in the strainndashlife modelling Agree-ment between experiment and calculation is good forabout two-thirds of the specimens in Fig 20 andpoor for the other third Also where there is pooragreement it is unfortunately non-conservative
Eight specimens (circled in Fig 20) four of whichare above the upper 106 life interval line wereselected for further analysis to see if using morescrutiny in the selection of the notch model and thenotch dimensions would produce better agreementThese eight specimens are the same specimens listed inTable 4 Note that these eight specimens were testedover a range of stress amplitude levels Specimens C10and E6 were chosen for detailed analysis specificallyfor their unusually long and short lives respectivelyEach macroporosity casting group was represented inthe eight selected specimens
Aside from the 075 mm radius spherical notchmodel used in Fig 20 hemispherical or 3-D ellipsoi-dal notches (the SadowskySternberg or the Neubernotch models) were used to model the stressconcentration factors The SadowskySternberg type
notch was used for pores that loosely resembled theshape of a cigar or American football Pores of thistype required measurements of the major and minoraxes which were determined by microscopy of the 2-D polished surface images The Neuber notch modelwas used for pores that were more disc-shaped Theplane of the ellipse is parallel to the loading directionfor the Neuber notch with the axis of revolutionabout the minor axis Notch size and shape data arerequired to develop a lsquomodelrsquo notch within thematerial and this was determined from microscopyUsing these notch models the stress concentrationfactors Kt ranged from 227 to 297 From Kt a fatiguenotch factor was calculated using equations (5) and(6) Table 4 contains the ellipsoidal notch informa-tion used in the specimens selected for analysis notchtype major and minor ellipse axes length Kt and KfIn cases where a specimen contained multiple poresthe notch was created to fit the dimensions of thelargest pore on the ground surface of the specimen
Using Scalc from equation (3) the nominal strainranges were determined from equation (1) and thenotch root strain was determined from equations (7)and (8) The specimen life was calculated usingequation (2) with the results shown in Table 8Calculated versus experimental fatigue lives areshown in Fig 21 using solid data points for strainndashlife modelling Generally the calculations are still non-conservative The effectiveness of the local strainndashlifemodel with ellipsoidal notches in calculation of thefatigue life of specimens with macroporosity variedsignificantly Unfortunately no remarkable differ-ences were observed during microscopy examinationbetween the specimens that were in good and in pooragreement with the notch modelling
However there are fundamental factors thatcontribute to the modelling uncertainties and maybe sources of disagreement between the notchcalculations and tests complex pore shape aninability to determine a specific pore responsible forfailure the presence of multiple pores in the speci-mens the use of infinite body notch models use ofbulk material properties of the microporosity speci-mens and the use of a calculated stress based on themodulus Emeas The shape of the porosity was verytorturous and made the process of fitting a notch tothe pore geometry difficult and not entirely quanti-tative This contributes to uncertainty in the notchdimensions Though many macropores were evidentthroughout the ground surfaces of some of thespecimens the fatigue life calculation only takes
20 Calculated versus experimental life for strainndashlife modelling based on typical macroporesphere found in specimen C4 Rpore~075 mm
Table 8 Results of modelling macropores as ellipsoidal notches using local-strain model
SpecimenStress amplitudeSa MPa
Calculated stressScalc MPa
Youngrsquos ModulusE GPa
ExperimentalNfcycles
CalculatedNfcycles
H2 66 86 151 769 074 834 000G7 53 73 143 249 752 Run-outC4 126 174 143 24 320 24 500C10 66 92 141 4 053 800 295 000C2 96 138 137 1365 60 275E6 126 207 120 160 6800E1 96 211 90 1935 4333D5 53 120 87 10 812 124 000
Run-out is 56106 cycles or greater
Sigl et al Fatigue of 8630 cast steel in the presence of porosity 143
International Journal of Cast Metals Research 2004 Vol 17 No 3
into account the influence of a single pore or tightlyspaced group of pores modelled as a single ellipsoidalnotch Strainndashlife material properties from the speci-mens with microporosity were used in the fatigue lifecalculations for the specimens with macroporosityThese material properties used are given in Table 2This is believed to be an accurate representation of thespecimens with macroporosity because the lsquosoundrsquoportions of the specimens were observed to containmicropores ranging from approximately 10 to 200 mmin diameter Essentially the macropore notches residewithin material having properties of the specimenswith microporosity Recall that the notch modelsassume an infinite body However as is evident inFigs 16 and 17 the macropores are of a sizecomparable to the nominal area of the specimenTherefore another shortcoming of the calculations isthat the lsquocorrectedrsquo infinite body solution does notaccurately reflect the true Kt of these specimens Thepores were also very large in relation to the overalldimension of the specimens It may have beenbeneficial to use larger specimens or create specimenswith smaller amounts of porosity Either case wouldaddress these issues and reduce the differencebetween the specimens and the notch model Finallyto develop a truly predictive model the stress input
for the life calculation equations must be model-based instead of using a measured stress Scalc
Modelling macropores by LEFM approach
Modelling the fatigue lives of the eight selectedspecimens listed in Table 4 by LEFM was alsoperformed Since it could not be determined throughfractographic analysis which pores were responsiblefor the failure of a particular specimen the squareroot of the total surface area of the porosity was usedto determine the initial crack length for each specimenas measured It was anticipated that this approachwould give a conservative estimate and would beapplicable for life calculations The crack length atfracture was determined to be the point of net sectionyielding and was determined in the same manner as afwas found in the micropore LEFM calculations Thevalue of DK was determined using equations (10) (12)and (13) and the maximum nominal stresses encoun-tered during testing The Forman crack front modelequations (12) and (13) was again used as a result ofthe presence of surface porosity on all of theevaluated specimens though actual crack nucleationregions could not be determined The life calculationwas made by numerically integrating equation (11)with the results shown in Table 9
Fatigue lives calculated using LEFM are plotted inFig 21 versus experimental fatigue lives using lsquoopenrsquosymbols The LEFM life calculations producedresults that were generally in less agreement withthe measurements than the notched strainndashlifecalculations Only one of the LEFM life calculationswas conservative with five specimens having calcu-lated lives more than 10 times longer than what wasobserved experimentally The initial crack length wastaken as the square root of the total pore surface areafound on the ground surface instead of just a singlepore or group of pores that were thought to beresponsible for the failure of the specimen whichshould have led to conservative results As withmodelling the micropores the use of crack growthproperties taken from sound (keel block) materialmay have adversely affected the life calculations ofthe specimens with macroporosity In summaryassumptions that may have resulted in disagreementbetween the model calculations and test data aremodelling macropores as the square root of the totalpore area uncertainty in the actual macropore sizesresponsible for failure and the lack of good crackfront propagation models for material surroundingthe macroscopic pore
Table 9 Results of modelling macropores as crack
Specimen Smax MPa ExperimentalNf cycles ai mm af mm CalculatedNf cycles
H2 66 769 074 170 444 1 080 000G7 53 249 752 066 452 Run-outC4 126 24 320 144 413 294 000C10 66 4053 800 163 444 1320 000C2 96 1365 214 428 119 000E6 126 160 233 413 31 400E1 96 1935 241 428 56 400D5 53 10 819 246 452 298 000
Run-out is 56106 cycles or greaterStress intensity factor threshold value was not exceeded
21 Calculated versus experimental life for strainndashlife and LEFM modelling for eight identifiedpoints in Fig 20 using pore measurementsgiven in Table 4
144 Sigl et al Fatigue of 8630 cast steel in the presence of porosity
International Journal of Cast Metals Research 2004 Vol 17 No 3
Discussion
Cyclic and fatigue material properties were measuredthrough strain and load controlled R~21 testing ofthe microporosity specimens Microporosity speci-mens had low Dep2 at high strain amplitudes andvirtually no Dep2 at strain amplitudes lower than De2~0006 The fatigue limit Sf was also much lowerthan sound cast material The difference in materialproperties was as a result of the occurrence ofmicroporosity Comparison of the micropore caststeel material with sound specimen propertiesrevealed similar monotonic strengths but reducedductility Percent reduction in area was significantlyreduced by approximately a factor of 4 and though adirect comparison between per cent elongation wasnot possible a value of 25 would be consideredvery low for cast steels of similar strength whichnormally have a per cent elongation near 20Microporosity had a significant influence on thecyclic and fatigue properties of the specimens withmicroporosity The reduced ductility of the steel gavea lack of plastic strain observed during cyclingcausing the elastic strain amplitudes to remain largerthan the plastic strain amplitudes at all strain levelstested This would cause the material to behave in amore brittle manner with increased crack growthrates and consequently reduced fatigue strengths at allstrain amplitudes Evidence of this is shown in thereduced fatigue limit at 56106 cycles which is lessthan half of the Sf observed in the sound specimensFurther the micropores themselves would act asstress risers within the specimen further decreasingthe crack nucleation times
Specimens containing macroporosity performedsignificantly more poorly than specimens that con-tained microporosity in fatigue testing For a stressamplitude of 126 MPa the two specimens withmicroporosity resulted in run-out tests their fatiguelives were greater than 56106 cycles At the same stresslevel eightmacroporosity specimens in all three groupswere tested and the lives of these specimens rangedfrom 160 to 41 000 cycles Within the three macro-porosity specimen groups the lsquoleastrsquo and lsquomiddlersquoporosity groupswere found to have similar fatigue livesand both outperformed the lsquomostrsquo porosity group Acorrelation between the measured specimen modulusEmeas the porosity level (represented by specimengroup) and the specimen fatigue life was observed Thespecimen modulus Emeas was shown to have a strongcorrelation with the fatigue life of the specimens andwas subsequently used as a new way of grouping thespecimens Generally specimens with higher Emeas
outperformed the lower modulus specimens butsignificant scatter could still be observed withinthe modulus groups particularly noticeable in themodulus 110ndash139 GPa grouping as well as in thecalculated stress grouping Emeas appears to be a betterindicator of fatigue performance than specimen group-ing but this information alone cannot be accuratelycorrelated to the life of a specimen
The most common pore size found on the polishedmicroporosity specimen surfaces with microporositywas approximately 8 mm in diameter However sizesup to 20 mm in diameter were also observed Larger
pores on the order of 200 mm in diameter wereobserved on several of the specimen fracture surfacesThough these larger pores may not be numerouswithin the current material they have a significantinfluence on the fatigue life From local strainndashlifemodelling a notch diameter of 200 mm gave goodagreement with fatigue testing LEFM modelling ofmicropores did not produce accurate life calculationsas a result of the small crack growth behaviour of themicropores and lack of crack growth property data
As a result of the small size of the micropores theextent of microporosity could not be determinedconclusively neither by examination of the radio-graphs nor through the examination of the fracturesurfaces Information on the size and distribution ofmicroporosity was gathered through microscopyconducted on ground surfaces of the microporosityspecimens The total microporosity area was deter-mined to be 065 or less within the microporosityspecimens This relatively small percentage of micro-porosity caused significant reduction in ductilityperformance which concurs with a study by otherswho found that microporosity values greater than05 significantly reduced per cent elongation and percent reduction in area while having little effect onstrength properties27
For the macroporosity specimens it was deter-mined that strainndashlife calculations using a sphericalnotch radius of 075 mm gave agreement with the testdata to within one decade for 20 out of the 27 ofthe specimens tested The notch radius used in thecalculations was chosen because it agrees with thepore radius observed via SEM in a lsquotypicalrsquo macro-porosity specimen and the equivalent radius ofporosity on ASTM standard radiographs17 Thedisagreement between the measured and calculatedlives of the specimens with macroporosity wasprimarily non-conservative for both the strainndashlifeand LEFM approaches with LEFM giving moredisagreement The largest disagreement between thecalculations and test data was observed at the lowestlived specimens (highest stress levels)
Modelling the effect of macroporosity using thestrainndashlife and LEFM approach was hindered bythe torturous shape of the shrinkage porosity and thelarge size of the macropores relative to the specimendiameter Determining a proper value for Kt wasdifficult The complex shape of the porosity is not theidealized hemispherical and three-dimensional ellip-tical notches Here as in other investigations anenvelope was constructed around the pore toapproximate it as a 200 mm sphere (in the case ofmicroporosity) and a 075 mm dia sphere and three-dimensional notches as shown in Table 4 (in the caseof macroporosity)910 This is the first attempt bythese authors to relate the fatigue life to the size of theporosity as it may be found on an X-ray or a cutsection The crack initiation and growth from pores ismuch more complex than this and is influenced by thedetailed geometry of pores deep in the solidifiedstructure with smaller radii and sharper cornersHowever crack initiation and growth from pores alsodepend upon location of these pore features relativeto the grain boundaries and the orientation of grainboundaries on the pore periphery relative to the
Sigl et al Fatigue of 8630 cast steel in the presence of porosity 145
International Journal of Cast Metals Research 2004 Vol 17 No 3
stress28 These issues may be difficult to include in ageneral predictive model and a more thoroughanalysis that takes into account more details of poreshape and other issues will have to be done in the futureto see if predictions can be improved Modelling theeffect of macroporosity using LEFM was hindered byusing crack growth properties taken from sound lsquokeelrsquoblock material as well as the large size of macro-porosity located within the specimens which isexpected to increase the stress amplitude in the sectionExamination of the porous material fracture surfaceswith the SEM showed that many specimens had noclear indication of crack nucleation FCG or finalfracture regions on either the micro- or macroscopiclevels However several specimens tested did haveFCG and final fracture regions similar to the micro-pore material low strain amplitude specimens on boththe micro- and macroscopic levels but there was noclear indication of crack nucleation
Summary and conclusions
Cast steel containing a variation in porosity frommicro- to macro- levels was tested for monotonicstrength and fatigue and the experimental fatigueresults were then compared with fatigue calculationmodels No porosity was seen in radiographs of thespecimens with microporosity whereas the lsquoleastrsquo andlsquomiddlersquo macroporosity groups appeared to containsimilar amounts of porosity and the lsquomostrsquo macro-porosity group contained noticeably greater porosity
Based on the preliminary calculations performedhere there is evidence that using strainndashlife models forcast steel with microporosity can provide an engi-neering approach sought to couple casting simulationprediction of porosity with the prediction of partfatigue performance Since microporosity in steel isnot usually detected by radiography (or othernondestructive inspection techniques) the possibilityof its presence in parts can be considered in the designprocess either by lsquowhat-ifrsquo analysis or by integratingcasting process simulations with the design analysesWhen the fatigue test results for both the micro- andmacroporosity specimens are compared with soundkeel block data the full range of mechanical propertydegradation caused by porosity is seen The issueswhich are believed to prevent good agreement betweencalculations and test specimen life data for themacroscopic specimens continue to be investigated
Acknowledgements
This research was undertaken as part of the IntegratedDesignof Steel Castings for Service Performanceprojectwhich is funded by the United States Department ofDefense through the American Metalcasting Consor-tium (AMC) PRO-ACT program AMCrsquos PRO-ACTprogramme is sponsored by Defense Supply CenterPhiladelphia (DSC Philadelphia PA USA) and theDefense Logistics Agency (DLA Ft Belvoir VAUSA) This research is also conducted under theauspices of the Steel Foundersrsquo Society of Americaand through substantial in-kind support guidance andinterest from SFSA member foundries In particularthe authors would like to thank Harrison Steel forseveral trial iterations on the casting of test specimens
and the final test specimen castings Alloy WeldInspection Co for their digital and film radiographyof the fatigue test specimens and MAGMAGmbH fortheir support of the porosity prediction model used todesign the test specimen castings
References1 ASTM in lsquo2002 Annual book of ASTM standardsrsquo Vol 0303
189ndash191 2002 West Conshohocken PA American Society ofTesting and Materials
2 ASTM in lsquo2002 Annual book of ASTM standardsrsquo Vol 030381ndash83 2002 West Conshohocken PA American Society ofTesting and Materials
3 ASTM in lsquo2002 Annual book of ASTM standardsrsquo Vol 0303125ndash127 2002 West Conshohocken PA American Society ofTesting and Materials
4 m kohno and m makioka AFS Trans 1970 9ndash165 k chijiwa t nakayama and m imamura CIF 36 1ndash126 j g conley b moran and j gray lsquoAluminum in automotive
applicationsrsquo Vol 1350 25ndash38 1998 SAE Special Publications7 q g wang d apelian and d a lados J Light Metals 2001
1 73ndash848 c m sonsino and j ziese Int J Fatigue 1993 15 75ndash849 p heuler c berger and j motz Fatigue Fract Eng Mater
Struct 1992 16 115ndash13610 s jayet-gendrot p gilles and c migne lsquoFatigue and
fracture Vol 1rsquo Vol 350 107ndash116 1997 American Societyof Mechanical Engineers Pressure Vessels and Piping Division
11 t mansson and f nilsson Int J Cast Met Res 2001 13373ndash378
12 p hausild c berdin p bompard and n verdiereMater SciEng A 2002 335 164ndash174
13 r hardin and c beckermann in lsquo2002 SFSA technicaland operating conference proceedingsrsquo Chicago IL SteelFoundersrsquo Society of America Paper 45 1ndash10
14 k d carlson z lin r a hardin c beckermanng mazurkevich and m c schneider Proc Conf onlsquoModeling of casting welding and advanced solidificationprocesses Xrsquo Destin Florida May 2003 295ndash302
15 r i stephens lsquoFatigue and fracture toughness of five carbon orlow alloy cast steels at room or low climatic temperaturesrsquoCarbon and Low Alloy Technical Research Committee SteelFoundersrsquo Society of America Des Plaines IL 1982
16 ASTM in lsquo2002 Annual book of ASTM standardsrsquo Vol 0301569ndash583 2002 West Conshohocken PA American Society ofTesting and Materials
17 k carlson s ou r hardin and c beckermann Int J CastMet Res 2001 14 169ndash183
18 ASTM in lsquo2002 Annual book of ASTM standardsrsquo Vol 0301738ndash745 2002 West Conshohocken PA American Society ofTesting and Materials
19 ASTM in lsquo2002 Annual book of ASTM standardsrsquo Vol 030160ndash81 2002 West Conshohocken PA American Society ofTesting and Materials
20 c r brooks and a choudhury lsquoFailure analysis ofengineering materialsrsquo 2002 New York McGraw-Hill
21 r e peterson lsquoStress concentration factorsrsquo 1974 New YorkWiley-Interscience
22 eubanksr a Trans ASME 76 Appl Mech Section 57ndash62
23 r i stephens a fatemi r r stephens and h o fuchs lsquoMetalfatigue in engineeringrsquo 2nd edn 2000 New York Wiley-Interscience
24 Society of Automotive Engineers lsquoFatigue design handbookrsquoVol 4 29 1968 Warrendale PA SAE
25 r g forman and v shivakumar lsquoFracture mechanicsrsquo17th volume ASTM STP 905 Philadelphia ASTM 198659ndash74
26 ASTM in lsquo2002 Annual book of ASTM standardsrsquo Vol 0301603ndash644 2002 West Conshohocken PA American Society ofTesting and Materials
27 j a griffin r d griffin and c d pears in lsquo2000 SFSAtechnical and operating conference proceedingsrsquo Chicago ILSteel Foundersrsquo Society of America Paper 25 1ndash10
28 j-y buffiere s savelli p h jouneau e maire andr fougeres Mater Sci Eng A 2001 316 115ndash126
146 Sigl et al Fatigue of 8630 cast steel in the presence of porosity
International Journal of Cast Metals Research 2004 Vol 17 No 3
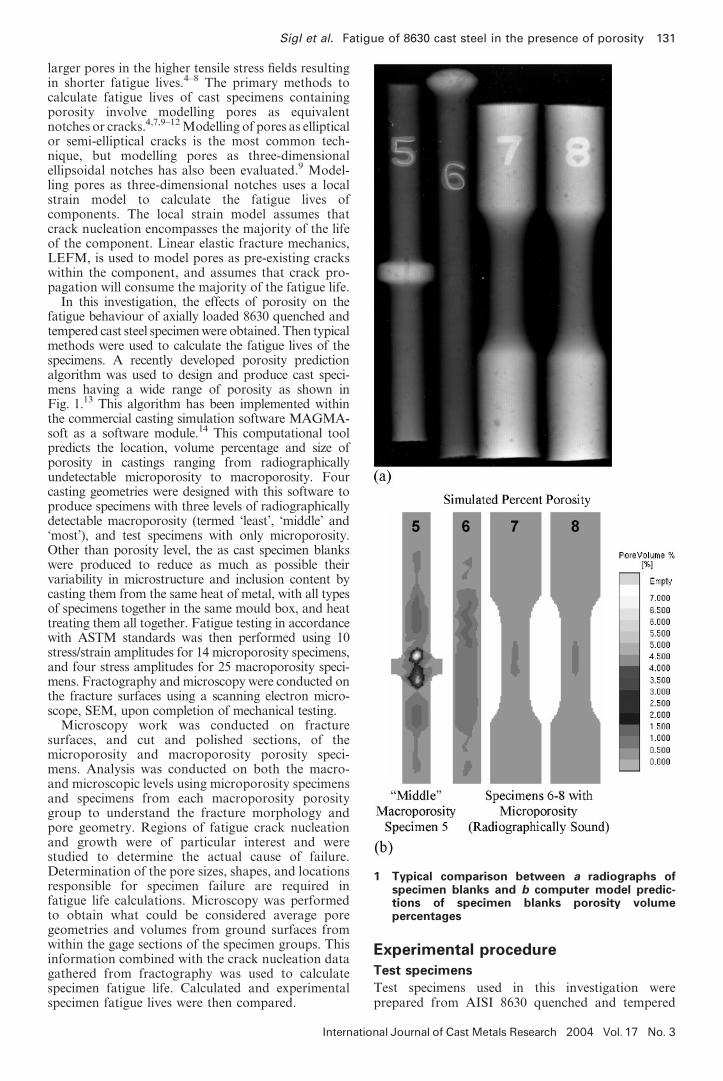
larger pores in the higher tensile stress fields resultingin shorter fatigue lives4ndash8 The primary methods tocalculate fatigue lives of cast specimens containingporosity involve modelling pores as equivalentnotches or cracks479ndash12Modelling of pores as ellipticalor semi-elliptical cracks is the most common tech-nique but modelling pores as three-dimensionalellipsoidal notches has also been evaluated9 Model-ling pores as three-dimensional notches uses a localstrain model to calculate the fatigue lives ofcomponents The local strain model assumes thatcrack nucleation encompasses the majority of the lifeof the component Linear elastic fracture mechanicsLEFM is used to model pores as pre-existing crackswithin the component and assumes that crack pro-pagation will consume the majority of the fatigue life
In this investigation the effects of porosity on thefatigue behaviour of axially loaded 8630 quenched andtempered cast steel specimenwere obtained Then typicalmethods were used to calculate the fatigue lives of thespecimens A recently developed porosity predictionalgorithm was used to design and produce cast speci-mens having a wide range of porosity as shown inFig 113 This algorithm has been implemented withinthe commercial casting simulation software MAGMA-soft as a software module14 This computational toolpredicts the location volume percentage and size ofporosity in castings ranging from radiographicallyundetectable microporosity to macroporosity Fourcasting geometries were designed with this software toproduce specimens with three levels of radiographicallydetectable macroporosity (termed lsquoleastrsquo lsquomiddlersquo andlsquomostrsquo) and test specimens with only microporosityOther than porosity level the as cast specimen blankswere produced to reduce as much as possible theirvariability in microstructure and inclusion content bycasting them from the same heat of metal with all typesof specimens together in the same mould box and heattreating them all together Fatigue testing in accordancewith ASTM standards was then performed using 10stressstrain amplitudes for 14 microporosity specimensand four stress amplitudes for 25 macroporosity speci-mens Fractography andmicroscopy were conducted onthe fracture surfaces using a scanning electron micro-scope SEM upon completion of mechanical testing
Microscopy work was conducted on fracturesurfaces and cut and polished sections of themicroporosity and macroporosity porosity speci-mens Analysis was conducted on both the macro-and microscopic levels using microporosity specimensand specimens from each macroporosity porositygroup to understand the fracture morphology andpore geometry Regions of fatigue crack nucleationand growth were of particular interest and werestudied to determine the actual cause of failureDetermination of the pore sizes shapes and locationsresponsible for specimen failure are required infatigue life calculations Microscopy was performedto obtain what could be considered average poregeometries and volumes from ground surfaces fromwithin the gage sections of the specimen groups Thisinformation combined with the crack nucleation datagathered from fractography was used to calculatespecimen fatigue life Calculated and experimentalspecimen fatigue lives were then compared
Experimental procedure
Test specimens
Test specimens used in this investigation wereprepared from AISI 8630 quenched and tempered
1 Typical comparison between a radiographs ofspecimen blanks and b computer model predic-tions of specimen blanks porosity volumepercentages
Sigl et al Fatigue of 8630 cast steel in the presence of porosity 131
International Journal of Cast Metals Research 2004 Vol 17 No 3
cast steel The composition (wt-) was 093 Mn 066Si 050 Ni 048 Cr 029 C 027 Mo 0045 Al 0022 Sand 0027 P Microporosity specimen blanks (Fig 2a)were cast with reservoirs of molten steel at the ends ofthe blank with a narrow gage section located in thecentre in an attempt to minimise the occurrence ofmacroshrinkage in the casting Specimen blanks withmacroporosity (Fig 2b) were cast as 14 mm diacylinders with an approximate 25 mm dia disc locatedat the mid-length of the casting to create a hot spotwhere the porosity would form The amount ofporosity in the casting was controlled by changingthe thickness of the central disc with more porosityoccurring in the castings with thicker discs Castingsimulation (Fig 1b) predicts a maximum porosity ofapproximately 05 in the gage section of themicroporosity specimen blanks and a porosity rangebetween 2 and 25 in the macroporosity specimenblanks depending on the central disc thickness
All cast blanks received identical heat treatmentnormalised at 900uC austenised at 885uC waterquenched and finally tempered for 15 h at 510uCThis heat treatment resulted in a tempered martensiticstructure with a Rockwell C hardness of 34 This heattreatment matched that used on the 8630 steel testedin a 1982 Steel Foundersrsquo Society of America (SFSA)study15 to produce specimens having the samematerial properties as this baseline data Specimensused in the 1982 SFSA report were machined fromlarge cast trapezoidal-shaped keel blocks and datafrom the report15 will be referred to as lsquosoundrsquospecimen data throughout the remainder of thispaper After heat treatment each cast specimen blankwas machined into a round test specimen with thefinal polished dimensions shown in Fig 3 Machiningfollowed the ASTM E60616 standard that providesguidelines for specimen preparation geometry finalsurface finish and uniformity
The machined specimens were examined throughvisual inspection and radiographic analysis to
determine a qualitative measure of the porositypresent in each casting group Typical radiographsof selected specimens are shown in Fig 4 Visualinspection showed that two of the 15 microporosityspecimens and 27 of the 29 specimens with macro-porosity had exposed pores at the specimen surfaceNo porosity was detectable in the radiographs of themicroporosity specimens they appeared to be radio-graphically sound The micropores were too small(v200 mm diameter) to be detectable by the radio-graphic analysis used Based on the radiographs ofthe macroporosity specimens it was observed that thelsquoleastrsquo and lsquomiddlersquo porosity groups contained verysimilar amounts of macroporosity with pore radii ofapproximately 075 mm The lsquomostrsquo porosity group ofspecimens showed the presence of even larger voidsIn a study of the ASTM standard radiographs17 itwas shown that the equivalent radii of the porosity inthe radiographs (determined by two times the area ofa radiographic indication divided by its circumfer-ence) were in a range from 06 to 11 mm over all fiveASTM levels of porosity severity For the three lowestlevels of porosity in the ASTM standard radiographs(including all types A B and C) it was found thatthe average equivalent radius of porosity wasapproximately 075 mm17 which agrees well with
a microporosity specimen blanks b macroporosityspecimen blanks
2 Dimensions of cast blanks in millimetresDimension lsquoXrsquo~5 75 and 10 mm for lsquoleastrsquolsquomiddlersquo and lsquomostrsquo macroporosity specimengroups respectively
3 Final dimensions of fatigue specimens inmillimetres
4 Radiograph images of a microporosity speci-mens b lsquoleastrsquo macroporosity specimens clsquomiddlersquo macroporosity specimens and d lsquomostrsquomacroporosity specimens
132 Sigl et al Fatigue of 8630 cast steel in the presence of porosity
International Journal of Cast Metals Research 2004 Vol 17 No 3
observations of the lsquoleastrsquo and lsquomiddlersquo porositygroups examined here It was concluded17 that thetypical size of macropores detected through theASTM Standards1ndash3 was about 075 mm with largersizes forming in worse porosity through the mergingof pores
Mechanical testing
Testing was performed using a 100 kN closed loopservo-hydraulic test system All fatigue tests wereperformed under fully reversed (R~21) loadingconditions The alignment of the load frame grippingfixtures was verified according to ASTM StandardPractice E1012 Type A Method 1 and meeting therequirements of ASTM E606 which requires that lsquothemaximum bending strains so determined should notexceed 5 of the minimum axial strain range imposedduring any test programrsquo1618
Monotonic and fatigue property data of the 8630steel with microporosity were obtained first beforethe macroporosity specimens Monotonic tests wereconducted in displacement control following standardASTM E08 that provides guidelines on specimenpreparation geometry surface finish diameter mea-surement test machine preparation grips alignmentrate of testing and determination of tensile proper-ties19 Testing procedures for strain controlled lowcycle fatigue (LCF) tests outlined in ASTM E606that provides guidelines for alignment calibrationgrips transducers fixtures cycle counting extens-ometers test environment wave form frequencynumber of specimens and failure criteria werefollowed to gather the needed cyclic and fatigueproperties16 Tests conducted in strain control hadconstant strain rates of 001 s21 with frequenciesvarying between 025 and 125 Hz At smaller strainamplitudes the behaviour of the specimens waspredominantly elastic making it possible to approx-imate strain amplitudes using load control Cyclingspecimens in load control allowed the testing speed tobe increased to 10ndash30 Hz with lower frequencies usedfor higher stress amplitudes
All lsquoleastrsquo lsquomiddlersquo and lsquomostrsquo macroporosityspecimens were run in load control at 10ndash20 HzThe extensometer was also used on these tests toproduce readings for the elastic modulus E Thesedata were collected to determine whether a relation-ship between the apparent elastic modulus and theporosity volume measured from the radiographscould be established Specimens with macroporositywere tested at four different stress levels with the firststress level chosen as 126 MPa note this was the run-out stress amplitude for the specimens with micro-porosity The second stress level of 66 MPa waschosen by converting the strainndashlife endashN curve of themicroporosity specimens to a stressndashlife SndashN curveand then shifting this curve down to the lives of thespecimens with macroporosity previously tested Thisadjusted SndashN curve was then used to estimate stressamplitude and lives of the specimens with macro-porosity The goal was to obtain a life on the order of106 cycles without a run-out occurring The remainingstress levels were chosen to fill in gaps within themacroporosity specimen data All fatigue tests were
performed until fracture of the specimen occurred ora run-out life was achieved at 56106 cycles
Experimental results
Monotonic testing
Monotonic material tensile properties were obtainedfrom two microporosity specimens with the averageresults shown in Table 1 In this table the ultimatetensile strength Su yield strength Sy YoungrsquosModulus E per cent reduction of area RA percent elongation EL true fracture strength sf truefracture ductility ef strength coefficient K and strainhardening exponent n are given for the microporosityspecimens Only values for Su Sy E RA sf and efmay be compared to the sound specimen data15 sinceEL K and n were not given in the earlier studyMonotonic tensile stressndashstrain curves for the speci-mens with microporosity are shown in Fig 5 As isevident in Table 1 both the sound and microporositymaterial gave similar properties for E Su and Syfound by the 02 offset method The RA for themicroporosity specimens was found to be 76 lowerthan the RA for the sound specimens Neithermonotonic microporosity test specimen showed signsof necking and in conjunction with small values ofRA and EL these tests indicate that the speci-mens with microporosity exhibited low ductility
Table 1 8630 steel monotonic properties
Property Micropore material avg Sound material15
Su MPa 1125 1144Sy MPa 1088 985E GPa 197 207EL 25 ^RA 70 29sf MPa 1156 1268ef 0073 035K MPa 1307 ^n 00279 ^
Not thearithmeticmeanbut thebest fit regression to theaggregatedata
5 Monotonic and cyclic stressndashstrain curves ofmicroporosity specimens
Sigl et al Fatigue of 8630 cast steel in the presence of porosity 133
International Journal of Cast Metals Research 2004 Vol 17 No 3
Microporosity specimen fatigue testing
Cyclic and fatigue material properties for the micro-porosity specimens are shown Table 2 and they areagain compared with the results for the soundspecimens15 The first two entries in Table 2 are thefatigue strength (or fatigue limit) Sf at 56106 cyclesand the fatigue ratio SfSu The fatigue ratio isreduced by more than a factor of 2 from the sounddata Via the lsquocompanionrsquo sample method the cyclicstressndashstrain curve shown in Fig 5 was generatedusing the approximate halflife stable hysteresis loopsfrom a series of fatigue tests run at six strainamplitudes ea In this process the tensile points(loop tips) of the stabilised hysteresis loops at thespecimen halflife are connected as shown in Fig 6 toform the curve In Fig 6 only four of the six strainamplitudes tested are discernible the lowest twostrain amplitudes collapse onto the curve forea~0004 The cyclic stressndashstrain curve is used todetermine the material properties which relate thenominal true stress and true strain ranges as given byequation (1)
De~DS
Ez2
DS
2K 0
1nrsquo
(1)
where the symbols DS and De are the nominal trueaxial stress and true axial strain respectively E isYoungrsquos modulus K9 is the cyclic strength coefficientand n9 is the cyclic strain hardening exponent Values
of these parameters are given in Table 2 for the soundand microporosity material The value of cyclic yieldstrength S9
y was found to be 894 MPa which is lessthan Sy (comparing Tables 1 and 2) indicating thatthe material cyclic softened Cyclic softening com-monly occurs with high strength materials and resultsin softening of the material as the cyclic loadingprogresses The majority of softening occurred withinthe first 10ndash20 of specimen life and then slowed toan approximate constant slope of decreasing maxi-mum stress in tension and increasing minimum stressin compression
A strain versus reversals to failure endash2Nf curve(Fig 7) was constructed from the plastic and elasticcurves which when summed produce the total endash2Nf
curve equation
De
2~
Dee2
zDep2
~srsquofE
(2Nf )bzersquof (2Nf )
c (2)
where De2 is the total strain amplitude Dee2 is theelastic strain amplitude Dep2 is the plastic strainamplitude s9f is the fatigue strength coefficient b isthe fatigue strength exponent e9f is the fatigueductility coefficient and c is the fatigue ductilityexponent The values for s9f b e9f and c from themicroporosity specimens are given in Table 2 andwere determined by a curve fit of the test dataComparison between the microporosity and sounddata in Table 2 reveals the largest difference to be thefatigue ductility coefficient In equation (2) the firstaddition term is the equation of the elastic strainamplitude curve and the second term is the equationof the plastic strain amplitude curve Many steelsbehave in a predominantly plastic manner under highstrain amplitudes and in a predominantly elasticmanner at lower strain amplitudes with a transitionpoint where the elastic and plastic curves cross It wasobserved that this transition point never occurred inthe microporosity specimens as the elastic strainamplitudes were always larger than the plastic strainamplitudes At strain amplitudes of 0004 and belowplastic strains were virtually nonexistent and the Dee2data points can be seen to fall directly on top of theDe2 data points
Table 2 8630 steel cyclic properties
Property Micropore material Sound material15
Sf MPa 126 293SfSu 011 026K9 MPa 2550 15022267n9 0167 01220195S9y MPa 894 682661
b 20176 20121c 20908 20693s9f MPa 2390 1936e9f 011 042
Data determined from the companion methodData determined from the companion and incremental stepmeth-ods respectively
6 Halflife hysteresis loops used to create cyclicstressndashstrain curve for microporosity specimens 7 Total elastic and plastic strainndashlife curves of
microporosity specimens
134 Sigl et al Fatigue of 8630 cast steel in the presence of porosity
International Journal of Cast Metals Research 2004 Vol 17 No 3
Macroporosity specimen fatigue testing
The fatigue test conditions and test results for allspecimens with macroporosity are given in Table 3They are grouped by lsquoleastrsquo lsquomiddlersquo and lsquomostrsquoporosity specimen geometry types and then fromlargest to smallest stress amplitude level within eachgroup Experimental fatigue results of the lsquoleastrsquolsquomiddlersquo and lsquomostrsquo macroporosity levels are shownin comparison to the microporosity specimens in thestressndashlife SndashN curve of Fig 8 Scatter bands aredrawn around each of the three porosity groups Thescatterbands for the lsquoleastrsquo and lsquomiddlersquo porositygroups show significant overlap indicating that thegroups had similar fatigue lives The scatterband forthe lsquomostrsquo porosity group falls farther to the left of the
lsquoleastrsquo and lsquomiddlersquo porosity groups and has fewerareas of overlap demonstrating generally lowerexperimental fatigue lives at the same stress levelNote that all of the macroporosity specimens hadconsiderably shorter fatigue lives than the lives of themicroporosity bearing material and were testedbelow the microporosity specimens fatigue limit forthe majority of the fatigue testing
A modulus of elasticity Emeas of each macropor-osity specimen was measured during testing todetermine whether the porosity level and measuredmodulus could be correlated It was also believed thatthis might serve as an indicator of porosity volumeThis lsquoapparentrsquo specimen modulus is reduced from themodulus of sound specimens by the lost sectionthickness associated with porosity The modulus ofthe microporosity test specimens was only 5 lowerthan the sound data15 as seen in Table 1 and thisdifference could be attributable to normal variabilityandor the greater microporosity As determined fromthe data in Table 3 the macroporosity specimenmodulus values were 20ndash63 lower than the soundmaterial modulus and 16ndash61 less than the micro-porosity specimen measured modulus Measuredmodulus ranges of 137ndash153 111ndash166 and 77ndash136 GPa were found in the lsquoleastrsquo lsquomiddlersquo andlsquomostrsquo specimen groups respectively Note that thelsquoleastrsquo and lsquomiddlersquo specimen groupings had meanEmeas of approximately 144 GPa and producedsimilar experimental fatigue results and the meanmeasured modulus of the lsquomostrsquo specimens was113 GPa Both the lsquoleastrsquo and lsquomiddlersquo materialshad a mean measured modulus significantly higherthan the lsquomostrsquo porous material and outperformed thelsquomostrsquo porous specimens in fatigue testing
Table 3 Macroporosity specimen load control test data and results
Specimen ID Porosity level Stress amp MPa Nf E GPa Calculated stress MPa
C4 Least 126 24 320 143 174C8 Least 126 29 023 153 163C2 Least 96 1365 137 138C3 Least 96 79 908 149 127C9 Least 66 216 516 145 90C10 Least 66 4 053 800 141 92C5 Least 53 851 275 138 76H8 Middle 126 7456 148 168G5 Middle 126 13 013 142 175H3 Middle 126 40 896 155 161G2 Middle 96 4392 111 171G8 Middle 96 41 066 125 152H7 Middle 96 333 025 142 134H2 Middle 66 769 074 151 86G1 Middle 66 1 681 018 166 79G7 Middle 53 249 752 143 73G4 Middle 53 1 342 218 145 72E6 Most 126 160 120 207E8 Most 126 11 648 136 183D6 Most 126 37 089 135 184E1 Most 96 1935 90 211E5 Most 96 6042 77 246D10 Most 66 15 419 113 115D4 Most 66 57 566 135 97D8 Most 66 113 503 136 96D5 Most 53 10 812 87 120E10 Most 53 15 868 104 101
8 Porous material fatigue data with scatterbandsdotted pattern lsquoleastrsquo porosity vertical shadinglsquomiddlersquo porosity inclined shading lsquomostrsquo porosity
Sigl et al Fatigue of 8630 cast steel in the presence of porosity 135
International Journal of Cast Metals Research 2004 Vol 17 No 3
Based on the relationship between the measuredspecimen modulus and fatigue life a more appro-priate grouping of specimens would be on the basis ofmeasured modulus rather than specimen castinggeometry Therefore new macroporosity groupingsbased on measured moduli of 140 GPa and greater110ndash139 GPa and moduli less than 110 GPa weremade approximately splitting the total range ofmoduli data into thirds These new groups are plottedin the SndashNf graph of Fig 9 which has scatterbandsdrawn around the measured modulus groupingsGenerally the data when plotted in these three newgroupings show that the higher modulus specimensoutperformed the lower modulus specimens and thatcategorising the data based on measured modulusprovides a better grouping with less overlap than theas cast geometry did in Fig 8
All macroporosity tests were conducted using loadcontrol This meant that the amplitude of the axialforce on the specimen was determined based on thenominal specimen cross-sectional area and the desiredstress amplitude levels before testing The nominalspecimen area was determined from diameter mea-surements made using an optical microscope withoutconsideration of porosity This test amplitude stress islower than the true stresses experienced by thespecimen material since the specimen area is reducedby the macroporosity Assuming that the decrease inmeasured modulus is because of the reduced volumecaused by porosity there is a reduction in the effectivecross-sectional area of the specimen test sectionConsidering this a better representative value of thelsquoeffectiversquo stress amplitude applied to the macropor-osity test specimens is calculated by equation (3)
Scalc~Sa
Emicro
Emeas (3)
where Emicro and Emeas represent the modulus of themicroporosity specimens and macroporosity testspecimens respectively and Scalc and Sa representthe newly calculated lsquonominalrsquo applied stress ampli-tude and the original stress amplitude based on a
sound test specimen respectively Using this equa-tion the calculated test stress amplitudes ranged fromapproximately 70 to 250 MPa instead of the fourstress amplitude groups of 53 66 96 and 126 MPaThe calculated stress is given in Table 3 for each testspecimen New data points using the calculatedstresses shown as open shapes are shown in the SndashNf plot in Fig 10 From Fig 10 the test specimensfall into a power function pattern with the higherstresses generally seeing shorter lives than the lowerstresses as is normally expected with fatigue dataEven with the calculated nominal stress the speci-mens with macroporosity still had significantlyshorter lives than the microporosity specimens withsimilar stress amplitudes It is apparent that using thisrepresentative stress amplitude alone does not entirelyexplain the poor fatigue behaviour of the specimenswith macroporosity The actual stresses responsiblefor failure are even higher than these calculatedstresses The calculated stresses in Fig 10 are basedon a measured modulus arising from the entirespecimen test section and are not determined at thefailure initiation sites
Results of the fatigue testing of the micro- andmacroporosity specimens are compared with thesound material test curve15 in Fig 11 Note that themicroporosity data (dashed curve) depart more fromthe sound data (solid curve) at decreasing levels ofstress and at lower levels of stress (300 MPa) thefatigue life is reduced by a factor of about 100 Sincethis microporosity is difficult to detect it may point toa cause of the overly large safety factor applied bydesigners to cast material throughout an entire castpart in lieu of the ability to predict the presence ofmicroporosity in parts and design for its localisedeffects The ratio of the stress amplitudes of themicroporosity specimens to macroporosity specimensrange from 5 at 102 cycles to failure to 3 at 105 cycleswhich emphasises the dramatically reduced fatigueresistance associated with macroporosity Run-outtests (Nfw56106 cycles) occurred at the 126 MPastress level in the microporosity test specimens
9 Porous material fatigue data grouped by modu-lus Emeas with scatterbands dotted patternmodulus 140 GPa and greater vertical shadingmodulus 110ndash139 GPa inclined shading modu-lus less than 110 GPa
10 Calculated stress amplitude macroporositydata squares lsquoleastrsquo porosity diamondslsquomiddlersquo porosity triangles lsquomostrsquo porosityand test stress amplitude data Sa for (filled cir-cles) microporosity material
136 Sigl et al Fatigue of 8630 cast steel in the presence of porosity
International Journal of Cast Metals Research 2004 Vol 17 No 3
The results of the fatigue testing point to theimportance of integrating the prediction of porosityin the casting process with the casting design In thecase of microporosity since it is difficult to detectusing nondestructive inspection (NDI) predictingmicroporosity in the casting process and consideringits effect on fatigue life of the part will be useful indesigning and producing parts with greater durabilityand reducing overly large factors of safety applied todesign calculations The results for the macroporosityspecimens provide a lower bound or worst caseboundary for property Certainly more research intothe effects of macroporosity and an explanation forthe significant data scatter observed here are war-ranted Unless an engineering approach can bedeveloped to conservatively consider the effects ofmacroporosity on the casting performance goodcasting practices and NDI must be relied upon toprevent it from occurring
Fractography and microscopy
Specimens with microporosity
Following the axial testing the specimen fracturesurfaces were examined with the use of a scanningelectron microscope (SEM) The examinationrevealed two types of cyclic failures for the micro-porosity specimens Specimens tested at strainamplitudes greater than or equal to ea~0003showed essentially no fatigue regions and had veryrough and jagged fracture surfaces These are similarto the monotonic fracture surfaces which despite thelow values of per cent elongation and per centreduction in area were widely covered with ductiledimples as shown in Fig 12 Ductile dimples areformed at discontinuities such as second-phaseparticles inclusions or grain boundaries within thesteel and begin to grow and coalesce into cracks thateventually lead to fracture of the component20 Thismicrovoid coalescence is typically associated withductile fracture
Specimens tested at strain amplitudes belowea~0003 had flat regions in the fracture surfaceindicating areas of fatigue crack growth (FCG) Clearregions of crack nucleation and final fracture werealso observed in these specimens The final fractureregion was composed primarily of ductile dimples(Fig 12) and the FCG region was composed offatigue facets Typical fatigue facets found in theFCG region are shown in Fig 13 Three low strainamplitude specimens were evaluated under the SEMand all were found to have cracks that nucleated fromsurface or near-surface porosity approximately200 mm in diameter such as shown in Fig 14
No indication of unsoundness was observed on theradiographs for all microporosity specimens Three ofthe 15 microporosity specimens were examined under20ndash30006 magnification Pores of 100ndash200 mm dia
11 Stress amplitude versus cycles to failure forsound cast 8630 material property curve15 micro-porosity data and macroporosity data usingcalculated stress amplitude from equation (3)
12 Typical ductile dimples found in final fractureregions of microporosity specimens
13 Typical fatigue facets found in FCG regions
Sigl et al Fatigue of 8630 cast steel in the presence of porosity 137
International Journal of Cast Metals Research 2004 Vol 17 No 3
were observed in the fracture surface of these threespecimens Only after sectioning the microporosityspecimens approximately 5 mm behind the fracturesurface and polishing to a mirror surface finish wasthe widespread presence of micropores revealed Theobserved micropores on the polished surface werenearly spherical in shape with diameters ranging fromapproximately 2ndash20 mm Larger pores on the order of200 mm as found in three specimens on the fracturesurface were not evident in any ground and polishedsections On the polished surfaces the microporeswere not distributed evenly across the surfacetherefore a conservative estimate of total localmicropore volume gathered by measuring the totalmicropore surface area from a high microporeconcentration region is approximately 065 An
image of typical micropores found on the groundsurface is shown in Fig 15
Specimens with macroporosity
Eight specimens with macroporosity were chosen tohave their fracture surfaces examined with the SEMThe fracture surfaces fell into two categories thosethat showed clear evidence of fatigue fractures such asin Fig 16a and those that did not (Fig 17a)Specimens with evidence of fatigue fractures typicallyhad a FCG region as indicated by a large flat regionon a macroscopic view and had the appearance offatigue facets on a microscopic view In severalspecimens a final fracture region was found on themacroscopic level as a shiny region containing a smallbut identifiable shear lip Upon evaluation of the finalfracture region on a microscopic level ductile
14 Near surface micropore of approximately 200 mmdiameter
15 Typical micropores found on ground surface
16 Macroporosity specimen a fracture surface showing signs of FCG near edges of specimen and bground surface
138 Sigl et al Fatigue of 8630 cast steel in the presence of porosity
International Journal of Cast Metals Research 2004 Vol 17 No 3
dimpling was observed as was the case with themicroporosity specimens Unfortunately none of thespecimens showed a clearly identifiable region ofcrack nucleation at a specific pore This introducesuncertainty to the application of predictive fatigue lifemodels
Fracture surfaces of the eight specimens selectedfor study were ground back to more clearly show theporosity present within the specimen The polishedsurfaces of the specimens are shown aligned in thesame orientation as the fracture surfaces in Figs 16band 17b The total macropore surface areas of thepolished surfaces were then measured using imageanalysis dividing this by the total cross-sectional areaof the specimens gives porosity ranging fromapproximately 22 to 309 for the eight specimensAlso a lsquocalculatedrsquo porosity percentage was deter-mined from the measured elastic modulus Emeas ofeach specimen according to equation (4)
Calculated porosity ~100 1Emeas
Emicro
(4)
where the constant Emicro is the modulus of thespecimens with microporosity The measured porearea percentages are compared to calculated porositypercentages in the third and fourth columns ofTable 4 It should be noted that the macroporositywas not uniformly spread throughout the gage sectionof the specimens Therefore the measured pore area
percentages are not entirely representative of the porevolume of these specimens and are merely a snapshotof a section near the region of fracture Though theirmagnitudes are different the calculated and measuredporosities appear to be in somewhat relative agree-ment between specimens
Modelling microporosity in fatigue lifecalculations
Fatigue life calculations for microporosity bystrainndashlife approach
The fatigue lives of the specimens with microporositywere calculated using the strainndashlife approach andmodelling the micropores as notches The poresresponsible for crack nucleation in the three speci-mens examined were spherical-shaped with a dia-meter of approximately 200 mm This pore size issmall compared to the 5 mm dia of the specimen atthe gage section Therefore the micropores weremodelled as a spherical notch contained within aninfinite body giving a stress concentration factorKt equal to 20521 This Kt value was then increasedby 7 according to Eubanks22 to account for thevicinity of the crack nucleation pores near the surfaceof the specimens The final value of Kt was thus takento be 219
The stress concentration factor was used tocalculate a fatigue notch factor Kf Fatigue strength
17 Macroporosity specimen a fracture surface with no signs of macroscopic fatigue and b ground surface
Table 4 Measured macropore and 3-D notch geometries
Ellipsoidal notch information
SpecimenYoungrsquosModulus E GPa Calc porosity
Meas porearea 3-D notch type
Major axis2a mm
Minor axis2b mm Kt Kf
H2 151 234 149 Neuber 225 18 236 223G7 143 274 22 SS 201 043 282 170C4 143 274 105 SS 150 075 247 205C10 141 284 135 Neuber 175 100 297 256C2 137 305 232 SS 333 115 266 221E6 120 391 276 Neuber 235 200 227 217E1 90 543 297 SS 410 179 254 230D5 87 558 309 SS 400 235 237 224
Sigl et al Fatigue of 8630 cast steel in the presence of porosity 139
International Journal of Cast Metals Research 2004 Vol 17 No 3
depends not only on the stress concentration factorbut also on the notch radius material strength andmean and alternating stresses23 Kf was determinedfrom Kt using
2124
Kf~1zKt1
1za=r (5)
a~002542070
Su
18
(6)
where r is the notch root radius inmillimetres Su is theultimate tensile strength of the material in MPa and ais a material constant in mm It should be noted thatequation (6) was originally developed for wroughtsteels24 Extending equation (6) to cast steels was thebest approximation available for the constant a
Nominal stresses were calculated at each strainamplitude tested assuming perfectly sound speci-mens This was accomplished using equation (1)which relates the nominal true stress DS and truestrain ranges De The local notch root stress andstrain ranges were then calculated from the nominalstress and strain ranges by simultaneously solvingNeuberrsquos rule equation (7) and the stable cyclehysteresis loop equation equation (8) given below as
DeDs~K2f De
DS (7)
De~Ds
Ez2
Ds
2K 0
1nrsquo
(8)
where Ds and De are the local axial stress and strain atthe notch root respectively The material propertiesE K9 and n9 were taken as those of the sound lsquokeelblockrsquo material as provided in Table 215 The localnotch strain range from equations (7) and (8) wasthen put into equation (2) to calculate the fatigue lifeof the specimens with microporosity
Spheroid notches of 10 20 100 and 200 mm diawere chosen to represent the range of possible poresizes where the fatigue failure initiates Theserepresentative values were chosen based on observa-tions made on the fracture and polished surfaces anddemonstrate how micropore size data might be usedto determine the effect of microporosity on the steelfatigue resistance The resulting life calculations areshown in Table 5 and in graphical form in Fig 18which plots the strain amplitude ea versus cycles to
failure Nf Note that calculated run-out points are notindicated in Fig 18 and note that life calculationmodelling lines are extended out to 16107 cycles Anynotched fatigue life values that are calculated to begreater than 56106 cycles should be consideredlsquocalculatedrsquo run-outs
The results shown in Fig 18 are encouraging sincemicropores responsible for the failure of the threecircled specimens in Fig 18 were observed to benearly spherical in shape with diameters of approxi-mately 100ndash200 mm and were located at or near thespecimen surface The three experimental data pointsagree better with the 100ndash200 mm pore size calcula-tions than with the 10ndash20 mm pore or sound materialcurves Calculations using micropores of 100ndash200 mmdia result in reasonably accurate and conservative lifecalculations using the strainndashlife approach for allmicroporosity specimens Also the two run-outspecimens that were tested at the lowest strainamplitude agree with the run-out calculation for the200 mm sized pore Examination of the microporespecimen fracture surfaces with a SEM showedthat the specimens tested at high strain amplitudesDe2o0003 showed no clear indication of crack
Table 5 Comparison of experimental microporosity specimen fatigue lives and calculated fatigue lives for200 mm spherical notch using local strainndashlife model
ea ExperimentalNf cycles CalculatedNf (cycles) for a 200 mmnotch
001 10 270008 29 400006 153 and 381 700004 3800 1700003 650 and 3476 3000002 19 299 210000015 62 112 11 8000001 517 015 and 512 858 222 00000008 951 965 1 240 000000065 Run-outrun-out Run-out
Note fatigue lives for runs at repeated strain levels are separated by lsquoandrsquoStrain amplitude approximated using load controlRun-out was taken as 5 000 000 cycles
18 Local strainndashlife curve for sound materialmicroporosity data and model calculations formicroporosity specimens using 10 20 100 and200 mm dia surface notches
140 Sigl et al Fatigue of 8630 cast steel in the presence of porosity
International Journal of Cast Metals Research 2004 Vol 17 No 3
nucleation FCG or final fracture regions whereasthe specimens tested at low strain amplitudes De2v0003 clearly demonstrated all of these features Thismay explain the disagreement with the two points at thefar left in Fig 18 Since the most useful region of thisfigure is the high cycle range these high strain levelswould not be desirable in a design or application
Modelling micropores by linear elastic fracturemechanics (LEFM)
Linear elastic fracture mechanics (LEFM) principleswere used to calculate the microporosity specimenlives and compare with fatigue testing results It isassumed that for the microporosity material a fatiguecrack of size lsquoarsquo has a crack growth rate of dadN thatcan be modelled by the Paris equation
da
dN~A(DK)n (9)
where A and n are material constants and DK isthe mode I stress intensity factor range operatingon the crack The constants A and n are determinedfrom crack test data for a given material andunfortunately it was not feasible to measure fatiguecrack growth properties in the current series ofmaterial testing for the microporosity specimensTherefore properties from the sound material asgiven in Table 615 were used in the LEFM calcula-tions presented here
For fully reversed testing the value of DK wascalculated using equation (10)
DK~Smax
ffiffiffiffiffiffipa
pF (10)
where Smax is the maximum stress a is the crack depthand F represents a shape factor that relates thegeometry of the crack front to the crack depth Equa-tion (10) only takes into account Smax because theminimum stress intensity factor is undefined in com-pression and will have a value of zero Additional crackclosure was not incorporated Substituting equa-tion (10) into equation (9) and integrating from theinitial crack depth ai to the final crack depth af resultsin equation (11) giving the total cycles to failure
Nf~
ethNf
0
dN~
ethafai
da
A(Smax
ffiffiffiffiffiffipa
pF )n
(11)
Cracks responsible for the failure of the specimenswere formed from pores located near or at the surfaceof the round specimens Therefore the cracks weremodelled as semi-circular surface cracks Formancreated a model for semi-circular cracks growing inround bars much like the cracks growing in thesespecimens25 Using this model where Dsp is the
diameter of the round specimen the shape factorF(aDsp) becomes
Fa
Dsp
~g
a
Dsp
0725z202
a
Dsp
z037 1 sinp
2
a
Dsp
3 (12)
ga
Dsp
~092
2
p
tan
p
2
a
Dsp
p
2
a
Dsp
1=2
cosp
2
a
Dsp
The initial crack length was taken as the square rootof the projected area of the pore that nucleatedthe crack1012 For simplicity it was assumed that forall microporosity specimens the cracks leading tofracture nucleated from 200 mm dia pores Thereforean initial crack length of 177 mm was used for allmicropore specimens This assumed initial cracklength is termed lsquophysically smallrsquo by ASTM Stand-ard E647 since it is less than 1 mm26 Five of the eightstress levels resulted in DK below the long crackthreshold stress intensity factor DKth so small crackgrowth behaviour was assumed to exist Since smallcrack growth behaviour was not evaluated for thesound specimens this growth was calculated byextrapolating equations (9) and (11) into the smallcrack growth region from the sound data15 Thespecimens tested at strain amplitudes greater thanea~00015 were run in strain control so the stablecycle stress taken from mid-life of the specimen wasused as an approximation of Smax The maximumstress used during testing must be less than or equal toeight-tenths of the yield strength for LEFM to beapplicable Therefore two of the testing levelsea~001 and ea~0008 could not be evaluated withthis procedure since the stable cycle tensile peaks weretoo large and violated LEFM restrictions
The final crack length of each specimen wasdetermined either at the point where net sectionyielding would occur or at the point where the criticalstress intensity factor Kc was reached Some difficultyarises applying this method for final crack sizedetermination in the Forman crack front modelThe Forman model is only capable of reaching cracksizes equivalent to the radius of the specimen as isdemonstrated by the following equation for determin-ing the crack length
r~a(2Rspa)
2(Rspa) (14)
where r is the radius of the circle describing the crackfront a is the crack length and Rsp is the specimenradius As the crack length a approaches Rsp theequation becomes undefined If net section yieldingcould only be reached when a crack length larger thanRsp was reached the crack shape was assumed tobecome a straight front so net section yielding andconsequently af could be calculated Equations (12)and (13) were used to calculate the stress intensityfactor It was found that all failures occurred by netsection yielding
Table 6 Crack growth properties
Property Data used for calculations
Sy MPa 1088DKth MPa m12 94Kc MPa m12 135A m cycle^1 263610^12n 303
Properties from sound material15 at R~0
(13)
Sigl et al Fatigue of 8630 cast steel in the presence of porosity 141
International Journal of Cast Metals Research 2004 Vol 17 No 3
Table 7 gives specimen test information and theexperimental and calculated fatigue lives using theForman crack front model These results arecompared in Fig 19 It can be seen that LEFMcalculations (dotted line) modelling the micropores ascracks overestimates life compared to all test dataexcept the three longest life specimens In thecalculations five of the eight strain amplitudes werenot large enough to produce a stress intensity factorthat was above the long crack threshold intensityfactor of DKth~94 MPa m12 for the given cracksize Even though the LEFM calculations indicatedthat the initial discontinuities would not lead tospecimen failure if they were treated as long cracksevaluation of the fracture surface indicated that thenear surface porosity did indeed contribute to thefailure Since small crack growth can occur below thisDKth an explanation for this disagreement lies inlooking at small crack growth
Small crack growth is greatly influenced by themicrostructure of the component and is often veryunpredictable It can be approximated by the extra-polation of the Paris equation into the small crackgrowth behaviour lsquoregimersquo as was done here Howeverthis extrapolation may have contributed to unrealisticcalculations Another source of error is the use offatigue crack growth properties that were not meas-ured for the microporosity specimens It was hopedthat the sound material constants A and n used inequation (9) could be used in the material with
microporosity However it appears now that com-pared to sound material material with microporositywill likely have a lower threshold value and a fastercrack growth rate at a given DK as a result of stressconcentrations created around microvoids within thematerial Shorter LEFM calculated specimen lives willresult from either shifting the Paris equation up byincreasing the constant A or from increasing the slopeof the equation by raising the value of the exponent nBoth would lead to shorter calculated specimen life
Fatigue life calculations formacroporosity
Macroporosity fatigue life calculations bystrainndashlife approach
An appropriate notch model must be selected tocalculate the fatigue life of the macroporosity speci-mens using the strainndashlife approach Both size andshape for the notch responsible for the failure must bedefined for the notch Since it was not possible in thepresent study to identify particular notches responsiblefor failures of the macroporosity specimens the courseof action taken was to perform test calculations using avariety of available notch models using notch (pore)size and shape data determined from microscopy
As an initial step specimen C4 was determined tobe a representative specimen for the purpose ofapplying strainndashlife calculations In specimen C4 themacroporosity was encapsulated at the specimencentre and did not extend as near the surface as it didin some specimens Specimen C4 had three largemacropores on the ground-back fracture surfaceBased on the average dimension of the pores in C4 aspherical notch of radius 075 mm was selected as therepresentative notch The cross-sectional area of thisnotch was close to the average pore area in specimenC4 Using the spherical notch model21 for this size ofnotch gave agreement between calculated and meas-ured fatigue life for specimen C4 In the current workthese stress concentration factors were determinedfrom best fit lines to the curves found in the handbookof stress concentration factors by Peterson21 Theseassume the notch to be internal in an infinite bodyand so the surface stress concentration factor Kt wasincreased by 7 as mentioned earlier
As a next step results of the life calculations arecompared with experimental lives in Fig 20 using thislsquorepresentativersquo 075 mm radius notch for all speci-mens Note that the data point for specimen C4 is
Table 7 Results of modelling single 200 mm diameter pore as surface crack
Smax MPa of net section yielding ExperimentalNf cycles af mm CalculatedNf cycles
862 792 153 and 381 157 27 400790 726 3800 180 35 700698 642 650 and 3476 207 51 900395 363 19 299 304 291 000296 272 62 112 342 699 000198 182 517 015 and 52 858 381 2 360 000158 145 951 965 398 4 680 000126 116 Run-out and run-out 415 Run-out
Note fatigue lives for runs at repeated stress levels are separated by lsquoandrsquoRun-out is 56106 cyclesSmall crack growth assumption was needed to make life predictions
19 LEFM model calculations for microporosityspecimens using crack length based on 200 mmpore compared with sound material and micro-porosity data
142 Sigl et al Fatigue of 8630 cast steel in the presence of porosity
International Journal of Cast Metals Research 2004 Vol 17 No 3
indicated in the figure Since an identical notch size isused in all specimens the variables reflecting thedifferent amounts of porosity in each specimen areEmeas and Scalc Macropores cause a substantial lossof cross-sectional area within the specimen and hencea large increase in the applied stress Considering thisthe calculated stress from equation (3) was used as thestress amplitude in the strainndashlife modelling Agree-ment between experiment and calculation is good forabout two-thirds of the specimens in Fig 20 andpoor for the other third Also where there is pooragreement it is unfortunately non-conservative
Eight specimens (circled in Fig 20) four of whichare above the upper 106 life interval line wereselected for further analysis to see if using morescrutiny in the selection of the notch model and thenotch dimensions would produce better agreementThese eight specimens are the same specimens listed inTable 4 Note that these eight specimens were testedover a range of stress amplitude levels Specimens C10and E6 were chosen for detailed analysis specificallyfor their unusually long and short lives respectivelyEach macroporosity casting group was represented inthe eight selected specimens
Aside from the 075 mm radius spherical notchmodel used in Fig 20 hemispherical or 3-D ellipsoi-dal notches (the SadowskySternberg or the Neubernotch models) were used to model the stressconcentration factors The SadowskySternberg type
notch was used for pores that loosely resembled theshape of a cigar or American football Pores of thistype required measurements of the major and minoraxes which were determined by microscopy of the 2-D polished surface images The Neuber notch modelwas used for pores that were more disc-shaped Theplane of the ellipse is parallel to the loading directionfor the Neuber notch with the axis of revolutionabout the minor axis Notch size and shape data arerequired to develop a lsquomodelrsquo notch within thematerial and this was determined from microscopyUsing these notch models the stress concentrationfactors Kt ranged from 227 to 297 From Kt a fatiguenotch factor was calculated using equations (5) and(6) Table 4 contains the ellipsoidal notch informa-tion used in the specimens selected for analysis notchtype major and minor ellipse axes length Kt and KfIn cases where a specimen contained multiple poresthe notch was created to fit the dimensions of thelargest pore on the ground surface of the specimen
Using Scalc from equation (3) the nominal strainranges were determined from equation (1) and thenotch root strain was determined from equations (7)and (8) The specimen life was calculated usingequation (2) with the results shown in Table 8Calculated versus experimental fatigue lives areshown in Fig 21 using solid data points for strainndashlife modelling Generally the calculations are still non-conservative The effectiveness of the local strainndashlifemodel with ellipsoidal notches in calculation of thefatigue life of specimens with macroporosity variedsignificantly Unfortunately no remarkable differ-ences were observed during microscopy examinationbetween the specimens that were in good and in pooragreement with the notch modelling
However there are fundamental factors thatcontribute to the modelling uncertainties and maybe sources of disagreement between the notchcalculations and tests complex pore shape aninability to determine a specific pore responsible forfailure the presence of multiple pores in the speci-mens the use of infinite body notch models use ofbulk material properties of the microporosity speci-mens and the use of a calculated stress based on themodulus Emeas The shape of the porosity was verytorturous and made the process of fitting a notch tothe pore geometry difficult and not entirely quanti-tative This contributes to uncertainty in the notchdimensions Though many macropores were evidentthroughout the ground surfaces of some of thespecimens the fatigue life calculation only takes
20 Calculated versus experimental life for strainndashlife modelling based on typical macroporesphere found in specimen C4 Rpore~075 mm
Table 8 Results of modelling macropores as ellipsoidal notches using local-strain model
SpecimenStress amplitudeSa MPa
Calculated stressScalc MPa
Youngrsquos ModulusE GPa
ExperimentalNfcycles
CalculatedNfcycles
H2 66 86 151 769 074 834 000G7 53 73 143 249 752 Run-outC4 126 174 143 24 320 24 500C10 66 92 141 4 053 800 295 000C2 96 138 137 1365 60 275E6 126 207 120 160 6800E1 96 211 90 1935 4333D5 53 120 87 10 812 124 000
Run-out is 56106 cycles or greater
Sigl et al Fatigue of 8630 cast steel in the presence of porosity 143
International Journal of Cast Metals Research 2004 Vol 17 No 3
into account the influence of a single pore or tightlyspaced group of pores modelled as a single ellipsoidalnotch Strainndashlife material properties from the speci-mens with microporosity were used in the fatigue lifecalculations for the specimens with macroporosityThese material properties used are given in Table 2This is believed to be an accurate representation of thespecimens with macroporosity because the lsquosoundrsquoportions of the specimens were observed to containmicropores ranging from approximately 10 to 200 mmin diameter Essentially the macropore notches residewithin material having properties of the specimenswith microporosity Recall that the notch modelsassume an infinite body However as is evident inFigs 16 and 17 the macropores are of a sizecomparable to the nominal area of the specimenTherefore another shortcoming of the calculations isthat the lsquocorrectedrsquo infinite body solution does notaccurately reflect the true Kt of these specimens Thepores were also very large in relation to the overalldimension of the specimens It may have beenbeneficial to use larger specimens or create specimenswith smaller amounts of porosity Either case wouldaddress these issues and reduce the differencebetween the specimens and the notch model Finallyto develop a truly predictive model the stress input
for the life calculation equations must be model-based instead of using a measured stress Scalc
Modelling macropores by LEFM approach
Modelling the fatigue lives of the eight selectedspecimens listed in Table 4 by LEFM was alsoperformed Since it could not be determined throughfractographic analysis which pores were responsiblefor the failure of a particular specimen the squareroot of the total surface area of the porosity was usedto determine the initial crack length for each specimenas measured It was anticipated that this approachwould give a conservative estimate and would beapplicable for life calculations The crack length atfracture was determined to be the point of net sectionyielding and was determined in the same manner as afwas found in the micropore LEFM calculations Thevalue of DK was determined using equations (10) (12)and (13) and the maximum nominal stresses encoun-tered during testing The Forman crack front modelequations (12) and (13) was again used as a result ofthe presence of surface porosity on all of theevaluated specimens though actual crack nucleationregions could not be determined The life calculationwas made by numerically integrating equation (11)with the results shown in Table 9
Fatigue lives calculated using LEFM are plotted inFig 21 versus experimental fatigue lives using lsquoopenrsquosymbols The LEFM life calculations producedresults that were generally in less agreement withthe measurements than the notched strainndashlifecalculations Only one of the LEFM life calculationswas conservative with five specimens having calcu-lated lives more than 10 times longer than what wasobserved experimentally The initial crack length wastaken as the square root of the total pore surface areafound on the ground surface instead of just a singlepore or group of pores that were thought to beresponsible for the failure of the specimen whichshould have led to conservative results As withmodelling the micropores the use of crack growthproperties taken from sound (keel block) materialmay have adversely affected the life calculations ofthe specimens with macroporosity In summaryassumptions that may have resulted in disagreementbetween the model calculations and test data aremodelling macropores as the square root of the totalpore area uncertainty in the actual macropore sizesresponsible for failure and the lack of good crackfront propagation models for material surroundingthe macroscopic pore
Table 9 Results of modelling macropores as crack
Specimen Smax MPa ExperimentalNf cycles ai mm af mm CalculatedNf cycles
H2 66 769 074 170 444 1 080 000G7 53 249 752 066 452 Run-outC4 126 24 320 144 413 294 000C10 66 4053 800 163 444 1320 000C2 96 1365 214 428 119 000E6 126 160 233 413 31 400E1 96 1935 241 428 56 400D5 53 10 819 246 452 298 000
Run-out is 56106 cycles or greaterStress intensity factor threshold value was not exceeded
21 Calculated versus experimental life for strainndashlife and LEFM modelling for eight identifiedpoints in Fig 20 using pore measurementsgiven in Table 4
144 Sigl et al Fatigue of 8630 cast steel in the presence of porosity
International Journal of Cast Metals Research 2004 Vol 17 No 3
Discussion
Cyclic and fatigue material properties were measuredthrough strain and load controlled R~21 testing ofthe microporosity specimens Microporosity speci-mens had low Dep2 at high strain amplitudes andvirtually no Dep2 at strain amplitudes lower than De2~0006 The fatigue limit Sf was also much lowerthan sound cast material The difference in materialproperties was as a result of the occurrence ofmicroporosity Comparison of the micropore caststeel material with sound specimen propertiesrevealed similar monotonic strengths but reducedductility Percent reduction in area was significantlyreduced by approximately a factor of 4 and though adirect comparison between per cent elongation wasnot possible a value of 25 would be consideredvery low for cast steels of similar strength whichnormally have a per cent elongation near 20Microporosity had a significant influence on thecyclic and fatigue properties of the specimens withmicroporosity The reduced ductility of the steel gavea lack of plastic strain observed during cyclingcausing the elastic strain amplitudes to remain largerthan the plastic strain amplitudes at all strain levelstested This would cause the material to behave in amore brittle manner with increased crack growthrates and consequently reduced fatigue strengths at allstrain amplitudes Evidence of this is shown in thereduced fatigue limit at 56106 cycles which is lessthan half of the Sf observed in the sound specimensFurther the micropores themselves would act asstress risers within the specimen further decreasingthe crack nucleation times
Specimens containing macroporosity performedsignificantly more poorly than specimens that con-tained microporosity in fatigue testing For a stressamplitude of 126 MPa the two specimens withmicroporosity resulted in run-out tests their fatiguelives were greater than 56106 cycles At the same stresslevel eightmacroporosity specimens in all three groupswere tested and the lives of these specimens rangedfrom 160 to 41 000 cycles Within the three macro-porosity specimen groups the lsquoleastrsquo and lsquomiddlersquoporosity groupswere found to have similar fatigue livesand both outperformed the lsquomostrsquo porosity group Acorrelation between the measured specimen modulusEmeas the porosity level (represented by specimengroup) and the specimen fatigue life was observed Thespecimen modulus Emeas was shown to have a strongcorrelation with the fatigue life of the specimens andwas subsequently used as a new way of grouping thespecimens Generally specimens with higher Emeas
outperformed the lower modulus specimens butsignificant scatter could still be observed withinthe modulus groups particularly noticeable in themodulus 110ndash139 GPa grouping as well as in thecalculated stress grouping Emeas appears to be a betterindicator of fatigue performance than specimen group-ing but this information alone cannot be accuratelycorrelated to the life of a specimen
The most common pore size found on the polishedmicroporosity specimen surfaces with microporositywas approximately 8 mm in diameter However sizesup to 20 mm in diameter were also observed Larger
pores on the order of 200 mm in diameter wereobserved on several of the specimen fracture surfacesThough these larger pores may not be numerouswithin the current material they have a significantinfluence on the fatigue life From local strainndashlifemodelling a notch diameter of 200 mm gave goodagreement with fatigue testing LEFM modelling ofmicropores did not produce accurate life calculationsas a result of the small crack growth behaviour of themicropores and lack of crack growth property data
As a result of the small size of the micropores theextent of microporosity could not be determinedconclusively neither by examination of the radio-graphs nor through the examination of the fracturesurfaces Information on the size and distribution ofmicroporosity was gathered through microscopyconducted on ground surfaces of the microporosityspecimens The total microporosity area was deter-mined to be 065 or less within the microporosityspecimens This relatively small percentage of micro-porosity caused significant reduction in ductilityperformance which concurs with a study by otherswho found that microporosity values greater than05 significantly reduced per cent elongation and percent reduction in area while having little effect onstrength properties27
For the macroporosity specimens it was deter-mined that strainndashlife calculations using a sphericalnotch radius of 075 mm gave agreement with the testdata to within one decade for 20 out of the 27 ofthe specimens tested The notch radius used in thecalculations was chosen because it agrees with thepore radius observed via SEM in a lsquotypicalrsquo macro-porosity specimen and the equivalent radius ofporosity on ASTM standard radiographs17 Thedisagreement between the measured and calculatedlives of the specimens with macroporosity wasprimarily non-conservative for both the strainndashlifeand LEFM approaches with LEFM giving moredisagreement The largest disagreement between thecalculations and test data was observed at the lowestlived specimens (highest stress levels)
Modelling the effect of macroporosity using thestrainndashlife and LEFM approach was hindered bythe torturous shape of the shrinkage porosity and thelarge size of the macropores relative to the specimendiameter Determining a proper value for Kt wasdifficult The complex shape of the porosity is not theidealized hemispherical and three-dimensional ellip-tical notches Here as in other investigations anenvelope was constructed around the pore toapproximate it as a 200 mm sphere (in the case ofmicroporosity) and a 075 mm dia sphere and three-dimensional notches as shown in Table 4 (in the caseof macroporosity)910 This is the first attempt bythese authors to relate the fatigue life to the size of theporosity as it may be found on an X-ray or a cutsection The crack initiation and growth from pores ismuch more complex than this and is influenced by thedetailed geometry of pores deep in the solidifiedstructure with smaller radii and sharper cornersHowever crack initiation and growth from pores alsodepend upon location of these pore features relativeto the grain boundaries and the orientation of grainboundaries on the pore periphery relative to the
Sigl et al Fatigue of 8630 cast steel in the presence of porosity 145
International Journal of Cast Metals Research 2004 Vol 17 No 3
stress28 These issues may be difficult to include in ageneral predictive model and a more thoroughanalysis that takes into account more details of poreshape and other issues will have to be done in the futureto see if predictions can be improved Modelling theeffect of macroporosity using LEFM was hindered byusing crack growth properties taken from sound lsquokeelrsquoblock material as well as the large size of macro-porosity located within the specimens which isexpected to increase the stress amplitude in the sectionExamination of the porous material fracture surfaceswith the SEM showed that many specimens had noclear indication of crack nucleation FCG or finalfracture regions on either the micro- or macroscopiclevels However several specimens tested did haveFCG and final fracture regions similar to the micro-pore material low strain amplitude specimens on boththe micro- and macroscopic levels but there was noclear indication of crack nucleation
Summary and conclusions
Cast steel containing a variation in porosity frommicro- to macro- levels was tested for monotonicstrength and fatigue and the experimental fatigueresults were then compared with fatigue calculationmodels No porosity was seen in radiographs of thespecimens with microporosity whereas the lsquoleastrsquo andlsquomiddlersquo macroporosity groups appeared to containsimilar amounts of porosity and the lsquomostrsquo macro-porosity group contained noticeably greater porosity
Based on the preliminary calculations performedhere there is evidence that using strainndashlife models forcast steel with microporosity can provide an engi-neering approach sought to couple casting simulationprediction of porosity with the prediction of partfatigue performance Since microporosity in steel isnot usually detected by radiography (or othernondestructive inspection techniques) the possibilityof its presence in parts can be considered in the designprocess either by lsquowhat-ifrsquo analysis or by integratingcasting process simulations with the design analysesWhen the fatigue test results for both the micro- andmacroporosity specimens are compared with soundkeel block data the full range of mechanical propertydegradation caused by porosity is seen The issueswhich are believed to prevent good agreement betweencalculations and test specimen life data for themacroscopic specimens continue to be investigated
Acknowledgements
This research was undertaken as part of the IntegratedDesignof Steel Castings for Service Performanceprojectwhich is funded by the United States Department ofDefense through the American Metalcasting Consor-tium (AMC) PRO-ACT program AMCrsquos PRO-ACTprogramme is sponsored by Defense Supply CenterPhiladelphia (DSC Philadelphia PA USA) and theDefense Logistics Agency (DLA Ft Belvoir VAUSA) This research is also conducted under theauspices of the Steel Foundersrsquo Society of Americaand through substantial in-kind support guidance andinterest from SFSA member foundries In particularthe authors would like to thank Harrison Steel forseveral trial iterations on the casting of test specimens
and the final test specimen castings Alloy WeldInspection Co for their digital and film radiographyof the fatigue test specimens and MAGMAGmbH fortheir support of the porosity prediction model used todesign the test specimen castings
References1 ASTM in lsquo2002 Annual book of ASTM standardsrsquo Vol 0303
189ndash191 2002 West Conshohocken PA American Society ofTesting and Materials
2 ASTM in lsquo2002 Annual book of ASTM standardsrsquo Vol 030381ndash83 2002 West Conshohocken PA American Society ofTesting and Materials
3 ASTM in lsquo2002 Annual book of ASTM standardsrsquo Vol 0303125ndash127 2002 West Conshohocken PA American Society ofTesting and Materials
4 m kohno and m makioka AFS Trans 1970 9ndash165 k chijiwa t nakayama and m imamura CIF 36 1ndash126 j g conley b moran and j gray lsquoAluminum in automotive
applicationsrsquo Vol 1350 25ndash38 1998 SAE Special Publications7 q g wang d apelian and d a lados J Light Metals 2001
1 73ndash848 c m sonsino and j ziese Int J Fatigue 1993 15 75ndash849 p heuler c berger and j motz Fatigue Fract Eng Mater
Struct 1992 16 115ndash13610 s jayet-gendrot p gilles and c migne lsquoFatigue and
fracture Vol 1rsquo Vol 350 107ndash116 1997 American Societyof Mechanical Engineers Pressure Vessels and Piping Division
11 t mansson and f nilsson Int J Cast Met Res 2001 13373ndash378
12 p hausild c berdin p bompard and n verdiereMater SciEng A 2002 335 164ndash174
13 r hardin and c beckermann in lsquo2002 SFSA technicaland operating conference proceedingsrsquo Chicago IL SteelFoundersrsquo Society of America Paper 45 1ndash10
14 k d carlson z lin r a hardin c beckermanng mazurkevich and m c schneider Proc Conf onlsquoModeling of casting welding and advanced solidificationprocesses Xrsquo Destin Florida May 2003 295ndash302
15 r i stephens lsquoFatigue and fracture toughness of five carbon orlow alloy cast steels at room or low climatic temperaturesrsquoCarbon and Low Alloy Technical Research Committee SteelFoundersrsquo Society of America Des Plaines IL 1982
16 ASTM in lsquo2002 Annual book of ASTM standardsrsquo Vol 0301569ndash583 2002 West Conshohocken PA American Society ofTesting and Materials
17 k carlson s ou r hardin and c beckermann Int J CastMet Res 2001 14 169ndash183
18 ASTM in lsquo2002 Annual book of ASTM standardsrsquo Vol 0301738ndash745 2002 West Conshohocken PA American Society ofTesting and Materials
19 ASTM in lsquo2002 Annual book of ASTM standardsrsquo Vol 030160ndash81 2002 West Conshohocken PA American Society ofTesting and Materials
20 c r brooks and a choudhury lsquoFailure analysis ofengineering materialsrsquo 2002 New York McGraw-Hill
21 r e peterson lsquoStress concentration factorsrsquo 1974 New YorkWiley-Interscience
22 eubanksr a Trans ASME 76 Appl Mech Section 57ndash62
23 r i stephens a fatemi r r stephens and h o fuchs lsquoMetalfatigue in engineeringrsquo 2nd edn 2000 New York Wiley-Interscience
24 Society of Automotive Engineers lsquoFatigue design handbookrsquoVol 4 29 1968 Warrendale PA SAE
25 r g forman and v shivakumar lsquoFracture mechanicsrsquo17th volume ASTM STP 905 Philadelphia ASTM 198659ndash74
26 ASTM in lsquo2002 Annual book of ASTM standardsrsquo Vol 0301603ndash644 2002 West Conshohocken PA American Society ofTesting and Materials
27 j a griffin r d griffin and c d pears in lsquo2000 SFSAtechnical and operating conference proceedingsrsquo Chicago ILSteel Foundersrsquo Society of America Paper 25 1ndash10
28 j-y buffiere s savelli p h jouneau e maire andr fougeres Mater Sci Eng A 2001 316 115ndash126
146 Sigl et al Fatigue of 8630 cast steel in the presence of porosity
International Journal of Cast Metals Research 2004 Vol 17 No 3
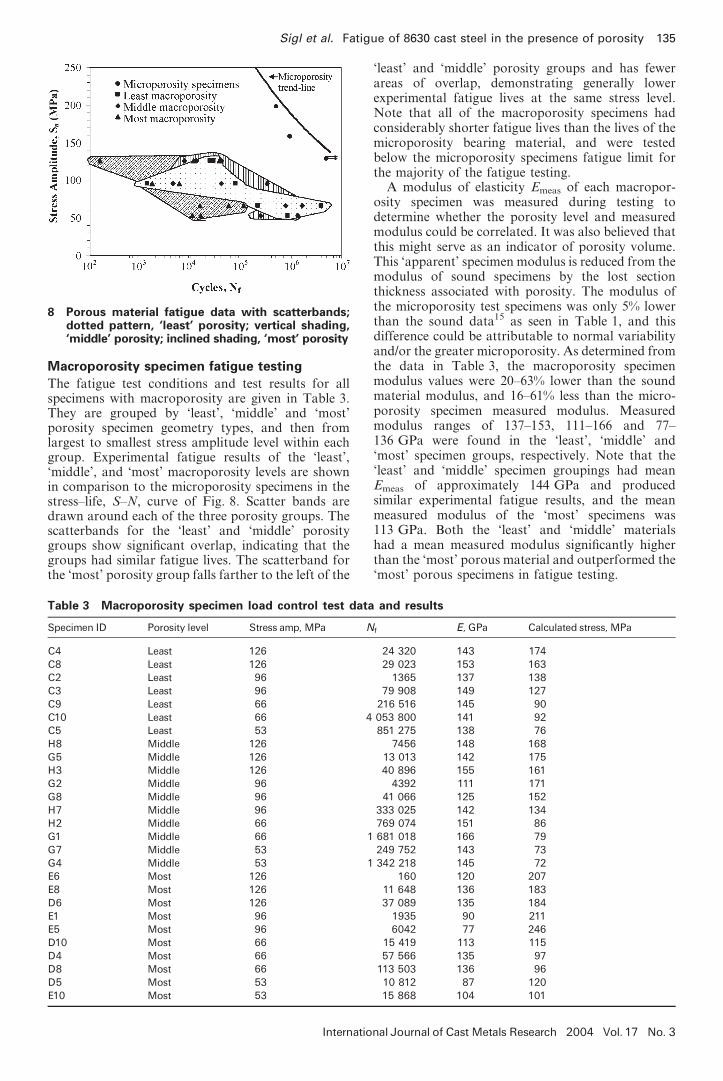
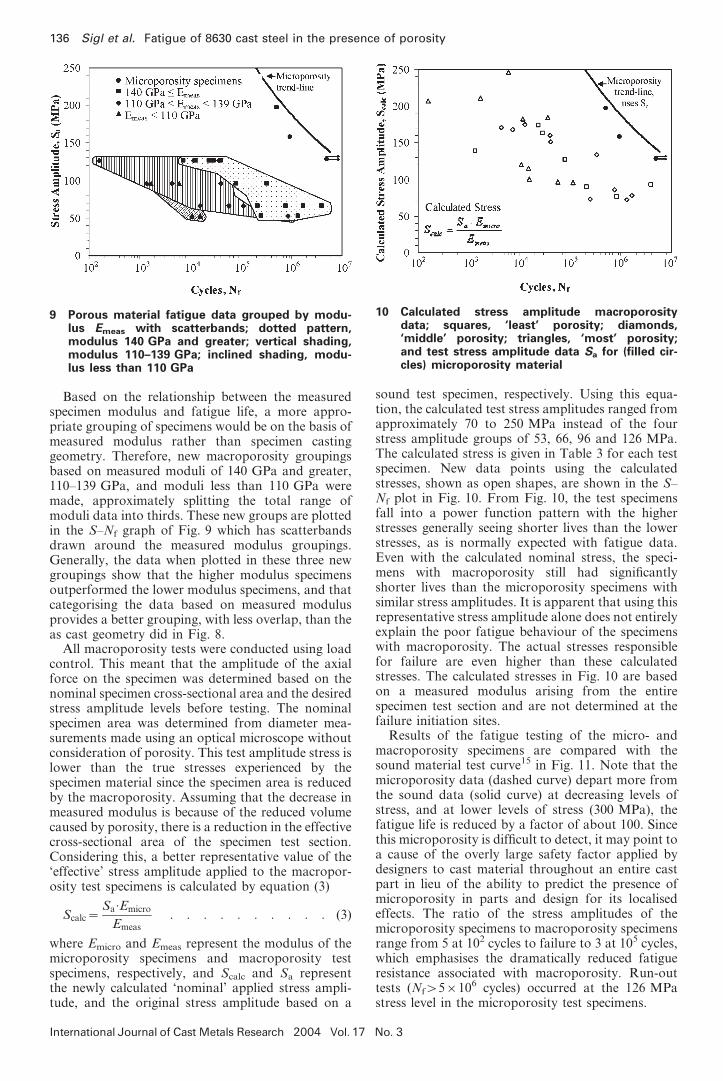
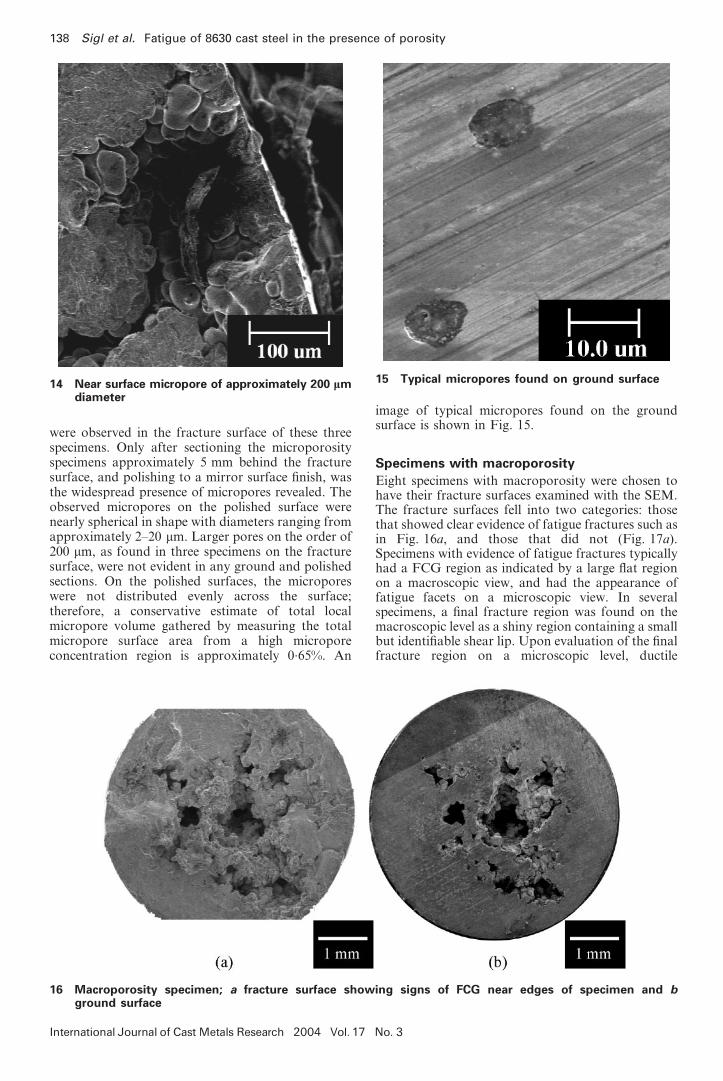
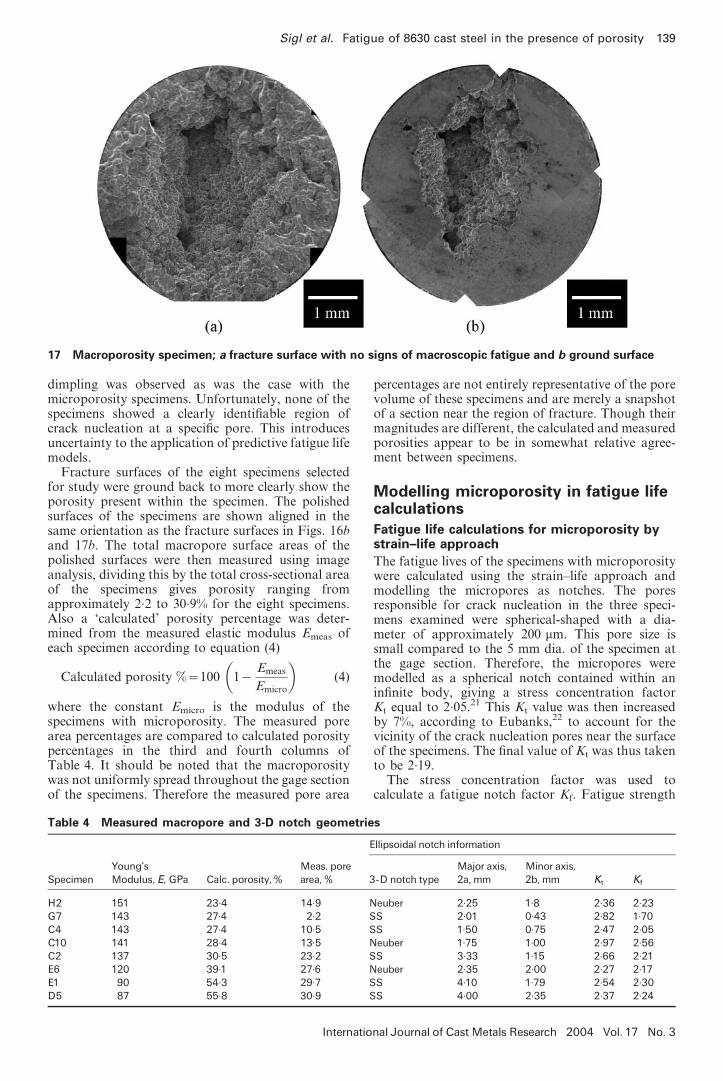
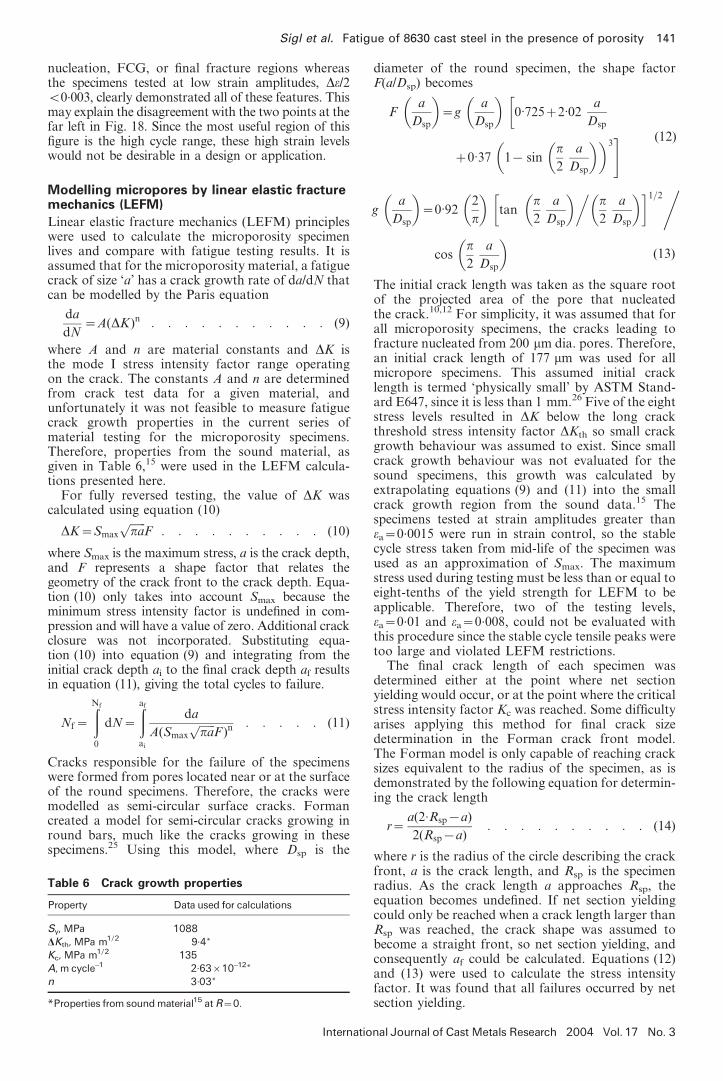
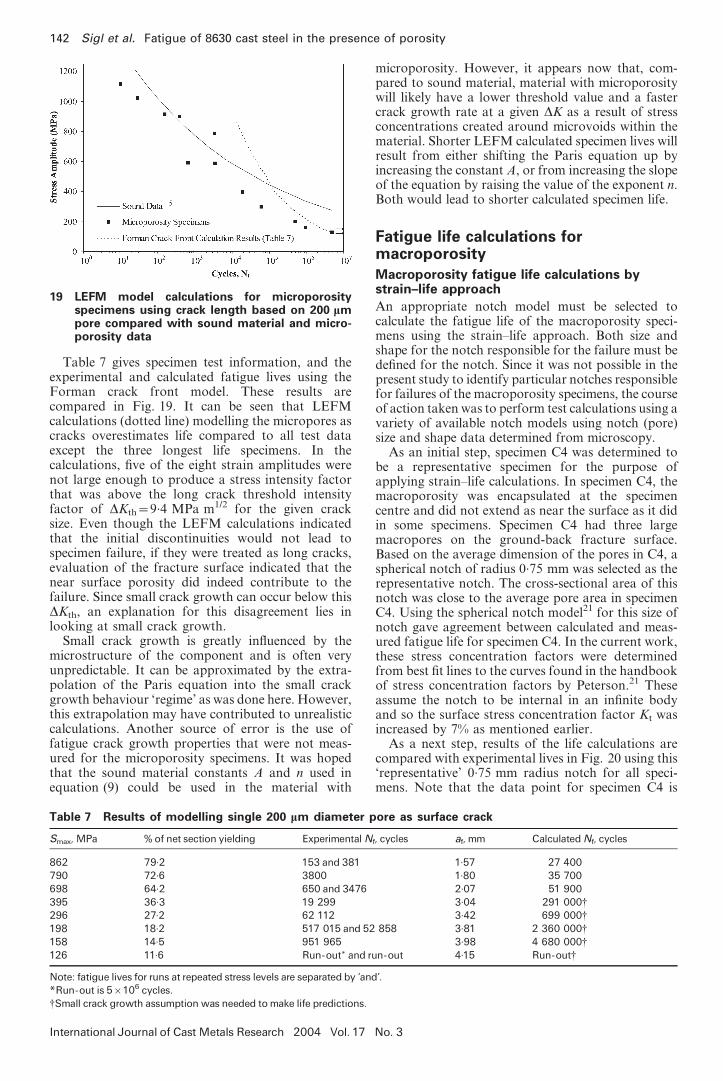
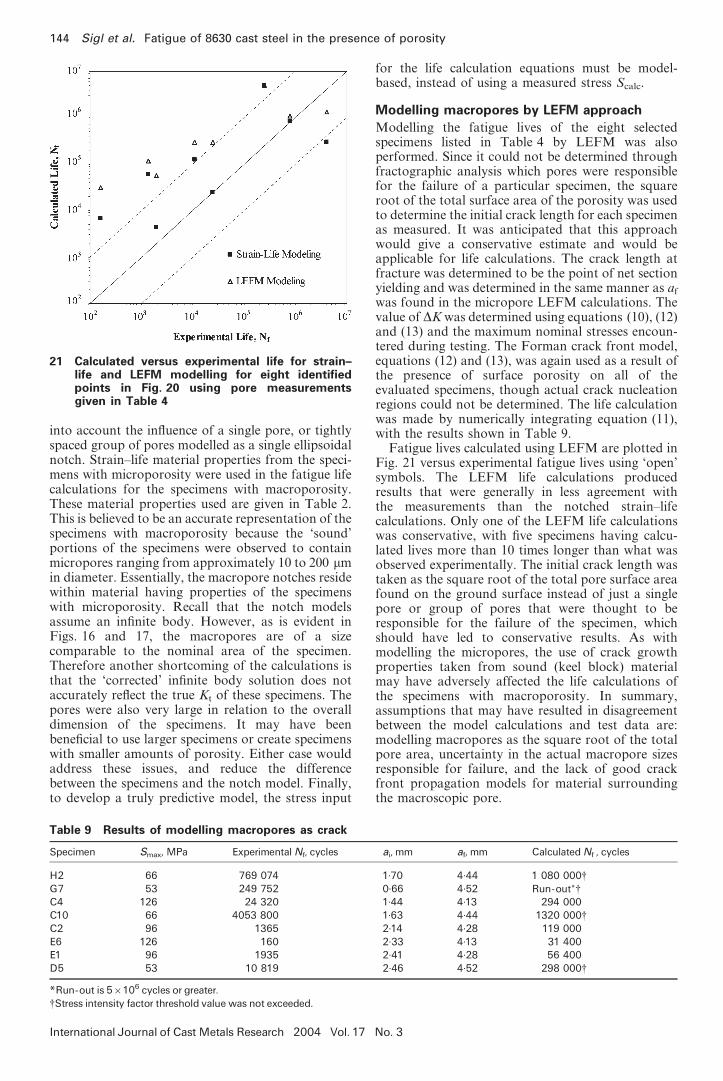