8.1 Economic Valuation of Ocean Color Data Records
21
8.1 Economic Valuation of Ocean Color Data Records Paula Bontempi (NASA Headquarters), Ivona Cetinić (NASA GSFC USRA) and Roger Cooke (Resources for the Future) IOCCG-24 Meeting – Hanoi, Vietnam 4-6 April 2019
Transcript of 8.1 Economic Valuation of Ocean Color Data Records

8.1 Economic Valuation of Ocean Color Data Records
Paula Bontempi (NASA Headquarters), Ivona Cetinić (NASA GSFC
USRA) and Roger Cooke (Resources for the Future)
IOCCG-24 Meeting – Hanoi, Vietnam
4-6 April 2019

Where do we start?
Carbon.
Aquatic carbon.
Ivona and Roger have done the lion’s share of the work (thank you). Joel
Scott has joined us for the follow on manuscript (major thank you).

3
Economically Valuing Satellite Aquatic Carbon Observations
• Science is an economic investment by the public
• We are dependent on Earth’s oceans for a healthy world
economy and life as we know it
• We have no global ocean or carbon observing system.
Should we invest in one? Is it worth it?
• What is the economic value of an advanced ocean color
observing system?

4
• The ocean plays a central role in the world economy - transport
of goods and ecosystem services.
• Central to the ocean economy is the carbon cycle, and coupled
carbon-climate feedbacks.
• The value of ocean goods and services relies on healthy
conditions; Earth observation (EO) assets enable the research
and monitoring needed to ensure such services are sustainably
maintained.
• EO assets provide the only means by which the Earth System
can be globally monitored and understood, but have not
received due economic valuation.
Economically Valuing Satellite Aquatic Carbon Observations

5
• What is this economic valuation for aquatic carbon?
• A first look suggests it‘s really big.
• The net present value of the economic impact of foregoing the
sustained observations of the Earth’s carbon cycle range from
US$1-10 trillion dollars.
• The uncertainty in this estimate is driven by the associated
uncertainties in quantifying sources, sinks, and fluxes in Earth’s
carbon cycle at a range of spatial scales.
Economically Valuing Satellite Aquatic Carbon Observations

6
• We have few traceable estimates of the economic value of learning the
Earth’s carbon cycle, the currency of our planet and its climate. At present
there are large uncertainties, and uncertainties cost money.
• For example, climate scientists often say that the results from their research
“will inform societal decisions with trillion dollar impacts”
• But is this statement verified and traceable in any way?
• How could we quantify an economic value to aquatic carbon science and
compare this to a global ocean color observing system’s investment?
– The value of aquatic carbon science exists decades into the future
– That value has to be treated as a risk/benefit economic analysis
– Rigorous analysis must take into account uncertainties in aquatic carbon science,
economic impacts, policy
• Science value and economic frameworks are potentially valuable for strategic
planning of the Earth observing system, as well as communicating what we
do and its value to society
What is the Economic Value of Aquatic Carbon Science?
Requires a combination of ocean science and economics expertise

7
• All measurements have uncertainty. New & better measurements
reduce uncertainty, and cost money.
• What is the economic value of reducing uncertainty? How to
compute??
• Value of Information,
Reducing uncertainty ⇒ more efficient mitigation / adaptation
• Can be done! Tent poles:• Quantify uncertainty reduction of new measurements
• Use Integrated Assessment Models (DICE) to connect climate and economy
• Use Social Cost of Carbon to monetize climate damages
What is the Economic Value of Reducing Uncertainty
Requires a combination of ocean science and economics expertise

8
• IPCC AR5 absolute fluxes in GtC (averaged for 2002-2011
period). Air denotes the airborne fraction of emitted CO2,
Air to Ocean is the downward flux into the Ocean. FF
denotes fossil fuel and cement emissions. LUC denotes
emissions due to land use change. The Land residual is
computed to close the carbon budget.
IPCC AR5 Uncertainties in CURRENT C Cycle

9
Carbon Cycle Uncertainty going forward (assume no new physics)
• Airborne fraction (fraction of emissions retained in atmosphere
after 1 year)
• Ocean Fraction (fraction of emissions moved to Ocean after 1
year)

10
How does C cycle uncertainty impact concentrations, temperature and damages?

11

12
Concentrations to 2200 (?)
High accuracy is critical to more better understanding of ocean carbon and global c cycle
Initial air (AF0) and ocean fractions (OF0)
computed for the year 2000, accounting
for the observational uncertainty,
computed as a random variable that is a
ratio of two other normal variables
(nominal values ± standard deviations):
AF0 = 4.3 ± 0.1212 / 9.2 ± 0.649.
OF0 = 2.4 ± 0.424 / 9.2 ± 0.649.
We use the probability distributions as
shown.
Distributions are right skewed and the
mean values are somewhat larger than
the ratios of the means.Bontempi et al. in
review,
Frontiers in Marine
Science – OO19

13
Carbon Cycle Uncertainty going forward (assume no new physics)
• Airborne fraction (fraction of emissions retained in atmosphere
after 1 year)
• Ocean Fraction (fraction of emissions moved to Ocean after 1
year)

14
Concentrations to 2200
High accuracy is critical to more better understanding of ocean carbon and global c cycle
Uncertainty arising from our lack of
knowledge of the carbon fluxes and
growth rates assumes, as it were, no
change in the physics.
Initial values for the AF and OF are
drawn from their distributions, and
values are drawn for their growth rates,
used to compute atmospheric
concentrations for all years out to 2200.
Sample growth rates are not produced
anew each year. The uncertainties
translate into uncertainties in
atmospheric CO2 concentrations (ppmv)
out to 2200. These uncertainties are fed
into DICE’s temperature and damage
[trillions $ 2005] models to produce the
uncertainties (DICE’s 5-year time steps).
15
What does this mean?
High accuracy is critical to more better understanding of ocean carbon and global c cycle
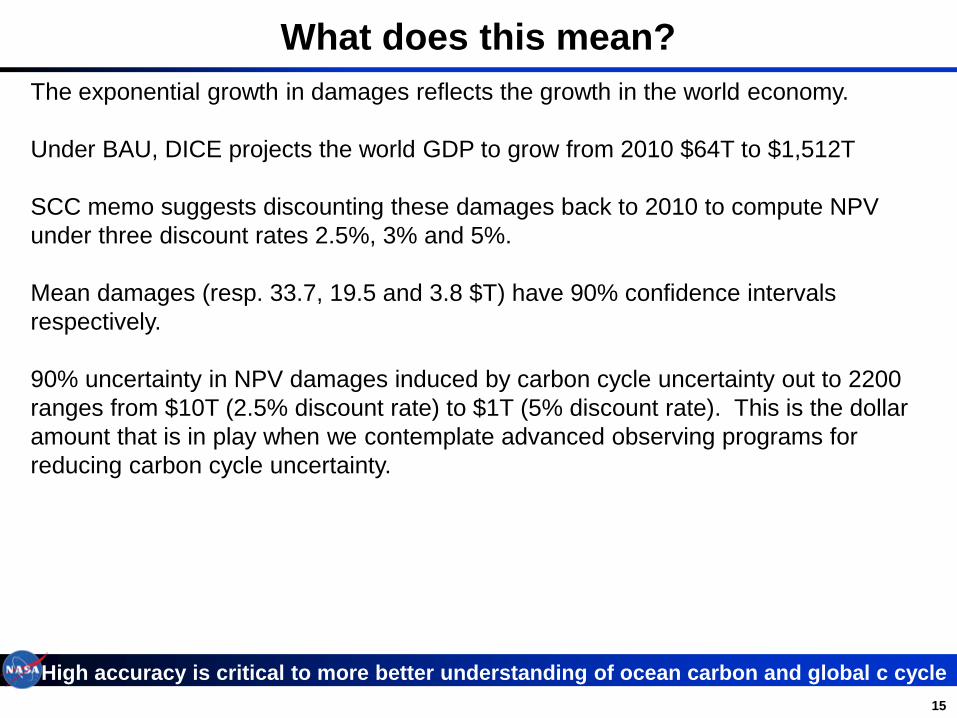
The exponential growth in damages reflects the growth in the world economy.
Under BAU, DICE projects the world GDP to grow from 2010 $64T to $1,512T
SCC memo suggests discounting these damages back to 2010 to compute NPV
under three discount rates 2.5%, 3% and 5%.
Mean damages (resp. 33.7, 19.5 and 3.8 $T) have 90% confidence intervals
respectively.
90% uncertainty in NPV damages induced by carbon cycle uncertainty out to 2200
ranges from $10T (2.5% discount rate) to $1T (5% discount rate). This is the dollar
amount that is in play when we contemplate advanced observing programs for
reducing carbon cycle uncertainty.

16
Economics: The Big Picture
• World GDP today ~ $80 Trillion US dollars (check this?)
• Net Present Value (NPV)
– compare a current investment to other investments that could
have been made with the same resources
• Discount rate: 3% (we used 2.5%)
– 10 years: discount future value by factor of 1.3
– 25 years: discount future value by factor of 2.1
– 50 years: discount future value by factor of 4.4
– 100 years: discount future value by factor of 21
• Business as usual damages to 2200: 1.25% to 12.5% of GDP
per year depending on carbon cycle sensitivity.

17
Path forward
High accuracy is critical to more better understanding of ocean carbon and global c cycle
Hector - a reduced-form model that explicitly
treats surface ocean chemistry, emulates the
marine carbonate system of both
observations and the CMIP5 archive, as well
as to explore the parametric sensitivities to
Hector’s ocean outputs.
Parameters such as:
• Total ocean carbon (as well as deep
ocean, intermediate, and surface ocean
• DIC (High Latitude, Low Latitude)
• Cflux (HL, LL ocean carbon flux)
• Aragonite and Calcite saturation (HL,LL)
• pCO2
• Total atmosphere ocean carbon flux
.. And many moreFrom: Hartin et al., Biogeosciences,(2016)

18
Summary • With the default settings for the physics and economics of the DICE model, the
variability in NPV damages or impacts to the global economy, based only on current
carbon cycle uncertainty, range over an order of magnitude based on the conservative
2.5% discount rates.
• Even discounting at 5%, the uncertainty range of $1T by far overshadows the cost of
any investment in sustained global ocean carbon observing infrastructure, data
processing, and analysis for a satellite example.
• In all cases shown, the value of information of an advanced carbon cycle observing
system using the satellite ocean color remote sensing example appears to be large
relative to their cost. Current advanced, global, ocean color satellite observations
costs in the US are roughly 1 billion USD/year (see PACE SDT (2018)).
• If we accounted for comparable and complementary synergistic international efforts of
roughly similar magnitude for planned missions and future observations globally, the
estimate might head towards a total of 3-4 billion USD/year for all of ocean color
remote sensing observational capability. (Gap analysis would help here).

19
Summary
• Added benefit: ocean color remote sensing also enables
retrievals of critical ocean ecosystem data as well.
• The potential scientific, management and economic benefits of
sustained investments far outweigh the cost over time.

20
Caveats
• A complete advanced ocean carbon observation system might
easily reach several times the costs of the satellite infrastructure
– Additional investments in research, monitoring, process studies,
modeling, and in the case of management, the infrastructure to
handle verification and reporting of carbon trades, as well as the
monitoring piece.
– That being said, relative to the value-of-information estimates in
this paper at 1-10 trillion USD the investment would be outweighed
by the capability to integrate in to a global ocean carbon
observation the basic and applied research as well as modeling for
managing sustainable ocean resources.

21
• Economics estimates have large uncertainties, but they can both increase or
decrease the current economic VOI costs.
• Examples that would increase economic value:
– The following climate change costs are not included in the 2010 U.S. Social Cost
of Carbon Memo:
Ocean acidification,
Species loss
Unexpected accelerations such as arctic methane or carbon dioxide
greenhouse gas emissions as climate warms
Larger than expected sea level rise (e.g. recent Hansen et al 2016 paper just
released on nonlinear sea level rise rates)
• Examples that would decrease economic value:
– Unexpected societal shift to rapidly eliminate CO2 emissions well beyond the
recent Paris agreement (factor of 2 to 4 faster reductions)
– Unexpected early technological breakthrough in cost reduction of renewable
energy (e.g. sudden factor of 4 reduction in solar, wind, battery costs by 2020)
Caveats - Is this useful?