8.0 FUTURE TRANSPORTATION NEEDS 8.1 OADS … 14,099 19,070 4,970 35.25 ... Several of these were...
32
MISSISSIPPI GULF COAST AREA TRANSPORTATION STUDY | 2040 LONG-RANGE TRANSPORTATION PLAN Chapter 8: Future Transportation Needs 8-1 | Page 8.0 FUTURE TRANSPORTATION NEEDS The transportation system of the future will likely need to provide for an increasing demand for travel. It is anticipated that it will also need to be responsive to an increasing diversity of needs arising from evolving patterns of land use and development, economic activity and social interaction. Development of the 2040 Metropolitan Transportation Plan for the Mississippi Gulf Coast region has been guided by an analysis of both existing conditions and the long-range travel demand forecast. At the same time, other current local and regional plans, input from the public involvement process, and the expressed views of stakeholders have played an invaluable role in shaping the vision of future transportation in the region presented herein. 8.1 ROADS AND BRIDGES As noted at the end of the previous chapter, the number of people living in the study area is projected to increase by more than 20 percent over the next 25 years; and the demand for travel is forecast to grow by 25 percent (see Table 8-1). It is expected that nearly 80,000 additional residents will be making almost 400,000 trips daily. Based on output from the regional travel demand forecasting model, aggregate daily travel should be approaching two million trips in 2040. The demand for travel categorized as home-based should be consistent with the projected increase in population and households (21.67 and 21.55 percent respectively). Casino-bound trips are expected to grow at a significantly lower rate. However, it should be noted that the gaming purpose includes only those trips generated within the study area. Many trips to casinos come from outside the three-county area and are included in the external-internal trip purpose: The number of trips in this category, with one end outside the three-county area, is expected to expand by more than half during the long-range planning period. Significant growth is also expected to occur in the commercial motor-vehicle categories. The analysis briefly described in the preceding chapter indicated that the distance traveled and time spent traveling by motorists are both projected to increase by relative amounts exceeding the overall rate of increase in the demand for travel, assuming no additional transportation system improvements are made beyond those already underway or programmed for implementation. This conclusion was reached by comparing 2040 model output for the Existing-plus-Committed (E+C) network with the 2013 assignment results for the base network calibrated to replicate existing conditions as nearly as possible. The E+C network includes 26 roadway improvements (previously listed in Table 7-3), more than half of which (15) involve the widening or reconstruction of existing streets and highways. Only two represent new roadway construction, and in each case the additional right-of-way required extends for only about one mile. Other new construction includes three half-interchanges on the interstate system and major improvements to the interchange between I-10 and I-110. The remaining five projects relate to intersection improvements. Based on output from the regional travel demand model, the number of vehicle miles traveled (VMT) on the E+C network in 2040 is projected to exceed VMT on the base network in 2013 by approximately 4.45 million or 36 percent (see Table 8-2). The largest share of the increase—1.72 million miles or 40 percent of total growth--will fall on the interstate highway class. However, the largest relative increase—44 percent--is expected on collectors.
Transcript of 8.0 FUTURE TRANSPORTATION NEEDS 8.1 OADS … 14,099 19,070 4,970 35.25 ... Several of these were...

MISSISSIPPI GULF COAST AREA TRANSPORTATION STUDY | 2040 LONG-RANGE TRANSPORTATION PLAN Chapter 8: Future Transportation Needs
8-1 | P a g e
8.0 FUTURE TRANSPORTATION NEEDS
The transportation system of the future will likely need to provide for an increasing demand for travel. It is anticipated that it will also need to be responsive to an increasing diversity of needs arising from evolving patterns of land use and development, economic activity and social interaction. Development of the 2040 Metropolitan Transportation Plan for the Mississippi Gulf Coast region has been guided by an analysis of both existing conditions and the long-range travel demand forecast. At the same time, other current local and regional plans, input from the public involvement process, and the expressed views of stakeholders have played an invaluable role in shaping the vision of future transportation in the region presented herein. 8.1 ROADS AND BRIDGES
As noted at the end of the previous chapter, the number of people living in the study area is projected to increase by more than 20 percent over the next 25 years; and the demand for travel is forecast to grow by 25 percent (see Table 8-1). It is expected that nearly 80,000 additional residents will be making almost 400,000 trips daily. Based on output from the regional travel demand forecasting model, aggregate daily travel should be approaching two million trips in 2040. The demand for travel categorized as home-based should be consistent with the projected increase in population and households (21.67 and 21.55 percent respectively). Casino-bound trips are expected to grow at a significantly lower rate. However, it should be noted that the gaming purpose includes only those trips generated within the study area. Many trips to casinos come from outside the three-county area and are included in the external-internal trip purpose: The number of trips in this category, with one end outside the three-county area, is expected to expand by more than half during the long-range planning period. Significant growth is also expected to occur in the commercial motor-vehicle categories.
The analysis briefly described in the preceding chapter indicated that the distance traveled and time spent traveling by motorists are both projected to increase by relative amounts exceeding the overall rate of increase in the demand for travel, assuming no additional transportation system improvements are made beyond those already underway or programmed for implementation. This conclusion was reached by comparing 2040 model output for the Existing-plus-Committed (E+C) network with the 2013 assignment results for the base network calibrated to replicate existing conditions as nearly as possible. The E+C network includes 26 roadway improvements (previously listed in Table 7-3), more than half of which (15) involve the widening or reconstruction of existing streets and highways. Only two represent new roadway construction, and in each case the additional right-of-way required extends for only about one mile. Other new construction includes three half-interchanges on the interstate system and major improvements to the interchange between I-10 and I-110. The remaining five projects relate to intersection improvements.
Based on output from the regional travel demand model, the number of vehicle miles traveled (VMT) on the E+C network in 2040 is projected to exceed VMT on the base network in 2013 by approximately 4.45 million or 36 percent (see Table 8-2). The largest share of the increase—1.72 million miles or 40 percent of total growth--will fall on the interstate highway class. However, the largest relative increase—44 percent--is expected on collectors.

MISSISSIPPI GULF COAST AREA TRANSPORTATION STUDY | 2040 LONG-RANGE TRANSPORTATION PLAN Chapter 8: Future Transportation Needs
8-2 | P a g e
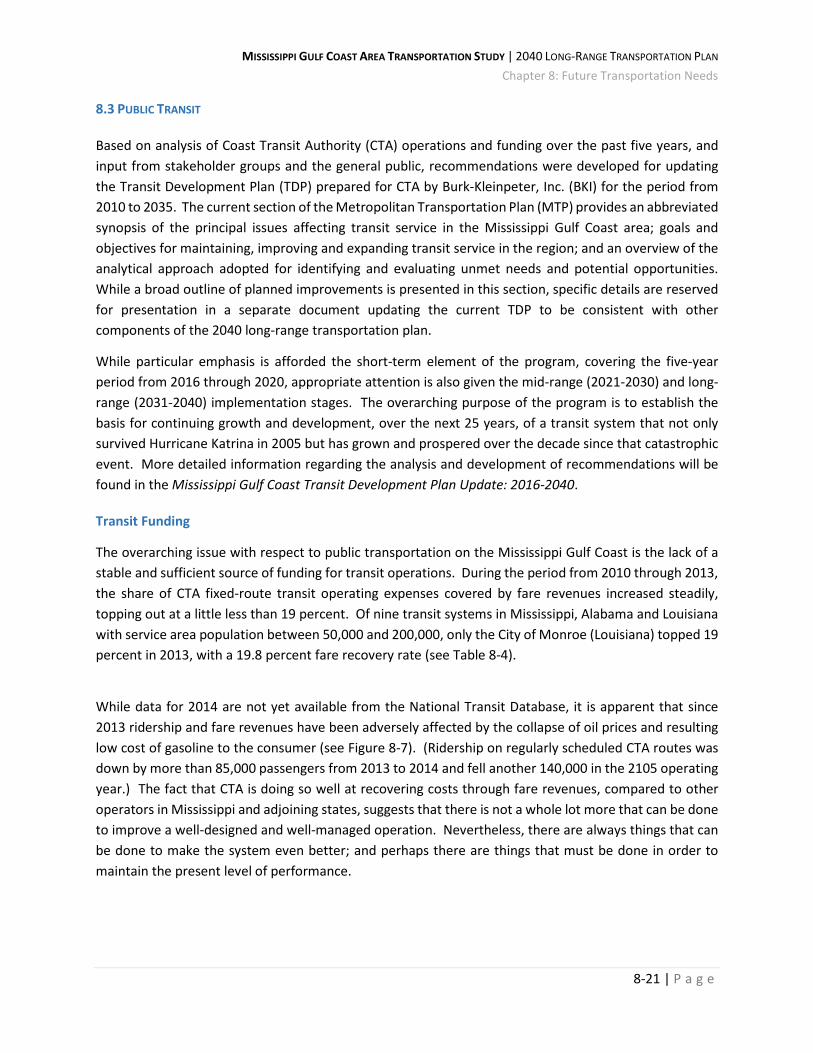
Table 8-1: PROJECTED CHANGE IN DAILY TRAVEL BY TRIP PURPOSE FROM 2013 TO 2040
NUMBER OF TRIPS PERCENT TRIP PURPOSE 2013 2040 CHANGE CHANGE Home-Based Work 281,110 342,149 61,040 21.71 Home-Based Other 664,928 809,274 144,345 21.71 Non-Home-Based 341,447 415,455 74,009 21.68 Gaming 3,717 4,216 499 13.42 Commercial Motor-Vehicle 114,766 151,738 36,972 32.22 Truck 14,099 19,070 4,970 35.25 External-Internal 137,201 207,822 70,621 51.47 External-External 3,259 4,315 1,056 32.40
TOTAL 1,562,540 1,956,079 393,512 25.18 Note: The Commercial Motor-Vehicle category includes light trucks, taxis, vans and other commercially operated four-wheeled vehicles. The Truck category includes heavy trucks and other commercially operated vehicles with more than four wheels. The External-Internal category represents trips having one end outside the area and the other end inside. This includes through-trips that involve a stop in the area for any reason. The External-External category represents only those through-trips that do not involve a stop for any reason. Source: Mississippi Gulf Coast Area Travel Demand Forecasting Model (2015). Calculations by Neel-Schaffer, Inc.
The projected change in vehicle-hours traveled (VHT) is spread somewhat more evenly across major roadway classes. While the interstate system accounts for the largest number of additional hours—approximately 44,000—that only represents a third of the system total (about 132,000). Again, collectors show the largest relative increase—almost 50 percent—with minor arterials close behind (nearly 49 percent). The largest increase in vehicle-hours of delay (VHD) is projected to occur on the interstate system: Roughly 23,000 out of 52,000 total hours of additional delay. That represents an increase of more than 93 percent in delay occurring on the interstate system, a relative change about equal with the overall change projected for the street and highway network as a whole. On the other hand, delay time on minor arterials and collectors is expected to more than double by 2040.
This sizable increase in anticipated delay time indicates that in the absence of any additional improvements to the transportation system, beyond those already funded, the added travel demand resulting from fairly moderate population growth in the area will result in significantly greater traffic congestion in the area and reduced operating speeds. The analysis projected that the portion of overall travel time attributable to delay resulting from congested conditions would increase from 18 percent under existing conditions to almost 25 percent in 2040, barring additional improvements to the system. Average operating speed would decrease by about two miles per hour system-wide.
A useful measure of traffic congestion is the ratio of daily traffic volume to daily roadway capacity. A volume-over-capacity (V/C) ratio exceeding 1.00 indicates that the number of vehicles traversing a particular network link has exceeded the theoretical capacity of the roadway. The base-year network

MISSISSIPPI GULF COAST AREA TRANSPORTATION STUDY | 2040 LONG-RANGE TRANSPORTATION PLAN Chapter 8: Future Transportation Needs
8-3 | P a g e
Table 8-2: PROJECTED CHANGE IN VEHICLE-MILES TRAVELED, VEHICLE-HOURS TRAVELED
AND VEHICLE-HOURS OF DELAY BY MAJOR ROADWAY FUNCTIONAL CLASS FROM 2013 TO 2040 VEHICLE-MILES TRAVELED (VMT) FUNCTIONAL CLASS 2013 2040 CHANGE PERCENT Interstate 4,544,997 6,337,155 1,792,158 39.43 Principal Arterial 4,144,750 5,309,504 1,164,754 28.10 Minor Arterial 1,573,683 2,155,742 582,059 36.99 Collector 2,077,122 2,992,083 914,961 44.05
TOTAL 12,340,552 16,794,483 4,453,931 36.09
VEHICLE-HOURS TRAVELED (VHT) FUNCTIONAL CLASS 2013 2040 CHANGE PERCENT Interstate 97,007 141,103 44,096 45.46 Principal Arterial 102,175 137,106 34,931 34.19 Minor Arterial 43,800 65,145 21,345 48.73 Collector 63,694 95,494 31,800 49.93
TOTAL 306,675 438,847 132,173 43.10
VEHICLE-HOURS OF DELAY (VHD) FUNCTIONAL CLASS 2013 2040 CHANGE PERCENT Interstate 24,891 48,185 23,294 93.59 Principal Arterial 17,407 29,869 12,463 71.60 Minor Arterial 6,164 14,566 8,402 136.31 Collector 7,195 14,981 7,787 108.23
TOTAL 55,656 107,602 51,946 93.33
Percent Delay (VHD/VHT) 18.15 24.52 6.37 -- Average Operating Speed (VMT/VHT) 40.24 38.27 -1.97 --
Note: Higher totals in Table 7-2 are due to the inclusion of local streets not represented here. Source: Mississippi Gulf Coast Travel Demand Forecasting Model (2015). Calculations by Neel-Schaffer, Inc.
assignment showed a fairly limited number of generally short street or highway segments with V/C greater than 1.00. Several of these were route segments limited to locations in the immediate vicinity of interchanges with Interstate 10. They included County Farm Road, Canal Road, U. S. Highway 49 (US 49) and Lorraine Road, all in Harrison County. Other roads with V/C over 1.00 on segments in close proximity to the interstate were Promenade Parkway-Sangani Boulevard in D’Iberville, Bayview Avenue in Biloxi and MS 53 immediately west of US 49. The ratios for almost all of these locations were in the range of 1.01 to 1.05. A very few were higher: US 49 (1.20), Promenade Parkway (1.26) and Sangani Boulevard (1.25).

MISSISSIPPI GULF COAST AREA TRANSPORTATION STUDY | 2040 LONG-RANGE TRANSPORTATION PLAN Chapter 8: Future Transportation Needs
8-4 | P a g e
The number of roadway segments with V/C greater than 1.00 is expected to triple (to 21) by 2040 if improvements other than those already committed are not made. They would include two roadway segments in Hancock County, 14 in Harrison County and five in Jackson County (see Figure 8-1). Projected volume-to-capacity ratios range from 1.01 to 1.62, with a third being higher than 1.25 (see Table 8-3). Some of these anticipated roadway capacity deficiencies may need to be addressed by widening the existing roadways; others may not be soluble except by providing new route alternatives. Nevertheless, it is important to note that in some cases it may be more appropriate to apply Intelligent Transportation Systems (ITS) solutions such as interconnected traffic signals or reversible travel lanes; or the situation may call for employing Transportation Demand Management (TDM) strategies and/or improved bicycle, pedestrian and transit facilities and services to encourage the use of alternative means of transportation.
Congestion Management
Although major capital investments are still needed to meet growing travel demand, large-scale projects involving new roadway construction or lane additions are few and far between primarily because of the costs involved. In the absence of the unlimited funding required to build more roads than there are cars to fill them, there is a need to investigate more affordable ways to mitigate congestion. The GRPC Congestion Management Process (CMP) undertook the task of identifying congested roadways by analyzing travel-time data collected for the long-range planning base year of 2013. The results were used to help identify roadway improvement needs and potential projects for addressing congested traffic conditions where they exist.
The Transportation Research Board defines traffic congestion as “travel time of delay in excess of that normally incurred under free-flow travel conditions.” The CMP process generates a level of service (LOS) measure for roadway segments and intersections based on travel-time data. This information provides decision-makers with a profile of existing traffic flow conditions that can be easily grasped and readily understood.
A travel rate index is used to identify areas of concern for recurring congestion. This index measures the amount of extra time it takes to travel from one point to another on a given route during the peak period. The travel rate index is derived from the average speed (in miles per hour) in the afternoon peak period divided by the free-flow speed (85th percentile). The index provides a percentage indicating the degree to which the vehicular travel rate is negatively affected by congested traffic conditions. Each percentage falls within a range associated with a given level of service (LOS) measure. LOS measures are commonly expressed as letter-grades with A corresponding to free-flow conditions and F representing an operational failure in which traffic is stalled or hardly moving at all. The Transportation Research Board’s Highway Capacity Manual describes LOS measures in the following terms:
The CMP undertook the task of identifying congested roadways. . . . The results were used to help identify roadway improvement needs and potential projects for addressing congested traffic conditions.

MISSISSIPPI GULF COAST AREA TRANSPORTATION STUDY | 2040 LONG-RANGE TRANSPORTATION PLAN Chapter 8: Future Transportation Needs
8-5 | P a g e
Figure 8-1: Projected 2040 Roadway Capacity Deficiencies
Source: Gulf Regional Planning Commission.

MISSISSIPPI GULF COAST AREA TRANSPORTATION STUDY | 2040 LONG-RANGE TRANSPORTATION PLAN Chapter 8: Future Transportation Needs
8-6 | P a g e
Table 8-3: PROJECTED 2040 ROADWAY CAPACITY DEFICIENCIES
(EXISTING-PLUS-COMMITTED NETWORK) LENGTH PEAK 2- MAX 1-
ROADWAY FROM (N/W) TO (S/E) (MI) LANES WAY VOL WAY
V/C Hancock County MS 43 Hwy 603 Texas Flat Rd 3.75 2 24,394 1.29
Gex Dr-Yacht Club Dr Kapalama Dr I-10 EB Off-Ramp 0.33 2 20,822 1.06
Harrison County
Firetower Rd-Menge Ave I-10 WB Off-Ramp I-10 EB Off-Ramp 0.19 2 11,697 1.12
MS 53 County Farm Rd Canal Rd 2.22 2 20,706 1.10
MS 53 Old Hwy 49 US 49 0.78 2 26,630 1.40
County Farm Rd I-10 WB Off-Ramp Red Creek Rd 1.21 2 20,875 1.62
Canal Road I-10 WB Off-Ramp 28th St 2.57 2 22,169 1.33
US 49 Airport Rd North Carolina Ave 0.77 6 65,140 1.05
US 49 Old Hwy 49 34th Street 0.46 6 62,168 1.01
US 49 I-10 WB Off-Ramp Creosote Rd 0.40 6 100,841 1.65
US 49 Dedeaux Rd Landon Rd 0.84 6 70,826 1.14
Landon Rd Old Hwy 49 US 49 0.08 2 21,499 1.43
Three Rivers Rd Crossroads Pkwy Seaway Rd 0.10 2 22,180 1.13
Hwy 605 Dedeaux Rd I-10 EB Off-Ramp 0.53 4 48,834 1.30
Lorraine Rd Industrial Waterway Pass Rd 1.83 4 48,432 1.18
Division St Forrest Ave I-10 NB On-Ramp 0.56 2 15,623 1.14
Jackson County
Seaman Rd Jordan Rd I-10 Connector Rd 1.87 2 17,770 1.18
Bienville Blvd M L King Jr Ave Bechtel Blvd 0.78 4 45,179 1.12
MS 57 Humphrey Rd Gautier-Vancleave Rd 1.08 2 20,964 1.10
Hwy 613 MS 63 Saracennia Rd 3.00 2 14,776 1.01
Hwy 614 MS 63 HWY 613 4.70 2 15,535 1.04
Notes: Termini for deficient segments are the nearest major streets (or bridges) east and west, or north and south of links
having V/C greater than 1.00. Peak two-way volume and maximum one-way volume/capacity may apply to separate
links due to differences in vehicular capacity or the directional distribution of traffic. Source: Mississippi Gulf Coast Regional Travel Demand Forecasting Model (2015).
• LOS A describes primarily free-flow operations at average travel speeds, usually about 90 percent of the free-flow speed for the arterial classification. Vehicles are seldom impeded in their ability to maneuver in the traffic stream. Delay at signalized intersections is minimal.

MISSISSIPPI GULF COAST AREA TRANSPORTATION STUDY | 2040 LONG-RANGE TRANSPORTATION PLAN Chapter 8: Future Transportation Needs
8-7 | P a g e
• LOS B represents reasonably unimpeded operations at average travel speeds, usually about 70 percent of the free-flow speed for the arterial classification. The ability to maneuver in the traffic stream is only slightly restricted and delays are not bothersome.
• LOS C represents stable operations; however, ability to maneuver and change lanes in mid-block locations may be more restricted than in LOS “B”, and longer queues, adverse signal coordination, or both may contribute to lower average travel speeds of about 50 percent of the average free-flow speed for the arterial classification.
• LOS D borders on a range in which small increases in flow may cause substantial increases in approach delay and hence decreases in arterial speed. LOS “D” may be due to adverse signal progression, inappropriate signal timing, high volumes, or some combination of these. Average travel speeds are about 40 percent of free-flow speed.
• LOS E is characterized by significant delays and average travel speeds of one-third the free-flow
speed or less. Such operations are caused by some combination of adverse progression, high signal density, high volumes, extensive delays at critical intersections, and inappropriate signal timing.
• LOS F characterizes arterial flow at extremely low speeds, from less than one-third to one-quarter of the free-flow speed. Intersection congestion is likely at critical signalized locations, with long delays and extensive queuing.
The CMP identifies congestion caused by either operational problems or lack of capacity (or both). Once congested areas have been identified, the causes must be determined. Before a decision is made to add base capacity to a roadway, alternative strategies for mitigating congested conditions should be investigated. Operational strategies have been used increasingly in recent years to squeeze greater efficiency out of existing facilities. These strategies often can be implemented at a fraction of the cost of added roadway capacity.
The travel-time analysis showed that significant delay resulting from congestion exists on Highway 49 and Pass Road in Gulfport, and on Highway 90 in Biloxi, Ocean Springs and Pascagoula (see Figure 8-2). In addition, the analysis indicated there are 23 intersections in the region at which motorists experience excessive delay. These findings provided valuable input to the project development process.
Mobility and Connectivity
Due to the linearity of urban development in the Mississippi Gulf Coast region, north-south mobility is very important to provide movement between the two major travel corridors—Interstate 10 and US Highway 90--spanning the three coastal counties from Alabama to Louisiana. Mobility is essential for many reasons including, but not limited to, hurricane evacuation and daily work commutes. When major storms approach the region from the Gulf of Mexico, north-south connectors are used by Gulf Coast

MISSISSIPPI GULF COAST AREA TRANSPORTATION STUDY | 2040 LONG-RANGE TRANSPORTATION PLAN Chapter 8: Future Transportation Needs
8-8 | P a g e
residents to reach I-10. Commuters use the north-south connectors daily as they make long commutes to major employment sites such as Stennis, Ingalls and Chevron. The Mississippi Gulf Coast mobility corridors facilitate the flow of traffic throughout the region. The corridors establish generalized travel patterns which form the primary routes of choice used by the population for the majority of their travel needs. Most relatively long-distance trips being made within the region are a combination of major arterial and interstate movements. These corridors have higher design standards and provide more direct and higher speed travel between locations. They facilitate mobility in the region in the following ways:
• Serve major activity centers, the highest volume corridors, and longest trip demands;
• Carry a high proportion of total urban travel on limited route mileage; • Interconnect and provide continuity for major rural corridors to accommodate trips entering and
leaving the urban area and movements through the urban area; • Serve demand for intra-area travel between central business districts and outlying residential
areas.
Figure 8-2: Deficient Road Segments and Intersections Identified by Congestion Management Process
Source: Gulf Regional Planning Commission

MISSISSIPPI GULF COAST AREA TRANSPORTATION STUDY | 2040 LONG-RANGE TRANSPORTATION PLAN Chapter 8: Future Transportation Needs
8-9 | P a g e
The concept of proper spacing between major corridors is an important consideration in providing for the mobility of people and goods. Ideally, regular and logical spacing between corridors should exist; but in actuality the distance between corridors varies considerably. In densely populated urban areas, spacing of all route types is tighter and generally more consistent than the spacing in sparsely developed rural areas. An evaluation of the Mississippi Gulf Coast mobility corridors reveals a number of coverage gaps in the street and highway network. The analysis applied a three-mile buffer to the north-south corridors, representing the desirable maximum distance between them, and identified gaps where this criterion was not met. The evaluation applied the following criteria to define an adequate corridor:
- The corridor should provide direct access between I-10 and US 90.
- The roadway should have at least four travel lanes.
Four gaps in the coverage provided by north-south mobility corridors were revealed using this approach (see Figure 8-3): West Harrison County (Gap 1) – This area desperately needs an adequate connection between I-10 and US 90. There are several routes that could be considered for the necessary improvement: Among them are Menge Avenue, Red Creek Road, Espy Avenue and Beatline Road. Beatline Road would appear to be the best option, but it would require that a connection be made between its current terminus at Railroad Street and US 90. Central Harrison County (Gap 2) – The best connector in this gap appears to be Popp’s Ferry Road. Improvements necessary to make this corridor an adequate north-south connector would include a new bridge across the Back Bay of Biloxi, widening of the three-lane section, an extension from Pass Road to US 90 and a connection to the I-10 Woolmarket interchange.
Ocean Springs (Gap 3) – While this gap appears to be fairly narrow, a connector here would have a very beneficial effect on the accessibility of Ocean Springs and would help to reduce traffic on the congested section of US 90 in that city.
Pascagoula River Basin (Gap 4) – This is a natural gap, and there is nothing to be done here. It should also be noted that the distance between I-10 and US 90 exceeds three miles almost from one end of the study area to the other, and there is clearly a need for another east-west mobility corridor south of the interstate. North of the interstate there does not yet appear to be a well-defined need for enhanced east-west mobility, but as development pushes further inland in the years ahead the need for a continuous route connecting major north-south corridors is likely to become more apparent.
Freight Transportation
Trucking--As described in the Mississippi Statewide Freight Plan (MDOT 2015), the principal Mississippi Gulf Coast highway freight corridor is Interstate 10 from the Louisiana line to the Alabama border. The

MISSISSIPPI GULF COAST AREA TRANSPORTATION STUDY | 2040 LONG-RANGE TRANSPORTATION PLAN Chapter 8: Future Transportation Needs
8-10 | P a g e
major intersecting highways are US 49 in Gulfport and MS 63 in Pascagoula. The three coastal counties intersected by the I-10 corridor account for 13 percent of both population and employment in Mississippi. Ingalls Shipbuilding, the state’s largest employer with over 13,000 employees, is located in this corridor.
Within the metropolitan area the corridor serves three major maritime ports located on the Gulf of Mexico, including deep-water ports in Gulfport and Pascagoula. Truck freight is the dominant mode of goods transport in the area, and it is expected to grow from 61 percent of total freight in 2011 to 65 percent in 2040. The MDOT statewide plan identifies primary highway freight facilities and key connectors (see Figure 8-4). Identification of this network was based on an analysis of freight flow patterns that focused on three key corridor functions: (1) Providing interstate connectivity; (2) Providing access to key intermodal freight facilities and freight generators; and (3) Efficiently moving high volumes of freight to support the state’s economic health. Output from the regional travel demand model and travel-time analysis was used to evaluate existing congestion in the freight corridor, including on the freight connectors, and to project congested conditions likely to occur in the future. Both current and foreseeable congestion, associated with the movement of goods by truck, is concentrated on US 49, a connector between I-10 and US 90 that provides direct access to the Mississippi State Port at Gulfport. Figure 8-3: North-South Mobility Corridors between Interstate 10 and U. S. Highway 90
Source: Gulf Regional Planning Commission

MISSISSIPPI GULF COAST AREA TRANSPORTATION STUDY | 2040 LONG-RANGE TRANSPORTATION PLAN Chapter 8: Future Transportation Needs
8-11 | P a g e
Figure 8-4: Major Trucking Corridors
Source: Mississippi Department of Transportation (2015): Mississippi Statewide Freight Plan; Gulf Regional Planning Commission.
Railroads—The Hancock County Port and Harbor Commission is pursuing plans to install approximately 24 miles of new track to connect the existing Port Bienville Railroad (PBVR) to the Norfolk Southern mainline at Nichols. This long-contemplated addition to the shortline railroad will make it possible to ship freight north and south as well as east and west. On June 2, 2015 the Federal Railroad Administration issued a Notice of Intent for the preparation of an Environmental Impact Statement (EIS) in connection with the Port Bienville Railroad Project. The proposed improvement will expand the PBVR system to connect Port Bienville Industrial Park with the Norfolk Southern line between New Orleans and Hattiesburg via Stennis Space Center. Dual Class 1 rail service via the north-south Norfolk Southern line and the east-west CSXT line is intended to enable Hancock County and Stennis Space Center to attract industries that require long-distance rail service providing access to shipping destinations located north and northeast of the Mississippi Gulf Coast metropolitan area. MDOT completed a Feasibility Report for the project in 2013, identifying reasonable alternative corridors and projected economic benefits of the improvement.
MISSISSIPPI GULF COAST AREA TRANSPORTATION STUDY | 2040 LONG-RANGE TRANSPORTATION PLAN Chapter 8: Future Transportation Needs
8-12 | P a g e
Kansas City Southern entered into an agreement with the Mississippi State Port Authority in 2015 to make a joint investment in upgrading the line leading north from the Mississippi State Port at Gulfport to Hattiesburg. Pending improvements will render the KCS rail line capable of carrying standard 286,000-pound cars and double-stack trains. This enhancement of the regional freight transportation system has long been considered an essential element of plans for expanding the capability of the Mississippi State Port for moving goods in and out of the port efficiently. Roadway Safety Needs
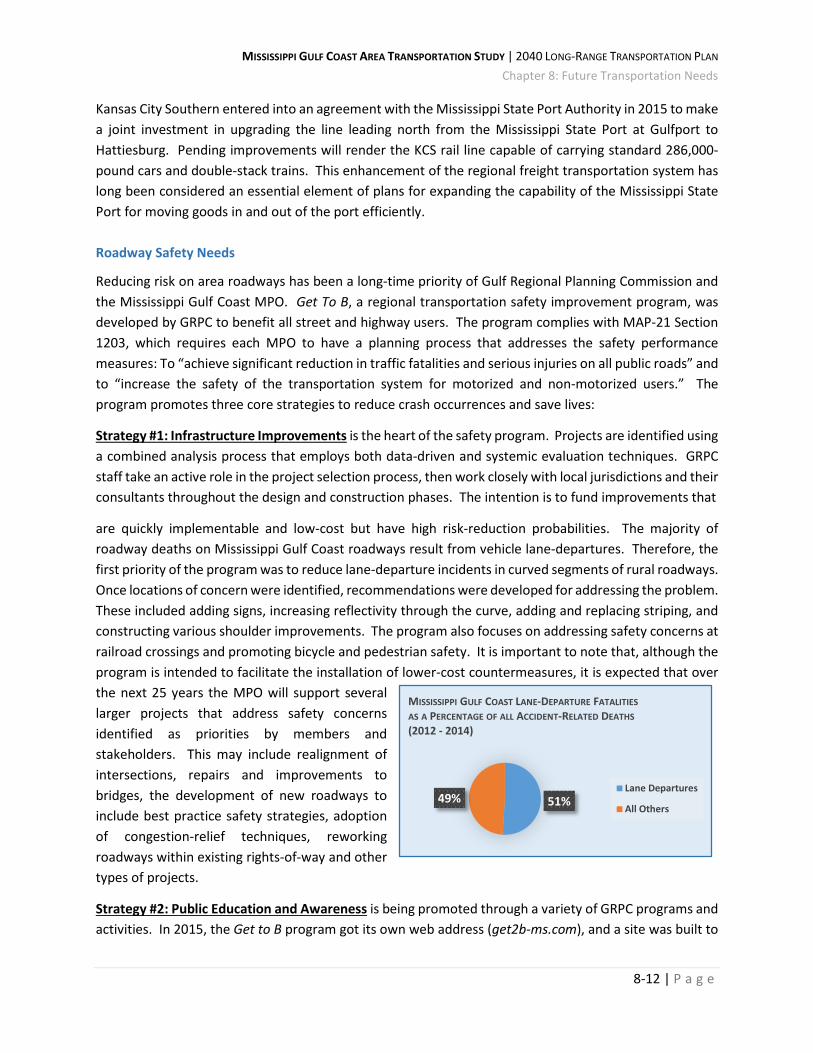
Reducing risk on area roadways has been a long-time priority of Gulf Regional Planning Commission and the Mississippi Gulf Coast MPO. Get To B, a regional transportation safety improvement program, was developed by GRPC to benefit all street and highway users. The program complies with MAP-21 Section 1203, which requires each MPO to have a planning process that addresses the safety performance measures: To “achieve significant reduction in traffic fatalities and serious injuries on all public roads” and to “increase the safety of the transportation system for motorized and non-motorized users.” The program promotes three core strategies to reduce crash occurrences and save lives:
Strategy #1: Infrastructure Improvements is the heart of the safety program. Projects are identified using a combined analysis process that employs both data-driven and systemic evaluation techniques. GRPC staff take an active role in the project selection process, then work closely with local jurisdictions and their consultants throughout the design and construction phases. The intention is to fund improvements that
are quickly implementable and low-cost but have high risk-reduction probabilities. The majority of roadway deaths on Mississippi Gulf Coast roadways result from vehicle lane-departures. Therefore, the first priority of the program was to reduce lane-departure incidents in curved segments of rural roadways. Once locations of concern were identified, recommendations were developed for addressing the problem. These included adding signs, increasing reflectivity through the curve, adding and replacing striping, and constructing various shoulder improvements. The program also focuses on addressing safety concerns at railroad crossings and promoting bicycle and pedestrian safety. It is important to note that, although the program is intended to facilitate the installation of lower-cost countermeasures, it is expected that over the next 25 years the MPO will support several larger projects that address safety concerns identified as priorities by members and stakeholders. This may include realignment of intersections, repairs and improvements to bridges, the development of new roadways to include best practice safety strategies, adoption of congestion-relief techniques, reworking roadways within existing rights-of-way and other types of projects.
Strategy #2: Public Education and Awareness is being promoted through a variety of GRPC programs and activities. In 2015, the Get to B program got its own web address (get2b-ms.com), and a site was built to
51%49%
MISSISSIPPI GULF COAST LANE-DEPARTURE FATALITIESAS A PERCENTAGE OF ALL ACCIDENT-RELATED DEATHS(2012 - 2014)
Lane Departures
All Others

MISSISSIPPI GULF COAST AREA TRANSPORTATION STUDY | 2040 LONG-RANGE TRANSPORTATION PLAN Chapter 8: Future Transportation Needs
8-13 | P a g e
provide transportation safety information on a wide variety of topics. This safety improvement strategy is expected to be fully realized over the next five years. It will be aided by the formation of a committed stakeholder committee that will develop and implement a variety of educational initiatives and activities designed to stimulate safety awareness among all sections of the community. Groups targeted for initial messaging and program activities include aging drivers, young drivers, parents with young children, rural drivers and professional drivers. It is the goal of the program to develop Get to B as a regionally recognizable reminder to be safe, alert and aware on the road, which will result in fewer crashes and fewer casualties.
Strategy #3: Workforce Development is an active component of the safety improvement program. The “Get to B Safety Series” engages a wide variety of transportation professionals and safety stakeholders in training workshops that increase awareness of safety techniques and encourage greater consideration of safety in the planning, project design and reporting processes.
This ongoing effort will ensure that when existing roadways are being improved, or new roadways are being designed, there will be a concerted effort made to give due consideration for the safety of all roadway users. Enhancing the transportation infrastructure through the adoption of roadway-safety best practices will put the Mississippi Gulf Coast region in a position to reduce significantly the overall number of traffic crashes and the severity of injuries sustained in vehicular accidents.
Topic selection for the workforce development sessions is determined by two primary sources: 1) Crash data analysis, and 2) Priority concerns expressed and related subjects requested by MPO membership. In response GRPC provides training events addressing intersection safety techniques, strategies to reduce lane departure events and ways in which the roadside can be altered to reduce injury. Future workshops will focus on incorporating access management techniques, reducing red-light running, making intersection turning safer and accommodating roadway users traveling by non-motorized modes.
Recommendations for reducing the most common types of crashes in the Mississippi Gulf Coast Metropolitan Planning Area are outlined below. Rear-End Collisions
In the study area, rear-end collisions account for the largest number of crashes. These crashes can be attributed to numerous factors. One main cause of rear-end accidents is driver inattention. Other potential causes include large turning volumes, slippery pavement, inadequate roadway lighting, crossing pedestrians, poor visibility of a traffic signal, congestion, inadequate signal timing, and/or an unwarranted signal.
The crash data show high concentrations of rear-end crashes at intersections. Correlating the crash data with field conditions and observation reveals that many of these rear-end crashes may be influenced by intersection geometry and traffic operations. Rear-end crash frequency may be reduced by adjusting the yellow clearance intervals in compliance with the Institute of Transportation Engineers (ITE) recommended clearance interval practices. The number of crashes may further be reduced by reconfiguring the travel and turning lanes. This can be accomplished by a variety of methods, including

MISSISSIPPI GULF COAST AREA TRANSPORTATION STUDY | 2040 LONG-RANGE TRANSPORTATION PLAN Chapter 8: Future Transportation Needs
8-14 | P a g e
converting two-way frontage roads to one-way frontage roads, providing exclusive right-turn lanes, providing advanced warning signs, providing indirect left-turns, or by displacing left-turn movements.
In general, the recommendations for reducing rear end crashes include the following:
Analyze turning volumes to determine if a right-turn lane or left-turn lane is warranted. Providing a turning lane separates the turning vehicles from the through vehicles, preventing through vehicles from rear-ending turning vehicles. If a large right-turn volume exists, increasing the corner radius for right turns is an option.
Check the pavement conditions. Rear-end collisions caused by slippery pavement can be reduced by lowering the speed limit with enforcement; providing overlay pavement, adequate drainage, and/or grooved pavement; or with the posting of a “Slippery When Wet” sign.
Ensure roadway lighting is sufficient for drivers to see the roadway and surroundings.
Determine if there is a large amount of pedestrian traffic. Pedestrians crossing the roads may impede traffic and force drivers to stop suddenly. If crossing pedestrians are an issue, options include installing or improving crosswalk devices and providing pedestrian signal indications.
Check the visibility of the traffic signals at all approaches. In order to provide better visibility of the traffic signal, options include installing or improving warning signs, overhead signal heads, installing 12-inch signal lenses, visors and back plates, or relocating/adding signal heads.
Verify that the signal timing is adequate to serve the traffic volumes at the trouble intersections. Options include adjusting the phase-change interval, providing a red-clearance interval, providing progression, and utilizing signal actuation with dilemma-zone protection.
Verify that a signal is warranted at the given intersection.
Single-Vehicle Crashes
Single-vehicle crashes (Run off road) are the second most prevalent crash type in the study area. A number of factors could be the cause for single-vehicle crashes, including speeding, pavement surface conditions, lighting and markings, roadway geometry, and signal timing.
In general, the recommendations for reducing single vehicle crashes include:
Conduct speed studies to determine whether or not speed was a contributing factor.
Ensure roadway lighting is sufficient for drivers to see the roadway and surroundings during dark hours.
Ensure proper application of traffic control devices.

MISSISSIPPI GULF COAST AREA TRANSPORTATION STUDY | 2040 LONG-RANGE TRANSPORTATION PLAN Chapter 8: Future Transportation Needs
8-15 | P a g e
Verify proper signal-head alignments as well as condition of signal-head indications (i.e. lens burn-through, L.E.D. usage, etc.)
Verify that pavement markings are visible during day and night hours.
Verify that the roadway geometry can be safely maneuvered by drivers.
Provide shoulders or increase shoulder width.
Relocate fixed objects that are close to travel lanes.
Improve the visibility of fixed objects during night hours.
Side-Impact Collisions
Side-impact collisions (angle) were the third most prevalent collision type in the study area between 2011 and 2013. They can be caused by a number of factors, including restricted sight distance, excessive speed, inadequate roadway lighting, poor visibility of a traffic signal, inadequate signal timing, inadequate advance warning signs, large traffic volumes, or simply the driver failing to stop for a red light. In general, recommendations for reducing side impact collisions include the following:
Verify that the sight distance at all intersection approaches is not restricted. Options to alleviate restricted sight distance include removing sight obstructions and/or installing or improving warning signs.
Conduct speed studies to determine whether or not speed is a contributing factor. In order to reduce crashes caused by excessive speeding, the speed limit can be lowered with enforcement, the phase change interval can be adjusted, or rumble strips can be installed.
Ensure roadway lighting is sufficient for drivers to see roadway and surroundings.
Check the visibility of the traffic signal at all approaches. In order to provide better visibility of the traffic signal, options include installing or improving warning signs, overhead signal-heads, installing 12-inch signal lenses, visors, back plates, and/or relocating or adding signal-heads.
Verify that the signal timing is adequate to serve existing traffic volumes. Options include adjusting the phase change interval, providing a red-clearance interval, providing progression, and/or utilizing signal actuation with dilemma-zone protection.
Verify that the intersection is designed to handle the observed traffic volume. If the traffic volumes are too high for an intersection’s capacity, options include adding a lane(s) or retiming the signal.
Other Collision Types
Within the study area, there are a number of other collision types that are prevalent, including sideswipe, left turn same roadway, parked vehicle, animal, pedestrian and head-on. In general, the

MISSISSIPPI GULF COAST AREA TRANSPORTATION STUDY | 2040 LONG-RANGE TRANSPORTATION PLAN Chapter 8: Future Transportation Needs
8-16 | P a g e
recommendations for increasing safety and reducing the number of crashes on all the study segments and intersections include the following:
Determine if the speed limit is too high or if vehicles in the area are traveling over the speed limit. Reducing the speed can reduce the severity of crashes and make drivers more attentive to their surroundings.
Verify the clearance intervals for all signalized intersection approaches and ensure that there is an all-red clearance. For larger intersections, it is particularly important to have a long enough clearance interval for vehicles to safely make it through the intersection before the light turns red.
Check for proper intersection signage, especially if the roadway geometry may be confusing for the driver. Verify that all one-way streets are marked “One-Way” and “No Turn” signs are placed at appropriate locations.
Verify that pavement markings are visible during day and night hours.
Verify that the roadway geometry can be maneuvered easily by drivers.
Evaluate left and right turning volumes to determine if a right-turn and/or left-turn lane is warranted.
Ensure roadway lighting is sufficient for drivers to see the roadway and surroundings.
Check the visibility of traffic signals from all approaches.
Verify that lanes are marked properly and provide turning and through movement directions, as well as signage that indicates lane configurations. This will prevent cars from dangerously switching lanes at the last minute and reduce crash potential.
Development of a Safety Management System (SMS)
Traffic safety programs are relatively uniform from state to state in their approach to making the highway system safer for their users. The typical traffic safety program combines several different features from a Safety Management System (SMS) which all states were mandated to develop in accordance with the Intermodal Surface Transportation Efficiency Act of 1991 (ISTEA). Under ISTEA and ensuing regulations, the SMS was required to address the following needs:
Coordinating and integrating safety features for the various modes of travel;
Identifying hazardous locations, investigating them, and establishing countermeasures to increase safety;
Early consideration for safety in all highway projects and programs;
Identifying safety needs of special user groups (handicapped, elderly, etc.);
MISSISSIPPI GULF COAST AREA TRANSPORTATION STUDY | 2040 LONG-RANGE TRANSPORTATION PLAN Chapter 8: Future Transportation Needs
8-17 | P a g e
Routinely maintaining and upgrading the safety features on the roadways;
Marketing safety programs to encourage community involvement;
The SMS mandate was later withdrawn due to the 1995 National Highway System Designation Act. However, MAP-21 Section 1203 requires that each state and MPO have a planning process that addresses the safety performance measure to “achieve a significant reduction in traffic fatalities and serious injuries on all public roads.” MAP-21 also retains the SAFETEA-LU requirement that the planning process address the need to “increase the safety of the transportation system for motorized and non-motorized users.”
Safety programs are relatively uniform throughout the United States. The typical traffic safety program includes the following elements:
A crash record system
Identification of hazardous locations
Engineering studies
Selection of countermeasures
Prioritization of improvement projects
Planning and implementation of improvement projects
Evaluation of the implemented projects
The crash record system should contain data on individual crashes that occur in the area. The crash data should include the following information: time, date, weather condition, pavement condition, driver, and roadway. The primary source for this data is usually police reports from local jurisdictions. In order for this record system to be useful, the data have to be processed and available on a timely basis so that they can be analyzed without undue delay.
The identification of hazardous locations is based on actual crashes that have occurred and/or the recognized potential of an area to have a high number of crashes. The severity of these crashes must also be considered in order to prioritize the locations and develop solutions for them. Once the hazardous locations are identified, engineering studies can be conducted using the crash record system data. An analysis can use crash frequency, crash rate, Equivalent Property Damage Only (EPDO) rates, and other methods. Supplemental data from police comments and citizen complaints can also be used in the analytical process in order to identify the cause of crashes.
Once the cause of crashes has been determined, countermeasures are proposed and then evaluated. Improvement projects are selected based on the benefits they will provide compared to the cost of implementation. Sometimes, enforcement and education may be all that is necessary in order to reduce the number of crashes. Other times, multiple projects may be needed to mitigate a particular problem area.

MISSISSIPPI GULF COAST AREA TRANSPORTATION STUDY | 2040 LONG-RANGE TRANSPORTATION PLAN Chapter 8: Future Transportation Needs
8-18 | P a g e
Once the projects have been selected, they need to be prioritized based on their cost and projected benefits. Due to funding limitations, not all improvement projects can be implemented. After the projects have been selected and prioritized, a plan should be developed in order to implement the projects. An implementation plan will help ensure that resources and finances are available to complete the improvement projects in a timely manner. Implementation of the projects should occur as soon as possible to avoid cost increases and prevent potential crashes that may occur without the project in place.
Projects must be evaluated to determine whether they are effective or can be used to address similar problems in the future. This is typically done in a before-and-after analysis by observing the frequency and severity of the crashes several years before the implementation of the project and again for several years after the project has been completed. Two issues can arise in this method of analysis. First, if enforcement and/or education change from before to after conditions, such added (or subtracted) variables may affect the number of crashes occurring at that location. Second, “regression to the mean,” a statistical phenomenon that can make natural variation in repeated data look like real change, must be taken into account to ensure that change in crash patterns and/or frequency can reasonably be attributed to the safety projects. In order to correct these two issues, control sites should be established that are similar to the study locations but have not had any other changes made that might affect traffic safety outcomes.
Roadway and Bridge Maintenance Needs
The existing condition of roads and bridges is only known for state-maintained facilities and those county highways and local bridges maintained under the supervision of the Office of State-Aid Road Construction (OSARC). OSARC oversees more than 10,000 miles of county highway--comprising approximately 15 percent of all local roads--built and maintained according to standards developed by the American Association of State Highway and Transportation Officials (AASHTO). The state-aid agency also administers the Local Bridge Replacement and Rehabilitation Program. In a 2013 report entitled Mississippi’s Transportation Infrastructure, MDOT outlined a 20-year program for maintaining roads and bridges. The county-by-county inventory of needs presented in the report was based on a two-year program of inspections, rating road and bridge conditions in accordance with state and federal standards. The following highway segments were noted as having unsatisfactory pavement ratings:
US 90 Pearl River Bridge (Photo by William Blackwell) Hancock County:
• Highway 607 from I-10 to US 90 • Highway 90 in Waveland and Bay Saint Louis

MISSISSIPPI GULF COAST AREA TRANSPORTATION STUDY | 2040 LONG-RANGE TRANSPORTATION PLAN Chapter 8: Future Transportation Needs
8-19 | P a g e
Harrison County: • US 49 from Airport Road to 28th Street in Gulfport • I-10 in the vicinity of the US 49 interchange • I-10 from the Woolmarket interchange in Harrison County to the Jackson County line • I-110 from its northern terminus just north of I-10 to its southern terminus at US 90
Jackson County: • I-10 from Highway 609 to MS 63 • MS 57 from I-10 to US 90 • MS 63 from I-10 to US 90 • US 90 from Oak Street in Gautier to Jerry St. Pé Highway at Ingalls Shipyards • US 90 from Pascagoula Street to Hospital Road in Pascagoula
There are 13 State-Aid bridges in Hancock County but only one MDOT-posted span, the US 90 bridge over the Pearl River at the Louisiana state line. Built in 1933 by the Wisconsin Bridge and Iron Company, the Pearl River Bridge has total length of 960.7 feet, deck width of 23.9 feet and vertical clearance above deck of 15 feet. An estimated 2,100 vehicles cross the bridge daily. The deck condition rating (as of April 2012) was fair, the superstructure condition was rated poor, substructure condition was fair, and the overall sufficiency rating was 6.0 (out of a possible 100.0). MDOT also maintains major bridges on Interstate 10 spanning the Pearl and Jourdan rivers and the US 90 bridge across the Bay of Saint Louis connecting Hancock County to Harrison County. Projected long-range rehabilitation costs shown in the MDOT report included the following amounts for state-maintained facilities in Hancock County:
• $11.726 million for pavement on highways • $28.779 million for MDOT bridges • $12.877 million for State-Aid bridges
There are 24 State-Aid bridges in Harrison County. I-10 bridges in the county include those crossing the Wolf River, Bayou Bernard (within the elevated US 49 interchange), the Biloxi River and the Tchoutacabouffa River. MDOT also maintains the US 90 bridge spanning the Bay of Biloxi, connecting Harrison County to Jackson County. The MDOT report identified the following costs for bridge and pavement rehabilitation over the next 20 years:
• $28.885 million for pavement on highways • $35.855 million for MDOT bridges • $42.585 million for State-Aid bridges
There are 19 State-Aid bridges in Jackson County and one MDOT-posted span. The latter is located on MS 57, crossing Red Creek just south of the George County line. The longest bridge in the Mississippi Gulf Area is the I-10 elevated section spanning the Pascagoula River basin. The total length of the bridge is 20,930.2 feet, almost four miles. Built in 1976, the I-10 Pascagoula River Bridge
MISSISSIPPI GULF COAST AREA TRANSPORTATION STUDY | 2040 LONG-RANGE TRANSPORTATION PLAN Chapter 8: Future Transportation Needs
8-20 | P a g e
bridge was inspected in October of 2012 and garnered ratings of good for deck condition and satisfactory for both superstructure condition and substructure condition. The 2013 MDOT report presented the following projections of 20-year maintenance costs for state routes in Jackson County:
• $36.182 million for pavement on highways • $27.734 million for MDOT bridges • $24.423 million for State-Aid bridges
8.2 BICYCLE AND PEDESTRIAN
While significant progress has been made in the development of bicycle and pedestrian facilities in the metropolitan area, the demand for non-motorized travel continues to grow, spurring efforts to provide sidewalks, bike paths, safe routes for cycling and multiuse pathways for both pedestrians and those riding bicycles. In addition to the local improvements designed to meet mobility needs within residential, commercial and recreational areas, there is a larger need for development of a regional network, serving longer trips between different sections of a city or even between cities. GRPC planners have sketched a network of separated paths that would improve bicycle mobility and increase connectivity throughout the Mississippi Gulf Coast area (see Figure 8-5). Highway 90 would serve as the spine of the network, providing a continuous east-west route across the three coastal counties. North-south routes would radiate inland from the coast along major roadways such as Beatline Road and County Farm Road, Highway 49, Popp’s Ferry Road, Highway 609 and the Gautier-Vancleave Road. Some segments of these routes would not be suitable for the installation of separated paths but could be adapted to accommodate bicycle travel safely.
This conceptual network is not intended to represent the total needs of the region. However, the segments selected represent recommendations from local comprehensive plans, the Hancock County Greenways Plan, the 2035 Long Range Transportation Plan, and/or input from local advocates and planners. Other objectives planners considered when identifying the proposed network components were connections to existing routes, schools, parks, transit routes and/or commercial centers. The proposed facility types have not been evaluated in terms of right-of-way costs or potential conflicts with utilities, drainage facilities or wetlands.
The separated-path network includes the Border to Border Route, a trail based on the Gulf Coast Heritage Trails Partnership’s signature project--the proposed Mississippi Coastal Heritage Trail--that would connect Infinity Science Center’s Possum Walk Trail in western Hancock County to the Grand Bay National Estuarine Research Reserve in eastern Jackson County (see Figure 8-6). The route proposed supports the MPO objective to improve regional transportation system mobility, accessibility, and quality for all roadway users and modes. It incorporates the most direct route segments suitable for bicycling based on speed, traffic volume, available space to ride, and connection to existing bicycle and pedestrian facilities.
MISSISSIPPI GULF COAST AREA TRANSPORTATION STUDY | 2040 LONG-RANGE TRANSPORTATION PLAN Chapter 8: Future Transportation Needs
8-21 | P a g e
8.3 PUBLIC TRANSIT
Based on analysis of Coast Transit Authority (CTA) operations and funding over the past five years, and input from stakeholder groups and the general public, recommendations were developed for updating the Transit Development Plan (TDP) prepared for CTA by Burk-Kleinpeter, Inc. (BKI) for the period from 2010 to 2035. The current section of the Metropolitan Transportation Plan (MTP) provides an abbreviated synopsis of the principal issues affecting transit service in the Mississippi Gulf Coast area; goals and objectives for maintaining, improving and expanding transit service in the region; and an overview of the analytical approach adopted for identifying and evaluating unmet needs and potential opportunities. While a broad outline of planned improvements is presented in this section, specific details are reserved for presentation in a separate document updating the current TDP to be consistent with other components of the 2040 long-range transportation plan.
While particular emphasis is afforded the short-term element of the program, covering the five-year period from 2016 through 2020, appropriate attention is also given the mid-range (2021-2030) and long-range (2031-2040) implementation stages. The overarching purpose of the program is to establish the basis for continuing growth and development, over the next 25 years, of a transit system that not only survived Hurricane Katrina in 2005 but has grown and prospered over the decade since that catastrophic event. More detailed information regarding the analysis and development of recommendations will be found in the Mississippi Gulf Coast Transit Development Plan Update: 2016-2040.
Transit Funding
The overarching issue with respect to public transportation on the Mississippi Gulf Coast is the lack of a stable and sufficient source of funding for transit operations. During the period from 2010 through 2013, the share of CTA fixed-route transit operating expenses covered by fare revenues increased steadily, topping out at a little less than 19 percent. Of nine transit systems in Mississippi, Alabama and Louisiana with service area population between 50,000 and 200,000, only the City of Monroe (Louisiana) topped 19 percent in 2013, with a 19.8 percent fare recovery rate (see Table 8-4).
While data for 2014 are not yet available from the National Transit Database, it is apparent that since 2013 ridership and fare revenues have been adversely affected by the collapse of oil prices and resulting low cost of gasoline to the consumer (see Figure 8-7). (Ridership on regularly scheduled CTA routes was down by more than 85,000 passengers from 2013 to 2014 and fell another 140,000 in the 2105 operating year.) The fact that CTA is doing so well at recovering costs through fare revenues, compared to other operators in Mississippi and adjoining states, suggests that there is not a whole lot more that can be done to improve a well-designed and well-managed operation. Nevertheless, there are always things that can be done to make the system even better; and perhaps there are things that must be done in order to maintain the present level of performance.

MISSISSIPPI GULF COAST AREA TRANSPORTATION STUDY | 2040 LONG-RANGE TRANSPORTATION PLAN Chapter 8: Future Transportation Needs
8-22 | P a g e
Table 8-4: CTA FARE REVENUES COMPARED TO OPERATING EXPENSES FOR COMPARABLE TRANSIT SYSTEMS
URBANIZED SERVICE AREA FARE OPERATING PCT FARE SYSTEM AREA (UZA) POPULATION REVENUE EXPENSES RECOVERY Coast Transit Authority Gulfport MS 113,222 $765,203 $4,082,184 18.7% Hub City Transit Hattiesburg MS 51,084 $31,526 $867,600 3.6% City of Jackson Transit Jackson MS 173,514 $529,954 $3,125,387 17.0% Tuscaloosa County Park & Transit Tuscaloosa AL 136,487 $151,386 $1,257,289 12.0% City of Huntsville AL Public Transit Huntsville AL 127,000 $246,903 $2,084,007 11.8% City of Alexandria Alexandria LA 62,924 $434,767 $2,304,265 18.9% City of Monroe Transit System Monroe LA 50,000 $858,545 $4,327,135 19.8% Lafayette Transit System Lafayette LA 148,843 $528,435 $4,736,618 11.2% Terrebonne Consolidated Govt Houma LA 82,803 $120,673 $1,688,608 7.1%
Note: Survey included all systems in Alabama, Louisiana and Mississippi with service area population equal to at least 50,000 but less than 200,000. Source: National Transit Database (2015) for data; calculations by Neel-Schaffer, Inc.
It is to be hoped that fare revenues can be restored to the 2013 level and further expanded in the future—and that operating expenses can be held in check or even reduced by judicious route planning and scheduling—but the major obstacle confronting CTA is the lack of a local funding source that can be counted on from year to year. While the overall operating cost for all public transportation services provided by CTA exceeded the total cost of services provided by the City of Jackson in 2013, the Jackson transit system benefited from local support that surpassed local funding for CTA by more than $3.1 million (see Table 8-5). The aggregate local contribution to transit operations in the Mississippi Gulf Coast area has declined in absolute terms in recent years, forcing cutbacks that have had a deleterious effect on ridership. Moreover, as noted in the 2010 TDP and reiterated in a report on funding prepared for CTA by BKI in 2012, the local percentage of operating funds has been decreasing since 2001. A little more than two-thirds of all operating funds made available to CTA in 2013 were used to cover expenses incurred for fixed-route bus service (see Table 8-6). Fare revenue generated by bus service represented a little less than 60 percent of the total amount paid by passengers for all services. Vanpool services provided on a contractual basis by VPSI incurred only 13 percent of all operating expenses and generated 37 percent of total fare revenue. The commuter vanpool service had the highest farebox recovery rate, just over 60 percent, with the balance of costs being covered by a combination of Federal Transit Administration (FTA) Job Access Reverse Commute Program funds and contributions from participating employers.
The report prepared for CTA by BKI noted that local funding is appropriated annually by participating cities and counties from their general funds and added, “With undedicated local general fund dollars continually in high demand, transit must continually compete with other important community services for sustained funding levels” (Getting on Board with Coast Transit Authority, July 31, 2012, page 28). Four potential

MISSISSIPPI GULF COAST AREA TRANSPORTATION STUDY | 2040 LONG-RANGE TRANSPORTATION PLAN Chapter 8: Future Transportation Needs
8-23 | P a g e
Figure 8-5: Proposed Separated-Path Network for Bicycle Travel
Source: Gulf Regional Planning Commission

MISSISSIPPI GULF COAST AREA TRANSPORTATION STUDY | 2040 LONG-RANGE TRANSPORTATION PLAN Chapter 8: Future Transportation Needs
8-24 | P a g e
Figure 8-6: Proposed Border-to-Border Bicycle Trail
Source: Gulf Regional Planning Commission

MISSISSIPPI GULF COAST AREA TRANSPORTATION STUDY | 2040 LONG-RANGE TRANSPORTATION PLAN Chapter 8: Future Transportation Needs
8-25 | P a g e
Source: National Transit Database; U. S. Department of Energy, Energy Information Administration; Neel-Schaffer, Inc. sources of funding, culled from an initial 40 considered in consultation with a stakeholder study group, were recommended for further exploration (page 39):
• Court fees imposed as a penalty stemming from a motorist violation resulting in suspension of
the driver’s license; • Rental car fees primarily targeting non-resident visitors to the area; • Casino-based revenue provided by operators under an agreement reimbursing CTA for casino-
oriented transit service such as the Casino Hopper line; • Tri-county tourism-based tax primarily targeting non-resident visitors by imposing a sales tax on
accommodations and retail food and beverage purchases.
It remains to be seen whether any one of these or another revenue measure can attract the broad-based public and political support necessary to secure adoption at the local and/or state level. Nevertheless, it is likely that in the absence of some dedicated local funding source, CTA will be hard-pressed to continue providing regularly scheduled fixed-route transit service at the present level; and upgrading operations to attract additional patronage will be impossible.
60
70
80
90
100
110
120
130
140
150
1 4 7 10 13 16 19 22 25 28 31 34 37 40 43 46 49 52PERC
ENT
OF
CORR
ESPO
NDI
NG
MO
NTH
IN 2
010
MONTH
Figure 8-7:CTA RIDERSHIP COMPARED TO PRICE OF GASOLINE BY MONTH
(JANUARY 2011 TO APRIL 2015)Normalized as Percentage of 2010 Base-Line Condition
PASSENGERS PRICE OF GASOLINE

MISSISSIPPI GULF COAST AREA TRANSPORTATION STUDY | 2040 LONG-RANGE TRANSPORTATION PLAN Chapter 8: Future Transportation Needs
8-26 | P a g e
Maintaining the Existing System
The immediate challenge confronting CTA is to maintain the existing system, consolidating the gains of the past 10 years, in order to provide a stable platform for future growth and expansion. While the overall performance of the system has been very good in recent years, it is possible that fare revenue could be increased or operating expense reduced by modifying service on routes that do not perform up to the system-wide standard. Two modifications proposed for implementation during the five-year short-range planning period from 2016 to 2020 could make a not-insignificant contribution to the efficiency of fixed-route transit operations: The first would eliminate so-called “hail stops” made when someone wishing to board flags down a bus at a non-designated location. Eliminating such flag stops and providing proper signage at all designated stop locations could help improve schedule adherence and even reduce the time required to complete a scheduled trip. The second reform would involve eliminating unnecessary deviations from main travel routes. At the present time some buses turn in at designated locations to pick up passengers waiting at establishments set back from the street. The process of leaving the street to travel up a private drive, pick up passengers, return to the street and then merge into moving traffic consumes time that could be pared from the schedule by simply providing a properly signed stop location on the street and making curbside pick-ups standard policy for all fixed-route service.
Table 8-5: 2013 COAST TRANSIT AUTHORITY FUNDING BY SOURCE COMPARED TO OTHER MISSISSIPPI SYSTEMS
URBANIZED FUNDING SOURCE SYSTEM AREA FARES FEDERAL STATE LOCAL OTHER TOTAL Coast Transit Authority Gulfport $1,281,624 $3,173,357 $266,510 $1,132,009 $199,948 $6,053,448
Percent 21.2% 52.4% 4.4% 18.7% 3.3% 100.0%
Hub City Transit Hattiesburg $41,548 $752,768 $0 $346,401 $0 $1,140,717
Percent 3.6% 66.0% 0.0% 30.4% 0.0% 100.0%
City of Jackson Jackson $601,436 $344,002 $480,000 $4,267,055 $75,675 $5,768,168 Percent 10.4% 6.0% 8.3% 74.0% 1.3% 100.0%
Note: Funding amounts are for all services, including fixed-route, paratransit and commuter. Source: National Transit Database (2015) for data; calculations by Neel-Schaffer, Inc.
Another very important alteration that needs to be implemented over the next five years involves reducing the time between scheduled trips in order to increase the frequency of service. Headways presently range from 45 to 90 minutes. CTA proposes to reduce 45-minute headways to 30 minutes wherever possible and to cut 90-minute trip intervals to 60 minutes. These measures would require additional equipment and operating funds, but they are essential if the transit system is to build a solid base of support among riders who consider bus service to be a convenient and reliable alternative to private-vehicle travel. Additional measures, such as those described above and others intended to reduce

MISSISSIPPI GULF COAST AREA TRANSPORTATION STUDY | 2040 LONG-RANGE TRANSPORTATION PLAN Chapter 8: Future Transportation Needs
8-27 | P a g e
travel distance by shortening or redirecting routes, can also contribute to lessening the time between scheduled trips.
Proper maintenance of rolling stock and replacement of aging vehicles are also necessary measures if the transit system is to be kept in a state of good repair and service is to remain safe and reliable. CTA currently has on order seven new low-floor hybrid-electric buses with reclining seats, overhead luggage racks, wireless internet and electrical outlets. These vehicles will have a major impact on the public perception of transit as an attractive alternative to driving. The implementation of new technology will also serve to pique interest and appreciation of enhanced transit service. The RouteShout mobile app launched earlier this year allows riders to find out where a bus is located and when it will arrive at a specified stop. An individual waiting at a stop location or preparing to leave home to catch the bus no longer has to wonder when the transit vehicle will arrive; that information is readily available on his computer or cellular phone.
There is also an obvious need to maintain current performance standards for other CTA services: Demand-response paratransit and commuter vanpool operations. Regular parallel paratransit service will necessarily grow as the fixed-route system expands, and the ADA Paratransit Plus operation will continue providing transportation for qualified individuals throughout all three Mississippi Gulf Coast counties. CTA also remains committed to its highly successful commuter ridesharing program and will continue its outreach to large employers and efforts to secure or provide parking and other facilities needed to encourage public support and patronage. In addition, the Bike-n-Bus program has been extremely successful in attracting riders from among the cycling population by enabling them to mount their bikes on racks attached to the front end of buses so that they can easily shift from riding a bicycle to traveling in a transit vehicle and back again. The Bike-n-Bus Program will continue to be a staple of the CTA system.
Table 8-6: 2013 COAST TRANSIT AUTHORITY OPERATING EXPENSE
AND FARE REVENUE BY MODE OPERATING PCT OF FARE PCT OF FARE PCT MODE EXPENSE EXP TOT REVENUE REV TOT OF EXPENSE Demand-Response $1,145,046 19.1 $42,470 3.3 3.7 Fixed-Route Bus $4,082,184 68.0 $765,203 59.7 18.7 Vanpool $780,198 13.0 $473,951 37.0 60.7
TOTAL $6,007,428 100.0 $1,281,624 100.0 21.3 Source: National Transit Database (2015); calculations by Neel-Schaffer, Inc.
Upgrading Facilities
In order to expand the transit system to meet the growing need for public transportation in the Mississippi Gulf Coast area it will be necessary to optimize utilization of the existing transit centers in Gulfport, Biloxi and D’Iberville. These are important transit hubs at which lines converge and from which they radiate to serve people living, working, shopping or engaging in recreational activities in their respective cities or traveling from one city to the other for these or other purposes. CTA is in the process of finalizing plans for expansion of the Gulfport Transit Center into the adjacent structure which served as the Gulfport Main

MISSISSIPPI GULF COAST AREA TRANSPORTATION STUDY | 2040 LONG-RANGE TRANSPORTATION PLAN Chapter 8: Future Transportation Needs
8-28 | P a g e
Library for many years prior to Hurricane Katrina. The structure, gutted by the storm and abandoned by the Harrison County Library System, will be rehabilitated and reconfigured to serve as a multimodal transportation center. It will serve as a base for downtown shuttle service connecting Jones Park, the new aquarium and other waterfront attractions to office buildings, the post office, the new library, the county courthouse, Federal building and other destinations in the central business district of the city.
CTA also plans to locate transit super-stops at new hubs located at key transfer-points for travel in the region. One located in the vicinity of the I-10 interchange with US 49 will provide an opportunity to implement park-and-ride service for residents of the Orange Grove area and other more remote portions of Harrison County who work in or near downtown Gulfport or along the Highway 90 corridor served by the Beachcomber line. Another located in the vicinity of the I-10 interchange with I-110 will facilitate park-and-ride service for people who live in outlying portions of either Harrison or Jackson County and work in D’Iberville or Biloxi. A third hub is also proposed for the planned Coliseum Hotel and Convention District identified in the City of Biloxi Comprehensive Plan. The hub would be a major transfer-point between the Beachcomber, new express bus service linking the Gulfport and Biloxi transit centers, and a planned Popp’s Ferry route that will connect to the Coliseum hub by way of the Popp’s Ferry Road extension from Pass Road to US 90 currently under development. CTA will pursue negotiations with the owners and operators of major retail shopping malls, as well as the Mississippi Coast Coliseum Authority, to secure the necessary space at suitable locations for development of the proposed hubs and associated parking facilities.
In order to optimize planned express bus service in the Highway 90 corridor, and possibly along other major routes, CTA will seek the implementation of intelligent transportation systems (ITS) technology to facilitate the movement of transit vehicles. The first item on the ITS agenda is the installation of signal-preemption equipment on traffic lights and buses that would trigger a green light for approaching transit vehicles. This will be another key element of efforts to cut travel time and reduce headways.
Expansion of the Existing System
In addition to improving service by tightening up the schedule and cutting down the time between scheduled bus trips, CTA intends to expand the existing fixed-route transit network to areas where latent demand is presently unmet. A key objective in this regard relates to the need for more service connecting east-west routes in the older urban areas located along the Mississippi Sound to the areas that have been annexed or incorporated in the years since the City of D’Iberville achieved municipal status in 1988. Since then, both Gulfport and Biloxi have annexed large areas lying north of the old city limits, as did the City of Gautier in Jackson County. More recently, residents of the Diamondhead community in Hancock County voted to incorporate, and the one-time haven for retirees developed in the 1970s became the newest Mississippi Gulf coast municipality in January of 2012. The last 10 years have also seen a steady push to the north occasioned by the destruction of homes and businesses during Hurricane Katrina and the ensuing impact of stricter building requirements and drastically higher insurance costs. New bus routes need to follow the inland progression of development.
At the same time, there is clearly a need for more expeditious service in the east-west corridor running roughly parallel to the coastline in Harrison County. As traffic builds on Beach Boulevard (US 90) it becomes increasingly difficult for Beachcomber and Casino Hopper drivers to stay on schedule. This is especially the case during special events such as the annual weeklong Cruisin’ the Coast celebration that

MISSISSIPPI GULF COAST AREA TRANSPORTATION STUDY | 2040 LONG-RANGE TRANSPORTATION PLAN Chapter 8: Future Transportation Needs
8-29 | P a g e
attracts thousands of vintage automobile owners to the Coast. Adding as many as 10,000 cars to the traffic mix can result in serious congestion, especially when the drivers of those vehicles are only cruising and in no hurry to get anywhere. Two major studies undertaken in the past 20 years have focused on the need for a new roadway, running east and west somewhere between Highway 90 and Pass Road, which could provide relief for those two principal arterials. Both studies recommended development of a multimodal transportation corridor capable of carrying longer, faster vehicular trips so that Beach Boulevard could serve principally as a scenic route for more leisurely sightseeing trips, beach-bound travel or gaming-related trip-making. The proposed new corridor would also accommodate transit, initially facilitating express bus service on the limited-access roadway, and later providing a path for bus rapid transit (BRT) service between Gulfport and Biloxi.
Other proposed new routes were identified by analyzing base-year and projected future land use and demographic conditions. Detailed information regarding the analysis is presented in the 2040 Transit Development Plan. This section of the long-range transportation plan focuses only on what went into the identification of short–term needs for new or reconfigured routes. The evaluation of potential new or modified routes assumed several key criteria:
• Service should be extended to areas with population and/or employment density sufficient to support transit patronage.
• System continuity should be maintained and strengthened by connecting new routes to existing lines whenever possible, preferably at hubs or other locations conducive to passenger transfers.
• Wherever possible new routes should follow well-traveled arterial routes with adequate roadway capacity.
• New or modified routes should be designed both to be seen by potential riders and to make sense as alternative travel choices, avoiding time-consuming indirect or circuitous paths.
• New or modified routes should be designed to allow the scheduling of service at 30 to 60-minute intervals in order to advance the CTA objective relating to reduced headways for regularly scheduled fixed-route service.
CTA bus routes presently provide fairly extensive coverage within a large portion of the Gulfport-Biloxi Urbanized Area, including the cities of Gulfport, Biloxi, D’Iberville and Ocean Springs (see Figure 8-8). Limited service in Bay Saint Louis has recently been added in the form of an isolated local circulator not connected to the rest of the system. No service is provided in the cities of Waveland, Pass Christian or Long Beach; nor is service available in the Jackson County cities east of Ocean Springs: Pascagoula, Moss Point and Gautier. There are also large portions of Gulfport and Biloxi that remain unserved, including much of the Orange Grove area and North Biloxi.
The initial criterion applied in assessing the potential suitability of these service gap areas for the location of new routes related to the concentration of population and employment. Density statistics were derived for the 797 traffic analysis zones in the three-county area delineated for the regional travel demand forecasting model. The criterion adopted to identify zones that might be capable of supporting transit service was population and/or employment density exceeding 1,000 residents or workers per square mile. (Traffic zones meeting that criterion are highlighted yellow in Figure 8-8). In Hancock County, Diamondhead and portions of Waveland and Bay Saint Louis met the base criterion. In the western portion of Harrison County, almost all traffic zones in Long Beach had population and/or employment density greater than 1,000, but very few in Pass Christian met the threshold value. Most zones in Gulfport,

MISSISSIPPI GULF COAST AREA TRANSPORTATION STUDY | 2040 LONG-RANGE TRANSPORTATION PLAN Chapter 8: Future Transportation Needs
8-30 | P a g e
Biloxi and D’Iberville exceeded the base criterion. In the western portion of Jackson County, most of the zones included in the Gulfport-Biloxi Urbanized Area—in Ocean Springs, St. Martin and Gulf Hills—had population/employment density greater than 1,000. In the unserved Pascagoula-Moss Point Urbanized Area much of Gautier, most of Moss Point and virtually all of Pascagoula satisfied the initial criterion.
The criterion relating to continuity presents an obstacle to the implementation of new service in eastern Jackson County and must be waived if transit is to establish a foothold in the Pascagoula-Moss Point Urbanized Area. There is certainly an unmet need for transit in Pascagoula, Moss Point and Gautier; but it is difficult to see how it could be linked to the existing network, given the large gap in service-area potential east of Ocean Springs. On the other hand, new routes in Gulfport, Biloxi or Long Beach could easily be connected to existing lines at new or previously established transit hubs.
West of Gulfport, Highway 90 provides the most likely path for the extension of transit service. Major streets in Gulfport that currently do not accommodate bus routes include Highway 49 north of I-10, Airport Road, Hewes Avenue, Cowan Road, Lorraine Road and Courthouse Road. In Biloxi the entire length of Popp’s Ferry Road is located in an area that could support transit. In Jackson County the numerous arterials presently lacking transit include the Gautier-Vancleave Road, Highway 90 and MS 63; Main Street and Martin Luther King Boulevard in Moss Point; Pascagoula Street, Telephone Road, and Market Street in Pascagoula; and others.
After evaluating a number of potential routes, with regard to these and the other criteria identified, the following seven were identified as the ones most likely to meet the need for new service and secure the patronage of people living, working or traveling in areas of unmet latent transit demand:
• Popp’s Ferry Road from Edgewater Shopping Center to the Promenade in D’Iberville. The route would utilize Eisenhower Drive and Pass Road to reach Popp’s Ferry Road; follow that thoroughfare from one end to the other; and connect to the Promenade hub by way of D’Iberville Boulevard and Promenade Parkway. The one-way travel distance would be approximately 9.50 miles, and the trip from one end to the other would require roughly 40 minutes, making it possible for two buses to provide service with 45-minute intervals between trips in each direction.
• Beachcomber – Long Beach from the Gulfport Transit Terminal to the WalMart in Pass Christian via Highway 90. The total length of the proposed route is about seven miles. A round-trip of 14 miles would require a little less than 60 minutes to complete, so it is possible a single bus could provide hourly service on the route.
• Beachcomber – Bay Saint Louis would provide service between the Pass Christian WalMart and Bay Saint Louis, connecting to the new Beachcomber-Long Beach line. Most of the route would be located on Highway 90. In Bay Saint Louis the line would terminate at the municipal parking facility on Court Street. Between the highway and the end of the line the route would follow Beach Boulevard and Court Street, circling back to Beach Boulevard on the return trip by way of Second Street and Main Street. The total route length would be approximately 10 miles, requiring roughly 40 minutes to complete a one-way trip; so two buses would be required to provide continuous service at 45-minute intervals.

MISSISSIPPI GULF COAST AREA TRANSPORTATION STUDY | 2040 LONG-RANGE TRANSPORTATION PLAN Chapter 8: Future Transportation Needs
8-31 | P a g e
• Ocean Springs-D’Iberville via Washington Avenue (Highway 609), the I-10 Connector Road, Mallette Road and Sangani Boulevard to the hub at the Promenade. Initiation of service on this route will follow completion of the I-10 Connector Road between Tucker Road (Highway 609) and the east end of Mallette Road at Daisy Vestry Road. Connecting service at the Promenade will include the new Popp’s Ferry line and D’Iberville Route 4. At the opposite end the route will connect to Ocean Springs Route 7 at its point of origin on Washington Avenue in the vicinity of either Bienville Boulevard or Government Street. The total centerline length of the route is approximately seven miles. A round-trip could probably be accomplished in less than an hour, making it possible for a single bus to provide service on the route at 60-minute intervals.
• East-West Corridor express bus service between the Gulfport and Biloxi transit terminals, operating initially on Highway 90, would be relocated to the new multimodal transportation corridor eventually. The total one-way length of the route is about 12.25 miles. Buses would make a very limited number of stops, so it is likely a one-way trip could be completed in 40 minutes or less. Two buses could be assigned to provide weekday peak-period service at 45-minute intervals.
• Gautier-Pascagoula would provide service between the Gautier-Vancleave Road and downtown Pascagoula, via Highway 90 and Pascagoula Street, terminating at Delmas Avenue. This is one of two new routes that would establish transit service within the Pascagoula-Moss Point Urbanized Area. The route would be roughly 6.25 miles from end to end and require about 25 minutes to complete, so a single-bus could provide regularly scheduled service at 60-minute intervals.
• Pascagoula-Moss Point would provide service between the two cities in eastern Jackson County on Jackson Avenue, Market Street, Telephone Road, Main Street, Highway 613 and Dutch Bayou Road, looping back around at the northern end of the route via Elder Ferry Road, Jamestown Road and Sutton Road. The total length of the route would be approximately 7.25 miles. A one-way trip could probably be accomplished in less than 30 minutes, making it possible for a single bus to provide regularly scheduled service at 60-minute intervals.
In addition to the existing transit centers in Gulfport, Biloxi and D’Iberville, the expanded system would require new hubs in the central business districts of Bay Saint Louis, Oceans Springs and Pascagoula, at the Promenade in D’Iberville and at the WalMart in Pass Christian. Park-and-ride facilities should be developed in the vicinity of I-10 at Highway 49, Lorraine Road, I-110 and Highway 609.
Planning for future development of the system should explore the possibility of establishing transit service in Diamondhead and linking it to Bay Saint Louis. It should also examine the feasibility of service connecting Gautier to Ocean Springs. Other corridors in Gulfport, Biloxi and Long Beach may warrant further articulation of the existing system in the future. The planning basis for eventual implementation of bus rapid transit (BRT) in the East-West Corridor should be established, and conceptual plans for beachfront fixed-guideway service on or adjacent to Highway 90 in Gulfport and Biloxi should be developed.

MISSISSIPPI GULF COAST AREA TRANSPORTATION STUDY | 2040 LONG-RANGE TRANSPORTATION PLAN Chapter 8: Future Transportation Needs
8-32 | P a g e
Figure 8-8: Potential Transit Service Areas
Source: Neel-Schaffer, Inc.


![関与しているか › guidelinem › msgl › koukasyo...#1 Search "Multiple Sclerosis/immunology" [MAJR] 4,970 #2 Search mechanism OR mechanisms OR immunopathogenesis OR immunopathology](https://static.fdocuments.net/doc/165x107/5f19cd6bb57556544602988a/e-a-guidelinem-a-msgl-a-koukasyo-1-search-multiple.jpg)