![12: ' # '8& *#1 & 9cdn.intechopen.com/pdfs-wm/39943.pdf&kdswhu 'hwhuplqdwlrqri)rrg4xdolw\e\8vlqj6shfwurvfrslf 0hwkrgv $jqlhv]nd1dzurfnddqg-rdqqd/dpruvnd $gglwlrqdolqirupdwlrqlvdydlodeohdwwkhhqgriwkhfkdswhu](https://static.fdocuments.net/doc/165x107/5b15485b7f8b9adc528b8599/12-8-1-9cdn-ampkdswhu-hwhuplqdwlrqrirrg4xdolwe8vlqj6shfwurvfrslf.jpg)
80: ' # '7& *#8 & 9cdn.intechopen.com/pdfs-wm/13654.pdfThe osteocytes, with their interconnected...
20
3,350+ OPEN ACCESS BOOKS 108,000+ INTERNATIONAL AUTHORS AND EDITORS 115+ MILLION DOWNLOADS BOOKS DELIVERED TO 151 COUNTRIES AUTHORS AMONG TOP 1% MOST CITED SCIENTIST 12.2% AUTHORS AND EDITORS FROM TOP 500 UNIVERSITIES Selection of our books indexed in the Book Citation Index in Web of Science™ Core Collection (BKCI) Chapter from the book Virtual Reality Downloaded from: http://www.intechopen.com/books/virtual-reality PUBLISHED BY World's largest Science, Technology & Medicine Open Access book publisher Interested in publishing with IntechOpen? Contact us at [email protected]
Transcript of 80: ' # '7& *#8 & 9cdn.intechopen.com/pdfs-wm/13654.pdfThe osteocytes, with their interconnected...

3,350+OPEN ACCESS BOOKS
108,000+INTERNATIONAL
AUTHORS AND EDITORS115+ MILLION
DOWNLOADS
BOOKSDELIVERED TO
151 COUNTRIES
AUTHORS AMONG
TOP 1%MOST CITED SCIENTIST
12.2%AUTHORS AND EDITORS
FROM TOP 500 UNIVERSITIES
Selection of our books indexed in theBook Citation Index in Web of Science™
Core Collection (BKCI)
Chapter from the book Virtual RealityDownloaded from: http://www.intechopen.com/books/virtual-reality
PUBLISHED BY
World's largest Science,Technology & Medicine
Open Access book publisher
Interested in publishing with IntechOpen?Contact us at [email protected]
1. Introduction
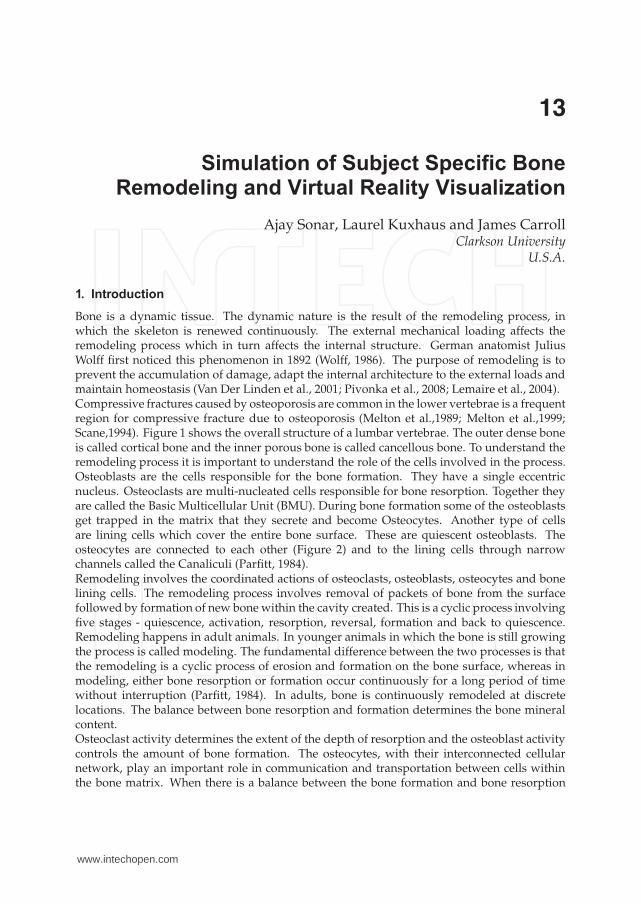
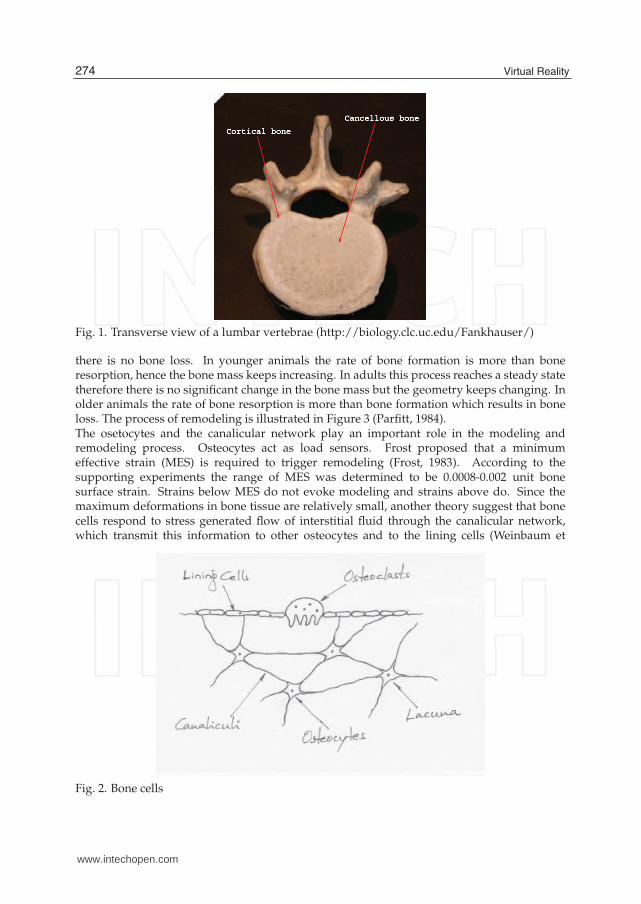
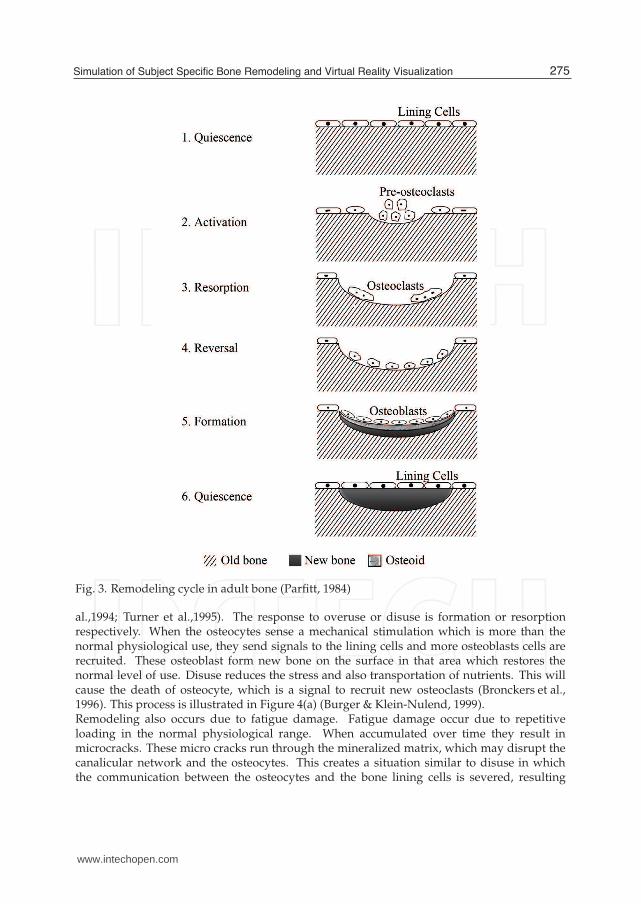
Bone is a dynamic tissue. The dynamic nature is the result of the remodeling process, inwhich the skeleton is renewed continuously. The external mechanical loading affects theremodeling process which in turn affects the internal structure. German anatomist JuliusWolff first noticed this phenomenon in 1892 (Wolff, 1986). The purpose of remodeling is toprevent the accumulation of damage, adapt the internal architecture to the external loads andmaintain homeostasis (Van Der Linden et al., 2001; Pivonka et al., 2008; Lemaire et al., 2004).Compressive fractures caused by osteoporosis are common in the lower vertebrae is a frequentregion for compressive fracture due to osteoporosis (Melton et al.,1989; Melton et al.,1999;Scane,1994). Figure 1 shows the overall structure of a lumbar vertebrae. The outer dense boneis called cortical bone and the inner porous bone is called cancellous bone. To understand theremodeling process it is important to understand the role of the cells involved in the process.Osteoblasts are the cells responsible for the bone formation. They have a single eccentricnucleus. Osteoclasts are multi-nucleated cells responsible for bone resorption. Together theyare called the Basic Multicellular Unit (BMU). During bone formation some of the osteoblastsget trapped in the matrix that they secrete and become Osteocytes. Another type of cellsare lining cells which cover the entire bone surface. These are quiescent osteoblasts. Theosteocytes are connected to each other (Figure 2) and to the lining cells through narrowchannels called the Canaliculi (Parfitt, 1984).Remodeling involves the coordinated actions of osteoclasts, osteoblasts, osteocytes and bonelining cells. The remodeling process involves removal of packets of bone from the surfacefollowed by formation of new bonewithin the cavity created. This is a cyclic process involvingfive stages - quiescence, activation, resorption, reversal, formation and back to quiescence.Remodeling happens in adult animals. In younger animals in which the bone is still growingthe process is called modeling. The fundamental difference between the two processes is thatthe remodeling is a cyclic process of erosion and formation on the bone surface, whereas inmodeling, either bone resorption or formation occur continuously for a long period of timewithout interruption (Parfitt, 1984). In adults, bone is continuously remodeled at discretelocations. The balance between bone resorption and formation determines the bone mineralcontent.Osteoclast activity determines the extent of the depth of resorption and the osteoblast activitycontrols the amount of bone formation. The osteocytes, with their interconnected cellularnetwork, play an important role in communication and transportation between cells withinthe bone matrix. When there is a balance between the bone formation and bone resorption
13
Simulation of Subject Specific Bone Remodeling and Virtual Reality Visualization
Ajay Sonar, Laurel Kuxhaus and James Carroll Clarkson University
U.S.A.
13
www.intechopen.com
2 Virtual Reality
Fig. 1. Transverse view of a lumbar vertebrae (http://biology.clc.uc.edu/Fankhauser/)
there is no bone loss. In younger animals the rate of bone formation is more than boneresorption, hence the bone mass keeps increasing. In adults this process reaches a steady statetherefore there is no significant change in the bone mass but the geometry keeps changing. Inolder animals the rate of bone resorption is more than bone formation which results in boneloss. The process of remodeling is illustrated in Figure 3 (Parfitt, 1984).The osetocytes and the canalicular network play an important role in the modeling andremodeling process. Osteocytes act as load sensors. Frost proposed that a minimumeffective strain (MES) is required to trigger remodeling (Frost, 1983). According to thesupporting experiments the range of MES was determined to be 0.0008-0.002 unit bonesurface strain. Strains below MES do not evoke modeling and strains above do. Since themaximum deformations in bone tissue are relatively small, another theory suggest that bonecells respond to stress generated flow of interstitial fluid through the canalicular network,which transmit this information to other osteocytes and to the lining cells (Weinbaum et
Fig. 2. Bone cells
274 Virtual Reality
www.intechopen.com
Simulation of Subject Specific Bone Remodeling and Virtual Reality Visualization 3
Fig. 3. Remodeling cycle in adult bone (Parfitt, 1984)
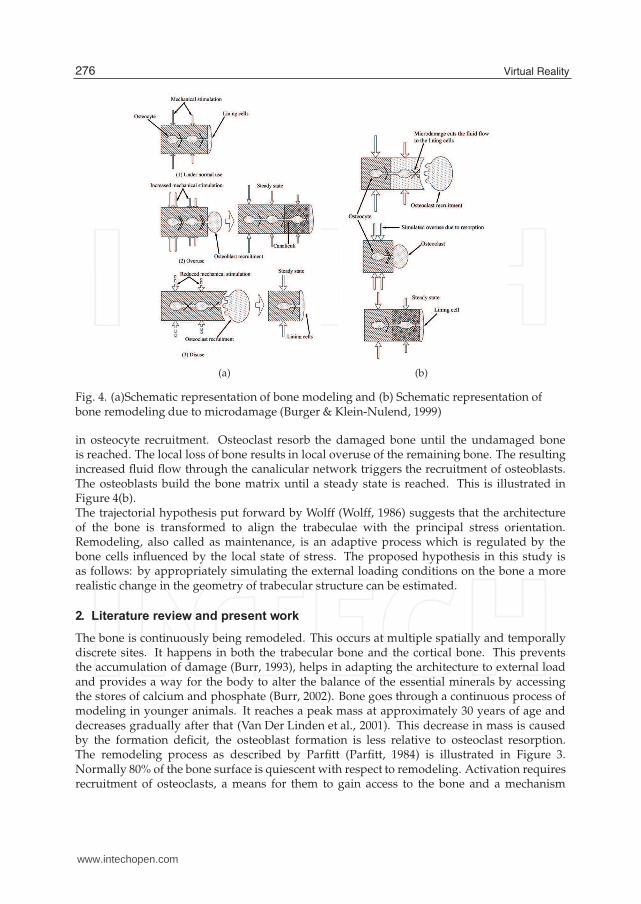
al.,1994; Turner et al.,1995). The response to overuse or disuse is formation or resorptionrespectively. When the osteocytes sense a mechanical stimulation which is more than thenormal physiological use, they send signals to the lining cells and more osteoblasts cells arerecruited. These osteoblast form new bone on the surface in that area which restores thenormal level of use. Disuse reduces the stress and also transportation of nutrients. This willcause the death of osteocyte, which is a signal to recruit new osteoclasts (Bronckers et al.,1996). This process is illustrated in Figure 4(a) (Burger & Klein-Nulend, 1999).Remodeling also occurs due to fatigue damage. Fatigue damage occur due to repetitiveloading in the normal physiological range. When accumulated over time they result inmicrocracks. These micro cracks run through the mineralized matrix, which may disrupt thecanalicular network and the osteocytes. This creates a situation similar to disuse in whichthe communication between the osteocytes and the bone lining cells is severed, resulting
275Simulation of Subject Specific Bone Remodeling and Virtual Reality Visualization
www.intechopen.com
4 Virtual Reality
(a) (b)
Fig. 4. (a)Schematic representation of bone modeling and (b) Schematic representation ofbone remodeling due to microdamage (Burger & Klein-Nulend, 1999)
in osteocyte recruitment. Osteoclast resorb the damaged bone until the undamaged boneis reached. The local loss of bone results in local overuse of the remaining bone. The resultingincreased fluid flow through the canalicular network triggers the recruitment of osteoblasts.The osteoblasts build the bone matrix until a steady state is reached. This is illustrated inFigure 4(b).The trajectorial hypothesis put forward by Wolff (Wolff, 1986) suggests that the architectureof the bone is transformed to align the trabeculae with the principal stress orientation.Remodeling, also called as maintenance, is an adaptive process which is regulated by thebone cells influenced by the local state of stress. The proposed hypothesis in this study isas follows: by appropriately simulating the external loading conditions on the bone a morerealistic change in the geometry of trabecular structure can be estimated.
2. Literature review and present work
The bone is continuously being remodeled. This occurs at multiple spatially and temporallydiscrete sites. It happens in both the trabecular bone and the cortical bone. This preventsthe accumulation of damage (Burr, 1993), helps in adapting the architecture to external loadand provides a way for the body to alter the balance of the essential minerals by accessingthe stores of calcium and phosphate (Burr, 2002). Bone goes through a continuous process ofmodeling in younger animals. It reaches a peak mass at approximately 30 years of age anddecreases gradually after that (Van Der Linden et al., 2001). This decrease in mass is causedby the formation deficit, the osteoblast formation is less relative to osteoclast resorption.The remodeling process as described by Parfitt (Parfitt, 1984) is illustrated in Figure 3.Normally 80% of the bone surface is quiescent with respect to remodeling. Activation requiresrecruitment of osteoclasts, a means for them to gain access to the bone and a mechanism
276 Virtual Reality
www.intechopen.com
Simulation of Subject Specific Bone Remodeling and Virtual Reality Visualization 5
to attach to the bone surface. Activation is a function of age, sex and metabolic state. Itoccurs partly at random and partly in response to the biomechanical requirement. Aftercoming in contact with the bone, the osteoclasts begin to resorb the bone. It is referred toas Howship’s lacuna in trabecular bone and as cutting cone in cortial bone. The resorptioncavity has a charecteristic shape and dimension. The resorption cavity grows at a rate of5-10µm/day perpendicular to the surface and 20-40µm/day parallel to the surface. Afterthe resorption ends, it enters a reversal phase. The rough surface of the resorption cavity issmoothed and thin layer of highly mineralized matrix is laid down, preparing the surfacefor bone formation. Once the surface is ready, osteoblast cells are recruited. This phase hastwo parts, matrix synthesis and mineralization. Mineralization follows matrix synthesis. Thenewly laid unmineralized bone matrix is called osteoid. This seperates the osteoblasts andthe newly mineralized bone. Synthesis terminates after the cavity is filled. Mineralizationcontinues slowly until the osteoid seam disappears. The osteoblasts that remain on the surfacetransform in to lining cells.Bone adapts its structure much more readily during growth than after skeletal maturationbecause it is intrinsically responsive to strain (Frost, 1982). During modeling there is no needfor activation of the surface since it is continuously active from earliest embryonic stage untilgrowth ceases. Whereas in the adult bone, for the adaptive change to occur, the quiescentsurface needs activation.Unlike cortical bone which is dense, trabecular bone is porous and extremely anisotropic.It consists of numerous interconnected struts mostly with thick vertical struts and thinnerhorizontal struts. There are two distinct types of struts present in the structure, plates androds. As the name suggest the rods are more cylindrical and long whereas the plates aremore flat. In a study on the age related change by Mosekilde (Mosekilde, 1988; 1989), onindividuals between the age of 15 to 87, a significant thinning and disappearance of thehorizontal supporting struts and total removal of some of the vertical struts were observed. Asignificant increase in both the horizontal and vertical trabecular distance was also shown. Apronounced loss of bone strength was shown in females around the age of 40-50 (Mosekilde,1989).Many theoretical and computational models have been proposed to investigate and simulatethe dynamic behavior of the bone (Van Der Linden et al.,2001; Lemaire et al.,2004; Thomsenet al.,1994; Langton et al.,1998). With high resolution imaging methodologies such as µCTbecoming more accessible, the study of trabecular remodeling began to take in to account theinfluence of cellular activity in 2 and 3 dimensions (Liu et al., 2008; Van Der Linden et al., 2001;Muller & Hayes, 1997). Simulation involving effect of metabolic bone formation deficit andthe micro structural bone formation deficit are also developed (Van Der Linden et al., 2001;Linden et al., 2003). Effect of trabecular plate thickness and the trabecular plate density on theage related changes showed that the plate density is more significant predictor of bone lossthan a decrease in the plate thickness (Parfitt et al., 1983).Different mathematical control models of mechanical bone mass regulation have beenproposed (Cowin & Hegedus,1976; Mullender & Huiskes,1995; Huiskes et al.,1987). Thesemodels assumed a continuous feedback loop between the maintenance of bone mass and localstrain values in the tissue. This enabled mathematical predictions of local bone regulationbased on external loads. These models differ in the kind of mechanical signal used tocontrol the feedback loop. Finite element methods are used to link the external loads to localmechanical signal. These models were validated to produce accurate prediction of long termformation and resorption (Van Rietbergen et al., 1993; Weinbaum et al., 1994). The results of
277Simulation of Subject Specific Bone Remodeling and Virtual Reality Visualization
www.intechopen.com
6 Virtual Reality
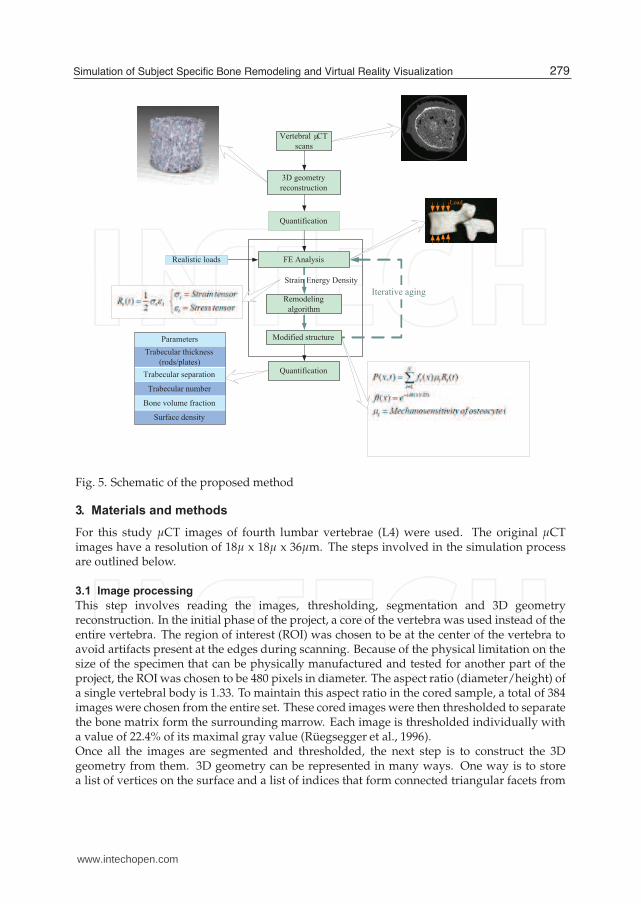
these models showed that the orientation of the trabeculae is directly related to the externalprincipal stress orientation, and when the orientation of the principal stress is rotated thetrabecular architecture transformed to realign to the new orientation.Apart from the visual assessment of the structural changes, different structural parametersare used to characterize these changes (Parfitt et al., 1987; Muller & Ruegsegger, 1996;Muller & Hayes, 1997; Liu et al., 2008). In the past, these parameters were studied by theexamination of the two dimensional crossections of cancellous bone biopsies. The threedimensional morphometric parameters are then derived from two dimensional images usingstereological methods (Parfitt et al., 1987). The bone volume fraction,which is a ratio of bonevolume to the total volume of the structure (BV/TV), and the surface density, which is theratio of the bone surface area to the bone volume (BS/BV), can be obtained directly from thetwo dimensional images, whereas trabecular thickness (Tb.Th), trabecular separation (Tb.Sp)and the trabecular number (Tb.N) are derived indirectly assuming a fixed structural model.Typically an ideal plate or rodmodel is assumed. The problemwith this method is that, it willlead to errors in the indirectly derived parameters if the structure deviates from the assumedmodel. It has been shown that the error due to deviation could be up to 52% dependingon the method used (Simmons & Hipp, 1997). Cancellous bone structure continuouslychanges is structural type. Since the stereological method assumes a certain structural model,the initial parameters calculated on a trabecular bone undergoing remodeling cannot becompared with the subsequent calculated parameters because the remodeling changes thetype of the structure from plate-like to rod-like (Hildebrand & Ruegsegger, 1997). Recentadvances in µCT have made it possible to acquire these parameters directly from 3D µCTimage (Hildebrand et al., 1999) without any underlying model assumptions. The valuesobtained by this method were shown to correspond well with the stereological method(Thomsen et al., 2005). The trabecular thickness is determined by filling maximal spheres intothe structure, then the average thickness of all points in the bone is calculated to give Tb.Th(Hildebrand & Ruegsegger, 1997). The Tb.Sp is calculated in the same way but the pointsrepresenting the non bone region or the marrow region are used to fill the maximal spheres(Hildebrand et al., 1999). The Tb.N is taken as the inverse of the mean distance between themidaxis of the trabecular structure. The calculated midaxes of the cancellous structure canalso be used to decompose the bone in to rods and plates (Stauber & Muller, 2006; Ju et al.,2007). Further, the orientation of the rods can also be calculated. By decomposing thecancellous bone in to rods and plates, the trabecular thickness can be calculated for the rodsand plates seperately. A comparison between the indirect calculated values assuming fixedmodel structure and the model independent direct calculation is made in (Hildebrand et al.,1999).The idea proposed in this research is the use of the realistic mechanical loading data to runa remodelling algorithm to predict the structure of trabecular bone after real-world loadingconditions are applied. This can be achieved by gathering the motion capture data of anindividual performing different activities (eg., walking, running, lifting weights etc.). Theseactivities can be grouped into different categories like easy, medium or hard based on theirintensity. This data can be collected with any motion capture system. This data can be usedin virtual human modeling and musculoskeletal simulation software to calculate forces anddisplacements at various joint locations or at specifiedmarker locations. This force data is thenused in the remodeling algorithm to accurately predict the modified trabecular structure. Thisdata could be useful to predict and change the lifestyle/physical habits to avoid severe chronicdamage/injury. The schematic of the proposed method is shown in the Figure 5.
278 Virtual Reality
www.intechopen.com
Simulation of Subject Specific Bone Remodeling and Virtual Reality Visualization 7
Remodeling
algorithm
Modified structure
FE Analysis
Vertebral CT
scans
3D geometry
reconstruction
Strain Energy Density
Quantification
Load
Realistic loads
Parameters
Trabecular thickness
(rods/plates)
Trabecular separation
Trabecular number
Bone volume fraction
Surface density
Iterative aging
Quantification
μ
Fig. 5. Schematic of the proposed method
3. Materials and methods
For this study µCT images of fourth lumbar vertebrae (L4) were used. The original µCTimages have a resolution of 18µ x 18µ x 36µm. The steps involved in the simulation processare outlined below.
3.1 Image processing
This step involves reading the images, thresholding, segmentation and 3D geometryreconstruction. In the initial phase of the project, a core of the vertebra was used instead of theentire vertebra. The region of interest (ROI) was chosen to be at the center of the vertebra toavoid artifacts present at the edges during scanning. Because of the physical limitation on thesize of the specimen that can be physically manufactured and tested for another part of theproject, the ROI was chosen to be 480 pixels in diameter. The aspect ratio (diameter/height) ofa single vertebral body is 1.33. To maintain this aspect ratio in the cored sample, a total of 384images were chosen from the entire set. These cored images were then thresholded to separatethe bone matrix form the surrounding marrow. Each image is thresholded individually witha value of 22.4% of its maximal gray value (Ruegsegger et al., 1996).Once all the images are segmented and thresholded, the next step is to construct the 3Dgeometry from them. 3D geometry can be represented in many ways. One way is to storea list of vertices on the surface and a list of indices that form connected triangular facets from
279Simulation of Subject Specific Bone Remodeling and Virtual Reality Visualization
www.intechopen.com
8 Virtual Reality
those vertices. An isosurface algorithm is used to extract this information. The images arestored in a three dimensional array. The isosurface algorithm connects the points that have avalue equal to the one specified by the user, which is called the isovalue. In this experiment,the pixels in each image have two values, 0 for marrow or the pixels in the background spaceand 1 for the region that represents the bone. Hence an isovalue of 1 would generate a listof points on the surface of the bone along with a list of combination of indices that formtriangular facets.
3.2 Quantification
The parameters selected to quantify the bone structure are, bone volume fraction which is aratio of bone volume to the total volume (BV/TV), surface density which is the ratio of bonesurface area to the bone volume (BS/BV), trabecular thickness (Tb.Th), trabecular separation(Tb.Sp) and the trabecular number (Tb.N) (Hildebrand et al., 1999). The bone volume (BV)is the volume enclosed by the bone surface. Total volume (TV) is the volume of the boneincluding the marrow space. The bone surface area is calculated by adding the area of all thetriangles, generated by the isosurface function, forming the surface. The area of a triangleformed by its vertices a, b, and c is give by equation 1.
A= a− b
B = c− a
Area= (A× B)/2
(1)
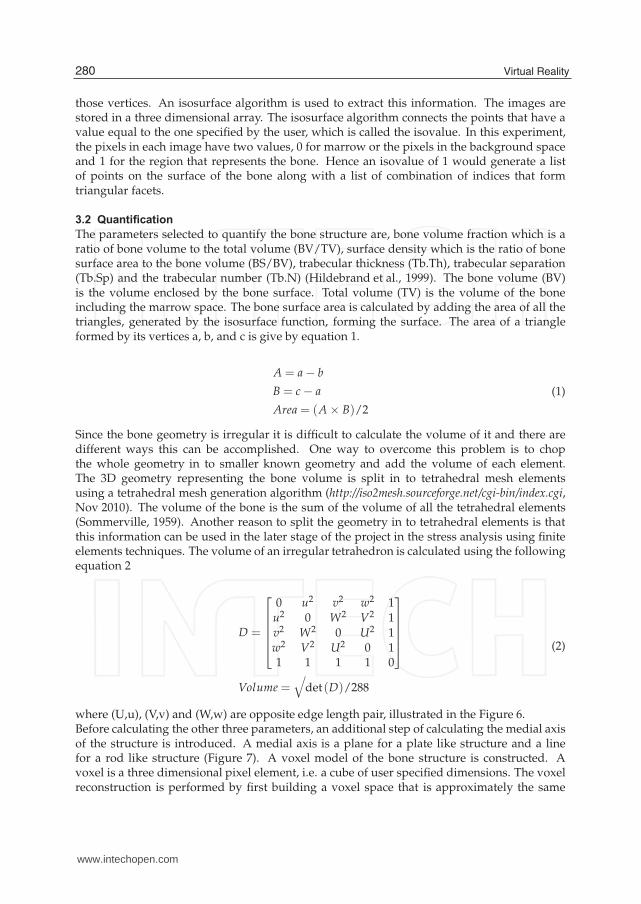
Since the bone geometry is irregular it is difficult to calculate the volume of it and there aredifferent ways this can be accomplished. One way to overcome this problem is to chopthe whole geometry in to smaller known geometry and add the volume of each element.The 3D geometry representing the bone volume is split in to tetrahedral mesh elementsusing a tetrahedral mesh generation algorithm (http://iso2mesh.sourceforge.net/cgi-bin/index.cgi,Nov 2010). The volume of the bone is the sum of the volume of all the tetrahedral elements(Sommerville, 1959). Another reason to split the geometry in to tetrahedral elements is thatthis information can be used in the later stage of the project in the stress analysis using finiteelements techniques. The volume of an irregular tetrahedron is calculated using the followingequation 2
D =
⎡
⎢
⎢
⎢
⎢
⎣
0 u2 v2 w2 1u2 0 W2 V2 1v2 W2 0 U2 1w2 V2 U2 0 11 1 1 1 0
⎤
⎥
⎥
⎥
⎥
⎦
Volume=√
det(D)/288
(2)
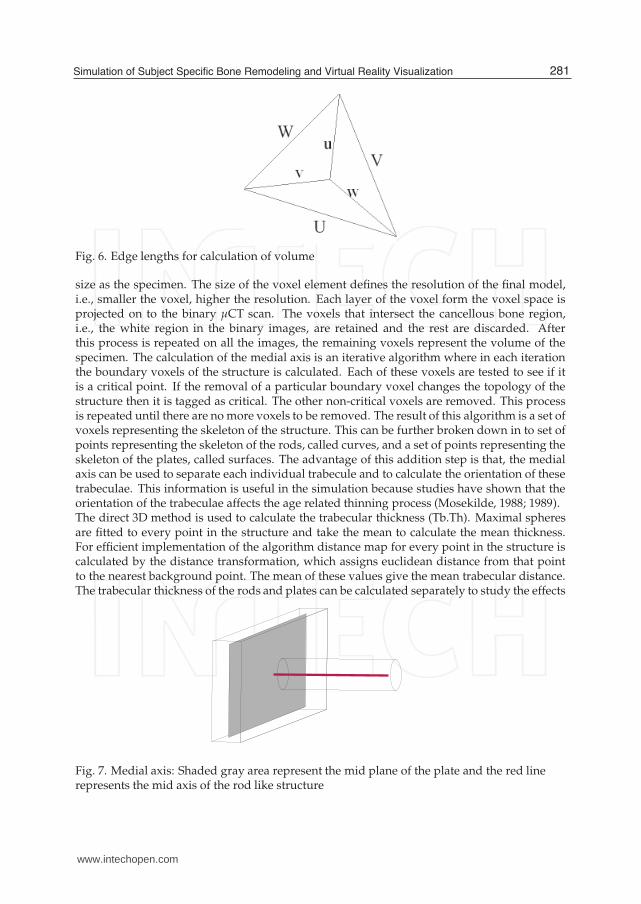
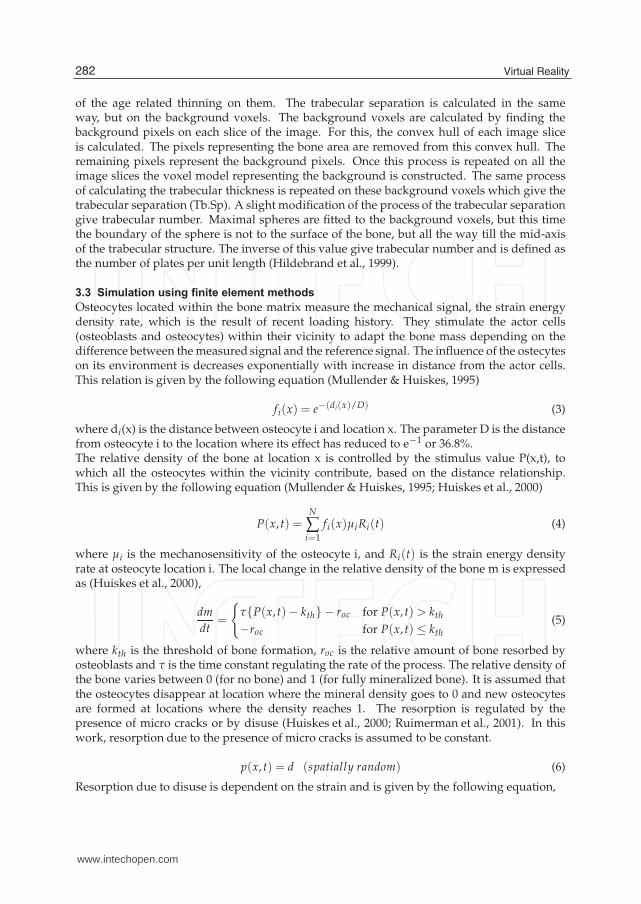
where (U,u), (V,v) and (W,w) are opposite edge length pair, illustrated in the Figure 6.Before calculating the other three parameters, an additional step of calculating the medial axisof the structure is introduced. A medial axis is a plane for a plate like structure and a linefor a rod like structure (Figure 7). A voxel model of the bone structure is constructed. Avoxel is a three dimensional pixel element, i.e. a cube of user specified dimensions. The voxelreconstruction is performed by first building a voxel space that is approximately the same
280 Virtual Reality
www.intechopen.com
Simulation of Subject Specific Bone Remodeling and Virtual Reality Visualization 9
Fig. 6. Edge lengths for calculation of volume
size as the specimen. The size of the voxel element defines the resolution of the final model,i.e., smaller the voxel, higher the resolution. Each layer of the voxel form the voxel space isprojected on to the binary µCT scan. The voxels that intersect the cancellous bone region,i.e., the white region in the binary images, are retained and the rest are discarded. Afterthis process is repeated on all the images, the remaining voxels represent the volume of thespecimen. The calculation of the medial axis is an iterative algorithm where in each iterationthe boundary voxels of the structure is calculated. Each of these voxels are tested to see if itis a critical point. If the removal of a particular boundary voxel changes the topology of thestructure then it is tagged as critical. The other non-critical voxels are removed. This processis repeated until there are no more voxels to be removed. The result of this algorithm is a set ofvoxels representing the skeleton of the structure. This can be further broken down in to set ofpoints representing the skeleton of the rods, called curves, and a set of points representing theskeleton of the plates, called surfaces. The advantage of this addition step is that, the medialaxis can be used to separate each individual trabecule and to calculate the orientation of thesetrabeculae. This information is useful in the simulation because studies have shown that theorientation of the trabeculae affects the age related thinning process (Mosekilde, 1988; 1989).The direct 3D method is used to calculate the trabecular thickness (Tb.Th). Maximal spheresare fitted to every point in the structure and take the mean to calculate the mean thickness.For efficient implementation of the algorithm distance map for every point in the structure iscalculated by the distance transformation, which assigns euclidean distance from that pointto the nearest background point. The mean of these values give the mean trabecular distance.The trabecular thickness of the rods and plates can be calculated separately to study the effects
Fig. 7. Medial axis: Shaded gray area represent the mid plane of the plate and the red linerepresents the mid axis of the rod like structure
281Simulation of Subject Specific Bone Remodeling and Virtual Reality Visualization
www.intechopen.com
10 Virtual Reality
of the age related thinning on them. The trabecular separation is calculated in the sameway, but on the background voxels. The background voxels are calculated by finding thebackground pixels on each slice of the image. For this, the convex hull of each image sliceis calculated. The pixels representing the bone area are removed from this convex hull. Theremaining pixels represent the background pixels. Once this process is repeated on all theimage slices the voxel model representing the background is constructed. The same processof calculating the trabecular thickness is repeated on these background voxels which give thetrabecular separation (Tb.Sp). A slight modification of the process of the trabecular separationgive trabecular number. Maximal spheres are fitted to the background voxels, but this timethe boundary of the sphere is not to the surface of the bone, but all the way till the mid-axisof the trabecular structure. The inverse of this value give trabecular number and is defined asthe number of plates per unit length (Hildebrand et al., 1999).
3.3 Simulation using finite element methods
Osteocytes located within the bone matrix measure the mechanical signal, the strain energydensity rate, which is the result of recent loading history. They stimulate the actor cells(osteoblasts and osteocytes) within their vicinity to adapt the bone mass depending on thedifference between themeasured signal and the reference signal. The influence of the ostecyteson its environment is decreases exponentially with increase in distance from the actor cells.This relation is given by the following equation (Mullender & Huiskes, 1995)
fi(x) = e−(di(x)/D) (3)
where di(x) is the distance between osteocyte i and location x. The parameter D is the distancefrom osteocyte i to the location where its effect has reduced to e−1 or 36.8%.The relative density of the bone at location x is controlled by the stimulus value P(x,t), towhich all the osteocytes within the vicinity contribute, based on the distance relationship.This is given by the following equation (Mullender & Huiskes, 1995; Huiskes et al., 2000)
P(x, t) =N
∑i=1
fi(x)µiRi(t) (4)
where µi is the mechanosensitivity of the osteocyte i, and Ri(t) is the strain energy densityrate at osteocyte location i. The local change in the relative density of the bone m is expressedas (Huiskes et al., 2000),
dm
dt=
{
τ{P(x, t)− kth} − roc for P(x, t) > kth−roc for P(x, t) ≤ kth
(5)
where kth is the threshold of bone formation, roc is the relative amount of bone resorbed byosteoblasts and τ is the time constant regulating the rate of the process. The relative density ofthe bone varies between 0 (for no bone) and 1 (for fully mineralized bone). It is assumed thatthe osteocytes disappear at location where the mineral density goes to 0 and new osteocytesare formed at locations where the density reaches 1. The resorption is regulated by thepresence of micro cracks or by disuse (Huiskes et al., 2000; Ruimerman et al., 2001). In thiswork, resorption due to the presence of micro cracks is assumed to be constant.
p(x, t) = d (spatially random) (6)
Resorption due to disuse is dependent on the strain and is given by the following equation,
282 Virtual Reality
www.intechopen.com
Simulation of Subject Specific Bone Remodeling and Virtual Reality Visualization 11
Bone Structure
Finite Element
Architecture
SED at nodal
points
SED at Osteocyte
locations (Linear
Interpolation)
Osteoblast
recruitment Stimulus
on the surface (P)
Load
Reference Signal
(Mechanical
Setpoint, k)
Osteocyte
distance relation
P>Kth
Bone formation
Bone
resorption
Bone
formation
Relative
bone
density goes
from 0 to 1
Relative
bone
density goes
from 1 to 0
YES
NO
Osteoclast recruitment
stimulus (p)Resorption
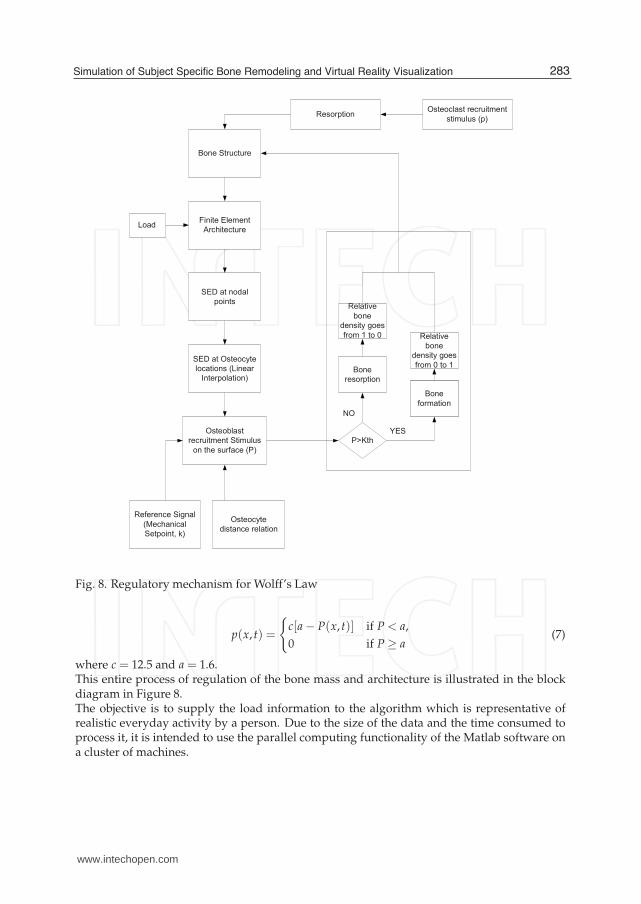
Fig. 8. Regulatory mechanism for Wolff’s Law
p(x, t) =
{
c[a− P(x, t)] if P < a,
0 if P ≥ a(7)
where c = 12.5 and a = 1.6.This entire process of regulation of the bone mass and architecture is illustrated in the blockdiagram in Figure 8.The objective is to supply the load information to the algorithm which is representative ofrealistic everyday activity by a person. Due to the size of the data and the time consumed toprocess it, it is intended to use the parallel computing functionality of the Matlab software ona cluster of machines.
283Simulation of Subject Specific Bone Remodeling and Virtual Reality Visualization
www.intechopen.com
12 Virtual Reality
(a) (b)
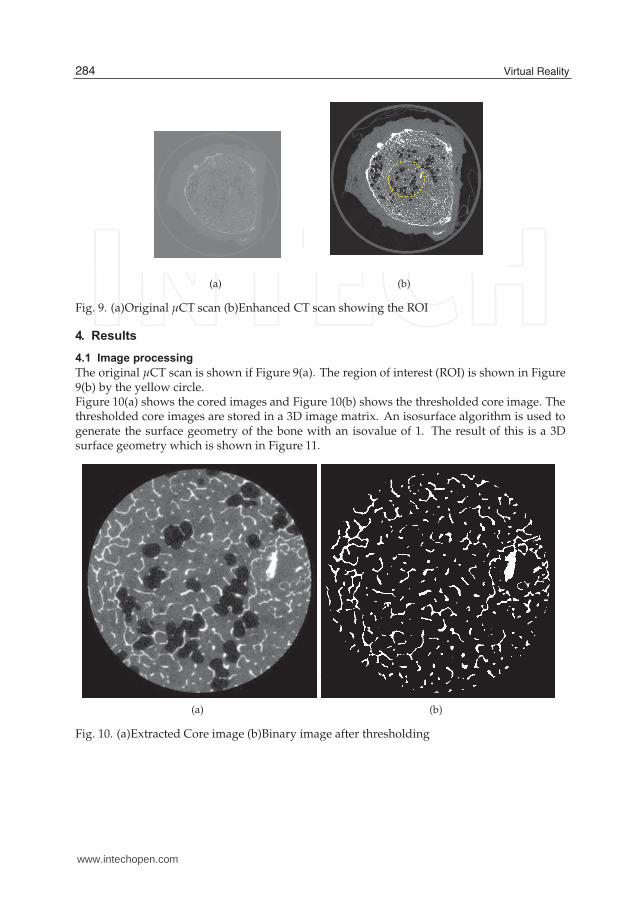
Fig. 9. (a)Original µCT scan (b)Enhanced CT scan showing the ROI
4. Results
4.1 Image processing
The original µCT scan is shown if Figure 9(a). The region of interest (ROI) is shown in Figure9(b) by the yellow circle.Figure 10(a) shows the cored images and Figure 10(b) shows the thresholded core image. Thethresholded core images are stored in a 3D image matrix. An isosurface algorithm is used togenerate the surface geometry of the bone with an isovalue of 1. The result of this is a 3Dsurface geometry which is shown in Figure 11.
(a) (b)
Fig. 10. (a)Extracted Core image (b)Binary image after thresholding
284 Virtual Reality
www.intechopen.com
Simulation of Subject Specific Bone Remodeling and Virtual Reality Visualization 13
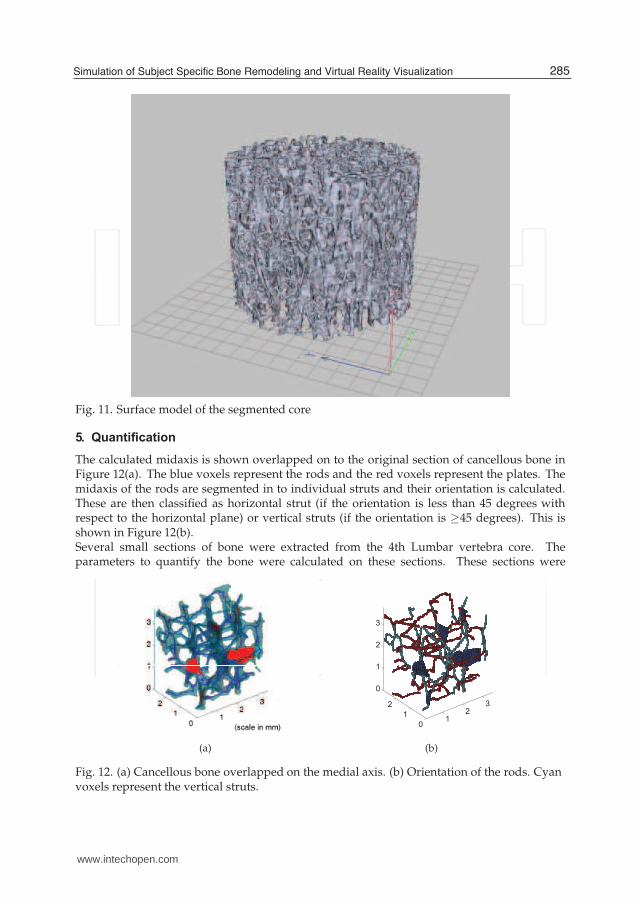
Fig. 11. Surface model of the segmented core
5. Quantification
The calculated midaxis is shown overlapped on to the original section of cancellous bone inFigure 12(a). The blue voxels represent the rods and the red voxels represent the plates. Themidaxis of the rods are segmented in to individual struts and their orientation is calculated.These are then classified as horizontal strut (if the orientation is less than 45 degrees withrespect to the horizontal plane) or vertical struts (if the orientation is ≥45 degrees). This isshown in Figure 12(b).Several small sections of bone were extracted from the 4th Lumbar vertebra core. Theparameters to quantify the bone were calculated on these sections. These sections were
(a)
12
3
0
1
2
0
1
2
3
(b)
Fig. 12. (a) Cancellous bone overlapped on the medial axis. (b) Orientation of the rods. Cyanvoxels represent the vertical struts.
285Simulation of Subject Specific Bone Remodeling and Virtual Reality Visualization
www.intechopen.com
14 Virtual Reality
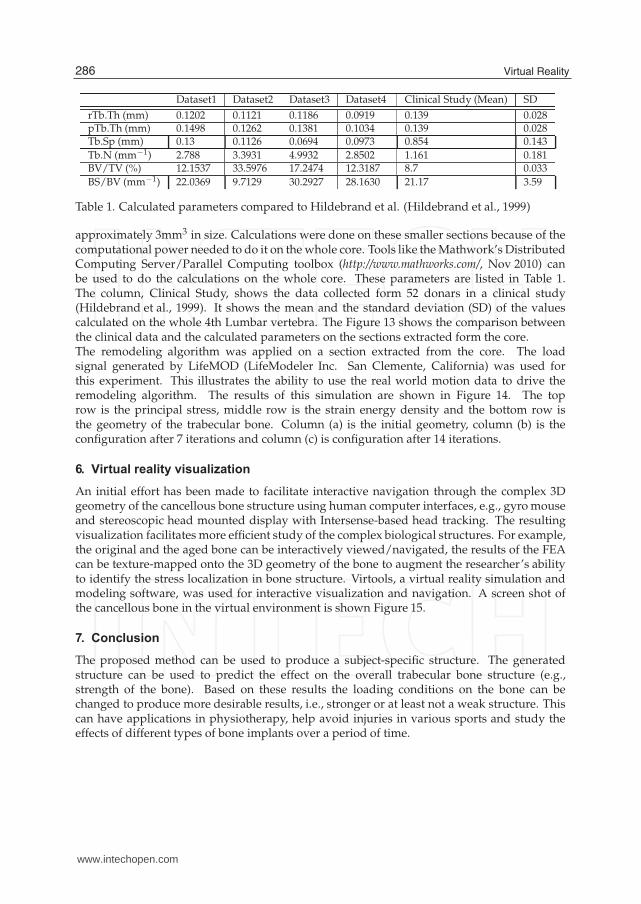
Dataset1 Dataset2 Dataset3 Dataset4 Clinical Study (Mean) SD
rTb.Th (mm) 0.1202 0.1121 0.1186 0.0919 0.139 0.028pTb.Th (mm) 0.1498 0.1262 0.1381 0.1034 0.139 0.028Tb.Sp (mm) 0.13 0.1126 0.0694 0.0973 0.854 0.143
Tb.N (mm−1) 2.788 3.3931 4.9932 2.8502 1.161 0.181BV/TV (%) 12.1537 33.5976 17.2474 12.3187 8.7 0.033
BS/BV (mm−1) 22.0369 9.7129 30.2927 28.1630 21.17 3.59
Table 1. Calculated parameters compared to Hildebrand et al. (Hildebrand et al., 1999)
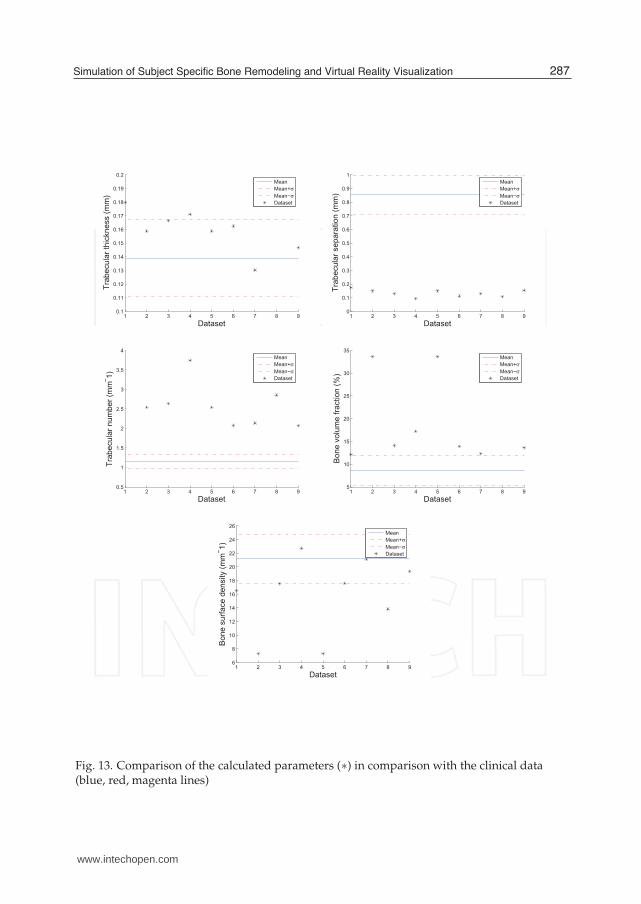
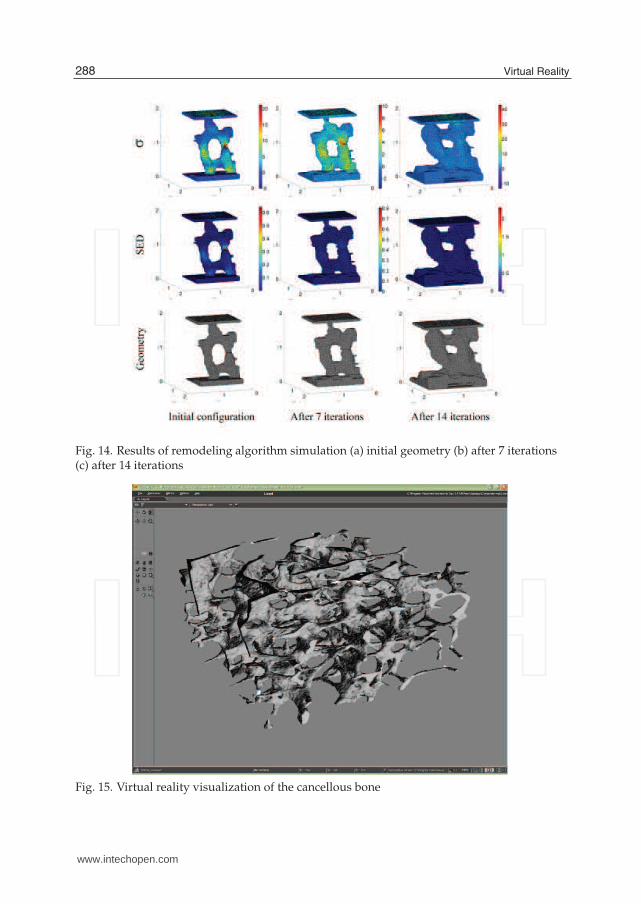
approximately 3mm3 in size. Calculations were done on these smaller sections because of thecomputational power needed to do it on the whole core. Tools like theMathwork’s DistributedComputing Server/Parallel Computing toolbox (http://www.mathworks.com/, Nov 2010) canbe used to do the calculations on the whole core. These parameters are listed in Table 1.The column, Clinical Study, shows the data collected form 52 donars in a clinical study(Hildebrand et al., 1999). It shows the mean and the standard deviation (SD) of the valuescalculated on the whole 4th Lumbar vertebra. The Figure 13 shows the comparison betweenthe clinical data and the calculated parameters on the sections extracted form the core.The remodeling algorithm was applied on a section extracted from the core. The loadsignal generated by LifeMOD (LifeModeler Inc. San Clemente, California) was used forthis experiment. This illustrates the ability to use the real world motion data to drive theremodeling algorithm. The results of this simulation are shown in Figure 14. The toprow is the principal stress, middle row is the strain energy density and the bottom row isthe geometry of the trabecular bone. Column (a) is the initial geometry, column (b) is theconfiguration after 7 iterations and column (c) is configuration after 14 iterations.
6. Virtual reality visualization
An initial effort has been made to facilitate interactive navigation through the complex 3Dgeometry of the cancellous bone structure using human computer interfaces, e.g., gyromouseand stereoscopic head mounted display with Intersense-based head tracking. The resultingvisualization facilitates more efficient study of the complex biological structures. For example,the original and the aged bone can be interactively viewed/navigated, the results of the FEAcan be texture-mapped onto the 3D geometry of the bone to augment the researcher’s abilityto identify the stress localization in bone structure. Virtools, a virtual reality simulation andmodeling software, was used for interactive visualization and navigation. A screen shot ofthe cancellous bone in the virtual environment is shown Figure 15.
7. Conclusion
The proposed method can be used to produce a subject-specific structure. The generatedstructure can be used to predict the effect on the overall trabecular bone structure (e.g.,strength of the bone). Based on these results the loading conditions on the bone can bechanged to produce more desirable results, i.e., stronger or at least not a weak structure. Thiscan have applications in physiotherapy, help avoid injuries in various sports and study theeffects of different types of bone implants over a period of time.
286 Virtual Reality
www.intechopen.com
Simulation of Subject Specific Bone Remodeling and Virtual Reality Visualization 15
1 2 3 4 5 6 7 8 90.1
0.11
0.12
0.13
0.14
0.15
0.16
0.17
0.18
0.19
0.2
Dataset
Tra
becula
r th
ickness (
mm
)
Mean
Mean+σ
Mean−σ
Dataset
1 2 3 4 5 6 7 8 90
0.1
0.2
0.3
0.4
0.5
0.6
0.7
0.8
0.9
1
Dataset
Tra
becula
r separa
tion (
mm
)
Mean
Mean+σ
Mean−σ
Dataset
1 2 3 4 5 6 7 8 90.5
1
1.5
2
2.5
3
3.5
4
Dataset
Tra
becula
r num
ber
(mm− 1
)
Mean
Mean+σ
Mean−σ
Dataset
1 2 3 4 5 6 7 8 95
10
15
20
25
30
35
Dataset
Bone v
olu
me f
raction (
%)
Mean
Mean+σ
Mean−σ
Dataset
1 2 3 4 5 6 7 8 96
8
10
12
14
16
18
20
22
24
26
Dataset
Bone s
urf
ace d
ensity (
mm− 1
)
Mean
Mean+σ
Mean−σ
Dataset
Fig. 13. Comparison of the calculated parameters (∗) in comparison with the clinical data(blue, red, magenta lines)
287Simulation of Subject Specific Bone Remodeling and Virtual Reality Visualization
www.intechopen.com
16 Virtual Reality
Fig. 14. Results of remodeling algorithm simulation (a) initial geometry (b) after 7 iterations(c) after 14 iterations
Fig. 15. Virtual reality visualization of the cancellous bone
288 Virtual Reality
www.intechopen.com
Simulation of Subject Specific Bone Remodeling and Virtual Reality Visualization 17
8. References
Bronckers, A., Goei, W., Luo, G., Karsenty, G., D’Souza, R., Lyaruu, D. & Burger, E.(1996). DNA fragmentation during bone formation in neonatal rodents assessedby transferase-mediated end labeling., Journal of bone and mineral research: the officialjournal of the American Society for Bone and Mineral Research 11(9): 1281.
Burger, E. & Klein-Nulend, J. (1999). Mechanotransduction in bone-role of thelacuno-canalicular network, The FASEB Journal 13(9001): 101.
Burr, D. (1993). Remodeling and the repair of fatigue damage, Calcified tissue international53: 75–81.
Burr, D. (2002). Targeted and nontargeted remodeling, Bone 30(1): 2–4.Frost, H. (1982). Mechanical determinants of bone modeling., Metabolic bone disease & related
research 4(4): 217.Frost, H. (1983). A determinant of bone architecture: the minimum effective strain, Clinical
Orthopaedics and Related Research 175: 286.Hildebrand, T., Laib, A., Muller, R., Dequeker, J. & Ruegsegger, P. (1999). Direct
three-dimensional morphometric analysis of human cancellous bone:microstructural data from spine, femur, iliac crest, and calcaneus, Journal ofBone and Mineral Research 14: 1167–1174.
Hildebrand, T. & Ruegsegger, P. (1997). A newmethod for the model-independent assessmentof thickness in three-dimensional images, Journal of Microscopy 185(1): 67–75.
http://iso2mesh.sourceforge.net/cgi-bin/index.cgi (n.d.).http://www.mathworks.com/ (Nov 2010).Huiskes, R., Ruimerman, R., van Lenthe, G. & Janssen, J. (2000). Effects ofmechanical forces on
maintenance and adaptation of form in trabecular bone, Nature 405(6787): 704–706.Ju, T., Baker, M. & Chiu, W. (2007). Computing a family of skeletons of volumetric models for
shape description, Computer-Aided Design 39(5): 352–360.Lemaire, V., Tobin, F., Greller, L., Cho, C. & Suva, L. (2004). Modeling the interactions between
osteoblast and osteoclast activities in bone remodeling, Journal of theoretical biology229(3): 293–309.
Linden, J., Verhaar, J., Pols, H. & Weinans, H. (2003). A simulation model at trabecularlevel to predict effects of antiresorptive treatment after menopause, Calcified tissueinternational 73(6): 537–544.
Liu, X., Huang, A., Zhang, X., Sajda, P., Ji, B. & Guo, X. (2008). Dynamic simulation ofthree dimensional architectural and mechanical alterations in human trabecular boneduring menopause, Bone 43(2): 292–301.
Mosekilde, L. (1988). Age-related changes in vertebral trabecular bone architecture–assessedby a new method., Bone 9(4): 247–50.
Mosekilde, L. (1989). Sex differences in age-related loss of vertebral trabecular bone mass andstructure–biomechanical consequences., Bone 10(6): 425.
Mullender, M. & Huiskes, R. (1995). Proposal for the regulatory mechanism of Wolff’s law,Journal of orthopaedic research 13(4): 503–512.
Muller, R. & Hayes, W. (1997). Biomechanical competence of microstructural bone in theprogress of adaptive bone remodeling, Proceedings of SPIE, Vol. 3149, SPIE, p. 69.
Muller, R. & Ruegsegger, P. (1996). Analysis ofmechanical properties of cancellous bone underconditions of simulated bone atrophy, Journal of Biomechanics 29(8): 1053–1060.
Parfitt, A. (1984). The cellular basis of bone remodeling: The quantum concept reexaminedin light of recent advances in the cell biology of bone, Calcified Tissue International
289Simulation of Subject Specific Bone Remodeling and Virtual Reality Visualization
www.intechopen.com
18 Virtual Reality
36: 37–45.Parfitt, A., Drezner, M., Glorieux, F., Kanis, J., Malluche, H., Meunier, P., Ott, S. & Recker,
R. (1987). Bone histomorphometry: Standardization of nomenclature, symbols, andunits, J Bone Miner Res 2(6): 595–610.
Parfitt, A., Mathews, C., Villanueva, A., Kleerekoper, M., Frame, B. & Rao, D. (1983).Relationships between surface, volume, and thickness of iliac trabecular bonein aging and in osteoporosis. Implications for the microanatomic and cellularmechanisms of bone loss., Journal of Clinical Investigation 72(4): 1396.
Pivonka, P., Zimak, J., Smith, D., Gardiner, B., Dunstan, C., Sims, N., JohnMartin, T. &Mundy,G. (2008). Model structure and control of bone remodeling: A theoretical study, Bone43(2): 249–263.
Ruegsegger, P., Koller, B. & Muller, R. (1996). A microtomographic system forthe nondestructive evaluation of bone architecture, Calcified tissue international58(1): 24–29.
Ruimerman, R., Huiskes, R., Van Lenthe, G. & Janssen, J. (2001). A computer-simulationmodel relating bone-cell metabolism to mechanical adaptation of trabeculararchitecture, Computer Methods in Biomechanics and Biomedical Engineering4(5): 433–448.
Simmons, C. & Hipp, J. (1997). Method-Based Differences in the Automated Analysis ofthe Three-Dimensional Morphology of Trabecular Bone, Journal of Bone and MineralResearch 12(6): 942–947.
Sommerville, D. (1959). Analytical geometry of three dimensions, The University Press.Stauber, M. &Muller, R. (2006). Volumetric spatial decomposition of trabecular bone into rods
and plates - A new method for local bone morphometry, Bone 38(4): 475–484.Thomsen, J., Laib, A., Koller, B., Prohaska, S., Mosekilde, L. & Gowin, W. (2005).
Stereological measures of trabecular bone structure: comparison of 3D microcomputed tomography with 2D histological sections in human proximal tibial bonebiopsies, Journal of Microscopy 218(2): 171–179.
Van Der Linden, J., Verhaar, J. & Weinans, H. (2001). A Three-Dimensional Simulation ofAge-Related Remodeling in Trabecular Bone, J Bone Miner Res 16(4): 688–696.
Van Rietbergen, B., Huiskes, R., Weinans, H., Sumner, D., Turner, T. & Galante, J. (1993).The mechanism of bone remodeling and resorption around press-fitted THA stems,Journal of biomechanics 26(4-5): 369–382.
Weinbaum, S., Cowin, S. & Zeng, Y. (1994). A model for the excitation of osteocytesby mechanical loading-induced bone fluid shear stresses, Journal of biomechanics27(3): 339–360.
Wolff, J. (1986). The Law of Bone Remodeling.(Das Gesetz der Transformation der Knochen,Kirschwald, 1892). Translated by Maquet, P., Furlong, R.
290 Virtual Reality
www.intechopen.com
Virtual RealityEdited by Prof. Jae-Jin Kim
ISBN 978-953-307-518-1Hard cover, 684 pagesPublisher InTechPublished online 08, December, 2010Published in print edition December, 2010
InTech EuropeUniversity Campus STeP Ri Slavka Krautzeka 83/A 51000 Rijeka, Croatia Phone: +385 (51) 770 447 Fax: +385 (51) 686 166www.intechopen.com
InTech ChinaUnit 405, Office Block, Hotel Equatorial Shanghai No.65, Yan An Road (West), Shanghai, 200040, China
Phone: +86-21-62489820 Fax: +86-21-62489821
Technological advancement in graphics and other human motion tracking hardware has promoted pushing"virtual reality" closer to "reality" and thus usage of virtual reality has been extended to various fields. The mosttypical fields for the application of virtual reality are medicine and engineering. The reviews in this bookdescribe the latest virtual reality-related knowledge in these two fields such as: advanced human-computerinteraction and virtual reality technologies, evaluation tools for cognition and behavior, medical and surgicaltreatment, neuroscience and neuro-rehabilitation, assistant tools for overcoming mental illnesses, educationaland industrial uses In addition, the considerations for virtual worlds in human society are discussed. This bookwill serve as a state-of-the-art resource for researchers who are interested in developing a beneficialtechnology for human society.
How to referenceIn order to correctly reference this scholarly work, feel free to copy and paste the following:
Ajay Sonar, Laurel Kuxhaus and James Carroll (2010). Simulation of Subject Specific Bone Remodeling andVirtual Reality Visualization, Virtual Reality, Prof. Jae-Jin Kim (Ed.), ISBN: 978-953-307-518-1, InTech,Available from: http://www.intechopen.com/books/virtual-reality/simulation-of-subject-specific-bone-remodeling-and-virtual-reality-visualization