8. Study of vapour-liquid equilibrium of mixtures (B2.5.)
12
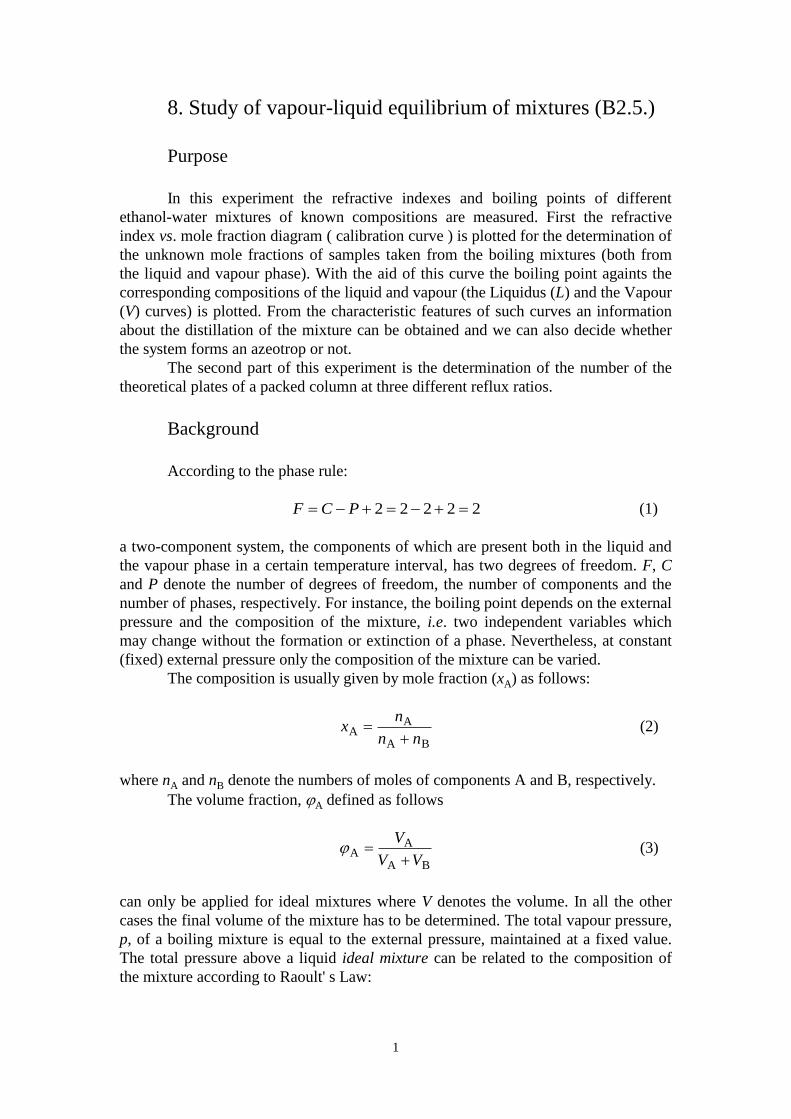
1 8. Study of vapour-liquid equilibrium of mixtures (B2.5.) Purpose In this experiment the refractive indexes and boiling points of different ethanol-water mixtures of known compositions are measured. First the refractive index vs. mole fraction diagram ( calibration curve ) is plotted for the determination of the unknown mole fractions of samples taken from the boiling mixtures (both from the liquid and vapour phase). With the aid of this curve the boiling point againts the corresponding compositions of the liquid and vapour (the Liquidus (L) and the Vapour (V) curves) is plotted. From the characteristic features of such curves an information about the distillation of the mixture can be obtained and we can also decide whether the system forms an azeotrop or not. The second part of this experiment is the determination of the number of the theoretical plates of a packed column at three different reflux ratios. Background According to the phase rule: 2 2 2 2 2 P C F (1) a two-component system, the components of which are present both in the liquid and the vapour phase in a certain temperature interval, has two degrees of freedom. F, C and P denote the number of degrees of freedom, the number of components and the number of phases, respectively. For instance, the boiling point depends on the external pressure and the composition of the mixture, i.e. two independent variables which may change without the formation or extinction of a phase. Nevertheless, at constant (fixed) external pressure only the composition of the mixture can be varied. The composition is usually given by mole fraction (x A ) as follows: B A A A n n n x (2) where n A and n B denote the numbers of moles of components A and B, respectively. The volume fraction, A defined as follows B A A A V V V (3) can only be applied for ideal mixtures where V denotes the volume. In all the other cases the final volume of the mixture has to be determined. The total vapour pressure, p, of a boiling mixture is equal to the external pressure, maintained at a fixed value. The total pressure above a liquid ideal mixture can be related to the composition of the mixture according to Raoult' s Law:
Transcript of 8. Study of vapour-liquid equilibrium of mixtures (B2.5.)
1
8. Study of vapour-liquid equilibrium of mixtures (B2.5.)
Purpose
In this experiment the refractive indexes and boiling points of different
ethanol-water mixtures of known compositions are measured. First the refractive
index vs. mole fraction diagram ( calibration curve ) is plotted for the determination of
the unknown mole fractions of samples taken from the boiling mixtures (both from
the liquid and vapour phase). With the aid of this curve the boiling point againts the
corresponding compositions of the liquid and vapour (the Liquidus (L) and the Vapour
(V) curves) is plotted. From the characteristic features of such curves an information
about the distillation of the mixture can be obtained and we can also decide whether
the system forms an azeotrop or not.
The second part of this experiment is the determination of the number of the
theoretical plates of a packed column at three different reflux ratios.
Background
According to the phase rule:
22222 PCF (1)
a two-component system, the components of which are present both in the liquid and
the vapour phase in a certain temperature interval, has two degrees of freedom. F, C
and P denote the number of degrees of freedom, the number of components and the
number of phases, respectively. For instance, the boiling point depends on the external
pressure and the composition of the mixture, i.e. two independent variables which
may change without the formation or extinction of a phase. Nevertheless, at constant
(fixed) external pressure only the composition of the mixture can be varied.
The composition is usually given by mole fraction (xA) as follows:
BA
AA
nn
nx
(2)
where nA and nB denote the numbers of moles of components A and B, respectively.
The volume fraction, A defined as follows
BA
AA
VV
V
(3)
can only be applied for ideal mixtures where V denotes the volume. In all the other
cases the final volume of the mixture has to be determined. The total vapour pressure,
p, of a boiling mixture is equal to the external pressure, maintained at a fixed value.
The total pressure above a liquid ideal mixture can be related to the composition of
the mixture according to Raoult' s Law:

2
ZZBBAAZBA pxpxpxpppp (4)
where Ap
Zp denote the vapour pressures of the corresponding components in
pure state as well as pA pZ denote the partial pressures of the same components
over the given mixture. For a binary A-B two-component ideal mixture, since
BA xx = 1, a linear dependence between the composition of the liquid and the total
vapour pressure is obtained:
BAAB ppxpp (5)
If BA pp , there is no difference between the composition of the liquid and its
vapour. If BA pp , the relation between the mole fraction of component A in the
vapour (yA) and its molar fraction in the liquid phase, (xA,) is the same, i.e. yA > xA,
independently of the composition of the liquid. The partial pressures, assuming ideal
gases, can be expressed as:
pyp AA and pyp BB (6)
Combining Eqs. (5) and (6) a nonlinear dependence between p and y is obtained as:
BAAA
BA
ppyp
ppp (7)
It follows from Eqs. (5) and (7), that even if the mixture is ideal, the total
pressure does not depend linearly on the mole fraction of the components in the
vapour phase. In case of real mixtures at constant external pressure the boiling point is
a nonlinear function of both x and y (see Fig. 1) mole fractions.
Fig. 1. Boiling point - composition diagram.

3
In some cases, when there is a strong interaction between the the components A and
B, a maximum or minimum can be found on the Liquidus (L) and Vapour (V) curves
at a definite composition. Such mixture is called an azeotropic mixture (see Fig 2).
The studied ethanol - water mixture has an azeotropic minimum in the boiling point
vs. composition curve.
Fig. 2. Vapour pressure (p) - composition diagram at constant temperature as well as
boiling point () - composition diagram at constant pressure for a mixture having an
azeotrope.
In a distillation experiment the vapour is withdrawn and condensed. If the
vapour in this example is drawn off and completely condensed, the condensed liquid
is richer in the more volatile component than the original liquid sample. The fractional
distillation repeats the boiling and the condensation cycle several times. When the
repeated distillations occurs in a column packed with glass rings, the condensed liquid
(the product) will be much richer in the more volatile component, than that at the
other type of destillations. This method is called rectification.
When a part of the condensed liquid (the product) flows back into the kettle,
after a certain time a stationary state will be set in the column. It means that there will
be a definite temperature and composition distribution in the column. These
compositions differ from the equilibrium composition.
Therefore we use a new Ax vs. Ay relation, which is different from the
equilibrium curve. (In the next considerations xA and *Ay are the equilibrium mole
fractions of the more volatile component in the liquid and vapour state, respectively,
and Ay is the mole fraction of the more volatile component (A) in vapour phase if
there is a stationary state in the column.) The relation between Ax and Ay in the
stationary condition is as follows:
ADAA
11
1x
R
Rx
Ry
(8)
4
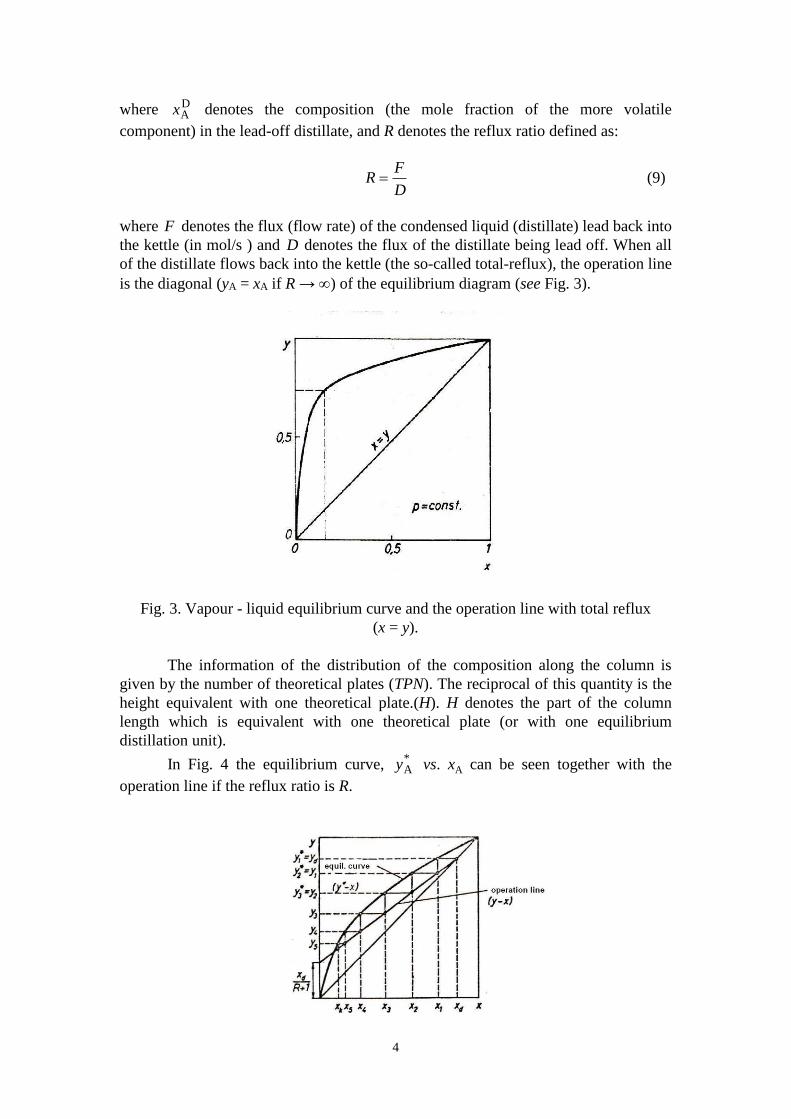
where DAx denotes the composition (the mole fraction of the more volatile
component) in the lead-off distillate, and R denotes the reflux ratio defined as:
RF
D (9)
where F denotes the flux (flow rate) of the condensed liquid (distillate) lead back into
the kettle (in mol/s ) and D denotes the flux of the distillate being lead off. When all
of the distillate flows back into the kettle (the so-called total-reflux), the operation line
is the diagonal (yA = xA if R → ) of the equilibrium diagram (see Fig. 3).
Fig. 3. Vapour - liquid equilibrium curve and the operation line with total reflux
(x = y).
The information of the distribution of the composition along the column is
given by the number of theoretical plates (TPN). The reciprocal of this quantity is the
height equivalent with one theoretical plate.(H). H denotes the part of the column
length which is equivalent with one theoretical plate (or with one equilibrium
distillation unit).
In Fig. 4 the equilibrium curve, *Ay vs. xA can be seen together with the
operation line if the reflux ratio is R.
5
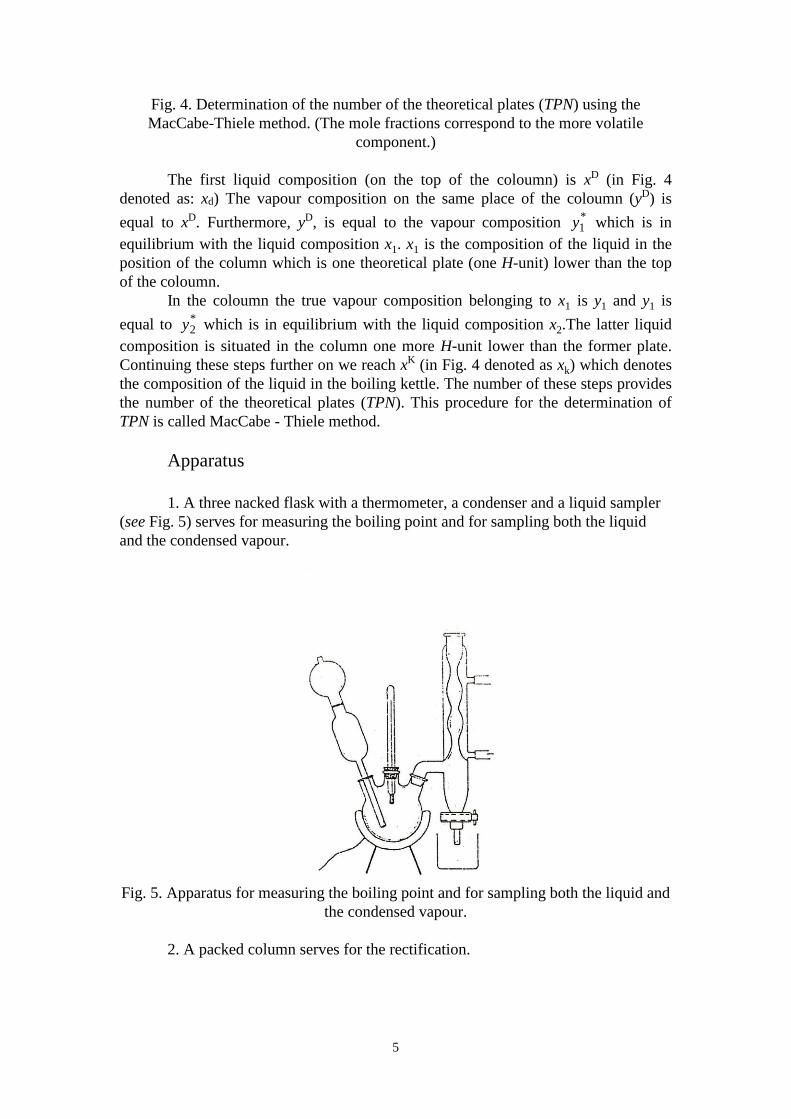
Fig. 4. Determination of the number of the theoretical plates (TPN) using the
MacCabe-Thiele method. (The mole fractions correspond to the more volatile
component.)
The first liquid composition (on the top of the coloumn) is xD (in Fig. 4
denoted as: xd) The vapour composition on the same place of the coloumn (yD) is
equal to xD. Furthermore, yD, is equal to the vapour composition *1y which is in
equilibrium with the liquid composition x1. x1 is the composition of the liquid in the
position of the column which is one theoretical plate (one H-unit) lower than the top
of the coloumn.
In the coloumn the true vapour composition belonging to x1 is y1 and y1 is
equal to *2y which is in equilibrium with the liquid composition x2.The latter liquid
composition is situated in the column one more H-unit lower than the former plate.
Continuing these steps further on we reach xK (in Fig. 4 denoted as xk) which denotes
the composition of the liquid in the boiling kettle. The number of these steps provides
the number of the theoretical plates (TPN). This procedure for the determination of
TPN is called MacCabe - Thiele method.
Apparatus
1. A three nacked flask with a thermometer, a condenser and a liquid sampler
(see Fig. 5) serves for measuring the boiling point and for sampling both the liquid
and the condensed vapour.
Fig. 5. Apparatus for measuring the boiling point and for sampling both the liquid and
the condensed vapour.
2. A packed column serves for the rectification.
6
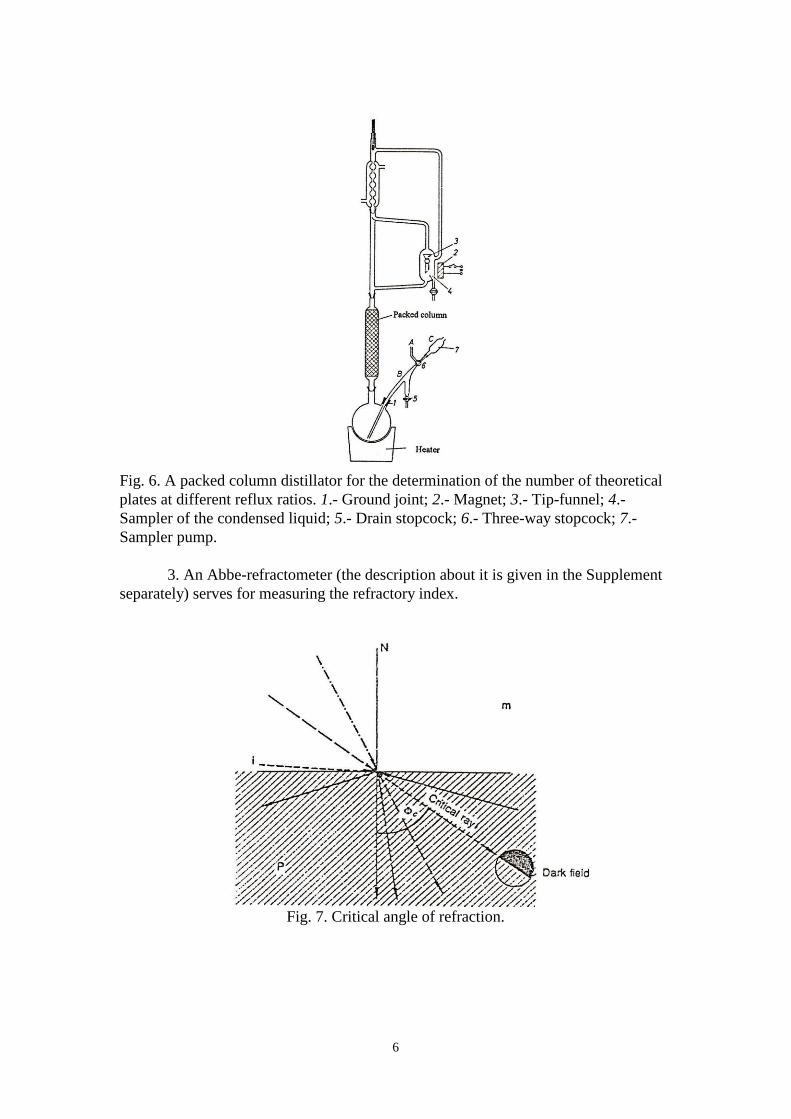
Fig. 6. A packed column distillator for the determination of the number of theoretical
plates at different reflux ratios. 1.- Ground joint; 2.- Magnet; 3.- Tip-funnel; 4.-
Sampler of the condensed liquid; 5.- Drain stopcock; 6.- Three-way stopcock; 7.-
Sampler pump.
3. An Abbe-refractometer (the description about it is given in the Supplement
separately) serves for measuring the refractory index.
Fig. 7. Critical angle of refraction.

7
Fig. 8. Schematic diagram of an Abbe-refractometer.
Procedure
The ethanol-water system to be studied forms an azeotropic minimum in the
boiling-point vs. composition curve at 96 mass per cent of ethanol (in mole fraction
xethanol = 0.90) at normal air pressure (101325 Pa). For the determination of the
number of theoretical plates (TPN) it is necessary to know the equilibrium diagram
and the phase diagram. For this purpose the boiling point and the compositions of the
equilibrium liquid and vapour phases should be determined. The composition is
determined by measuring the refractory index. The refractive index vs. composition
curve has also an extremum, a maximum but at xethanol = 0.65. As a consequence in a
definite refractory index range there are two compositions which have the same
refractory index values. Therefore, only by measuring the refractory index in this
range, the true compositions of the concensed vapour samples should be determined
using the following procedure:
1) Take a portion from the condensed vapour and measure its refractory index!
2) From the obtained refractory index vs. concentration of ethanol curve read the
two possible values of composition!
3) Dilute the sample with a small portion of distilled water (e.g. by using 5:1
sample/water volume ratio) and homogenise the mixture!
4) Measure the refractory index of the diluted sample!
5) From the refractory index vs. concentration of ethanol curve read the two
possible values of composition of the diluted sample!
If the refractory index of the diluted sample is larger than that of the original
(undiluted) sample the true composition lies on the right hand side of the maximum.
The same conclusion can be made if no or very small change in the value of refractory
index is experienced after the dilution, i.e. the true composition lies on the right hand
side of the maximum. In the latter case the original composition lies on the right,
whereas the diluted composition lies on left hand side of the maximum. Moving the
composition from the right to the left hand side from the maximum can occur either
by two strong dilution or if the original sample composition is on the right hand side
but near to the maximum. Note that using two strong dilution may cause even
decrease of the refractory index! If the refractory index of the diluted sample by small
8
dilution is lower than that of the original (undiluted) sample the true composition lies
on the left hand side of the maximum.
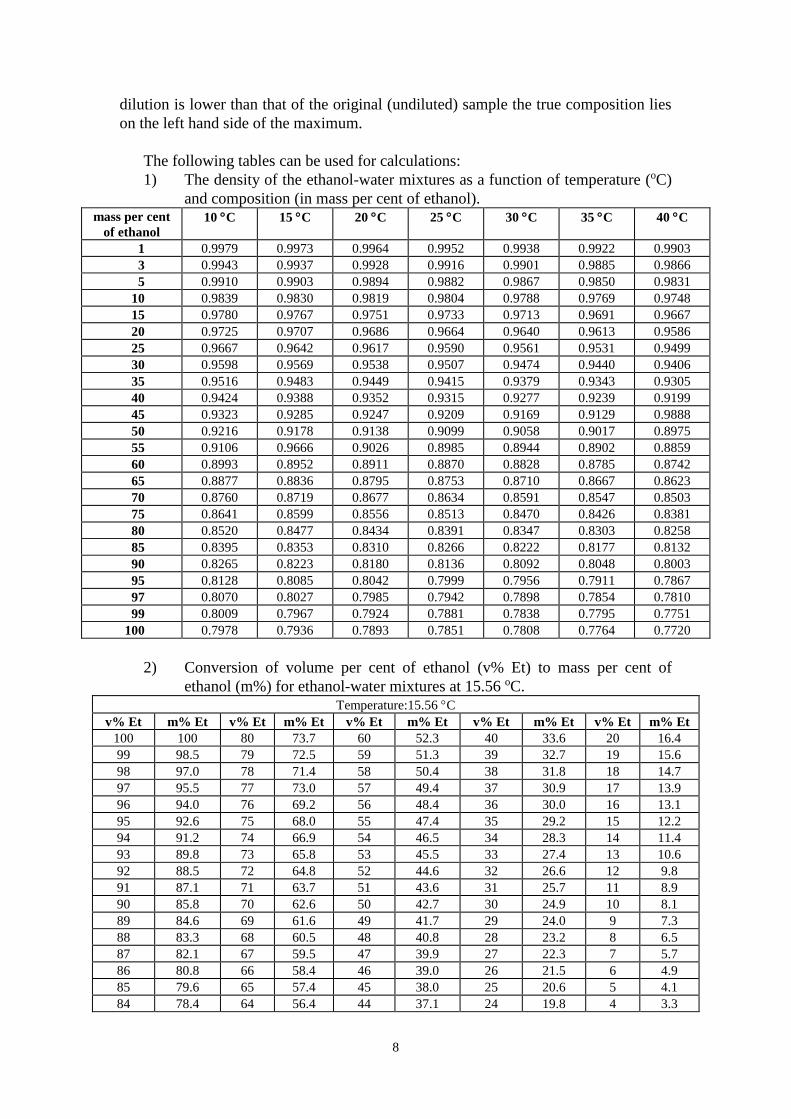
The following tables can be used for calculations:
1) The density of the ethanol-water mixtures as a function of temperature (oC)
and composition (in mass per cent of ethanol). mass per cent
of ethanol
10 C 15 C 20 C 25 C 30 C 35 C 40 C
1 0.9979 0.9973 0.9964 0.9952 0.9938 0.9922 0.9903
3 0.9943 0.9937 0.9928 0.9916 0.9901 0.9885 0.9866
5 0.9910 0.9903 0.9894 0.9882 0.9867 0.9850 0.9831
10 0.9839 0.9830 0.9819 0.9804 0.9788 0.9769 0.9748
15 0.9780 0.9767 0.9751 0.9733 0.9713 0.9691 0.9667
20 0.9725 0.9707 0.9686 0.9664 0.9640 0.9613 0.9586
25 0.9667 0.9642 0.9617 0.9590 0.9561 0.9531 0.9499
30 0.9598 0.9569 0.9538 0.9507 0.9474 0.9440 0.9406
35 0.9516 0.9483 0.9449 0.9415 0.9379 0.9343 0.9305
40 0.9424 0.9388 0.9352 0.9315 0.9277 0.9239 0.9199
45 0.9323 0.9285 0.9247 0.9209 0.9169 0.9129 0.9888
50 0.9216 0.9178 0.9138 0.9099 0.9058 0.9017 0.8975
55 0.9106 0.9666 0.9026 0.8985 0.8944 0.8902 0.8859
60 0.8993 0.8952 0.8911 0.8870 0.8828 0.8785 0.8742
65 0.8877 0.8836 0.8795 0.8753 0.8710 0.8667 0.8623
70 0.8760 0.8719 0.8677 0.8634 0.8591 0.8547 0.8503
75 0.8641 0.8599 0.8556 0.8513 0.8470 0.8426 0.8381
80 0.8520 0.8477 0.8434 0.8391 0.8347 0.8303 0.8258
85 0.8395 0.8353 0.8310 0.8266 0.8222 0.8177 0.8132
90 0.8265 0.8223 0.8180 0.8136 0.8092 0.8048 0.8003
95 0.8128 0.8085 0.8042 0.7999 0.7956 0.7911 0.7867
97 0.8070 0.8027 0.7985 0.7942 0.7898 0.7854 0.7810
99 0.8009 0.7967 0.7924 0.7881 0.7838 0.7795 0.7751
100 0.7978 0.7936 0.7893 0.7851 0.7808 0.7764 0.7720
2) Conversion of volume per cent of ethanol (v% Et) to mass per cent of
ethanol (m%) for ethanol-water mixtures at 15.56 oC. Temperature:15.56 C
v% Et m% Et v% Et m% Et v% Et m% Et v% Et m% Et v% Et m% Et
100 100 80 73.7 60 52.3 40 33.6 20 16.4
99 98.5 79 72.5 59 51.3 39 32.7 19 15.6
98 97.0 78 71.4 58 50.4 38 31.8 18 14.7
97 95.5 77 73.0 57 49.4 37 30.9 17 13.9
96 94.0 76 69.2 56 48.4 36 30.0 16 13.1
95 92.6 75 68.0 55 47.4 35 29.2 15 12.2
94 91.2 74 66.9 54 46.5 34 28.3 14 11.4
93 89.8 73 65.8 53 45.5 33 27.4 13 10.6
92 88.5 72 64.8 52 44.6 32 26.6 12 9.8
91 87.1 71 63.7 51 43.6 31 25.7 11 8.9
90 85.8 70 62.6 50 42.7 30 24.9 10 8.1
89 84.6 69 61.6 49 41.7 29 24.0 9 7.3
88 83.3 68 60.5 48 40.8 28 23.2 8 6.5
87 82.1 67 59.5 47 39.9 27 22.3 7 5.7
86 80.8 66 58.4 46 39.0 26 21.5 6 4.9
85 79.6 65 57.4 45 38.0 25 20.6 5 4.1
84 78.4 64 56.4 44 37.1 24 19.8 4 3.3

9
83 77.2 63 55.4 43 36.2 23 18.9 3 2.5.
82 76.0 62 54.3 42 35.3 22 18.1 2 1.7
81 74.9 61 53.3 41 34.5 21 17.2 1 0.8
3) The density of water as a function of temperature. C 0.0 1.0 2.0 3.0 4.0 5.0 6.0 7.0 8.0 9.0
0 0.999867 0.999926 0.999967 0.999992 1.000000 0.999991 0.999998 0.999929 0.999876 0.999808
10 0.999727 0.999632 0.999524 0.999404 0.999271 0.999126 0.998970 0.998802 0.99862 0.99834
20 0.99823 0.99802 0.99779 0.99756 0.99732 0.99707 0.99681 0.99654 0.99626 0.99597
30 0.99567 0.99536 0.99505 0.99473 0.99439 0.99405 0.99371 0.99335 0.99299 0.99262
40 0.99224 0.99186 0.99147 0.99107 0.99066 0.99024 0.98982 0.98940 0.98896 0.98852
50 0.98807 0.98762 0.98715 0.98669 0.98621 0.98573 0.98525 0.98475 0.98425 0.98375
60 0.98324 0.98272 0.98220 0.98167 0.98113 0.98059 0.98005 0.97950 0.97894 0.97838
70 0.97781 0.97723 0.97666 0.97607 0.97548 0.97489 0.97424 0.97368 0.97307 0.97245
80 0.97183 0.97121 0.97057 0.96994 0.96930 0.96865 0.96800 0.96734 0.96668 0.96601
90 0.96534 0.96464 0.96399 0.96330 0.96261 0.96192 0.96122 0.96051 0.95981 0.95909
100 0.95838
1. Prepare 4-5 different compositions of the ethanol - water mixture in ethanol
mole fraction range of 0.1 – 0.5 in 50 cm3 volumetric flasks! The professor leading
the practice select these compositions. You measure the quantities of ethanol and
water with burettes. Read and record the value of temperature from the thermometer
being near the burettes! Calculate roughly how much ethanol and water is needed to
prepare approximately 50 cm3 of mixture of the given composition! It is not necessary
to prepare accurately 50 cm3 of mixture. Do not fill-in the volumetric flask up to the
ring mark! There is a volume contraction during mixing ethanol with water! Since you
do not use absolute ethanol and even not that with azeotropic composition (96 mas per
cent) for mixing, the precise composition of the concentrated ethanol should be
determined. It is ususally in the 92-96 mass per cent range. Nevertheless, the precise
composition should be known. For the determination of the precise composition, the
density (using a Mettler Densito 30PX vibration cell densitometer) as well as the
refractory index (using an Abbe-refractometer) of the concentrated ethanol should be
determined. Using the given tables below as well as further data given by the
professor leading the practice the composition of the concentrated ethanol, used for
making the mixtures, can be determined. Knowing this value, the amounts (masses
and volumes) of the concentrated ethanol and the distilled water for preparing the
requested mixtures can be calculated. Nevertheless, in order to obtain more precise
compositions, in addition to measure the volumes of the components by the burettes,
measure even their masses using a balance! In addition to the data of the 4-5
compositions prepared by you, you will get further composition, refractory index and
boiling-point data of other compositions in the total mole fraction range of 0 to 1.
The setting parameters for the requested three reflux ratios to adjust can be found
at the equipment. The measured refractory index corresponds to 25.0 °C and the D-
spectrum line of sodium.
You have to measure the refractory index:
1) of the prepared liquid mixtures,
2) of the condensate of the equilibrium vapour,
3) of the diluted condensate and
4) of the boiling liquid in equilibrium with the vapour.

10
2. In order to construct the calibration curve you should measure the refractive
index of your mixtures just prepared. At first switch on the thermostate because the
refractive index depends on the temperature, so you have to maintain the temperature
of the prisms of the Abbe-refractometer! The refractometer is connected to the
thermostate. The temperature is already set to 25.0 oC by the thermostate. In the next
step switch on the light suorce of Abbe-refractometer! Open the prism (rotate the
illuminating prism downward and away from you)! Introduce a couple of drops of
your sample onto the horizontally positioned illuminating prism using an eye-dropper
and close it tight to the refracting prism! Rotate the prisms until the boundary between
the dark and light fields appears in the field of viewf necessary, adjust the position of
the mirror to obtain the best illumination possible! By the aid of the Amici prisms
eliminate the colour fringe and sharpen the boundary! Set the light / dark boundary
exactly to the intersection of the cross hairs! Read the value of refractive index with
an accuracy of 0.0002! Make a measurement even with the distilled water and the
concentrated ethanol! Record the temperature measurements too!
3. Fill some part of the liquid into the three-necked flask, supply it with a
condenser, Cottrell vapour-lift, thermometer and liquid sampler, and drop some
boiling chips into the liquid! Set the bulb of the thermometer at the neck level of the
condenser! Apply gentle heating using the electric basket-heater to avoid overheating
of the vapour! Observe the equilibrium tempereture of the boiling mixture! Take a
sample from the vapour by turning down the condenser and collecting a few drops
into a vial! Take a sample from the liquid too, by the liquid sampler! Close each vial
carefully by a stopper in order to prevent the evaporation! Having done this you have
re-fill the rest of the cooled mixture into a waste collector, or into the kettle of the
rectification column (consult the professor leading the practice about it)! Repeat step 3
with the other compositions to be studied!
4. In order to construct your liquidus and vapour curves, measure the refractive
index for all vapour and liquid samples (see step 2)!
5. In the kettle of the column there is a mixture containing about 30 mass per
cent of ethanol. You will get three different reflux ratios from the professor leading
the practice. Using a reflux timer you can regulate the lengths of time of flowing back
and of leading off during a unit length of time. (A magnet changes the ways of the
distillate by a funnel.)
Switch on the heater, and adjust the reflux timer to obtain the given reflux
ratio! Turn on the stopcock of the condensat-sampler, and let work the column!
After reaching the stationary state (in about 10 – 20 minutes), take a sample
from the condensate (distillate) and take a sample from the liquid being in the kettle
by the liquid-sampler! (Turn off the thre-way stopcock and using the rubber-ball pump
some liquid into the collecting tube! Turn on the three-way stopcock, and by the
turning on the stopcock of the collecting tube let the liquid sample flow out into a
vial!)
Repeat step 5 for the other two reflux ratios!
6. In order to calculate the number of the theoretical plates measure the
refractive index of the condensate and the liquid being in the kettle!
Graphs, tables, data to be reported

11
1. The composition (mole fraction of ethanol), the refractive index and the
boiling point of the prepared mixtures in a table. In addition, present the measured
refractive indexes of the equilibrium liquid and condensed vapour samples taken from
the boiling system in further coloumns of the table!
2. The refractive index vs. composition (mole fraction of ethanol) of the
prepared mixtures in a figure, including the points given by the professor (calibration
curve ). Mark your own measured points in the figure!
3. Calculate the compositions (in mole fraction of ethanol) of the equilibrium
liquid and condensed vapour samples based on the calibration curve!
4. The phase diagram (the liquidus (L) and the vapour (V) curves), i.e. the
boiling point vs. the mole fraction of ethanol in the liquid and the vapour phase).
Include the points given by the professor even in this figure! Mark your own measured
points!
5. The three different operation lines together with the equilibrium diagram
(the mole fraction of ethanol in the vapour vs. the mole fraction of ethanol in the
liquid) in separate figures in order to determine the numbers of the theoretical plates
in all three cases. Include the points given by the professor even in the equilibrium
diagram! Mark your own measured points!
6. The numbers of the theoretical plates in all three cases obtained by the
MacCabe-Thiele method.
Supplement
Operation of the Abbe-refractometer
The refractive index (n) for a liquid or isotropic solid is the ratio of the phase
velocity of light in vacuum to that in the medium. For a phase boundary it can be
defined as the ratio of the sine of angle v in vacuum to the sine of the corresponding
angle m in the medium:
m
v
m
v
sin
sin
c
cn (10)
Eq. (10) is called as the Snellius-Descartes law. The angles are measured
between the direction of the ray of light and the normal of the surface. (The normal of
a surface is an axis which is perpendicular to the surface.) The Abbe-refractometer
operates by measuring the so-called “critical angle”, crit. In this case v = 90o and so
critsin
1
n (11)
A thin layer of liquid sample is placed on the rectangle prism having a
refractive index of ng and ng > ns where ns denotes the refractive index of the sample.
If we follow different angles of incidence (see Fig. 7), from the normal to the glancing
incidence, i, we find that the angle of refraction also increases according to the
Snellius-Descartes law. At the glancing incidence we obtain the critical angle of

12
refraction, which is the last angle that lets light in the prism. Any higher angle of
refraction will provide a dark field in the measuring telescope.
The whole prism surface is illuminated with glancing incident light and a
telescope collects all the refracted rays with the same angle into one line in the focal
plane. Thus a sharp boundary is seen in the telescope between the dark and bright
illuminated fields by a monochromatic light source. If a white light is used as a source
of light the critical boundary is sharpened by the use of a compensator (two Amici
prisms) and the refractive index obtained is that for the sodium D-light in spite of the
white light source (see Fig. 8).
10.02.2014. László Bencze and József Mika