8. Optimizing Fertilizer Use within the Context of ......8. Optimizing Fertilizer Use within the...
13
8. Optimizing Fertilizer Use within the Context of Integrated Soil Fertility Management in Mali Mohamed Dicko [email protected], Mama Koné, Lamine Traoré, Cheick H. Diakité, Nianankoro Kamissoko, Baba Sidibé, Zoumana Kouyaté, Diakalia Sogodogo, Lassana Dioni, Hamidou Konaré and Amadou Gakou Institut d’Economie Rurale, B.P.258, Rue Mohamed V, Bamako, Mali 8.1 Agricultural systems of Mali Mali is a vast country of 1,241,000 km 2 in the semi-arid zone of West Africa (10 ° to 25 °N and 4 °E to 12 °W; Diarra 1993; MEATEU 2000). Agriculture is the principal occupation of about 80% of the population. It accounts for 34% of GDP and 23% of exported products. Subsistence farming dominates with agricultural produce largely consumed locally by the producers. Cropland has increased while fallow has decreased and crop mean yields, except for rice, have not increased. Generally, smallholders readily adopt new good agricultural practices (GAP), including new varieties, use of fertilizers and good husbandry methods. Where appropriate, double cropping is practised and fertilizer use varies according to farmers’ financial capacity. In the south and west of the country, inputs may be provided for cotton and maize production and fertilizers are used more in the cereal-cotton rotation than cropping systems that do not include cotton. The value of complementing fertilizer use by manure application is recognized. Farmers welcome herdsmen to ‘overnight-park’ livestock on their fields during the dry season to gain the excreted urine and faeces. A law called ‘Loi d’Orientation Agricole’ (LOA: Agricultural Orientation Law), enacted in 2006, has enabled government subsidies on seeds and fertilizers, mechanization of agriculture, structuring and strengthening the technical capabilities of producers and their organizations, and the establishment of an institutional framework called the High Council of Agriculture. Mali has a dry tropical climate with an annual rainfall ranging from less than 100 mm to about 1200 mm (Table 8.1). Mali has four bioclimatic based agro-ecological zones (AEZ): Sahara, Fertilizer Use Optimization in sub-Saharan Africa (2016) Charles S. Wortmann and Keith Sones (ed). Published by CABI. Table 8.1: Mean monthly rainfall (mm) and maximum and minimum temperature ( o C; Tmax; Tmin) for representative locations of AEZ of Mali J F M A M J J A S O N D Sahara, Kidal Rainfall 1 0 0 1 5 12 37 46 23 3 0 0 Tmax 28 31 35 39 42 42 40 38 39 38 33 29 Tmin 13 15 19 23 27 29 27 26 26 23 18 14 Sahel, Niono Rainfall 2 0 1 4 20 56 131 171 76 17 0 0 Tmax 30 34 38 41 43 40 37 34 35 35 32 29 Tmin 15 20 24 28 30 27 25 24 24 23 18 14 Northern Sudan Savanna, Kolombada, Samanko Rainfall 2 1 3 22 52 119 215 268 169 55 2 0 Tmax 33 37 38 40 39 36 33 32 33 34 34 32 Tmin 15 20 22 25 26 24 24 22 22 23 18 14 Southern Sudan Savanna, Bougouni, Longorola, Finkolo Rainfall 2 1 7 39 98 144 242 292 206 77 9 1 Tmax 31 33 35 35 33 31 28 28 29 31 33 30 Tmin 18 24 27 28 27 25 24 23 24 24 23 21 100
Transcript of 8. Optimizing Fertilizer Use within the Context of ......8. Optimizing Fertilizer Use within the...

8. Optimizing Fertilizer Use within the Context of IntegratedSoil Fertility Management in MaliMohamed Dicko [email protected], Mama Koné, Lamine Traoré, Cheick H. Diakité, Nianankoro Kamissoko, Baba Sidibé, Zoumana Kouyaté, Diakalia Sogodogo, Lassana Dioni, Hamidou Konaré and Amadou GakouInstitut d’Economie Rurale, B.P.258, Rue Mohamed V, Bamako, Mali
8.1 Agricultural systems of MaliMali is a vast country of 1,241,000 km2 in the semi-arid zone of West Africa (10 ° to 25 °N and 4 °E to 12 °W; Diarra 1993; MEATEU 2000). Agriculture is the principal occupation of about 80% of the population. It accounts for 34% of GDP and 23% of exported products. Subsistence farming dominates with agricultural produce largely consumed locally by the producers. Cropland has increased while fallow has decreased and crop mean yields, except for rice, have not increased. Generally, smallholders readily adopt new good agricultural practices (GAP), including new varieties, use of fertilizers and good husbandry methods. Where appropriate, double cropping is practised and fertilizer use varies according to farmers’ financial capacity. In the south and west of the country, inputs may be provided for cotton
and maize production and fertilizers are used more in the cereal-cotton rotation than cropping systems that do not include cotton. The value of complementing fertilizer use by manure application is recognized. Farmers welcome herdsmen to ‘overnight-park’ livestock on their fields during the dry season to gain the excreted urine and faeces.A law called ‘Loi d’Orientation Agricole’ (LOA: Agricultural Orientation Law), enacted in 2006, has enabled government subsidies on seeds and fertilizers, mechanization of agriculture, structuring and strengthening the technical capabilities of producers and their organizations, and the establishment of an institutional framework called the High Council of Agriculture.Mali has a dry tropical climate with an annual rainfall ranging from less than 100 mm to about 1200 mm (Table 8.1). Mali has four bioclimatic based agro-ecological zones (AEZ): Sahara,
Fertilizer Use Optimization in sub-Saharan Africa (2016) Charles S. Wortmann and Keith Sones (ed). Published by CABI.
Table 8.1: Mean monthly rainfall (mm) and maximum and minimum temperature (oC; Tmax; Tmin) for representative locations of AEZ of Mali
J F M A M J J A S O N DSahara, KidalRainfall 1 0 0 1 5 12 37 46 23 3 0 0
Tmax 28 31 35 39 42 42 40 38 39 38 33 29
Tmin 13 15 19 23 27 29 27 26 26 23 18 14
Sahel, NionoRainfall 2 0 1 4 20 56 131 171 76 17 0 0
Tmax 30 34 38 41 43 40 37 34 35 35 32 29
Tmin 15 20 24 28 30 27 25 24 24 23 18 14
Northern Sudan Savanna, Kolombada, SamankoRainfall 2 1 3 22 52 119 215 268 169 55 2 0
Tmax 33 37 38 40 39 36 33 32 33 34 34 32
Tmin 15 20 22 25 26 24 24 22 22 23 18 14
Southern Sudan Savanna, Bougouni, Longorola, FinkoloRainfall 2 1 7 39 98 144 242 292 206 77 9 1
Tmax 31 33 35 35 33 31 28 28 29 31 33 30
Tmin 18 24 27 28 27 25 24 23 24 24 23 21
100

Sahel, Northern Sudan Savanna, pre-Guinean zone considered here as Southern Sudan Savanna and a transverse area called the Niger River Delta (Figure 8.1).The Sahara covers more than 50% of the country. It has an extreme spatial and temporal variability of precipitation. The annual rainfall is less than 200 mm and the temperature ranges from less than 14 to more than 42°C. The soils are sandy with low water retention capacity and much wind erosion occurs. Livestock can complement crops as the manure produced is a valuable resource if well used for crop production.In the Sahel, the average annual rainfall is 200 to 600 mm with a rainy season from July to September during which 79% of the rainfall is received (Table 8.1). Soils are generally low in organic matter and available nutrients. Soil erosion, especially by wind is of major concern. Cereals production is hampered by frequent drought occurrence. Cattle are the main livestock but sheep and goats are also important in the northern Sahel. Manure is important for soil fertility management in this zone, but the amounts produced are insufficient for farmers’ needs.
The North Sudan Savanna is characterized by annual rainfall of 600 mm to 1100 mm. The rainy season ranges from about 3 months in the north to 4 months in the south during which 90% of the rainfall is received (Table 8.1). Heavy rainfall causes leaching of nutrients. The most fertile soils are alluvial soils found in the lowlands (Soumaré 2004). This AEZ has the most agricultural potential in Mali. In addition to a relatively long rainy season and high rainfall, good soil water holding capacity in the lowlands allow for adaptation of many crops.The South Sudan Savanna corresponds to ecosystems of open forests and woodlands. This is the most humid climatic AEZ in Mali with an annual rainfall ranging from 1100 to 1200 mm (Table 8.1). The rainy season is of 5 to 7 months duration and has some torrential rains which are major soil erosion factors. The soils consist of loam and sandy loam in the lowlands and there are areas of ferralitic soil. The wooded land covers 40 to 90% of the AEZ . Furthermore, favourable natural conditions allow the cultivation of several crop types including tubers, citrus, cereals and pulses. Major biotic constraints of this AEZ for agricultural productivity include insects, mites and birds.
Sahara
SouthernSudan
Savanna
Sahel
NorthernSudan Savanna
DeltaInterior
0 250 500125 Km
Figure 8.1: Natural regions of Mali.
101

8.2 Current soil fertility managementExtensive and unsustainable exploitation of natural resources has resulted in soil degradation in Mali (Koné and Doumbia 1997). Each cropping system is experiencing intensification and sustainability challenges. Increased crop yields on soils of low natural fertility requires a more intensive and effective use of fertilizer combined with manure. Most fertilizer used in Mali is imported.Crop production is mostly rainfed and crops are grown from June to October and harvested between November and December. Over the years, farmers have adopted GAP for soil fertility management that fit their production systems. Some examples of GAP are:• Fallowing to restore soil fertility: although
traditionally very important (Wane 2009) fallows are becoming shorter and disappearing in some places (Dixon et al., 2001) because of population growth of 3% per year and a high pressure on lands.
• Intercropping: sorghum-cowpea and sorghum-peanut in the North Sudan Savanna and lowlands of the Sahel; pearl millet-cowpea in the Sahel; and annual crops with trees such as shea tree in the North Sudan Savanna and Acacia albida in the Sahel add to land productivity while the trees contribute to the maintenance of soil fertility.
• Application of manure on the fields by three traditional manure delivery systems: (a) the ‘overnight-parking’ arrangement with nomads with consequent deposition of faeces and urine in the fields, (b) moving
night pens from one point to another in which the deposition and trampling of faeces by animals contribute to their incorporation into the soil, and (c) fixed night pens from which the manure is transported and applied to fields (Landais and Lhoste 1993). Dry season feeding of crop residues is common with the unconsumed residue serving as bedding and eventually absorbing urine and entering into manure.
To achieve fertilizer use efficiency, recommendations should be adapted to cropping systems and rainfall amounts and distribution with rates decreasing from south to north. Good fertilizer nutrient management is referred to as the 4Rs of Nutrient Stewardship implying application of the right source of nutrients at the right rate, at the right time for efficient uptake by the crop, and with the right placement to be accessible to plant roots (Johnston and Bruulsema 2014).Fertilizer use in Mali has increased from 84,800 tons in 1994 to 175,000 tons in 2009 and 250,000 tons in 2011, despite the unusually high fertilizer costs, or fertilizer price inflation, of 2007 and 2008. In 2012, fertilizer sales reached about 300,000 tons. This increase in imports and sales of fertilizer is mainly due to subsidies and more efficient fertilizer distribution with about 2000 input shops supplying quality fertilizers to farmers (CNFA 2010). Fertilizer blending facilities, which include Toguna Agro-Industry, Sogefert and ADP, respectively, in Bamako, Sikasso and Ségou, attempt to match blends with crop needs.
-100
1020304050607080
Rice Pearl millet
Sorghum Maize Sorghum Rice Maize Sorghum
Niger Delta
Sahel North Sudan Savanna
South Sudan Savanna
Gra
in y
ield
cha
nge,
%
Figure 8.2: Crop response to added secondary and micronutrients (Mg, S, Zn, B) at field research sites of 2014-15 in Mali.
102

A concern with fertilizer supply is the low availability to farmers of single nutrient and two-nutrient compound fertilizers, with the exception of urea and DAP, although the same are imported and used to create blends. Limiting the fertilizer choice and emphasis on blends is expected to add to fertilizer cost and reduce the farmers’ profit potential. There has been some commercialization of organic resources. Companies such as Profeba, Orgafert and Elephant Vert produce municipal and industrial compost but the supply is small relative to farmer demand.The combined use of fertilizer, organic resources and soil and water conservation techniques (Mason et al., 2014) are needed to restore and improve soil fertility (AGRA 2013). Examples of GAP integration include use of manure, micro-dose fertilizer application, improved sorghum and maize varieties, the basin tillage practice of zai and reducing runoff and erosion with stone barriers or earthen bunds. Micro-dose fertilizer use with improved cereal varieties is practised, often complemented by application of manure. Other encouraged GAP include mulching, crop rotation, managed fallow, simple and tied ridging and intercropping. In valleys, dams are sometimes used to store water for irrigation of rice and vegetable crops.
8.3 Diagnosis of nutrient deficiencies in MaliTrials conducted in 2014-2015 included a diagnostic treatment to determine the importance of secondary and micronutrients to crop performance. This treatment contained Mg, S, Zn and B in addition to N, P and K and was compared with a treatment of the same N, P and K rates. The diagnostic treatment resulted in a mean yield increase of 39% for irrigated rice yield. However, there was not a consistent yield increase with other crops in the Sahel, North Sudan and South Sudan Savannas indicating that other biotic or abiotic factors are more constraining to yield than any of these secondary or micro-nutrients (Figure 8.2). Further investigation is needed to determine which of these nutrients are most important to irrigated rice production.
8.4 Optimizing fertilizer use in MaliIn spite of the government subsidy programme for fertilizer many poor farmers cannot afford
fertilizer use or apply inconsistently at low levels. To overcome this pitfall, optimization of fertilizer use is aimed at maximizing farmer profit from fertilizer use. Determining the economics of fertilizer use requires crop nutrient response functions. Results of numerous studies from different AEZ were used to capture crop responses to applied nutrients with a curvilinear to plateau relationship of nutrient rate with yield. This response is represented mathematically as: Yield = a - bcr, where a is near maximum yield for application of that nutrient, b is the gain in yield due to application of that nutrient, and cr determines the shape of the curvilinear response where c is a curvature coefficient and r is the nutrient rate. A response function has been established for each targeted crop-nutrient combination of three AEZ. Once such a response function has been determined, economics can be applied to estimate the profit potential for different nutrients applied to different crops.
0
0.3
0.6
0.9
1.2
1.5
1.8
0 10 20 30 40 50
Gra
in y
ield
, t/h
a
P rate, kg/ha
Pearl millet Sorghum Maize
Figure 8.3: Crop responses to fertilizer P in the Sahel.The fertilizer P response curves of maize, sorghum and pearl millet in Figure 8.3 illustrate how rate of application is important to profitability. With all curves, there is a higher rate of yield gain per kg/ha of P applied at lower compared with higher rates, especially for sorghum. Sorghum yield has a steep rate of increase as P is increased from 0 to 10 kg/ha and therefore potential for a relatively high rate of return on investment, a lesser rate for 10 to 20 kg/ha, eventually reaching a point of insufficient yield value increase to justify the cost of applying additional P. The financially constrained farmer can obtain the best returns on a limited investment in fertilizer use by applying at a rate where the response curve is relatively steep.Another important economic consideration in fertilizer use, especially for the financially
103

Figure 8.4a: Net return from fertilizer use in the Sahel Zone of Mali. This graphic assumes that grain values used were (in XOF) 330 for rice, 80 for maize, 130 for sorghum, 135 for pearl millet, 600 for cowpea and groundnut. Fertilizer use costs were: 13,500 for urea, 20,000 for DAP, 16,000 for TSP, 16,000 for KCl, and 13,500 for 15-15-15.
Figure 8.4b: Net return from fertilizer use in the North Sudan Savanna of Mali.
Figure 8.4c: Net return from fertilizer use in the South Sudan Savanna of Mali.
104

constrained farmer, is that not all nutrients applied to the same or different crops have the same profit potential. In Figures 8.4a-c, each curve represents the profit for a nutrient applied to a particular crop. The horizontal axis shows the amount invested in a nutrient applied to a crop. The vertical axis shows the net revenue resulting from the application of each nutrient to a crop. The net income tends to increase as one invests more in an applied nutrient until a peak before net income begins to decrease. The rate at the peak is referred to in this chapter as the economically optimal rate (EOR), that is the rate to maximize net returns per hectare and the targeted rate of the farmer with adequate financing. With the optimization of fertilizer use approach, the farmer’s financial constraint affects the choices of fertilizer amounts to apply to different crops as the farmer wants to apply fertilizer to maximize net returns on the limited investment. When the curves are steep, the expected net returns to application of that nutrient to the crop are high. In the Sahel region, there is high profit potential, at least at low rates of application, for N and P applied to rice, P applied to groundnut and K applied to cowpea (Figure 8.4a). The point where the yield gain is insufficient to pay for the cost of additional nutrient is at the peak of the curve and the EOR, after which profit is lost with more nutrient application. There the value of P applied to rice and of K applied to cowpea should be less than 7000 and 5000 CFCA/ha, respectively. There is good profit potential, however, with applying more P to groundnut and more N to rice. The lower lying curves also have the potential for profit, but much less potential compared with the steeper curves. In the North Sudan Savanna, the big profit opportunity is with N applied to sorghum (Figure 8.4b). Below that, with good but less profit potential are with N applied to maize and rice, and P applied to cowpea and pearl millet. The relatively low grain price for maize reduces its profit potential. In the South Sudan Savanna, the better profit opportunities are with N applied to sorghum, P applied to rice and sorghum, and K applied to cowpea (Figure 8.3c). Therefore, the financially constrained farmer needs to choose crop-nutrient-rate
combinations appropriate to the choice of crops that have the greatest potential to maximize net returns per hectare.
8.5 Fertilizer use optimization tools for Mali Decisions on investing in fertilizer use to optimize profit on the investment must consider a great deal of information and is potentially overwhelming, especially if the decisions are finance constrained. A farmer in the South Sudan Savanna has the implications of 14 crop-nutrient response functions to consider while accounting for their choice of crops, land allocation, expected value of commodities, the fertilizer use costs, and the amount of money to invest in fertilizer use. Therefore, fertilizer optimization tools (FOTs) were developed that work with macros created in Excel with the add-on Solver © (Frontline Systems Inc., Incline Village, NV, USA). These Excel FOTs use complex mathematics of linear programming which integrate crop-nutrient response information with other agronomic and economic information relevant to the farmer’s specific situation (agronomy.unl.edu/OFRA). In spite of this mathematical complexity, use of the FOTs is easy. Before the FOTs can be used, the add-on Solver needs to be activated and macros need to be enabled; the steps to doing this are given in the ‘Help and Instructions’ worksheet of the FOT. The FOTs and instructional materials are available at (https://agronomy.unl.edu/OFRA).In the input panels (Figure 8.5a), the user enters the land area allocated to each crop and expected value of the harvest, accounting for the value of that which will be kept for home consumption and the surplus to be marketed. He/she then enters the cost of using, considering purchase costs and the costs of transport and application, 50 kg bags of each fertilizer likely to be available. If a fertilizer is not available, its cost is replaced by zero. He/she finally enters the amount available for use of fertilizers; this is the budget or financial constraint. After fully informing the tool, the user left-clicks on the optimize button to launch the calculation.The amount of each fertilizer to be applied to each crop to maximize profit is reported in the upper panel of the output (Figure 8.5b). Sometimes the recommended rates are too
105

AEZ_SAHELProducer Name:
Prepared By:Date Prepared:
CropArea
Planted (Ha)*
Expected Grain
Value/kg †Pearl millet 3 135Sorghum 2 130Groundnuts, unshelled 0.5 600Cowpea 0.5 600Maize 0.5 80Rice 0.25 300
Total 6.75
Fertilizer Product N P2O5 K2O xx Costs/50 kg bag ¶*
Urea 46% 0% 0% 0% 13500Triple super phosphate, TSP 0% 46% 0% 0% 16000Diammonium phosphate, DAP 18% 46% 0% 0% 20000Murate of potash, KCL 0% 0% 60% 0% 16000NPK 15% 15% 15% 0% 13500
Amount available to invest in fertilizer 100000
Crop Urea TSP DAP KCl NPKPearl millet 0 0 48 0 0Sorghum 0 22 10 0 0Groundnuts, unshelled 0 0 0 20 0Cowpea 0 18 0 11 0Maize 31 0 0 0 0Rice 65 0 21 18 00 0 0 0 0 0Total fertilizer needed 32 53 170 20 0
Crop Yield Increases Net Returns
Pearl millet 449 41,439Sorghum 271 24,032Groundnuts, unshelled 93 49,319Cowpea 82 40,053Maize 351 19,733Rice 751 193,5910 0 0
Total net returns to investment in fertilizer
© 2015, The Board of Regents of the University of Nebraska. All rights reserved.
Acknowledgements: support of personnel of the Institut d'Economie Rurale and funding support from the Alliance for a Green Revolution in Africa--Soil Health Programme, and University of Nebraska-Lincoln.
For information, contact: Mohamed Dicko; [email protected]
Total Expected Net Returns to Fertilizer
Credits: M. DICKO and Mali OFRA TEAM and Charles Wortmann, Jim Jansen and Matthew Stockton, Universirty of Nebraska-Lincoln, USA
275,331
xxx
July 6, 2016xxx
Fertilizer Selection and Prices
Crop Selection and Prices
Budget Constraint
Fertilizer Optimization
Expected Average Effects per Ha
Application Rate - kg/Ha
Figure 8.5a: Input panel for the Excel FOT.
AEZ_SAHELProducer Name:
Prepared By:Date Prepared:
CropArea
Planted (Ha)*
Expected Grain
Value/kg †Pearl millet 3 135Sorghum 2 130Groundnuts, unshelled 0.5 600Cowpea 0.5 600Maize 0.5 80Rice 0.25 300
Total 6.75
Fertilizer Product N P2O5 K2O xx Costs/50 kg bag ¶*
Urea 46% 0% 0% 0% 13500Triple super phosphate, TSP 0% 46% 0% 0% 16000Diammonium phosphate, DAP 18% 46% 0% 0% 20000Murate of potash, KCL 0% 0% 60% 0% 16000NPK 15% 15% 15% 0% 13500
Amount available to invest in fertilizer 100000
Crop Urea TSP DAP KCl NPKPearl millet 0 0 48 0 0Sorghum 0 22 10 0 0Groundnuts, unshelled 0 0 0 20 0Cowpea 0 18 0 11 0Maize 31 0 0 0 0Rice 65 0 21 18 00 0 0 0 0 0Total fertilizer needed 32 53 170 20 0
Crop Yield Increases Net Returns
Pearl millet 449 41,439Sorghum 271 24,032Groundnuts, unshelled 93 49,319Cowpea 82 40,053Maize 351 19,733Rice 751 193,5910 0 0
Total net returns to investment in fertilizer
© 2015, The Board of Regents of the University of Nebraska. All rights reserved.
Acknowledgements: support of personnel of the Institut d'Economie Rurale and funding support from the Alliance for a Green Revolution in Africa--Soil Health Programme, and University of Nebraska-Lincoln.
For information, contact: Mohamed Dicko; [email protected]
Total Expected Net Returns to Fertilizer
Credits: M. DICKO and Mali OFRA TEAM and Charles Wortmann, Jim Jansen and Matthew Stockton, Universirty of Nebraska-Lincoln, USA
275,331
xxx
July 6, 2016xxx
Fertilizer Selection and Prices
Crop Selection and Prices
Budget Constraint
Fertilizer Optimization
Expected Average Effects per Ha
Application Rate - kg/Ha
Figure 8.5b: Excel FOT output panel after optimization showing fertilizers needed and the expected returns.
106

small to be feasible, such as 10 kg/ha DAP applied to sorghum or 11 kg/ha KCl applied to cowpea. For such small rates, the money or fertilizer should be allocated to another option. The second panel shows the expected average increases in yield and net profits due
to the recommended fertilizer application for each crop. The very high net return to fertilizer applied on rice might cause the farmer to allocate more land to rice production. Finally, the total expected net return due to fertilizer use is reported.
Table 8.2: The paper fertilizer optimization tool for the South Sudan Savanna MALI-South Sudan-AEZ Fertilizer Use Optimizer
The below assumes:Calibration measurement is with: Diago water bottle lid that holds about 8 ml, 5.6 g urea, 8.8 g DAP, 8.8 g of TSP, 8.0 g NPK and 8.8 g KCl; Gino tomato can of 70 ml to hold 49 g urea, 77 g DAP, 77 g TSP, and 77 g KCl. Planting: It is assumed maize and cowpea: 0.8 x 0.4 m; sorghum 0.8 x 0.8 m; pearl millet 1 x 0.8 m; groundnut 0.4 x 0.4 m; rice 20 cm.Crop values: It is assumed grain prices per kg (CFA): 80 maize; 130 sorghum; 300 rice; 135 pearl millet; 600 Groundnut; 600 cowpea.Fertilizer use costs for 50 kg: It is assumed 50 kg of fertilizer use costs (CFA): 13,500 urea; 20,000 DAP; 13,500 NPK; 16,000 TSP; 16,000 KCl.Broadcast width: 3 m; WAP=weeks after planting, WAT=weeks after transplanting. Application rate is kg/ha.
Level 1 financial ability.Cowpea Point apply 35 kg NPK (1Diago lid for 7 plants) at emergence
Maize Point apply 11 kg urea (1 Diago lid for 20 plants) at 6 WAP
Rice, lowland Broadcast 78 kg urea in 2 applications : 28 kg urea (1 Gino can for 7.5 m) at transplanting and 50 kg urea (1 Gino can for 4.1 m) at panicle initiation and 106 kg NPK (1 Gino can for 2 m) at transplanting, and 106 kg NPK at transplanting (1 Gino can of 70 ml for 2 m)
Sorghum Point apply 66 kg NPK (1 Diago lid for 2 plants) at emergence
Level 2 financial ability.Maize Point apply 32 kg urea (1 Diago lid for 6.8 plants) at emergence and 50 kg urea (1 Diago lid for 4.8 plants) 6
WAPCowpea Point apply 50 kg NPK at emergence (1 Diago lid for 5 plants)
Rice, upland Broadcast 49 kg urea (1 Gino can for 3.3 m) at transplanting and 50 kg urea (1 Gino can lid for 7 plants) at panicle initiation and broadcast 162 kg NPK at emerging or transplanting (1 Gino can for 1 m)
Sorghum Point apply 135 kg of NPK (1 Diago lid for 1 plant) at emergence
Rice, lowland Broadcast 26 kg urea (1 Gino can for 6.3 m) at transplanting and 50 kg urea (1 Gino can for 3.3 m) at panicle initiation
Level 3 financial ability (maximize profit per acre).Millet Point apply 10 kg urea at emergence (1 Diago lid for 14 plants) and 26 kg NPK at emergence (1 Diago
lid for 4 plants)Maize Point apply 31 kg urea (1 Diago lid for 7.5 plants) at emergence and 100 kg urea (1 Diago lid for 2
plants) 6 WAP and 33 kg NPK (1 Diago lid for 8 plants) at emergence and point apply 33 kg NPK at emergence (1 Diago lid for 8 plants)
Cowpea Point apply 66 kg NPK at emergence (1 Diago lid for 9 plants) and 12 kg KCl at emergence (1 Diago lid for 23 plants)
Rice, upland Broadcast 200 kg NPK at transplanting (1 Gino can for 1 m) and 50 kg at panicle initiation (1 Gino can for 3.3 m)
Sorghum Point apply 187 kg of NPK (1 Diago lid for 1plant) at emergence
Rice, lowland Broadcast 35 kg Urea at transplanting (1 Gino can for 4.7 m and 100 kg urea at panicle initiation (1 Gino can for 1.6 m), and broadcast 26 kg KCl at land preparation (1 Gino can for 9.9 m)
107

Note that the budget constraint was FCFA 100,000 which was allocated to 32, 53, 170, 20 and 0 kg of urea, TSP, DAP, KCl and NPK 15-15-15 (Figure 8.5b). The NPK blended fertilizer is likely the most expensive to produce, but has the lowest price because of unbalanced subsidies on fertilizer types. Even though it has a low price, it was not found to be economically competitive with other fertilizers because farmers would have to pay for the three nutrients even if the crop does not have an economic response to all nutrients. The added cost would mean profit lost. It would be even more harmful to the financially constrained farmer as purchase of the NPK would mean less money available for purchase of a fertilizer that has high profit potential. In some situations where the crop has an economic response to all three nutrients, the NPK blend may be economically competitive if adequately subsidized. When the scenario of Figure 8.4 is optimized with only urea and NPK available, the expected average total net returns are only CFA 184,524 compared with CFA 275,331, and only 67% of expected profit to the farmer who has the wider choice of fertilizer. The results illustrate the importance of enabling farmer access to a choice of fertilizers if the intent is to maximize farmer profit potential. For each Excel FOT, a companion paper FOT is developed realizing that farmers and extension workers often will not have a readily available computer (Table 8.2). The paper FOT has three financial capacity levels. Financial level 1 is the most constrained for a farmer who cannot invest more than one-third of the total amount required to apply fertilizer to all cropland at EOR. Farmers in financial level 2 have less than two-thirds the money needed to apply to all cropland at EOR. Farmers in financial level 3 have enough money to apply to at least some cropland at EOR. The paper FOT makes assumptions about the measuring units that the farmer can use to calibrate the visual and hand-feel perception of the correct rate. It is assumed that the farmer will plant as recommended. Assumptions are made about fertilizer costs and expected grain values on-farm at harvest. The paper FOT addresses the 4Rs of fertilizer use and recommends the right product, the
right rate, the right time and the right method of application. It also informs the user on calibration of application.Consider the paper FOT for South Sudan Savanna (Table 8.2). One of the three recommendations for the financial level 1 is “Rice lowland: Broadcast 28 kg urea (Gino for 11 m) at 0 WAT and 50 kg urea (Gino for 6 m) at panicle initiation, and 106 kg NPK (Gino for 2 m) at 0 WAT.” Therefore, the farmer will broadcast apply 28 kg/ha of urea and 106 kg/ha NPK 15-15-15 to lowland rice, including irrigated rice, at transplanting time and another 50 kg/ha urea at panicle initiation. When broadcasting, he/she will broadcast with a 3 m width. He/she should use a Gino brand tomato sauce can of 70 ml for calibration of his/her sense of application to achieve the correct rate. One Gino can is enough to broadcast to an area of 3 m wide and 11 m long for the transplant application of 28 kg/ha of urea. For the transplant application of 106 kg NPK, one Gino is sufficient to broadcast an area of 3 m wide and 2 m long. For the application at panicle initiation of 50 kg urea, one Gino is enough for an area 3 m wide and 6 m long.A constraint of the paper FOTs is that it may need to be revised yearly if there are significant changes in fertilizer costs relative to grain values. This is to be done at the national level with redistribution such as publication in newspapers as well as with on-line access. The steps to paper FOT development and revision are described in Chapter 1.Smallholder farmers typically farm small areas of land but numerous parcels of land that differ in crop history and management. The FOTs more or less work on a whole farm basis to optimize profit for the farm enterprise. The FOTs (Excel and paper versions) give optimized recommendations for fertilizer use within the farmer’s context and in situations of important agricultural land typical to an AEZ. However, optimization of fertilizer use needs to consider other practices that might affect nutrient availability on one or more of their land parcels (Table 8.3). Soil test results may indicate an adjustment in the fertilizer recommendation. Some practices, such as manure application, affect the optimal fertilizer use rate. For example, it is recommended that if farmyard manure is applied
108

in the Sudan Savanna, then urea, TSP/DAP, KCl, or NPK can be allocated elsewhere by 11, 7, 13 and 73 kg/ha per 1 t/ha manure applied (dry weight), respectively; this does not apply to the Sahel, however, as farmyard manure application commonly results in increased response to fertilizer.
8.6 Targeted crops and cropping systems by AEZMali has four major AEZ for crop production. The OFRA project was implemented in areas of 450 to 1200 mm annual rainfall for the major staple cereals including maize, sorghum, millet and rice in the regions of Koulikoro (Samanko and Kolombada), Kayes (Bema), Sikasso (Bougouni, Kebila, Longorola and Finkolo) and Segou (Cinzana and Niono). Other crops were addressed using results of past research including data from neighbouring countries. Crop nutrient response functions for N, P and K were developed (Tables 8.4a-c). The coefficients a, b and c of the response functions (column 3-5), the expected yield increase due to increments of nutrient application (column 6-9) and the EOR compared with the recommended rates are reported (column 10-11).
In the Sahel, rice and maize had more response to N compared with sorghum and pearl millet but all of the upland cereals had big responses to P (Table 8.4a). Rice and groundnut did not have economic responses to P. Only rice and cowpea had economic responses to K. EOR of N is less than half the recommended rate (REC) for maize and rice, but also less for sorghum and pearl millet. The EOR is sometimes more for P than the REC. The rice EOR for K was about 25% the REC. In the North Sudan Savanna, maize and sorghum had greater response to N compared with rice and most of the grain yield increase occurred with 30 kg/ha applied (Table 8.4b). Responses to P were relatively small except for with pearl millet. Evidence of response to K was lacking. The N REC for rice was low compared with the rate of the Sahel and similar to the EOR for N. The EOR for N applied to rice was greater than for maize and sorghum because of the higher value for rice grain. The EOR of N were less than the REC for maize and sorghum. The EOR of P varied inconsistently with the REC.In the South Sudan Savanna (Table 8.4c) upland rice, maize and sorghum have the best response
Table 8.3: Fertilizer rate adjustments within an integrated soil fertility management framework
FERTILIZER USE WITHIN AN INTEGRATED SOIL FERTILITY MANAGEMENT CONTEXTFERTILIZER SUBSTITUTION AND SOIL TEST IMPLICATIONS
ISFM practice Urea DAP/TSP KCl NPK 17-17-17Fertilizer reduction, % or kg/ha
Previous crop was a green manure crop (Sesbania and dolichos)
Incorporation at the end of the rainy season increase cereal grain and stover yields by 27% and 49%compared to cereal monoculture without organic amendment (Kouyaté, 2000).
Farmyard manure per 1 t of dry material in the Sudan Savanna
11 kg 7 kg 13 kg 73 kg
Dairy or poultry manure, per 1 t dry material 53 kg 27 kg 27 kgCompost, per 1 t 38 kg 12 kg 14 kgRotation 0% reduction in fertilizer rate but an average of 18 and 23%
more cereal yield expected following cowpea compared with a cereal on loamy sand and loam respectively (Kouyaté et al., 2000).
Cereal-other legume (effective in N fixation) intercropping Increase DAP/TSP by 11 kg/ha, reduce urea by 9 kg/ha and no change in K compared with sole cereal fertilizer
If soil P > 15 ppm by Bray 1 Apply no P
109
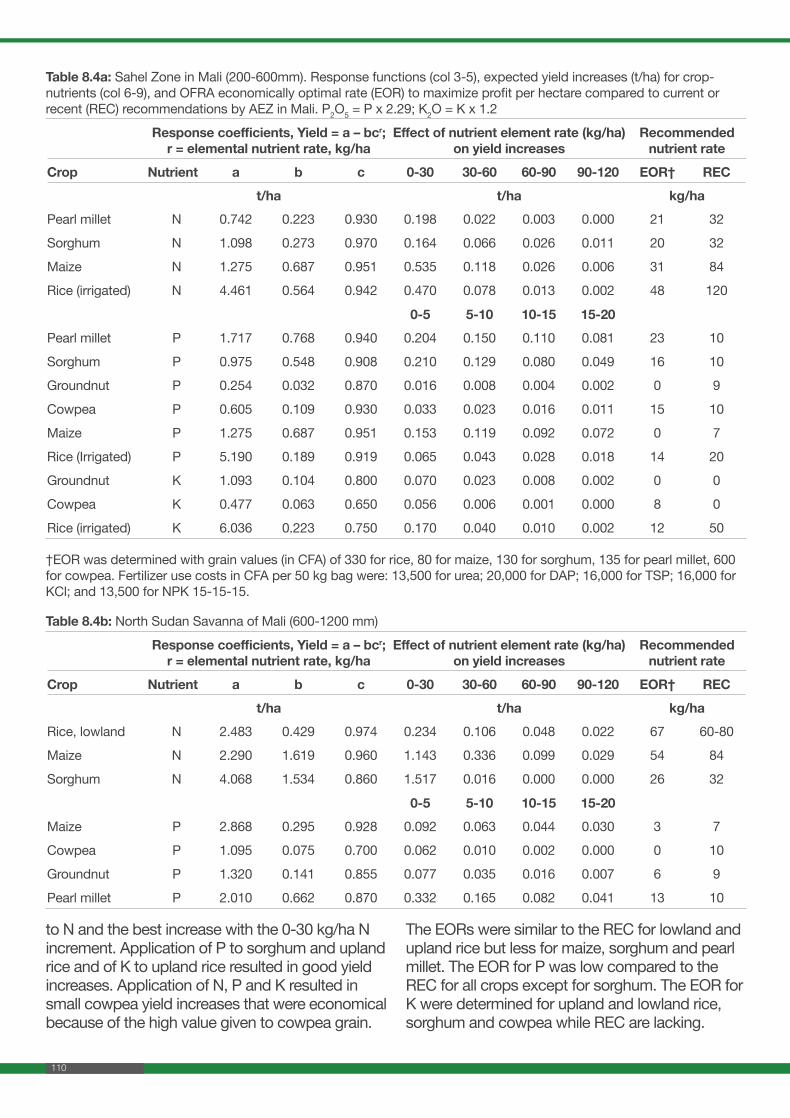
Table 8.4a: Sahel Zone in Mali (200-600mm). Response functions (col 3-5), expected yield increases (t/ha) for crop-nutrients (col 6-9), and OFRA economically optimal rate (EOR) to maximize profit per hectare compared to current or recent (REC) recommendations by AEZ in Mali. P2O5 = P x 2.29; K2O = K x 1.2
Response coefficients, Yield = a – bcr;r = elemental nutrient rate, kg/ha
Effect of nutrient element rate (kg/ha) on yield increases
Recommended nutrient rate
Crop Nutrient a b c 0-30 30-60 60-90 90-120 EOR† RECt/ha t/ha kg/ha
Pearl millet N 0.742 0.223 0.930 0.198 0.022 0.003 0.000 21 32
Sorghum N 1.098 0.273 0.970 0.164 0.066 0.026 0.011 20 32
Maize N 1.275 0.687 0.951 0.535 0.118 0.026 0.006 31 84
Rice (irrigated) N 4.461 0.564 0.942 0.470 0.078 0.013 0.002 48 120
0-5 5-10 10-15 15-20Pearl millet P 1.717 0.768 0.940 0.204 0.150 0.110 0.081 23 10
Sorghum P 0.975 0.548 0.908 0.210 0.129 0.080 0.049 16 10
Groundnut P 0.254 0.032 0.870 0.016 0.008 0.004 0.002 0 9
Cowpea P 0.605 0.109 0.930 0.033 0.023 0.016 0.011 15 10
Maize P 1.275 0.687 0.951 0.153 0.119 0.092 0.072 0 7
Rice (Irrigated) P 5.190 0.189 0.919 0.065 0.043 0.028 0.018 14 20
Groundnut K 1.093 0.104 0.800 0.070 0.023 0.008 0.002 0 0
Cowpea K 0.477 0.063 0.650 0.056 0.006 0.001 0.000 8 0
Rice (irrigated) K 6.036 0.223 0.750 0.170 0.040 0.010 0.002 12 50
†EOR was determined with grain values (in CFA) of 330 for rice, 80 for maize, 130 for sorghum, 135 for pearl millet, 600 for cowpea. Fertilizer use costs in CFA per 50 kg bag were: 13,500 for urea; 20,000 for DAP; 16,000 for TSP; 16,000 for KCl; and 13,500 for NPK 15-15-15.
Table 8.4b: North Sudan Savanna of Mali (600-1200 mm)
Response coefficients, Yield = a – bcr;r = elemental nutrient rate, kg/ha
Effect of nutrient element rate (kg/ha) on yield increases
Recommended nutrient rate
Crop Nutrient a b c 0-30 30-60 60-90 90-120 EOR† RECt/ha t/ha kg/ha
Rice, lowland N 2.483 0.429 0.974 0.234 0.106 0.048 0.022 67 60-80
Maize N 2.290 1.619 0.960 1.143 0.336 0.099 0.029 54 84
Sorghum N 4.068 1.534 0.860 1.517 0.016 0.000 0.000 26 32
0-5 5-10 10-15 15-20Maize P 2.868 0.295 0.928 0.092 0.063 0.044 0.030 3 7
Cowpea P 1.095 0.075 0.700 0.062 0.010 0.002 0.000 0 10
Groundnut P 1.320 0.141 0.855 0.077 0.035 0.016 0.007 6 9
Pearl millet P 2.010 0.662 0.870 0.332 0.165 0.082 0.041 13 10
to N and the best increase with the 0-30 kg/ha N increment. Application of P to sorghum and upland rice and of K to upland rice resulted in good yield increases. Application of N, P and K resulted in small cowpea yield increases that were economical because of the high value given to cowpea grain.
The EORs were similar to the REC for lowland and upland rice but less for maize, sorghum and pearl millet. The EOR for P was low compared to the REC for all crops except for sorghum. The EOR for K were determined for upland and lowland rice, sorghum and cowpea while REC are lacking.
110

The EOR determined from field research results were more than 20% less or more than the REC for 61 and 27%, respectively, of 33 comparisons (Table 8.4a,b,c). This implies that farmers, overall, who apply fertilizer at the REC are losing profit potential due to over-application. One exception is for N applied to upland and lowland, including irrigated, rice where the EOR and REC were generally similar. However, farmers who are financially constrained in fertilizer use need to benefit from the typical curvilinear to plateau response of crops to applied nutrients and generally apply at less than EOR where yield gain for kg/ha of applied nutrient is high.
8.7 ConclusionFertilizer use profitability can be improved for all AEZ of Mali. Recommended rates for farmers who are not financially constrained in fertilizer use need to be adjusted to reflect EOR. Farmers who are financially constrained in fertilizer use need to have the capacity to choose the crop-nutrient-rate options that are most likely to maximize returns on their investment. Computer
run and paper-based fertilizer optimization tools have been developed to enable determination of current EOR, depending on fertilizer costs and commodity values, and to determine the combination of crop-nutrient-rates for maximizing returns on investment. The fertilizer rate adjustment in an ISFM framework is important to optimizing fertilizer use to give credit to alternative nutrient supply practices, to apply additional fertilizer when justified (such as for intercropping) and to consider soil test values. If farmer profitability is the objective of fertilizer use optimization, it is essential that farmers have an adequate choice of single nutrient or two-nutrient compound fertilizers.
8.8 AcknowledgementsOur thanks go to all those who contributed to this chapter. We thank AGRA, CABI, University of Nebraska-Lincoln, the Mali Soil Health Consortium, and Institut d’Economie Rurale (the National Research Service) for their contributions and support.
Table 8.4c: South Sudan Savanna of Mali (1000-1200mm)
Response coefficients, Yield = a – bcr;r = elemental nutrient rate, kg/ha
Effect of nutrient element rate (kg/ha) on yield increases
Recommended nutrient rate
Crop Nutrient a b c 0-30 30-60 60-90 90-120 EOR† RECt/ha t/ha kg/ha
Maize N 3.000 1.760 0.970 1.054 0.423 0.170 0.068 65 84
Rice, upland N 4.655 1.908 0.988 0.580 0.404 0.281 0.196 70 60-80
Sorghum N 4.067 1.530 0.860 1.513 0.016 0.000 0.000 28 32
Rice, lowland N 2.482 0.428 0.970 0.256 0.103 0.041 0.017 62 60-80
Cowpea N 1.860 0.168 0.770 0.168 0.000 0.000 0.000 15 0
Pearl millet N 1.111 0.110 0.930 0.098 0.011 0.001 0.000 8 32
0-5 5-10 10-15 15-20Maize P 2.868 0.295 0.928 0.092 0.063 0.044 0.030 2 7
Rice, upland P 3.633 0.979 0.904 0.388 0.234 0.141 0.085 13 20
Sorghum P 2.770 1.470 0.910 0.553 0.345 0.215 0.134 12 10
Cowpea P 0.929 0.040 0.700 0.033 0.006 0.001 0.000 3 10
Pearl millet P 1.520 0.129 0.900 0.053 0.031 0.018 0.011 2 10
Rice, upland K 4.439 0.838 0.800 0.563 0.185 0.060 0.020 25 20
Sorghum K 2.016 0.114 0.900 0.047 0.028 0.016 0.010 23 12
Rice, lowland K 1.950 0.091 0.961 0.016 0.013 0.011 0.009 14 20
Cowpea K 0.871 0.100 0.800 0.067 0.022 0.007 0.002 13 0
111

8.9 ReferencesAGRA (2013) Africa Agriculture Status Report. Focus on staple crops. AGRA. http://www.archive.agra.org/our-results/annual-reportsCNFA (2010) Répertoire des agro-dealers du Mali. 2000 adresse à travers tout le paysDiarra A (1993) Utilisation des ressources naturelles et occupation de l’espace par les agriculteurs et les pasteurs en Zone aride au Mali, Cercle de Bourem (Région de Gao). Thèse de Doctorat, Université Paul Valery Montpellier III, FranceDixon J, Gulliver A and Gibbon D (2001) Systèmes d’exploitation agricole et pauvreté. Améliorer les moyens d’existence des agriculteurs dans un monde changeant. FAO, Banque MondialeJohnston AM and Bruulsema TW (2014) 4R nutrient stewardship for improved nutrient use efficiency. Proc Engin. 83:365–370Koné M and Doumbia M (1997) Les difficultés pour maintenir la fertilité des sols en cultures paysannes. Collection Colloques Montpellier, CIRAD-CA Kouyaté Z, Franzluebbers K, Juo ASR and Hossner LR (2000) Tillage, crop residue, legume rotation, and green manure effects on sorghum
and millet yields in the semiarid tropics of Mali. Plant and Soil 225:141-151Landais E and Lhoste PL (1993) Systèmes d’élevage et transfert de fertilisation dans la zone des savanes Africaines. Cahiers Agricultures 2:9-25Mason SC, Ouattara K, Taonda SJB, Pale SB, Sohoro A and Kabore D (2014) Soil and cropping system research in semi-arid West Africa as related to the potential for conservation agriculture. Internat J Agricul Sustain doi: 10.1080/14735903.2014.945319MEATEU (2000) Stratégie nationale en matière de diversité biologique, Tome 1, situation de diversité biologique au Mali. Ministère de l’Equipement de l’Aménagement du Territoire, de l’Environnement et de l’UrbanismeSoumaré M (2004) Contribution à la prévision de l’aire de diffusion de variétés de sorgho au Mali. Couplage entre modèle de croissance des cultures et systèmes d’information géographique. Mémoire de DEA, Université Paris 10, INA-PG Wane A (2009) Exploitation et gestion des ressources naturelles dans l’ile à Morphil. Etude de cas : l’arrondissement de cas-cas (département de Podor) Maitrise/Université CAD de Dakar/Géographie
112