8 hbs
37
131 Hepatic, biliary, and splenic scintigraphy have had an important role in radionuclide imaging since the 1960s. Many of the radiopharmaceuticals, methodologies, and indications have changed; however, modern scintigraphy provides unique physiological and diagnostic information not available from anatomical imaging. The various radio- pharmaceuticals used today have functional mechanisms of uptake, distribution, and localization that take advan- tage of the complex anatomy and physiology of the liver and spleen (Table 8-1 and Fig. 8-1). CHOLESCINTIGRAPHY Cholescintigraphy is used routinely for the diagnosis of various acute and chronic hepatobiliary diseases, including acute cholecystitis, biliary obstruction, bile leak, and acal- culous chronic gallbladder disease (Box 8-1). Radiopharmaceuticals Technetium-99m–labeled hepatobiliary radiopharmaceu- ticals became available in the early 1980s; because of their superior image and diagnostic quality they replaced iodine-123 rose bengal. Three hepatobiliary radiopharmaceuticals have been approved by the U.S. Food and Drug Administration (FDA) for clinical use in the United States (Fig. 8-2). The first was Tc-99m dimethyl iminodiacetic acid (IDA), which was referred to as hepatic IDA (HIDA). Although it is no longer used, HIDA has become a generic term for all Tc- 99m IDA radiopharmaceuticals. The two agents in clinical use today in the United States are shown in Table 8-2. Chemistry Tc-99m serves as a bridging atom between two IDA ligand molecules (Fig. 8-2). Both IDA molecules bind to an acet- anilide analog of lidocaine. The latter determines the radiopharmaceutical’s biological and pharmacokinetic properties. Minor structural changes in the phenyl ring (N substitu- tions) result in significant alterations in the pharmacoki- netics of IDA radiopharmaceuticals (Table 8-3). Many Tc-99m HIDA analogs with different aromatic ring chemi- cal substitutions have been investigated, with generic names of BIDA, DIDA, EIDA, PIPIDA, and so forth; however, most were found to have less uptake and slower clearance than the approved commercially available agents. Kit Preparation Tc-99m HIDA radiopharmaceuticals are commercially available as kits containing the non-labeled HIDA analog and stannous chloride in lyophilized form. With the addi- tion of Tc-99m pertechnetate to the vial, a Tc-99m–HIDA complex is formed. It is stable for at least 6 hours. Radiopharmaceutical Physiology and Pharmacokinetics HIDA radiopharmaceuticals are organic anions excreted by the liver in a manner similar to that of bilirubin. After intravenous injection, they are tightly bound to protein in the blood, minimizing renal clearance. Extraction occurs CHAPTER 8 Hepatobiliary System FIGURE 8-1. Anatomy of a liver lobule. Plates of hepatocytes and Kupffer cells are distributed radially around the central vein. Branches of the por- tal vein and hepatic artery located at the periphery of the lobule deliver blood to the sinusoids. Blood leaves through the central vein (proximal branch of hepatic veins). Peripherally located bile ducts drain bile cana- liculi that course between hepatocytes. TABLE 8-1 Liver and Spleen Radiopharmaceuticals, Mechanisms, and Clinical Indications Radiopharmaceutical Mechanism of uptake Indication Tc-99m mebrofenin, disofenin Hepatocyte uptake Cholescintigraphy Tc-99m red blood cells Tc-99m sulfur colloid Blood pool distribution Kupffer cell uptake Liver hemangioma, spleen Focal nodular hyperplasia Tc-99m MAA Blood flow, capillary occlusion Hepatic arterial perfusion Xe-133 Lipid soluble Focal fatty tumor uptake Gallium-67 citrate Iron binding Tumor/abscess imaging F-18 FDG Y-90 microspheres Glucose metabolism Blood flow, capillary occlusion Tumor imaging Liver tumor radiotherapy FDG, Fluorodeoxyglucose; MAA, macroaggregated albumin.
-
Upload
azmal-sarker -
Category
Health & Medicine
-
view
345 -
download
1
Transcript of 8 hbs
Chapter 8
Hepatobiliary System
Hepatic, biliary, and splenic scintigraphy have had an important role in radionuclide imaging since the 1960s. Many of the radiopharmaceuticals, methodologies, and indications have changed; however, modern scintigraphy provides unique physiological and diagnostic information not available from anatomical imaging. The various radio-pharmaceuticals used today have functional mechanisms of uptake, distribution, and localization that take advan-tage of the complex anatomy and physiology of the liver and spleen (Table 8-1 and Fig. 8-1).
CHOLESCINTIGRAPHY
Cholescintigraphy is used routinely for the diagnosis of various acute and chronic hepatobiliary diseases, including acute cholecystitis, biliary obstruction, bile leak, and acal-culous chronic gallbladder disease (Box 8-1).
Radiopharmaceuticals
Technetium-99m–labeled hepatobiliary radiopharmaceu-ticals became available in the early 1980s; because of their superior image and diagnostic quality they replaced iodine-123 rose bengal.
Three hepatobiliary radiopharmaceuticals have been approved by the U.S. Food and Drug Administration (FDA) for clinical use in the United States (Fig. 8-2). The first was Tc-99m dimethyl iminodiacetic acid (IDA), which was referred to as hepatic IDA (HIDA). Although it is no longer used, HIDA has become a generic term for all Tc-99m IDA radiopharmaceuticals. The two agents in clinical use today in the United States are shown in Table 8-2.
Table 8-1 Liver and Spleen Radiopharmaceuticals, Mechanisms, and Clinical Indications
RadiopharmaceuticalMechanism of uptake Indication
Tc-99m mebrofenin, disofenin
Hepatocyte uptake Cholescintigraphy
Tc-99m red blood cells
Tc-99m sulfur colloid
Blood pool distribution
Kupffer cell uptake
Liver hemangioma, spleen
Focal nodular hyperplasia
Tc-99m MAA Blood flow, capillary occlusion
Hepatic arterial perfusion
Xe-133 Lipid soluble Focal fatty tumor uptake
Gallium-67 citrate Iron binding Tumor/abscess imaging
F-18 FDGY-90 microspheres
Glucose metabolismBlood flow, capillary occlusion
Tumor imagingLiver tumor radiotherapy
FDG, Fluorodeoxyglucose; MAA, macroaggregated albumin.
ChemistryTc-99m serves as a bridging atom between two IDA ligand molecules (Fig. 8-2). Both IDA molecules bind to an acet-anilide analog of lidocaine. The latter determines the radiopharmaceutical’s biological and pharmacokinetic properties.
Minor structural changes in the phenyl ring (N substitu-tions) result in significant alterations in the pharmacoki-netics of IDA radiopharmaceuticals (Table 8-3). Many Tc-99m HIDA analogs with different aromatic ring chemi-cal substitutions have been investigated, with generic names of BIDA, DIDA, EIDA, PIPIDA, and so forth; however, most were found to have less uptake and slower clearance than the approved commercially available agents.
Kit Preparation
Tc-99m HIDA radiopharmaceuticals are commercially available as kits containing the non-labeled HIDA analog and stannous chloride in lyophilized form. With the addi-tion of Tc-99m pertechnetate to the vial, a Tc-99m–HIDA complex is formed. It is stable for at least 6 hours.
Radiopharmaceutical Physiology and Pharmacokinetics
HIDA radiopharmaceuticals are organic anions excreted by the liver in a manner similar to that of bilirubin. After intravenous injection, they are tightly bound to protein in the blood, minimizing renal clearance. Extraction occurs
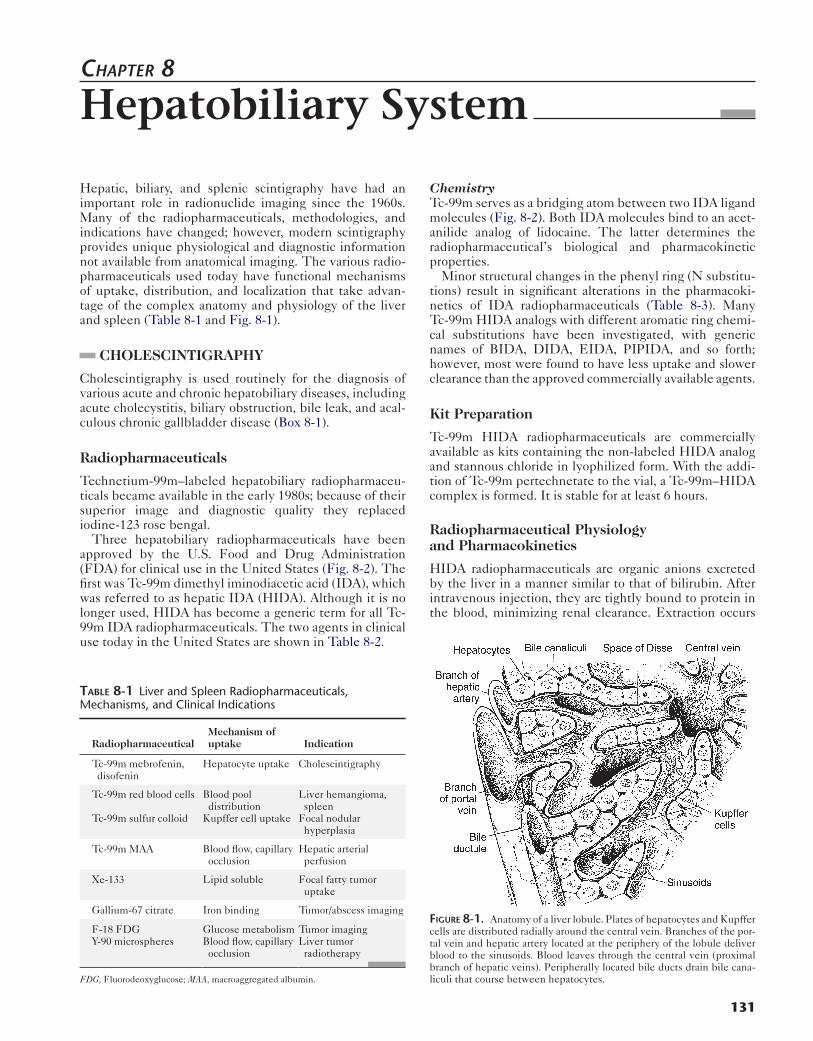
Figure 8-1. Anatomy of a liver lobule. Plates of hepatocytes and Kupffer cells are distributed radially around the central vein. Branches of the por-tal vein and hepatic artery located at the periphery of the lobule deliver blood to the sinusoids. Blood leaves through the central vein (proximal branch of hepatic veins). Peripherally located bile ducts drain bile cana-liculi that course between hepatocytes.
131
132 Nuclear Medicine: The Requisites
via a high-capacity, carrier-mediated, anionic clearance mechanism. HIDA is transported into bile canaliculi by an active membrane transport system. Unlike bilirubin, the Tc-99m IDA compounds are excreted in their original radiochemical form without conjugation or metabolism. Because Tc-99m HIDA travels the same pathway as biliru-bin, it is subject to competitive inhibition by high serum bilirubin levels.
Hepatic dysfunction causes altered HIDA pharmaco-kinetics—that is, delayed uptake, secretion, and clear-ance. The kidneys serve as the alternative route of excretion, clearing only a small percentage of the dose
Box 8-1. Cholescintigraphy: Clinical Indications
Acute cholecystitisAcute acalculous cholecystitisBiliary obstructionBiliary atresiaSphincter of Oddi dysfunctionBiliary leakChronic acalculous gallbladder diseaseBiliary diversion assessmentBiliary stent functionEnterogastric bile refluxFocal nodular hyperplasiaHepatocellular carcinoma
(Table 8-3). With hepatic dysfunction, urinary excretion increases.
After extraction by hepatocytes, HIDA is excreted into the biliary canaliculi and follows biliary flow into the larger ducts (Fig. 8-3). Approximately two thirds enters the gall-bladder via the cystic duct, and the remainder travels
Table 8-2 Technetium-99m Hepatobiliary Agent Names
Chemical FDA Commercial
Tc-99m diisopropyl IDA (DISIDA)
Disofenin Hepatolite
Tc-99m bromotriethyl IDA Mebrofenin Choletec
FDA, U.S. Food and Drug Administration.
Table 8-3 Normal Pharmacokinetics of Technetium-99m Hepatobiliary Iminodiacetic Acid Radiopharmaceuticals
AgentHepatic
uptake (%)Clearance
half-time (min)2-hr renal
excretion (%)
Tc-99m disofenin (DISIDA)
88 19 <9
Tc-99m mebrofenin (BrIDA)
98 17 <1
CH3
CH3
NHLidocaine
HIDA (dimethyl IDA)LidofeninTechnescan
DISIDA (disopropyl IDA)DisofeninHepatolite
Bromotriethyl IDAMebrofeninCholetec
NCH2
CH2CH3
CH2CH3
CH2COO
CH2COO
C
O
CH3
CH3
OOCH2C
OOCH2C99mTc
CH2COO
CH2COOH3C CH3
H3C
OOCH2C
OOCH2C99mTc
CH2COO
CH2COO
H3C CH3
OOCH2C
OOCH2C99mTc
H3C CH3
H3C CH3
CH
H3C
CH
CH3
3 2
5 614
CH3
NH NCH2C
O
NH NCH2C
OH3C
H3C
NHN CH2 C
O
CH
NHN CH2 C
O
Br
H3C
NHN CH2 C
OCH3
CH3
NH NCH2C
O
Br
Biological activity Radioactivity Biological activity
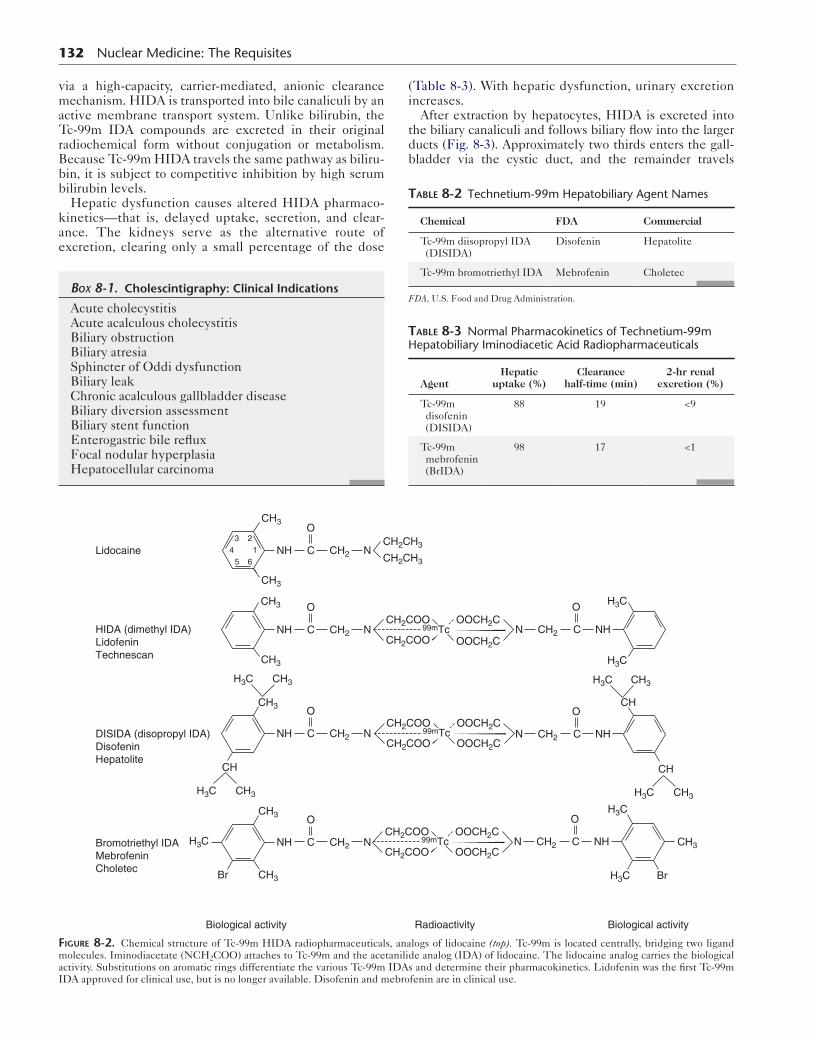
Figure 8-2. Chemical structure of Tc-99m HIDA radiopharmaceuticals, analogs of lidocaine (top). Tc-99m is located centrally, bridging two ligand molecules. Iminodiacetate (NCH2COO) attaches to Tc-99m and the acetanilide analog (IDA) of lidocaine. The lidocaine analog carries the biological activity. Substitutions on aromatic rings differentiate the various Tc-99m IDAs and determine their pharmacokinetics. Lidofenin was the first Tc-99m IDA approved for clinical use, but is no longer available. Disofenin and mebrofenin are in clinical use.
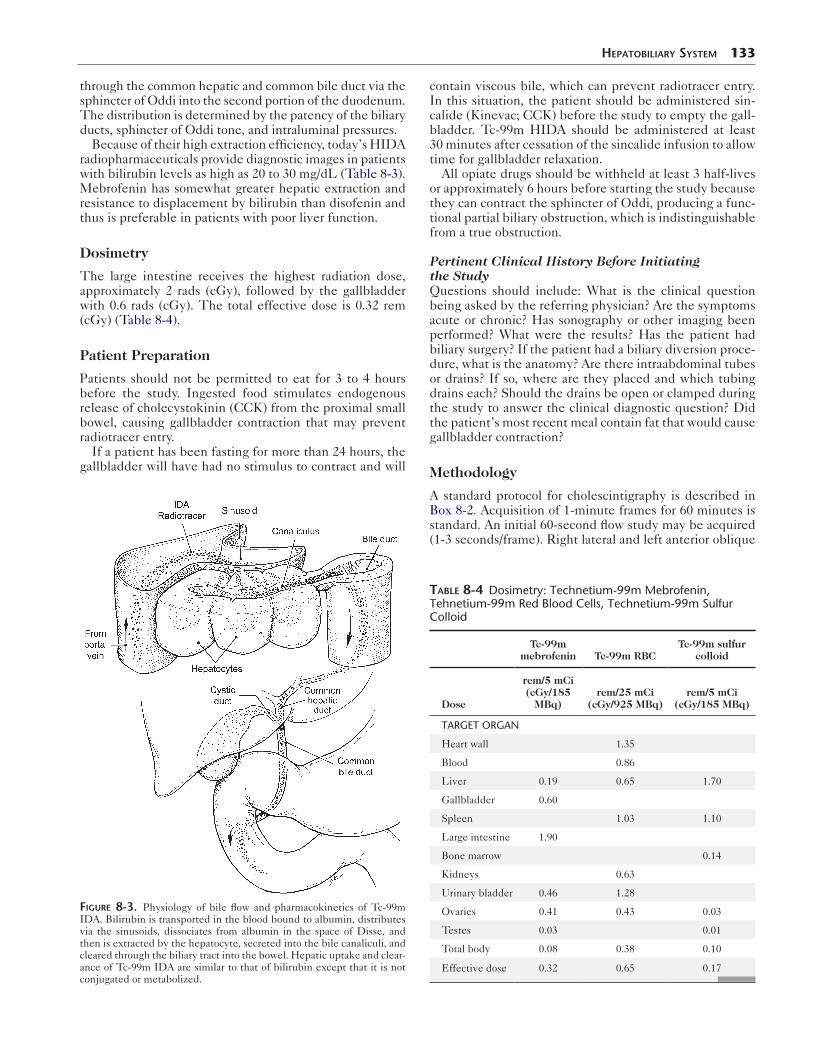
through the common hepatic and common bile duct via the sphincter of Oddi into the second portion of the duodenum. The distribution is determined by the patency of the biliary ducts, sphincter of Oddi tone, and intraluminal pressures.
Because of their high extraction efficiency, today’s HIDA radiopharmaceuticals provide diagnostic images in patients with bilirubin levels as high as 20 to 30 mg/dL (Table 8-3). Mebrofenin has somewhat greater hepatic extraction and resistance to displacement by bilirubin than disofenin and thus is preferable in patients with poor liver function.
Dosimetry
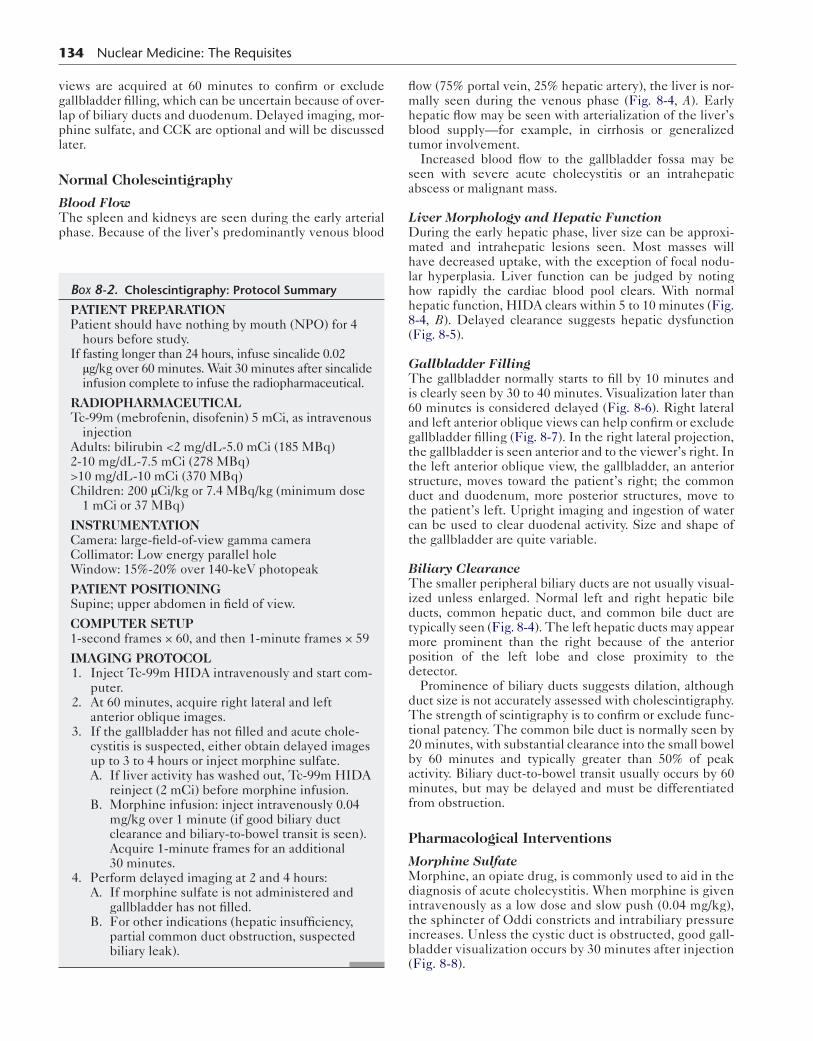
The large intestine receives the highest radiation dose, approximately 2 rads (cGy), followed by the gallbladder with 0.6 rads (cGy). The total effective dose is 0.32 rem (cGy) (Table 8-4).
Patient Preparation
Patients should not be permitted to eat for 3 to 4 hours before the study. Ingested food stimulates endogenous release of cholecystokinin (CCK) from the proximal small bowel, causing gallbladder contraction that may prevent radiotracer entry.
If a patient has been fasting for more than 24 hours, the gallbladder will have had no stimulus to contract and will
Figure 8-3. Physiology of bile flow and pharmacokinetics of Tc-99m IDA. Bilirubin is transported in the blood bound to albumin, distributes via the sinusoids, dissociates from albumin in the space of Disse, and then is extracted by the hepatocyte, secreted into the bile canaliculi, and cleared through the biliary tract into the bowel. Hepatic uptake and clear-ance of Tc-99m IDA are similar to that of bilirubin except that it is not conjugated or metabolized.
HepaTobiliary SySTem 133
contain viscous bile, which can prevent radiotracer entry. In this situation, the patient should be administered sin-calide (Kinevac; CCK) before the study to empty the gall-bladder. Tc-99m HIDA should be administered at least 30 minutes after cessation of the sincalide infusion to allow time for gallbladder relaxation.
All opiate drugs should be withheld at least 3 half-lives or approximately 6 hours before starting the study because they can contract the sphincter of Oddi, producing a func-tional partial biliary obstruction, which is indistinguishable from a true obstruction.
Pertinent Clinical History Before Initiating the StudyQuestions should include: What is the clinical question being asked by the referring physician? Are the symptoms acute or chronic? Has sonography or other imaging been performed? What were the results? Has the patient had biliary surgery? If the patient had a biliary diversion proce-dure, what is the anatomy? Are there intraabdominal tubes or drains? If so, where are they placed and which tubing drains each? Should the drains be open or clamped during the study to answer the clinical diagnostic question? Did the patient’s most recent meal contain fat that would cause gallbladder contraction?
Methodology
A standard protocol for cholescintigraphy is described in Box 8-2. Acquisition of 1-minute frames for 60 minutes is standard. An initial 60-second flow study may be acquired (1-3 seconds/frame). Right lateral and left anterior oblique
Table 8-4 Dosimetry: Technetium-99m Mebrofenin, Tehnetium-99m Red Blood Cells, Technetium-99m Sulfur Colloid
Tc-99m mebrofenin Tc-99m RBC
Tc-99m sulfur colloid
Dose
rem/5 mCi(cGy/185
MBq)rem/25 mCi
(cGy/925 MBq)rem/5 mCi
(cGy/185 MBq)
TARGET ORGAN
Heart wall 1.35
Blood 0.86
Liver 0.19 0.65 1.70
Gallbladder 0.60
Spleen 1.03 1.10
Large intestine 1.90
Bone marrow 0.14
Kidneys 0.63
Urinary bladder 0.46 1.28
Ovaries 0.41 0.43 0.03
Testes 0.03 0.01
Total body 0.08 0.38 0.10
Effective dose 0.32 0.65 0.17
134 Nuclear Medicine: The Requisites
views are acquired at 60 minutes to confirm or exclude gallbladder filling, which can be uncertain because of over-lap of biliary ducts and duodenum. Delayed imaging, mor-phine sulfate, and CCK are optional and will be discussed later.
Normal Cholescintigraphy
Blood FlowThe spleen and kidneys are seen during the early arterial phase. Because of the liver’s predominantly venous blood
Box 8-2. Cholescintigraphy: Protocol Summary
PATIENT PREPARATIONPatient should have nothing by mouth (NPO) for 4
hours before study.If fasting longer than 24 hours, infuse sincalide 0.02 μg/kg over 60 minutes. Wait 30 minutes after sincalide infusion complete to infuse the radiopharmaceutical.
RADIOPHARMACEUTICALTc-99m (mebrofenin, disofenin) 5 mCi, as intravenous
injectionAdults: bilirubin <2 mg/dL-5.0 mCi (185 MBq)2-10 mg/dL-7.5 mCi (278 MBq)>10 mg/dL-10 mCi (370 MBq)Children: 200 μCi/kg or 7.4 MBq/kg (minimum dose
1 mCi or 37 MBq)
INSTRUMENTATIONCamera: large-field-of-view gamma cameraCollimator: Low energy parallel holeWindow: 15%-20% over 140-keV photopeak
PATIENT POSITIONINGSupine; upper abdomen in field of view.
COMPUTER SETUP1-second frames × 60, and then 1-minute frames × 59
IMAGING PROTOCOL 1. Inject Tc-99m HIDA intravenously and start com-
puter. 2. At 60 minutes, acquire right lateral and left
anterior oblique images. 3. If the gallbladder has not filled and acute chole-
cystitis is suspected, either obtain delayed images up to 3 to 4 hours or inject morphine sulfate.
A. If liver activity has washed out, Tc-99m HIDA reinject (2 mCi) before morphine infusion.
B. Morphine infusion: inject intravenously 0.04 mg/kg over 1 minute (if good biliary duct clearance and biliary-to-bowel transit is seen). Acquire 1-minute frames for an additional 30 minutes.
4. Perform delayed imaging at 2 and 4 hours: A. If morphine sulfate is not administered and
gallbladder has not filled. B. For other indications (hepatic insufficiency,
partial common duct obstruction, suspected biliary leak).
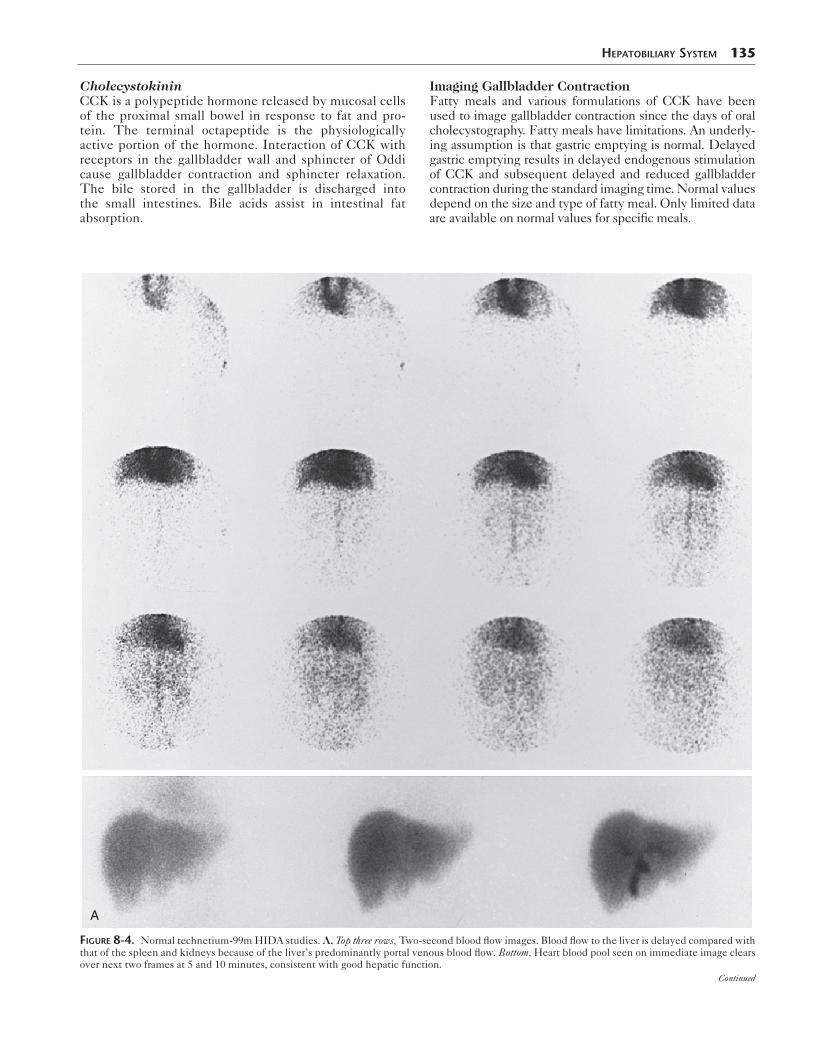
flow (75% portal vein, 25% hepatic artery), the liver is nor-mally seen during the venous phase (Fig. 8-4, A). Early hepatic flow may be seen with arterialization of the liver’s blood supply—for example, in cirrhosis or generalized tumor involvement.
Increased blood flow to the gallbladder fossa may be seen with severe acute cholecystitis or an intrahepatic abscess or malignant mass.
Liver Morphology and Hepatic FunctionDuring the early hepatic phase, liver size can be approxi-mated and intrahepatic lesions seen. Most masses will have decreased uptake, with the exception of focal nodu-lar hyperplasia. Liver function can be judged by noting how rapidly the cardiac blood pool clears. With normal hepatic function, HIDA clears within 5 to 10 minutes (Fig. 8-4, B). Delayed clearance suggests hepatic dysfunction (Fig. 8-5).
Gallbladder FillingThe gallbladder normally starts to fill by 10 minutes and is clearly seen by 30 to 40 minutes. Visualization later than 60 minutes is considered delayed (Fig. 8-6). Right lateral and left anterior oblique views can help confirm or exclude gallbladder filling (Fig. 8-7). In the right lateral projection, the gallbladder is seen anterior and to the viewer’s right. In the left anterior oblique view, the gallbladder, an anterior structure, moves toward the patient’s right; the common duct and duodenum, more posterior structures, move to the patient’s left. Upright imaging and ingestion of water can be used to clear duodenal activity. Size and shape of the gallbladder are quite variable.
Biliary ClearanceThe smaller peripheral biliary ducts are not usually visual-ized unless enlarged. Normal left and right hepatic bile ducts, common hepatic duct, and common bile duct are typically seen (Fig. 8-4). The left hepatic ducts may appear more prominent than the right because of the anterior position of the left lobe and close proximity to the detector.
Prominence of biliary ducts suggests dilation, although duct size is not accurately assessed with cholescintigraphy. The strength of scintigraphy is to confirm or exclude func-tional patency. The common bile duct is normally seen by 20 minutes, with substantial clearance into the small bowel by 60 minutes and typically greater than 50% of peak activity. Biliary duct-to-bowel transit usually occurs by 60 minutes, but may be delayed and must be differentiated from obstruction.
Pharmacological Interventions
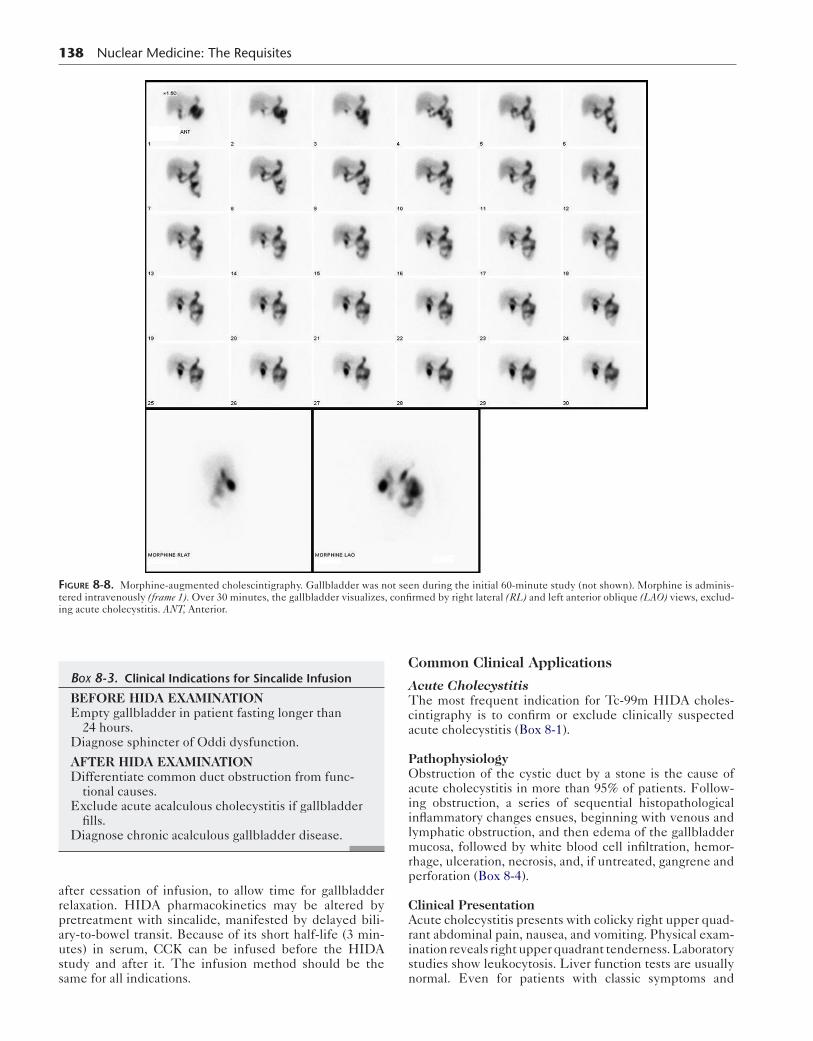
Morphine SulfateMorphine, an opiate drug, is commonly used to aid in the diagnosis of acute cholecystitis. When morphine is given intravenously as a low dose and slow push (0.04 mg/kg), the sphincter of Oddi constricts and intrabiliary pressure increases. Unless the cystic duct is obstructed, good gall-bladder visualization occurs by 30 minutes after injection (Fig. 8-8).
CholecystokininCCK is a polypeptide hormone released by mucosal cells of the proximal small bowel in response to fat and pro-tein. The terminal octapeptide is the physiologically active portion of the hormone. Interaction of CCK with receptors in the gallbladder wall and sphincter of Oddi cause gallbladder contraction and sphincter relaxation. The bile stored in the gallbladder is discharged into the small intestines. Bile acids assist in intestinal fat absorption.
HepaTobiliary SySTem 135
Imaging Gallbladder ContractionFatty meals and various formulations of CCK have been used to image gallbladder contraction since the days of oral cholecystography. Fatty meals have limitations. An underly-ing assumption is that gastric emptying is normal. Delayed gastric emptying results in delayed endogenous stimulation of CCK and subsequent delayed and reduced gallbladder contraction during the standard imaging time. Normal values depend on the size and type of fatty meal. Only limited data are available on normal values for specific meals.
A
Figure 8-4. Normal technetium-99m HIDA studies. A, Top three rows, Two-second blood flow images. Blood flow to the liver is delayed compared with that of the spleen and kidneys because of the liver’s predominantly portal venous blood flow. Bottom, Heart blood pool seen on immediate image clears over next two frames at 5 and 10 minutes, consistent with good hepatic function.
Continued

B
0–5 min 6–10 min 11–15 min 16–20 min
21–25 min 26–30 min 31–35 min 36–40 min
41–45 min
86 91 96
116111106
46–50 min 51–55 min 56–60 min
Figure 8-4, cont’d. B, Five-minute summed images for 60 minutes in a different patient. Right, left, and common hepatic ducts are seen by 15 to 20 minutes and the common bile duct by 30 minutes. Biliary-to-bowel clearance is noted at 36 minutes. The gallbladder is visualized early.
1 h 2 h
12 h
4 h
Figure 8-5. Severe hepatic dysfunction. Slow blood pool clearance and poor liver-to-background ratio. Gallbladder is not visualized until 12 hours. Last two images are right and left anterior oblique views respectively.

HepaTobiliary SySTem 137
Immediate
Anterior LAO Rt. lateral
3 hours post-injection
30 minutes 60 minutes
Figure 8-6. Delayed gallbladder visualization. Above: Immediate, 30- and 60-minute images show no gallbladder visualization. Delayed images obtained at 3 hours shows gallbladder filling in three views, anterior, left anterior oblique, and right lateral. The right lateral shows the gallbladder anteriorly (to the right) and the left anterior oblique shows the gallbladder lateral to the small bowel (moved to the left).
RLANT @ 60 min LAO
Figure 8-7. Overlying gallbladder, common duct, and duodenal activity at 60 minutes. Right lateral (RL) and left anterior oblique (LAO) views confirm gallbladder filling. ANT, Anterior.
Sincalide is the only commercial form of CCK available in the United States. It is an analog of the terminal octa-peptide of CCK. Clinical indications are listed in Box 8-3. It is used to empty the gallbladder before cholescintigra-phy in patients who have fasted for more than 24 hours and
after the gallbladder has been visualized to quantify a gall-bladder ejection fraction (GBEF) in those suspected of acalculous gallbladder disease.
When sincalide is infused before cholescintigraphy, Tc-99m HIDA should not be injected until 30 minutes
138 Nuclear Medicine: The Requisites
Figure 8-8. Morphine-augmented cholescintigraphy. Gallbladder was not seen during the initial 60-minute study (not shown). Morphine is adminis-tered intravenously (frame 1). Over 30 minutes, the gallbladder visualizes, confirmed by right lateral (RL) and left anterior oblique (LAO) views, exclud-ing acute cholecystitis. ANT, Anterior.
after cessation of infusion, to allow time for gallbladder relaxation. HIDA pharmacokinetics may be altered by pretreatment with sincalide, manifested by delayed bili-ary-to-bowel transit. Because of its short half-life (3 min-utes) in serum, CCK can be infused before the HIDA study and after it. The infusion method should be the same for all indications.
Box 8-3. Clinical Indications for Sincalide Infusion
BEFORE HIDA EXAMINATIONEmpty gallbladder in patient fasting longer than
24 hours.Diagnose sphincter of Oddi dysfunction.
AFTER HIDA EXAMINATIONDifferentiate common duct obstruction from func-
tional causes.Exclude acute acalculous cholecystitis if gallbladder
fills.Diagnose chronic acalculous gallbladder disease.
Common Clinical Applications
Acute CholecystitisThe most frequent indication for Tc-99m HIDA choles-cintigraphy is to confirm or exclude clinically suspected acute cholecystitis (Box 8-1).
PathophysiologyObstruction of the cystic duct by a stone is the cause of acute cholecystitis in more than 95% of patients. Follow-ing obstruction, a series of sequential histopathological inflammatory changes ensues, beginning with venous and lymphatic obstruction, and then edema of the gallbladder mucosa, followed by white blood cell infiltration, hemor-rhage, ulceration, necrosis, and, if untreated, gangrene and perforation (Box 8-4).
Clinical PresentationAcute cholecystitis presents with colicky right upper quad-rant abdominal pain, nausea, and vomiting. Physical exam-ination reveals right upper quadrant tenderness. Laboratory studies show leukocytosis. Liver function tests are usually normal. Even for patients with classic symptoms and
findings, a confirmatory imaging study is required for the diagnosis before surgery.
UltrasonographyMost patients with acute cholecystitis have gallstones, which can usually be seen on sonography; however, the presence of stones is not specific for acute cholecystitis. Asymptomatic gallstones are common and often unrelated to the cause of the presenting abdominal pain.
Many of the sonographic findings seen with acute chole-cystitis are not specific. Thickening of the gallbladder wall and pericholecystic fluid occur with other acute and chronic diseases. A more specific indication of acute inflammation is intramural lucency. The sonographic Mur-phy sign (localized tenderness in the region of the gall-bladder) in experienced hands is reported to have high accuracy. However, the finding is operator-dependent and not always reliable. The combination of gallstones, intra-mural lucency, and sonographic Murphy sign makes the diagnosis of acute cholecystitis likely. However, most patients with acute cholecystitis do not have all of these findings and the diagnosis is less certain.
Cholescintigraphy and ultrasonography provide comple-mentary functional and anatomical information. Ultraso-nography may reveal other factors that may be causing the patient’s symptoms—for example, common duct dilation of biliary obstruction, pancreatic or liver tumors, renal stones, pulmonary consolidation, or pleural effusion.
CholescintigraphyCholescintigraphy demonstrates the underlying patho-physiology of acute cholecystitis—nonfilling of the gall-bladder consistent with cystic duct obstruction. Nonfilling of the gallbladder by 60 minutes after Tc-99m HIDA injection is abnormal; however, it is not diagnostic of acute cholecystitis. Nonfilling at 3 to 4 hours is diagnostic. The most common reason for delayed gallbladder filling (>60 minutes) is chronic cholecystitis (Fig. 8-6).
The accuracy of cholescintigraphy for the diagnosis of acute cholecystitis using the delayed imaging method has been extensively investigated (Table 8-5). Its sensitivity (nonfilling of the gallbladder in those with the disease) is greater than 95% to 98% and specificity (filling of the gall-bladder in those who do not have the disease) is greater than 90%. Studies directly comparing cholescintigraphy with ultrasonography have found cholescintigraphy clearly supe-rior for the diagnosis of acute cholecystitis (Table 8-5).
In spite of its high specificity, false positive cholescinti-graphic studies occur. However, these can be minimized by anticipating situations in which they might occur (Box
Box 8-4. Acute Cholecystitis: Sequential Pathophysiology
1. Cystic duct obstruction 2. Venous and lymphatic outflow obstruction 3. Mucosal edema and congestion 4. Neutrophilic leukocyte infiltration 5. Hemorrhage and necrosis 6. Gangrene 7. Perforation
HepaTobiliary SySTem 139
8-5) and using state-of-the-art methodology. Ensuring that patients have fasted 3 to 4 hours before the study is man-datory. Those fasting longer than 24 hours or receiving hyperalimentation should be administered CCK before the study to contract the gallbladder, which likely is full of viscous bile. Patients with hepatic dysfunction have delayed pharmacokinetics—that is, delayed uptake and clearance of the radiotracer and unpredictable gallbladder filling. Delayed imaging up to 24 hours may be necessary to confirm or exclude gallbladder filling (Fig. 8-5).
Patients with chronic cholecystitis may have false posi-tive findings in a study for acute cholecystitis, because they may have a fibrotic obstructed duct or more likely a functional obstruction resulting from a gallbladder filled with viscous bile. In the latter patients, CCK may not empty the gallbladder because it is hypofunctional. Very ill hospitalized patients with a concurrent serious illness may have false positive scintigraphy results for acute cholecys-titis. The reason for this is unclear.
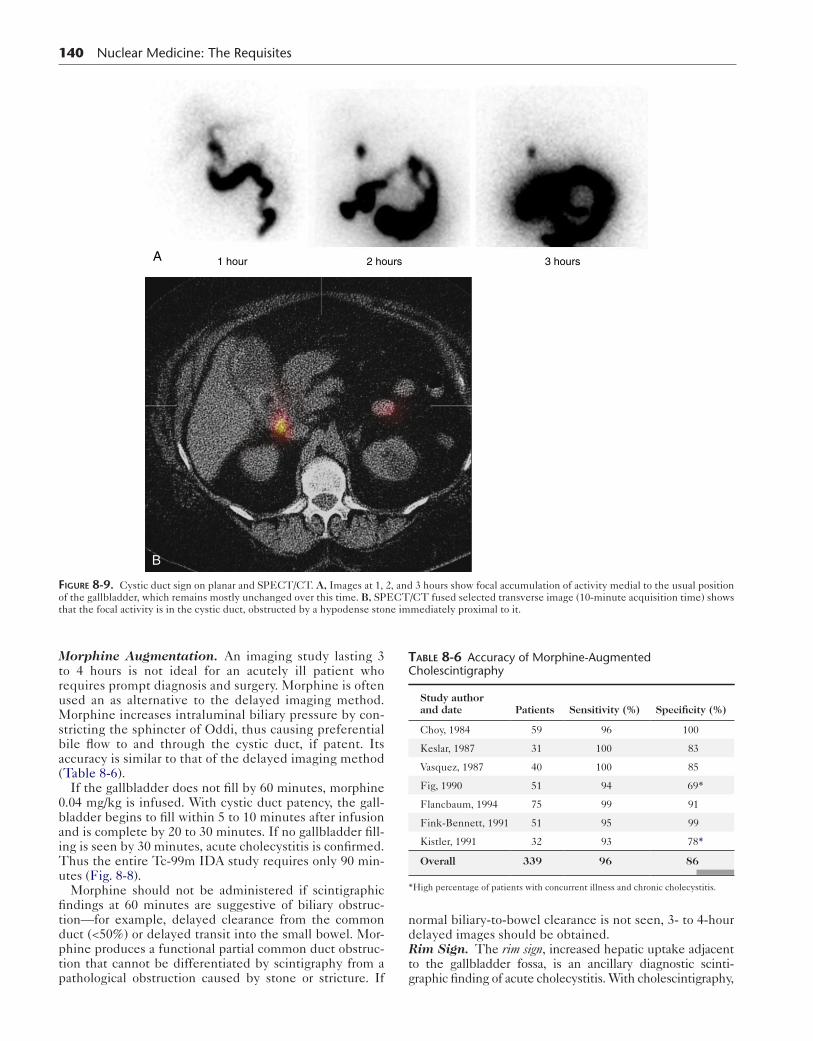
False negative study results (gallbladder filling in a patient with acute cholecystitis) are rare. One cause is the cystic duct sign—that is, dilation proximal to the cystic duct obstruction that may be misinterpreted as a gallblad-der (Fig. 8-9).
Box 8-5. Causes for False Positive Cholescintigraphy for Acute Cholecystitis
Fasting less than 4 hoursFasting longer than 24 hoursHyperalimentationConcurrent severe illnessChronic cholecystitisHepatic dysfunction
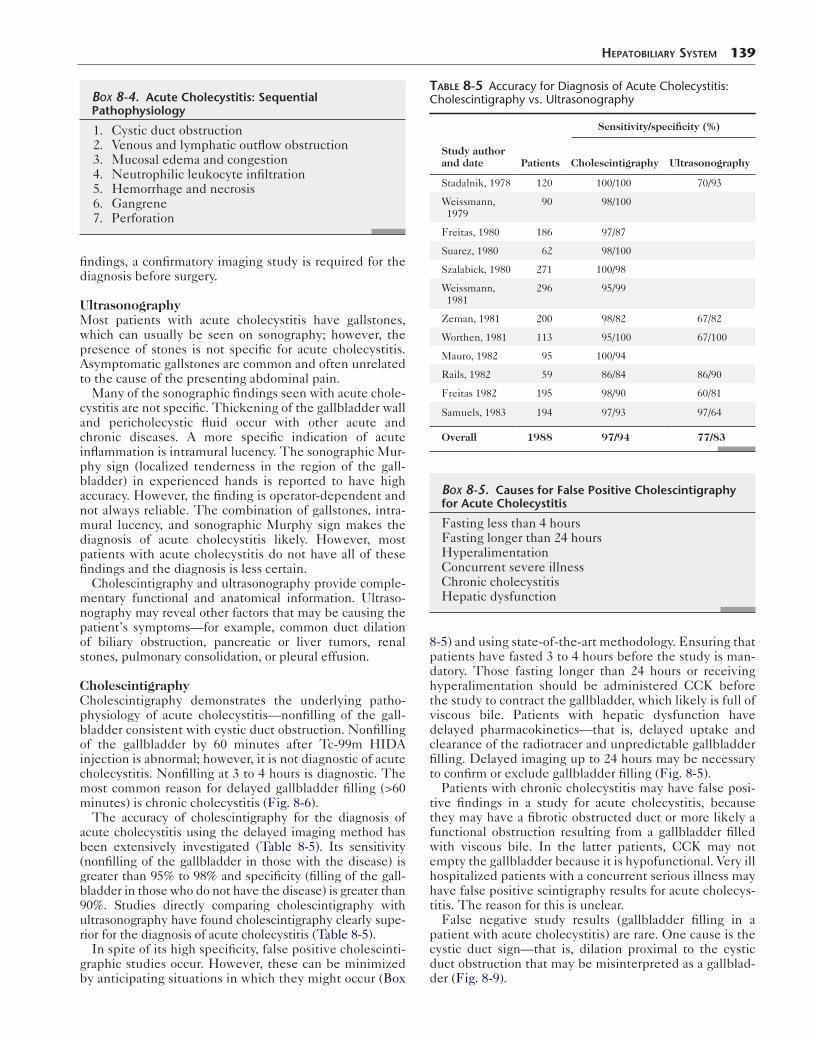
Table 8-5 Accuracy for Diagnosis of Acute Cholecystitis: Cholescintigraphy vs. Ultrasonography
Sensitivity/specificity (%)
Study author and date Patients Cholescintigraphy Ultrasonography
Stadalnik, 1978 120 100/100 70/93
Weissmann, 1979
90 98/100
Freitas, 1980 186 97/87
Suarez, 1980 62 98/100
Szalabick, 1980 271 100/98
Weissmann, 1981
296 95/99
Zeman, 1981 200 98/82 67/82
Worthen, 1981 113 95/100 67/100
Mauro, 1982 95 100/94
Rails, 1982 59 86/84 86/90
Freitas 1982 195 98/90 60/81
Samuels, 1983 194 97/93 97/64
Overall 1988 97/94 77/83
140 Nuclear Medicine: The Requisites
B
A 1 hour 2 hours 3 hours
Figure 8-9. Cystic duct sign on planar and SPECT/CT. A, Images at 1, 2, and 3 hours show focal accumulation of activity medial to the usual position of the gallbladder, which remains mostly unchanged over this time. B, SPECT/CT fused selected transverse image (10-minute acquisition time) shows that the focal activity is in the cystic duct, obstructed by a hypodense stone immediately proximal to it.
Morphine Augmentation. An imaging study lasting 3 to 4 hours is not ideal for an acutely ill patient who requires prompt diagnosis and surgery. Morphine is often used an as alternative to the delayed imaging method. Morphine increases intraluminal biliary pressure by con-stricting the sphincter of Oddi, thus causing preferential bile flow to and through the cystic duct, if patent. Its accuracy is similar to that of the delayed imaging method (Table 8-6).
If the gallbladder does not fill by 60 minutes, morphine 0.04 mg/kg is infused. With cystic duct patency, the gall-bladder begins to fill within 5 to 10 minutes after infusion and is complete by 20 to 30 minutes. If no gallbladder fill-ing is seen by 30 minutes, acute cholecystitis is confirmed. Thus the entire Tc-99m IDA study requires only 90 min-utes (Fig. 8-8).
Morphine should not be administered if scintigraphic findings at 60 minutes are suggestive of biliary obstruc-tion—for example, delayed clearance from the common duct (<50%) or delayed transit into the small bowel. Mor-phine produces a functional partial common duct obstruc-tion that cannot be differentiated by scintigraphy from a pathological obstruction caused by stone or stricture. If
normal biliary-to-bowel clearance is not seen, 3- to 4-hour delayed images should be obtained.Rim Sign. The rim sign, increased hepatic uptake adjacent to the gallbladder fossa, is an ancillary diagnostic scinti-graphic finding of acute cholecystitis. With cholescintigraphy,
Table 8-6 Accuracy of Morphine-Augmented Cholescintigraphy
Study author and date Patients Sensitivity (%) Specificity (%)
Choy, 1984 59 96 100
Keslar, 1987 31 100 83
Vasquez, 1987 40 100 85
Fig, 1990 51 94 69*
Flancbaum, 1994 75 99 91
Fink-Bennett, 1991 51 95 99
Kistler, 1991 32 93 78*
Overall 339 96 86
*High percentage of patients with concurrent illness and chronic cholecystitis.
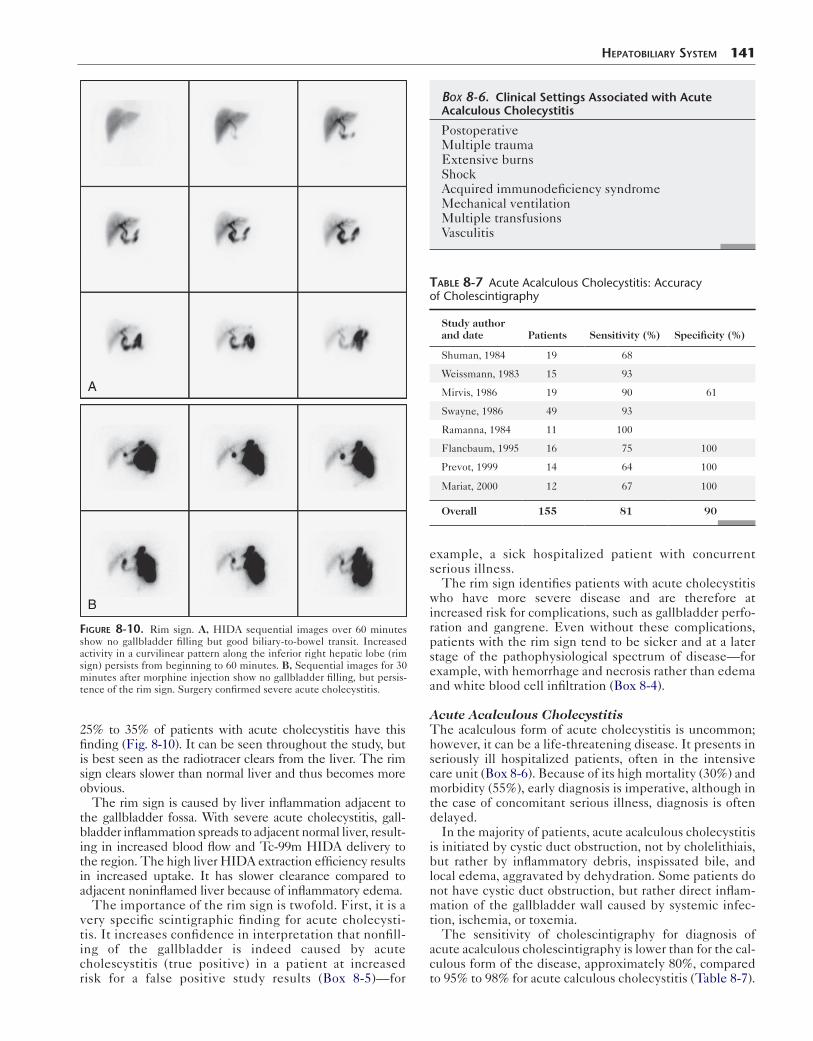
25% to 35% of patients with acute cholecystitis have this finding (Fig. 8-10). It can be seen throughout the study, but is best seen as the radiotracer clears from the liver. The rim sign clears slower than normal liver and thus becomes more obvious.
The rim sign is caused by liver inflammation adjacent to the gallbladder fossa. With severe acute cholecystitis, gall-bladder inflammation spreads to adjacent normal liver, result-ing in increased blood flow and Tc-99m HIDA delivery to the region. The high liver HIDA extraction efficiency results in increased uptake. It has slower clearance compared to adjacent noninflamed liver because of inflammatory edema.
The importance of the rim sign is twofold. First, it is a very specific scintigraphic finding for acute cholecysti-tis. It increases confidence in interpretation that nonfill-ing of the gallbladder is indeed caused by acute cholescystitis (true positive) in a patient at increased risk for a false positive study results (Box 8-5)—for
A
B
Figure 8-10. Rim sign. A, HIDA sequential images over 60 minutes show no gallbladder filling but good biliary-to-bowel transit. Increased activity in a curvilinear pattern along the inferior right hepatic lobe (rim sign) persists from beginning to 60 minutes. B, Sequential images for 30 minutes after morphine injection show no gallbladder filling, but persis-tence of the rim sign. Surgery confirmed severe acute cholecystitis.
HepaTobiliary SySTem 141
example, a sick hospitalized patient with concurrent serious illness.
The rim sign identifies patients with acute cholecystitis who have more severe disease and are therefore at increased risk for complications, such as gallbladder perfo-ration and gangrene. Even without these complications, patients with the rim sign tend to be sicker and at a later stage of the pathophysiological spectrum of disease—for example, with hemorrhage and necrosis rather than edema and white blood cell infiltration (Box 8-4).
Acute Acalculous CholecystitisThe acalculous form of acute cholecystitis is uncommon; however, it can be a life-threatening disease. It presents in seriously ill hospitalized patients, often in the intensive care unit (Box 8-6). Because of its high mortality (30%) and morbidity (55%), early diagnosis is imperative, although in the case of concomitant serious illness, diagnosis is often delayed.
In the majority of patients, acute acalculous cholecystitis is initiated by cystic duct obstruction, not by cholelithiais, but rather by inflammatory debris, inspissated bile, and local edema, aggravated by dehydration. Some patients do not have cystic duct obstruction, but rather direct inflam-mation of the gallbladder wall caused by systemic infec-tion, ischemia, or toxemia.
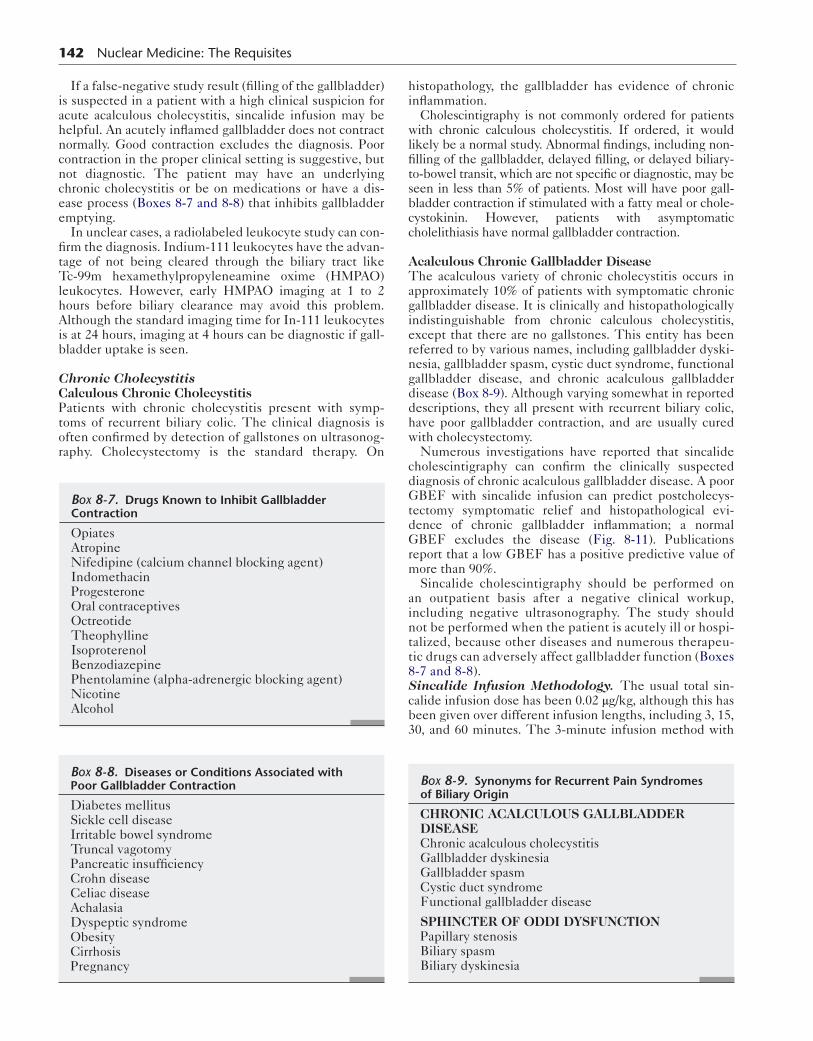
The sensitivity of cholescintigraphy for diagnosis of acute acalculous cholescintigraphy is lower than for the cal-culous form of the disease, approximately 80%, compared to 95% to 98% for acute calculous cholecystitis (Table 8-7).
Box 8-6. Clinical Settings Associated with Acute Acalculous Cholecystitis
PostoperativeMultiple traumaExtensive burnsShockAcquired immunodeficiency syndromeMechanical ventilationMultiple transfusionsVasculitis
Table 8-7 Acute Acalculous Cholecystitis: Accuracy of Cholescintigraphy
Study author and date Patients Sensitivity (%) Specificity (%)
Shuman, 1984 19 68
Weissmann, 1983 15 93
Mirvis, 1986 19 90 61
Swayne, 1986 49 93
Ramanna, 1984 11 100
Flancbaum, 1995 16 75 100
Prevot, 1999 14 64 100
Mariat, 2000 12 67 100
Overall 155 81 90
142 Nuclear Medicine: The Requisites
If a false-negative study result (filling of the gallbladder) is suspected in a patient with a high clinical suspicion for acute acalculous cholecystitis, sincalide infusion may be helpful. An acutely inflamed gallbladder does not contract normally. Good contraction excludes the diagnosis. Poor contraction in the proper clinical setting is suggestive, but not diagnostic. The patient may have an underlying chronic cholecystitis or be on medications or have a dis-ease process (Boxes 8-7 and 8-8) that inhibits gallbladder emptying.
In unclear cases, a radiolabeled leukocyte study can con-firm the diagnosis. Indium-111 leukocytes have the advan-tage of not being cleared through the biliary tract like Tc-99m hexamethylpropyleneamine oxime (HMPAO) leukocytes. However, early HMPAO imaging at 1 to 2 hours before biliary clearance may avoid this problem. Although the standard imaging time for In-111 leukocytes is at 24 hours, imaging at 4 hours can be diagnostic if gall-bladder uptake is seen.
Chronic CholecystitisCalculous Chronic CholecystitisPatients with chronic cholecystitis present with symp-toms of recurrent biliary colic. The clinical diagnosis is often confirmed by detection of gallstones on ultrasonog-raphy. Cholecystectomy is the standard therapy. On
Box 8-7. Drugs Known to Inhibit Gallbladder Contraction
OpiatesAtropineNifedipine (calcium channel blocking agent)IndomethacinProgesteroneOral contraceptivesOctreotideTheophyllineIsoproterenolBenzodiazepinePhentolamine (alpha-adrenergic blocking agent)NicotineAlcohol
Box 8-8. Diseases or Conditions Associated with Poor Gallbladder Contraction
Diabetes mellitusSickle cell diseaseIrritable bowel syndromeTruncal vagotomyPancreatic insufficiencyCrohn diseaseCeliac diseaseAchalasiaDyspeptic syndromeObesityCirrhosisPregnancy
histopathology, the gallbladder has evidence of chronic inflammation.
Cholescintigraphy is not commonly ordered for patients with chronic calculous cholecystitis. If ordered, it would likely be a normal study. Abnormal findings, including non-filling of the gallbladder, delayed filling, or delayed biliary-to-bowel transit, which are not specific or diagnostic, may be seen in less than 5% of patients. Most will have poor gall-bladder contraction if stimulated with a fatty meal or chole-cystokinin. However, patients with asymptomatic cholelithiasis have normal gallbladder contraction.
Acalculous Chronic Gallbladder DiseaseThe acalculous variety of chronic cholecystitis occurs in approximately 10% of patients with symptomatic chronic gallbladder disease. It is clinically and histopathologically indistinguishable from chronic calculous cholecystitis, except that there are no gallstones. This entity has been referred to by various names, including gallbladder dyski-nesia, gallbladder spasm, cystic duct syndrome, functional gallbladder disease, and chronic acalculous gallbladder disease (Box 8-9). Although varying somewhat in reported descriptions, they all present with recurrent biliary colic, have poor gallbladder contraction, and are usually cured with cholecystectomy.
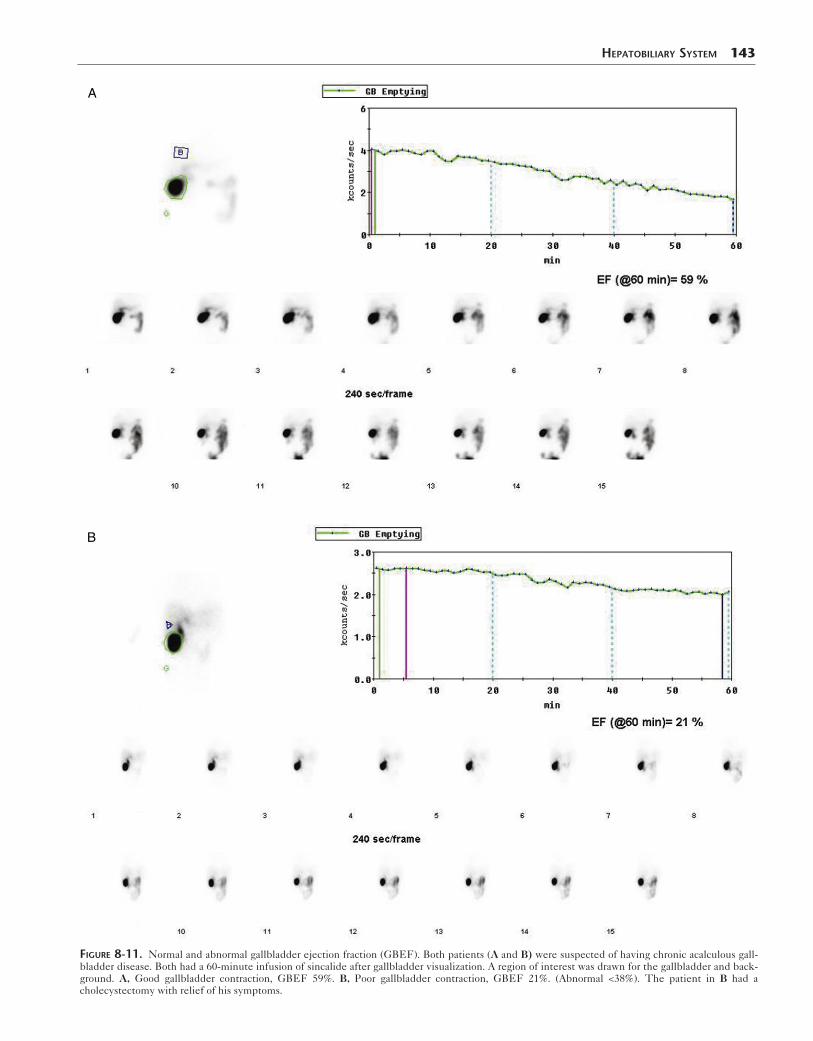
Numerous investigations have reported that sincalide cholescintigraphy can confirm the clinically suspected diagnosis of chronic acalculous gallbladder disease. A poor GBEF with sincalide infusion can predict postcholecys-tectomy symptomatic relief and histopathological evi-dence of chronic gallbladder inflammation; a normal GBEF excludes the disease (Fig. 8-11). Publications report that a low GBEF has a positive predictive value of more than 90%.
Sincalide cholescintigraphy should be performed on an outpatient basis after a negative clinical workup, including negative ultrasonography. The study should not be performed when the patient is acutely ill or hospi-talized, because other diseases and numerous therapeu-tic drugs can adversely affect gallbladder function (Boxes 8-7 and 8-8).Sincalide Infusion Methodology. The usual total sin-calide infusion dose has been 0.02 μg/kg, although this has been given over different infusion lengths, including 3, 15, 30, and 60 minutes. The 3-minute infusion method with
Box 8-9. Synonyms for Recurrent Pain Syndromes of Biliary Origin
CHRONIC ACALCULOUS GALLBLADDER DISEASEChronic acalculous cholecystitisGallbladder dyskinesiaGallbladder spasmCystic duct syndromeFunctional gallbladder disease
SPHINCTER OF ODDI DYSFUNCTIONPapillary stenosisBiliary spasmBiliary dyskinesia
HepaTobiliary SySTem 143
A
B
Figure 8-11. Normal and abnormal gallbladder ejection fraction (GBEF). Both patients (A and B) were suspected of having chronic acalculous gall-bladder disease. Both had a 60-minute infusion of sincalide after gallbladder visualization. A region of interest was drawn for the gallbladder and back-ground. A, Good gallbladder contraction, GBEF 59%. B, Poor gallbladder contraction, GBEF 21%. (Abnormal <38%). The patient in B had a cholecystectomy with relief of his symptoms.
144 Nuclear Medicine: The Requisites
calculation of a GBEF at 20 to 30 minutes was commonly used in the past; however, it is no longer recommended. It causes abdominal cramping or nausea in 50% of subjects, may lead to a false positive result, and normal values have never been established because of the wide range of GBEFs in normal subjects (0-100%).
A misconception is that reproduction of the patient’s pain with sincalide infusion is diagnostic of acalculous chronic gallbladder disease. This is not true. A side effect of sincalide is that it stimulates intestinal motility, which can cause cramping abdominal pain the drug is infused too rapidly (Box 8-8). Symptoms are not seen with 30- to 60-minute infusions.
A multicenter comparison trial found that a 60-minute infusion of 0.02 μg/kg has the least variability in normal subjects compared to 15- and 30-minute infusions and the best defined normal value (lower range of normal is 38%) (Box 8-8). A published consensus paper written by experts in gastroenterology, surgery, primary care, and nuclear medicine has recommended that the 60-minute infusion method become the standard.
Biliary ObstructionBiliary obstruction has multiple causes. Cancerous and non-cancerous causes usually present differently (Table 8-8). Malignancy (e.g., pancreatic or biliary duct cancer) usually causes painless obstructive jaundice, whereas choledocholi-thiasis produces severe acute or recurrent abdominal pain.
High-Grade Biliary ObstructionPathophysiology. With high-grade obstruction, the sequence of pathophysiological events progresses in a pre-dictable manner (Box 8-10), although the time course may vary depending on the rapidity of onset, the degree of obstruction, and the cause. Obstruction causes increased intraductal pressure and high back-pressure, reducing bile flow and causing biliary duct dilation. If unchecked, hepa-tocellular damage and ultimately biliary cirrhosis occur.
Patients with high-grade biliary obstruction often pres-ent with abdominal pain, jaundice, and elevated alkaline phosphatase and direct serum bilirubin. Increased serum alkaline phosphatase occurs early in the natural history, whereas hyperbilirubinemia is a late manifestation.
The diagnosis is often confirmed by anatomical imaging—for example, ultrasonography or magnetic resonance cholan-giopancreatography (MRCP), showing biliary duct dilation. Anatomical imaging also may detect an obstructing mass. Obstructing biliary stones are not always seen on anatomical imaging.
Biliary duct dilation is diagnostic only of obstruction in patients who have not had prior obstruction or biliary sur-gery, because the ducts may remain dilated postoperatively.
Box 8-10. High-Grade Biliary Obstruction: Sequential Pathophysiology
1. Obstruction of hepatic or common bile duct 2. Increased intrabiliary pressure 3. Significantly decreased bile flow 4. Ductal dilation 5. Biliary cirrhosis
Cholescintigraphy can determine whether the dilated bili-ary ducts are patent or again obstructed. Ductal dilation often does not become evident until 24 to 72 hours after obstruction. Cholescintigraphy can diagnose obstruction before dilation occurs because it depicts the underlying pathophysiology—that is, severely reduced or no bile flow.
Partial Biliary ObstructionThe most common cause for partial obstruction is choledo-cholithiasis. Liver function tests and serum bilirubin may be normal. Biliary ducts often are not dilated with a partial or intermittent low-grade obstruction, probably because of the lower intraductal pressure. In some cases, ductal dila-tion may be restricted by edema and scarring.
Imaging DiagnosisUltrasonography is often the first imaging study ordered. Without dilation, the study may be normal. Rapid T2-weighted MRCP scans viewed in the coronal plane mimic the appearance of contrast cholangiography. It is superior to sonography for detecting stones that do not result in ductal dilation. However, small symptomatic stones may not be detected. MRCP does not evaluate bile flow.
Cholescintigraphy can help determine if the patient’s symptoms are biliary in origin when anatomical imaging is unrewarding and if a more invasive workup is considered— for example, percutaneous cholangiography or endoscopic retrograde cholangiopancreatography (ERCP). Discor-dance between anatomical and functional imaging with cholescintigraphy is not uncommon. Functional abnormal-ities precede morphologically evident disease. When there is no ductal dilation, scintigraphy may show evidence of partial biliary obstruction manifested by delayed bile flow. In patients without obstruction but dilated ducts from prior obstruction, cholescintigraphy can exclude recurrent obstruction by demonstrating normal bile flow.
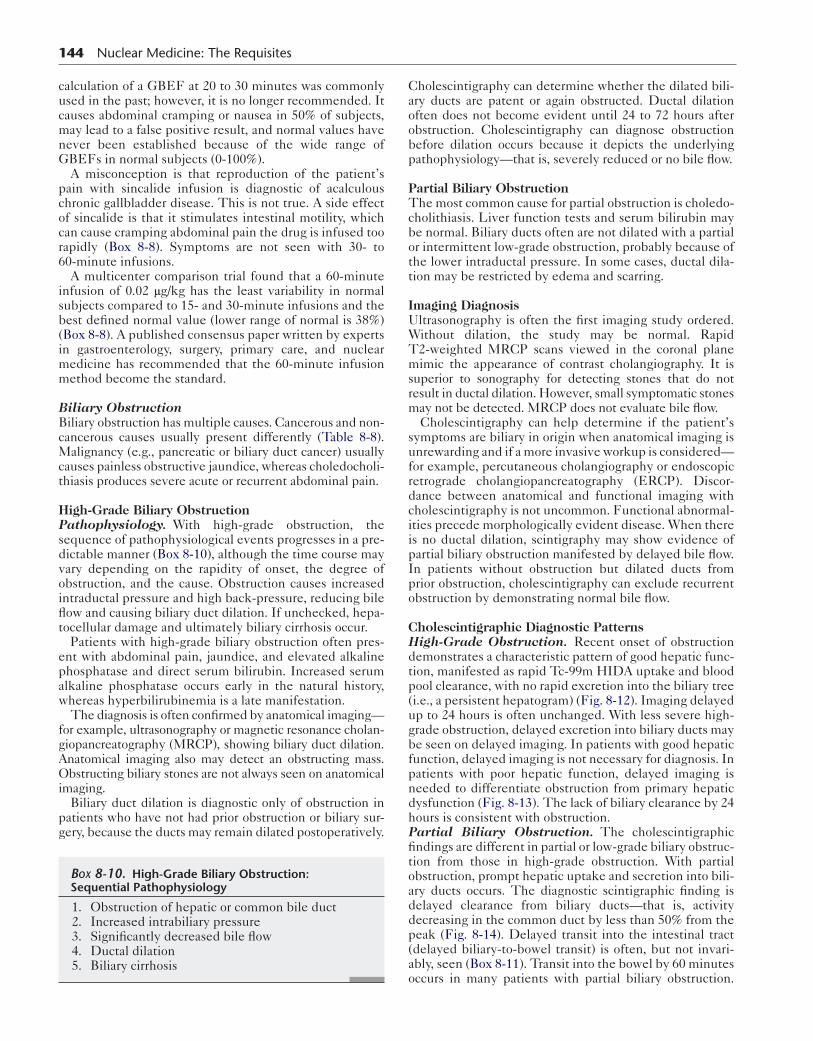
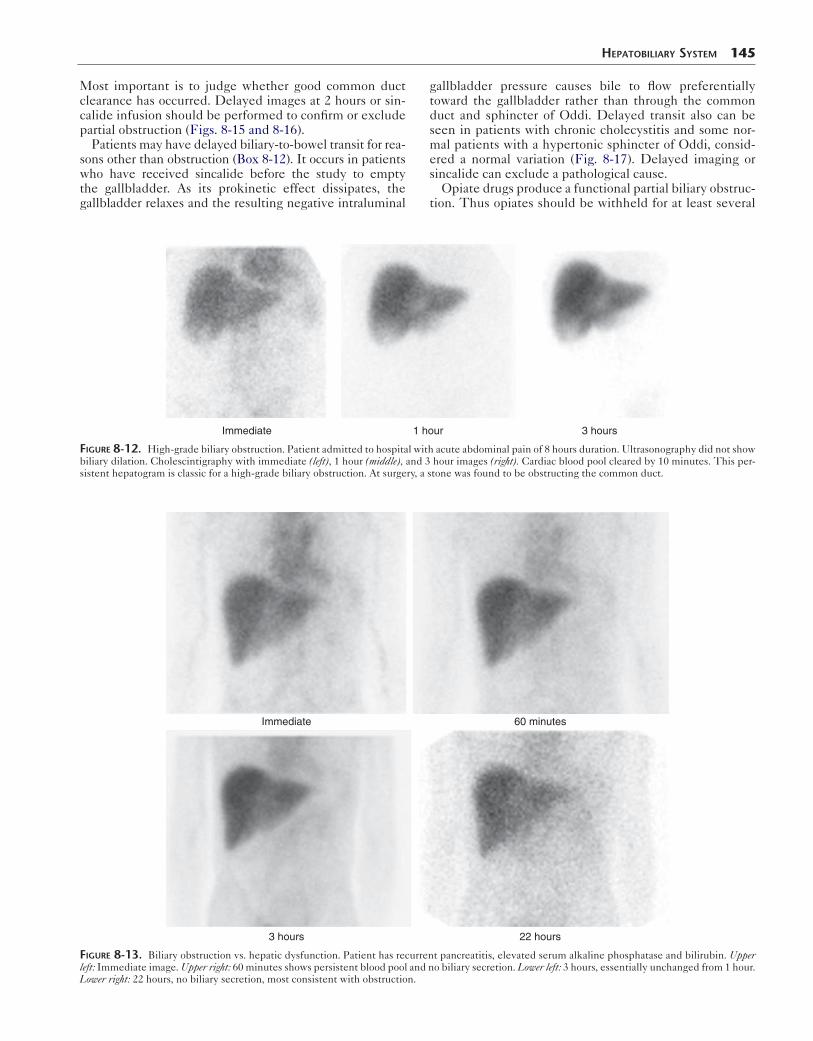
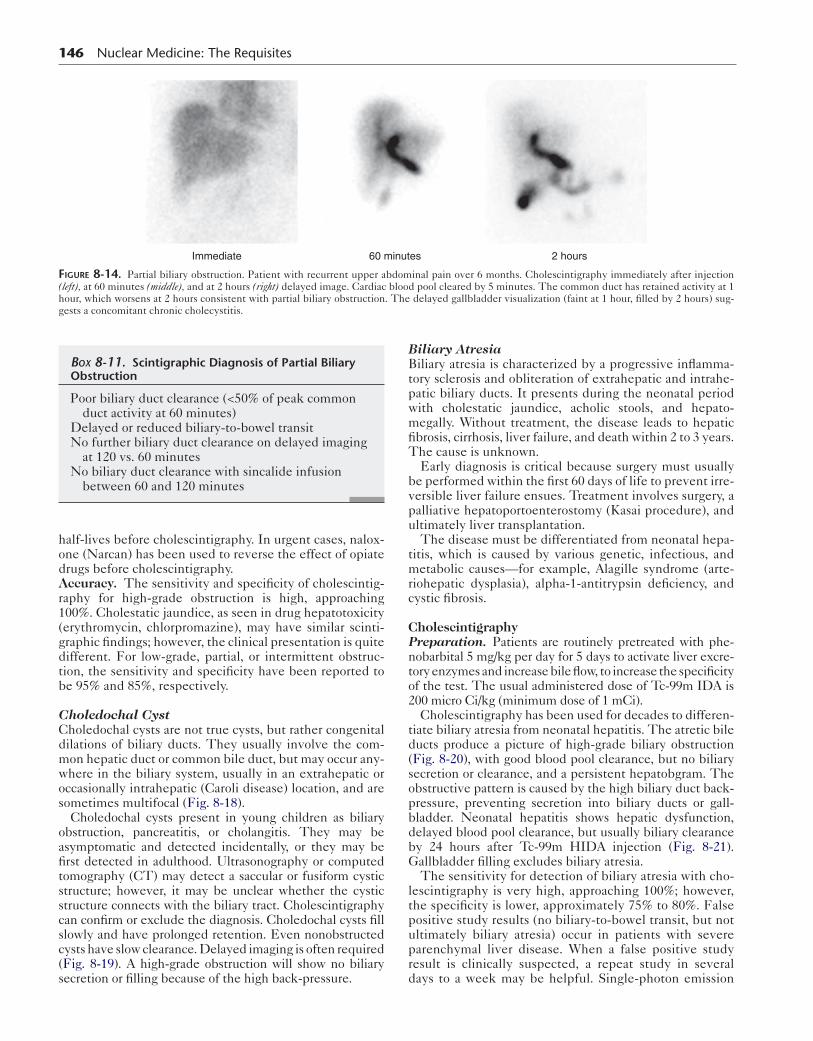
Cholescintigraphic Diagnostic PatternsHigh-Grade Obstruction. Recent onset of obstruction demonstrates a characteristic pattern of good hepatic func-tion, manifested as rapid Tc-99m HIDA uptake and blood pool clearance, with no rapid excretion into the biliary tree (i.e., a persistent hepatogram) (Fig. 8-12). Imaging delayed up to 24 hours is often unchanged. With less severe high-grade obstruction, delayed excretion into biliary ducts may be seen on delayed imaging. In patients with good hepatic function, delayed imaging is not necessary for diagnosis. In patients with poor hepatic function, delayed imaging is needed to differentiate obstruction from primary hepatic dysfunction (Fig. 8-13). The lack of biliary clearance by 24 hours is consistent with obstruction.Partial Biliary Obstruction. The cholescintigraphic findings are different in partial or low-grade biliary obstruc-tion from those in high-grade obstruction. With partial obstruction, prompt hepatic uptake and secretion into bili-ary ducts occurs. The diagnostic scintigraphic finding is delayed clearance from biliary ducts—that is, activity decreasing in the common duct by less than 50% from the peak (Fig. 8-14). Delayed transit into the intestinal tract (delayed biliary-to-bowel transit) is often, but not invari-ably, seen (Box 8-11). Transit into the bowel by 60 minutes occurs in many patients with partial biliary obstruction.
Most important is to judge whether good common duct clearance has occurred. Delayed images at 2 hours or sin-calide infusion should be performed to confirm or exclude partial obstruction (Figs. 8-15 and 8-16).
Patients may have delayed biliary-to-bowel transit for rea-sons other than obstruction (Box 8-12). It occurs in patients who have received sincalide before the study to empty the gallbladder. As its prokinetic effect dissipates, the gallbladder relaxes and the resulting negative intraluminal
HepaTobiliary SySTem 145
gallbladder pressure causes bile to flow preferentially toward the gallbladder rather than through the common duct and sphincter of Oddi. Delayed transit also can be seen in patients with chronic cholecystitis and some nor-mal patients with a hypertonic sphincter of Oddi, consid-ered a normal variation (Fig. 8-17). Delayed imaging or sincalide can exclude a pathological cause.
Opiate drugs produce a functional partial biliary obstruc-tion. Thus opiates should be withheld for at least several
Immediate 1 hour 3 hours
Figure 8-12. High-grade biliary obstruction. Patient admitted to hospital with acute abdominal pain of 8 hours duration. Ultrasonography did not show biliary dilation. Cholescintigraphy with immediate (left), 1 hour (middle), and 3 hour images (right). Cardiac blood pool cleared by 10 minutes. This per-sistent hepatogram is classic for a high-grade biliary obstruction. At surgery, a stone was found to be obstructing the common duct.
Immediate 60 minutes
3 hours 22 hours
Figure 8-13. Biliary obstruction vs. hepatic dysfunction. Patient has recurrent pancreatitis, elevated serum alkaline phosphatase and bilirubin. Upper left: Immediate image. Upper right: 60 minutes shows persistent blood pool and no biliary secretion. Lower left: 3 hours, essentially unchanged from 1 hour. Lower right: 22 hours, no biliary secretion, most consistent with obstruction.
146 Nuclear Medicine: The Requisites
Immediate 60 minutes 2 hours
Figure 8-14. Partial biliary obstruction. Patient with recurrent upper abdominal pain over 6 months. Cholescintigraphy immediately after injection (left), at 60 minutes (middle), and at 2 hours (right) delayed image. Cardiac blood pool cleared by 5 minutes. The common duct has retained activity at 1 hour, which worsens at 2 hours consistent with partial biliary obstruction. The delayed gallbladder visualization (faint at 1 hour, filled by 2 hours) sug-gests a concomitant chronic cholecystitis.
half-lives before cholescintigraphy. In urgent cases, nalox-one (Narcan) has been used to reverse the effect of opiate drugs before cholescintigraphy.Accuracy. The sensitivity and specificity of cholescintig-raphy for high-grade obstruction is high, approaching 100%. Cholestatic jaundice, as seen in drug hepatotoxicity (erythromycin, chlorpromazine), may have similar scinti-graphic findings; however, the clinical presentation is quite different. For low-grade, partial, or intermittent obstruc-tion, the sensitivity and specificity have been reported to be 95% and 85%, respectively.
Choledochal CystCholedochal cysts are not true cysts, but rather congenital dilations of biliary ducts. They usually involve the com-mon hepatic duct or common bile duct, but may occur any-where in the biliary system, usually in an extrahepatic or occasionally intrahepatic (Caroli disease) location, and are sometimes multifocal (Fig. 8-18).
Choledochal cysts present in young children as biliary obstruction, pancreatitis, or cholangitis. They may be asymptomatic and detected incidentally, or they may be first detected in adulthood. Ultrasonography or computed tomography (CT) may detect a saccular or fusiform cystic structure; however, it may be unclear whether the cystic structure connects with the biliary tract. Cholescintigraphy can confirm or exclude the diagnosis. Choledochal cysts fill slowly and have prolonged retention. Even nonobstructed cysts have slow clearance. Delayed imaging is often required (Fig. 8-19). A high-grade obstruction will show no biliary secretion or filling because of the high back-pressure.
Box 8-11. Scintigraphic Diagnosis of Partial Biliary Obstruction
Poor biliary duct clearance (<50% of peak common duct activity at 60 minutes)
Delayed or reduced biliary-to-bowel transitNo further biliary duct clearance on delayed imaging
at 120 vs. 60 minutesNo biliary duct clearance with sincalide infusion
between 60 and 120 minutes
Biliary AtresiaBiliary atresia is characterized by a progressive inflamma-tory sclerosis and obliteration of extrahepatic and intrahe-patic biliary ducts. It presents during the neonatal period with cholestatic jaundice, acholic stools, and hepato-megally. Without treatment, the disease leads to hepatic fibrosis, cirrhosis, liver failure, and death within 2 to 3 years. The cause is unknown.
Early diagnosis is critical because surgery must usually be performed within the first 60 days of life to prevent irre-versible liver failure ensues. Treatment involves surgery, a palliative hepatoportoenterostomy (Kasai procedure), and ultimately liver transplantation.
The disease must be differentiated from neonatal hepa-titis, which is caused by various genetic, infectious, and metabolic causes—for example, Alagille syndrome (arte-riohepatic dysplasia), alpha-1-antitrypsin deficiency, and cystic fibrosis.
CholescintigraphyPreparation. Patients are routinely pretreated with phe-nobarbital 5 mg/kg per day for 5 days to activate liver excre-tory enzymes and increase bile flow, to increase the specificity of the test. The usual administered dose of Tc-99m IDA is 200 micro Ci/kg (minimum dose of 1 mCi).
Cholescintigraphy has been used for decades to differen-tiate biliary atresia from neonatal hepatitis. The atretic bile ducts produce a picture of high-grade biliary obstruction (Fig. 8-20), with good blood pool clearance, but no biliary secretion or clearance, and a persistent hepatobgram. The obstructive pattern is caused by the high biliary duct back-pressure, preventing secretion into biliary ducts or gall-bladder. Neonatal hepatitis shows hepatic dysfunction, delayed blood pool clearance, but usually biliary clearance by 24 hours after Tc-99m HIDA injection (Fig. 8-21). Gallbladder filling excludes biliary atresia.
The sensitivity for detection of biliary atresia with cho-lescintigraphy is very high, approaching 100%; however, the specificity is lower, approximately 75% to 80%. False positive study results (no biliary-to-bowel transit, but not ultimately biliary atresia) occur in patients with severe parenchymal liver disease. When a false positive study result is clinically suspected, a repeat study in several days to a week may be helpful. Single-photon emission
HepaTobiliary SySTem 147
A
B
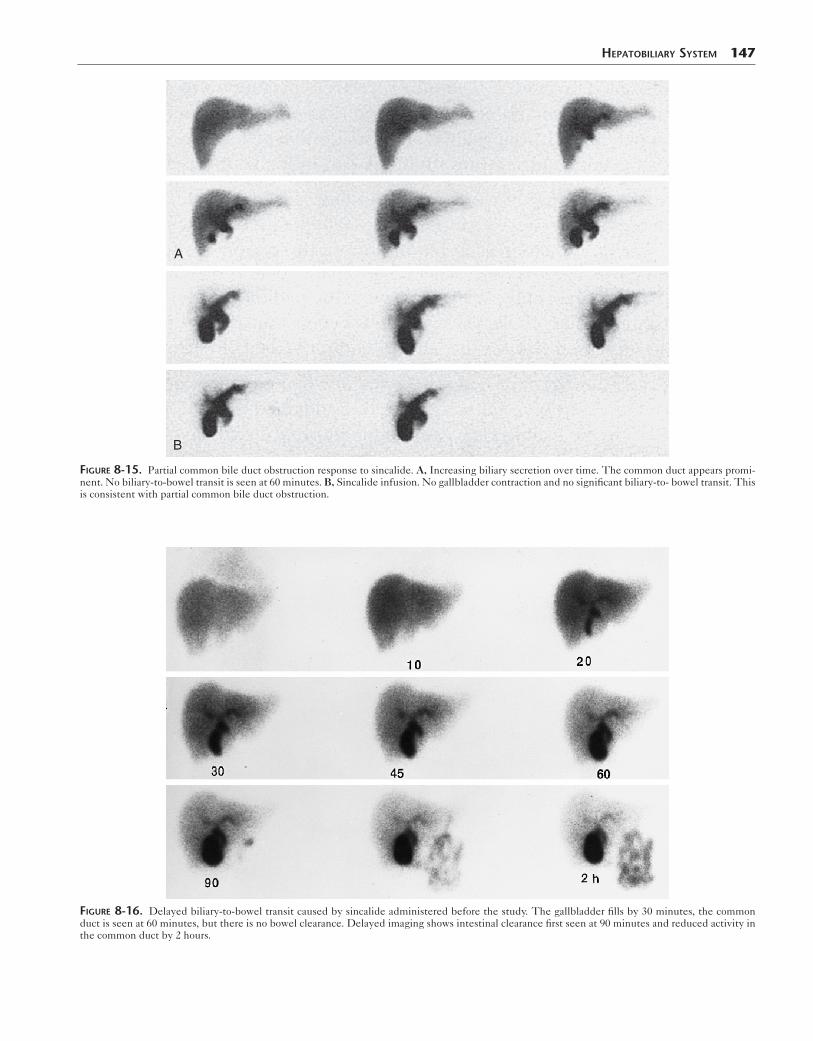
Figure 8-15. Partial common bile duct obstruction response to sincalide. A, Increasing biliary secretion over time. The common duct appears promi-nent. No biliary-to-bowel transit is seen at 60 minutes. B, Sincalide infusion. No gallbladder contraction and no significant biliary-to- bowel transit. This is consistent with partial common bile duct obstruction.
Figure 8-16. Delayed biliary-to-bowel transit caused by sincalide administered before the study. The gallbladder fills by 30 minutes, the common duct is seen at 60 minutes, but there is no bowel clearance. Delayed imaging shows intestinal clearance first seen at 90 minutes and reduced activity in the common duct by 2 hours.
148 Nuclear Medicine: The Requisites
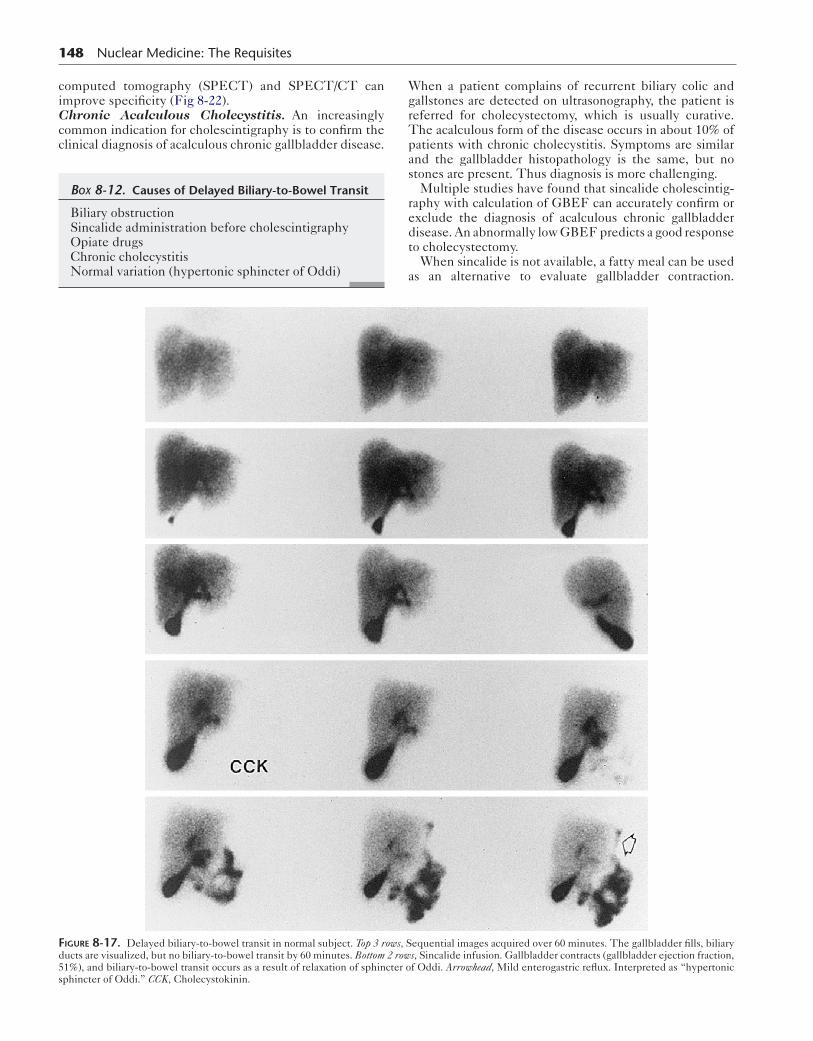
computed tomography (SPECT) and SPECT/CT can improve specificity (Fig 8-22).Chronic Acalculous Cholecystitis. An increasingly common indication for cholescintigraphy is to confirm the clinical diagnosis of acalculous chronic gallbladder disease.
Box 8-12. Causes of Delayed Biliary-to-Bowel Transit
Biliary obstructionSincalide administration before cholescintigraphyOpiate drugsChronic cholecystitisNormal variation (hypertonic sphincter of Oddi)
When a patient complains of recurrent biliary colic and gallstones are detected on ultrasonography, the patient is referred for cholecystectomy, which is usually curative. The acalculous form of the disease occurs in about 10% of patients with chronic cholecystitis. Symptoms are similar and the gallbladder histopathology is the same, but no stones are present. Thus diagnosis is more challenging.
Multiple studies have found that sincalide cholescintig-raphy with calculation of GBEF can accurately confirm or exclude the diagnosis of acalculous chronic gallbladder disease. An abnormally low GBEF predicts a good response to cholecystectomy.
When sincalide is not available, a fatty meal can be used as an alternative to evaluate gallbladder contraction.
Figure 8-17. Delayed biliary-to-bowel transit in normal subject. Top 3 rows, Sequential images acquired over 60 minutes. The gallbladder fills, biliary ducts are visualized, but no biliary-to-bowel transit by 60 minutes. Bottom 2 rows, Sincalide infusion. Gallbladder contracts (gallbladder ejection fraction, 51%), and biliary-to-bowel transit occurs as a result of relaxation of sphincter of Oddi. Arrowhead, Mild enterogastric reflux. Interpreted as “hypertonic sphincter of Oddi.” CCK, Cholecystokinin.
HepaTobiliary SySTem 149
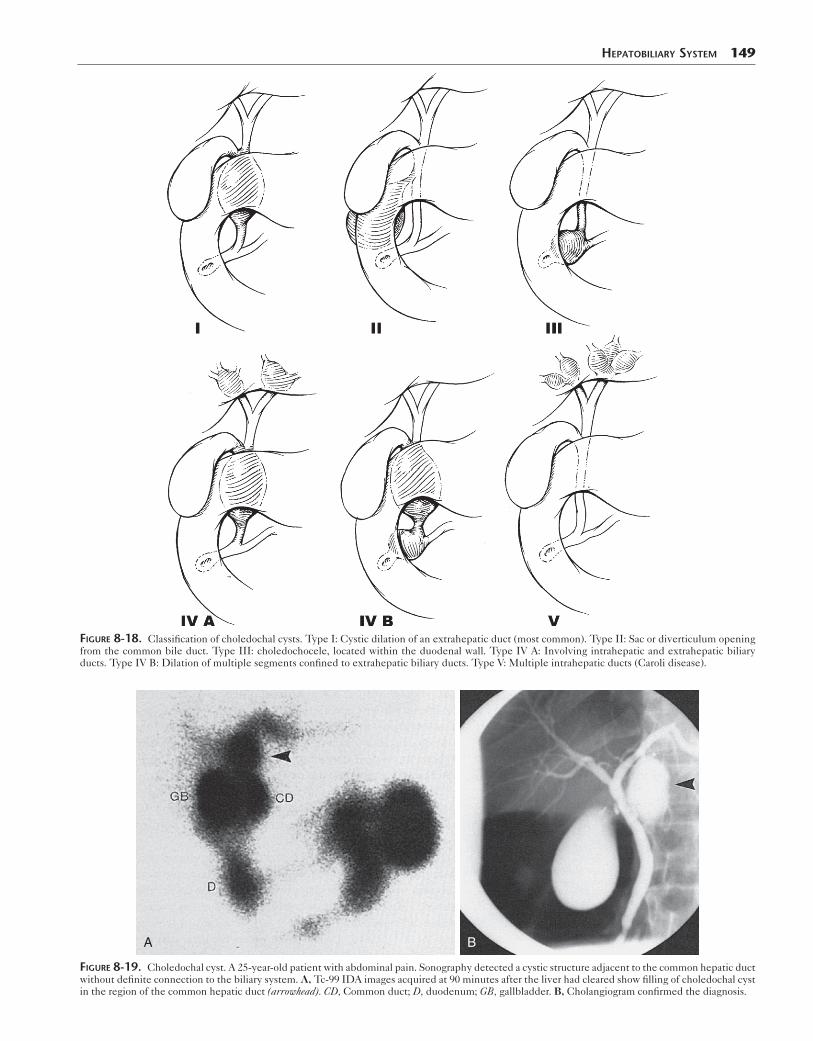
Figure 8-18. Classification of choledochal cysts. Type I: Cystic dilation of an extrahepatic duct (most common). Type II: Sac or diverticulum opening from the common bile duct. Type III: choledochocele, located within the duodenal wall. Type IV A: Involving intrahepatic and extrahepatic biliary ducts. Type IV B: Dilation of multiple segments confined to extrahepatic biliary ducts. Type V: Multiple intrahepatic ducts (Caroli disease).
A B
Figure 8-19. Choledochal cyst. A 25-year-old patient with abdominal pain. Sonography detected a cystic structure adjacent to the common hepatic duct without definite connection to the biliary system. A, Tc-99 IDA images acquired at 90 minutes after the liver had cleared show filling of choledochal cyst in the region of the common hepatic duct (arrowhead). CD, Common duct; D, duodenum; GB, gallbladder. B, Cholangiogram confirmed the diagnosis.
150 Nuclear Medicine: The Requisites
Immediate 1 hour 6 hours 24 hours
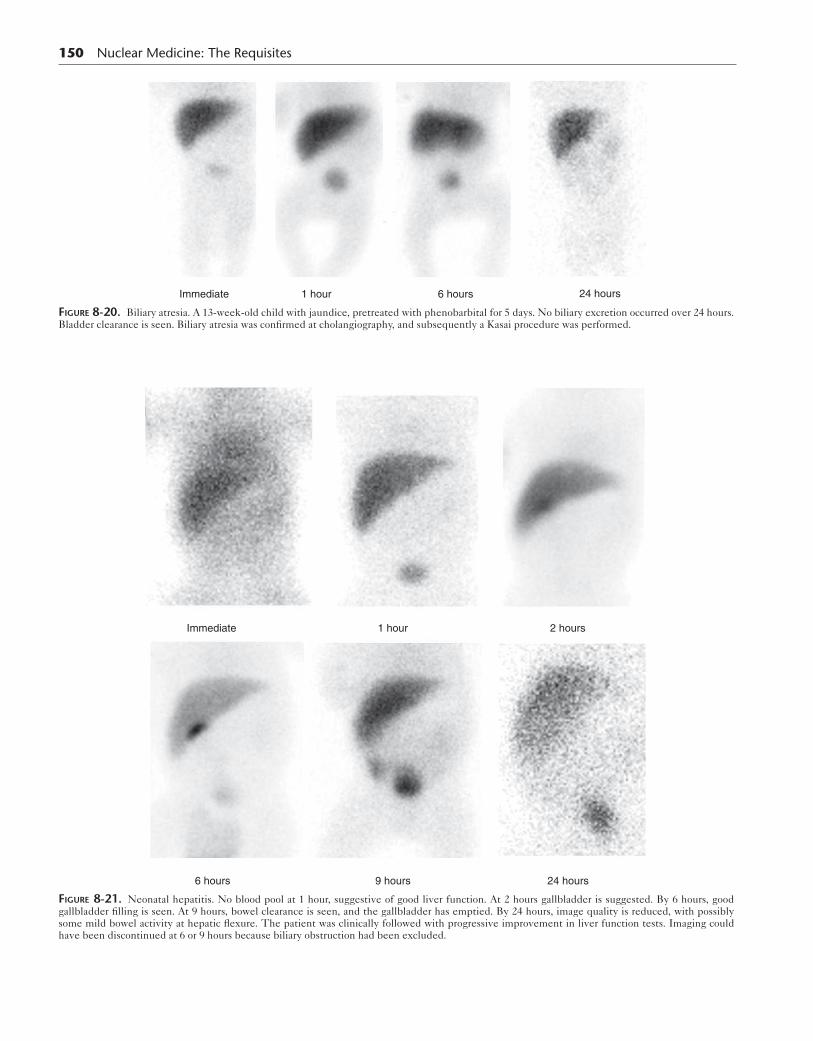
Figure 8-20. Biliary atresia. A 13-week-old child with jaundice, pretreated with phenobarbital for 5 days. No biliary excretion occurred over 24 hours. Bladder clearance is seen. Biliary atresia was confirmed at cholangiography, and subsequently a Kasai procedure was performed.
Immediate 1 hour
9 hours6 hours 24 hours
2 hours
Figure 8-21. Neonatal hepatitis. No blood pool at 1 hour, suggestive of good liver function. At 2 hours gallbladder is suggested. By 6 hours, good gallbladder filling is seen. At 9 hours, bowel clearance is seen, and the gallbladder has emptied. By 24 hours, image quality is reduced, with possibly some mild bowel activity at hepatic flexure. The patient was clinically followed with progressive improvement in liver function tests. Imaging could have been discontinued at 6 or 9 hours because biliary obstruction had been excluded.
Normal values depend on the amount of fat in the meal and the study length. Thus an established protocol and validated normal values should be used.
Many studies have shown that sincalide cholescintigra-phy with calculation of GBEF can confirm the diagnosis of chronic acalculous gallbladder disease and predict response to cholecystectomy (Fig. 8-11). Scintigraphy should be per-formed on an outpatient basis when the patient is not hav-ing symptoms. Performing this test on an inpatient basis is fraught with potential for error, because the patient is likely to be on a variety of medications that may inhibit gallblad-der contraction or may have illnesses that may adversely affect gallbladder function (Boxes 8-7 and 8-8).Methodology for Sincalide Cholescintigraphy. When sincalide was used in conjunction with oral cholecystography
B
A
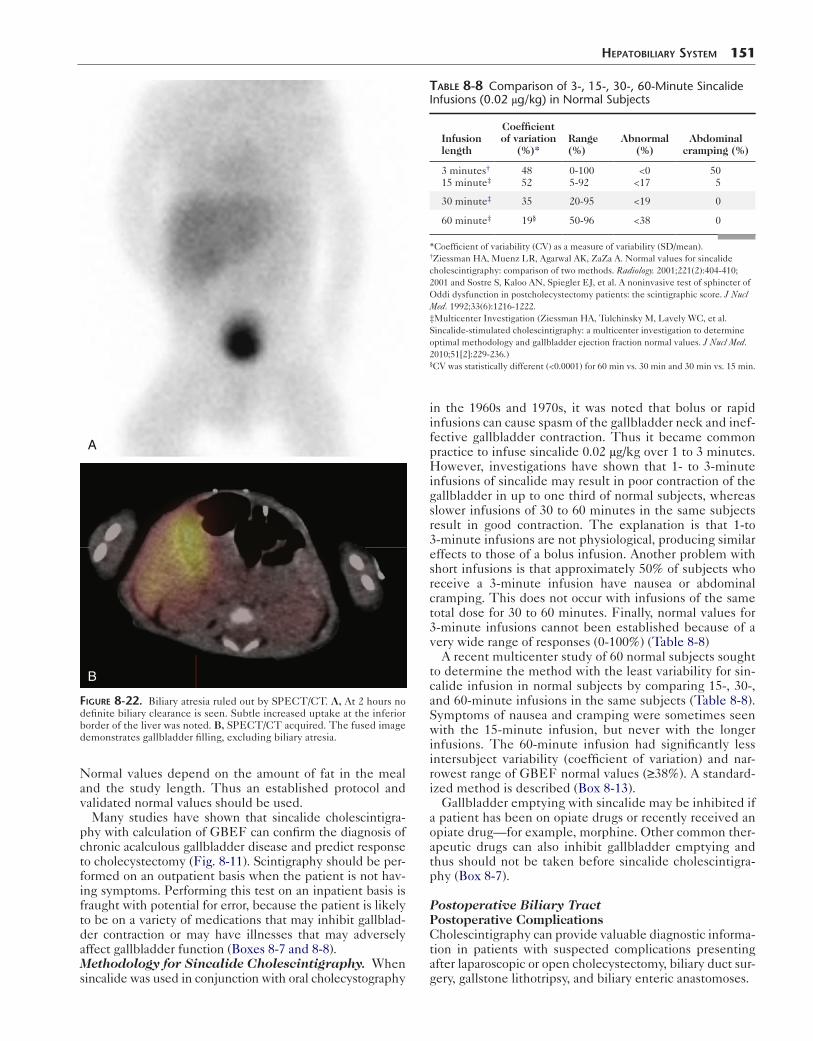
Figure 8-22. Biliary atresia ruled out by SPECT/CT. A, At 2 hours no definite biliary clearance is seen. Subtle increased uptake at the inferior border of the liver was noted. B, SPECT/CT acquired. The fused image demonstrates gallbladder filling, excluding biliary atresia.
HepaTobiliary SySTem 151
in the 1960s and 1970s, it was noted that bolus or rapid infusions can cause spasm of the gallbladder neck and inef-fective gallbladder contraction. Thus it became common practice to infuse sincalide 0.02 μg/kg over 1 to 3 minutes. However, investigations have shown that 1- to 3-minute infusions of sincalide may result in poor contraction of the gallbladder in up to one third of normal subjects, whereas slower infusions of 30 to 60 minutes in the same subjects result in good contraction. The explanation is that 1-to 3-minute infusions are not physiological, producing similar effects to those of a bolus infusion. Another problem with short infusions is that approximately 50% of subjects who receive a 3-minute infusion have nausea or abdominal cramping. This does not occur with infusions of the same total dose for 30 to 60 minutes. Finally, normal values for 3-minute infusions cannot been established because of a very wide range of responses (0-100%) (Table 8-8)
A recent multicenter study of 60 normal subjects sought to determine the method with the least variability for sin-calide infusion in normal subjects by comparing 15-, 30-, and 60-minute infusions in the same subjects (Table 8-8). Symptoms of nausea and cramping were sometimes seen with the 15-minute infusion, but never with the longer infusions. The 60-minute infusion had significantly less intersubject variability (coefficient of variation) and nar-rowest range of GBEF normal values (≥38%). A standard-ized method is described (Box 8-13).
Gallbladder emptying with sincalide may be inhibited if a patient has been on opiate drugs or recently received an opiate drug—for example, morphine. Other common ther-apeutic drugs can also inhibit gallbladder emptying and thus should not be taken before sincalide cholescintigra-phy (Box 8-7).
Postoperative Biliary TractPostoperative ComplicationsCholescintigraphy can provide valuable diagnostic informa-tion in patients with suspected complications presenting after laparoscopic or open cholecystectomy, biliary duct sur-gery, gallstone lithotripsy, and biliary enteric anastomoses.
Table 8-8 Comparison of 3-, 15-, 30-, 60-Minute Sincalide Infusions (0.02 μg/kg) in Normal Subjects
Infusion length
Coefficientof variation
(%)*Range (%)
Abnormal (%)
Abdominal cramping (%)
3 minutes†
15 minute‡4852
0-1005-92
<0<17
505
30 minute‡ 35 20-95 <19 0
60 minute‡ 19§ 50-96 <38 0
*Coefficient of variability (CV) as a measure of variability (SD/mean).†Ziessman HA, Muenz LR, Agarwal AK, ZaZa A. Normal values for sincalide cholescintigraphy: comparison of two methods. Radiology. 2001;221(2):404-410; 2001 and Sostre S, Kaloo AN, Spiegler EJ, et al. A noninvasive test of sphincter of Oddi dysfunction in postcholecystectomy patients: the scintigraphic score. J Nucl Med. 1992;33(6):1216-1222.‡Multicenter Investigation (Ziessman HA, Tulchinsky M, Lavely WC, et al. Sincalide-stimulated cholescintigraphy: a multicenter investigation to determine optimal methodology and gallbladder ejection fraction normal values. J Nucl Med. 2010;51[2]:229-236.)§CV was statistically different (<0.0001) for 60 min vs. 30 min and 30 min vs. 15 min.
152 Nuclear Medicine: The Requisites
Biliary LeaksBile leaks occur most commonly after cholecystectomy or other biliary tract surgery. Obstruction can be a contribut-ing cause. The laparoscopic method has become the pro-cedure of choice for elective cholecystectomy; however, this approach is associated with a somewhat higher rate of bile duct injury than open cholecystectomy.
Although ultrasonography and CT can detect fluid col-lections, the type and origin of the fluid collection is some-times unclear. Cholescintigraphy can determine whether the fluid collection is of biliary origin rather than a result of other causes, such as ascites or seroma. The rate of biliary leakage can be estimated visually, rapid versus slow. Slow bile leaks usually resolve spontaneously with conservative therapy; rapid leaks often require surgical correction.
Before percutaneous drainage of a biloma, cholescin-tigraphy can help ensure that central biliary obstruction is not present. With obstruction, it is unlikely that bile leak-age can be effectively treated by percutaneous drainage without addressing the underlying cause of obstruction. Follow-up cholescintigraphy can confirm resolution or per-sistence of the leakage.
With cholescintigraphically, bile leakage is seen as a pro-gressively increasing collection of radiotracer in the region of the gallbladder fossa or hepatic hilum. The activity may spread into the subdiaphragmatic space, over the dome of the liver, and into the colonic gutters or manifest as free bile in the abdomen (Fig. 8-23). Rapid leaks are detectable dur-ing the first 60 minutes of the study. Slower leaks may
Box 8-13. Consensus Methodology for Sincalide Cholescintigraphy: Gallbaldder Ejection Fraction Calculation
SINCALIDE ADMINISTRATION: STANDARDIZED PROTOCOL 1. Ensure that gallbladder has filled. 2. Position camera in left anterior oblique projection
(35-40 degrees). 3. Draw 0.02 μg/kg sincalide into a 30- to 50-mL
syringe and dilute with normal saline to the volume of the syringe.
4. Set up infusion pump so that the entire volume of the syringe will be infused over 60 minutes.
5. Set up computer acquisition for 60 one-minute frames (128 × 128).
6. Begin imaging at start of sincalide infusion and stop imaging at the end of 60-minute infusion.
7. Abnormal GBEF is less than 38%.*
COMPUTER PROCESSING GBEF 1. Select region of interest for the gallbladder and
adjacent liver background. 2. Generate time–activity curve. 3. Calculate GBEF at 60 minutes = maximum
counts − minimum counts divided by maximum counts, all corrected for background.
*From DiBaise JK, Richmond BK, Ziessman HA, et al. Cholecystokinin-cholescintigraphy in adults: consensus recommendations of an interdisci-plinary panel. Clin Nucl Med. 2012;37(1):63-70.GBEF, Gallbladder ejection fraction.
require delayed imaging. Positioning the patient on the right lateral decubitus for several minutes immediately before laying them flat under the camera positions camera closer for better image. Peritoneal tubing, drains, and collec-tion bags may exhibit accumulation and should be imaged.
Biliary Diversion SurgeryBiliary enteric bypass procedures are performed in patients for benign and malignant diseases associated with biliary obstruction.
Ultrasonography has imaging limitations in the pres-ence of gas in the anastomotic bowel segment or refluxed biliary air after surgery. Two thirds of attempts are reported as indeterminate. Biliary dilation may be pres-ent in more than 20% of patients even though obstruction has been adequately relieved by surgery. MRCP has become a standard diagnostic procedure because of its good accuracy in visualizing the postoperative stricture and detecting obstruction. Cholescintigraphy is well-suited to diagnose bile leakage, patency of the anastomo-sis, and recurrent obstruction in patients who have had biliary diversion surgery. It is important to know the post-operative anatomy of the patient being imaged. Although biliary scintigraphy is useful in a variety of anastomoses, it is particularly valuable in patients with intrahepatic cholangiojejunostomy or choledochojejunostomy. The latter is a direct anastomosis of the extrahepatic portion of the common bile duct or common hepatic duct to a Roux-en-Y jejunal loop. The intrahepatic cholangiojeju-nostomy requires direct anastomosis between the small bowel and intrahepatic ducts. Cholescintigraphy also can be helpful if ERCP cannot reach the biliary tract when a long Roux-en-Y loop has been created.
Cholescintigraphy is the only noninvasive method that can distinguish obstructed dilated ducts from those that are chronically dilated but not obstructed. With scintigraphy, intestinal excretion visualization by 1 hour with or without ductal dilation is consistent with functional patency. Intes-tinal excretion longer than 1 hour is suggestive of partial obstruction. However, retention of activity in biliary ducts is a more reliable indicator. Persistent or worsening biliary duct retention between 1 and 2 hours is very suspicious for obstruction. Stasis with minimal intestinal excretion and pooling in the region of the biliary enteric anastomosis nor-mally may be seen at 1 hour. This may be positional and can be confirmed by imaging the patient upright. Persis-tent nonvisualization of the biliary system and intestine is seen with complete biliary duct obstruction.
Other Gastrointestinal Surgical AnastomosesCholescintigraphy can provide functional information about other surgical procedures involving the gastrointes-tinal tract—for example, Billroth I and II and Whipple resection. In Billroth II anastomoses, afferent loop patency can be determined. The afferent loop should fill readily in an antegrade direction from the common duct. Normally, there is progressive accumulation of activity within the loop. However, it should clear distally by 2 hours.
Liver TransplantsThe major role for cholescintigraphy is to aid in detection of the postoperative complications of bile leaks and
HepaTobiliary SySTem 153
A
B
C
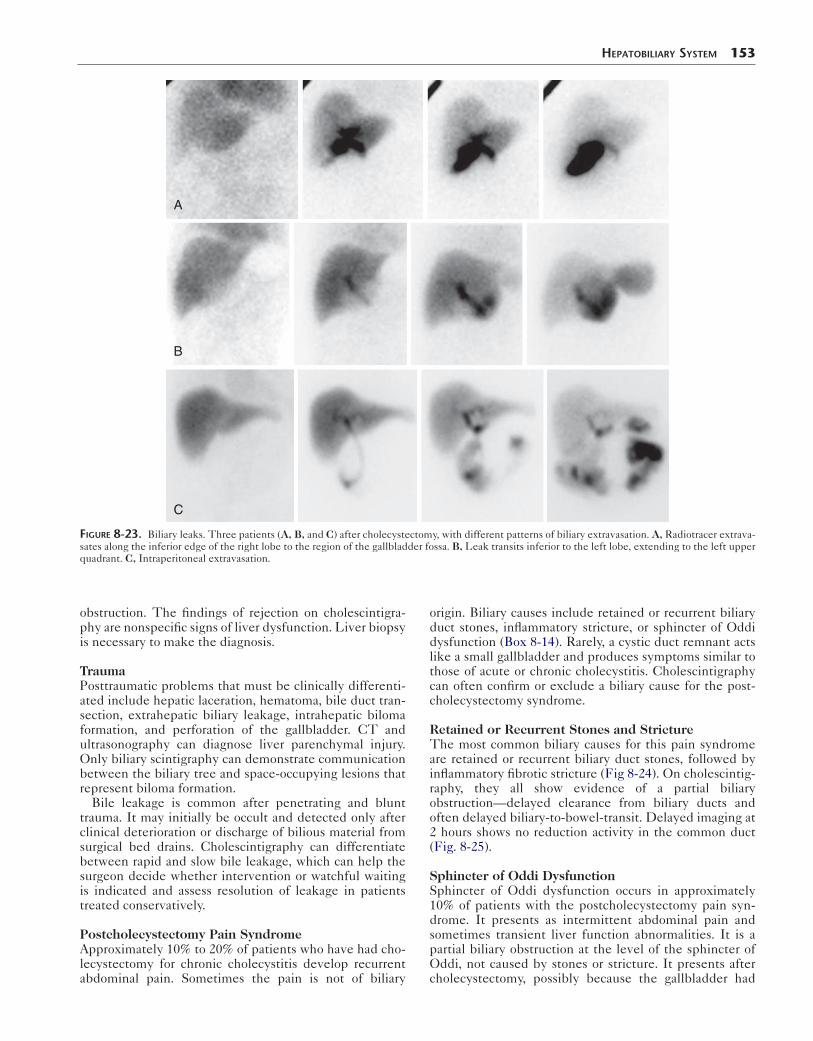
Figure 8-23. Biliary leaks. Three patients (A, B, and C) after cholecystectomy, with different patterns of biliary extravasation. A, Radiotracer extrava-sates along the inferior edge of the right lobe to the region of the gallbladder fossa. B, Leak transits inferior to the left lobe, extending to the left upper quadrant. C, Intraperitoneal extravasation.
obstruction. The findings of rejection on cholescintigra-phy are nonspecific signs of liver dysfunction. Liver biopsy is necessary to make the diagnosis.
TraumaPosttraumatic problems that must be clinically differenti-ated include hepatic laceration, hematoma, bile duct tran-section, extrahepatic biliary leakage, intrahepatic biloma formation, and perforation of the gallbladder. CT and ultrasonography can diagnose liver parenchymal injury. Only biliary scintigraphy can demonstrate communication between the biliary tree and space-occupying lesions that represent biloma formation.
Bile leakage is common after penetrating and blunt trauma. It may initially be occult and detected only after clinical deterioration or discharge of bilious material from surgical bed drains. Cholescintigraphy can differentiate between rapid and slow bile leakage, which can help the surgeon decide whether intervention or watchful waiting is indicated and assess resolution of leakage in patients treated conservatively.
Postcholecystectomy Pain SyndromeApproximately 10% to 20% of patients who have had cho-lecystectomy for chronic cholecystitis develop recurrent abdominal pain. Sometimes the pain is not of biliary
origin. Biliary causes include retained or recurrent biliary duct stones, inflammatory stricture, or sphincter of Oddi dysfunction (Box 8-14). Rarely, a cystic duct remnant acts like a small gallbladder and produces symptoms similar to those of acute or chronic cholecystitis. Cholescintigraphy can often confirm or exclude a biliary cause for the post-cholecystectomy syndrome.
Retained or Recurrent Stones and StrictureThe most common biliary causes for this pain syndrome are retained or recurrent biliary duct stones, followed by inflammatory fibrotic stricture (Fig 8-24). On cholescintig-raphy, they all show evidence of a partial biliary obstruction—delayed clearance from biliary ducts and often delayed biliary-to-bowel-transit. Delayed imaging at 2 hours shows no reduction activity in the common duct (Fig. 8-25).
Sphincter of Oddi DysfunctionSphincter of Oddi dysfunction occurs in approximately 10% of patients with the postcholecystectomy pain syn-drome. It presents as intermittent abdominal pain and sometimes transient liver function abnormalities. It is a partial biliary obstruction at the level of the sphincter of Oddi, not caused by stones or stricture. It presents after cholecystectomy, possibly because the gallbladder had
154 Nuclear Medicine: The Requisites
been acting as a pressure release valve, decompressing the biliary ducts with increases in pressure, preventing pain.
Patients have been classified clinically into 3 categories. In type I, enzyme elevations are seen, with pain episodes and dilated biliary ducts. In type II, either enzyme elevations or dilated biliary ducts occur. Type III presents with only pain. Patients with type I are the most easily diagnosed. Patients with types II and III are more diagnostically challenging; cholescintigraphy may have a role in these cases.
Therapy is usually sphincterotomy, particularly for a fixed obstruction (papillary stenosis), whereas a functional and
Box 8-14. Causes of Postcholecystectomy Pain Syndrome
Retained or recurrent choledocholithiasisInflammatory strictureSphincter of Oddi dysfunctionCystic duct remnant (obstructed/inflamed)Nonhepatobiliary origin
reversible obstruction (biliary dyskinesia) may temporarily respond to drugs (e.g., nifedipine) and toxins (e.g., Botox).
Sonography, CT, and MRCP often are not diagnostic. Sphincter of Oddi manometry has been regarded as the gold standard, with an elevated sphincter pressure (>40 mm Hg) being diagnostic. However, this technique is invasive, not widely available, technically difficult, prone to interpretative errors, and associated with a significant incidence of adverse effects, notably pancreatitis. ERCP is ultimately used to exclude cholelithiasis or stricture; however, it is invasive and associated with a high incidence of postprocedure complications, including pancreatitis.
The value of cholescintigraphy is controversial. Evi-dence-based data are lacking. However, multiple single-center studies have shown it to be useful and is routinely performed at some biliary referral centers. Early studies suggested that image analysis alone can be diagnostic with findings of a partial biliary obstruction—that is, delayed biliary duct clearance at 60 minutes with no further clear-ance between 1 and 2 hours (Fig. 8-25).
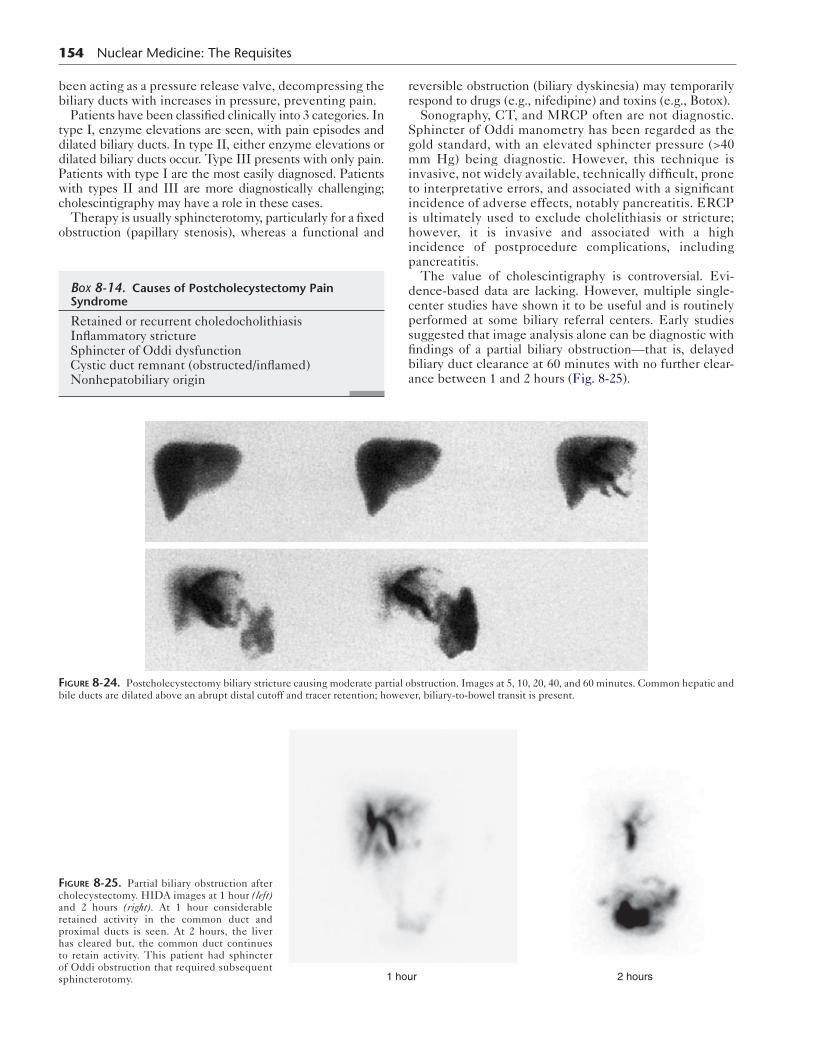
Figure 8-24. Postcholecystectomy biliary stricture causing moderate partial obstruction. Images at 5, 10, 20, 40, and 60 minutes. Common hepatic and bile ducts are dilated above an abrupt distal cutoff and tracer retention; however, biliary-to-bowel transit is present.
Figure 8-25. Partial biliary obstruction after cholecystectomy. HIDA images at 1 hour (left) and 2 hours (right). At 1 hour considerable retained activity in the common duct and proximal ducts is seen. At 2 hours, the liver has cleared but, the common duct continues to retain activity. This patient had sphincter of Oddi obstruction that required subsequent sphincterotomy. 2 hours1 hour
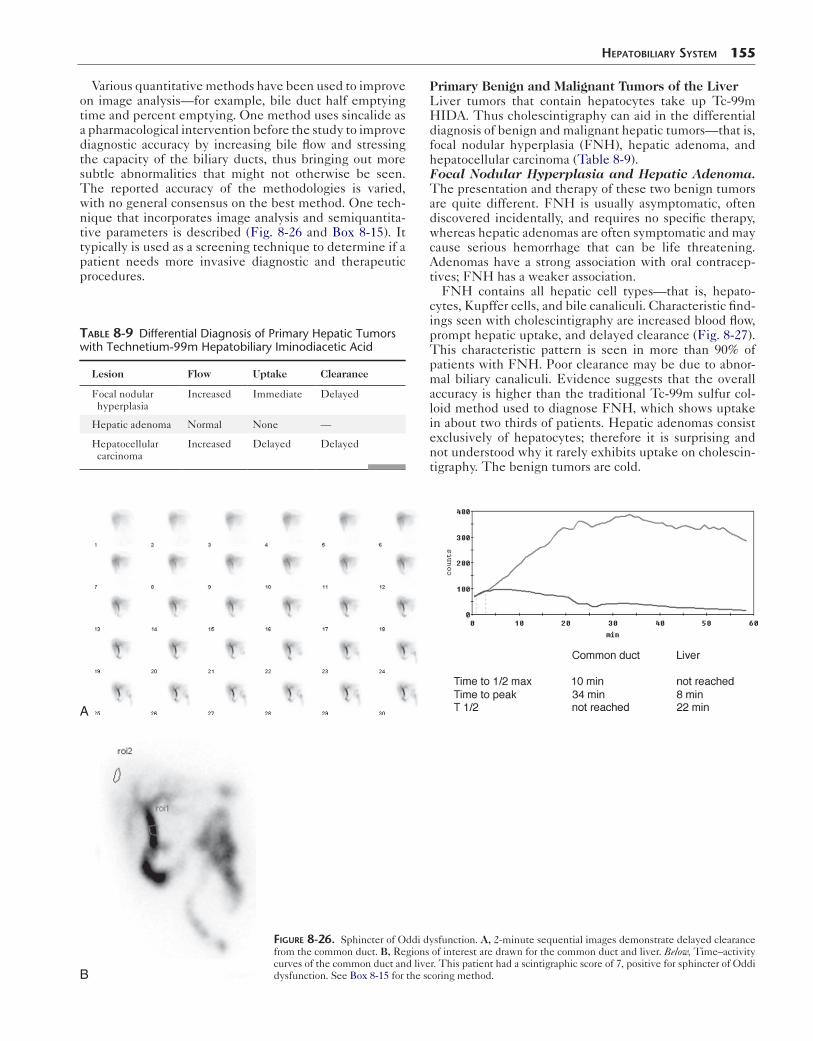
Various quantitative methods have been used to improve on image analysis—for example, bile duct half emptying time and percent emptying. One method uses sincalide as a pharmacological intervention before the study to improve diagnostic accuracy by increasing bile flow and stressing the capacity of the biliary ducts, thus bringing out more subtle abnormalities that might not otherwise be seen. The reported accuracy of the methodologies is varied, with no general consensus on the best method. One tech-nique that incorporates image analysis and semiquantita-tive parameters is described (Fig. 8-26 and Box 8-15). It typically is used as a screening technique to determine if a patient needs more invasive diagnostic and therapeutic procedures.
Table 8-9 Differential Diagnosis of Primary Hepatic Tumors with Technetium-99m Hepatobiliary Iminodiacetic Acid
Lesion Flow Uptake Clearance
Focal nodular hyperplasia
Increased Immediate Delayed
Hepatic adenoma Normal None —
Hepatocellular carcinoma
Increased Delayed Delayed
A
HepaTobiliary SySTem 155
Primary Benign and Malignant Tumors of the LiverLiver tumors that contain hepatocytes take up Tc-99m HIDA. Thus cholescintigraphy can aid in the differential diagnosis of benign and malignant hepatic tumors—that is, focal nodular hyperplasia (FNH), hepatic adenoma, and hepatocellular carcinoma (Table 8-9).Focal Nodular Hyperplasia and Hepatic Adenoma. The presentation and therapy of these two benign tumors are quite different. FNH is usually asymptomatic, often discovered incidentally, and requires no specific therapy, whereas hepatic adenomas are often symptomatic and may cause serious hemorrhage that can be life threatening. Adenomas have a strong association with oral contracep-tives; FNH has a weaker association.
FNH contains all hepatic cell types—that is, hepato-cytes, Kupffer cells, and bile canaliculi. Characteristic find-ings seen with cholescintigraphy are increased blood flow, prompt hepatic uptake, and delayed clearance (Fig. 8-27). This characteristic pattern is seen in more than 90% of patients with FNH. Poor clearance may be due to abnor-mal biliary canaliculi. Evidence suggests that the overall accuracy is higher than the traditional Tc-99m sulfur col-loid method used to diagnose FNH, which shows uptake in about two thirds of patients. Hepatic adenomas consist exclusively of hepatocytes; therefore it is surprising and not understood why it rarely exhibits uptake on cholescin-tigraphy. The benign tumors are cold.
B
Figure 8-26. Sphincter of Oddi dysfunction. A, 2-minute sequential images demonstrate delayed clearance from the common duct. B, Regions of interest are drawn for the common duct and liver. Below, Time–activity curves of the common duct and liver. This patient had a scintigraphic score of 7, positive for sphincter of Oddi dysfunction. See Box 8-15 for the scoring method.
156 Nuclear Medicine: The Requisites
Box 8-15. Sphincter of Oddi Dysfunction: Sincalide and Semiquantification Protocol
PREPARATIONFasting for 2 hours before study
COMPUTER SETUPOne-minute frames × 60
IMAGING PROTOCOL 1. Infuse sincalide 0.02 µg/kg × 10 minutes. 2. Fifteen minutes after sincalide infusion, inject 5
mCi Tc-99m HIDA intravenously. 3. Acquire 1-minute frames × 60 minutes (128 × 128).
COMPUTER PROCESSING ANALYSIS 1. Draw regions of interest around liver and common
duct and derive time–activity curves. 2. Use image analysis for scoring. Time–activity
curves provide ancillary information. Time–activity curves may sometimes help determine time to hepatic peak and percent of common bile duct emptying.
SCINTIGRAPHIC SCORING Score
1. Peak liver uptakea. Less than 10 minutes 0b. 10 minutes or greater 1
2. Time of biliary visualizationa. Less than 15 minutes 0b. Greater than 15 minutes 1
3. Prominence of biliary tracta. Not prominent 0b. Prominence of major extrahepatic ducts
1
c. Prominence of major intrahepatic ducts
2
4. Bowel visualizationa. Less than 15 minutes 0b. 15 to 30 minutes 1c. Greater than 30 minutes 2
5. CBD emptyinga. More than 50% 0b. Less than 50% 1c. No change 2d. Increasing activity 3
6. CBD-to-liver intensity ratioa. CBD60 min ≤ liver60 min 0b. CBD60 min > liver60 min but < liver15 min 1c. CBD60 min > liver60 min and = liver15 min 2d. CBD60 min > both liver60 min and liver15 min
3
TOTAL SCORE___
INTERPRETATIONScore of >5 is consistent with sphincter of Oddi
dysfunction.*
*Sostre S, Kaloo AN, Spiegler EJ, et al. A noninvasive test of sphincter of Oddi dysfunction in postcholecystectomy patients: the scintigraphic score. J Nucl Med. 1992;33(6):1216–1222.CBD, common bile duct.
Hepatocellular Carcinoma. Cholescintigraphy dem-onstrates characteristic findings with hepatocellular carci-noma (hepatoma). The malignant hepatocytes are hypofunctional compared to normal liver. Thus, during the first hour of imaging, no uptake is seen within the lesion (cold defect). Delayed imaging at 2 to 4 hours often shows filling in, or continuing uptake within the tumor, and concomitant clearing of adjacent normal liver (Fig. 8-28). This pattern is very specific for hepatoma. However, poorly differentiated hepatomas may not fill in on delayed imaging. Tc-99m IDA uptake may be seen at sites of hepa-tocellular metastases—for example, in the lung.
Enterogastric Bile RefluxCholescintigraphy can demonstrate bile reflux (Fig. 8-29). Some reflux may be seen in normal subjects on routine cholescintigraphy, particularly if morphine or sincalide has been administered. The more reflux and more persistent it is, the higher the likelihood that it is related to the patient’s symptoms. Quantitative methods for estimating the amount of reflux have been described. Enterograstric reflux can produce an alkaline gastritis, seen most com-monly after gastric resection surgery. Symptoms are often similar to those of acid-related disease.
TECHNETIUM-99M RED BLOOD CELL LIVER SCINTIGRAPHY
Cavernous hemangiomas are the most common benign tumor of the liver and the second most common hepatic tumor, behind liver metastases. They are usually asymptomatic and discovered incidentally on CT or ultrasonography during the workup or staging in a patient with a known primary malig-nancy or during evaluation of unrelated abdominal symptoms or disease. They require no specific therapy but must be dif-ferentiated from other more serious liver tumors.
Normal Hepatic Vascular Anatomy
The liver has a complex vascular system (Fig. 8-30). It receives two thirds to three fourths of its blood supply from the portal vein. The portal vein and hepatic artery flow into the liver sinusoids, which act as the capillary bed for the liver cells. Blood leaves the liver through the cen-tral veins and drain into the hepatic veins, emptying into the inferior vena cava.
Pathology
Cavernous hemangiomas of the liver consist of dilated, endothelium-lined vascular channels of varying sizes sepa-rated by fibrous septa. Histopathologically, they are not related to capillary hemangiomas, angiodysplasia, or infan-tile hemangioendotheliomas. Ten percent are multiple. Lesions larger than 4 cm are called giant cavernous hemangiomas.
Diagnostic Imaging
Noninvasive diagnosis of cavernous hemangioma of the liver can obviate the need for biopsy, which may result in hemorrhage and significant morbidity.
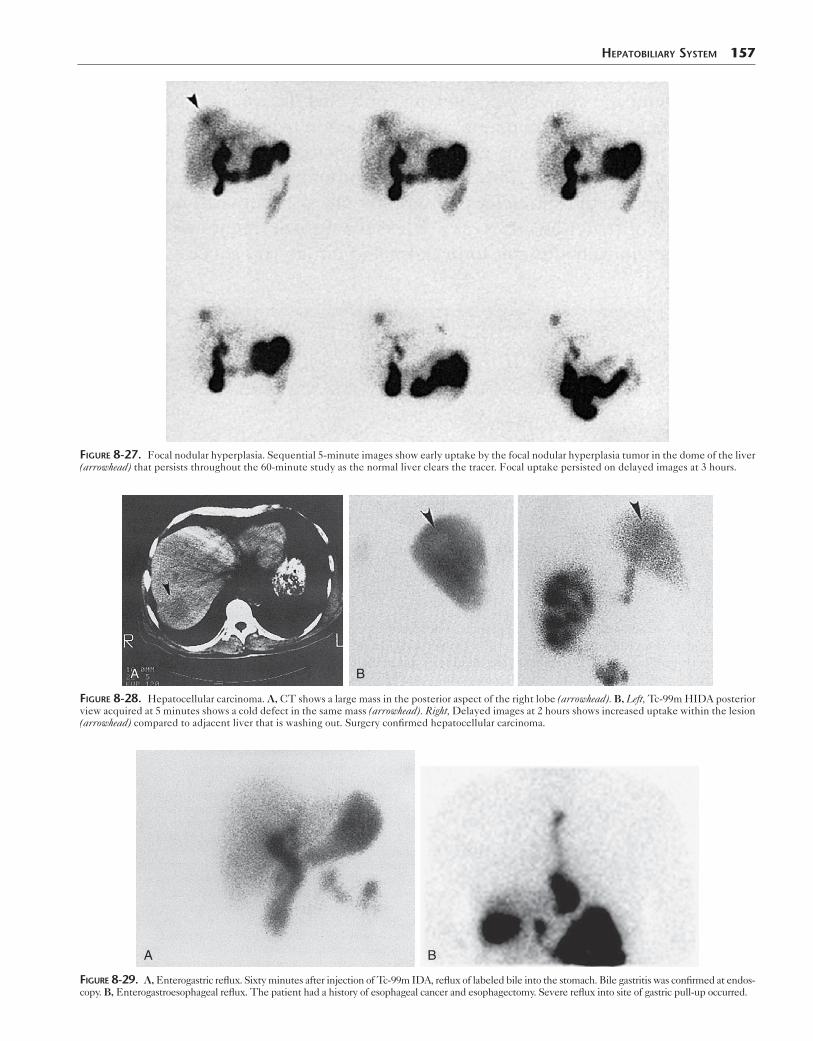
HepaTobiliary SySTem 157
Figure 8-27. Focal nodular hyperplasia. Sequential 5-minute images show early uptake by the focal nodular hyperplasia tumor in the dome of the liver (arrowhead) that persists throughout the 60-minute study as the normal liver clears the tracer. Focal uptake persisted on delayed images at 3 hours.
AA B
Figure 8-28. Hepatocellular carcinoma. A, CT shows a large mass in the posterior aspect of the right lobe (arrowhead). B, Left, Tc-99m HIDA posterior view acquired at 5 minutes shows a cold defect in the same mass (arrowhead). Right, Delayed images at 2 hours shows increased uptake within the lesion (arrowhead) compared to adjacent liver that is washing out. Surgery confirmed hepatocellular carcinoma.
BA
Figure 8-29. A, Enterogastric reflux. Sixty minutes after injection of Tc-99m IDA, reflux of labeled bile into the stomach. Bile gastritis was confirmed at endos-copy. B, Enterogastroesophageal reflux. The patient had a history of esophageal cancer and esophagectomy. Severe reflux into site of gastric pull-up occurred.
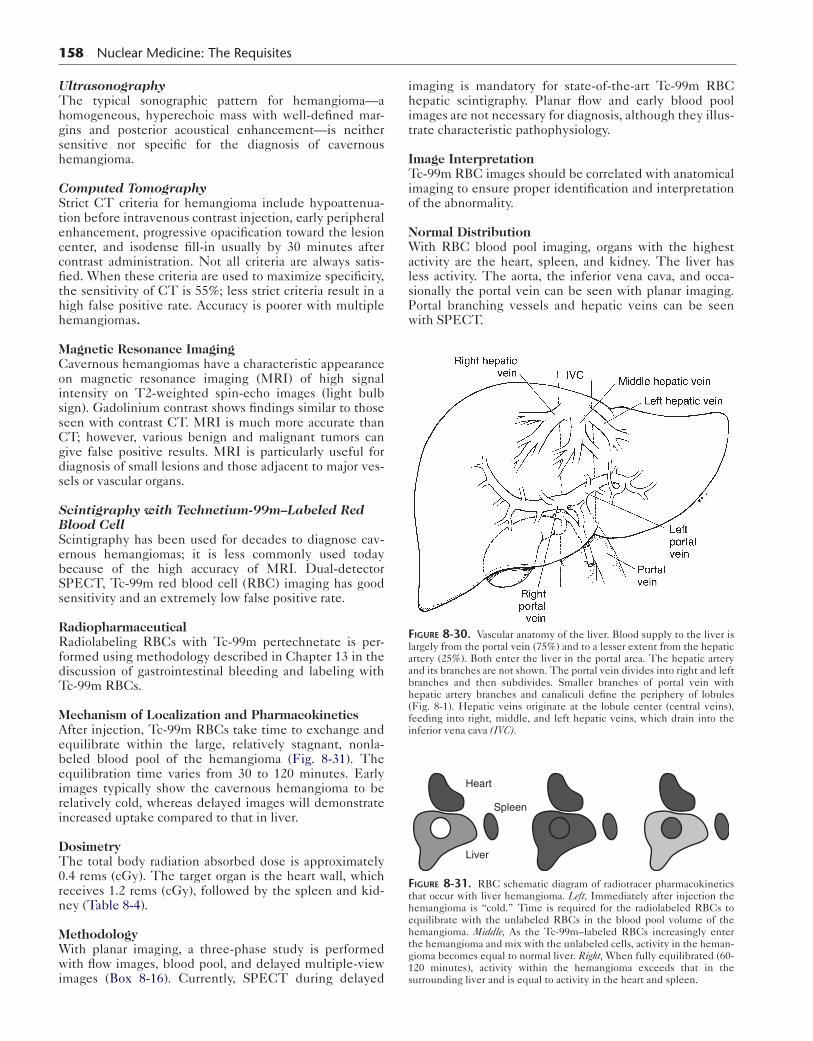
158 Nuclear Medicine: The Requisites
UltrasonographyThe typical sonographic pattern for hemangioma—a homogeneous, hyperechoic mass with well-defined mar-gins and posterior acoustical enhancement—is neither sensitive nor specific for the diagnosis of cavernous hemangioma.
Computed TomographyStrict CT criteria for hemangioma include hypoattenua-tion before intravenous contrast injection, early peripheral enhancement, progressive opacification toward the lesion center, and isodense fill-in usually by 30 minutes after contrast administration. Not all criteria are always satis-fied. When these criteria are used to maximize specificity, the sensitivity of CT is 55%; less strict criteria result in a high false positive rate. Accuracy is poorer with multiple hemangiomas.
Magnetic Resonance ImagingCavernous hemangiomas have a characteristic appearance on magnetic resonance imaging (MRI) of high signal intensity on T2-weighted spin-echo images (light bulb sign). Gadolinium contrast shows findings similar to those seen with contrast CT. MRI is much more accurate than CT; however, various benign and malignant tumors can give false positive results. MRI is particularly useful for diagnosis of small lesions and those adjacent to major ves-sels or vascular organs.
Scintigraphy with Technetium-99m–Labeled Red Blood CellScintigraphy has been used for decades to diagnose cav-ernous hemangiomas; it is less commonly used today because of the high accuracy of MRI. Dual-detector SPECT, Tc-99m red blood cell (RBC) imaging has good sensitivity and an extremely low false positive rate.
RadiopharmaceuticalRadiolabeling RBCs with Tc-99m pertechnetate is per-formed using methodology described in Chapter 13 in the discussion of gastrointestinal bleeding and labeling with Tc-99m RBCs.
Mechanism of Localization and PharmacokineticsAfter injection, Tc-99m RBCs take time to exchange and equilibrate within the large, relatively stagnant, nonla-beled blood pool of the hemangioma (Fig. 8-31). The equilibration time varies from 30 to 120 minutes. Early images typically show the cavernous hemangioma to be relatively cold, whereas delayed images will demonstrate increased uptake compared to that in liver.
DosimetryThe total body radiation absorbed dose is approximately 0.4 rems (cGy). The target organ is the heart wall, which receives 1.2 rems (cGy), followed by the spleen and kid-ney (Table 8-4).
MethodologyWith planar imaging, a three-phase study is performed with flow images, blood pool, and delayed multiple-view images (Box 8-16). Currently, SPECT during delayed
imaging is mandatory for state-of-the-art Tc-99m RBC hepatic scintigraphy. Planar flow and early blood pool images are not necessary for diagnosis, although they illus-trate characteristic pathophysiology.
Image InterpretationTc-99m RBC images should be correlated with anatomical imaging to ensure proper identification and interpretation of the abnormality.
Normal DistributionWith RBC blood pool imaging, organs with the highest activity are the heart, spleen, and kidney. The liver has less activity. The aorta, the inferior vena cava, and occa-sionally the portal vein can be seen with planar imaging. Portal branching vessels and hepatic veins can be seen with SPECT.
Figure 8-30. Vascular anatomy of the liver. Blood supply to the liver is largely from the portal vein (75%) and to a lesser extent from the hepatic artery (25%). Both enter the liver in the portal area. The hepatic artery and its branches are not shown. The portal vein divides into right and left branches and then subdivides. Smaller branches of portal vein with hepatic artery branches and canaliculi define the periphery of lobules (Fig. 8-1). Hepatic veins originate at the lobule center (central veins), feeding into right, middle, and left hepatic veins, which drain into the inferior vena cava (IVC).
Heart
Liver
Spleen
Figure 8-31. RBC schematic diagram of radiotracer pharmacokinetics that occur with liver hemangioma. Left, Immediately after injection the hemangioma is “cold.” Time is required for the radiolabeled RBCs to equilibrate with the unlabeled RBCs in the blood pool volume of the hemangioma. Middle, As the Tc-99m–labeled RBCs increasingly enter the hemangioma and mix with the unlabeled cells, activity in the heman-gioma becomes equal to normal liver. Right, When fully equilibrated (60-120 minutes), activity within the hemangioma exceeds that in the surrounding liver and is equal to activity in the heart and spleen.
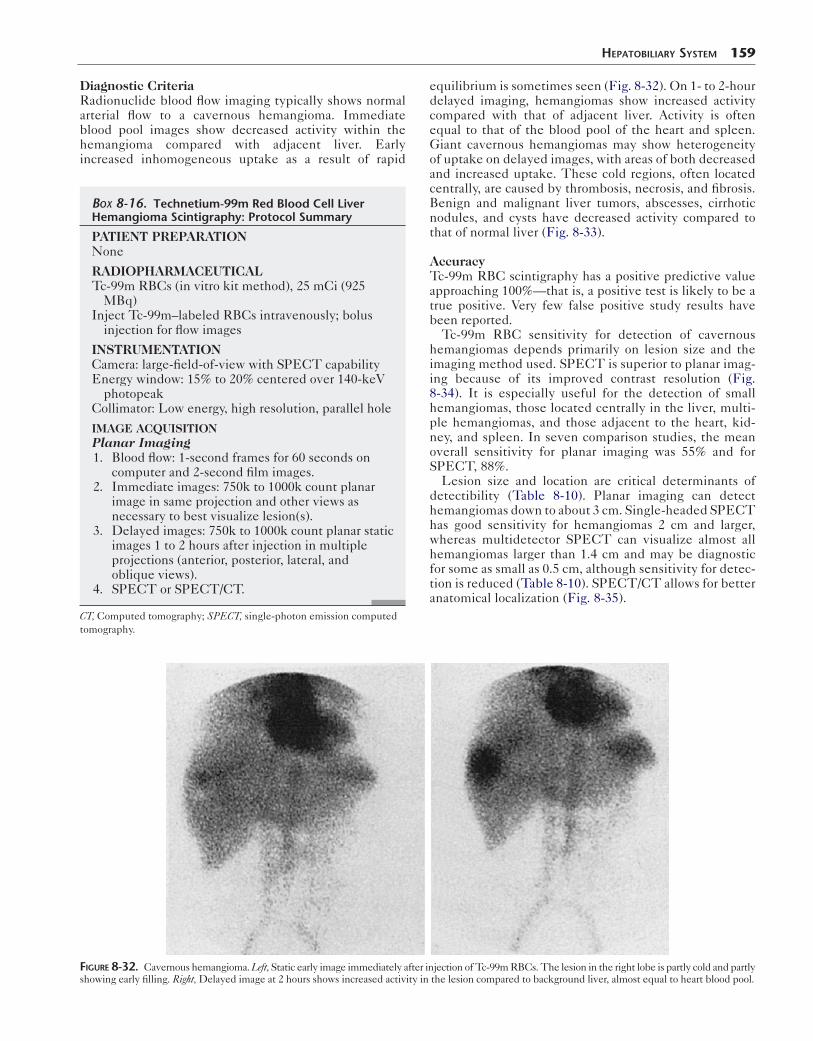
Diagnostic CriteriaRadionuclide blood flow imaging typically shows normal arterial flow to a cavernous hemangioma. Immediate blood pool images show decreased activity within the hemangioma compared with adjacent liver. Early increased inhomogeneous uptake as a result of rapid
Box 8-16. Technetium-99m Red Blood Cell Liver Hemangioma Scintigraphy: Protocol Summary
PATIENT PREPARATIONNone
RADIOPHARMACEUTICALTc-99m RBCs (in vitro kit method), 25 mCi (925
MBq)Inject Tc-99m–labeled RBCs intravenously; bolus
injection for flow images
INSTRUMENTATIONCamera: large-field-of-view with SPECT capabilityEnergy window: 15% to 20% centered over 140-keV
photopeakCollimator: Low energy, high resolution, parallel hole
IMAGE ACQUISITIONPlanar Imaging 1. Blood flow: 1-second frames for 60 seconds on
computer and 2-second film images. 2. Immediate images: 750k to 1000k count planar
image in same projection and other views as necessary to best visualize lesion(s).
3. Delayed images: 750k to 1000k count planar static images 1 to 2 hours after injection in multiple projections (anterior, posterior, lateral, and oblique views).
4. SPECT or SPECT/CT.
CT, Computed tomography; SPECT, single-photon emission computed tomography.
HepaTobiliary SySTem 159
equilibrium is sometimes seen (Fig. 8-32). On 1- to 2-hour delayed imaging, hemangiomas show increased activity compared with that of adjacent liver. Activity is often equal to that of the blood pool of the heart and spleen. Giant cavernous hemangiomas may show heterogeneity of uptake on delayed images, with areas of both decreased and increased uptake. These cold regions, often located centrally, are caused by thrombosis, necrosis, and fibrosis. Benign and malignant liver tumors, abscesses, cirrhotic nodules, and cysts have decreased activity compared to that of normal liver (Fig. 8-33).
AccuracyTc-99m RBC scintigraphy has a positive predictive value approaching 100%—that is, a positive test is likely to be a true positive. Very few false positive study results have been reported.
Tc-99m RBC sensitivity for detection of cavernous hemangiomas depends primarily on lesion size and the imaging method used. SPECT is superior to planar imag-ing because of its improved contrast resolution (Fig. 8-34). It is especially useful for the detection of small hemangiomas, those located centrally in the liver, multi-ple hemangiomas, and those adjacent to the heart, kid-ney, and spleen. In seven comparison studies, the mean overall sensitivity for planar imaging was 55% and for SPECT, 88%.
Lesion size and location are critical determinants of detectibility (Table 8-10). Planar imaging can detect hemangiomas down to about 3 cm. Single-headed SPECT has good sensitivity for hemangiomas 2 cm and larger, whereas multidetector SPECT can visualize almost all hemangiomas larger than 1.4 cm and may be diagnostic for some as small as 0.5 cm, although sensitivity for detec-tion is reduced (Table 8-10). SPECT/CT allows for better anatomical localization (Fig. 8-35).
Figure 8-32. Cavernous hemangioma. Left, Static early image immediately after injection of Tc-99m RBCs. The lesion in the right lobe is partly cold and partly showing early filling. Right, Delayed image at 2 hours shows increased activity in the lesion compared to background liver, almost equal to heart blood pool.

160 Nuclear Medicine: The Requisites
AA B
Figure 8-33. Negative Tc-99m RBC study for hemangioma. A, CT scan shows a large lesion in right lobe of the liver. B, Planar Tc-99m RBC scan is cold in the same region and negative for hemangioma. The diagnosis was metastatic colon cancer.
A
H
B
A
Figure 8-34. Improved visualization of hemangioma with SPECT. A, Left, Immediate postinjection planar image shows neither decreased nor increased uptake, probably because of small lesion size. Right, After 1.5-hour delay, planar study shows mildly increased focal uptake in the liver dome. B, SPECT coronal (left) and transverse (right) sections are strongly positive for hemangioma with high target-to-background ratio. A, Aorta; H, heart.
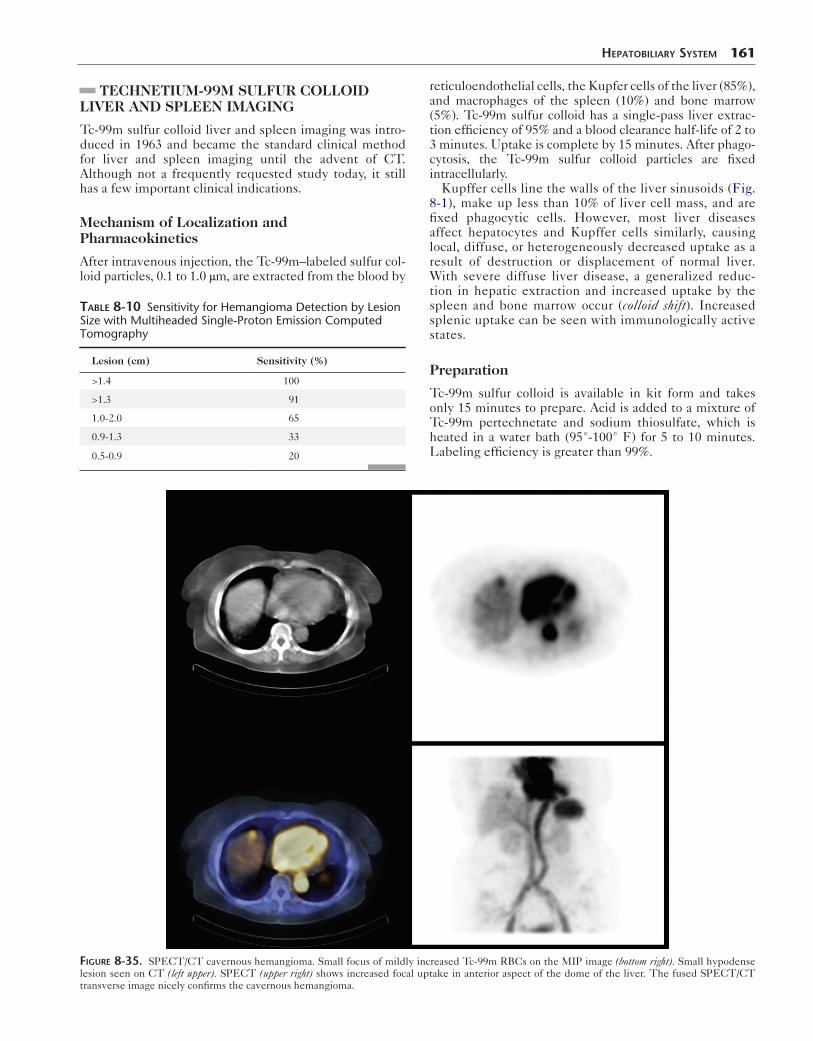
TECHNETIUM-99M SULFUR COLLOID LIVER AND SPLEEN IMAGING
Tc-99m sulfur colloid liver and spleen imaging was intro-duced in 1963 and became the standard clinical method for liver and spleen imaging until the advent of CT. Although not a frequently requested study today, it still has a few important clinical indications.
Mechanism of Localization and Pharmacokinetics
After intravenous injection, the Tc-99m–labeled sulfur col-loid particles, 0.1 to 1.0 μm, are extracted from the blood by
Table 8-10 Sensitivity for Hemangioma Detection by Lesion Size with Multiheaded Single-Proton Emission Computed Tomography
Lesion (cm) Sensitivity (%)
>1.4 100
>1.3 91
1.0-2.0 65
0.9-1.3 33
0.5-0.9 20
HepaTobiliary SySTem 161
reticuloendothelial cells, the Kupfer cells of the liver (85%), and macrophages of the spleen (10%) and bone marrow (5%). Tc-99m sulfur colloid has a single-pass liver extrac-tion efficiency of 95% and a blood clearance half-life of 2 to 3 minutes. Uptake is complete by 15 minutes. After phago-cytosis, the Tc-99m sulfur colloid particles are fixed intracellularly.
Kupffer cells line the walls of the liver sinusoids (Fig. 8-1), make up less than 10% of liver cell mass, and are fixed phagocytic cells. However, most liver diseases affect hepatocytes and Kupffer cells similarly, causing local, diffuse, or heterogeneously decreased uptake as a result of destruction or displacement of normal liver. With severe diffuse liver disease, a generalized reduc-tion in hepatic extraction and increased uptake by the spleen and bone marrow occur (colloid shift). Increased splenic uptake can be seen with immunologically active states.
Preparation
Tc-99m sulfur colloid is available in kit form and takes only 15 minutes to prepare. Acid is added to a mixture of Tc-99m pertechnetate and sodium thiosulfate, which is heated in a water bath (95°-100° F) for 5 to 10 minutes. Labeling efficiency is greater than 99%.
Figure 8-35. SPECT/CT cavernous hemangioma. Small focus of mildly increased Tc-99m RBCs on the MIP image (bottom right). Small hypodense lesion seen on CT (left upper). SPECT (upper right) shows increased focal uptake in anterior aspect of the dome of the liver. The fused SPECT/CT transverse image nicely confirms the cavernous hemangioma.
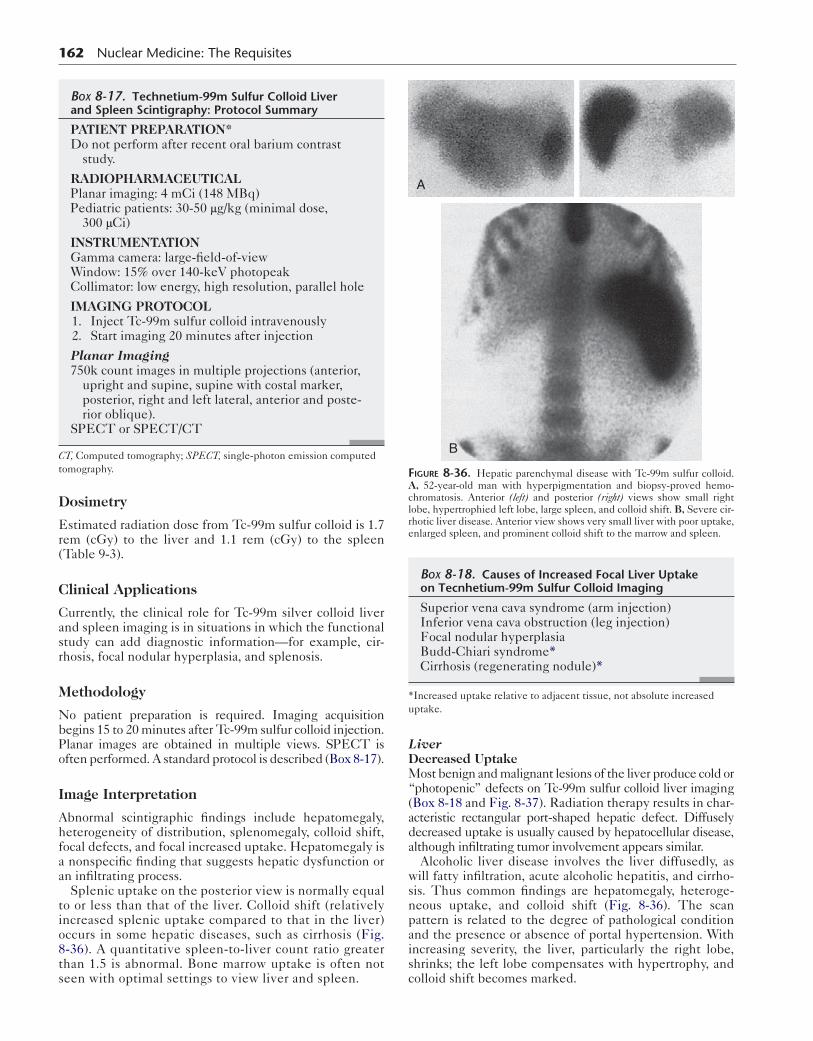
162 Nuclear Medicine: The Requisites
Dosimetry
Estimated radiation dose from Tc-99m sulfur colloid is 1.7 rem (cGy) to the liver and 1.1 rem (cGy) to the spleen (Table 9-3).
Clinical Applications
Currently, the clinical role for Tc-99m silver colloid liver and spleen imaging is in situations in which the functional study can add diagnostic information—for example, cir-rhosis, focal nodular hyperplasia, and splenosis.
Methodology
No patient preparation is required. Imaging acquisition begins 15 to 20 minutes after Tc-99m sulfur colloid injection. Planar images are obtained in multiple views. SPECT is often performed. A standard protocol is described (Box 8-17).
Image Interpretation
Abnormal scintigraphic findings include hepatomegaly, heterogeneity of distribution, splenomegaly, colloid shift, focal defects, and focal increased uptake. Hepatomegaly is a nonspecific finding that suggests hepatic dysfunction or an infiltrating process.
Splenic uptake on the posterior view is normally equal to or less than that of the liver. Colloid shift (relatively increased splenic uptake compared to that in the liver) occurs in some hepatic diseases, such as cirrhosis (Fig. 8-36). A quantitative spleen-to-liver count ratio greater than 1.5 is abnormal. Bone marrow uptake is often not seen with optimal settings to view liver and spleen.
Box 8-17. Technetium-99m Sulfur Colloid Liver and Spleen Scintigraphy: Protocol Summary
PATIENT PREPARATION*Do not perform after recent oral barium contrast
study.
RADIOPHARMACEUTICALPlanar imaging: 4 mCi (148 MBq)Pediatric patients: 30-50 μg/kg (minimal dose,
300 μCi)
INSTRUMENTATIONGamma camera: large-field-of-viewWindow: 15% over 140-keV photopeakCollimator: low energy, high resolution, parallel hole
IMAGING PROTOCOL 1. Inject Tc-99m sulfur colloid intravenously 2. Start imaging 20 minutes after injection
Planar Imaging750k count images in multiple projections (anterior,
upright and supine, supine with costal marker, posterior, right and left lateral, anterior and poste-rior oblique).
SPECT or SPECT/CT
CT, Computed tomography; SPECT, single-photon emission computed tomography.
LiverDecreased UptakeMost benign and malignant lesions of the liver produce cold or “photopenic” defects on Tc-99m sulfur colloid liver imaging (Box 8-18 and Fig. 8-37). Radiation therapy results in char-acteristic rectangular port-shaped hepatic defect. Diffusely decreased uptake is usually caused by hepatocellular disease, although infiltrating tumor involvement appears similar.
Alcoholic liver disease involves the liver diffusedly, as will fatty infiltration, acute alcoholic hepatitis, and cirrho-sis. Thus common findings are hepatomegaly, heteroge-neous uptake, and colloid shift (Fig. 8-36). The scan pattern is related to the degree of pathological condition and the presence or absence of portal hypertension. With increasing severity, the liver, particularly the right lobe, shrinks; the left lobe compensates with hypertrophy, and colloid shift becomes marked.
A
B
Figure 8-36. Hepatic parenchymal disease with Tc-99m sulfur colloid. A, 52-year-old man with hyperpigmentation and biopsy-proved hemo-chromatosis. Anterior (left) and posterior (right) views show small right lobe, hypertrophied left lobe, large spleen, and colloid shift. B, Severe cir-rhotic liver disease. Anterior view shows very small liver with poor uptake, enlarged spleen, and prominent colloid shift to the marrow and spleen.
Box 8-18. Causes of Increased Focal Liver Uptake on Tecnhetium-99m Sulfur Colloid Imaging
Superior vena cava syndrome (arm injection)Inferior vena cava obstruction (leg injection)Focal nodular hyperplasiaBudd-Chiari syndrome*Cirrhosis (regenerating nodule)*
*Increased uptake relative to adjacent tissue, not absolute increased uptake.
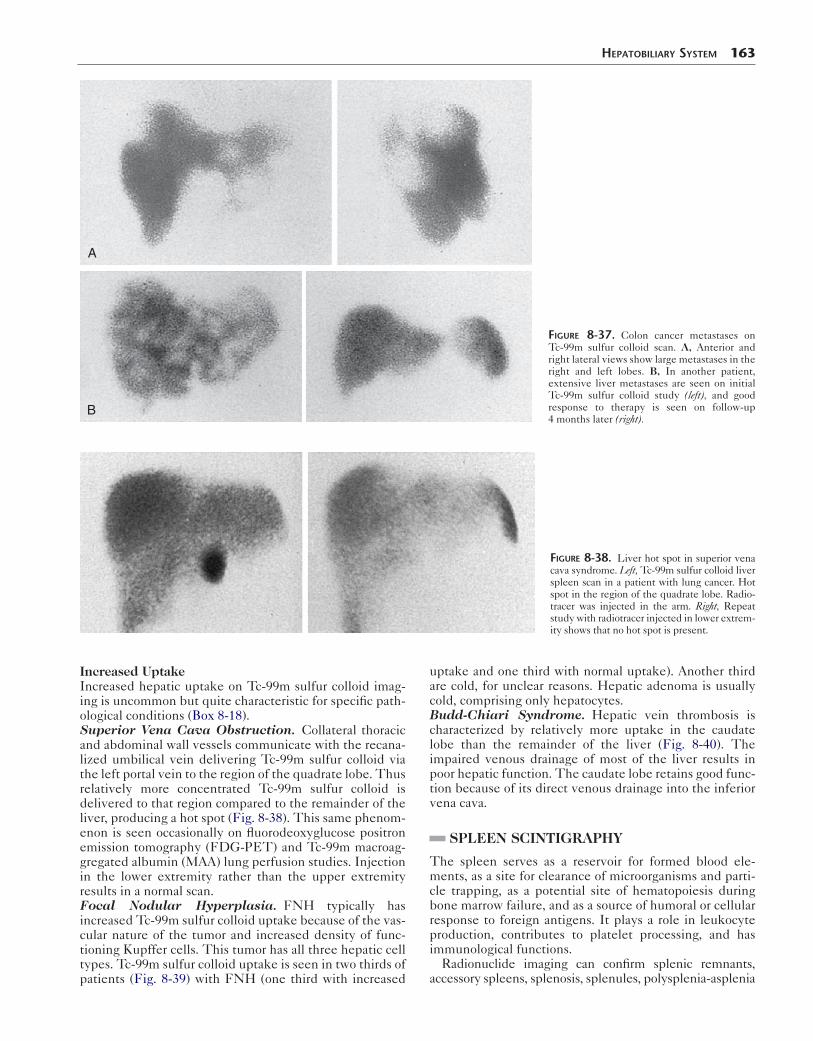
HepaTobiliary SySTem 163
A
B
Figure 8-37. Colon cancer metastases on Tc-99m sulfur colloid scan. A, Anterior and right lateral views show large metastases in the right and left lobes. B, In another patient, extensive liver metastases are seen on initial Tc-99m sulfur colloid study (left), and good response to therapy is seen on follow-up 4 months later (right).
Figure 8-38. Liver hot spot in superior vena cava syndrome. Left, Tc-99m sulfur colloid liver spleen scan in a patient with lung cancer. Hot spot in the region of the quadrate lobe. Radio-tracer was injected in the arm. Right, Repeat study with radiotracer injected in lower extrem-ity shows that no hot spot is present.
Increased UptakeIncreased hepatic uptake on Tc-99m sulfur colloid imag-ing is uncommon but quite characteristic for specific path-ological conditions (Box 8-18).Superior Vena Cava Obstruction. Collateral thoracic and abdominal wall vessels communicate with the recana-lized umbilical vein delivering Tc-99m sulfur colloid via the left portal vein to the region of the quadrate lobe. Thus relatively more concentrated Tc-99m sulfur colloid is delivered to that region compared to the remainder of the liver, producing a hot spot (Fig. 8-38). This same phenom-enon is seen occasionally on fluorodeoxyglucose positron emission tomography (FDG-PET) and Tc-99m macroag-gregated albumin (MAA) lung perfusion studies. Injection in the lower extremity rather than the upper extremity results in a normal scan.Focal Nodular Hyperplasia. FNH typically has increased Tc-99m sulfur colloid uptake because of the vas-cular nature of the tumor and increased density of func-tioning Kupffer cells. This tumor has all three hepatic cell types. Tc-99m sulfur colloid uptake is seen in two thirds of patients (Fig. 8-39) with FNH (one third with increased
uptake and one third with normal uptake). Another third are cold, for unclear reasons. Hepatic adenoma is usually cold, comprising only hepatocytes.Budd-Chiari Syndrome. Hepatic vein thrombosis is characterized by relatively more uptake in the caudate lobe than the remainder of the liver (Fig. 8-40). The impaired venous drainage of most of the liver results in poor hepatic function. The caudate lobe retains good func-tion because of its direct venous drainage into the inferior vena cava.
SPLEEN SCINTIGRAPHY
The spleen serves as a reservoir for formed blood ele-ments, as a site for clearance of microorganisms and parti-cle trapping, as a potential site of hematopoiesis during bone marrow failure, and as a source of humoral or cellular response to foreign antigens. It plays a role in leukocyte production, contributes to platelet processing, and has immunological functions.
Radionuclide imaging can confirm splenic remnants, accessory spleens, splenosis, splenules, polysplenia-asplenia
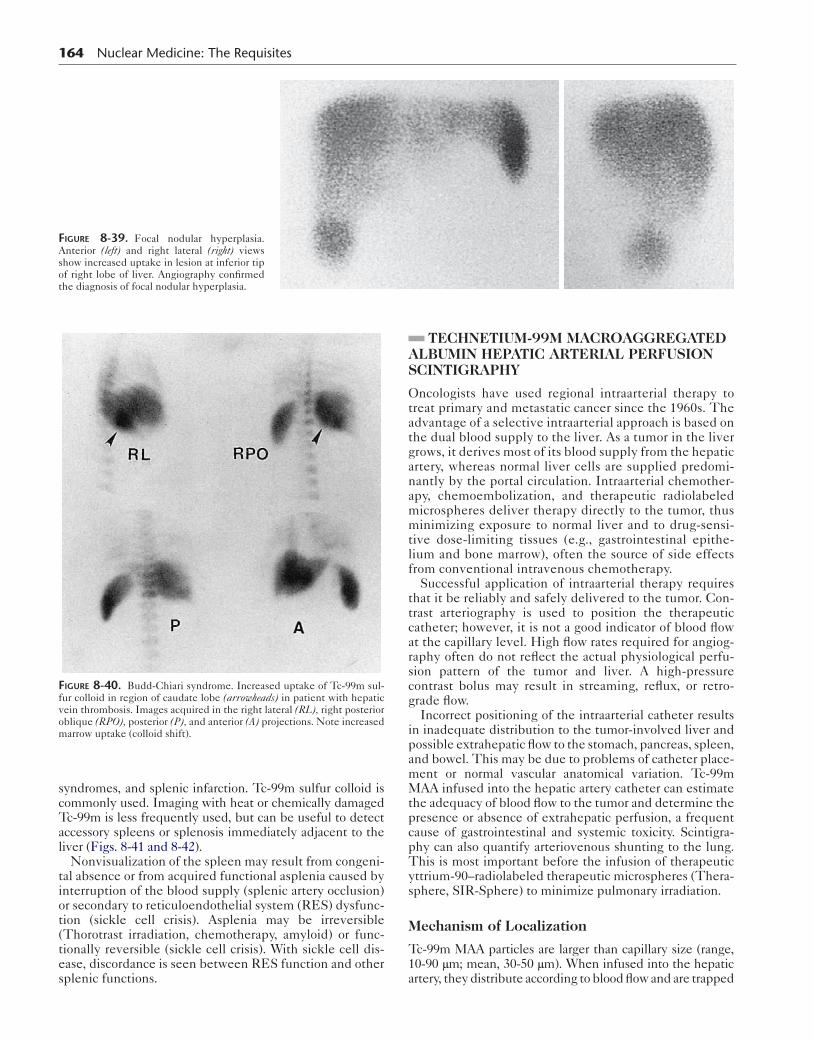
164 Nuclear Medicine: The Requisites
Figure 8-39. Focal nodular hyperplasia. Anterior (left) and right lateral (right) views show increased uptake in lesion at inferior tip of right lobe of liver. Angiography confirmed the diagnosis of focal nodular hyperplasia.
syndromes, and splenic infarction. Tc-99m sulfur colloid is commonly used. Imaging with heat or chemically damaged Tc-99m is less frequently used, but can be useful to detect accessory spleens or splenosis immediately adjacent to the liver (Figs. 8-41 and 8-42).
Nonvisualization of the spleen may result from congeni-tal absence or from acquired functional asplenia caused by interruption of the blood supply (splenic artery occlusion) or secondary to reticuloendothelial system (RES) dysfunc-tion (sickle cell crisis). Asplenia may be irreversible (Thorotrast irradiation, chemotherapy, amyloid) or func-tionally reversible (sickle cell crisis). With sickle cell dis-ease, discordance is seen between RES function and other splenic functions.
Figure 8-40. Budd-Chiari syndrome. Increased uptake of Tc-99m sul-fur colloid in region of caudate lobe (arrowheads) in patient with hepatic vein thrombosis. Images acquired in the right lateral (RL), right posterior oblique (RPO), posterior (P), and anterior (A) projections. Note increased marrow uptake (colloid shift).
TECHNETIUM-99M MACROAGGREGATED ALBUMIN HEPATIC ARTERIAL PERFUSION SCINTIGRAPHY
Oncologists have used regional intraarterial therapy to treat primary and metastatic cancer since the 1960s. The advantage of a selective intraarterial approach is based on the dual blood supply to the liver. As a tumor in the liver grows, it derives most of its blood supply from the hepatic artery, whereas normal liver cells are supplied predomi-nantly by the portal circulation. Intraarterial chemother-apy, chemoembolization, and therapeutic radiolabeled microspheres deliver therapy directly to the tumor, thus minimizing exposure to normal liver and to drug-sensi-tive dose-limiting tissues (e.g., gastrointestinal epithe-lium and bone marrow), often the source of side effects from conventional intravenous chemotherapy.
Successful application of intraarterial therapy requires that it be reliably and safely delivered to the tumor. Con-trast arteriography is used to position the therapeutic catheter; however, it is not a good indicator of blood flow at the capillary level. High flow rates required for angiog-raphy often do not reflect the actual physiological perfu-sion pattern of the tumor and liver. A high-pressure contrast bolus may result in streaming, reflux, or retro-grade flow.
Incorrect positioning of the intraarterial catheter results in inadequate distribution to the tumor-involved liver and possible extrahepatic flow to the stomach, pancreas, spleen, and bowel. This may be due to problems of catheter place-ment or normal vascular anatomical variation. Tc-99m MAA infused into the hepatic artery catheter can estimate the adequacy of blood flow to the tumor and determine the presence or absence of extrahepatic perfusion, a frequent cause of gastrointestinal and systemic toxicity. Scintigra-phy can also quantify arteriovenous shunting to the lung. This is most important before the infusion of therapeutic yttrium-90–radiolabeled therapeutic microspheres (Thera-sphere, SIR-Sphere) to minimize pulmonary irradiation.
Mechanism of Localization
Tc-99m MAA particles are larger than capillary size (range, 10-90 μm; mean, 30-50 μm). When infused into the hepatic artery, they distribute according to blood flow and are trapped
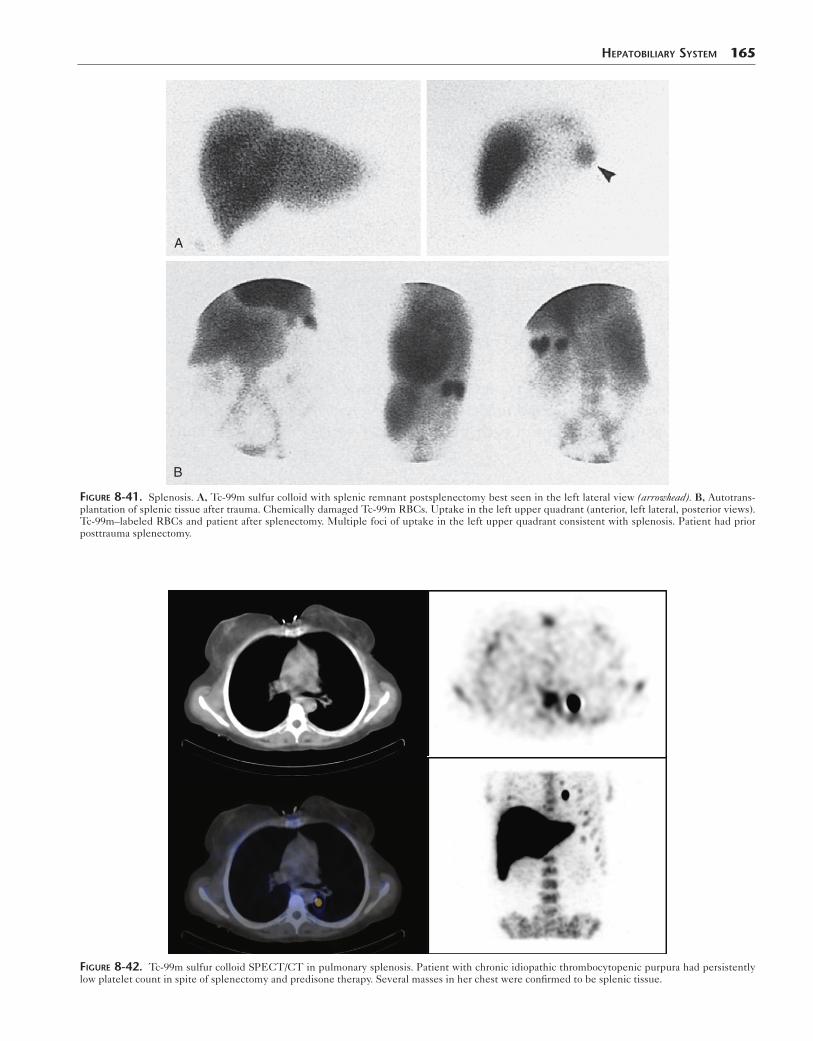
HepaTobiliary SySTem 165
A
B
Figure 8-41. Splenosis. A, Tc-99m sulfur colloid with splenic remnant postsplenectomy best seen in the left lateral view (arrowhead). B, Autotrans-plantation of splenic tissue after trauma. Chemically damaged Tc-99m RBCs. Uptake in the left upper quadrant (anterior, left lateral, posterior views). Tc-99m–labeled RBCs and patient after splenectomy. Multiple foci of uptake in the left upper quadrant consistent with splenosis. Patient had prior posttrauma splenectomy.
Figure 8-42. Tc-99m sulfur colloid SPECT/CT in pulmonary splenosis. Patient with chronic idiopathic thrombocytopenic purpura had persistently low platelet count in spite of splenectomy and predisone therapy. Several masses in her chest were confirmed to be splenic tissue.
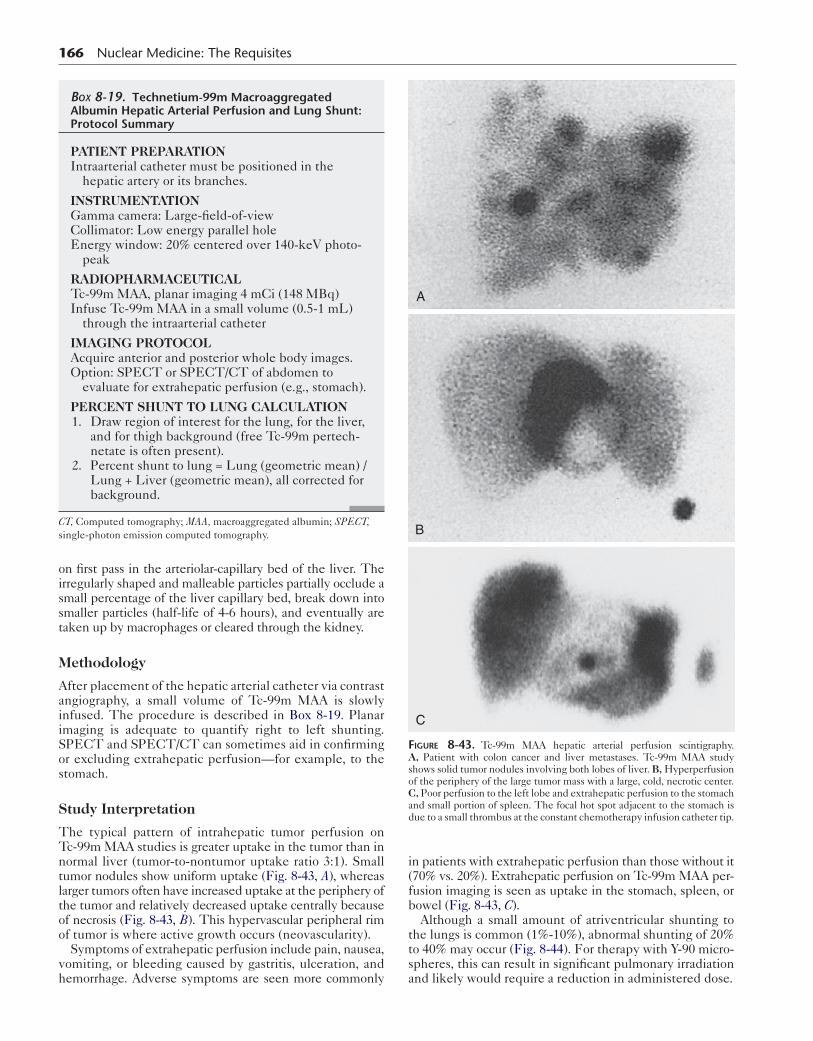
166 Nuclear Medicine: The Requisites
on first pass in the arteriolar-capillary bed of the liver. The irregularly shaped and malleable particles partially occlude a small percentage of the liver capillary bed, break down into smaller particles (half-life of 4-6 hours), and eventually are taken up by macrophages or cleared through the kidney.
Methodology
After placement of the hepatic arterial catheter via contrast angiography, a small volume of Tc-99m MAA is slowly infused. The procedure is described in Box 8-19. Planar imaging is adequate to quantify right to left shunting. SPECT and SPECT/CT can sometimes aid in confirming or excluding extrahepatic perfusion—for example, to the stomach.
Study Interpretation
The typical pattern of intrahepatic tumor perfusion on Tc-99m MAA studies is greater uptake in the tumor than in normal liver (tumor-to-nontumor uptake ratio 3:1). Small tumor nodules show uniform uptake (Fig. 8-43, A), whereas larger tumors often have increased uptake at the periphery of the tumor and relatively decreased uptake centrally because of necrosis (Fig. 8-43, B). This hypervascular peripheral rim of tumor is where active growth occurs (neovascularity).
Symptoms of extrahepatic perfusion include pain, nausea, vomiting, or bleeding caused by gastritis, ulceration, and hemorrhage. Adverse symptoms are seen more commonly
Box 8-19. Technetium-99m Macroaggregated Albumin Hepatic Arterial Perfusion and Lung Shunt: Protocol Summary
PATIENT PREPARATIONIntraarterial catheter must be positioned in the
hepatic artery or its branches.
INSTRUMENTATIONGamma camera: Large-field-of-viewCollimator: Low energy parallel holeEnergy window: 20% centered over 140-keV photo-
peak
RADIOPHARMACEUTICALTc-99m MAA, planar imaging 4 mCi (148 MBq)Infuse Tc-99m MAA in a small volume (0.5-1 mL)
through the intraarterial catheter
IMAGING PROTOCOLAcquire anterior and posterior whole body images.Option: SPECT or SPECT/CT of abdomen to
evaluate for extrahepatic perfusion (e.g., stomach).
PERCENT SHUNT TO LUNG CALCULATION 1. Draw region of interest for the lung, for the liver,
and for thigh background (free Tc-99m pertech-netate is often present).
2. Percent shunt to lung = Lung (geometric mean) / Lung + Liver (geometric mean), all corrected for background.
CT, Computed tomography; MAA, macroaggregated albumin; SPECT, single-photon emission computed tomography.
in patients with extrahepatic perfusion than those without it (70% vs. 20%). Extrahepatic perfusion on Tc-99m MAA per-fusion imaging is seen as uptake in the stomach, spleen, or bowel (Fig. 8-43, C).
Although a small amount of atriventricular shunting to the lungs is common (1%-10%), abnormal shunting of 20% to 40% may occur (Fig. 8-44). For therapy with Y-90 micro-spheres, this can result in significant pulmonary irradiation and likely would require a reduction in administered dose.
A
B
C
Figure 8-43. Tc-99m MAA hepatic arterial perfusion scintigraphy. A, Patient with colon cancer and liver metastases. Tc-99m MAA study shows solid tumor nodules involving both lobes of liver. B, Hyperperfusion of the periphery of the large tumor mass with a large, cold, necrotic center. C, Poor perfusion to the left lobe and extrahepatic perfusion to the stomach and small portion of spleen. The focal hot spot adjacent to the stomach is due to a small thrombus at the constant chemotherapy infusion catheter tip.
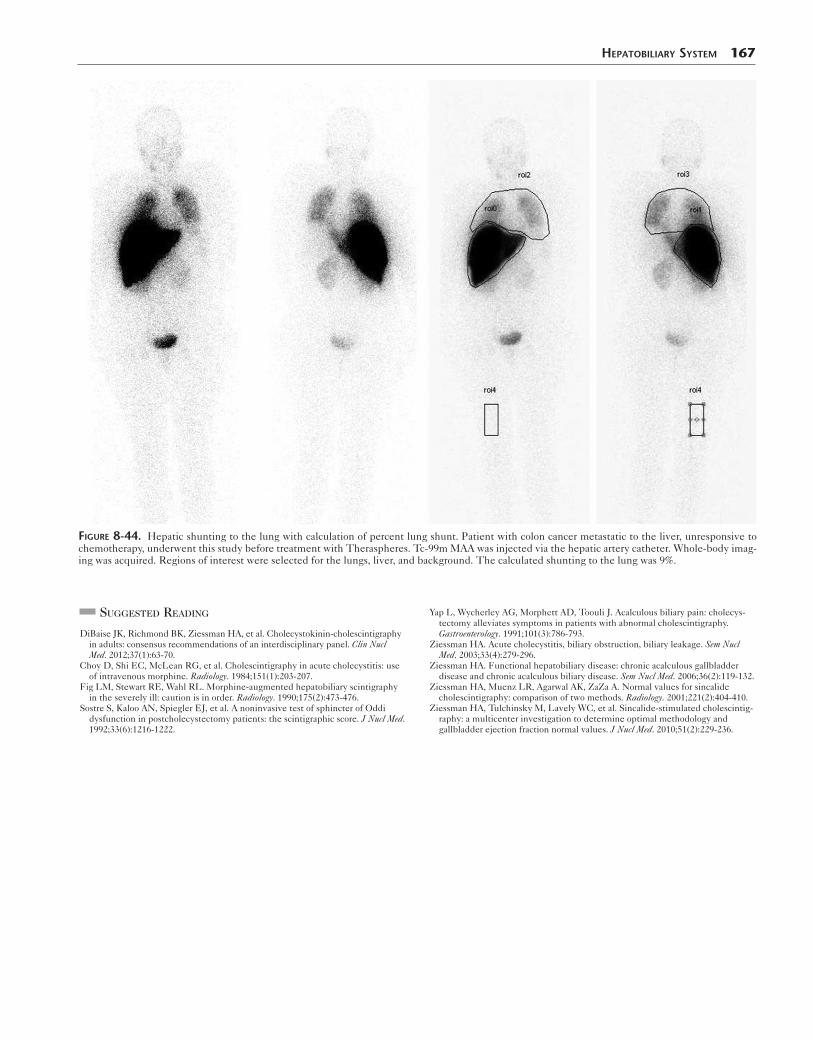
HepaTobiliary SySTem 167
Figure 8-44. Hepatic shunting to the lung with calculation of percent lung shunt. Patient with colon cancer metastatic to the liver, unresponsive to chemotherapy, underwent this study before treatment with Theraspheres. Tc-99m MAA was injected via the hepatic artery catheter. Whole-body imag-ing was acquired. Regions of interest were selected for the lungs, liver, and background. The calculated shunting to the lung was 9%.
SuggeSted reading
DiBaise JK, Richmond BK, Ziessman HA, et al. Cholecystokinin-cholescintigraphy in adults: consensus recommendations of an interdisciplinary panel. Clin Nucl Med. 2012;37(1):63-70.
Choy D, Shi EC, McLean RG, et al. Cholescintigraphy in acute cholecystitis: use of intravenous morphine. Radiology. 1984;151(1):203-207.
Fig LM, Stewart RE, Wahl RL. Morphine-augmented hepatobiliary scintigraphy in the severely ill: caution is in order. Radiology. 1990;175(2):473-476.
Sostre S, Kaloo AN, Spiegler EJ, et al. A noninvasive test of sphincter of Oddi dysfunction in postcholecystectomy patients: the scintigraphic score. J Nucl Med. 1992;33(6):1216-1222.
Yap L, Wycherley AG, Morphett AD, Toouli J. Acalculous biliary pain: cholecys-tectomy alleviates symptoms in patients with abnormal cholescintigraphy. Gastroenterology. 1991;101(3):786-793.
Ziessman HA. Acute cholecystitis, biliary obstruction, biliary leakage. Sem Nucl Med. 2003;33(4):279-296.
Ziessman HA. Functional hepatobiliary disease: chronic acalculous gallbladder disease and chronic acalculous biliary disease. Sem Nucl Med. 2006;36(2):119-132.
Ziessman HA, Muenz LR, Agarwal AK, ZaZa A. Normal values for sincalide cholescintigraphy: comparison of two methods. Radiology. 2001;221(2):404-410.
Ziessman HA, Tulchinsky M, Lavely WC, et al. Sincalide-stimulated cholescintig-raphy: a multicenter investigation to determine optimal methodology and gallbladder ejection fraction normal values. J Nucl Med. 2010;51(2):229-236.