8. C B C , L D S 1149 N B - Texas A&M University
14
Ludden, J.N., Plank, T., and Escutia, C. (Eds.) Proceedings of the Ocean Drilling Program, Scientific Results Volume 185 8. CORRELATION BETWEEN CORE, LOGGING, AND SEISMIC DATA AT SITE 1149 IN THE NADEZHDA BASIN 1 Lewis J. Abrams 2 ABSTRACT Synthetic seismograms are derived from a combination of laboratory and downhole measurements of density and velocity data collected from Holes 1149A and 1149B during Ocean Drilling Program Leg 185. The close match between single-channel seismic data obtained at Site 1149 and the synthetic seismogram facilitates core depth to traveltime correlation and is used to adjust laboratory measurements of velocity to in situ values. The two most prominent reflections are shown to corre- spond to the interface between pelagic clay and shallowest chert and to the top of oceanic crust. The correlation of physical and seismic stratig- raphy at Site 1149 forms the basis for future regional-scale investiga- tions of the sedimentary and volcanic history of the Nadezhda Basin, northwest Pacific. INTRODUCTION Ocean Drilling Program (ODP) Site 1149 is located on the Pacific plate ~100 km east of the Izu-Bonin Trench within the region known as the Nadezhda Basin (Fig. F1A). The primary objective of drilling at this site was to determine the geochemical input to the Izu-Bonin subduc- tion system (Shipboard Scientific Party, 2000b). Site 1149 is particularly important because no other drilling attempts within 1000 km have continuously cored the entire sedimentary sequence and uppermost oceanic crust, the most proximal being Deep Sea Drilling Project (DSDP) Sites 303 and 304, 1600 km to the northeast (Fig. F1A). Single- 140°E 145° 150° 155° 160° 143.2°E 143.3° 143.4° 143.5° I z u -B o n i n Tre n c h 500 0 4500 3500 2500 1500 7500 6500 5500 11,000 8500 303 303 1149 1149 304 304 Nadezhda Nadezhda Basin Basin Bonin Islands Japan Shatsky Shatsky Rise Rise Hole 1149D Depth (m) JR185 SCS line 1 C2005 MCS line 39 Line 2 Line 3 A B Site 1149 Holes A, B, & C 30° 35° 40° N 31.2° 31.3° 31.4° N F1. Predicted topography of the northwest Pacific, p. 10. 1 Abrams, L.J., 2002. Correlation between core, logging, and seismic data at Site 1149 in the Nadezhda Basin. In Ludden, J.N., Plank, T., and Escutia, C. (Eds.), Proc. ODP, Sci. Results, 185, 1–14 [Online]. Available from World Wide Web: <http://www- odp.tamu.edu/publications/185_SR/ VOLUME/CHAPTERS/001.PDF>. [Cited YYYY-MM-DD] 2 University of North Carolina, Center for Marine Science, One Marvin Moss Lane, Wilmington NC 28409, USA. [email protected] Initial receipt: 28 August 2001 Acceptance: 31 May 2002 Web publication: 6 September 2002 Ms 185SR-001
Transcript of 8. C B C , L D S 1149 N B - Texas A&M University

Ludden, J.N., Plank, T., and Escutia, C. (Eds.)Proceedings of the Ocean Drilling Program, Scientific Results Volume 185
8. CORRELATION BETWEEN CORE, LOGGING, AND SEISMIC DATA AT SITE 1149IN THE NADEZHDA BASIN1
Lewis J. Abrams2
ABSTRACT
Synthetic seismograms are derived from a combination of laboratoryand downhole measurements of density and velocity data collectedfrom Holes 1149A and 1149B during Ocean Drilling Program Leg 185.The close match between single-channel seismic data obtained at Site1149 and the synthetic seismogram facilitates core depth to traveltimecorrelation and is used to adjust laboratory measurements of velocity toin situ values. The two most prominent reflections are shown to corre-spond to the interface between pelagic clay and shallowest chert and tothe top of oceanic crust. The correlation of physical and seismic stratig-raphy at Site 1149 forms the basis for future regional-scale investiga-tions of the sedimentary and volcanic history of the Nadezhda Basin,northwest Pacific.
INTRODUCTION
Ocean Drilling Program (ODP) Site 1149 is located on the Pacificplate ~100 km east of the Izu-Bonin Trench within the region known asthe Nadezhda Basin (Fig. F1A). The primary objective of drilling at thissite was to determine the geochemical input to the Izu-Bonin subduc-tion system (Shipboard Scientific Party, 2000b). Site 1149 is particularlyimportant because no other drilling attempts within 1000 km havecontinuously cored the entire sedimentary sequence and uppermostoceanic crust, the most proximal being Deep Sea Drilling Project(DSDP) Sites 303 and 304, 1600 km to the northeast (Fig. F1A). Single-
140°E 145° 150° 155° 160°
143.2°E 143.3° 143.4° 143.5°
Izu-B
onin
Trench
5000
4500
3500
2500
1500
7500
6500
5500
11,000
8500
303303
11491149
304304
NadezhdaNadezhdaBasinBasin
BoninIslands
Japan
ShatskyShatskyRiseRise
Hole 1149D
Dep
th (
m)
JR185 S
CS
line 1
C2005 MCS line 39
Line
2
Line 3
A
B
Site 1149Holes
A, B, & C
30°
35°
40°N
31.2°
31.3°
31.4°N
F1. Predicted topography of the northwest Pacific, p. 10.
1Abrams, L.J., 2002. Correlation between core, logging, and seismic data at Site 1149 in the Nadezhda Basin. In Ludden, J.N., Plank, T., and Escutia, C. (Eds.), Proc. ODP, Sci. Results, 185, 1–14 [Online]. Available from World Wide Web: <http://www-odp.tamu.edu/publications/185_SR/VOLUME/CHAPTERS/001.PDF>. [Cited YYYY-MM-DD]2University of North Carolina, Center for Marine Science, One Marvin Moss Lane, Wilmington NC 28409, USA. [email protected]
Initial receipt: 28 August 2001Acceptance: 31 May 2002Web publication: 6 September 2002Ms 185SR-001

L.J. ABRAMSCORRELATION BETWEEN CORE, LOGGING, AND SEISMIC DATA 2
channel seismic (SCS) profiles obtained across Site 1149 during Leg 185and numerous regional seismic profiles throughout the area provide themeans for extending the results from Site 1149 to basinwide scales(1000 km). Such regional-scale seismic stratigraphy forms the founda-tion for investigations of the sedimentary and volcanic history of a sig-nificant area of the northwest Pacific seaward of the Izu-Bonin Trench.The objective of this paper is to provide the correlation between thephysical stratigraphy at Site 1149 and local SCS data utilizing a syn-thetic seismogram constructed from both downhole logging and ship-board physical properties data.
DATA
Seismic Data
Site selection for Site 1149 was initially based on multichannel seis-mic (MCS) lines and sonobuoy data obtained during cruise C2005 ofthe Robert Conrad in 1976. A short SCS and 3.5-kHz survey was con-ducted on approach to Site 1149, which confirmed the general seismiccharacter and unit thicknesses observed in the MCS records. Holes1149A, 1149B, and 1149C are located at the intersection of JOIDES Res-olution SCS lines 1 and 3, which is ~3.5 km northwest of the intersec-tion of SCS line 1 and C2005 line 39 (Fig. F1B). Hole 1149D is located~5 km to the southwest on C2005 line 39. Approximately 50 km of SCSdata were shot with two synchronized 80-in3 water guns and receivedusing a single-channel 100-m-long streamer. The guns and streamerwere both towed at 12–18 m depth. Water guns were fired every 13 s,equivalent to ~36 m at 5.4 kt. The seismic data from each shot weresampled every 1 ms from 0 to 11 s and were digitally recorded after ap-plying an antialiasing filter with a corner frequency at 250 Hz.
Site 1149 Core Data
Depth in meters below seafloor (mbsf), lithology, lithologic unit divi-sions, and biostratigraphic ages from Holes 1149A and 1149B (Ship-board Scientific Party, 2000c) are summarized in Figure F2. Results fromHoles 1149C and 1149D are not considered in this study because coreswere washed and/or taken discontinuously through most of the sedi-ment section and downhole measurements were not obtained.
Physical Properties
The wet bulk density of discrete samples was obtained during routinemeasurements of index properties at Site 1149 during Leg 185 (Ship-board Scientific Party, 2000c, 2000a). Laboratory P-wave measurementsused in this study were made using the Hamilton Frame velocimeterPWS3 contact probe system (Boyce, 1976; Blum, 1997). The PWS3 mea-surement is conducted across the split core axis (x-direction) using ver-tically oriented transducer pairs, with the upper transducer pressedagainst the split surface and the lower pressed against the core liner. Ve-locities were also measured in three mutually perpendicular directions(x, y, and z) using the PWS3 system on discrete samples of igneous andsedimentary rocks (lithologic Units III and IV and oceanic crust), whichwere sawed as oriented cubes. Velocity and density values were ob-tained every 1.5 m at the same depth in Unit I and Subunit IIA where
118.2
Reflectioncoefficient
> 0.4
Velocity (km/s)
V = 4821
Density (g/cm3) TWTmsbsf
0
180.12
410
226
TD 445.2
410
282.9
180
149.5
118.2
Age
438
148
188
Lith
uni
t(m
bsf)
282.9
TD445.2
336
CPA Holes 1149 A & BS
YN
Basalt
I
IIA
IIB
III
IV
453
0.18
Dep
th (
mbs
f)
Two-
way
trav
eltim
e (m
s)
Sou
rce
wav
elet
Pelagic clayw/ash layers
Pelagic clayw/o ash layers
IIA
IIB
Lithology andlithologic units
Basalt
I
III
IV
Ash and biogenicsilica-bearing clay
Interbeddedradiolarian chert,porcellanite, and
siliceous clay
Interbeddedradiolarian chertand radiolarian
nannofossilchalk/marl
149.5
l. M
ioce
ne -
l. P
leis
t.l.
Val
angi
nian
- l.
Hau
teriv
ian
e. A
ptia
n -
Alb
ian
Mio?
?
100
200
300
400
500
0Seafloor
7700
7800
7900
8100
8000
8200
2.0 1.5 2.53.0
F2. Logging and coring results and core-log-seismic correlation, p. 11.

L.J. ABRAMSCORRELATION BETWEEN CORE, LOGGING, AND SEISMIC DATA 3
core recovery was ~95%; however, wet bulk density values for an ~30-minterval in Subunit IIB could not be obtained because the pyncnometerdid not attain a stable helium pressure (Shipboard Scientific Party,2000c).
Downhole Measurements Data
Downhole measurements of velocity were made every 0.15 m inHole 1149B using the long-spacing sonic sonde (LSS) as part of the com-bination of instruments (tools) known as the Formation MicroScanner-sonic tool string. The LSS consists of two transmitters spaced 0.61 mapart, which are located 2.4 m below two receivers that are also spaced0.61 m apart. Velocity is calculated from measured traveltime betweentransmitter/receiver pairs over a known distance (i.e., 2.4, 3, 3, and 3.6m), resulting in a maximum of four traveltime values at each measure-ment depth. During postcruise processing, all traveltimes resulting invelocities outside the range of 1524–3805 m/s were discarded (Lamont-Doherty Borehole Research Group). This simple reprocessing success-fully corrects most noisy data because the inaccurate traveltimes aresufficiently extreme and there is an eightfold redundancy of measure-ments at each depth. The velocity values used in this study (known asVP2) were derived from the median values of the processed traveltimes.
Downhole density measurements were made in Hole 1149B with theHostile Environment Litho-Density Sonde (HLDS) located in the middleof the 30-m-long triple combination tool string. The HLDS utilizes aneccentralizing arm to maintain sensor contact with the borehole wall toa maximum hole diameter of 46 cm. Data accuracy is degraded bywashouts where borehole diameter exceeds 46 cm. Density valuesabove 180 mbsf within the pelagic clay are considered unreliable andare not used in this study because of extended washout zones (Fig. F3).
Combined Core and Logging Data
Velocity and density data used to calculate synthetic seismogramswere obtained from combining laboratory and downhole logging mea-surements. Downhole tools record continuous measurements of in situborehole properties, regardless of core recovery, at a relatively fine sam-pling interval of ~15 cm. Downhole measurements are used where pos-sible and are especially valuable in intervals of low core recovery (e.g.,below 180 mbsf). Laboratory measurements were used in discrete depthintervals where downhole measurements were either not available orwere considered unreliable. Core and logging depth scales matchexactly at the lithologic Unit II/III boundary (~180 mbsf), and depthsreported for all major lithologic unit boundaries are from core depths.
In Hole 1149A, there was nearly 95% core recovery using theadvanced hydraulic piston corer (APC) and extended core barrel (XCB)to the base of the pelagic clay interval at 180 mbsf (lithologic Units Iand II) (Fig. F2). Downhole measurements of density and velocity werevery limited in this interval (poor quality and/or minimal coverage)(Fig. F3); therefore, laboratory velocity and density values from Hole1149A are used from 0 to 180 mbsf. A constant density of 1.36 g/cm3,which is the density value measured at the top of Subunit IIB, was alsoused for the lower portion of this unit from 149 to 180 mbsf. Labora-tory measurements can accurately reflect actual velocity and densitytrends in such intervals of high recovery, minimal core disturbance (i.e.,APC), and relatively frequent sampling (every 1.5 m). Core recovery,
Dep
th (
mbs
f)
Velocity (km/s)
2.0
Density (g/cm3)
1.5 2.52.0 2.04.0
Resistivity (Ωm) Caliper (cm)
20 400
100
200
300
400
500
Pelagic clayw/ash layers
Pelagic clayw/o ash layers
IIA
IIB
Lithology andlithologic units
Basalt
I
III
IV
Ash and biogenicsilica-bearing clay
Interbeddedradiolarian chert,porcellanite, and
siliceous clay
Interbeddedradiolarian chertand radiolarian
nannofossilchalk/marl
TD 445.2
410
282.9
180
149.5
118.2
F3. Lithology and lithologic units and downhole measurements, p. 12.

L.J. ABRAMSCORRELATION BETWEEN CORE, LOGGING, AND SEISMIC DATA 4
however, dropped dramatically to ~10%–15% when using a rotary corebarrel (RCB) in the interval of interbedded chert/porcellanite/clay andchert/chalk/marl, characterizing lithologic Units III and IV below 180mbsf (Fig. F2). Although backfill prevented logging of the volcanicbasement, hole conditions remained stable long enough to log most ofthe sedimentary section within this interval of poor core recovery. TheLSS, in the middle of the 33-m-long tool string, obtained velocity mea-surements from 160 (Subunit IIB) to 351 mbsf (Unit IV) ~59 m abovethe top of oceanic crust and 94 m above total hole depth (Fig. F3). Aconstant velocity (the average log velocity of lithologic Unit IV [2485m/s]) was used to extend the log velocity from 351 mbsf down to thetop of oceanic crust at 410 mbsf. The average laboratory-derived veloc-ity of 4821 m/s was used to continue the velocity data from 410 to thetotal depth of 445.2 mbsf (Fig. F2).
Density values were acquired as shallow as 63 mbsf (Unit I) and ex-tend down to 398 mbsf, ~12 m above the top of oceanic crust and 47 mabove total hole depth (Fig. F3). A constant density, the average logdensity of the lowermost 50 m of lithologic Unit IV (2.2 g/cm3), wasused to extend the log density from 398 mbsf down to the top of oce-anic crust at 410 mbsf. The average laboratory-derived density of 2.66g/cm3 was used to extend the density data to the total depth of 445.2mbsf (Fig. F2). The combination of laboratory and downhole loggingdata used to make continuous velocity and density profiles are listed inTable T1.
SYNTHETIC SEISMOGRAMS
Velocity and density data from laboratory and downhole measure-ments were converted from mbsf to two-way traveltime (TWT) and re-sampled at a 1-ms sample interval. Impedance (velocity × density) andimpedance contrasts were used to calculate reflection coefficients (Fig.F2). This calculation is simplified by assuming vertical incidence, hori-zontal interfaces, no multiples, and no energy loss from sphericalspreading and attenuation. The water gun seismic-source wavelet wasobtained from the average of 10 adjacent traces of the seafloor reflec-tion at the drill site. The portion of the stacked signal from the first neg-ative to positive deflection associated with the seafloor to a pointinterpreted as the end of the source wavelet (31 ms) was used as theseismic source (Fig. F2). The series of reflection coefficients was con-volved with the source wavelet to produce a minimum-phase syntheticseismogram. The merge point of laboratory and logging data at 180mbsf occurs at a major change in lithology and physical properties(Unit II/III boundary) (Figs. F2, F3), and therefore, joining the data atthat depth does not create an artificial impedance contrast. The use of aconstant velocity in the lowermost 59 m of the sedimentary section,stepping to a higher constant velocity interval within the ~40 m of oce-anic crust, only serves to model the TWT to the top of oceanic crust andnot the seismic character (facies) of this short depth interval. The seis-mic character of this portion of the synthetic is controlled by the den-sity log, which continues to 398 mbsf. An examination of thedownhole resistivity and density measurements, which, like velocity,are largely controlled by porosity, indicate that there are no largereflection-producing changes in physical properties in the section im-mediately above basement (Fig. F3). More importantly, the length ofthe source wavelet is comparable to this depth interval and convolution
T1. Depth intervals, hole designa-tions, and measurement type for the velocity and density data, p. 14.

L.J. ABRAMSCORRELATION BETWEEN CORE, LOGGING, AND SEISMIC DATA 5
with any reasonable velocity series covering this short 59-m intervalwill result in nearly identical synthetic seismograms with only the totaltraveltime changing.
RESULTS AND DISCUSSION
A synthetic seismogram can constrain depth–traveltime correlationsif the synthetic seismogram closely matches the observed seismic char-acter. Reflections, however, are most often interference patterns causedby the source wavelet character and combined impedance contrasts as-sociated with closely spaced downhole changes in porosity and lithol-ogy. Exceptions include reflections created by large and abruptimpedance contrasts between extended intervals of relatively uniformphysical properties where the reflection appears as a recognizable repro-duction of the source wavelet scaled by the reflection coefficient (e.g.,the seafloor). Reflections created at such interfaces are especially usefulfor constraining depth–traveltime correlations. Reflection amplitude isdirectly related to the size of the impedance contrast and can also be animportant constraint when matching synthetic and observed seismo-grams. At Site 1149, a large contrast in physical properties at the inter-face between the thick (180 m) section of relatively homogenouspelagic clay and a sequence of interbedded chert/porcellanite/clay is ex-pected to produce the shallowest subseafloor high-amplitude reflection(e.g., Wilkens et al., 1993).
Figure F2 summarizes the core-log-seismic correlation at Site 1149based on synthetic seismograms. The observed seismic data and syn-thetic seismogram are both displayed using identical parameters, in-cluding true relative amplitude, in order to clearly identify the highestamplitude events. A preliminary synthetic seismogram (not shown)matched all the major features of the observed seismic profile includingthe high-amplitude reflections expected from the largest impedancecontrasts at the seafloor, the pelagic clay/chert interface (Unit II/IIIboundary), and the top of the oceanic crust. However, the TWT of themajor subseafloor reflections on the preliminary synthetic seismogramwere slightly larger (10 ms deeper) than those observed on seismic pro-files. This indicates velocities used in this synthetic were slightly toolow. The simplest solution to achieve a perfect match between the onsetof the highest amplitude reflections of the synthetic and observed seis-mograms was to raise the average velocity (1525 m/s) of the laboratory-derived measurements in the upper 180 mbsf by 69 m/s, a 4.5% in-crease. Is this a valid solution? It is well known that laboratory measure-ments of velocity are lower than in situ measurements in unlithifiedmarine sediments because of core expansion and disturbance createdfrom the coring process. This indicates the sign of the correction is cor-rect (i.e., laboratory velocities must increase), but is the amount of in-crease reasonable? The ~20-m interval (160–180 mbsf) of in situvelocity measurements overlapping with laboratory measurements inthe pelagic clay (Subunit IIB) average of ~1568 m/s, a 3.5% increaseover the average laboratory velocity in this interval. This result is veryclose to the amount of velocity increase required to exactly match syn-thetic and observed seismograms; however, downhole velocity mea-surements in this interval are extremely noisy because of widelyvarying borehole diameters and may be too low (Fig. F3).
Various site specific and general velocity vs. depth functions havebeen developed that correct laboratory velocities to reflect in situ condi-
L.J. ABRAMSCORRELATION BETWEEN CORE, LOGGING, AND SEISMIC DATA 6
tions (e.g., Urmos et al., 1993; Carlson et al., 1986). Although these cor-rections are not specific to the high-porosity, high-clay content of UnitsI and II, they can serve as a general guide to in situ velocities in thisshort and shallow depth interval. Application of the corrections of ei-ther Urmos et al. (1993) or Carlson et al. (1986) to our data raises theaverage velocity in the 0–180 mbsf interval by ~7% (~1630 m/s) andplaces the first high-amplitude subseafloor reflection only 6 ms shal-lower than on the observed seismogram (i.e., decreases the TWT). Be-cause the character of the observed seismic (i.e., both low and highamplitudes) is so well matched by the synthetic, the use of any of thesecorrections to laboratory velocities results in similar conclusions; theUnit II/III boundary at 180.12 mbsf corresponds to the shallowestsubseafloor high-amplitude reflection at 226 milliseconds below sea-floor (msbsf), and the top of oceanic crust at 410 mbsf corresponds tothe high-amplitude reflection at 438 msbsf. The synthetic seismogramutilized in this paper applies the simplest solution of raising the labora-tory velocities by a constant 69 m/s, resulting in an average velocity of1594 m/s for the upper 180 m of sediment.
These results indicate that the correlation between lithologic unitboundaries (core depth) and TWT given by the Shipboard ScientificParty (2000c), which were established without the aid of syntheticseismograms, must be adjusted to slightly greater traveltimes. The UnitII/III boundary is placed at 226 msbsf rather than 200 msbsf. The UnitIII/IV boundary correlates to 336 msbsf rather than 280 msbsf, and thetop of oceanic crust is at 438 msbsf instead of 420 msbsf.
Seismic Stratigraphy
Ewing et al. (1968) originally defined the acoustic stratigraphy oflarge portions of the western Pacific as consisting of two or more of thefollowing four seismic units: (1) an upper transparent layer (weakly re-flective), (2) an upper opaque layer (highly reflective or well stratified),(3) a lower transparent layer, and (4) acoustic basement. Acousticbasement has been referred to as “Horizon B,” the “deep opaque layer,”and as the “reverberant layer” where it is characterized by an interval offlat-lying, smooth, high-amplitude, closely spaced reflections (Ewing etal., 1968; Heezen, MacGregor, et al., 1973; Houtz et al., 1973; Houtz andLudwig, 1979).
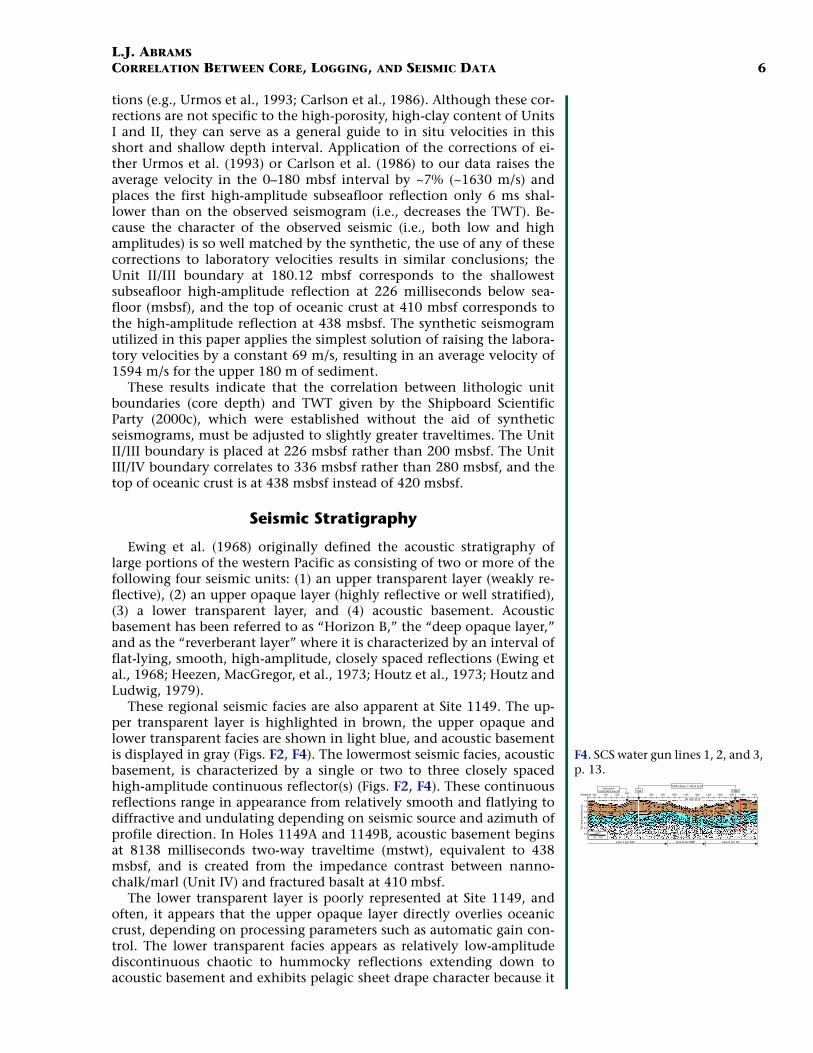
These regional seismic facies are also apparent at Site 1149. The up-per transparent layer is highlighted in brown, the upper opaque andlower transparent facies are shown in light blue, and acoustic basementis displayed in gray (Figs. F2, F4). The lowermost seismic facies, acousticbasement, is characterized by a single or two to three closely spacedhigh-amplitude continuous reflector(s) (Figs. F2, F4). These continuousreflections range in appearance from relatively smooth and flatlying todiffractive and undulating depending on seismic source and azimuth ofprofile direction. In Holes 1149A and 1149B, acoustic basement beginsat 8138 milliseconds two-way traveltime (mstwt), equivalent to 438msbsf, and is created from the impedance contrast between nanno-chalk/marl (Unit IV) and fractured basalt at 410 mbsf.
The lower transparent layer is poorly represented at Site 1149, andoften, it appears that the upper opaque layer directly overlies oceaniccrust, depending on processing parameters such as automatic gain con-trol. The lower transparent facies appears as relatively low-amplitudediscontinuous chaotic to hummocky reflections extending down toacoustic basement and exhibits pelagic sheet drape character because it
F4. SCS water gun lines 1, 2, and 3, p. 13.
350 450 550 850 950 1050 1150 1250 1350 1450 1550 1650 1750639
7.7
7.8
7.9
8.1
8.2
8.3
8.0
Shotpoint
JR 185 SCS
Two-
way
trav
eltim
e (s
)
CPA Holes 1149 A & B
UT
UO
LT
AB5 km
VE = 23X
Line 1 o/c 337° Line 2 o/c 208° Line 3 o/c 70°
1584Intersection
C2005 MCS line 39 742

L.J. ABRAMSCORRELATION BETWEEN CORE, LOGGING, AND SEISMIC DATA 7
is generally of uniform thickness and concordant with the underlyingbasement topography. This interval correlates to the interbedded chert/chalk/marl of lithologic Unit IV. The lithologic Unit III/IV boundary(282.9 mbsf = 336 msbsf), however, is not associated with a distinctcontinuous reflection because there is no large and abrupt impedancecontrast at this boundary. Instead, it is characterized by a reflection in-terference pattern with a subtle transition from the upper opaque to thepoorly developed lower transparent seismic facies.
The upper opaque layer as originally defined by analog air gunrecords appears stratified rather than “opaque” on these SCS water gunrecords (Figs. F2, F4). The upper opaque layer in Holes 1149A and1149B begins at 226 msbsf (7926 mstwt) and consists of high-amplitudecontinuous reflections that mimic the underlying basement relief andappear as a stratified pelagic drape deposit of generally uniform thick-ness. The continuous high-amplitude reflection that appears at 226msbsf is the result of the large and abrupt impedance contrast, which ispresent between pelagic clay (Unit II) and the shallowest abundantchert at ~180 mbsf (Unit III) (Figs. F2, F4). The stratified appearance isan interference pattern from closely spaced impedance contrasts associ-ated with interbedded chert, porcellanite, and clay similar to that ob-served by Wilkens et al. (1993).
The upper transparent layer is relatively thick and extends from theseafloor to 226 msbsf (7926 mstwt). This unit has a pelagic sheet-drapeform and a relatively reflection-free seismic character in the upper por-tion with semicontinuous reflections of low amplitude apparent in thelower portion of this interval. The “transparent” character is indicativeof a relatively homogenous interval containing no significant imped-ance contrasts and is correlated to the unlithified siliceous ash-bearingclay of lithologic Subunit IA. The weak semicontinuous reflections be-ginning at 148 msbsf correlate to lithologic Unit II (118.2–180.12mbsf). The Unit I/II boundary is marked by abrupt but relatively smallchanges in porosity, grain density, and downhole resistivity, and ex-treme changes in borehole diameter are present within Unit II (Fig. F3)(Shipboard Scientific Party, 2000c).
CONCLUSIONS
1. Correlations between core, logging, and seismic data from ODPSite 1149 have been established through the construction of asynthetic seismogram from a combination of downhole andshipboard laboratory measurements of velocity and density.
2. The major reflections and general seismic facies characteristics ofthe observed SCS profiles are well reproduced by the syntheticseismogram. The close match between synthetic and observedseismogram displayed using true amplitudes allows the syn-thetic to successfully constrain depth to traveltime correlationsand requires that laboratory velocities be increased by ~4.5% inthe upper transparent seismic facies. The velocity increase is con-sistent with results from other empirical methods that correctlaboratory velocities for the effects of rebound and core distur-bance.
3. The depth-to-traveltime correlations indicate that the lithologicunit boundaries given by the Shipboard Scientific Party (2000c)must be adjusted to slightly greater traveltimes as follows: UnitII/III boundary at 226 msbsf rather than 200 msbsf, Unit III/IV at

L.J. ABRAMSCORRELATION BETWEEN CORE, LOGGING, AND SEISMIC DATA 8
336 msbsf rather than 280 msbsf, and top of oceanic crust at 438msbsf rather than 420 msbsf.
4. The seismic facies identified at Site 1149 can be compared to theregional seismic facies descriptions of the northwest Pacific byEwing et al. (1968). No other boreholes within 1000 km of Site1149 have sampled the complete sedimentary section and top ofoceanic crust seaward of the Izu-Bonin trench. Thus, the resultsof the correlation between physical and seismic stratigraphy atSite 1149 have regional significance and can now be extendedbasinwide using preexisting regional MCS and analog SCS pro-files.
ACKNOWLEDGMENTS
This research used samples and data provided by the Ocean DrillingProgram (ODP). ODP is sponsored by the U.S. National Science Founda-tion and participating countries under the management of the JointOceanographic Institutions, Inc. This project was partially funded bythe U.S. Science Support Program. This is University of North Carolina,Wilmington, Center for Marine Science Contribution #255.
I am grateful to the Ocean Drilling Program for inviting me to partic-ipate on Leg 185, to all members of the Shipboard Scientific Party of Leg185 for their cooperation on board the ship, and to the ODP personneland the SEDCO crew who made Leg 185 a success. I also thank RichardJarrard for insights into the interpretation of shipboard physical proper-ties data and Dr. Sun, at Lamont-Doherty Borehole Research Group, forsupplying software for synthetic seismogram calculations. Maps wereproduced using Generic Mapping Tools software (Wessel and Smith,1995). Reviews by William Sager and M.F. Moore improved this manu-script.

L.J. ABRAMSCORRELATION BETWEEN CORE, LOGGING, AND SEISMIC DATA 9
REFERENCES
Blum, P., 1997. Physical properties handbook: a guide to the shipboard measurementof physical properties of deep-sea cores. ODP Tech. Note, 26 [Online]. Availablefrom World Wide Web: <http://www-odp.tamu.edu/publications/tnotes/tn26/INDEX.HTM>. [Cited 1999-04-01]
Boyce, R.E., 1976. Definitions and laboratory techniques of compressional soundvelocity parameters and wet-water content, wet-bulk density, and porosity parame-ters by gravimetric and gamma-ray attenuation techniques. In Schlanger, S.O.,Jackson, E.D., et al., Init. Repts. DSDP, 33: Washington (U.S. Govt. Printing Office),931–958.
Carlson, R.L., Gangi, A.F., and Snow, K.R., 1986. Empirical reflection travel time ver-sus depth and velocity versus depth functions for the deep sea sediment column. J.Geophys. Res., 91:8249–8266.
Ewing, J., Ewing, M., Aitken, T., and Ludwig, W.J., 1968. North Pacific sediment layersmeasured by seismic profiling. In Knopoff, L., Drake, C.L., and Hart, P.J. (Eds.), TheCrust and Upper Mantle of the Pacific Area. Geophys. Monogr., Am. Geophys.Union., 12:147–173.
Heezen, B.C., MacGregor, I.D., et al., 1973. Init. Repts. DSDP, 20: Washington (U.S.Govt. Printing Office).
Houtz, R.E., Ewing, J., and Buhl, P., 1970. Seismic data from sonobuoy stations in thenorthern and equatorial Pacific. J. Geophys. Res., 75:5093–5111.
Houtz, R.E., and Ludwig, W.J., 1979. Distribution of reverberant subbottom layers inthe southwest Pacific basin. J. Geophys. Res., 84:3497–3504.
Smith, W.H.F., and Sandwell, D.T., 1997. Global seafloor topography from satellitealtimetry and ship depth soundings. Science, 277:1956–1962.
Shipboard Scientific Party, 2000a. Explanatory notes. In Plank, T., Ludden, J.N., Escu-tia, C., et al., Proc. ODP, Init. Repts., 185, 1–76 [CD-ROM]. Available from: OceanDrilling Program, Texas A&M University, College Station TX 77845-9547, USA.
————, 2000b. Leg 185 summary: inputs to the Izu-Mariana subduction system. InPlank, T., Ludden, J.N., Escutia, C., et al., Proc. ODP, Init. Repts., 185: College StationTX (Ocean Drilling Program), 1–63.
————, 2000c. Site 1149. In Plank, T., Ludden, J.N., Escutia, C., et al., Proc. ODP, Init.Repts., 185, 1–190 [CD-ROM]. Available from: Ocean Drilling Program, Texas A&MUniversity, College Station TX 77845-9547, USA.
Urmos, J., Wilkens, R.H., Bassinot, F., Lyle, M., Marsters, J.C., Mayer, L.A., andMosher, D.C., 1993. Laboratory and well-log velocity and density measurementsfrom the Ontong Java Plateau: new in-situ corrections to laboratory data forpelagic carbonates. In Berger, W.H., Kroenke, L.W., Mayer, L.A., et al., Proc. ODP,Sci. Results, 130: College Station, TX (Ocean Drilling Program), 607–622.
Wessel, P., and Smith, W.H.F., 1995. New version of the Generic Mapping Toolsreleased. Eos, Trans. Am. Geophys. Union, 76:329.
Wilkens, R.H., Christensen, N.I., and Collins, J.A., 1993. Seismic properties andreflectivity of North Pacific Ocean cherts. In Wilkens, R.H., Firth, J., Bender, J., etal., Proc. ODP, Sci. Results, 136: College Station, TX (Ocean Drilling Program), 99–104.

L.J. ABRAMSCORRELATION BETWEEN CORE, LOGGING, AND SEISMIC DATA 10
Figure F1. A. Predicted topography of the northwest Pacific (Smith and Sandwell, 1997) and selected phys-iographic features. Circles locate Site 1149 (~100 km east of the Izu-Bonin Trench) and DSDP Sites 303 and304. B. Circles indicate Site 1149 hole positions. The bold black line indicates the track of the ~50-km-longsingle-channel seismic (SCS) survey conducted during Leg 185 (JOIDES Resolution, Leg 185 SCS lines 1, 2,and 3). This SCS data is presented in Fig. F4, p. 13. The bold red line indicates the portion of SCS data dis-played in Fig. F2, p. 11. The thin black line indicates a segment of multichannel seismic (MCS) line 39 fromthe regional survey of C2005.
140°E 145° 150° 155° 160°
143.2°E 143.3° 143.4° 143.5°
Izu-B
onin
Trench
5000
4500
3500
2500
1500
7500
6500
5500
11,000
8500
303
1149
304
NadezhdaBasin
BoninIslands
Japan
ShatskyRise
Hole 1149D
Dep
th (
m)
JR185 S
CS
line 1
C2005 MCS line 39
Line
2
Line 3
A
B
Site 1149Holes
A, B, & C
30°
35°
40°N
31.2°
31.3°
31.4°N

L.J. A
BR
AM
SC
OR
RE
LA
TIO
N B
ET
WE
EN
CO
RE, L
OG
GIN
G, A
ND
SE
ISMIC D
AT
A1
1
Figure synthetic seismograms. Thefirst tw d four show the velocity anddensit efficient calculated from im-pedan epth (mbsf) to time (msbsf)correla ith the reflection coefficientto crea nted as 10 adjacent traces incolum served seismograms are dis-played nally identified seismic unitsare co illiseconds below seafloor, V= velo
Dep
th (
mbs
f)
Two-
way
trav
eltim
e (m
s)
100
200
300
400
500
0 7700
7800
7900
8100
8000
8200
F2. Logging and coring results (Shipboard Scientific Party, 2000c) and core-log-seismic correlation based ono columns summarize the lithology, lithologic units, and biostratigraphic ages at Site 1149. Columns three an
y profiles derived from merging laboratory and downhole measurements. Column five shows the reflection coce contrasts obtained from the composite velocity and density data. Columns six and seven show selected dtions from matching the synthetic and observed seismograms. The seismic source signature that is convolved wte the synthetic seismogram (SYN) is shown at the top of column seven. The synthetic seismogram is presen eight. Column nine shows an ~1.8-km portion of JOIDES Resolution SCS water gun line 2. Synthetic and ob with no filtering and true amplitude. The locations of Holes 1149A and 1149B are shown with an arrow. Regio
lor coded as described in the text and Figure F4, p. 13. TD = total depth, TWT = two-way traveltime, msbsf = mcity.
118.2
Reflectioncoefficient
> 0.4
Velocity (km/s)
V = 4821
Density (g/cm3) TWTmsbsf
0
180.12
410
226
TD 445.2
410
282.9
180
149.5
118.2
Age
438
148
188
Lith
uni
t(m
bsf)
282.9
TD445.2
336
CPA Holes 1149 A & B
SY
N
Basalt
I
IIA
IIB
III
IV
453
0.18
Sou
rce
wav
elet
Pelagic clayw/ash layers
Pelagic clayw/o ash layers
IIA
IIB
Lithology andlithologic units
Basalt
I
III
IV
Ash and biogenicsilica-bearing clay
Interbeddedradiolarian chert,porcellanite, and
siliceous clay
Interbeddedradiolarian chertand radiolarian
nannofossilchalk/marl
149.5
l. M
ioce
ne -
l. P
leis
t.l.
Val
angi
nian
- l.
Hau
teriv
ian
e. A
ptia
n -
Alb
ian
Mio?
?
Seafloor2.0 1.5 2.53.0

L.J. ABRAMSCORRELATION BETWEEN CORE, LOGGING, AND SEISMIC DATA 12
Figure F3. Lithology and lithologic units and downhole measurements of velocity, density, and resistivity(medium induction resistivity tool) along with the caliper from the HLDS tool are displayed through theentire logged section of Hole 1149B (Shipboard Scientific Party, 2000c). The dashed line highlights theabrupt and large contrast of physical properties at 180 mbsf. TD = total depth.
Dep
th (
mbs
f)
Velocity (km/s)
2.0
Density (g/cm3)
1.5 2.52.0 2.04.0
Resistivity (Ωm) Caliper (cm)
20 400
100
200
300
400
500
Pelagic clayw/ash layers
Pelagic clayw/o ash layers
IIA
IIB
Lithology andlithologic units
Basalt
I
III
IV
Ash and biogenicsilica-bearing clay
Interbeddedradiolarian chert,porcellanite, and
siliceous clay
Interbeddedradiolarian chertand radiolarian
nannofossilchalk/marl
TD 445.2
410
282.9
180
149.5
118.2

L.J. A
BR
AM
SC
OR
RE
LA
TIO
N B
ET
WE
EN
CO
RE, L
OG
GIN
G, A
ND
SE
ISMIC D
AT
A1
3
Figure 2, and 3. The bold white line at Shotpoints 742 and 1584 indicatesthe lo portion of SCS line 3 displayed in Figure F2, p. 11. Colors markregion sparent layer (UT) and light blue encompasses the upper opaque(UO) a mic data were processed and displayed with the following param-eters: ird trace, 500-ms AGC, and vertical exaggeration (VE) = 23× at theseaflo n course.
1150 1250 1350 1450 1550 1650 1750
7.7
7.8
7.9
8.1
8.2
8.3
8.0
Shotp
JR 185 SCS
Two-
way
trav
eltim
e (s
)
Holes 1149 A & B
UT
UO
LT
AB
ine 2 o/c 208° Line 3 o/c 70°
1584
F4. JOIDES Resolution (JR) single-channel seismic (SCS) water gun lines 1, cation and interval cored in Holes 1149A and 1149B. A box encloses theally identified seismic facies; light brown corresponds to the upper trannd lower transparent (LT) layers lying above acoustic basement (AB). Seis
seafloor mute, band-pass filter = 25–100 Hz, three-trace mix, plot every thor. MCS = multichannel seismic, CPA = closest point of approach, o/c = o
350 450 550 850 950 1050639
oint
CPA
5 km
VE = 23X
Line 1 o/c 337° L
IntersectionC2005 MCS line 39 742

L.J. ABRAMSCORRELATION BETWEEN CORE, LOGGING, AND SEISMIC DATA 14
Table T1. Depth intervals, hole designation, and measurement type for the velocity and density data usedto construct the synthetic seismogram (shown in Fig. F2, p. 11.).
Measurements Velocity depth interval (mbsf) Density depth interval (mbsf)
Shipboard laboratory 185-1149A, 185-1149B 185-1149A, 185-1149B0–179.55 0–149
149–179.55 (use constant density of 1.36 g/cm3)
185-1149B 185-1149B410–4145.2 (use average velocity of basalt = 4821 m/s) 410–445.2 (use average density of basalt = 2.66 g/cm3)
Downhole (Hole 1149B) 180.12–350.83 180.12–397.9
350.83–410.0 (use average velocity from 283 to 350.83 in lithologic Unit IV = 2485 m/s)
397.9–410.0 mbsf (use average density from 368 to 397.8 mbsf = 2.204 g/cm3)