8 Adele M. Burnett - CORE
38
1 Running head: Influences on netball umpires’ decision-making 1 2 3 4 Decision-making of English Netball Superleague Umpires: Contextual and 5 Dispositional Influences 6 7 Adele M. Burnett a* , Daniel T. Bishop a , Kelly J. Ashford b , A. Mark, Williams c , Noel 8 P. Kinrade a . 9 a Division of Sport, Health and Exercise Sciences, Brunel University London, 10 Uxbridge, UB8 3PH, UK, [email protected]; Centre for Cognitive Neuroscience, 11 Brunel University London, Uxbridge, UB8 3PH, UK, [email protected], 12 [email protected]; b Cardiff School of Sport, Cardiff Metropolitan University, 13 Cardiff, CF23 6XD, UK, [email protected]; c Department of Health, Kinesiology 14 and Recreation, University of Utah, Salt Lake City, UT84112, USA, 15 [email protected]. 16 17 * Corresponding author. Division of Sport, Health and Exercise Sciences, 18 Department of Life Sciences, College of Health and Life Sciences, Brunel University 19 London, Uxbridge, Middlesex, UB8 3PH. Email address: 20 [email protected] (A. M. Burnett). 21 22
Transcript of 8 Adele M. Burnett - CORE

1
Running head: Influences on netball umpires’ decision-making 1
2
3
4
Decision-making of English Netball Superleague Umpires: Contextual and 5
Dispositional Influences 6
7
Adele M. Burnetta*, Daniel T. Bishopa, Kelly J. Ashfordb, A. Mark, Williamsc, Noel 8
P. Kinradea. 9
aDivision of Sport, Health and Exercise Sciences, Brunel University London, 10
Uxbridge, UB8 3PH, UK, [email protected]; Centre for Cognitive Neuroscience, 11
Brunel University London, Uxbridge, UB8 3PH, UK, [email protected], 12
[email protected]; b Cardiff School of Sport, Cardiff Metropolitan University, 13
Cardiff, CF23 6XD, UK, [email protected]; cDepartment of Health, Kinesiology 14
and Recreation, University of Utah, Salt Lake City, UT84112, USA, 15
17
*Corresponding author. Division of Sport, Health and Exercise Sciences, 18
Department of Life Sciences, College of Health and Life Sciences, Brunel University 19
London, Uxbridge, Middlesex, UB8 3PH. Email address: 20
[email protected] (A. M. Burnett). 21
22

2
Abstract 23
Objectives. The decisions made by officials have a direct bearing on the outcomes of 24
competitive sport contests. In an exploratory study, we examine the interrelationships 25
between the decisions made by elite netball umpires, the potential contextual and 26
environmental influences (e.g., crowd size), and the umpires’ dispositional tendencies – 27
specifically, their propensity to deliberate and ruminate on their decisions. 28
Design/Method. Filmed footage from 60 England Netball Superleague matches was coded 29
using performance analysis software. We measured the number of decisions made overall, 30
and for home and away teams; league position; competition round; match quarter; and crowd 31
size. Additionally, 10 umpires who officiated in the matches completed the Decision-Specific 32
Reinvestment Scale (DSRS). 33
Results. Regression analyses predicted that as home teams’ league position improved the 34
number of decisions against away teams increased. A model comprising competition round 35
and average league position of both teams predicted the number of decisions made in 36
matches, but neither variable emerged as a significant predictor. The umpire analyses 37
revealed that greater crowd size was associated with an increase in decisions against away 38
teams. The Decision Rumination factor was strongly negatively related to the number of 39
decisions in Quarters 1 and 3, this relationship was driven by fewer decisions against home 40
teams by umpires who exhibited higher Rumination subscale scores. 41
Conclusions. These findings strengthen our understanding of contextual, environmental, and 42
dispositional influences on umpires’ decision-making behaviour. The tendency to ruminate 43
upon decisions may explain the changes in decision behaviour in relation to the home team 44
advantage effect. 45
Key Words: avoidance; reinvestment; rumination; referee; bias; pressure. 46

3
Introduction 47
In competitive sports, officials are required to make rapid and complex decisions, 48
often in a highly pressured environment (Helsen & Bultynck, 2004). Moreover, their 49
decisions often directly affect the outcome of competitions (Plessner & MacMahon, 2013). 50
For example, during the final minutes of the 2015 Rugby World Cup quarter-final between 51
Scotland and Australia, referee, Craig Joubert, decided to award a controversial penalty to 52
Australia for a deliberate knock-on, resulting in a 35-34 victory for Australia, which enabled 53
them to progress to the semi-final of the competition. Such decisions invariably attract 54
negative evaluations by aggrieved players, coaches, spectators and the media, so the 55
importance of consistent and impartial officiating is unquestionable (Stulp, Buunk, Verhulst, 56
& Pollet, 2012). 57
Decision-making can be influenced by a variety of factors (MacMahon et al., 2015), 58
such as home advantage and crowd noise (e.g., crowd noise contribution to the home 59
advantage effect, Nevill, Hemingway, Greaves, Dallaway, & Devonport, 2016; Unkelbach & 60
Memmert, 2010), competition level (Souchon, Cabagno, Traclet, Trouilloud, & Maio, 2009; 61
Souchon et al., 2016), reputation (e.g., expectation bias in gymnastics, Plessner, 1999) and 62
time (e.g., decision accuracy and frequency thoughout games, Emmonds et al., 2015; Mallo, 63
Frutos, Juárez, & Navarro, 2012). In the current paper, we employ and exploratory approach 64
to examine the decisions made by netball umpires and the influences of contextual and 65
environmental factors on the number of decisions made. Moreover, we investigate umpires’ 66
self-reported tendency to reinvest in, and ruminate upon, their decisions. 67
Many researchers have focused upon the home advantage in sports – a phenomenon 68
whereby there is an apparent advantage conferred to the home team. Four major determinants 69
have been suggested to cause the home advantage effect namely, familiarity, territoriality, 70

4
travel fatigue, and crowd noise (Pollard, 2008). It has been suggested that home advantage 71
fluctuates throughout the game. For example, in basketball, Jones (2007) demonstrated that 72
the home advantage (difference in points scored by the home and away teams) was greatest in 73
the first quarter. In volleyball, home teams had a greater advantage at the beginning (1st set) 74
and towards the end of the game (4th and 5th sets); this effect has been attributed to familiarity 75
with the venues and crowd effects (Marcelino, Mesquita, Palao, & Sampaio, 2009). In 76
relation to the referee’s influence on the home advantage, Boyko, Boyko, and Boyko (2007) 77
examined data from 5,244 English Premier League soccer matches involving 50 referees. 78
They found that referees differed in their susceptibility to the home advantage effect; 79
hypothesising this was due to variations in the referees’ ability to deal with social pressure. 80
However, Johnston (2008) replicated Boyko et al.’s (2007) approach and found no evidence 81
of such individual differences when removing referees who only officiated a few matches. To 82
investigate this discrepancy further, Page and Page (2010) analysed footage from 37,830 83
national and international soccer matches across 58 competitions, between 1994 and 2007. 84
Their analyses showed that not only did the size of the home advantage differ significantly 85
between referees, but also, in line with Boyko et al. (2007), their decisions were moderated 86
by crowd size – lending support to the notion that referees cope differently with the social 87
pressure exerted by home crowds. 88
Using a video-based protocol, Nevill, Balmer, and Williams (2002) manipulated 89
crowd noise presence (“loud” or none) and found that soccer referees made more decisions in 90
favour of the home team, and in line with the original match referee. Unkelbach and 91
Memmert (2010) identified the inherent limitation of testing crowd noise (“natural 92
conditions”) versus no crowd noise (“unnatural conditions”). The authors highlighted that 93
Nevill et al’s (2002) findings merely indicate that home crowd noise biases decisions 94

5
compared to no crowd noise, rather than crowd noise influencing referee decisions in favour 95
of the home team. Subsequently, Unkelbach and Memmert (2010) tested the hypothesis that 96
louder crowd noise would lead to more yellow cards awarded compared to low crowd noise. 97
Twenty referees viewed 56 foul scenes, in which 50% led to the award of a yellow card and 98
50% did not. The high-volume crowd noise led to substantially more yellow cards than low-99
volume crowd noise. Further evidence in soccer indicates that home teams were awarded 100
more penalties (e.g., Nevill, Newell, & Gale, 1996; Scoppa, 2008; Sutter & Kocher, 2004), 101
and fewer yellow and red cards (Buraimo, Forrest, & Simmons, 2010) with the size of the 102
attending crowd moderating these effects (Boyko et al., 2007). 103
The mediating effect of competition level has received scant attention, whilst stage of 104
competition (e.g., Round 1, playoffs, finals, etc.) has yet to be investigated. Souchon et al. 105
(2009) proposed that the level of competition is a stereotyping heuristic used by referees to 106
form their decisions, interpreting fouls differently according to their preconceptions regarding 107
the standard of play. Souchon et al. (2009) investigated this notion in handball (e.g., lower 108
versus higher standard), predicting the level of competition effects would be greater for more 109
difficult, ambiguous handball transgressions (“pushing offences”, opposed to clearer “holding 110
back” offences) and anticipating that referees would be more lenient in higher-standard 111
competition. They reported that referees intervened less frequently at higher levels of 112
competition and allowed play to continue without intervention more frequently following 113
more ambiguous transgressions (pushing offences compared to holding offences). Similarly, 114
Souchon et al. (2016) observed that referees intervened less often when higher- level players 115
transgressed. The authors suggested that a reduction in decisions made may be the 116
culmination of a number of factors: referees trying to maintain the flow of a match; referees 117
making fewer calls to maintain the game’s value as a spectacle (e.g., Mascarenhas, O'Hare, & 118

6
Plessner, 2006); that a greater number of fouls may be more ambiguous in high-level 119
competition, due to the high speed of play; that greater levels of player aggressiveness may 120
make it more difficult to identify transgressions; or that referees may assume that certain 121
players can continue their actions despite the seriousness of the foul committed (e.g., gender 122
stereotype and males superior physical ability, Souchon et al., 2010). In this study, we aim to 123
examine potential changes in the number of decisions made across progressive competition 124
rounds (perceived match importance arguably increases as the rounds progress). 125
Few researchers have focused on the effect of the competing teams’ abilities on sports 126
officials’ judgements. However, Plessner (1999) examined the idea of an expectation bias in 127
team gymnastics, where gymnasts normally perform in a ranked order, worst to best. Plessner 128
predicted that when the same routines, placed in either first or fifth position, will score higher 129
when the judges view them in the latter position. Forty-eight gymnastic judges, with prior 130
expectations of coaches’ rank order of the gymnasts, judged videotapes of a men’s team 131
competition. Their results supported the notion of an ability expectation bias, whereby, for 132
difficult tasks (e.g., pommel horse, vault, and horizontal bar) the judges awarded greater 133
scores when the target routines were presented fifth than if they were presented first. Findlay 134
and Ste-Marie (2004) explored athlete reputation bias in figure skating judgments. Twelve 135
judges evaluated performance of 14 skaters, half of whom were known to the judges. The 136
performance of skaters with a pre-existing positive reputation were scored more highly than 137
those of the unknown skaters. It is possible that similar unconscious biases relating to 138
perceived athlete ability may also exist in team sports; hence, we also took the competing 139
teams’ pre-eminence (i.e., their league position) into account in this study. 140
To date, a limited body of research has investigated the effect of the match period on 141
sports officials’ decision-making. Mallo et al. (2012) assessed the soccer referees’ decision 142

7
quality and quantity in relation to match periods. Mallo et al. reported that a greater number 143
of incidents occurred in the last 15- minute period of matches – but the lowest referee 144
decision accuracy (77%) was also observed during this period. They suggested that physical 145
and mental fatigue occurs during the final stages of a match leading to impaired decision-146
making. Similarly, Emmonds et al. (2015) found a drop in penalty judgement accuracy in 147
rugby league referees in the last 10 minutes of matches. Conversely, Mascarenhas, Button, 148
O’Hare and Dicks (2009) reported that soccer referees were less accurate in the opening 15 149
minutes of each half than they were at any other period. They attributed poorer decision-150
making to warm up decrements, whereby their physical warm-up was not accompanied by a 151
mental warm up techniques. Finally, Elsworthy, Burke and Dascombe (2014) investigated 152
decision-making demands of Australian Football referees, and reported that the number of 153
free kicks awarded and free kick accuracy did not differ across each quarter of the match. 154
Accordingly, in the present study, we analysed differences in the number of decisions made 155
by netball umpires across each of the four match quarters. 156
Published reports using qualitative methods have identified several sources of 157
pressure and anxiety for sports officials (such as game importance, Hill, Matthews, & Senior, 158
2016; time, Morris & O’Connor, 2016; social pressure, Schnyder & Hossner, 2016). Morris 159
and O’Connor (2016) found that National Rugby League (NRL) referees identified the time 160
during a match as an influence on their game management strategies and decision-making 161
ability. For example, one referee stated “certain decisions can have a greater impact at 162
different stages in a game which can increase media scrutiny” (Morris & O’Connor, 2016, 163
p.854). Schnynder and Hossner (2016) interviewed high-level soccer referees regarding 164
decision-making and the difficulties they face. Several of the referees identified social 165
pressures, including pressure from the media, teams, football associations and even 166

8
themselves. Hill, Matthews, and Senior (2016) interviewed seven expert rugby referees and 167
noted that avoidance coping behaviours were regularly employed to deal with multiple 168
stressors that influence their performance including: unfamiliarity (e.g., new situations); 169
performance errors (e.g., mistakes that ‘harm’ players, coaches and own career prospects); 170
interpersonal conflict (e.g., manging player hostility); game importance (e.g., when the match 171
outcome held significant consequence for players such as a final, or for themselves such as 172
games close to renewal of contracts) and self-presentational concerns (e.g., fear of negative 173
evaluation by selectors, avoiding criticism that could damage their confidence and 174
reputation). The avoidance behaviours manifested themselves as denial after performance 175
errors, rushing or withdrawal during the game, and a lack of preparation leading into games. 176
Similarly, overt and maladaptive changes in behaviour under anxiogenic conditions have 177
been observed in soccer (Jordet & Hartman, 2008) in climbing (Nieuwenhuys, Pijpers, 178
Oudejans, & Bakker, 2008), dart throwing (Nibbeling, Oudejans, & Daanen, 2012), golf 179
(Hill, Hanton, Matthews, & Fleming, 2010), and police arrest procedures (Renden et al., 180
2014). 181
Decision avoidance has been described as “a tendency to avoid making a choice, by 182
postponing it or by seeking an easy way out that involves no action or no change” (Anderson, 183
2003, p. 139). Selection difficulty has been identified as a major contributor to decision 184
avoidance including factors such as: reasoning; preference uncertainty; attractiveness of 185
options; attentional focus; time limitation; negative emotion (associated with blame and 186
regret); and conflict type (Anderson, 2003). Researchers have shown that decision averseness 187
occurs when situations have inequitable outcomes for others – particularly when the decision 188
maker is held accountable (Beattie, Baron, Hershey, & Spranca, 1994); and the likelihood of 189
negative outcomes also increases negative emotions associated with such decisions (Luce, 190

9
Bettman, & Payne, 1997). In this study, we explored the notion that withdrawal of decisions 191
(fewer decisions made) may be an example of decision avoidance behaviour. 192
Several theories have been proposed to explain performance decrements under 193
pressure. A prominent example is Reinvestment Theory (Masters, 1992). Reinvestment is 194
defined as the “propensity for manipulation of conscious, explicit rule based knowledge, by 195
working memory, to control the mechanics of one’s movements during motor output” 196
(Masters & Maxwell, 2004, p.208). Consequently, the use of explicit knowledge to 197
consciously control normally automatic movements typically results in performance 198
decrements or outright failure. Researchers have demonstrated that, when performing well-199
learnt motor skills or complex cognitive tasks, individuals who have a strong tendency to 200
reinvest (as measured by the Reinvestment Scale, Masters et al., 1993) (as measured by the 201
Reinvestment Scale) are more susceptible to poor performance under pressure (Jackson, 202
Kinrade, Hicks, & Wills, 2013; Kinrade, Jackson, & Ashford, 2010). 203
To address potentially differential effects of reinvestment on motor skill execution 204
and decision-making, Kinrade, Jackson, Ashford and Bishop (2010) modified the original 205
scale to create a decision-specific version focusing on individuals’ propensity to deliberate, 206
and ruminate, on their decisions – the Decision-Specific Reinvestment Scale (DSRS). 207
Kinrade et al. (2010) proposed two explanations for the breakdown of decision-making under 208
pressure. First, that conscious processing of explicit information results in poor decision-209
making, by interfering with normal automatic processes (Decision Reinvestment; e.g., “I’m 210
aware of the way my mind works when I make a decision”). Secondly, ruminative thoughts 211
(e.g., over past poor decisions) lead to poor decision-making by drawing processing resources 212
away from the task at hand (Decision Rumination; e.g., “I remember poor decisions I make 213
for a long time afterwards”). Kinrade et al., (2010) described rumination as a thought process 214

10
that typically involves repetitive negative thoughts about past events or current mood states. 215
Higher decision reinvesters and ruminators tend to exhibit poorer working memory task 216
performance, (Laborde, Furley, & Schempp, 2015) and poorer decision-making performance 217
in complex tasks (Kinrade, Jackson, & Ashford, 2015). Kinrade et al., (2015) suggested that 218
ruminative thoughts may occupy working memory capacity at a time when executive 219
functions are already in great demand to complete the primary task. Poolton, Sui and Masters 220
(2011) used the DSRS to examine soccer referees’ susceptibility to the home advantage 221
effect. Twenty-eight experienced referees were asked to make decisions when viewing game 222
footage of two opposing players competing for the ball, by stating which player committed 223
the foul. Referees that emerged as ‘high decision ruminators’ disproportionately made 224
decisions in favour of the home team. We aim to explore this link further in the present study, 225
in the context of netball officiating. 226
In order to more fully understand contextual and dispositional influences on the 227
decision-making of netball umpires, we used performance analysis to examine decisions 228
made by umpires during matches in the England Netball Superleague – the highest echelon of 229
competitive netball in the UK. We explored not only environmental and contextual influences 230
such as crowd size, but also the umpires’ self-reported tendency to reinvest in, and ruminate 231
upon, their decisions. The number of decisions made provided an overt manifestation of the 232
observed umpires’ behaviour, a technique previously used to categorise observational data 233
into approach- and avoidance-type behaviours (Jordet & Hartman, 2008). In accordance with 234
previous research (Anderson, 2003; Hill et al., 2016; Jordet & Hartman, 2008; Nevill et al., 235
2002; Poolton et al., 2011; Souchon et al., 2016), we tentatively hypothesised that umpires’ 236
decision frequency would be mediated by environmental/ contextual influences such as home 237
team status, crowd size, match prominence, league position, and time during the match. More 238

11
explicitly, we predicted that, home teams in the presence of larger crowds, greater match 239
significance, more prominent teams, and early match quarters would each be associated with 240
lower decision frequencies (i.e., avoidance behaviour). We also predicted that a tendency to 241
reinvest and ruminate would be associated with inhibited decision-making. 242
Method 243
Participants 244
Altogether, 15 umpires officiated in the Superleague during the 2014 season, 245
umpiring approximately eight matches each (M = 8.067, SD = 3.77). From this original 246
sample 10 umpires (M age = 39.6 yrs, SD = 9.38 yrs) with a mean total years’ experience of 247
14.5 years (M = 14.5 yrs, SD = 7.66 yrs), qualified at international (International Umpire 248
Award) or national level (A-award), completed the DSRS. On average, they officiated almost 249
nine matches each throughout the season (M = 8.80, SD = 2.859). 250
Measures 251
Data Acquisition. Video footage from sixty Netball Superleague 2014 season 252
matches was obtained. Crowd size (number of people present in the crowd) data were 253
collected from the individual teams for their home fixtures and from England Netball for all 254
‘neutral’ venues (i.e., those for which there was no home team). League table data for each 255
round were obtained from England Netball. Approval was obtained from the lead institution’s 256
local ethics committee. 257
Variables. All coded variables were derived from discussions with a panel of experts 258
(an England Netball Officiating Manager, a retired international umpire and assessor, a 259
current national level umpire and tutor) and in accordance with variables previously shown to 260
be pertinent with regard to sports officials’ decision-making (e.g., match importance, Hill et 261
al., 2016; Decision Rumination and the home advantage effect, Poolton et al., 2011). The 262

12
primary dependent variable was the number of observable decisions made (NoD), split into 263
three subcategories: overall; those against the home team; and those against the away team. 264
Other coded variables included: infringement type (contact, obstruction, offside, breaking, 265
out of court, and other infringement); and sanctions imposed (penalty pass, advantage, throw 266
in, advantage goal, other sanction.). Additionally, we recorded six variables that were 267
hypothesised to have a potential influence on umpires’ decision-making: crowd size; 268
competition round number (e.g., 1 = 1st round); league positions (of home teams, of away 269
teams, and average; 1 = top of the league); and match quarter (e.g., Q1 = 1st quarter). 270
Decision Specific Reinvestment Scale. Altogether, 10 umpires completed the 271
Decision-Specific Reinvestment Scale (DSRS, Kinrade et al., 2010), a 13-item scale, 272
comprising two subscales (Decision Reinvestment and Decision Rumination). Participants 273
responded to each of the 13 items using a 5-point Likert scale anchored by 0 (“extremely 274
uncharacteristic”) and 4 (“extremely characteristic”). The Decision Reinvestment subscale 275
comprises 6 items, assessing the individual’s propensity to consciously monitor their 276
decision-making processes, with scores ranging from 0 to 24. The Decision Rumination 277
subscale comprises 7 items, assessing tendency to negatively evaluate previous poor 278
decisions, with scores ranging from 0 to 28. Kinrade et al. (2010) reported an internal 279
consistency of .89 for the Decision Reinvestment subscale items and .91 for the Decision 280
Rumination subscale items. 281
Procedure 282
The matches were analysed using digital performance analysis software (Sportscode 283
Elite Version 9, Sportstec, Australia). A self-devised code window was designed to collect 284
the number of observable decisions, based on arm signals and vocalisations made by the 285
umpires during the matches. Observable decisions were infringements that were registered 286

13
and acted upon by the official by either a whistle blow or signalling advantage (this did not 287
include time calls e.g., injury, blood). Also, umpires can decide not to interfere with play 288
(Helsen & Bultynck, 2004) and these non-observable decisions were not recorded. Situations 289
in which decisions were unclear were coded separately (accounting for 1.4% of total 290
decisions made). Two researchers independently coded all the footage; intraclass correlation 291
coefficients were used to test for inter and intra-observer reliability (ICC >.90 for all). 292
Data Analyses 293
Preliminary screening of all data, using univariate z-scores (> ± 3.29) and multivariate 294
Mahalanobis distance values revealed one outlier from both the match and umpire data set 295
which were removed. The data were normally distributed. 296
A repeated-measures ANOVA was completed to compare differences in the NoD 297
made across quarters. The relationships between contextual/ environmental influences, 298
dispositional tendencies, and decision-making were examined using two different analyses: 299
one in which matches were treated as cases (n = 59), and another in which umpires were 300
cases (n = 15 [all umpires] or n = 10 [DSRS completer’s only, accounting for 72% of all 301
matches, n = 42]). Pearson’s product moment correlation coefficient was calculated for all 302
bivariate combinations of the following variables in the match analyses: NoD; per match and 303
per quarter; overall, in favour of home teams and in favour of away teams; crowd size; 304
competitive round number; and home, and away team league positions, and their average. For 305
the umpire analyses, bivariate correlations included total years of experience, Reinvestment, 306
Rumination and number of games umpired. For the match-level analysis, all variables that 307
were significantly related to NoD were entered as predictors into two stepwise multiple 308
regression analyses and one linear regression, in which backward elimination was used in 309
order to find a model that best explained the data. NoD, NoD Away, and NoD Home were 310

14
the criterion measures for each of the three models. Alpha was set at .05 for all statistical 311
tests. Due to the exploratory nature of the study, and accordingly tentative but directional 312
nature of the hypotheses, we made no correction for multiple comparisons. 313
Results 314
Descriptive statistics 315
The descriptive statistics are presented in Table 1. On average, umpires made 120 316
observable decisions per game (M = 120.41, SE = 4.07). A repeated-measures ANOVA 317
indicated that more decisions were made in the first quarter (M = 33.02, SE = 1.14) than in 318
the third (M = 29.63, SE = 1.16) and fourth (M = 27.72, SE = 1.61) quarters, (F (3, 39) = 319
4.811, p = .006, ηp2 = .270). The most common infringement type was contact (M = 45.69, SE 320
= 1.04), and the most frequently awarded sanction was a penalty (M = 48.77, SE = 1.37). 321
Descriptive statistics revealed that DSRS scores ranged from 15 to 35 (DSRS Global M = 322
25.50, SD = 6.67), and Reinvestment subscale score from 7 to 16 (Reinvestment M = 12.8, 323
SD = 2.82), and Rumination subscale score from 4 to 20 (Rumination M = 12.7, SD = 5.42). 324
Match-level Analysis 325
Total NoD. All match-level bivariate correlations are presented in Table 2. NoD 326
decreased as the average league position of the two teams increased (r = -.269, p = .040); that 327
is, the higher the positions of the two teams, the greater the NoD. Similarly, the higher the 328
home team league position (NB: top position in the league = 1), the greater the NoD (r = -329
.259, p = .047). As the teams progressed through the competition rounds, NoD increased (r = 330
266, p = .042). A backward stepwise regression was completed to identify the best predictors 331
for NoD (variables entered: average league position, round, and home league position). The 332
model that best predicted NoD included round and average team position (F (2, 58) = 3.919, 333
p = .026, R2Adjusted = .091), although, when considered individually, neither predictor 334
15
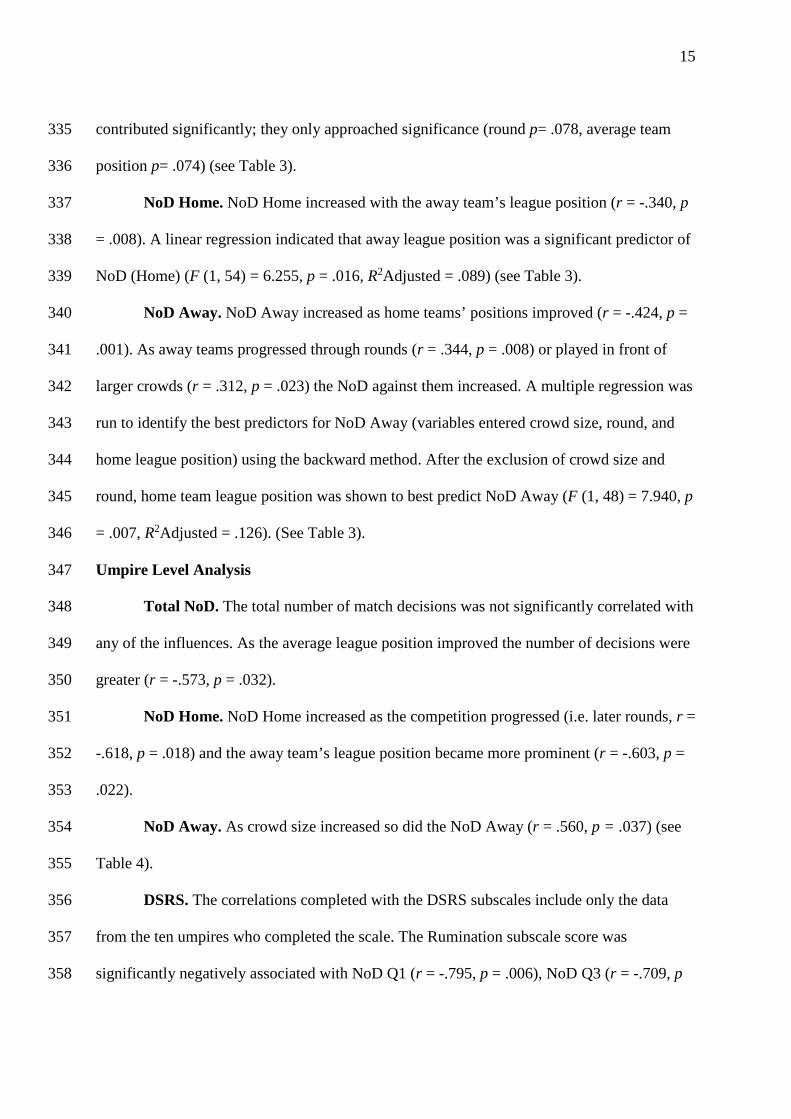
contributed significantly; they only approached significance (round p= .078, average team 335
position p= .074) (see Table 3). 336
NoD Home. NoD Home increased with the away team’s league position (r = -.340, p 337
= .008). A linear regression indicated that away league position was a significant predictor of 338
NoD (Home) (F (1, 54) = 6.255, p = .016, R2Adjusted = .089) (see Table 3). 339
NoD Away. NoD Away increased as home teams’ positions improved (r = -.424, p = 340
.001). As away teams progressed through rounds (r = .344, p = .008) or played in front of 341
larger crowds (r = .312, p = .023) the NoD against them increased. A multiple regression was 342
run to identify the best predictors for NoD Away (variables entered crowd size, round, and 343
home league position) using the backward method. After the exclusion of crowd size and 344
round, home team league position was shown to best predict NoD Away (F (1, 48) = 7.940, p 345
= .007, R2Adjusted = .126). (See Table 3). 346
Umpire Level Analysis 347
Total NoD. The total number of match decisions was not significantly correlated with 348
any of the influences. As the average league position improved the number of decisions were 349
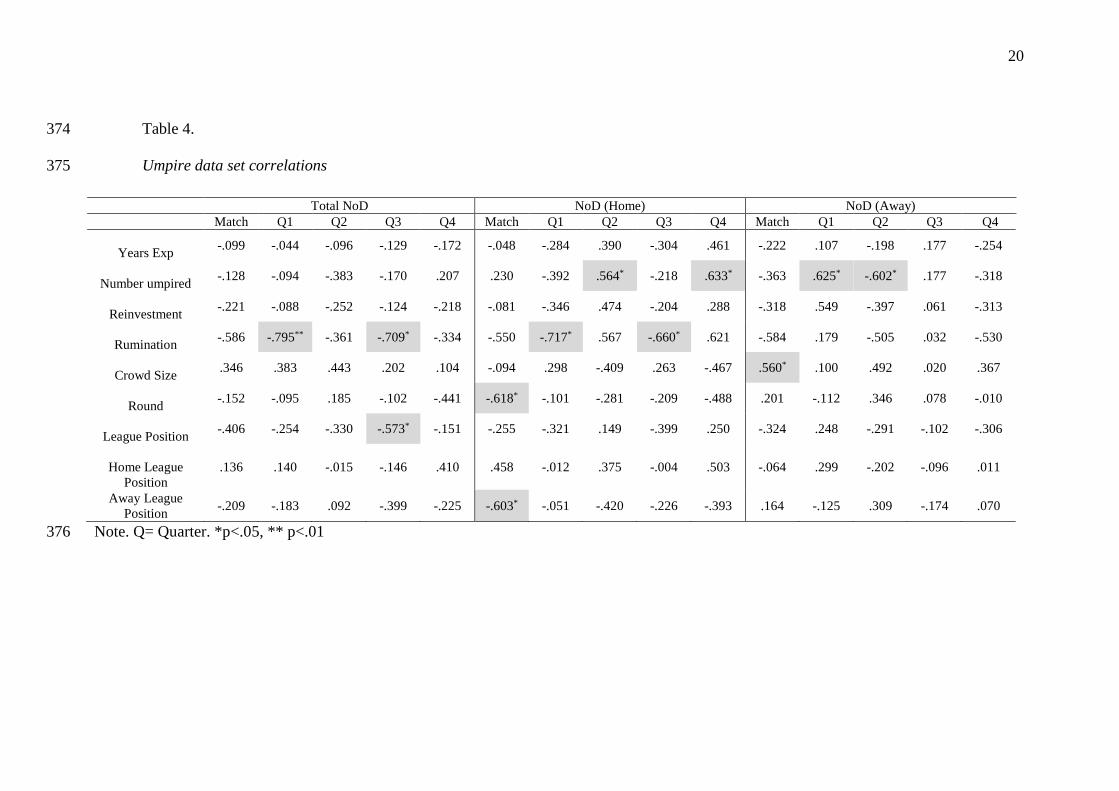
greater (r = -.573, p = .032). 350
NoD Home. NoD Home increased as the competition progressed (i.e. later rounds, r = 351
-.618, p = .018) and the away team’s league position became more prominent (r = -.603, p = 352
.022). 353
NoD Away. As crowd size increased so did the NoD Away (r = .560, p = .037) (see 354
Table 4). 355
DSRS. The correlations completed with the DSRS subscales include only the data 356
from the ten umpires who completed the scale. The Rumination subscale score was 357
significantly negatively associated with NoD Q1 (r = -.795, p = .006), NoD Q3 (r = -.709, p 358

16
= 022), NoD Home Q1 (r = -.717, p = .020) and NoD Home Q3 decisions (r = -.660, p = 359
.038); that is, higher Rumination subscale scores were associated with fewer decisions. 360
Reinvestment subscale scores were not significantly correlated with any NoD variables. 361
Table 1. Descriptive statistics-by umpire 362
Variable Mean Std Error Range Total number of decisions (NoD) 120.41 4.07 98.54 - 158.03
Q1 33.02 1.14 26.71 - 40.38
Q2 30.04 1.43 20.72 - 46.00
Q3 29.63 1.16 23.67 - 38.13
Q4 27.72 1.61 15.00 - 42.50
Decisions against home team (NoD Home) 59.74 1.80 43.00 - 68.57
Q1 17.80 1.19 12.14 - 27.17
Q2 13.74 0.82 8.83 - 18.42
Q3 15.04 1.16 10.00 - 23.50
Q4 13.17 1.06 5.00 - 18.56
Decisions against away team (NoD Away) 60.31 2.96 45.27 - 90.83
Q1 15.18 .784 9.33 - 22.00
Q2 16.38 1.87 7.09 - 37.16
Q3 14.39 .684 9.33 - 18.14
Q4 14.36 1.758 7.64 - 35.00
Neutral venue team match decisions 68.05 2.87 60.5 - 73 Simultaneous Match decisions 0.13 0.07 0 - 0.33 Infringements Contact 45.69 1.04 39-52.3
Obstruction 39.83 3.07 19-63.8
Offside 6.68 0.48 4.11-10.2
Breaking 6.21 0.62 2.2-10
Out 17.29 0.70 13.7-24
Other Infringement (n = 11) 6.07 0.41 2.56-8.44 Sanctions Penalty 48.77 1.37 39-61.2
Free 8.43 0.37 6.30-11.60
Advantage 35.48 2.81 21.33-62.8
Advantage Goal 9.02 0.83 3.00-16.13
Throw in 17.27 0.71 13.4-24.00
Other Penalty (n = 6) 1.43 0.34 0-4.5.00
363
Note. Neutral venue team match decisions refer to the average number of decisions 364
against teams at neutral grounds (n = 2, final and 3rd/4th play off matches). Simultaneous 365

17
match decisions refer to the number of decisions whereby no clear sanction could be awarded 366
against a specific team, and results in a toss-up. 367

18
Table 2. 368
Correlational Analysis – by Match (n = 59) 369
Total NoD NoD (Home) NoD (Away)
Match Q1 Q2 Q3 Q4
Match Q1 Q2 Q3 Q4
Match Q1 Q2 Q3 Q4
Round Number
.266* .188 .173 .279* .191 .042 .046 .045 .064 -.048 .344** .220 .170 .276* .256
Home League Position
-.258* -.152 -.233 -.211 -.231
.069 -.027 .171 -.060 .129
-.424** -.188 -.413** -.200 -.362**
Away League Position
-.063 -.215 .069 -.116 .116
-.340** -.285* -.232 -.258* -.147
.186 -.043 .266* .052 .244
Average Team
Position
-.269* -.305* -.139 -.273* -.098
-.223 -.258* -.048 -.263* -.013
-.203 -.193 -.128 -.126 -.104
Crowd Size
.236 .205 .171 .194 .170 .025 .128 -.160 .174 -.118 .312* .167 .337* .099 .286*
Note. Q= Quarter.*p<.05, ** p<.01.370

19
Table 3. 371
Multiple and Linear Regression Data 372
373 b SEB β p NoD Step 1 Constant 255.360 21.205 .000 Average League Position -5.160 4.685 -.175 .276
Home League Position -1.724 2.850 -.098 .548 Round 1.974 1.213 .212 .109
R2Adjusted
= .081, ∆R2 = .129 Step 2 Constant 253.939 20.955 .000 Average League Position -6.840 3.752 -.231 .074
Round 2.122 1.181 .228 .078 R2
Adjusted = .091, ∆R2 = -.006
NoD Home Constant 135.102 6.641 .000 Away League Position -3.299 1.319 -.325 .016 R2
Adjusted = .089, ∆R2 = .106
NoD Away Step 1 Constant 116.949 27.269 .000 Crowd Size .013 .027 .085 .642
Home League Position -3.711 2.289 -.297 .112 Round 1.399 .971 .195 .156
R2Adjusted
= .186, ∆R2 = .186 Step 2 Constant 128.369 12.000 .000 Home League Position -4.430 1.679 -.355 .011
Round 1.396 .962 .195 .154 R2
Adjusted = .182, ∆R2 = -.004
Step 3 Constant 140.132 8.950 .000 Home League Position -4.746 1.684 -.380 .007 R2
Adjusted = .126, ∆R2 = -.037
20
Table 4. 374
Umpire data set correlations 375
Note. Q= Quarter. *p<.05, ** p<.01 376
Total NoD NoD (Home) NoD (Away)
Match Q1 Q2 Q3 Q4 Match Q1 Q2 Q3 Q4 Match Q1 Q2 Q3 Q4
Years Exp -.099 -.044 -.096 -.129 -.172 -.048 -.284 .390 -.304 .461 -.222 .107 -.198 .177 -.254
Number umpired -.128 -.094 -.383 -.170 .207 .230 -.392 .564* -.218 .633* -.363 .625* -.602* .177 -.318
Reinvestment -.221 -.088 -.252 -.124 -.218 -.081 -.346 .474 -.204 .288 -.318 .549 -.397 .061 -.313
Rumination -.586 -.795** -.361 -.709* -.334 -.550 -.717* .567 -.660* .621 -.584 .179 -.505 .032 -.530
Crowd Size .346 .383 .443 .202 .104 -.094 .298 -.409 .263 -.467 .560* .100 .492 .020 .367
Round -.152 -.095 .185 -.102 -.441 -.618* -.101 -.281 -.209 -.488 .201 -.112 .346 .078 -.010
League Position -.406 -.254 -.330 -.573* -.151 -.255 -.321 .149 -.399 .250 -.324 .248 -.291 -.102 -.306
Home League
Position .136 .140 -.015 -.146 .410 .458 -.012 .375 -.004 .503 -.064 .299 -.202 -.096 .011
Away League Position -.209 -.183 .092 -.399 -.225 -.603* -.051 -.420 -.226 -.393 .164 -.125 .309 -.174 .070

21
Discussion 377
In an exploratory study, we examined the influence of contextual and dispositional 378
differences on decision-making of umpires in actual match settings. We hypothesised, based 379
on existing literature, that environmental and contextual influences (i.e., larger crowds, more 380
prominent teams, greater match significance, and early quarters) would be associated with 381
lower decision frequencies. Furthermore, we predicted that inhibited decision-making would 382
be associated with a dispositional tendency to reinvest and ruminate. In line with our 383
hypotheses, match prominence and league position were associated with a reduction in the 384
number of decisions. The Decision Rumination factor was linked with inhibited decision 385
making; but contrary to our hypothesis, the Reinvestment factor was unrelated. In contrast to 386
our hypotheses, increasing crowd size was associated with a greater number of decisions, 387
particularly against away teams; and the number of decisions diminished throughout a match. 388
Our data indicated that more decisions were made in Q1 (33 decisions) than in Q3 (29 389
decisions) and Q4 (27 decisions), incongruent to our hypothesis and the findings by Mallo et 390
al. (2012) and Elsworthy et al. (2014). These differences could be related to physical fitness 391
and fatigue of umpires; for example, Paget (2015) found that the distance covered by netball 392
umpires was significantly reduced in the fourth quarter. It is possible that, if umpires are 393
physically fatigued and not covering the same distances as they did in the early stages of a 394
match, the fewer decisions later in the game could be those missed or avoided as a result of 395
incorrect positioning. Multiple researchers have highlighted the link between position 396
(distance and angle) of soccer referees and decision performance (e.g., Gilis, Helsen, 397
Catteeuw, & Wagemans, 2008; Mallo et al., 2012; Oudejans et al., 2000; Oudejans et al., 398
2005). For example, Mallo et al. (2012) demonstrated referees had a lower number of 399
incorrect decisions when the referees were positioned in the central area of the field. 400

22
Research in medical and military settings has shown that fatigue and physical exertion have a 401
detrimental effect on decision-making (e.g., Kovacs & Croskerry, 1999; Larsen, 2001). 402
However, in sport contexts, decision-making performance was shown to be unaffected by 403
physical exertion in Australian football umpires (Elsworthy, Burke, Scott, Stevens, & 404
Dascombe, 2014; Paradis, Larkin, & O’Connor, 2015), fatigue in English Premier League 405
assistant referees (Catteeuw, Gilis, Wagemans, & Helsen, 2010) or physical performance of 406
New Zealand Football Championship referees (Mascarenhas et al., 2009). Thus, it is possible 407
the change in the number of decisions is in response to the reducing work rate of the players 408
or level of performance. For example, Weston and colleagues (Weston, Bird, Helsen, Nevill, 409
& Castagna, 2006; Weston et al., 2012) found that soccer referees and players high intensity 410
running distance, ball travel, and total distance covered were correlated. However, further 411
research is required to understand the link between player and referee physical performances 412
and their impact on referee decision-making. 413
As suggested by Poolton et al (2011), higher Rumination subscale scores, and not 414
Reinvestment scores, were strongly associated (r > -.7) with fewer decisions in Q1 and Q3. 415
Notably, higher ruminators made fewer decisions against home teams during those quarters. 416
Burke, Joyner, Pim, and Czech (2000) demonstrated that basketball officials’ cognitive 417
anxiety was higher pre-game, and at half time when compared to post-game. It is possible 418
that prior to the start of the game, where officials arrive at the venue early and watch the 419
teams’ warm-up pre-game, and during the half-time break, there is greater potential for 420
officials to engage in ruminative thoughts than during the smaller breaks taken between 421
Quarters 1 and 2, and 3 and 4. To our knowledge, no researchers have investigated the timing 422
of sports officials’ decision ruminations. However, Roy, Memmert, Frees, Radzevick, Pretz 423
and Noel (2016) explored the timing of rumination by asking hockey players to rate on a 5-424
23
point scale whether they would continue to think about the play when it was over and their 425
role in the play (past play), and how the team and individual would perform in the rest of the 426
match (future play). Their results indicated that participants were unlikely to think about 427
previous play after it was over, or about how the game would unfold; however, they were 428
more likely to think about past play than future play. The authors suggested that the low 429
rumination observed in successful field hockey players could reflect that people low in 430
rumination do best in tasks requiring quick shifts of attention (such as dynamic team sports). 431
Alternatively, a possible explanation might be that umpires engage in avoidance behaviours 432
to reduce the chance of scrutiny of their decisions (Anderson, 2003). Contrary to our 433
hypothesis, but consistent with Poolton et al. (2011), Reinvestment subscales scores were not 434
related to the number of decisions. 435
A home advantage effect was observed; the descriptive statistics indicated that more 436
decisions were awarded against away teams, supporting findings in soccer, that home teams 437
were awarded more penalties (Nevill et al., 1996) and that more yellow cards were awarded 438
to away teams (Goumas, 2014). Factors purported to contribute to the home advantage 439
include travel (i.e. greater time and distances for the away team), referee bias, familiarity and 440
crowd size (Pollard, 2008). Furthermore, the correlations suggested that for matches in later 441
rounds, where there is often greater importance due to more matches influencing final 442
placings, play-offs and finals, fewer decisions were awarded against home teams. One 443
explanation could be that officials exhibit avoidance-type behaviours to cope with the 444
increases in anxiety resulting from increased perceived importance. Hill et al. (2016) found 445
that rugby referees highlighted the importance of the game as one of the stressors affecting 446
their performance, and that some referees use avoidance coping methods (e.g., Jordet & 447
Hartman, 2008) to manage this stressor. It is possible that umpire experience could have 448

24
confounded these figures, however a correlation between round and the umpires years of 449
experience, where you might expect the most experienced umpires to officiate the latter 450
rounds, was non-significant (r = .126, p = 728). 451
Our results are consistent with previous research (e.g., Boyko et al., 2007; Page & 452
Page, 2010) where increases in crowd size were associated with an increase in the number of 453
decisions against away teams. One possible explanation is that when faced with a difficult 454
decision, officials draw on other salient cues (e.g., crowd noise), particularly when placed 455
under time constraints (Balmer et al., 2007). In order to reduce the complexity of a decision 456
(Souchon et al., 2010) umpires’ may use simple heuristics (Raab, 2012). For example, if two 457
opposing players contested a ball and the umpire was unsure of the penalty decision, they 458
may place equal weight on the auditory crowd cues as they do their visual information. 459
Crowd noise typically favours the home team, resulting in more decisions against away teams 460
(Nevill & Holder, 1999). This finding is reflected in our data, with larger crowd sizes 461
associated with more decisions against away teams. Alternatively, researchers have reported 462
that crowd noise induces a reluctance to penalise the home team (Nevill et al., 2002) (i.e., an 463
absence of crowd noise indicates to the referee that no serious offence has been committed). 464
The number of years’ experience was not associated with the number of decisions 465
made. This may be due to the number of years’ experience umpiring at Superleague level 466
(which was not recorded) or that there was little to no difference in qualification (Hancock & 467
Ste-Marie, 2013). Other researchers have found the referee’s experience to influence decision 468
-making. Nevill et al. (2002) found as referees experience increased, that more fouls were 469
awarded against home players, until a peak of 16 years, where upon a decline was then 470
observed. However, the number of games umpired was positively associated with 471

25
Reinvestment subscale scores. Potentially, those umpires who deliberate more on their 472
decisions are deemed more effective and are therefore requested to umpire more often. 473
League position predicted fewer decisions against home teams when playing lower 474
positioned away teams, and for away teams playing lower positioned home teams. This 475
finding may be similar to the reputation bias of judges found by Findlay and Ste-Marie 476
(2004) and Plessner (1999) whereby teams with a better performance reputation may be 477
sanctioned less. Alternatively, it is possible that the results of this study could be explained 478
by the differences in players (e.g., lower ability teams or less competitive matches), or 479
players’ susceptibility to pressure, and not that of the officials. Previously, researchers have 480
reported that yellow cards against away players in soccer could be a consequence of a poorer 481
psychological state when compared with playing at home (Bray, Jones, & Owen, 2002; 482
Terry, Walrond, & Carron, 1998). 483
There were several limitations that need to be acknowledged. First, we had 484
incomplete data for crowd size, resulting in six matches being excluded from the crowd size 485
analyses. Similarly, not all umpires who officiated the season completed the DSRS and were 486
therefore excluded from the correlational analyses. However, those who did complete the 487
DSRS officiated 72% of the matches analysed. Second, the accuracy of decisions was not 488
recorded, preventing insight into the performance change of umpires exposed to different 489
contextual and environmental conditions or comparisons between those with greater or lesser 490
disposition to ruminate. However, it was not practically possible to obtain objective 491
assessments of every decision made by the officials across the season. We also acknowledge 492
that rumination is often seen as a negative process (referring to passive self-critical 493
worrisome or anxious thinking, Trapnell, & Campbell, 1999; Treynor, Gonzalez, Nolen-494
Hoeksema, 2003), whereas self-reflection (considered to be a motivated process aimed at 495

26
understanding in the self and overcoming problems and difficulties, Trapnell, & Campbell, 496
1999; Treynor et al., 2003) on performance is an important post-game learning tool used by 497
sports officials (MacMahon et al.,2015). Although the DSRS items refer to negative 498
ruminative thoughts, our study design did not allow us to collect data on the types or timings 499
of rumination/reflection. Further investigation is required to examine the relationship 500
between rumination and performance in sports officials, with reference to the types 501
(rumination versus reflection) and timings (before, during, and after performance) of 502
ruminations officials’ make through self-report or stimulated recall. 503
Third, we cannot isolate the influence of each potential bias using the current study 504
design. The number of decisions umpires make may be a result of a combined effect of crowd 505
sizes, league position, round, and time. For example, you might expect later rounds to have 506
greater crowd sizes, which could have confounded our data. However, a correlation between 507
round and crowd size, was not significant (r = .136 p = .326). It would be beneficial to 508
investigate these effects in isolation in a controlled environment in order to draw clearer 509
conclusions regarding the potential influence of these factors. Furthermore, we cannot be 510
certain that the players’ performance was not affected by the same contextual, environmental 511
or dispositional influences, leading the umpires to adjust their decision-making accordingly. 512
Finally, we used observational data and descriptive and correlational analyses. An advantage 513
of the use of observational data is the high external validity, making the results easily 514
interpretable and applicable in the real world. While our approach is novel and the study 515
presents the first empirically based analysis of netball officiating behaviour we cannot infer 516
causality from the findings. In future, controlled experiments are required to establish any 517
causal links that may be implied in our data. For example, future research should examine the 518
specific crowd factors that lead to changes in decision-making behaviour such as examining 519

27
the impact of volume on decision-making, where crowd size has been linked to crowd noise 520
(Hayne, Taylor, Rumble, & Mee, 2011); or investigating the semantics of crowd members 521
(e.g., relevant or irrelevant to the decision, Bishop, Moore, Horne, & Teszka, 2014). 522
In summary, we explored putative contextual/environmental and dispositional 523
influences on netball umpires’ decision-making. We observed a home advantage effect, 524
whereby more decisions were awarded against away teams when crowd sizes were greater. 525
We found a reduction in the number of observable decisions made, against teams with higher 526
status, in more important matches, as the time played in a match decreased and as a function 527
of increasing levels of Decision Rumination. Our study presents the first empirically-driven 528
task analysis of the demands of refereeing in netball and highlights a number of key areas for 529
which follow-up research comprising experimental designs and manipulations may be 530
employed. 531
References 532
Anderson, C. J. (2003). The psychology of doing nothing: Forms of decision avoidance result 533
from reason and emotion. Psychological Bulletin, 129(1), 139. 534
Balmer, N. J., Nevill, A. M., Lane, A. M., Ward, P., Williams, A. M., & Fairclough, S. H. 535
(2007). Influence of crowd noise on soccer refereeing consistency in soccer. Journal of 536
Sport Behavior, 30(2), 130. 537
Beattie, J., Baron, J., Hershey, J. C., & Spranca, M. D. (1994). Psychological determinants of 538
decision attitude. Journal of Behavioral Decision Making, 7(2), 129-144. 539

28
Bishop, D. T., Moore, S., Horne, S., & Teszka, R. (2014). Attentional capture by spoken 540
language: Effects on netballers’ visual task performance. Journal of Sports Sciences, 541
32(17), 1611-1620. doi:10.1080/02640414.2014.908323 542
Boyko, R. H., Boyko, A. R., & Boyko, M. G. (2007). Referee bias contributes to home 543
advantage in english premiership football. Journal of Sports Sciences, 25(11), 1185-544
1194. doi:10.1080/02640410601038576 545
Bray, S. R., Jones, M. V., & Owen, S. (2002). The influence of competition location on 546
athletes' psychological states. Journal of Sport Behavior, 25(3), 231. 547
Buraimo, B., Forrest, D., & Simmons, R. (2010). The 12th man?: Refereeing bias in english 548
and german soccer. Journal of the Royal Statistical Society: Series A (Statistics in 549
Society), 173(2), 431-449. doi:10.1111/j.1467-985X.2009.00604.x 550
Burke, K. L., Joyner, A. B., Pim, A., & Czech, D. R. (2000). An exploratory investigation of 551
the perceptions of aniexty among basketball officials before, during, and after the 552
contest. Journal of Sport Behavior, 23(1), 11. 553
Catteeuw, P., Gilis, B., Wagemans, J., & Helsen, W. (2010). Offside decision making of 554
assistant referees in the english premier league: Impact of physical and perceptual-555
cognitive factors on match performance. Journal of Sports Sciences, 28(5), 471-481. 556
doi:10.1080/02640410903518184 557
Elsworthy, N., Burke, D., & Dascombe, B. (2014). Factors relating to the decision-making 558
performance of australian football officials. International Journal of Performance 559
Analysis in Sport, 14(2), 401-410. 560

29
Elsworthy, N., Burke, D., Scott, B. R., Stevens, C. J., & Dascombe, B. J. (2014). Physical 561
and decision-making demands of australian football umpires during competitive 562
matches. Journal of Strength and Conditioning Research, 28(12), 3502-3507. 563
doi:10.1519/JSC.0000000000000567 [doi] 564
Emmonds, S., O'Hara, J., Till, K., Jones, B., Brightmore, A., & Cooke, C. (2015). 565
Physiological and movement demands of rugby league referees: Influence on penalty 566
accuracy. Journal of Strength and Conditioning Research, 29(12), 3367-3374. 567
doi:10.1519/JSC.0000000000001002 [doi] 568
Findlay, L. C., & Ste-Marie, D. M. (2004). A reputation bias in figure skating judging. 569
Journal of Sport and Exercise Psychology, 26(1), 154-166. doi:10.1123/jsep.26.1.154 570
Gilis, B., Helsen, W., Catteeuw, P., & Wagemans, J. (2008). Offside decisions by expert 571
assistant referees in association football: Perception and recall of spatial positions in 572
complex dynamic events. Journal of Experimental Psychology.Applied, 14(1), 21-35. 573
doi:10.1037/1076-898X.14.1.21 574
Goumas, C. (2014). Home advantage in australian soccer. Journal of Science and Medicine in 575
Sport, 17(1), 119-123. doi:10.1016/j.jsams.2013.02.014 576
Hancock, D. J., & Ste-Marie, D. M. (2013). Gaze behaviors and decision making accuracy of 577
higher-and lower-level ice hockey referees. Psychology of Sport and Exercise, 14(1), 66-578
71. doi:10.1016/j.psychsport.2012.08.002 579
Hayne, M. J., Taylor, J. C., Rumble, R. H., & Mee, D. J. (2011). Prediction of noise from 580
small to medium sized crowds. Acoustics, Gold Coast, Australia. 581

30
Helsen, W., & Bultynck, J. (2004). Physical and perceptual-cognitive demands of top-class 582
refereeing in association football. Journal of Sports Sciences, 22(2), 179-189. 583
doi:10.1080/02640410310001641502 584
Hill, D. M., Hanton, S., Matthews, N., & Fleming, S. (2010). A qualitative exploration of 585
choking in elite golf. Journal of Clinical Sport Psychology, 4(3), 221-240. 586
doi:10.1123/jcsp.4.3.221 587
Hill, D. M., Matthews, N., & Senior, R. (2016). The psychological characteristics of 588
performance under pressure in professional rugby union referees. The Sport 589
Psychologist, Advance online publication doi:10.1123/tsp.2015-0109 590
Jackson, R. C., Kinrade, N. P., Hicks, T., & Wills, R. (2013). Individual propensity for 591
reinvestment: Field-based evidence for the predictive validity of three scales. 592
International Jounral of Sport Psychology, 44(4), 331-350. 593
doi:10.7352/IJSP2013.44.331 594
Johnston, R. (2008). On referee bias, crowd size, and home advantage in the english soccer 595
premiership. Journal of Sports Sciences, 26(6), 563-568. 596
doi:10.1080/02640410701736780 597
Jones, M. (2007). Home advantage in the NBA as a game-long process. Journal of 598
Quantitative Analysis in Sports, 3(4), 2-14. doi:10.2202/1559-0410.1081 599
Jordet, G., & Hartman, E. (2008). Avoidance motivation and choking under pressure in 600
soccer penalty shootouts. Journal of Sport & Exercise Psychology, 30(4), 450-457. 601
doi:10.1123/jsep.30.4.450 602

31
Kinrade, N. P., Jackson, R. C., & Ashford, K. J. (2015). Reinvestment, task complexity and 603
decision making under pressure in basketball. Psychology of Sport and Exercise, 20, 11-604
19. doi:10.1016/j.psychsport.2015.03.007 605
Kinrade, N. P., Jackson, R. C., & Ashford, K. J. (2010). Dispositional reinvestment and skill 606
failure in cognitive and motor tasks. Psychology of Sport & Exercise, 11(4), 312-319. 607
doi:10.1016/j.psychsport.2010.02.005 608
Kinrade, N. P., Jackson, R. C., Ashford, K. J., & Bishop, D. T. (2010). Development and 609
validation of the decision-specific reinvestment scale. Journal of Sports Sciences, 610
28(10), 1127-1135. doi:10.1080/02640414.2010.499439 611
Kovacs, G., & Croskerry, P. (1999). Clinical decision making: An emergency medicine 612
perspective. Academic Emergency Medicine, 6(9), 947-952. doi:10.1111/j.1553-613
2712.1999.tb01246.x 614
Laborde, S., Furley, P., & Schempp, C. (2015). The relationship between working memory, 615
reinvestment, and heart rate variability. Physiology & Behavior, 139, 430-436. 616
doi:10.1016/j.physbeh.2014.11.036 617
Larsen, R. P. (2001). Decision making by military students under severe stress. Military 618
Psychology, 13(2), 89-98. doi:10.1207/S15327876MP1302_02 619
Luce, M. F., Bettman, J. R., & Payne, J. W. (1997). Choice processing in emotionally 620
difficult decisions. Journal of Experimental Psychology: Learning, Memory, and 621
Cognition, 23(2), 384. 622

32
MacMahon, C., Mascarenhas, D. R. D., Plessner, H., Pizzera, A., Oudejans, R. R. D., & 623
Raab, M. (2015). Sports officials and officiating: Science and practice. Abingdon, Oxon: 624
Routledge. 625
Mallo, J., Frutos, P. G., Juárez, D., & Navarro, E. (2012). Effect of positioning on the 626
accuracy of decision making of association football top-class referees and assistant 627
referees during competitive matches. Journal of Sports Sciences, 30(13), 1437-1445. 628
doi:10.1080/02640414.2012.711485 629
Marcelino, R., Mesquita, I., Palao, J., & Sampaio, J. (2009). Home advantage in high-level 630
volleyball varies according to set number. Journal of Sports Science and Medicine, 8(3), 631
352-356. 632
Mascarenhas, D. R. D., Button, C., O'Hare, D., & Dicks, M. (2009). Physical performance 633
and decision making in association football referees: A naturalistic study. International 634
Journal of Sport Psychology, 37(2/3), 99. 635
Mascarenhas, D. R. D., O'Hare, D., & Plessner, H. (2006). The psychological and 636
performance demands of association football refereeing. International Journal of Sport 637
Psychology, 37(2/3), 99. 638
Masters, R. S. W. (1992). Knowledge, knerves and know how- the role of explicit versus 639
implicit knowledge in the breakdown of complex motor skill under pressure. British 640
Journal of Psychology, 83(3), 343-358. 641
Masters, R. S. W., & Maxwell, J., P. (2004). Implicit motor learning, reinvestment and 642
movement disruption: What you don't know won't hurt you? In A. M. Williams, & N. J. 643

33
Hodges (Eds.), Skill aquisition in sport: Research, theory, and practice (Second ed., pp. 644
207). New York: Routledge. 645
Masters, R. S. W., Polman, R. C. J., & Hammond, N. V. (1993). ‘Reinvestment’: A 646
dimension of personality implicated in skill breakdown under pressure. Personality and 647
Individual Differences, 14(5), 655-666. doi:10.1016/0191-8869(93)90113-H 648
Morris, G., & O’Connor, D. (2016). Key attributes of expert NRL referees. Journal of Sports 649
Sciences, , 1-6. 650
Nevill, A. M., Balmer, N. J., & Williams, A. M. (2002). The influence of crowd noise and 651
experience upon refereeing decisions in football. Psychology of Sport and Exercise, 3(4), 652
261-272. doi:10.1016/S1469-0292(01)00033-4 653
Nevill, A. M., & Holder, R. L. (1999). Home advantage in sport. Sports Medicine, 28(4), 654
221-236. doi:10.2165/00007256-199928040-00001 655
Nevill, A. M., Hemingway, A., Greaves, R., Dallaway, A., & Devonport, T. J. (2016). 656
Inconsistency of decision-making, the achilles heel of referees. Journal of Sports 657
Sciences, , 1-5. 658
Nevill, A. M., Newell, S. M., & Gale, S. (1996). Factors associated with home advantage in 659
english and scottish soccer matches. Journal of Sports Sciences, 14(2), 181-186. 660
doi:10.1080/02640419608727700 661

34
Nibbeling, N., Oudejans, R. R., & Daanen, H. A. (2012). Effects of anxiety, a cognitive 662
secondary task, and expertise on gaze behavior and performance in a far aiming task. 663
Psychology of Sport and Exercise, 13(4), 427-435. doi:10.1123/jsep.30.4.450 664
Nieuwenhuys, A., Pijpers, J. R., Oudejans, R. R. D., & Bakker, F. C. (2008). The influence of 665
anxiety on visual attention in climbing. Journal of Sport & Exercise Psychology, 30(2), 666
171-185. doi:10.1123/jsep.30.2.171 667
Oudejans, R. R. D., Verheijen, R., Bakker, F. C., Gerrits, J. C., Steinbrückner, M., & Beek, P. 668
J. (2000). Errors in judging 'offside' in football. Nature, 404(6773), 33-33. 669
doi:10.1038/35003639 670
Oudejans, R. R. D., Bakker, F. C., Verheijen, R., Gerrits, J. C., Steinbruckner, M., & Beek, P. 671
J. (2005). How position and motion of expert assistant referees in soccer relate to the 672
quality of their offside judgements during actual match play. International Journal of 673
Sport Psychology, 36(1), 3-21. doi:1871/50780 674
Page, K., & Page, L. (2010). Alone against the crowd: Individual differences in referees 675
ability to cope under pressure. Journal of Economic Psychology, 31(2), 192-199. 676
doi:10.1016/j.joep.2009.08.007 677
Paget, N. (2015). Performance analysis of high performance netball umpires for match-play 678
and fitness demands (Doctoral dissertation, Auckland University of Technology). 679
doi:10292/8963 680

35
Paradis, K., Larkin, P., & O’Connor, D. (2015). The effects of physical exertion on decision-681
making performance of australian football umpires. Journal of Sports Sciences, 34(16), 682
1535-1541. doi:10.1080/02640414.2015.1122205 683
Plessner, H. (1999). Expectation biases in gymnastics judging. Journal of Sport & Exercise 684
Psychology, 21(2), 131-144. doi:10.1123/jsep.21.2.131 685
Plessner, H., & MacMahon, C. (2013). The sports official in research and practice. In D. 686
Farrow, J. Baker & C. MacMahon (Eds.), Developing sport expertise: Researchers and 687
coaches put theory into practice (Second ed., pp. 71-131). New York: Routledge. 688
Pollard, R. (2008). Home advantage in football: A current review of an unsolved puzzle. The 689
Open Sports Sciences Journal, 1(1), 12-14. doi:10.2174/1875399X00801010012 690
Poolton, J., Siu, C. M., & Masters, R. S. W. (2011). The home team advantage gives football 691
referees something to ruminate about. International Journal of Sports Science and 692
Coaching, 6(4), 545-552. doi:10.1260/1747-9541.6.4.545 693
Raab, M. (2012). Simple heuristics in sports. International Review of Sport and Exercise 694
Psychology, 5(2), 104-120. doi:10.1080/1750984X.2012.654810 695
Renden, P. G., Landman, A., Geerts, S. F., Jansen, S. E. M., Faber, G. S., Savelsbergh, G. J. 696
P., & Oudejans, R. R. D. (2014). Effects of anxiety on the execution of police arrest and 697
self-defense skills. Anxiety, Stress & Coping, 27(1), 100-112. 698
doi:10.1080/10615806.2013.810213 699

36
Roy, M. M., Memmert, D., Frees, A., Radzevick, J., Pretz, J., & Noel, B. (2016). Rumination 700
and performance in dynamic, team sport. Frontiers in Psychology, 6, 2016. 701
doi:10.3389/fpsyg.2015.02016 702
Schnyder, U., & Hossner, E. (2016). Decision making in football officiating: An interview 703
study with top-level referees. Research Quarterly for Exercise and Sport, 87(S1), S81. 704
Scoppa, V. (2008). Are subjective evaluations biased by social factors or connections?: An 705
econometric analysis of soccer referee decisions. Empirical Economics, 35(1), 123-140. 706
doi:10.1007/s00181-007-0146-1 707
Souchon, N., Cabagno, G., Traclet, A., Dosseville, F., Livingstone, A. G., Jones, M. V., & 708
Maio, G. R. (2010). Referees’ decision-making and player gender: The moderating role 709
of the type of situation. Journal of Applied Sport Psychology, 22(1), 1-16. 710
doi:10.1080/10413200903250476 711
Souchon, N., Cabagno, G., Traclet, A., Trouilloud, D., & Maio, G. R. (2009). Referees' use 712
of heuristics: The moderating impact of standard of competition. Journal of Sports 713
Sciences, 27(7), 695-700. 714
Souchon, N., Livingstone, A. G., Bardin, B., Rascle, O., Cabagno, G., & Maio, G. R. (2016). 715
Influence of competition level on referees’ decision-making in handball. Social 716
Influence, , 1-13. 717
Stulp, G., Buunk, A. P., Verhulst, S., & Pollet, T. V. (2012). High and mighty: Height 718
increases authority in professional refereeing. Evolutionary Psychology : An 719

37
International Journal of Evolutionary Approaches to Psychology and Behavior, 10(3), 720
588-601. doi:10.1177/147470491201000314 721
Sutter, M., & Kocher, M. G. (2004). Favoritism of agents - the case of referees' home bias. 722
Journal of Economic Psychology, 25(4), 461-469. doi:10.1016/S0167-4870(03)00013-8 723
Trapnell, P. D., & Campbell, J. D. (1999). Private self-consciousness and the five-factor 724
model of personality: Distinguishing rumination and reflection. Journal of Personality 725
and Social Psychology, 76 (2), 284-304. doi: 10.1037/0022-3514.76.2.284 726
Treynor, W., Gonzalez, R., & Nolen-Hoeksema, S. (2003). Rumination reconsidered: A 727
psychometric analysis. Cognitive therapy and research, 27(3), 247-259. doi: 728
10.1023/A:1023910315561 729
Terry, P. C., Walrond, N., & Carron, A. V. (1998). The influence of game location on 730
athletes' psychological states. Journal of Science and Medicine in Sport, 1(1), 29-37. 731
doi:10.1016/S1440-2440(98)80006-6 732
Unkelbach, C., & Memmert, D. (2010). Crowd noise as a cue in referee decisions contributes 733
to the home advantage. Journal of Sport and Exercise Psychology, 32(4), 483-498. 734
Weston, M., Bird, S., Helsen, W., Nevill, A. M., & Castagna, C. (2006). The effect of match 735
standard and referee experience on the objective and subjective match workload of 736
english premier league referees. Journal of Science and Medicine in Sport, 9(3), 256-737
262. doi:10.1016/j.jsams.2006.03.022 738

38
Weston, M., Castagna, C., Impellizzeri, F. M., Bizzini, M., Williams, A. M., & Gregson, W. 739
(2012). Science and medicine applied to soccer refereeing. Sports Medicine, 42(7), 615-740
631. doi:10.2165/11632360-000000000-00000 741
742