
7th International Conference on ESAR „Expert Symposium on ... · 7th International Conference on...
308
Fahrzeugtechnik Heft F 117 Berichte der Bundesanstalt für Straßenwesen 7th International Conference on ESAR „Expert Symposium on Accident Research“
Transcript of 7th International Conference on ESAR „Expert Symposium on ... · 7th International Conference on...

Fahrzeugtechnik Heft F 117
Berichte derBundesanstalt für Straßenwesen
7th InternationalConference on ESAR
„Expert Symposium onAccident Research“
7th InternationalConference on ESAR
„Expert Symposium onAccident Research“
Reports on the ESAR-Conference 2016at Hannover Medical School
organized by
Accident Research Unit at Hannover Medical School (MHH)
Federal Highway Research InstituteBergisch Gladbach (BASt)
Research Association of German Car ManufacturersFrankfurt/M., (FAT)
University of TechnologyDresden
Berichte derBundesanstalt für Straßenwesen
Fahrzeugtechnik Heft F 117
Die Bundesanstalt für Straßenwesenveröffentlicht ihre Arbeits- und Forschungs- ergebnisse in der Schriftenreihe Berichte derBundesanstalt für Straßenwesen. Die Reihebesteht aus folgenden Unterreihen:
A - AllgemeinesB - Brücken- und IngenieurbauF - FahrzeugtechnikM - Mensch und SicherheitS - StraßenbauV - Verkehrstechnik
Es wird darauf hingewiesen, dass die unterdem Namen der Verfasser veröffentlichtenBerichte nicht in jedem Fall die Ansicht desHerausgebers wiedergeben.
Nachdruck und photomechanische Wiedergabe,auch auszugsweise, nur mit Genehmigungder Bundesanstalt für Straßenwesen,Stabsstelle Presse und Öffentlichkeitsarbeit.
Die Hefte der Schriftenreihe Berichte derBundesanstalt für Straßenwesen könnendirekt bei der Carl Schünemann Verlag GmbH,Zweite Schlachtpforte 7, D-28195 Bremen,Telefon: (04 21) 3 69 03 - 53, bezogen werden.
Über die Forschungsergebnisse und ihreVeröffentlichungen wird in der Regel in Kurzform imInformationsdienst Forschung kompakt berichtet.Dieser Dienst wird kostenlos angeboten;Interessenten wenden sich bitte an dieBundesanstalt für Straßenwesen,Stabsstelle Presse und Öffentlichkeitsarbeit.
Ab dem Jahrgang 2003 stehen die Berichte der Bundesanstalt für Straßenwesen (BASt) zum Teil als kostenfreier Download im elektronischen BASt-Archiv ELBA zur Verfügung. http://bast.opus.hbz-nrw.de
Impressum
HerausgeberBundesanstalt für StraßenwesenBrüderstraße 53, D-51427 Bergisch GladbachTelefon: (0 22 04) 43 - 0Telefax: (0 22 04) 43 - 674
RedaktionStabsstelle Presse und Öffentlichkeitsarbeit
Druck und VerlagFachverlag NW in der Carl Schünemann Verlag GmbHZweite Schlachtpforte 7, D-28195 Bremen Telefon: (04 21) 3 69 03 - 53Telefax: (04 21) 3 69 03 - 48www.schuenemann-verlag.de
ISSN 0943-9307ISBN 978-3-95606-326-8
Bergisch Gladbach, Juni 2017
7th International Conference on
ESAR „Expert Symposium on
Accident Research“ 2016
Kurzfassung
Im Jahr 2016 fand an der
Medizinischen Hochschule Hannover
nun zum siebten Mal nach der ersten
in 2004 und danach alle 2 Jahre
implementierte ESAR Konferenz
(Expert Symposium on Accident
Research) statt. ESAR stellt eine
internationale Zusammenkunft von
Experten dar, die weltweit Verkehrs-
unfälle wissenschaftlich analysieren
und hier ihre Ergebnisse diskutieren.
ESAR verbindet Behördenvertreter,
Entwicklungsingenieure der Automobil-
industrie und Wissenschaftler
miteinander und bietet ein Forum mit
besonderem Schwerpunkt auf In-
Depth-Analysen der Unfallstatistik und
Unfallanalysen. Besondere Berück-
sichtigung finden Forschungen auf der
Basis von so genannten „Erhebungen
am Unfallort“, die durch umfassende
Dokumentationen vom Unfallort, den
Fahrzeugen und den Verletzungen
unter Einbeziehung mehrerer
Fachdisziplinen geprägt sind. ESAR
will multidisziplinär die wissenschaft-
lichen Erkenntnisse zusammentragen
und auf einer wissenschaftlich
internationalen Ebene diskutieren und
ist somit wissenschaftliches Kollo-
quium und Plattform für einen
Informationsaustausch aller Unfall-
forscher. Erfahrungen in der Unfall-
prävention und dem komplexen Feld
der Unfallrekonstruktion werden dar-
gelegt und um neue Felder der
Forschung eröffnet. Bestehende
Ergebnisse langjähriger Forschungs-
arbeiten in Europa, USA, Australien
und Japan beinhalten unterschiedliche
infrastrukturelle Zusammenhänge und
geben Erkenntnisse über Population,
Fahrzeugbestand und Fahrereigen-
schaften, die eine Basis für
abzuleitende Empfehlungen und
Maßnahmen zur Erhöhung der
Verkehrssicherheit bieten.
Abstract
In 2016 the seventh ESAR conference
(Expert Symposium on Accident
Research) was held in Hannover.
ESAR is an international convention of
experts, who analyze traffic accidents
all over the world and discuss their
results in this context, conducted at the
Medizinische Hochschule Hannover
every 2 years. It connected repre-
sentatives of public authorities,
engineers in automotive development
and scientists and offers a forum with
particular emphasis on In-Depth-
Analyses of accident statistics and
accident analyses. Special focus is
placed on research on the basis of so-
called "In-Depth-Accident-Investiga-
tions" [data collections at the sites of
the accidents], which are characterized
by extensive documentations of the
sites of the accidents, of the vehicles
as well as of the injuries, encom-
passing several scientific fields. ESAR
aims at a multi-disciplinary compilation
of scientific results and at discussing
them on an international, scientific
level. It is thus a scientific colloquium
and a platform for exchanging
information for all accident resear-
chers. Experiences in accident

prevention as well as in the complex
field of accident reconstruction are
stated and new research fields are
added. Existing results of long-term
research work in Europe, the US,
Australia and Japan include different
infrastructural correlations and give
findings on population, vehicle
population and driver characteristics,
which offer a basis for recommenda-
tions to be derived and measures for
increasing road safety.
Welcome Words of Conference Chairman Professor D. Otte Welcome to Hannover for the 7th ESAR conference. ESAR is the acronym for “Expert Symposium on Accident Research”. The first conference was carried out in the year 2004, from than every 2 years the conference was held at the Medical School Hannover in Germany. Within these 12 years of existing approximately 250 papers were presented and discussed scientifically, published as proceedings by the BAST with ISBN numbers for worldwide transmission. Thank you to BAST for the continuation of this distribution. Under ESAR every 2 years experts from industry, government and other scientific bodies meet together to present their research results, mainly in focus are methodologies and benefits for finding countermeasures in safety performances and Accident Data structures and analysis. This year 72 delegates from 16 countries round the world came to Hannover. 40 papers will be presented. Before starting the conference I would like to introduce our organizing committee and say thanks especially to the Scientific Advisery Board SAB, which selected papers for presentation. You find the names of SAB on our website www.esar-hannover.de As always we open the conference with excellent keynote speakers,
Prof. Strick Federal Highway Research Institute BAST Represented by Claus Pastor Bundesanstalt für Straßenwesen, Germany Importance and Goals on Accident Prevention – Prospective Report of German Government Prof. Pete Thomas Loughborough University England. Automated transport – improving road safety? Professor Dr. Rodolfo Schöneburg Daimler AG. Germany , Opportunities for Occupant and Partner Protection by new Technologies based on Accident Research
The scientific program is dealing with different issues of Regulation and Consumer Aspects Methodologies of In-Depth Investigation Accident Prevention and Causation Injury Prevention and Mechanisms Emergency Rescue Aspects Driver and Vehicle Assistant Systems Special Topics on Vulnerable Road Users Roadside safety Injury Impairment and Long term consequences
Thank you very much and have a successful conference!
Interdisciplinary Accident Research and Research Projects of AARU Audi Accident Research Unit
Dr.-Ing. Klaus Gschwendtner*, Dr. med. Antonio Ernstberger**,
Dr. med. univ. Katharina Angerpointner**, Kristin Blum, M.Eng*, Dipl.-Ing. Eckart Donner*, Dr. rer. nat. Stefanie Weber**
*AUDI AG, AARU Audi Accident Research Unit
**University Hospital Regensburg, AARU Audi Accident Research Unit Abstract - AARU (Audi Accident Research Unit) is an interdisciplinary research project of the University Hospital Regensburg in cooperation with AUDI AG. Specific objective is to comprehend the respective accident scenario and retrieve generally applicable findings as to technical, medical and psychological processes. In order to prevent traffic accidents and to alleviate vehicle accident consequences, postulates of general traffic safety, human-machine interaction, technical design and function of new vehicles and occupant as well as third party protection shall be inferred from these findings. Specifically, each accident with new Audi, Lamborghini and Ducati vehicles involved is analyzed interdisciplinary, discussed in a case meeting and anonymously documented with more than 2,000 parameters. The database is continually used for solving safety relevant issues. Parallel to accident analysis, research projects are performed in the fields medicine, psychology and engineering in order to gain comprehensive insight and identify potential additional areas of activity of accident research. INTRODUCTION Accident research units mainly analyze accidents involving personal injury. Derived findings run in the development of infrastructural arrangements or the vehicle safety. This has been mainly reflected in the decreasing number of traffic fatalities during the last decades. In the last two decades the number of traffic fatalities on German roads decreased from 9,949 in the year 1993 to 3,377 in the year 2014 (-66.05 %). The number of accidents with personal injury decreased in the same time from 385,384 to 302,435 accidents (-21.52 %). But the number of accidents with property damage raise from 1,960,012 to 2,104,250 (+7.36 %) [1]. These are just the official reported numbers. An investigation of [2] shows that just every fourth of insurance cases of the property damage accident is reported officially. According to [3] the number of minor damage cases which do not appear in statistics amounts to 4,8 mio cases per year. The main objective of accident research is to make „blank spots“ on the accident scenario map disappear. Therefore accident research has to focus on every kind of accident to attain an improvement of road safety. Detailed information and knowledge about the emergence of accidents and the underlying conflict scenario are very helpful for developing and designing advanced driver assistance systems. In the field of driver assistance more and more active driving functions will find their way to the customer. Now, if the frequency of the different conflict scenarios is known, where an assistance system can support the driver the potential of the system to minimize or to avoid certain injury or damage in this situation can be derived. An increase of the take-rates of assistance-systems may contribute to improve road safety and in the long term to reduce the number of accidents. WHAT IS AARU? AARU (Audi Accident Research Unit) is an interdisciplinary research project of the University Hospital Regensburg in cooperation with AUDI AG. Specific objective is to comprehend the respective accident scenario and retrieve generally applicable findings as to technical, medical and psychological processes. Accident causes are often open to speculation. In most cases the focus is on accident consequences. An important question is: What are the causes of these accidents?
A look into the federal statistics reveals that the primary cause of death or injury of a person in more than 90 % of all traffic accidents is human failure [4]. As a rule, the police is not able to determine what eventually led to this human failure, and is therefore not listed in official statistics. This means that each and every single accident leaves many questions unanswered: What occurred immediately prior to the accident ? What exactly led to the collision? Was the driver distracted? Was stress a contributing factor, and if yes, what triggered it? Was the situation perceived unsafe at all? Or was the risk maybe even knowingly accepted? The classification of the accidents into various accident types as performed by official statistics allows an insight into the basic accident sequence, however, it provides only few specific accident details. Therefore, efforts to derive measures for accident prevention from accident types will remain a shallow attempt. In order to develop sensible counter-measures, facts surrounding the accident, driver behavior as well as driver reactions and accident mechanism are required. The development of driver assistance systems is a significant opportunity to support the driver in the driving task and warn of hazards or take immediately remedial actions. At best, this will prevent accidents. However, if an accident is unavoidable, such systems will often minimize the consequences of the accident. Since its establishment in 1998, AARU has set itself the task to collect accidents at such a high level of detail, thus achieving the required understanding for developing sensible remedial actions. Bavaria is the major statistical territory of AARU. Accident data collection It is AARU’s objective to analyze approximately 90 traffic accidents involving Audi, Lamborghini or Ducati models not older than two years at the time of the accident interdisciplinary per year. Other selection criteria for inclusion in the AARU database are: persons injured in the course of the accident and / or at least one airbag deployment and /or severe deformation of the involved vehicles. For the inclusion in the AARU database it is irrelevant in which of the involved vehicles the airbag deployed or the injured person was sitting in or if for instance a cyclist or pedestrian suffered injuries. Only recently, the scope of accident investigation has been supplemented by the analysis of material damage. AARU is comprised of three disciplines working in parallel and considering and analyzing the original accident from various perspectives. Medicine Among other things, the medical team collects information on biometric variables of persons involved, possible pre-existing conditions as well as information regarding first aid measures. Information sources for the medical team are standardized interviews performed by specially trained staff either on the phone or face-to-face. Medical records of the persons involved (medical reports, x-rays etc.) which are requested provided prior consent allow conclusions as to kind, extent and treatment of the respective injury. In addition, biomechanical sequence in the accident scenario is reconstructed and medical parameters are assigned for classification of the injury. Psychology Psychologist perform interview with drivers or pedestrians involved in the accident in order to determine the subjective view concerning the accident scenario. This allows the analysis of the surrounding factors of the accident and provides an opportunity to retrieve reliable significant insight concerning the behavior, subjective sensations and impressions of the involved persons in the pre-crash phase immediately prior to the accident by means of real-world traffic accidents. Standardized telephone interviews include questions regarding fatigue, stress, time pressure or distraction. The classification of accident causes is performed according to the 5-step method [5],[6] and [7], which are based on [8].
Technical aspects Engineers analyze the accident site and the involved vehicles and based on this perform a physical reconstruction of the accident. These data range from debris areas as well as skid and impact marks on the road, road surface and routing, temperature, light and precipitation at the time of the accident, acquisition of nature and severity of vehicle damage up to seating position of the occupants and load. All these data are collected at the inspection of the accident site as well as the individual accident vehicles. Case review After conclusion of their respective analysis of the three independently cooperating expert teams, each individual case is discussed in an interdisciplinary case conference. A specialist of each team presents the respective results. The collected data are then synchronized and objectified. For instance, the subjectively experienced accident sequence as reported in the psychological analysis is compared with the accident sequence objectified by technology. In addition, all injuries are allocated to an injury causing factor (e. g. component, body movement etc.) and the point in time at which the injury occurred. All participants discuss the accident until all details are understood and the three teams agree on sequence, accident cause and accident consequences. The interdisciplinary discussion results in a significantly improved understanding of the accident scenario und allows an evaluation of accident causes and potential estimation of driver assistance systems. Finally every case is anonymously documented with more than 2,000 parameters in the AARU database [5], [6], [7], [9]. The database is continually used for solving safety relevant issues. Databases and data analysis In order to prevent traffic accidents and to alleviate vehicle accident consequences, postulates of general traffic safety, human-machine interaction, technical design and function of new vehicles and occupant as well as third party protection shall be inferred from these findings. For database analyzes two main sources of data are used: Data out of collected accidents of AARU and the GIDAS (German In-depth Accident Study) database. According to the application to certain areas of research different data sets are used. For getting more general overview of a certain topic the GIDAS database is used and in some use cases combined with a projection to federal level. For analyzes concerning a particular vehicle (esp. Audi models) the AARU database is used. The required data analysis are used for questions out of engineering departments and also for displaying relevant fields of action or potential. There is a broad spectrum concerning vehicle safety and occupant protection up to driver assistance systems. Parallel to accident analysis, research projects are performed in the fields medicine, psychology and engineering in order to gain comprehensive insight and identify potential additional areas of activity of accident research. CURRENT RESEARCH PROJEKTS OF AARU Medicine In the medical field a reduction of injury severity in Germany was proven by 24,405 accidents in the GIDAS database, using accidents from 1991 to 2011. A further objective of the study was to identify main influencing factors for this decline. By means of a multivariate logistical regression model developed for this use case it could be demonstrated that the reduction of injury severity is a multifactorial event [10]. This study was published as original work in Injury, 2015 Oct; 46 Suppl 4: pp. 135-143.
Psychology More than 90 % of accidents involving personal injury are due to human failure [4], proving that individuals require support in the driving task. However, official statistics reveal no details allowing the determination of an accident cause according to the 5-step method or information on reaction behavior of accident participants. Respective technical counter-measures may only be defined and evaluated if the accident mechanism is obvious in connection with driver behavior and reaction [11]. Analyses performed by the AARU reveal that in situations in which their right of way is taken from the right side, drivers tend to react by swerving to the left, mainly in combination with braking. Other accident analyses showed the same result [12], [13]. In order to investigate reaction behavior of drivers in critical intersection situations, two studies using the Vehicle in the Loop (a combination of a driving simulator with a real vehicle) were carried out [14]. In the studies the reaction behavior of drivers was tested who had the right of way when they encountered a critical crossing situation on a rural road. The participants were driving with 70 km/h when they experienced situations in which their right of way was taken from the right side. Each critical situation had been designed in a way that there would have been a collision, if the driver would react either with an emergency braking and no steering or with a combination of braking and steering to the left. All situations would have been manageable without a collision by braking and swerving to the right. Technical Aspects For a long time accident research survey focused on accidents involving personal damage. However, more than 87 % of officially reported accidents on German roads involved merely property damage [4]. A significantly higher number of property damage accidents are not recorded by the police, but are only reported to the insurers [15]. Furthermore, approximately 4,8 million minor loss accidents [3] occur annually. Prevalence of these accidents and nescience on conflict creating scenarios in property damage is a field of action for accident research [2]. For this purpose the existing accident types were extended and an evaluation method has been developed to demonstrate customer value of future assistance systems by preventing accidents. Thus, a monetary purchasing incentive may be derived [16], [17]. RESULTS Medicine In the conducted study a significant decrease regarding all types of severe injuries and killed passengers was found. The relative decrease in mortality was 68.8 % according to the German Federal Statistical Office. Fortunately, especially the percentage of severely injured traffic victims was less than half (50.3 % to 65.4 %) during the study period, in terms of both the whole body and all individual body regions like head, thorax, abdomen, pelvis, upper and lower extremities. The percentage of uninjured passengers increased by 8.5 %. Furthermore, independent factors were found that are clearly associated with injury prevention. The use of seatbelts and airbags and a lower age of the passenger cars appeared to be factors on the positive side. Severe injury, however, was significantly associated with serious accidents like roll-over, skidding, collapse of passenger compartment, ejection or trapping, positive blood-alcohol, accidents on country roads compared to inner-city accidents, increased change in velocity and accidents at night for example. The implementation of protective factors increased over time, whereas factors constituting a high probability of serious injuries declined [10]. Psychology The result of the first study revealed the importance of the so-called Time-To-Arrival (TTA) for the prediction of the reaction behavior. TTA is applied for objective estimation of the criticality in cross traffic. It describes the time up to a potential collision with a conflict partner at an intersection [18]. It is calculated by dividing the distance to the critical area by the speed of the vehicle that has the
right of way [19]. With longer TTA drivers were able to perform an evasive steering maneuver to the right in order to prevent the accident. With decreasing TTA there was a tendency towards swerving to the left side which lead to having an accident. In the second study TTA was systematically varied in order to investigate its influence on evasive behavior. Overall it appeared that the percentage of mere braking actions basically dropped the lower the TTA was. However, it became evident that the smaller the TTA, the more rarely braking actions occurred at all. Besides, it became obvious that the drivers were not able to perform a sufficient emergency braking. Regarding the evasive behavior, the percentage of evading increased the smaller the TTA was. An analysis of the reaction of those drivers who performed a combination of braking and steering revealed that no driver started braking and steering simultaneously. The data indicated that all persons who steered first steered to the left side. If the drivers braked first there was a higher probability that there would be a steering to the right side, and therefore a higher chance to avoid the accident. Technical Aspects The developed evaluation method makes it possible to evaluate the claims cost of a future vehicle concept in combination with a certain driver assistance system. The material of all outer attachment parts and the technical configuration of every vehicle can be considered by means of damage points and damage units to derive a damage risk score [16], [17]. A damage risk function is used afterwards for evaluating modified accident parameters [20]. Therefore the vehicle is divided into damage segments: Front, fender, doors, side panel and rear. If the distribution of damage frequency of a certain vehicle is known the damage risk score can be determined best. If it is not known the damage frequency can also be taken from a precursor or comparable model. The used material of the outer attachment parts is one of the main influence factors like [17] shows. Based on a middle class vehicle equipped with steel an plastic bumpers an adjustment to aluminum parts shows only a little higher risk. Changing all attachment parts to CFRP (carbon reinforced plastic) would result in a higher damage risk. Plastic attachment parts lower the risk on the other hand. In addition the influence of technical equipment like the light technology on the claims cost can be determined. With reference to halogen headlights LEDs lead to an increase of 38 %, laser-lights to an increase of 129% [16]. Furthermore the fitting position of ADAS sensors can be evaluated. Nearly every component brings a rise of the damage risk score. By means of ADAS functions this effect has to be compensated due to an active intervention for mitigating or avoiding a collision. DISCUSSION Medicine For the first time it was possible with an accident data analysis to prove that the frequency and severity of directly accidental serious injuries decreased significantly during the study period. This could not only be explained through medical improvement. It is rather a multifactorial process including legal amendments, enhanced road layouts and improvement in automotive safety above all. To account for the impact of multiple factors, a multivariate regression analysis was applied. After identifying independent variables associated with lower morbidity, changes over time were calculated for relevant variables. Using seatbelts, age and avoidance of serious accidents for example are well known protecting factors. Interestingly, the year of construction and female gender had a moderate effect on morbidity in this study. The year of construction reflects the development of active and passive safety in passenger cars. Airbag and seat belt use were independent variables to avoid serious injuries. Next to seat belt use and airbag, the vehicle’s body stiffness is one of the most important
passive safety factors for passenger cars. The stiffness is more and more advanced from model line to model line. In the univariable analysis, the gender effect was observed for minor injuries like whiplash, but not for severe injuries. Osteoporosis in elderly women could have a tremendous influence, resulting, besides the factor age, in significance in the multivariable analysis. An effect of the seating position was examined and excluded. In the literature, a gender effect is mainly described for minor injuries. However, further studies could evaluate the influence of gender on severely injured vehicle occupants. In summary, the implementation of protective factors increased over time while accident constellations with a high probability for severe injury decreased over time [10]. Psychology The question of whether an accident is preventable may be approached from a number of points. The first option involves supporting the person responsible for the accident in order to prevent the error causing the accident. Therefore, the error underlying the accident has to be known in detail. This is possible by using the 5-step-method like AARU does. By knowing the error, suitable countermeasures can be applied, e.g. through driver assistance systems. A further option is to support persons involved in an accident to react in the best possible way in critical situations caused by the person responsible for the accident. In order to provide the party involved in an accident with the best possible support, it is initially necessary to understand how persons behave in critical situations. Therefore, the behavior of drivers was examined whose right of way was taken from the right side at an intersection. It could be shown that the shorter the TTA and thus the more critical the situation was the percentage of steering in the direction of movement of the crossing vehicle increased and braking decreased. This resulted in a higher number of collisions. Furthermore, it became obvious that most drivers were not able to perform an appropriate emergency braking. However, since a higher deceleration extends the available time in order to evaluate the situation, it would be reasonable to support the driver by means of a driver assistance system in order to prevent the collision. A vehicle system that provides a rapid deceleration could support the driver beneficially. It would suit the driver’s natural reaction to brake in a critical situation and would result in more time for the driver to comprehend the situation and to steer to the correct side to avoid the accident. Further studies should be conducted to examine the reaction behavior in other critical situations. Technical Aspects The developed evaluation method of damage points and damage units is validated by means of real world damage cases. Subsequently to the calculation of the damage extent the result of the damage points were compared to the estimated damage of authorized experts. The averaged deviation between the two different approaches is 2.9 % in motor own damage cases. 64.1 % of the analyzed cases were calculated directly under the assumption only to change outer attachment parts. The amount of cases repaired by smart repair or repair varnish is 15.4 %. In 20.5 % of the cases slight structural damages occurred [17]. The determination of damage extent in property damage accidents on the basis of the systematic of damage points and damage units is suitable for model and manufacturer independent calculations. Although the methodology is based on one manufacturer and on a limited number of vehicle models. Regarding SUVs and high price models a larger deviation occurs which has to be analyzed in further work. Superordinate objective of the evaluation method is to use it in an early stage of the product development process for evaluating vehicles according to their class, materials and equipment in combination with an ADAS function. Up to now the methodology works for minor deformation depths which are very common in property damage accidents but will be extended in the future.
CONCLUSION Detailed analysis of traffic accidents by AARU generate data resulting in an improved understanding of accident mechanisms and accident consequences and their analysis of the pre-crash phase as well as the behavior and reactions of the driver. Based on this analysis, appropriate remedial actions may be developed which are able to positively influence the accident scenario. An opportunity for vehicle manufacturers is the development of driver assistance systems, which at best may help to avoid accidents or at least minimize the accident consequences. Traffic accident research provides a valuable contribution by improving general traffic and road safety with attention to medical, psychological and technical aspects. REFERENCES [1] Statistisches Bundesamt: https://www.destatis.de/DE/ZahlenFakten/Wirtschaftsbereiche/TransportVerkehr/Verkehrs unfaelle/Tabellen_/Strassenverkehrsunfaelle.html; access: 24.04.2016. [2] Gschwendtner, Klaus; Kiss, Miklós; Gwehenberger, Johann; Lienkamp, Markus: „In-Depth“-Sachschadenanalyse, Anforderungen und Potenziale. In: VKU - Verkehrsunfall und Fahrzeugtechnik, pp. 272-284, Juli/August 2014. [3]: Gwehenberger, Johann; Behl, Thomas; Lauterwasser, Christoph: Wie wirksam sind Fahrerassistenzsysteme – vom Bagatellschaden bis zum schweren Unfall?. In: VKU - Verkehrsunfall und Fahrzeugtechnik, pp. 60-65, Februar 2012. [4] Statistisches Bundesamt (2013). Verkehrsunfälle 2012 (Fachserie 8, Reihe 7). Wiesbaden. https://www.destatis.de/DE/ Publikationen/Thematisch/TransportVerkehr/Verkehrsunfaelle/VerkehrsunfaelleJ2080700127004.pdf?__blob=publicationFile; access: 05.04.2016. [5]: Chiellino, Ulrich; Ernstberger, Antonio; Donner, Eckart; Graab, Birgit; Winkle, Thomas; Nerlich, Michael: Verkehrsunfallforschung – Was können Fahrerassistenzsysteme leisten? 4.Tagung Fahrerassistenz, München, 2010. [6]: Hörauf, Ulrich; Buschardt, Boris; Donner, Eckart; Graab, Birgit; Winkle, Thomas: Analyse von Verkehrsunfällen mit FAS-Potentialeinschätzung am Beispiel des FAS Lane Departure Warning. 2. Tagung Aktive Sicherheit durch Fahrerassistenz, München, 2006. [7]: Weber, Stefanie; Ernstberger, Antonio; Donner, Eckart; Kiss, Miklós: Interdisziplinäre Unfallforschung – ein Zusammenschluss von Technik, Medizin und Psychologie zur Steigerung der Verkehrssicherheit. In: VKU - Verkehrsunfall und Fahrzeugtechnik, pp. 61-65, Februar 2014. [8]: Rasmussen, Jens. Human errors: A taxonomy for describing human malfunction in industrial installations. In: Journal of Occupational Accidents, 4, pp. 311-333, 1982. [9]: Graab, Birgit; Donner, Eckart; Chiellino, Ulrich; Hoppe, Maria: Analyse von Verkehrsunfällen hinsichtlich unterschiedlicher Fahrerpopulationen und daraus ableitbarer Ergebnisse für die Entwicklung adaptiver Fahrerassistenzsysteme. 3. Tagung Aktive Sicherheit durch Fahrerassistenz, München, 2008. [10]: Ernstberger, Antonio; Joeris, Alexander; Daigl, Monica; Kiss, Miklós; Angerpointner, Katharina; Nerlich, Michael; Schmucker, Uli: Decrease of morbidity in road traffic accidents in a high income country – an analysis of 24,405 accidents in a 21 year period. In: Injury, Int. J. Care Injured 46S4, pp. 135-143, 2015. [11]: Weber, Stefanie; Ernstberger, Antonio; Donner, Eckart; Kiss, Miklós: Learning from Accidents: Using Technical and Subjective Information to Identify Accident Mechanisms and to Develop Driver Assistance Systems. In: Driver Behaviour an Training, Human Factors in Road and Rail Transport, Chapter 18, pp. 223-230, ISBN: 978-1-4724-1469-4, 2013. [12]: Malaterre, Gilles; Ferrandez, Francis; Fleury, Dominique; Lechner, Daniel: Decision making in emergency situations. In: Ergonomics, 31 (4), pp. 643-655, 1988.

[13] Kramer, Florian; Israel, Marc: „Virtueller Greifreflex“ - ein Konfliktpotenzial und die Möglichkeiten der Kompensation in Personenkraftwagen mithilfe moderner Assistenzsysteme. In: VKU - Verkehrsunfall und Fahrzeugtechnik, pp. 390-399, November 2014. [14]: Weber, Stefanie: Standardreaktionen in kritischen Fahrsituationen, Studien mit dem Vehicle in the Loop zur Untersuchung des Reaktionsverhaltens bei Vorfahrtsmissachtung von rechts. Dissertation, Universität der Bundeswehr München, Fakultät für Luft- und Raumfahrttechnik, ISBN: 978-3-7369-9151-4, 2015. [15]: Gesamtverband der Deutschen Versicherungswirtschaft e.V (Hrsg.): Statistisches Taschenbuch der Versicherungswirtschaft 2014. Verlag Versicherungswirtschaft GmbH, Berlin, August 2014. [16]: Gschwendtner, Klaus; Kiss, Miklós; Lienkamp, Markus: “Prospektive Analysis-Method for Estimating the Effect of Advanced Driver Assistance Systems on Property Damage”. Conference Paper. IEEE ITSC, Qingdao (China), 2014. [17]: Gschwendtner, Klaus; Feig, Philip; Kiss, Miklós; Lienkamp, Markus: Prospective Estimation of the Effectiveness of Driver Assistance Systems in Property Damage Accidents. The 24th International Technical Conference on the Enhanced Safety of Vehicles (ESV), Goetheborg, Juni 2015. [18] Van der Horst, Adrianus Rigardus Antonius:A time-based analysis of road user behaviour in normal and critical encounters, Ph.D. dissertation, Technical University Delft, ISBN: 90-9003340-8, 1990. [19]: Naujoks, Frederik; Grattenthaler, Heidi; Neukum, Alexandra: Fahrerseitiger Unterstützungsbedarf in drohenden Verkehrskonfliktszenarien und Wirksamkeitsuntersuchung frühzeitiger Fahrerinformationen basierend auf kooperativer Umfelderfassung. In: 10. Berliner Werkstatt Mensch-Maschine-Systeme, pp. 401-411, ISBN: 978-3-7983-2626-2, 2013. [20]: Gschwendtner, Klaus: Sachschadenanalyse zur Potenzialermittlung von Fahrerassistenzsystemen – von der Unfalltypen-Erweiterung zum Kundenwert. Dissertation, Technische Universität München, Lehrstuhl für Fahrzeugtechnik, ISBN: 978-3-8439-2416-0, 2015.
In-depth crash investigation in South Australia and its use in roadside safety research
S D Doecke*, M R J Baldock*, J E Woolley*
*Centre for Automotive Safety Research, University of Adelaide, South Australia, 5005, Australia
Abstract - This paper gives an overview of the in-depth crash investigation activity conducted by the Centre for Automotive Safety Research (CASR) at the University of Adelaide, in South Australia. Recent changes in method include: an expansion in on-call hours for the crash investigation team, providing the option of a phone interview for crash participants to discuss the crash, and downloading objective crash data from vehicle airbag control modules. These changes have resulted in: increased representativeness of crashes by hour of day; a decrease in the over-representation of fatal crashes in our sample; an increase in the proportion of crashes that involved a pedestrian, bicycle or scooter (moped); an increase in the proportion of crash participants consenting to an interview; and an increase in the objective data available, through airbag control module downloads. Our in-depth crash investigations enabled research into road departures that found barriers were a more feasible solution than clear zones for eliminating serious and fatal injury resulting from run off road crashes. INTRODUCTION The University of Adelaide has been conducting in-depth crash investigation research in various forms since 1963, first through the Department of Pathology, then through the Road Accident Research Unit, which became the Centre for Automotive Safety Research (CASR) in 2002. CASR is part of the Faculty of Engineering, Computer and Mathematical Sciences. More detailed discussion on the history of in-depth crash investigation in South Australia can be found in Baldock et al. [1]. At times these investigations have been focussed on a particular road safety issue, such as speed or pedestrian crashes, but generally have been aimed at collecting a large quantity of high quality data on a sample of crashes, in order to understand the factors that contribute to crashes occurring. Currently the investigations aim to collect representative samples of metropolitan and rural crashes within 100 km of Adelaide. This paper will give a brief description of the method, discuss adjustments to the method in 2014, and describe how the data are used in roadside safety research. METHOD CASR’s in-depth crash investigation team is composed of a mixture of academic and research support staff from engineering, psychology and health backgrounds. Participation in in-depth crash investigation is viewed within CASR as a key part of the development of new academic staff in the field of road safety research. The current team is comprised of an automotive engineer, two mechanical engineers, a mechatronic engineer, a civil engineer, two behavioural scientists, and a health professional. CASR’s crash investigations begin with notification by pager from the local ambulance service. This notification occurs a matter of seconds after an ambulance is dispatched. Two members of the team will then immediately drive to the scene of the crash, provided it has occurred within 100 km of Adelaide, and not within a rural township. These limitations are designed to limit travel time so that the scene evidence is sufficiently preserved upon a team’s arrival. Other criteria for case selection are: at least one participant must be transported by ambulance, the crash occurred on a public road, and it involved at least one motor vehicle (including motorcycles). On arrival at a the scene of a crash, CASR staff talk to emergency services’ personnel, participants and witnesses; mark the scene evidence; photograph the scene, vehicles, and road infrastructure; collect data on the vehicles, road and crash circumstances; digitally map the road environment and crash evidence; and record videos from each crash participant’s point of view.
After the crash, further sources of information are obtained, including: the police report, hospital and ambulance notes, driver and witnesses interviews, Coroner’s report (if fatal), forensics report (alcohol and drugs test results), and the crash history of the location and drivers. The speeds of the vehicles are also determined, if possible, by a crash reconstruction that utilises the scene evidence. Finally the crash is reviewed, an agreed version of events is decided upon, and the factors that contributed to the crash occurring are identified. A more detailed description of the data collected can be found in Baldock et al. [1]. RECENT CHANGES TO METHOD Prior to 2009, crash investigations at CASR had focussed on either metropolitan or rural crashes exclusively for a period of time. In 2009 CASR began sampling from both areas within the same period. This was aimed at building a sample from both areas simultaneously. To this end, weeks where only rural crashes were investigated were included to produce similar sample sizes between the two regions. It was found that, to achieve a similar sample size to metropolitan crashes, investigators needed to be on call to exclusively investigate rural crashes at a ratio of 2:1. At the end of 2014 a new series of crash investigations was commenced following a two-and-a-half year hiatus. A number of important changes to CASR’s method of crash investigation were made at this time. On-call times The most significant of these changes is the expansion of on-call hours. The on-call hours have varied considerably over the 53 years that crash investigations have been conducted at the University of Adelaide. From 1996 the on-call hours were limited to regular business hours, with selected evening shifts on Thursday and Friday. These evening shifts, however, had been phased out completely by 2006. Crashes outside these hours were only investigated if the South Australian Police Force’s Major Crash Investigation Unit had attended and preserved the evidence. Major Crash attends all crashes in which a fatality has occurred, or it is believed could result in a fatality. In 2014 the on call hours were expanded to 9am to 9pm, broken up into two shifts, 9am to 2pm and 2pm to 9pm. A rotating roster was developed to manage the logistics: a week of being on-call from 9am to 2pm was followed by two weeks of alternating between a day of being on-call from 2pm to 9pm, and a day dedicated to following up crashes attended by Major Crash that occurred between 9pm and 9am. When a follow up day falls on a Monday, crashes attended by Major Crash between 9pm Friday and 9am Monday are investigated. This ensures all of the week is sampled equally, in terms of time: although crashes occurring between 9pm and 9am weekdays, and on weekends, that are investigated have a bias to high severity crashes. Interviews of crash participants Interviews with crash participants provide valuable information on the human factors involved in the crash. These interviews are conducted on a purely voluntary basis. Importantly, CASR has protection from subpoena, which allows interviewers to assure participants that consenting to an interview and divulging incriminating information will not affect any legal proceedings. Usually, only drivers, riders or struck pedestrians are formally interviewed. Participants in fatal crashes are often not approached for an interview by CASR as an interview can be accessed in the Coroners Report. Prior to 2014, interviews were almost always conducted in person. Between 2002 and 2008, 70% of rural participants and 50% of metropolitan participants consented to an interview. By 2011 this had declined to 15% overall. Part of the reason for the decline may have been staffing changes, but it was
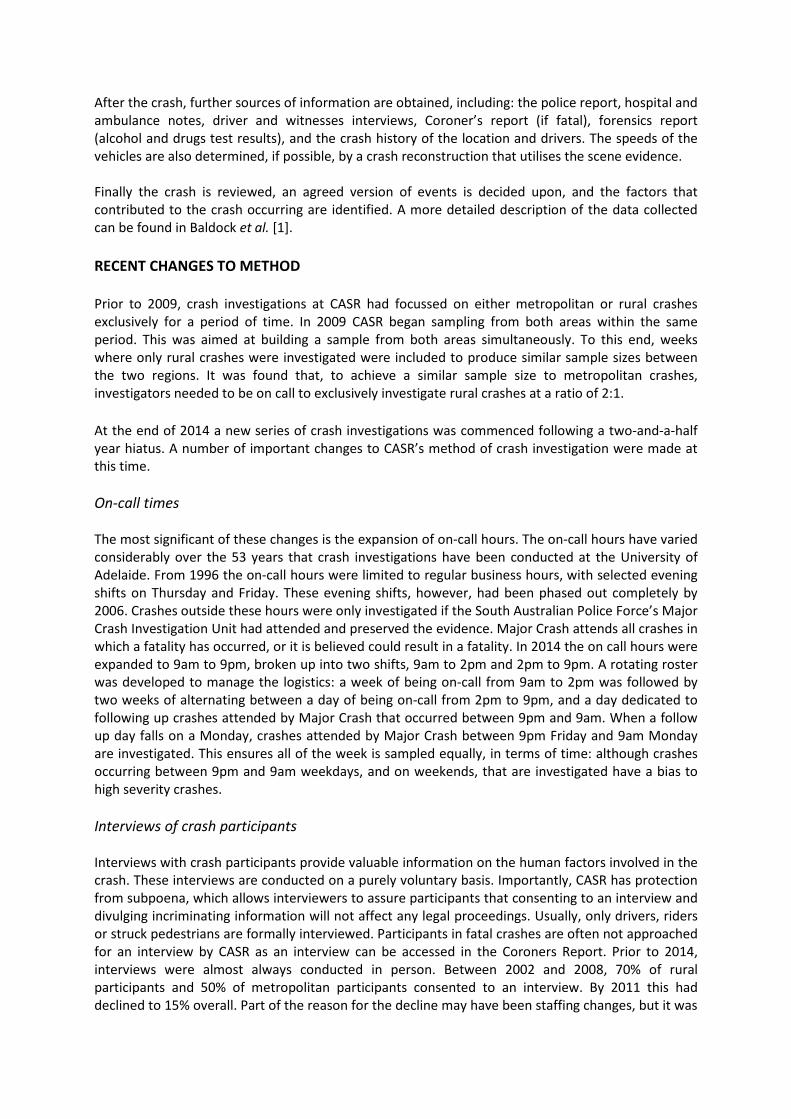
also believed that people were becoming increasingly unwilling to take the time to meet with researchers in person. In 2014 the option of a phone interview was added and the participants were encouraged to select the option they preferred, a telephone interview, an interview at their home, an interview at CASR, or an interview at a neutral location of their choosing. Airbag control module downloads A recent technological innovation in crash investigation is the downloading of information from a vehicle’s airbag control module. The information stored in the module after a crash varies between manufacturers and model years, but will usually include at least: vehicle speed, brake use, accelerator pedal use, delta-v, safety systems deployed and seatbelt use. Prior to the resumption of crash investigation in 2014, CASR purchased a tool to perform these downloads. The range of vehicles that the tool can download from is limited in Australia, though some top selling brands, such as Holden and Toyota, have good coverage dating back to the 2007 model year. RESULTS OF RECENT CHANGES TO METHOD On-call times Figure 1 shows the crashes investigated, by hour of day, before the extended investigation hours (2009 to 2011) and after the extended investigation hours (post 2014), compared to police reported injury crashes over similar time periods. The extended hours have reduced the extent of over-representation of business hours in the sample. The morning peak period, late night, and early morning crashes remain under-represented. The move to a more systematic method for following up crashes outside the on-call hours, limited to fatal or near-fatal crashes, reduced the over-representation of fatal crashes. Between 2009 and 2011, 18% of crashes investigated were fatal. Post 2014, this has reduced to 12.8%, though it remains well above the 2.4% of police reported injury crashes that are fatal.
Figure 1. Comparison of distribution of crashes by hour of day
before (2009 to 2011) and after (post 2014) on-call hours were extended
0
2
4
6
8
10
12
14
16
0 2 4 6 8 10 12 14 16 18 20 22
Perc
enta
ge
Hour of day
Before extended hours
In-depthPolice reports
0 2 4 6 8 10 12 14 16 18 20 22
Hour of day
After extended hours
An increase in the number of pedestrians, bicycles and scooters (mopeds) post 2014 may also be, at least in part, a result of extending the on-call hours into the evening commuting time. In the 2009 to 2011 period these vulnerable road users made up 3% of all crashes investigated by CASR. Post 2014, they currently represent 22% of the sample. Interviews of crash participants The interview acceptance rate has risen to 47% since the option of a telephone interview was added in 2014. Some of this increase may be attributable to additional staffing changes within CASR. The skill and dedication of staff plays a role in the interview acceptance rate: staff may need to make more than ten telephone calls to organise an interview, and must be willing to do so in the evenings as well as during business hours. However, anecdotal evidence from the staff involved in interviews suggests that a number of interviewees would not have consented to an interview without the option of a telephone interview. To date, a telephone interview has been chosen by a quarter of the interviewees. Airbag control module downloads A download from the airbag control module was obtained in 8% of all vehicles involved in a crash investigated by CASR. This percentage would be higher if CASR staff had been able to download from all vehicles that are accessible with its tool; in a few cases the owner did not give consent. This percentage would be expected to increase over time, as accessible vehicles represent an increasing percentage of vehicles involved in crashes. The information that has been gained from these downloads has provided highly valuable objective information as to what occurred in the crash. This has reduced the time taken to reconstruct the crash, or in one case where all involved vehicles were downloaded from, eliminated the need for a reconstruction altogether. It has also provided valuable information on the timing of pre-impact braking, helped determine if a vehicle came to a complete stop at a junction, and shown that a driver was not wearing his seatbelt. USE IN ROADSIDE SAFETY RESEARCH The value of conducting in-depth crash investigation research is not just in the data it provides; it is also valuable for the generation of research hypotheses based on field observations. One example of this pertains to a study CASR did on roadside safety. Roadside safety in many regions, including South Australia, has traditionally been based on the principle of clear zones: providing an area by the side of the road free of obstruction to allow an errant vehicle to recover [2]. CASR’s crash investigators observed that many errant vehicles travelled beyond the recommended clear zone and struck a fixed object. This was the catalyst for research into road departures using CASR’s in-depth crash investigation data. The following describes some of the central CASR research in this area. Further information on this research can be found in other publications [3-5]. Research has also been conducted on the related topics of median widths and barriers [6] and post impact trajectory of vehicles following intersection collisions [7,8].
Method This study included data from 132 rural crash investigations conducted from 1998 to 2010 in which a single vehicle had left the road. The site diagrams produced for each investigated crash were used to determine the departure angle and lateral distance travelled after leaving the roadway. It was also noted if the vehicle had struck a hazard, reducing the magnitude of the departure. These run off road crashes were categorised into types by the number of changes of direction the vehicle undertook before leaving the road. These different types were:
• drift off type run off road crashes in which the vehicle simply drove off the road without losing control,
• single yaw type run off road crashes in which the vehicle was experiencing a yaw (or sideslip) angle before leaving the road, and
• double yaw crashes in which an initial yaw is followed by an overcorrection, resulting in a yaw in the opposite direction.
Computer simulations were performed based on 15 of the crashes to gain a more detailed understanding of the dynamics of the vehicle throughout the departure. This included five of each of the three run off road crash types. Each case was simulated using two different driver scenarios. The first driver scenario simulated the driver attempting to recover to the roadway with steering input only. The second driver scenario simulated the driver beginning emergency braking half a second after running off the road. The computer simulations were also used to examine the appropriateness of barrier protection offsets. Results There were only 18 of the 132 crashes in which a vehicle did not strike a hazard. For cases in which a hazard was not struck, more than 80% of vehicles had a lateral displacement that exceeded 10 metres. It was also common for the vehicles to rollover at some point during their road departure (42%). The run off road crash type had a large effect on the departure angle. Vehicles that drifted off the road had much shallower median departure angles (6°) than single and double yaw type run off road crashes (17°). This resulted in loss of control type crashes (single and double yaw) having greater median lateral displacements from the roadway (8.1 metres) than drift off type run off road crashes (4.4 metres). Figure 2 compares the results of all the simulations to the in-depth crash investigation data using a cumulative distribution of maximum lateral displacement. It can be seen that the vehicles in the simulations travel at lot further than in the investigated crashes. This is not surprising considering that many vehicles in the investigated crashes struck a roadside hazard, and hence were impeded from having a greater lateral displacement. If only investigated crashes in which no hazard was struck are considered, the distribution of lateral displacements in these crashes is similar to the distribution of all the simulation results. Figure 1 also displays the large difference in the lateral displacement of vehicles that simply drift off the road rather than lose control and yaw.
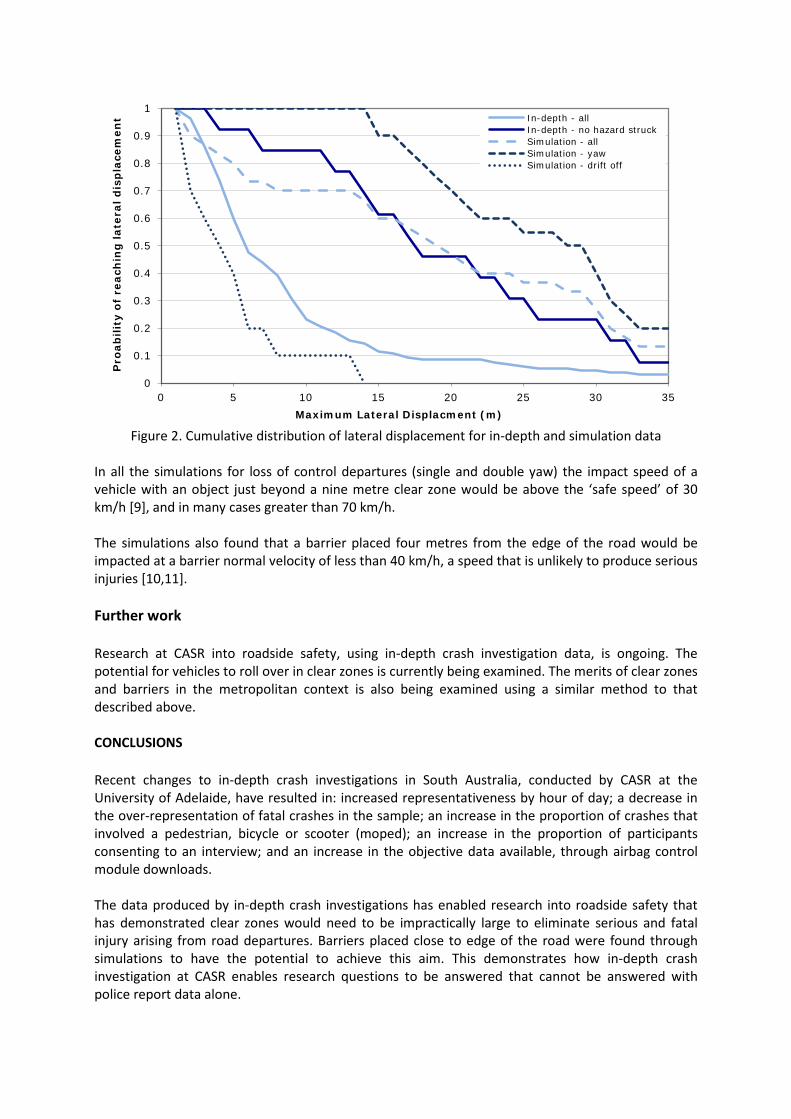
Figure 2. Cumulative distribution of lateral displacement for in-depth and simulation data
0
0.1
0.2
0.3
0.4
0.5
0.6
0.7
0.8
0.9
1
0 5 10 15 20 25 30 35
Pro
abili
ty o
f re
ach
ing
late
ral d
isp
lace
men
t
Maximum Lateral Displacment (m)
In-depth - allIn-depth - no hazard struckSimulation - allSimulation - yawSimulation - drift off
In all the simulations for loss of control departures (single and double yaw) the impact speed of a vehicle with an object just beyond a nine metre clear zone would be above the ‘safe speed’ of 30 km/h [9], and in many cases greater than 70 km/h. The simulations also found that a barrier placed four metres from the edge of the road would be impacted at a barrier normal velocity of less than 40 km/h, a speed that is unlikely to produce serious injuries [10,11]. Further work Research at CASR into roadside safety, using in-depth crash investigation data, is ongoing. The potential for vehicles to roll over in clear zones is currently being examined. The merits of clear zones and barriers in the metropolitan context is also being examined using a similar method to that described above. CONCLUSIONS Recent changes to in-depth crash investigations in South Australia, conducted by CASR at the University of Adelaide, have resulted in: increased representativeness by hour of day; a decrease in the over-representation of fatal crashes in the sample; an increase in the proportion of crashes that involved a pedestrian, bicycle or scooter (moped); an increase in the proportion of participants consenting to an interview; and an increase in the objective data available, through airbag control module downloads. The data produced by in-depth crash investigations has enabled research into roadside safety that has demonstrated clear zones would need to be impractically large to eliminate serious and fatal injury arising from road departures. Barriers placed close to edge of the road were found through simulations to have the potential to achieve this aim. This demonstrates how in-depth crash investigation at CASR enables research questions to be answered that cannot be answered with police report data alone.

REFERENCES
1. Baldock, M. R. J., Woolley, J. E., Ponte, G., Wundersitz, L. N., & Lindsay, V. L. (2009). In-depth crash investigation at the Centre for Automotive Safety Research. 3rd Expert Symposium on Accident Research, (pp. 15-23). Bergisch Gladbach: Bundesanstalt für Straßenwesen.
2. Austroads (2009) Guide to road design part 6: roadside design safety and barriers, Sydney, Austroads. 3. Doecke, S. D., & Woolley, J. E. (2010). Effective use of clear zones and barriers in a Safe System’s context. 2010
Australasian Road Safety Research, Policing and Education Conference, Canberra, 31 August - 3 September 2010. 4. Doecke, S. D., & Woolley, J. E. (2011). Further investigation into the effective use of clear zones and barriers in a
safe system’s context on rural roads. 2011 Australasian Road Safety Research, Policing and Education Conference, Perth, 6-9 November 2011.
5. Doecke, S. D., & Woolley, J. E. (2013). Some implications from the in-depth study and simulation modelling of road departure crashes on bends on rural roads. Road Safety Research, Policing and Education Conference 2013, Brisbane, Australia, 28-30 August 2013.
6. Doecke, S. D., & Woolley, J. E. (2013). Adequacy of barrier and median separation on rural roads (CASR087). Adelaide: Centre for Automotive Safety Research.
7. Doecke, S. D., Woolley, J. E., & Mackenzie, J. R. R. (2011). Post impact trajectory of vehicles at rural intersections. A Safe System, making it happen. Australasian College of Road Safety national conference, Melbourne, Australia, 1-2 September 2011.
8. Doecke, S. D., & Woolley, J. E. (2012). Post impact trajectory of vehicles at metropolitan intersections (CASR060). Adelaide: Centre for Automotive Safety Research.
9. Austroads (2006b) Guide to road safety part 3: speed limits and speed management, Sydney, Austroads. 10. National Highway Traffic Safety Administration (2007) Buying a safer car, 2008. (DOT HS 810 872) Washington, D.
C. : US Department of Transportation. 11. Grzebieta RH, Zou R, Corben B, Judd R, Kulgren A, Tingval C, Powell C. (2002) ‘Roadside Crash Barrier Testing’, in
Proceedings of the International Crashworthiness Conference, Melbourne, Australia, 25-27 January, 2002.
Title: In-depth crash investigation setup in Campinas, São Paulo, Brazil
Authors: Jörg Mönnich*, Thomas Lich*, Andreas Georgi*, Alexandre Pagotto**
*Robert Bosch GmbH, Corporate Research and Advance Engineering, Vehicle Safety and Assistance Systems, CR/AEV, Accident Research, Renningen, 70465 Stuttgart, Germany
** Robert Bosch Latin America, Head of Marketing for Chassis Systems Division, Vehicles Safety and Driving Assistance Systems Specialist, CC/MBL-LA, Campinas – SP, Brazil
Motivation
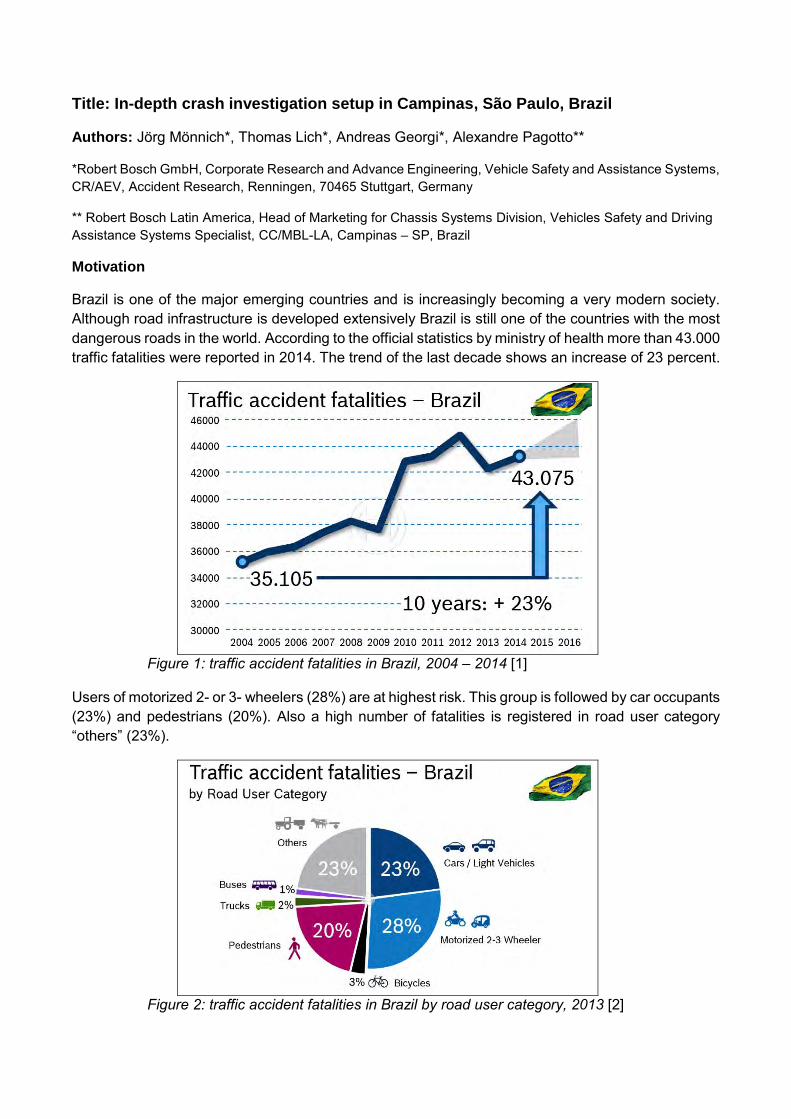
Brazil is one of the major emerging countries and is increasingly becoming a very modern society. Although road infrastructure is developed extensively Brazil is still one of the countries with the most dangerous roads in the world. According to the official statistics by ministry of health more than 43.000 traffic fatalities were reported in 2014. The trend of the last decade shows an increase of 23 percent.
Figure 1: traffic accident fatalities in Brazil, 2004 – 2014 [1]
Users of motorized 2- or 3- wheelers (28%) are at highest risk. This group is followed by car occupants (23%) and pedestrians (20%). Also a high number of fatalities is registered in road user category “others” (23%).
Figure 2: traffic accident fatalities in Brazil by road user category, 2013 [2]
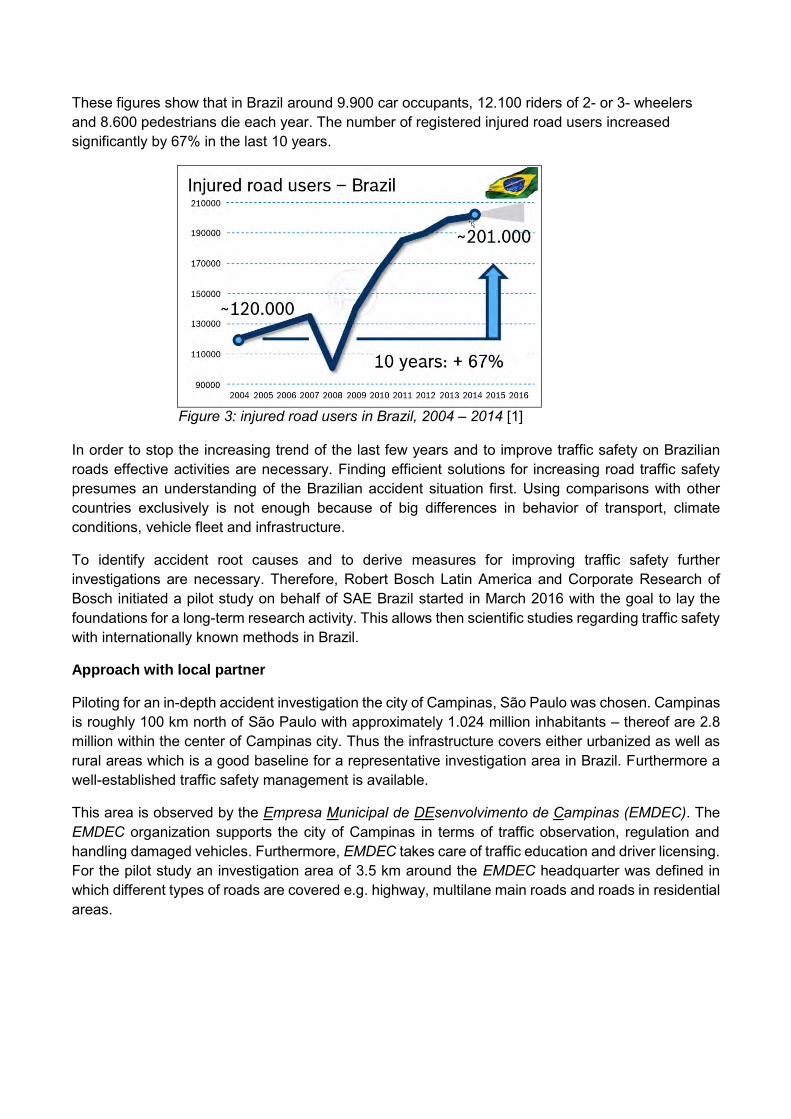
These figures show that in Brazil around 9.900 car occupants, 12.100 riders of 2- or 3- wheelers and 8.600 pedestrians die each year. The number of registered injured road users increased significantly by 67% in the last 10 years.
Figure 3: injured road users in Brazil, 2004 – 2014 [1]
In order to stop the increasing trend of the last few years and to improve traffic safety on Brazilian roads effective activities are necessary. Finding efficient solutions for increasing road traffic safety presumes an understanding of the Brazilian accident situation first. Using comparisons with other countries exclusively is not enough because of big differences in behavior of transport, climate conditions, vehicle fleet and infrastructure.
To identify accident root causes and to derive measures for improving traffic safety further investigations are necessary. Therefore, Robert Bosch Latin America and Corporate Research of Bosch initiated a pilot study on behalf of SAE Brazil started in March 2016 with the goal to lay the foundations for a long-term research activity. This allows then scientific studies regarding traffic safety with internationally known methods in Brazil.
Approach with local partner
Piloting for an in-depth accident investigation the city of Campinas, São Paulo was chosen. Campinas is roughly 100 km north of São Paulo with approximately 1.024 million inhabitants – thereof are 2.8 million within the center of Campinas city. Thus the infrastructure covers either urbanized as well as rural areas which is a good baseline for a representative investigation area in Brazil. Furthermore a well-established traffic safety management is available.
This area is observed by the Empresa Municipal de DEsenvolvimento de Campinas (EMDEC). The EMDEC organization supports the city of Campinas in terms of traffic observation, regulation and handling damaged vehicles. Furthermore, EMDEC takes care of traffic education and driver licensing. For the pilot study an investigation area of 3.5 km around the EMDEC headquarter was defined in which different types of roads are covered e.g. highway, multilane main roads and roads in residential areas.
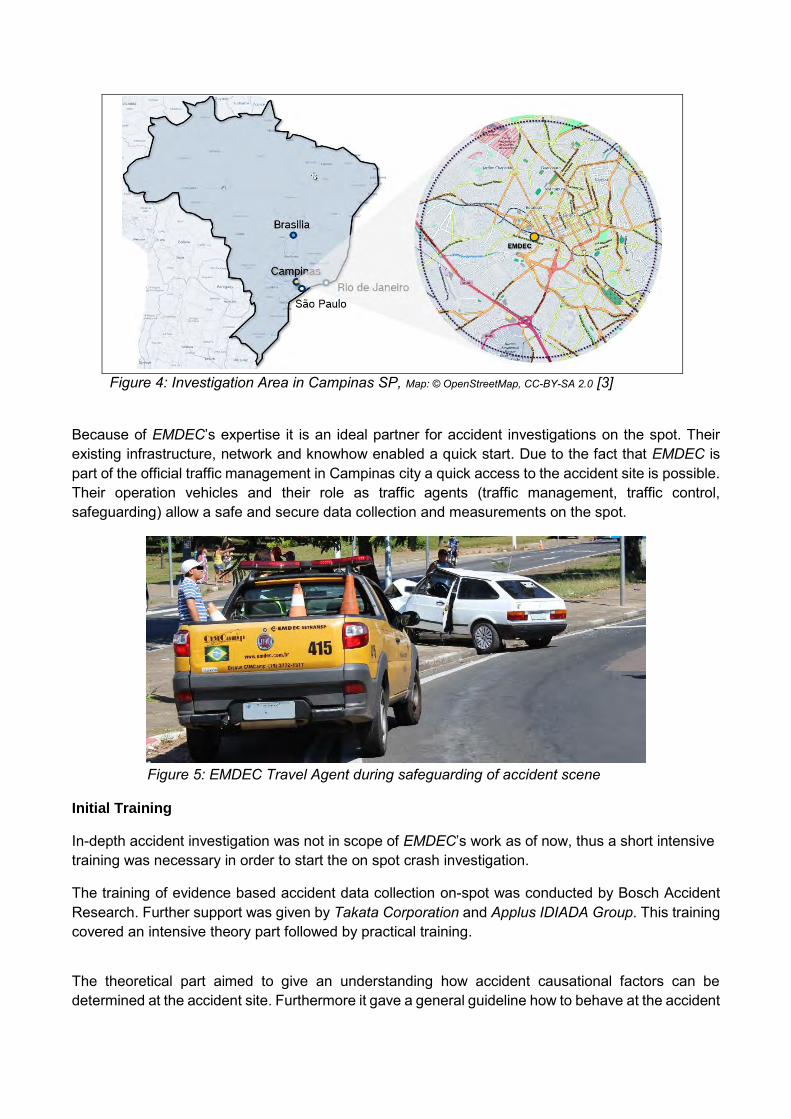
Figure 4: Investigation Area in Campinas SP, Map: © OpenStreetMap, CC-BY-SA 2.0 [3]
Because of EMDEC’s expertise it is an ideal partner for accident investigations on the spot. Their existing infrastructure, network and knowhow enabled a quick start. Due to the fact that EMDEC is part of the official traffic management in Campinas city a quick access to the accident site is possible. Their operation vehicles and their role as traffic agents (traffic management, traffic control, safeguarding) allow a safe and secure data collection and measurements on the spot.
Figure 5: EMDEC Travel Agent during safeguarding of accident scene
Initial Training
In-depth accident investigation was not in scope of EMDEC’s work as of now, thus a short intensive training was necessary in order to start the on spot crash investigation.
The training of evidence based accident data collection on-spot was conducted by Bosch Accident Research. Further support was given by Takata Corporation and Applus IDIADA Group. This training covered an intensive theory part followed by practical training.
The theoretical part aimed to give an understanding how accident causational factors can be determined at the accident site. Furthermore it gave a general guideline how to behave at the accident
spot dealing with authorities and accident participants. By using accident information from already investigated crashes out from other investigations the team from EMDEC was trained intensively. Overall following topics were covered
Safety and behavior at the accident site Trace identification and type of traces Determination of the collision point Type and kind of accident Types of crash configurations and their specific characteristics i.e. truck crashes Basics of crash documentation
To underlie the theory a practical part was assessed including:
Picture reporting (detailed documentation of vehicle damages) Documentation of accident details using investigation forms and database Trace interpretation, identification of collision Measurement and drawing of scaled sketch of the accident site Save work on accident spot
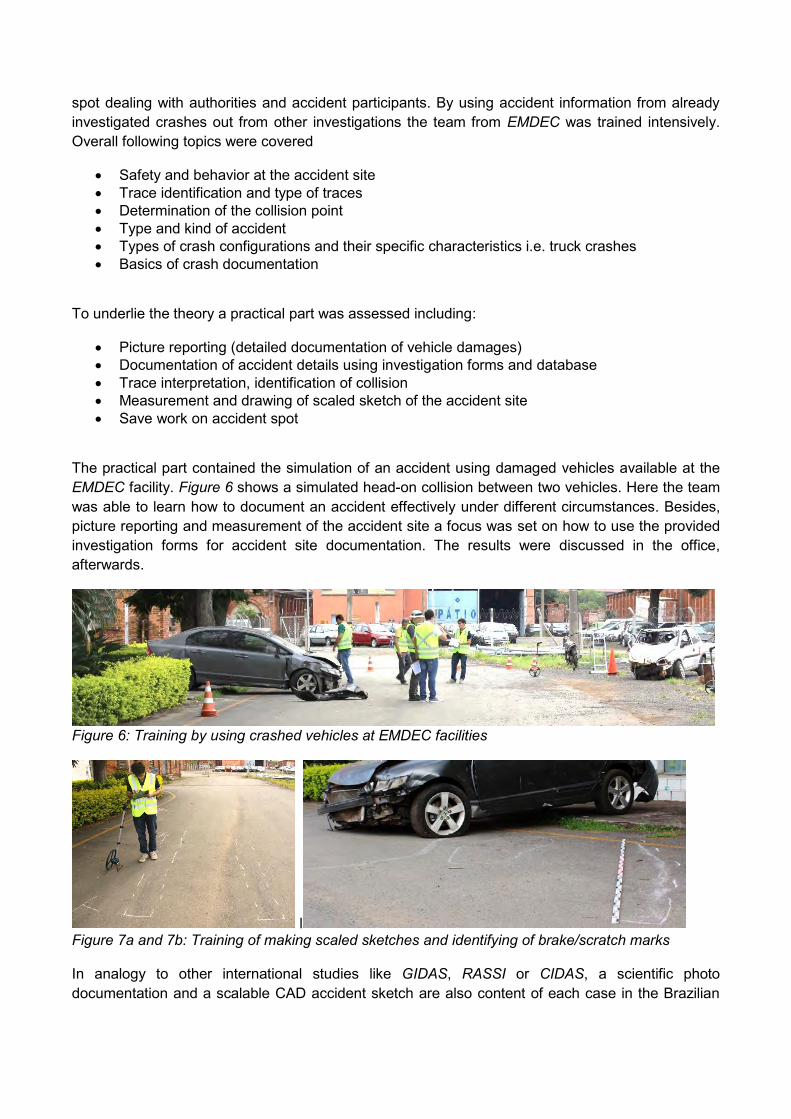
The practical part contained the simulation of an accident using damaged vehicles available at the EMDEC facility. Figure 6 shows a simulated head-on collision between two vehicles. Here the team was able to learn how to document an accident effectively under different circumstances. Besides, picture reporting and measurement of the accident site a focus was set on how to use the provided investigation forms for accident site documentation. The results were discussed in the office, afterwards.
Figure 6: Training by using crashed vehicles at EMDEC facilities
l Figure 7a and 7b: Training of making scaled sketches and identifying of brake/scratch marks In analogy to other international studies like GIDAS, RASSI or CIDAS, a scientific photo documentation and a scalable CAD accident sketch are also content of each case in the Brazilian
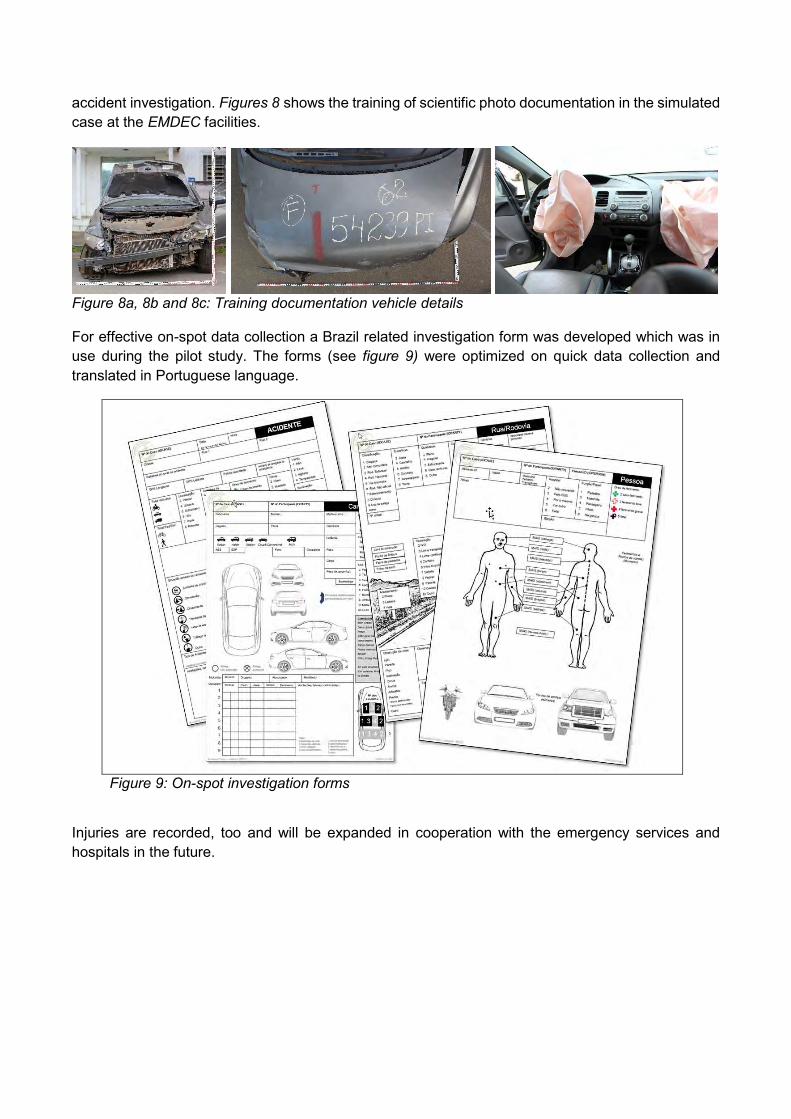
accident investigation. Figures 8 shows the training of scientific photo documentation in the simulated case at the EMDEC facilities.
Figure 8a, 8b and 8c: Training documentation vehicle details For effective on-spot data collection a Brazil related investigation form was developed which was in use during the pilot study. The forms (see figure 9) were optimized on quick data collection and translated in Portuguese language.
Figure 9: On-spot investigation forms
Injuries are recorded, too and will be expanded in cooperation with the emergency services and hospitals in the future.
Database
In addition to the training of data collection a new Brazilian adapted system of data storage was developed. This new digital database includes 12 records with 400 variables1 and approximately 3.000 detailing specifications options for each accident. The database structure and content allows international comparison of study results and supports the harmonization with other accident databases like iGlad. In addition to the accident pictures and scaled accident sketch the digital database of the pilot study includes detailed information about:
Accident scene (traffic control, traffic signs, location details, …) Weather information (climate, visibility, …) Street conditions (constitution, number of lanes, infrastructure details, …) Participant details (role, causes of accident, …) Vehicle details (body type, features, usage, active & passive safety, …) Vehicle damage (location, deformation, description, …) Accident reconstruction (event and vehicle wise details, speed, collision partner, …) Person information (role, usage of safety features, …) Injury coding (Injury details, location, classification, …) Police and rescue service relevant details
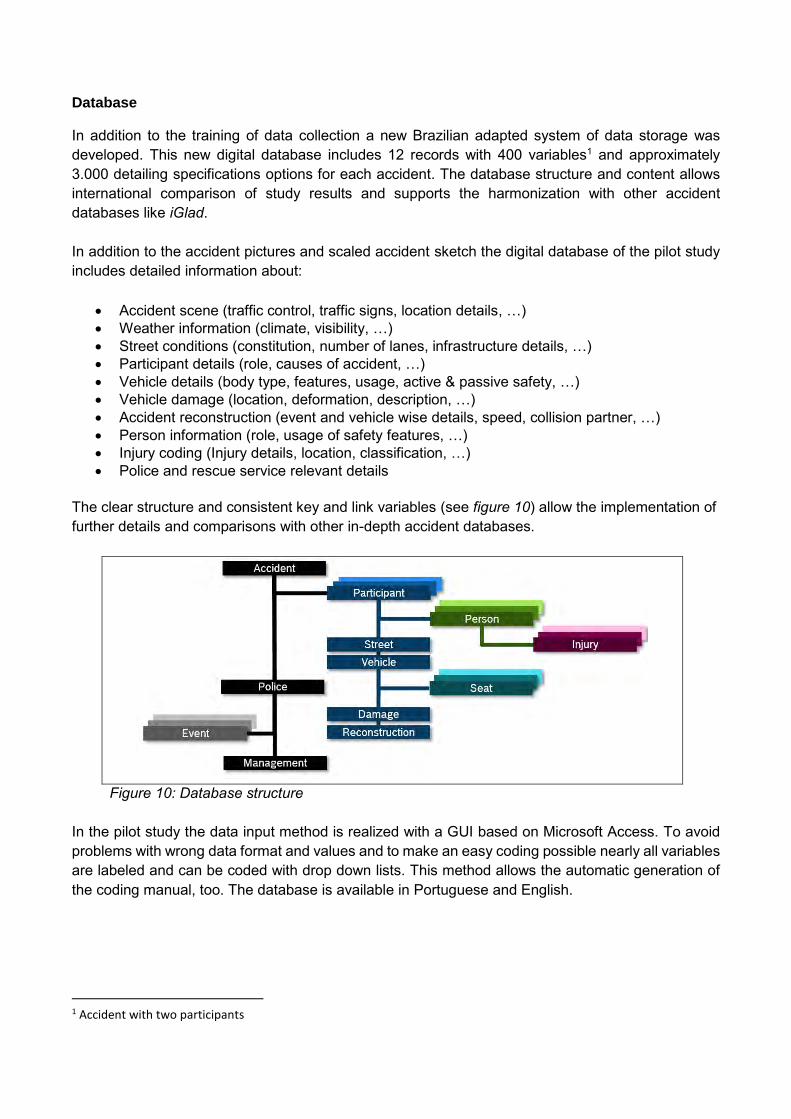
The clear structure and consistent key and link variables (see figure 10) allow the implementation of further details and comparisons with other in-depth accident databases.
Figure 10: Database structure
In the pilot study the data input method is realized with a GUI based on Microsoft Access. To avoid problems with wrong data format and values and to make an easy coding possible nearly all variables are labeled and can be coded with drop down lists. This method allows the automatic generation of the coding manual, too. The database is available in Portuguese and English.
1 Accident with two participants
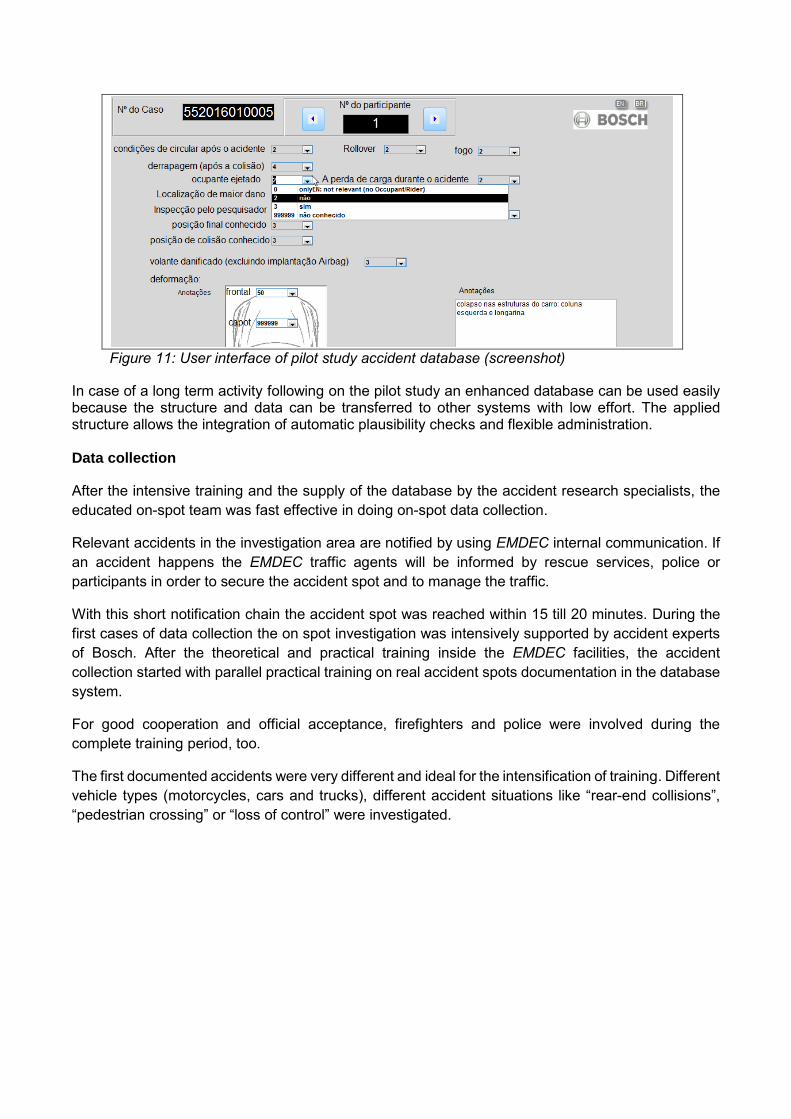
Figure 11: User interface of pilot study accident database (screenshot)
In case of a long term activity following on the pilot study an enhanced database can be used easily because the structure and data can be transferred to other systems with low effort. The applied structure allows the integration of automatic plausibility checks and flexible administration. Data collection
After the intensive training and the supply of the database by the accident research specialists, the educated on-spot team was fast effective in doing on-spot data collection.
Relevant accidents in the investigation area are notified by using EMDEC internal communication. If an accident happens the EMDEC traffic agents will be informed by rescue services, police or participants in order to secure the accident spot and to manage the traffic.
With this short notification chain the accident spot was reached within 15 till 20 minutes. During the first cases of data collection the on spot investigation was intensively supported by accident experts of Bosch. After the theoretical and practical training inside the EMDEC facilities, the accident collection started with parallel practical training on real accident spots documentation in the database system.
For good cooperation and official acceptance, firefighters and police were involved during the complete training period, too.
The first documented accidents were very different and ideal for the intensification of training. Different vehicle types (motorcycles, cars and trucks), different accident situations like “rear-end collisions”, “pedestrian crossing” or “loss of control” were investigated.
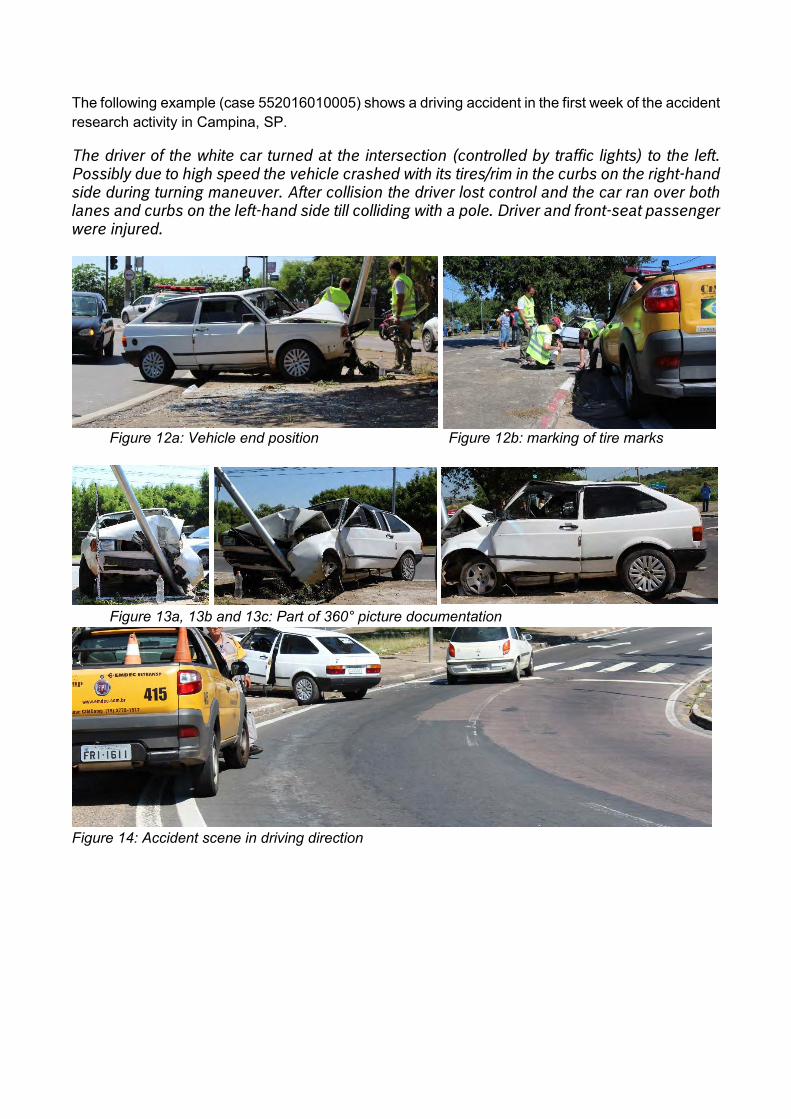
The following example (case 552016010005) shows a driving accident in the first week of the accident research activity in Campina, SP.
The driver of the white car turned at the intersection (controlled by traffic lights) to the left. Possibly due to high speed the vehicle crashed with its tires/rim in the curbs on the right-hand side during turning maneuver. After collision the driver lost control and the car ran over both lanes and curbs on the left-hand side till colliding with a pole. Driver and front-seat passenger were injured.
Figure 12a: Vehicle end position Figure 12b: marking of tire marks
Figure 13a, 13b and 13c: Part of 360° picture documentation
Figure 14: Accident scene in driving direction
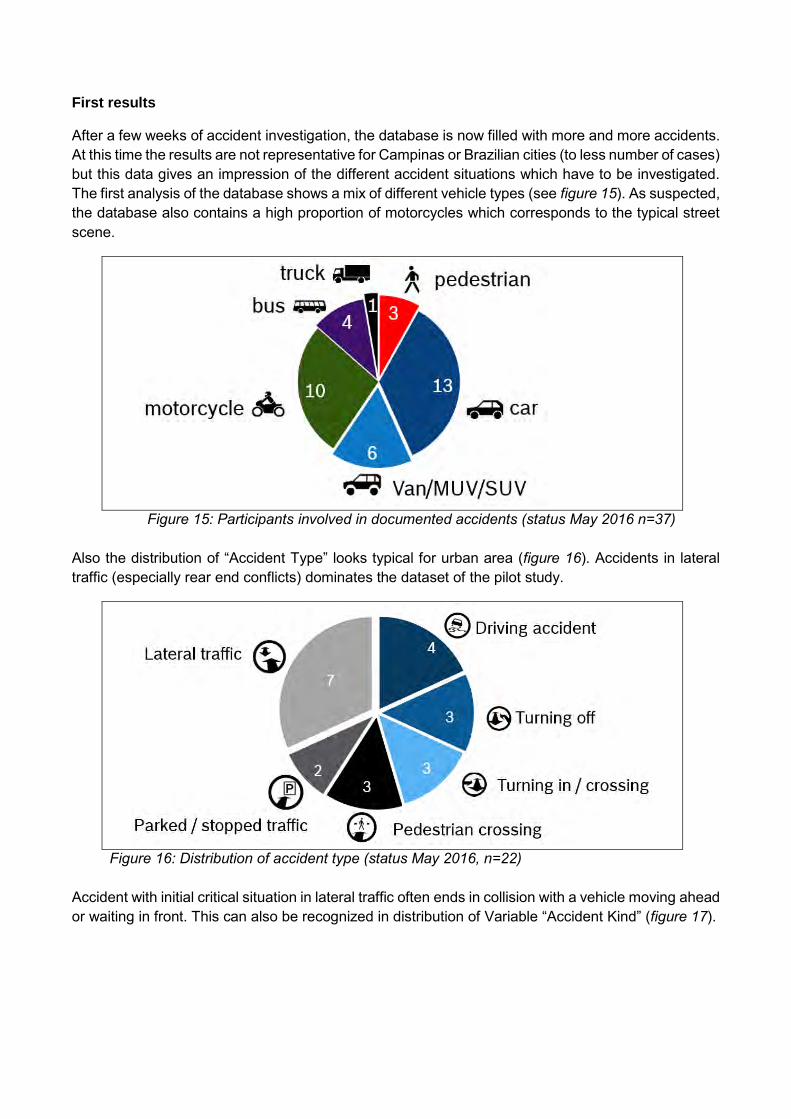
First results
After a few weeks of accident investigation, the database is now filled with more and more accidents. At this time the results are not representative for Campinas or Brazilian cities (to less number of cases) but this data gives an impression of the different accident situations which have to be investigated. The first analysis of the database shows a mix of different vehicle types (see figure 15). As suspected, the database also contains a high proportion of motorcycles which corresponds to the typical street scene.
Figure 15: Participants involved in documented accidents (status May 2016 n=37)
Also the distribution of “Accident Type” looks typical for urban area (figure 16). Accidents in lateral traffic (especially rear end conflicts) dominates the dataset of the pilot study.
Figure 16: Distribution of accident type (status May 2016, n=22)
Accident with initial critical situation in lateral traffic often ends in collision with a vehicle moving ahead or waiting in front. This can also be recognized in distribution of Variable “Accident Kind” (figure 17).
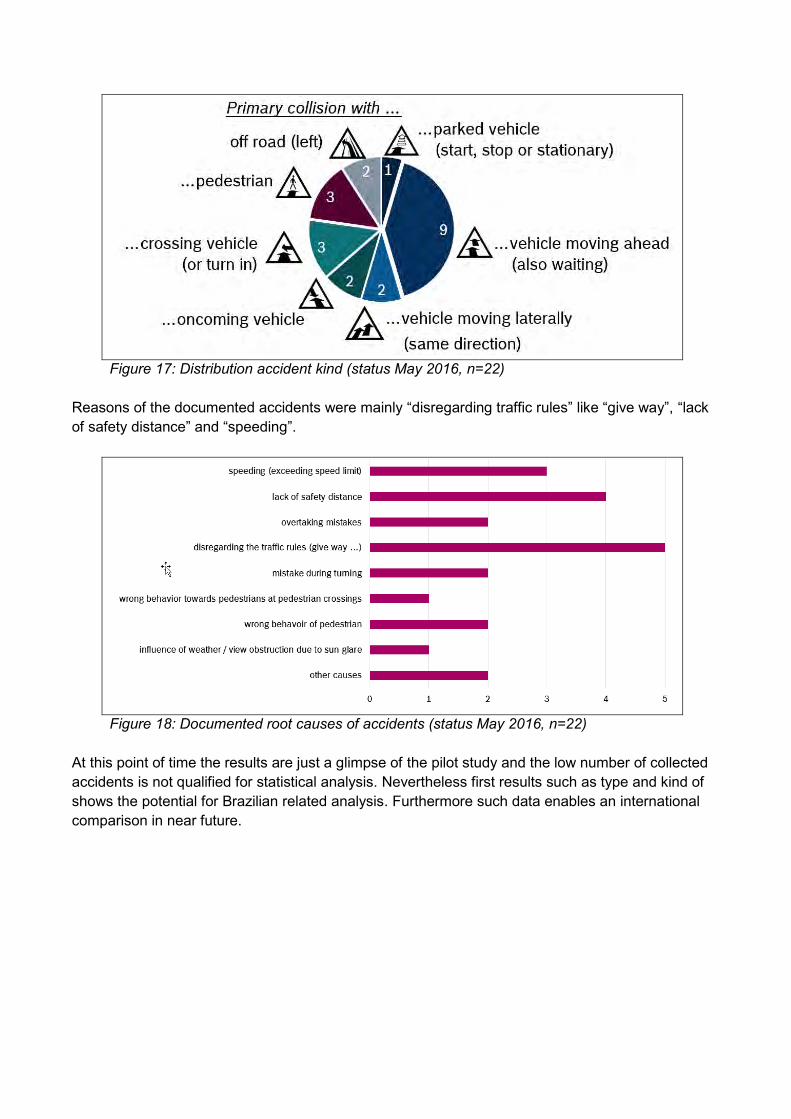
Figure 17: Distribution accident kind (status May 2016, n=22)
Reasons of the documented accidents were mainly “disregarding traffic rules” like “give way”, “lack of safety distance” and “speeding”.
Figure 18: Documented root causes of accidents (status May 2016, n=22)
At this point of time the results are just a glimpse of the pilot study and the low number of collected accidents is not qualified for statistical analysis. Nevertheless first results such as type and kind of shows the potential for Brazilian related analysis. Furthermore such data enables an international comparison in near future.
Outlook
The experience after few weeks of running accident collection shows that a baseline has been laid to build up a long term activity regarding in-depth accident research in Brazil. By end of 2016 the results will show that such investigation is more than required to improve traffic safety hence it is more likely that the investigation will be continued in 2017.Therefore a next step is to find further stakeholders like vehicle manufactures, supplier, safety-, infrastructure- or governmental related organizations which are willing to support this activity in future as a long-term investigation.
The investigation area should be expanded to rural area to increase representativeness. Therefore other authorities has to be taken into account hence further discussions to be made to get permission to access the accident site.
The implementation of automatic plausibility checks and development and usage of easy administrable database has to be done in advanced to reach high quality standards. Existing experience in other international activities like GIDAS, RASSI, CIDAS and iGlad is very beneficial to bring the Brazil project to a comparable level in short time.
First results of such long-term accident study can be used for comparison of real accident situation against Latin-NCAP results. Moreover results will lead to further traffic safety measures to improve traffic safety in Brazil. It will then also be possible to determined benefits from existing active and passive vehicle safety solutions in Brazil in future. Results can also be used for future campaigns with the goal to increase safety awareness in general.

[1] Ministry of Health – Brazil - DATASUS database Update 02/2016 Brazilian association for the prevention of traffic accidents http://www.vias-seguras.com/os_acidentes/estatisticas/estatisticas_nacionais/estatisticas_do_ministerio_da_saude http://datasus.saude.gov.br/
[2] GLOBAL STATUS REPORT ON ROAD SAFETY 2015 World Health Organization ISBN 978 92 4 156506 6
[3] © OpenStreetMap und Mitwirkende, CC-BY-SA http://www.openstreetmap.org/
License CC-BY-SA http://creativecommons.org/licenses/by-sa/2.0
Analysis and Investigation Method for All Traffic Scenarios (AIMATS)
Dr. Christian Erbsmehl*, Dr. Nils Lubbe**, Niels Ferson**, Hitoshi Yuasa**, Dr. Tom Landgraf*, Martin Urban*
*Fraunhofer Institute for Transportation and Infrastructure Systems, Zeunerstr. 38, 01069 Dresden, Germany
**Toyota Motors Europe, Research & Development, Hoge Wei 33, 1930 Zaventem, Belgium Abstract - Millions of kilometers are driven and recorded by car manufacturers and researchers every year to gather information about realistic traffic situations. The focus of these studies is often the recording of critical situations to create test scenarios for the development of new systems before introducing them into the market. This paper shows a novel Analysis and Investigation Method for All Traffic Scenarios (AIMATS) based on real traffic scenes. It also shows how to get detailed information about speeds, trajectories and behavior of all participants without driving thousands of kilometers at the example of conflict situations with animals. Basis of the AIMATS is the identification of the most relevant locations as “Points of Interest” (POI), the recording of the critical situations and their “base lines” at these POI. This paper presents a new method to identify critical scenarios involving both vehicles and animals as well as preliminary results of a study done in Saxony using this new method. INTRODUCTION AND STATE OF THE ART Vehicle based recording Naturalistic Driving Studies (NDS) record vehicle and driver behaviour using unobtrusive observation or using observation taking place in a natural setting [1]. Data recorded can be used to study vehicle motions and driver behaviours that lead to critical situations or collisions. Data is collected continuously during driving or triggered by critical events. NDS typically focuses on the pre-collision phase, including vehicle and driver states. In contrast, Event Data Recorders are typically triggered by collision events and are emphasizing collection of in-collision phase data. Field Operational Tests (FOT) have a close relation to NDS. Test vehicle instrumentation is often similar or equal. NDS observe and analyse crash causation while FOT evaluate effects of e.g. Advanced Driver Assistance Systems (ADAS) on critical events and collisions. Consequently, ADAS are typically present and evaluated in FOT while NDS can lead to developing new ADAS addressing previously unobserved crash causations. Several NDS have been concluded such as the 100-Car study [1] or SHRP2 [2], both conducted in the US, while others (e.g. European UDRIVE [3] ) are currently running. The quantity of vehicle based recording Animal-Vehicle encounters have been studied in a recent NDS using 48 instrumented vehicles which were enrolled for an average of 5 months each, over a span of 11 months in a collaboration of the Toyota Collaborative Safety Research Center (CSRC), the Virginia Tech Transportation Institute (VTTI) and the Western Transportation Institute (WTI). In total, 35,000 trips covering over 350,000 miles were recorded and 829 animal vehicle encounters were identified [4].
This indicates an encounter rate of less than one animal per instrumented vehicle and week. Even when driving in animal-encounter prone areas, this seems to be realistic as animal encounters and collisions after all are a rare event. The quality of vehicle based recording Another issue of NDS- based scenario data are often the limited boundary conditions of a mobile recording platform for example the field of view, the precise determination of the recorder platform (car) position or the possibility to record the traffic situation some seconds before and after a critical situation at the same location. Also, the natural behaviour of participants of the scenario cannot be recorded. For example, a pedestrian or wild animal street crossing without any interaction of cars. Infrastructure-based recording A promising approach to record more encounters per time and instrumentation unit is to base the observation not on in-vehicle instrumentation but in the infrastructure. Infrastructure-based observations can easily run for 24h a day, while vehicles are most of the time not recording any data. Infrastructure-based video recording has been used at Lund University in the 1980s [5], ranging from more qualitative descriptions to attempts of automated analysis [6], for example to describe drivers' speed behaviour at pedestrian crossings [7]. Another project which uses infrastructure-based recording is the AIM- Intersection Project in Braunschweig, Germany [8]. The AIM approach connects the equipment of one intersection with high-level measurement units like radar-, LIDAR- - and camera-based sensors. All these sensors are used to record normal traffic scenarios, critical scenarios and, of course, crashes. Critical events are thus comparable to normal driving situations at this specific location. One disadvantage of this method is the high effort and costs for installing the equipment at the intersection, which makes it not moveable to other critical locations. Résumé The recording of critical or normal real traffic situations with existing methods has the following disadvantages: - expensive equipment of the measuring systems (all) - limitations in recording parameters (NDS) - accuracy of recorded parameters (NDS) - flexible recording locations (AIM) This paper gives a new possibility for the Analysis and Investigation of all Traffic Scenarios (AIMATS) at the example of vehicle and wild animals encounters, developed by Fraunhofer IVI and Toyota Motor Europe. For the first time, this paper presents a method that has all advantages of the methods described above while eliminating most disadvantages. The
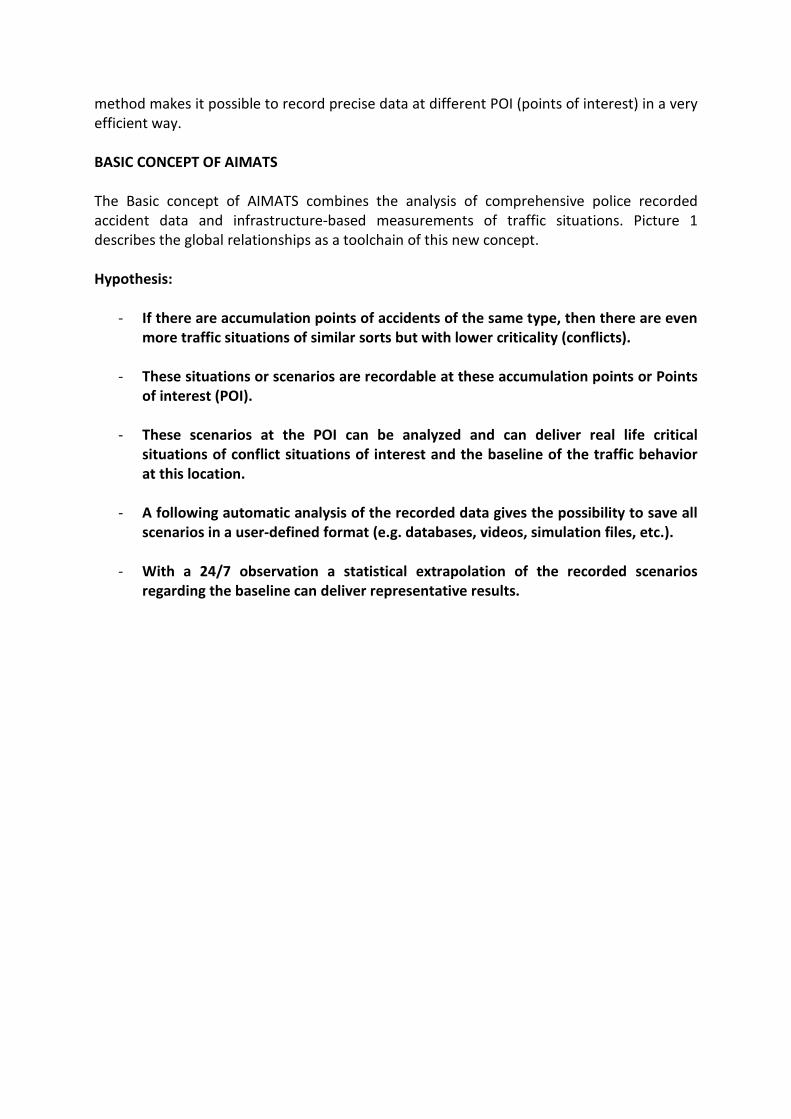
method makes it possible to record precise data at different POI (points of interest) in a very efficient way. BASIC CONCEPT OF AIMATS The Basic concept of AIMATS combines the analysis of comprehensive police recorded accident data and infrastructure-based measurements of traffic situations. Picture 1 describes the global relationships as a toolchain of this new concept. Hypothesis:
- If there are accumulation points of accidents of the same type, then there are even more traffic situations of similar sorts but with lower criticality (conflicts).
- These situations or scenarios are recordable at these accumulation points or Points of interest (POI).
- These scenarios at the POI can be analyzed and can deliver real life critical situations of conflict situations of interest and the baseline of the traffic behavior at this location.
- A following automatic analysis of the recorded data gives the possibility to save all scenarios in a user-defined format (e.g. databases, videos, simulation files, etc.).
- With a 24/7 observation a statistical extrapolation of the recorded scenarios regarding the baseline can deliver representative results.
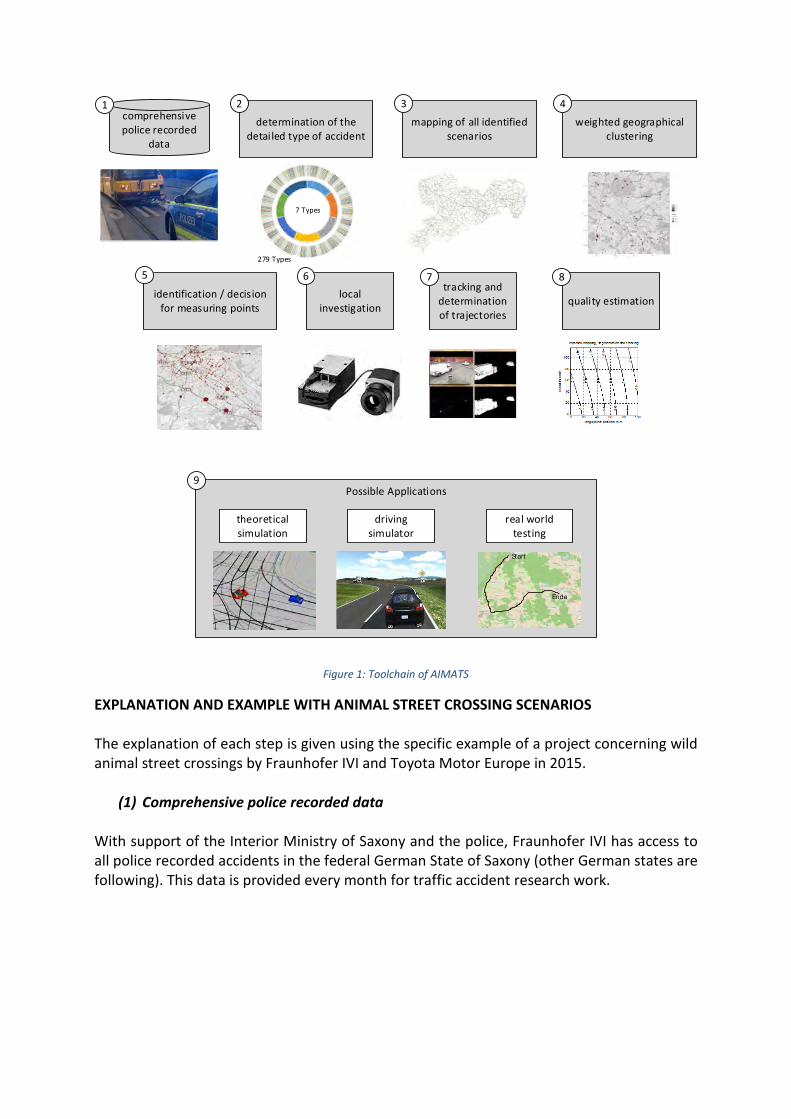
7- U-Typen
297- U-Typen
7 Types
279 Types
Possible Applications
theoretical simulation
comprehensive police recorded
data
determination of the detailed type of accident
mapping of all identified scenarios
weighted geographical clustering
identification / decision for measuring points
local investigation
tracking and determination of trajectories
quality estimation
driving simulator
real world testing
Start
Ende
1 2 3 4
5 6 7 8
9
Figure 1: Toolchain of AIMATS
EXPLANATION AND EXAMPLE WITH ANIMAL STREET CROSSING SCENARIOS The explanation of each step is given using the specific example of a project concerning wild animal street crossings by Fraunhofer IVI and Toyota Motor Europe in 2015.
(1) Comprehensive police recorded data With support of the Interior Ministry of Saxony and the police, Fraunhofer IVI has access to all police recorded accidents in the federal German State of Saxony (other German states are following). This data is provided every month for traffic accident research work.
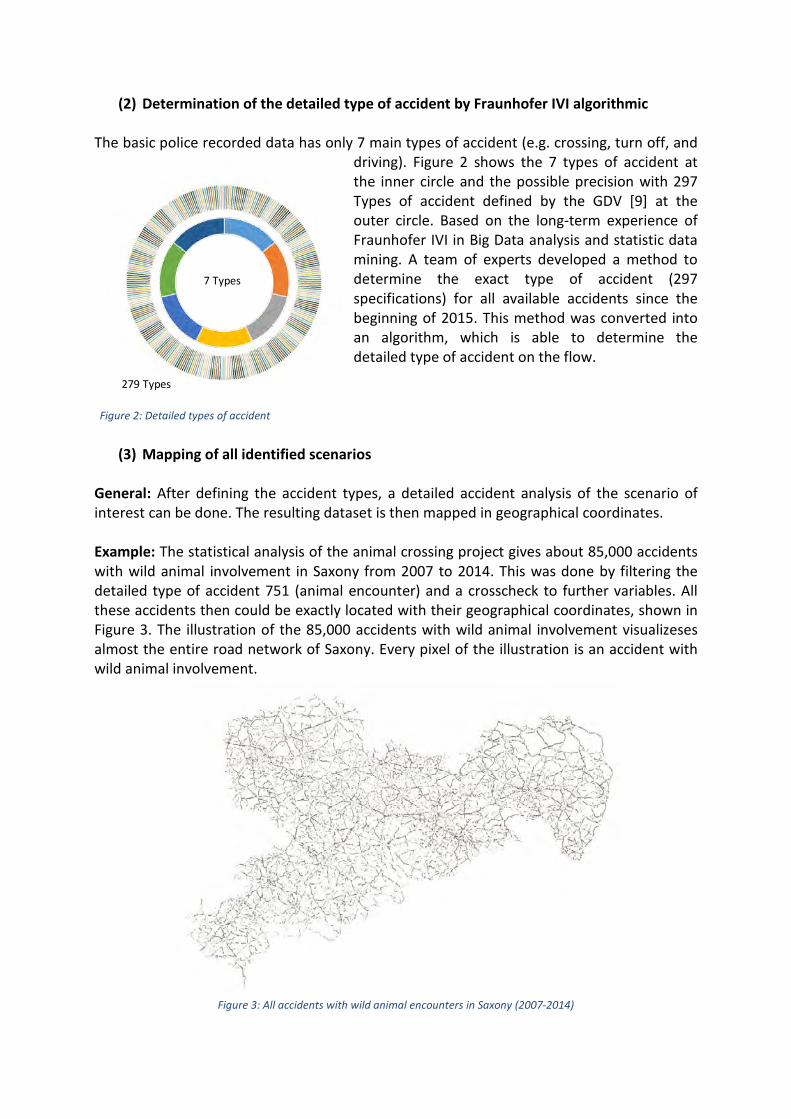
Figure 2: Detailed types of accident
(2) Determination of the detailed type of accident by Fraunhofer IVI algorithmic The basic police recorded data has only 7 main types of accident (e.g. crossing, turn off, and
driving). Figure 2 shows the 7 types of accident at the inner circle and the possible precision with 297 Types of accident defined by the GDV [9] at the outer circle. Based on the long-term experience of Fraunhofer IVI in Big Data analysis and statistic data mining. A team of experts developed a method to determine the exact type of accident (297 specifications) for all available accidents since the beginning of 2015. This method was converted into an algorithm, which is able to determine the detailed type of accident on the flow.
(3) Mapping of all identified scenarios General: After defining the accident types, a detailed accident analysis of the scenario of interest can be done. The resulting dataset is then mapped in geographical coordinates. Example: The statistical analysis of the animal crossing project gives about 85,000 accidents with wild animal involvement in Saxony from 2007 to 2014. This was done by filtering the detailed type of accident 751 (animal encounter) and a crosscheck to further variables. All these accidents then could be exactly located with their geographical coordinates, shown in Figure 3. The illustration of the 85,000 accidents with wild animal involvement visualizeses almost the entire road network of Saxony. Every pixel of the illustration is an accident with wild animal involvement.
Figure 3: All accidents with wild animal encounters in Saxony (2007-2014)
7- U-Typen
297- U-Typen
7 Types
279 Types
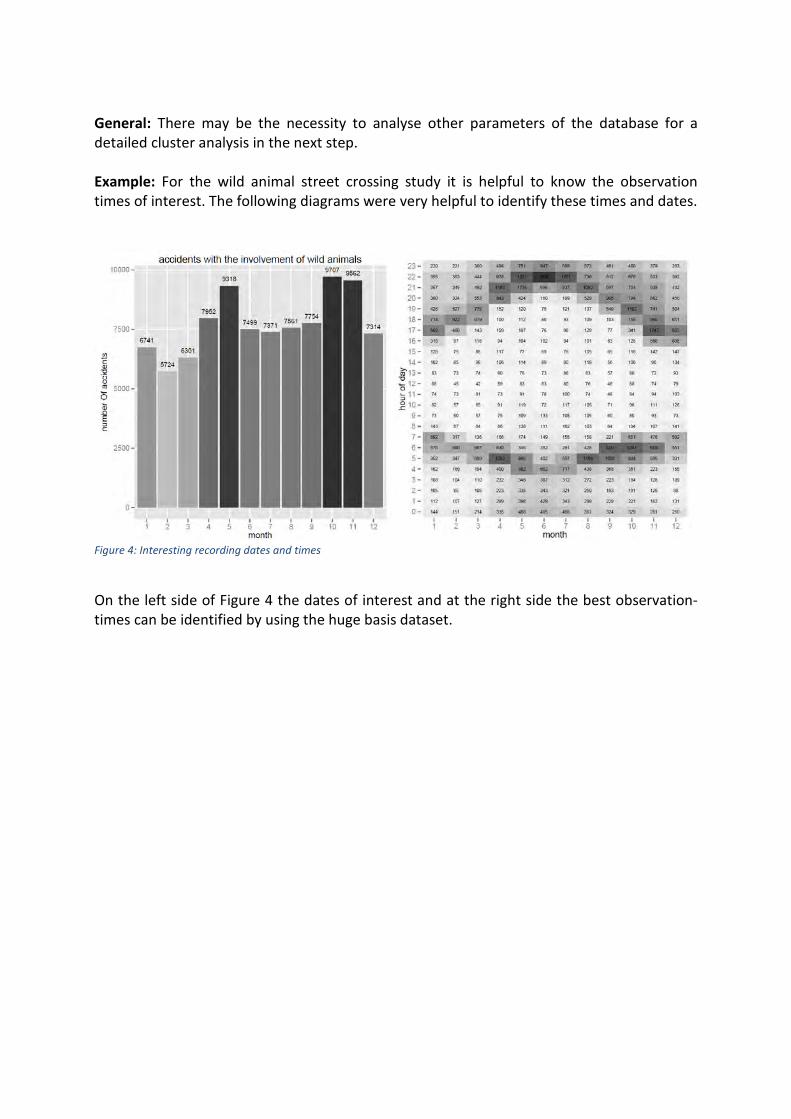
General: There may be the necessity to analyse other parameters of the database for a detailed cluster analysis in the next step. Example: For the wild animal street crossing study it is helpful to know the observation times of interest. The following diagrams were very helpful to identify these times and dates.
Figure 4: Interesting recording dates and times
On the left side of Figure 4 the dates of interest and at the right side the best observation- times can be identified by using the huge basis dataset.
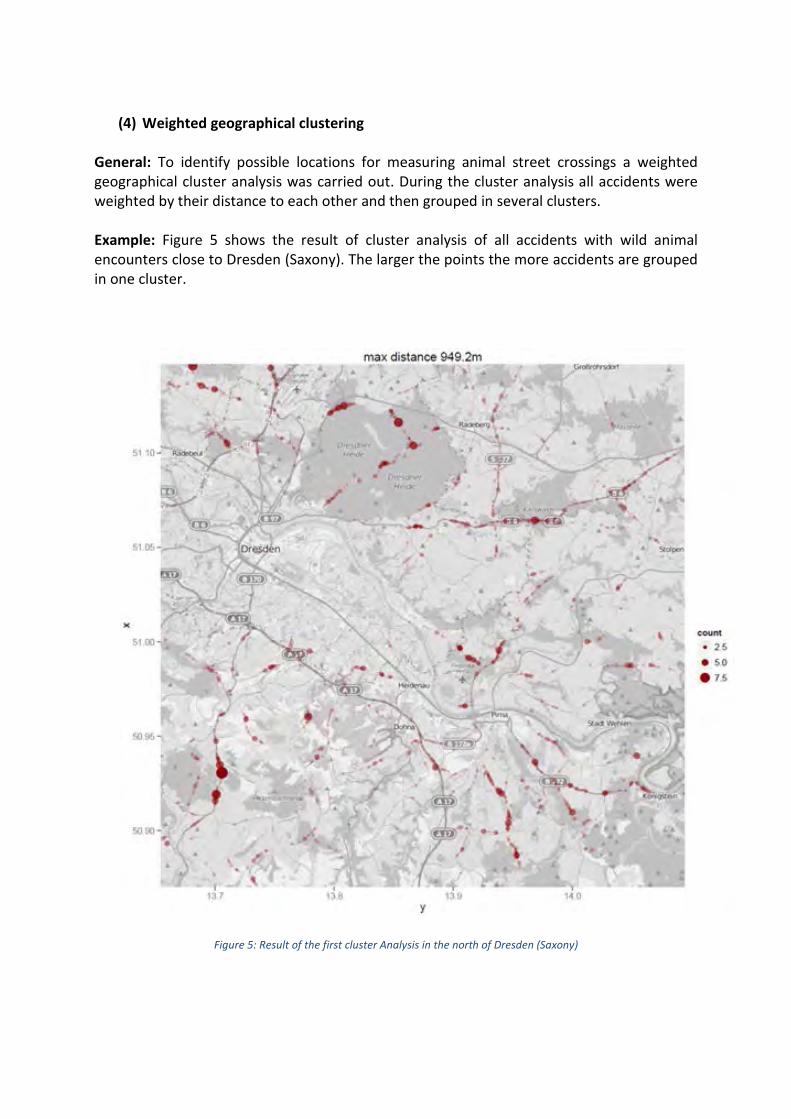
(4) Weighted geographical clustering
General: To identify possible locations for measuring animal street crossings a weighted geographical cluster analysis was carried out. During the cluster analysis all accidents were weighted by their distance to each other and then grouped in several clusters. Example: Figure 5 shows the result of cluster analysis of all accidents with wild animal encounters close to Dresden (Saxony). The larger the points the more accidents are grouped in one cluster.
Figure 5: Result of the first cluster Analysis in the north of Dresden (Saxony)
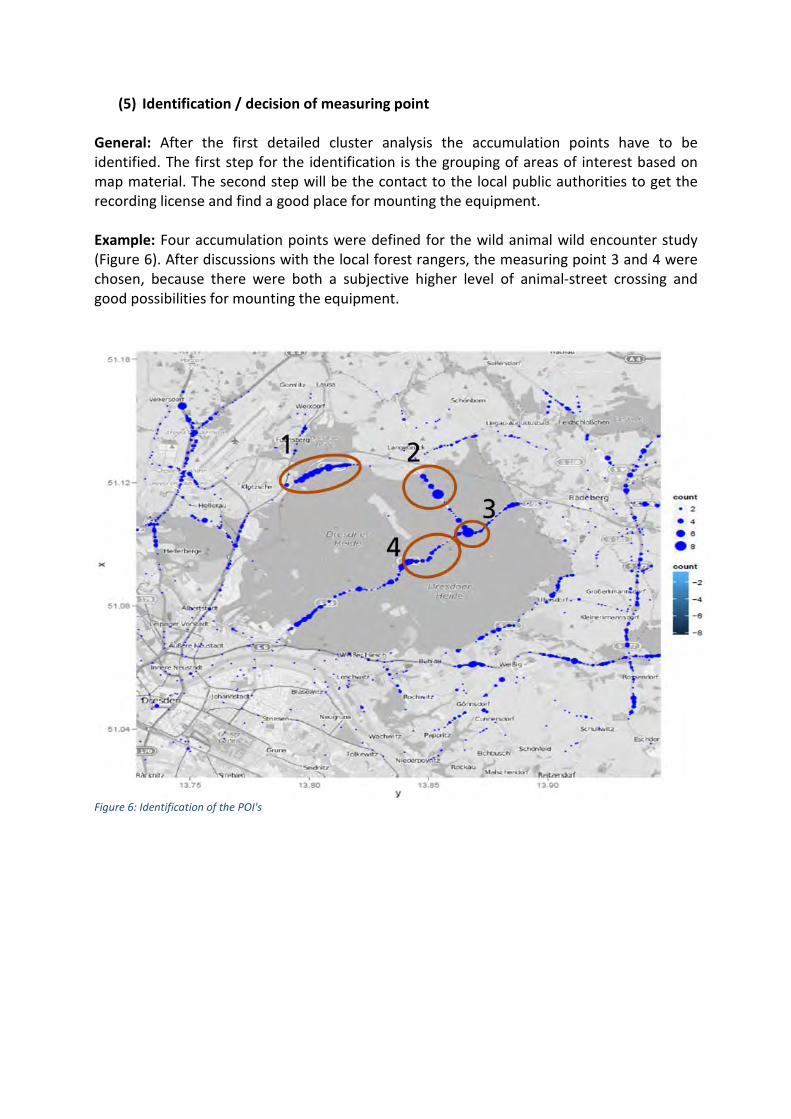
(5) Identification / decision of measuring point General: After the first detailed cluster analysis the accumulation points have to be identified. The first step for the identification is the grouping of areas of interest based on map material. The second step will be the contact to the local public authorities to get the recording license and find a good place for mounting the equipment. Example: Four accumulation points were defined for the wild animal wild encounter study (Figure 6). After discussions with the local forest rangers, the measuring point 3 and 4 were chosen, because there were both a subjective higher level of animal-street crossing and good possibilities for mounting the equipment.
Figure 6: Identification of the POI's
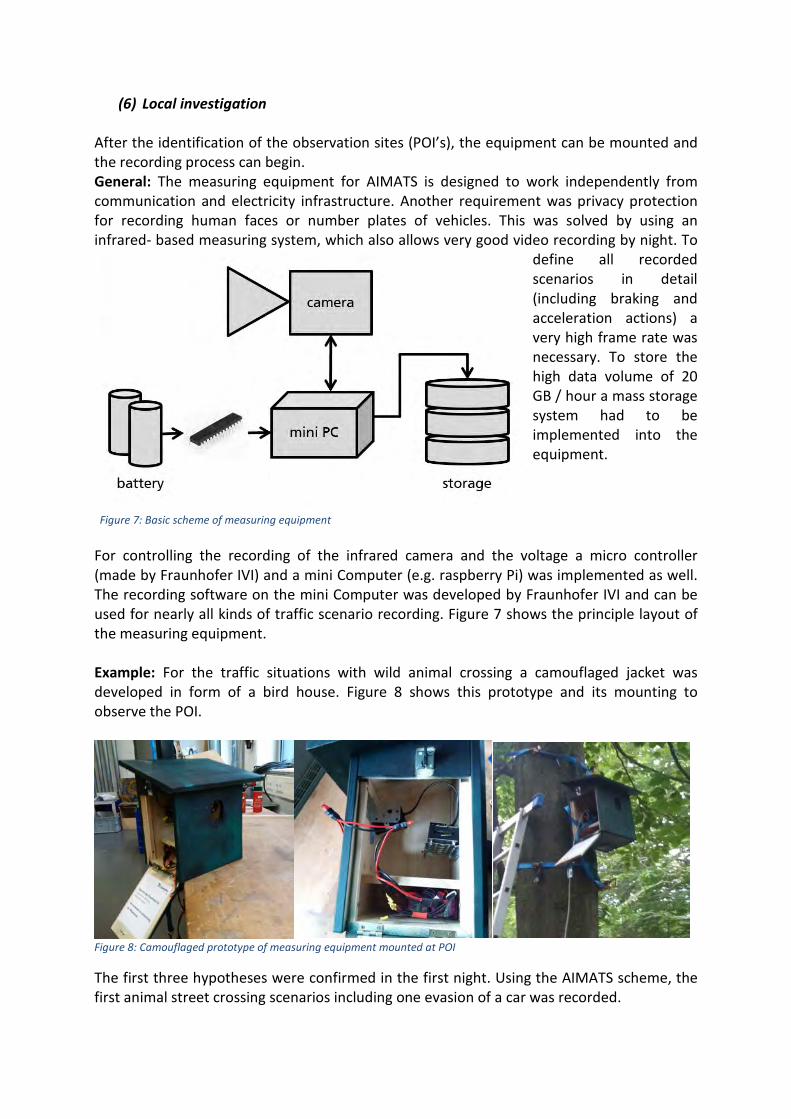
Figure 7: Basic scheme of measuring equipment
(6) Local investigation After the identification of the observation sites (POI’s), the equipment can be mounted and the recording process can begin. General: The measuring equipment for AIMATS is designed to work independently from communication and electricity infrastructure. Another requirement was privacy protection for recording human faces or number plates of vehicles. This was solved by using an infrared- based measuring system, which also allows very good video recording by night. To
define all recorded scenarios in detail (including braking and acceleration actions) a very high frame rate was necessary. To store the high data volume of 20 GB / hour a mass storage system had to be implemented into the equipment.
For controlling the recording of the infrared camera and the voltage a micro controller (made by Fraunhofer IVI) and a mini Computer (e.g. raspberry Pi) was implemented as well. The recording software on the mini Computer was developed by Fraunhofer IVI and can be used for nearly all kinds of traffic scenario recording. Figure 7 shows the principle layout of the measuring equipment. Example: For the traffic situations with wild animal crossing a camouflaged jacket was developed in form of a bird house. Figure 8 shows this prototype and its mounting to observe the POI.
Figure 8: Camouflaged prototype of measuring equipment mounted at POI
The first three hypotheses were confirmed in the first night. Using the AIMATS scheme, the first animal street crossing scenarios including one evasion of a car was recorded.
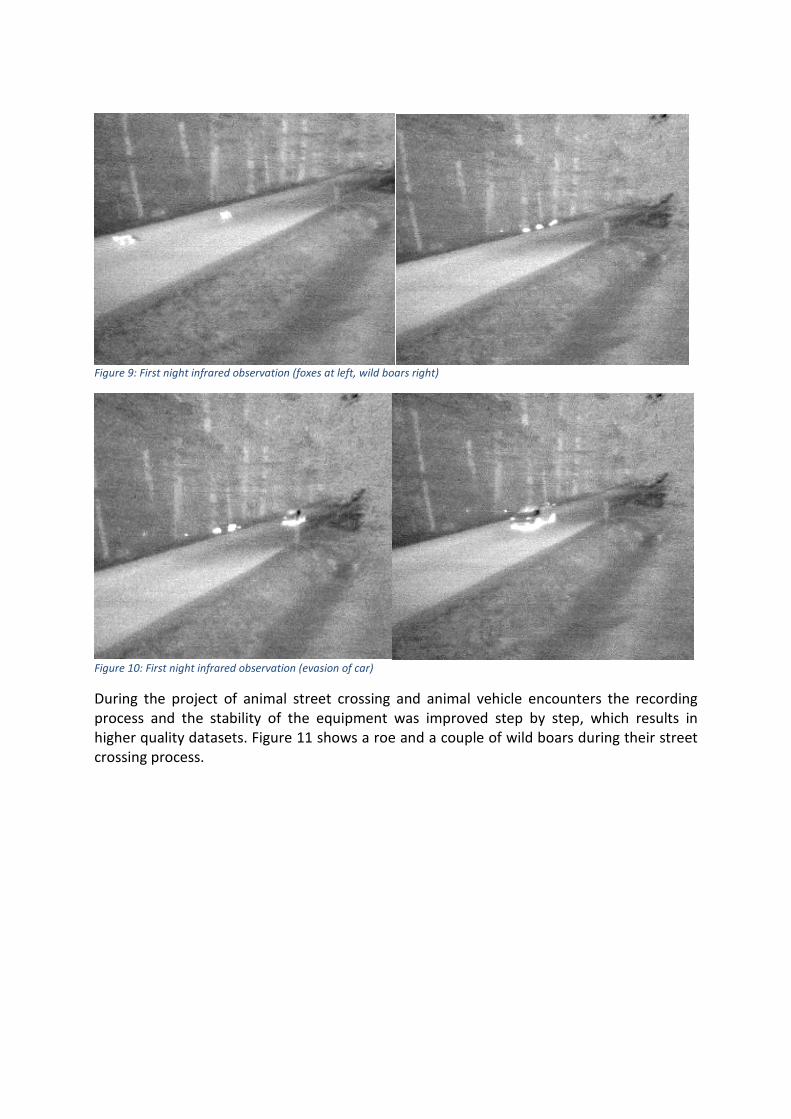
Figure 9: First night infrared observation (foxes at left, wild boars right)
Figure 10: First night infrared observation (evasion of car)
During the project of animal street crossing and animal vehicle encounters the recording process and the stability of the equipment was improved step by step, which results in higher quality datasets. Figure 11 shows a roe and a couple of wild boars during their street crossing process.
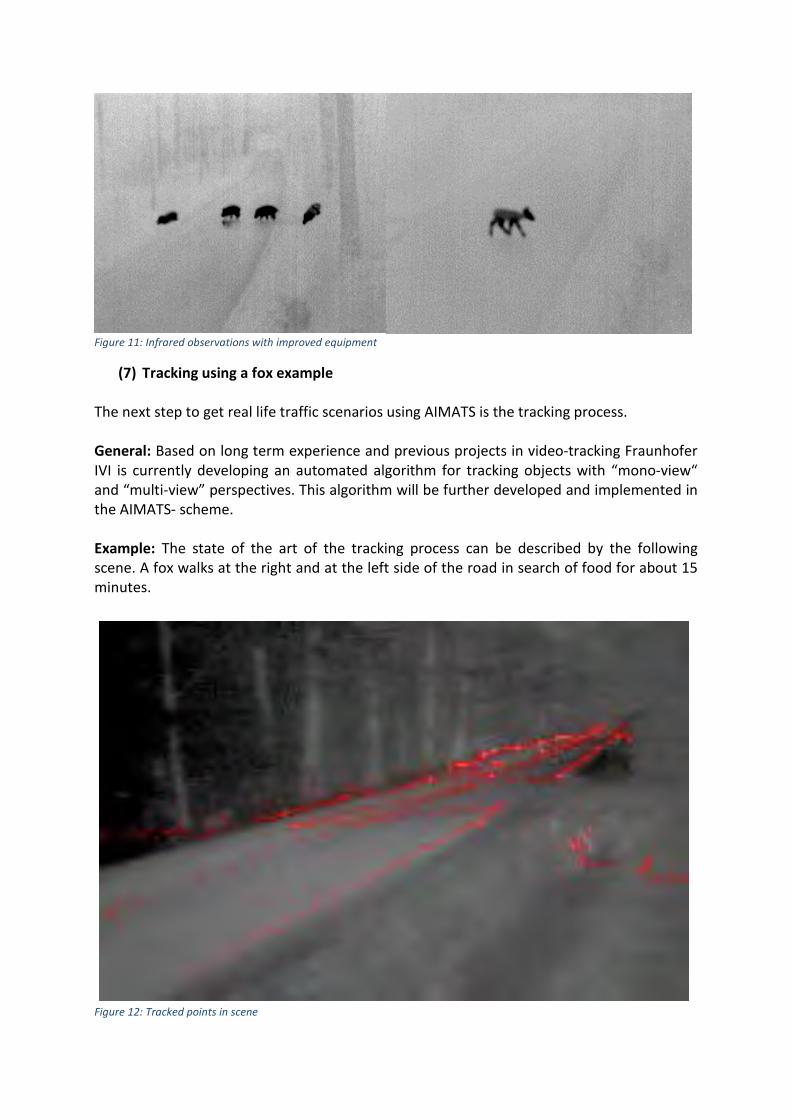
Figure 11: Infrared observations with improved equipment
(7) Tracking using a fox example The next step to get real life traffic scenarios using AIMATS is the tracking process. General: Based on long term experience and previous projects in video-tracking Fraunhofer IVI is currently developing an automated algorithm for tracking objects with “mono-view“ and “multi-view” perspectives. This algorithm will be further developed and implemented in the AIMATS- scheme. Example: The state of the art of the tracking process can be described by the following scene. A fox walks at the right and at the left side of the road in search of food for about 15 minutes.
Figure 12: Tracked points in scene
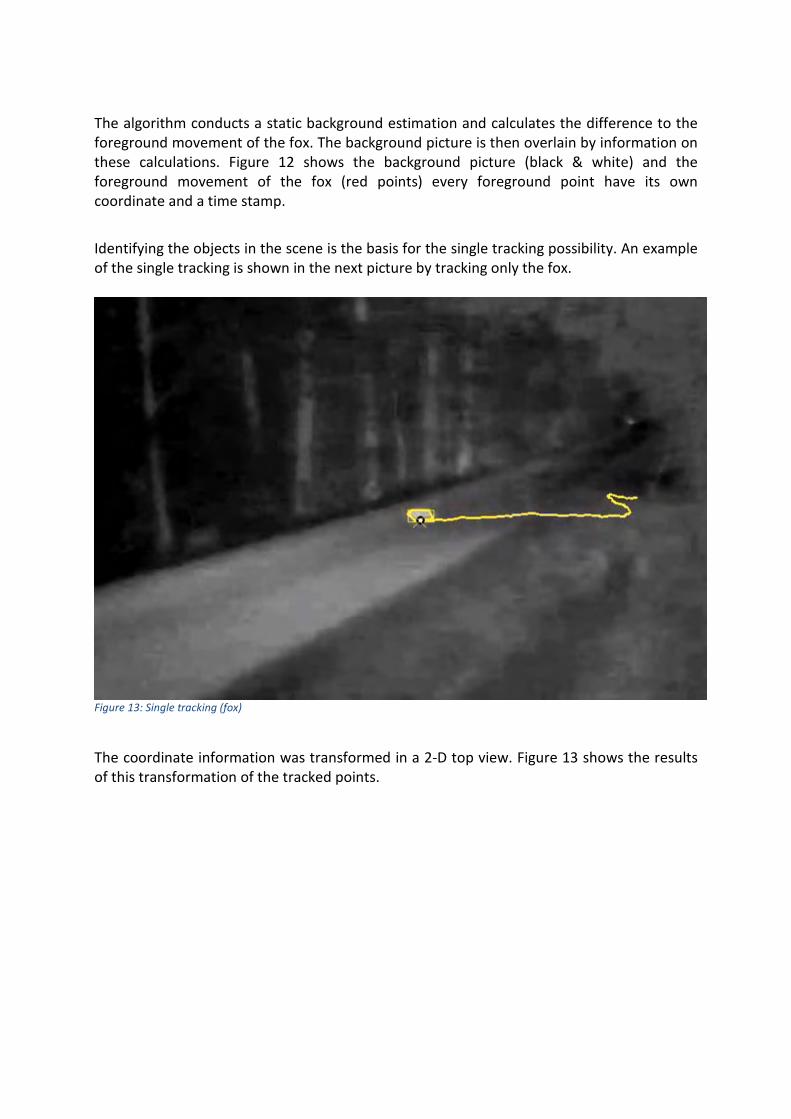
The algorithm conducts a static background estimation and calculates the difference to the foreground movement of the fox. The background picture is then overlain by information on these calculations. Figure 12 shows the background picture (black & white) and the foreground movement of the fox (red points) every foreground point have its own coordinate and a time stamp.
Identifying the objects in the scene is the basis for the single tracking possibility. An example of the single tracking is shown in the next picture by tracking only the fox.
Figure 13: Single tracking (fox)
The coordinate information was transformed in a 2-D top view. Figure 13 shows the results of this transformation of the tracked points.
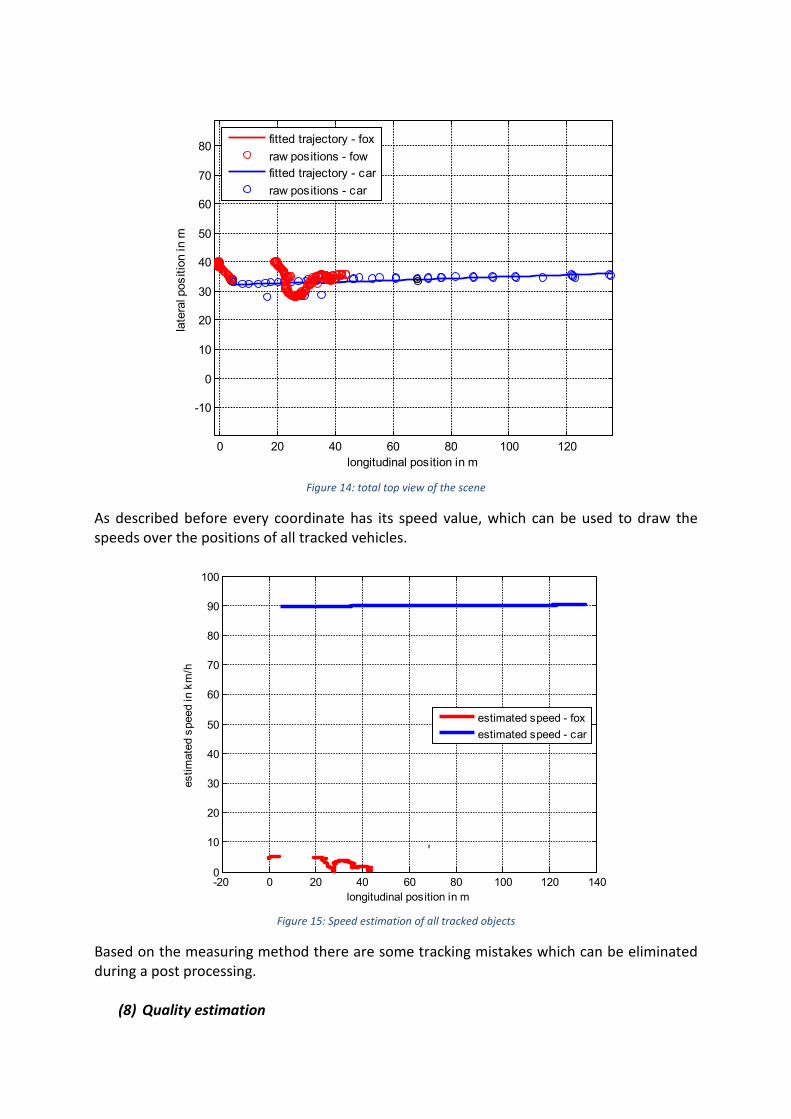
Figure 14: total top view of the scene
As described before every coordinate has its speed value, which can be used to draw the speeds over the positions of all tracked vehicles.
Figure 15: Speed estimation of all tracked objects
Based on the measuring method there are some tracking mistakes which can be eliminated during a post processing.
(8) Quality estimation
0 20 40 60 80 100 120
-10
0
10
20
30
40
50
60
70
80
longitudinal position in m
late
ral p
ositi
on in
m
fitted trajectory - foxraw positions - fowfitted trajectory - carraw positions - car
-20 0 20 40 60 80 100 120 1400
10
20
30
40
50
60
70
80
90
100
longitudinal position in m
estim
ated
spe
ed in
km
/h
estimated speed - foxestimated speed - car
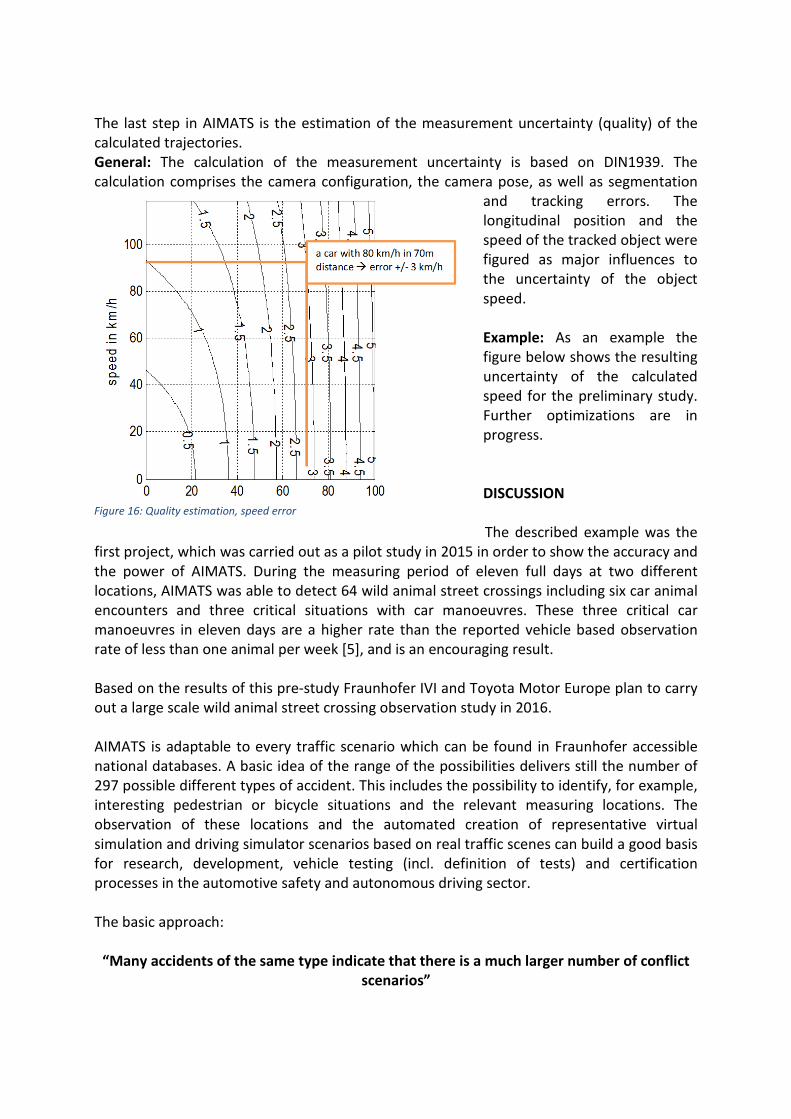
Figure 16: Quality estimation, speed error
The last step in AIMATS is the estimation of the measurement uncertainty (quality) of the calculated trajectories. General: The calculation of the measurement uncertainty is based on DIN1939. The calculation comprises the camera configuration, the camera pose, as well as segmentation
and tracking errors. The longitudinal position and the speed of the tracked object were figured as major influences to the uncertainty of the object speed. Example: As an example the figure below shows the resulting uncertainty of the calculated speed for the preliminary study. Further optimizations are in progress. DISCUSSION The described example was the
first project, which was carried out as a pilot study in 2015 in order to show the accuracy and the power of AIMATS. During the measuring period of eleven full days at two different locations, AIMATS was able to detect 64 wild animal street crossings including six car animal encounters and three critical situations with car manoeuvres. These three critical car manoeuvres in eleven days are a higher rate than the reported vehicle based observation rate of less than one animal per week [5], and is an encouraging result. Based on the results of this pre-study Fraunhofer IVI and Toyota Motor Europe plan to carry out a large scale wild animal street crossing observation study in 2016. AIMATS is adaptable to every traffic scenario which can be found in Fraunhofer accessible national databases. A basic idea of the range of the possibilities delivers still the number of 297 possible different types of accident. This includes the possibility to identify, for example, interesting pedestrian or bicycle situations and the relevant measuring locations. The observation of these locations and the automated creation of representative virtual simulation and driving simulator scenarios based on real traffic scenes can build a good basis for research, development, vehicle testing (incl. definition of tests) and certification processes in the automotive safety and autonomous driving sector. The basic approach:
“Many accidents of the same type indicate that there is a much larger number of conflict scenarios”

is valid for every traffic situation and leads to very representative locations (POI) for recording real traffic scenarios of interest. Due to the mobile and independent usage possibilities of the Fraunhofer hardware AIMATS can be placed at every POI, if the framework conditions (e.g. get the recording license of the owner of the forest) are clarified.

REFERENCES [1] Dingus, T. A., Klauer, S.G., Neale, V. L., Petersen, A., Lee, S. E., Sudweeks, J., Perez, M. A., Hankey, J., Ramsey, D., Gupta, S., Bucher, C., Doerzaph, Z. R., and Jermeland, J. (2006). The 100-car naturalistic driving study, Phase II – results of the 100-car field experiment (Contract No. DTNH22-00-C-07007). Washington, DC: National Highway Traffic Safety Administration [2] http://www.shrp2nds.us/ [3] http://www.udrive.eu/ [4] Alden, A.S., Mayer, B., McGoven, P., Sherony, R., Takahashi, H. (2016). Animal-Vehicle Encounter Naturalistic Driving Data Collection and Photogrammetric Analysis. Presented at SAE World Congress, April 12-14, 2016. [5] http://www.tft.lth.se/en/research/video-analysis/ [6] Ardö, H. MULTI-TARGET TRACKING USING ON-LINE VITERBI OPTIMISATION AND STOCHASTIC MODELLING. Dissertation Lund University 2009. Available at: http://www.maths.lth.se/matematiklth/personal/ardo/thesis/ [7] Varhélyi, A. Driver's speed behaviour at a zebra crossing: a case study. Accident Analysis and Prevention Volume 30, Issue 6, November 1998, Pages 731–743 [8] http://www.dlr.de/ts/desktopdefault.aspx/tabid-6422/#gallery/25304 [9] J. Ortlepp, P. Butterwege. Unfalltypenkatalog (Leitfaden zur Bestimmung des Unfalltypes). Gesamtverband der Deutschen Versicherungswirtschaft e.V., Unfallforschung der Versicherer: Erstauflage 03/1998, Neuauflage 01/2016.
Developing the European Road Safety Decision Support System
Pete Thomas**, Ashleigh Filtness**, George Yannis*, Eleonora Papadimitriou*, Athanasios Theofilatos*, Heike Martensen***, Kevin Diapendaele***
*National Technical University of Athens, Department of Transportation Planning and Engineering, Iroon Polytechneiou 9,
GR-15773, Athens, Greece **Loughborough University, Transport Safety Research Centre, Loughborough Design School, Ashby Road, Loughborough,
LE11 3TU, UK ***Belgian Institute for Road Safety, Behaviour and Policy Department, 1405 Haachtsesteenweg, B-1130 Brussels, Belgium
Abstract The Decision Support System (DSS) is one of the key objectives of the European co-funded research project SafetyCube in order to better support evidence-based policy making. Results will be assembled in the form of a DSS that will present for each suggested road safety measure: details of risk factor tackled, measure, best estimate of casualty reduction effectiveness, cost-benefit evaluation and analytic background. The development of the DSS presents a great potential to further support decision making at local, regional, national and international level, aiming to fill in the current gap of comparable measures effectiveness evaluation. In order to provide policy-makers and industry with comprehensive and well-structured information about measures, it is essential that a systems approach is used to ensure the links between risk factors and all relevant safety measures are made fully visible. The DSS is intended to become a major source of information for industry, policy-makers and the wider road safety community. Keywords: road safety, decision support system, road safety measures INTRODUCTION Although there has been a substantial progress in improving road safety and reducing traffic fatalities, in 2012 the EU Member States with the highest accident rate by population had a rate nearly four times that of the best performing countries. For that reason a number of countries have adopted a coherent approach to road safety management that follows the Safe System Approach [1]. Road safety policy-making is considered within the remit of governments and local/regional authorities. Nevertheless, all stakeholders who have an impact on road risks, including individual citizens, also have a responsibility to contribute to their reduction. The group of relevant stakeholders therefore includes not only publicly elected bodies but industry groups as well which involve insurance organizations, police, public health organizations, vehicle manufacturers, highway authorities and so on. However, there are several gaps in the evidence base which constitute major challenges needing to be addressed. There is poor availability regarding the information relating to the causes of crashes and the estimation of the associated risks. There is also a lack of a clear and consolidated set of measure evaluations relevant to European road safety. Moreover, a priority setting for road safety measures within a systems approach cannot be fully supported due to lack of information. Lastly, there is an increased need for further detailed safety data analysis in support of road safety “hot topics”, including new technologies and other measures that have not yet been properly evaluated. The main objective of SafetyCube project (“Safety Causation, Benefits and Efficiency - www.safetycube-project.eu) is to address these gaps in the evidence base. More specifically, it is aimed to develop an innovative road safety Decision Support System (DSS) that will enable policy-makers and stakeholders to select and
implement the most appropriate strategies, measures and cost-effective approaches to reduce casualties and crash severity for all road users. The core of the project includes a novel and comprehensive analysis of accident causation factors combined with newly estimated data on the effectiveness and cost-effectiveness of safety measures, not just in relation to reduction of fatalities but also the number of injured. An operational framework will be established to provide future access to the DSS once the project is completed. The project outputs will be framed according to the specific policy and stakeholder areas – infrastructures, vehicles and road users – so that the measures developed in the project can be most readily applied. A systems approach will ensure effective coordination between these areas. The close involvement of road safety stakeholders of all types at national and EU levels, and wider will enable the DSS to be focused on the most appropriate policy-making procedures and ensure the project outputs have global reach. This paper describes the background, methodology and design principles of the European DSS within the SafetyCube project. For the development of the European DSS a comprehensive common methodology is designed and applied in existing and new studies of road safety measures effectiveness evaluation. Moreover, extensive consultation of road safety stakeholders is carried out, by means of several workshops, in order to define the user needs for the DSS. The structure and the functioning of the DSS will be also presented, both in terms of back-end database and front-end user interface, together with the first results of the application of the common methodology for the evaluation of road safety measures effectiveness. SAFETYCUBE METHODOLOGY The SafetyCube methodology is illustrated in this section and is based on two pillars; analysis of study designs and coding of the studies, in order to be used as input to the back-end database of the Decision Support System (DSS). Taxonomy of risks, measures and related analysis methods In order to carry out an analysis of the study designs, a complete taxonomy has to be built first for each of the following 3 categories: behaviour, infrastructure and vehicle. General categories of the three main areas were firstly considered and then the specific risk factors and measures were assigned to the respective category. More than 90 risk factors and 95 measures in infrastructure areas, more than 115 risk factors and 250 measures for behaviour, more than 60 risk factors and 60 measures for the vehicle area have been identified by means of a thorough review of existing safety areas and taxonomies. The main elements included in the SafetyCube taxonomy are presented in Table 1. In each element, several specific risk factors and measures are considered.
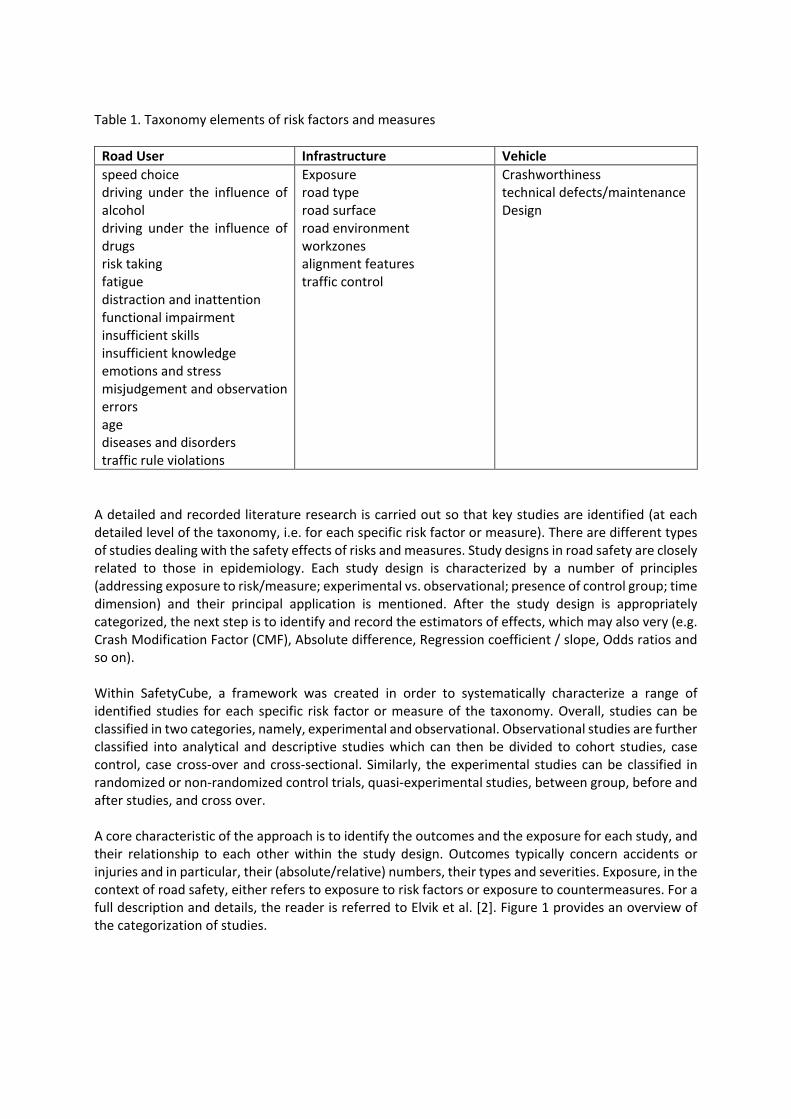
Table 1. Taxonomy elements of risk factors and measures
Road User Infrastructure Vehicle speed choice driving under the influence of alcohol driving under the influence of drugs risk taking fatigue distraction and inattention functional impairment insufficient skills insufficient knowledge emotions and stress misjudgement and observation errors age diseases and disorders traffic rule violations
Exposure road type road surface road environment workzones alignment features traffic control
Crashworthiness technical defects/maintenance Design
A detailed and recorded literature research is carried out so that key studies are identified (at each detailed level of the taxonomy, i.e. for each specific risk factor or measure). There are different types of studies dealing with the safety effects of risks and measures. Study designs in road safety are closely related to those in epidemiology. Each study design is characterized by a number of principles (addressing exposure to risk/measure; experimental vs. observational; presence of control group; time dimension) and their principal application is mentioned. After the study design is appropriately categorized, the next step is to identify and record the estimators of effects, which may also very (e.g. Crash Modification Factor (CMF), Absolute difference, Regression coefficient / slope, Odds ratios and so on). Within SafetyCube, a framework was created in order to systematically characterize a range of identified studies for each specific risk factor or measure of the taxonomy. Overall, studies can be classified in two categories, namely, experimental and observational. Observational studies are further classified into analytical and descriptive studies which can then be divided to cohort studies, case control, case cross-over and cross-sectional. Similarly, the experimental studies can be classified in randomized or non-randomized control trials, quasi-experimental studies, between group, before and after studies, and cross over. A core characteristic of the approach is to identify the outcomes and the exposure for each study, and their relationship to each other within the study design. Outcomes typically concern accidents or injuries and in particular, their (absolute/relative) numbers, their types and severities. Exposure, in the context of road safety, either refers to exposure to risk factors or exposure to countermeasures. For a full description and details, the reader is referred to Elvik et al. [2]. Figure 1 provides an overview of the categorization of studies.
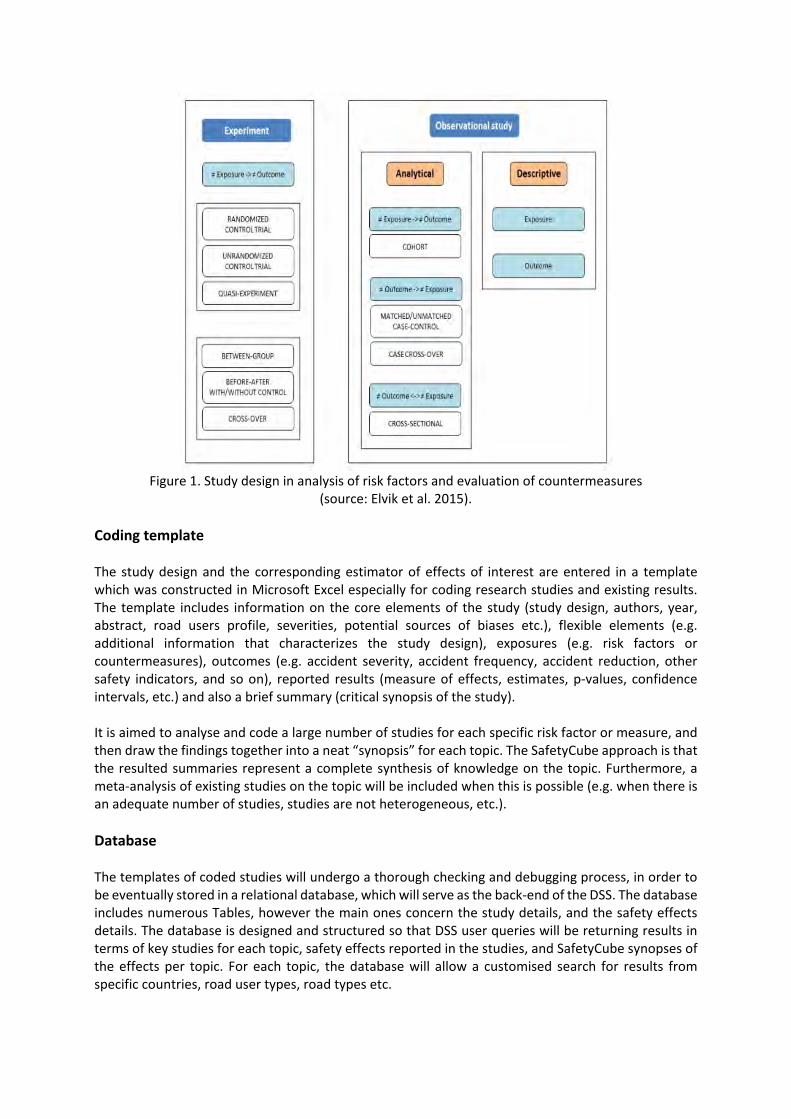
Figure 1. Study design in analysis of risk factors and evaluation of countermeasures
(source: Elvik et al. 2015). Coding template The study design and the corresponding estimator of effects of interest are entered in a template which was constructed in Microsoft Excel especially for coding research studies and existing results. The template includes information on the core elements of the study (study design, authors, year, abstract, road users profile, severities, potential sources of biases etc.), flexible elements (e.g. additional information that characterizes the study design), exposures (e.g. risk factors or countermeasures), outcomes (e.g. accident severity, accident frequency, accident reduction, other safety indicators, and so on), reported results (measure of effects, estimates, p-values, confidence intervals, etc.) and also a brief summary (critical synopsis of the study). It is aimed to analyse and code a large number of studies for each specific risk factor or measure, and then draw the findings together into a neat “synopsis” for each topic. The SafetyCube approach is that the resulted summaries represent a complete synthesis of knowledge on the topic. Furthermore, a meta-analysis of existing studies on the topic will be included when this is possible (e.g. when there is an adequate number of studies, studies are not heterogeneous, etc.). Database The templates of coded studies will undergo a thorough checking and debugging process, in order to be eventually stored in a relational database, which will serve as the back-end of the DSS. The database includes numerous Tables, however the main ones concern the study details, and the safety effects details. The database is designed and structured so that DSS user queries will be returning results in terms of key studies for each topic, safety effects reported in the studies, and SafetyCube synopses of the effects per topic. For each topic, the database will allow a customised search for results from specific countries, road user types, road types etc.
DSS DEVELOPMENT Analysis of user needs Stakeholders play a crucial role in developing the DSS and in achieving excellence. The SafetyCube project had already identified a core group of stakeholders from government, industry, research, and consumer organizations covering the three road safety pillars: vehicle, infrastructure, road user. The future users of the DSS include Public Authorities (local, regional, national, European and international level), Industry (Infrastructure, Vehicle, Insurance, Technology), Research Institutes, Non-Governmental Organisations, and Mass media. In order to identify user needs 3 workshops were carried out. The first workshop on June 2015 was carried out in Brussels in order to start a dialogue between the project participants and a number of key stakeholders for road safety in Europe. The workshop both introduced the audience to the SafetyCube project and also solicited input from the stakeholders that will form the structure and priorities of a DSS. An extensive list of “hot topics” was also created on the basis of feedback from stakeholders, allowing to enhance the SafetyCube initial lists. A total of 30 delegates attended the event [3]. A second workshop was organized on October 2015 in Ljubljana, Slovenia. The first part of the workshop was a plenary session with about 150 participants from the Slovenian Road Safety Councils and IRTAD meeting. The SafetyCube project was presented as well as the plans for the Road Safety Decision Support System (DSS) and the “hot topics” from previous workshop. All participants were asked to give their feedback to the DSS and “hot topics”. Feedback was collected both in spoken and written form. The second part of the workshop was a breakout session continuing with participants from the IRTAD group. The breakout session started with a discussion where the 23 participants were giving more detailed feedback on their wishes and questions on the DSS. Thereafter the participants were asked to add, comment and prioritize the “hot topics”. This was done on six posters showing the “hot topics” from previous stakeholder consultation. A more dedicated workshop was carried out on February 2016, in Brussels [4], where 12 road infrastructure stakeholders participated. The participants represented key road infrastructure stakeholders, including EC-INEA, EC-DG-MOVE, EURORAP, ASECAP, ETSC, POLIS network, FIA, BRRC and Belgian regional authorities. The objectives of the workshop were the analysis of infrastructure stakeholders’ needs for the DSS, as well as ranking of infrastructure related “hot topics”. On the basis of the workshops results, it was indicated that the Decision Support System (DSS) should be suitable for use by a wide range of end users. It should not be limited to EU policy makers, but also be applicable for local authorities. It is intended that the system will help policy makers make an “informed decision”. In addition, it has to be an impartial system, which will not advocate for specific measures – the intention is “to guide, rather than to dictate”. Using this structured approach to policy making should eventually enhance public acceptance of measures by providing a solid evidence base for decisions. Moreover, it was proposed that the DSS should have the following characteristics: include robust data which allow for critical analysis and transparency, access to the studies used and to all results as well, information of the best quality studies and recommendations. A platform built in the project should be operational after the project.
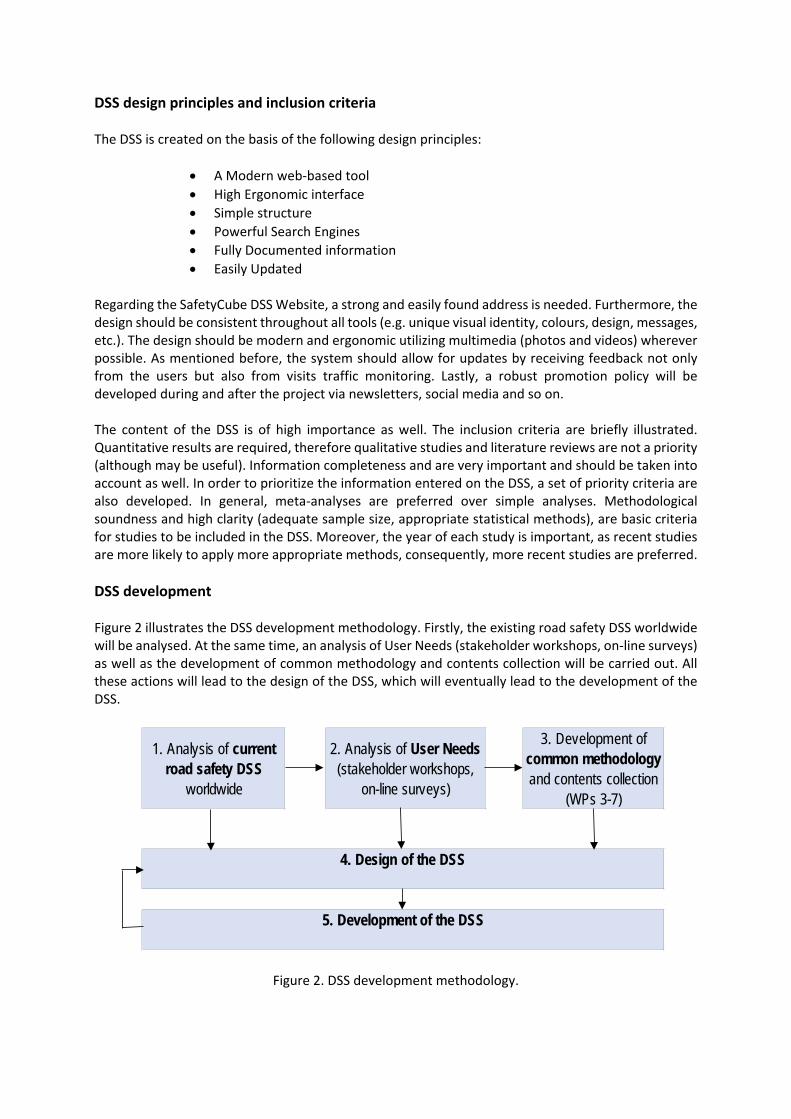
DSS design principles and inclusion criteria The DSS is created on the basis of the following design principles:
• A Modern web-based tool • High Ergonomic interface • Simple structure • Powerful Search Engines • Fully Documented information • Easily Updated
Regarding the SafetyCube DSS Website, a strong and easily found address is needed. Furthermore, the design should be consistent throughout all tools (e.g. unique visual identity, colours, design, messages, etc.). The design should be modern and ergonomic utilizing multimedia (photos and videos) wherever possible. As mentioned before, the system should allow for updates by receiving feedback not only from the users but also from visits traffic monitoring. Lastly, a robust promotion policy will be developed during and after the project via newsletters, social media and so on. The content of the DSS is of high importance as well. The inclusion criteria are briefly illustrated. Quantitative results are required, therefore qualitative studies and literature reviews are not a priority (although may be useful). Information completeness and are very important and should be taken into account as well. In order to prioritize the information entered on the DSS, a set of priority criteria are also developed. In general, meta-analyses are preferred over simple analyses. Methodological soundness and high clarity (adequate sample size, appropriate statistical methods), are basic criteria for studies to be included in the DSS. Moreover, the year of each study is important, as recent studies are more likely to apply more appropriate methods, consequently, more recent studies are preferred. DSS development Figure 2 illustrates the DSS development methodology. Firstly, the existing road safety DSS worldwide will be analysed. At the same time, an analysis of User Needs (stakeholder workshops, on-line surveys) as well as the development of common methodology and contents collection will be carried out. All these actions will lead to the design of the DSS, which will eventually lead to the development of the DSS.
Figure 2. DSS development methodology.
1. Analysis of current road safety DSS
worldwide
2. Analysis of User Needs (stakeholder workshops,
on-line surveys)
3. Development of common methodology and contents collection
(WPs 3-7)
4. Design of the DSS
5. Development of the DSS
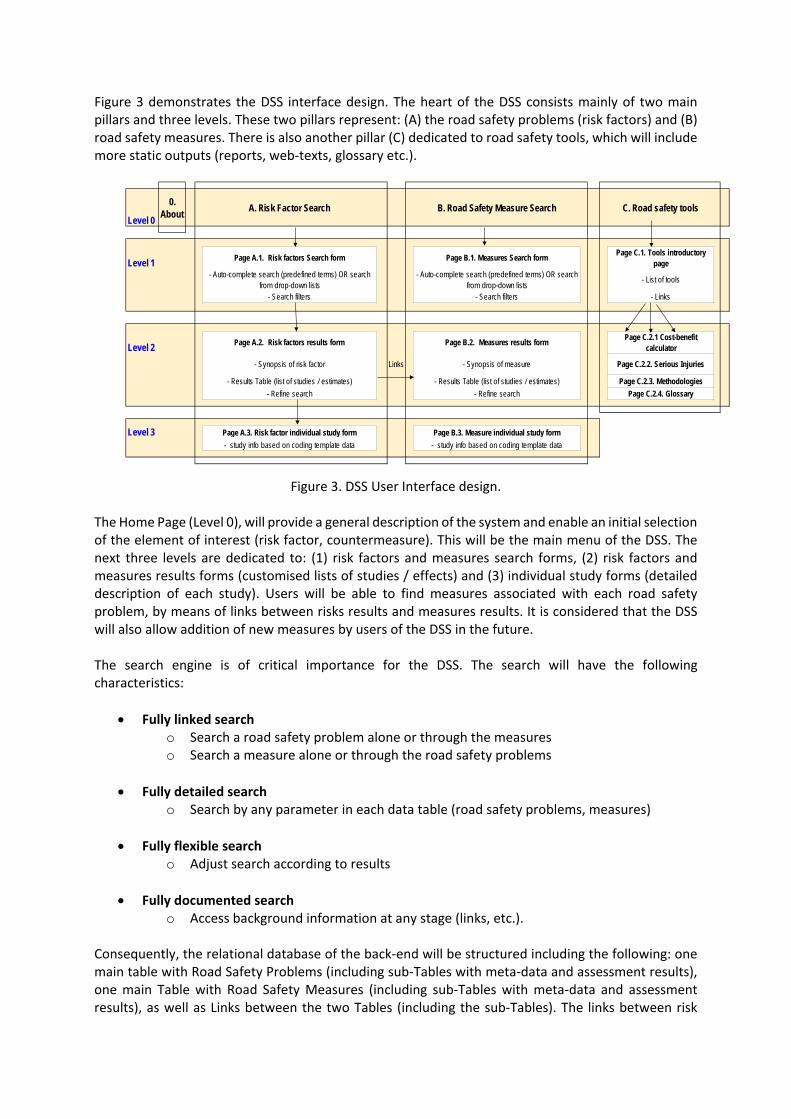
Figure 3 demonstrates the DSS interface design. The heart of the DSS consists mainly of two main pillars and three levels. These two pillars represent: (A) the road safety problems (risk factors) and (B) road safety measures. There is also another pillar (C) dedicated to road safety tools, which will include more static outputs (reports, web-texts, glossary etc.).
Figure 3. DSS User Interface design.
The Home Page (Level 0), will provide a general description of the system and enable an initial selection of the element of interest (risk factor, countermeasure). This will be the main menu of the DSS. The next three levels are dedicated to: (1) risk factors and measures search forms, (2) risk factors and measures results forms (customised lists of studies / effects) and (3) individual study forms (detailed description of each study). Users will be able to find measures associated with each road safety problem, by means of links between risks results and measures results. It is considered that the DSS will also allow addition of new measures by users of the DSS in the future. The search engine is of critical importance for the DSS. The search will have the following characteristics:
• Fully linked search o Search a road safety problem alone or through the measures o Search a measure alone or through the road safety problems
• Fully detailed search
o Search by any parameter in each data table (road safety problems, measures)
• Fully flexible search o Adjust search according to results
• Fully documented search
o Access background information at any stage (links, etc.). Consequently, the relational database of the back-end will be structured including the following: one main table with Road Safety Problems (including sub-Tables with meta-data and assessment results), one main Table with Road Safety Measures (including sub-Tables with meta-data and assessment results), as well as Links between the two Tables (including the sub-Tables). The links between risk
Level 0
0. About A. Risk Factor Search B. Road Safety Measure Search C. Road safety tools
Level 1 Page A.1. Risk factors Search form Page B.1. Measures Search form Page C.1. Tools introductory page
- Auto-complete search (predefined terms) OR search from drop-down lists
- Auto-complete search (predefined terms) OR search from drop-down lists - List of tools
- Search filters - Search filters - Links
Level 2 Page A.2. Risk factors results form Page B.2. Measures results form Page C.2.1 Cost-benefit calculator
- Synopsis of risk factor Links - Synopsis of measure Page C.2.2. Serious Injuries
- Results Table (list of studies / estimates) - Results Table (list of studies / estimates) Page C.2.3. Methodologies- Refine search - Refine search Page C.2.4. Glossary
Level 3 Page A.3. Risk factor individual study form Page B.3. Measure individual study form- study info based on coding template data - study info based on coding template data
factors and measures is of high importance as well. The DSS will be a fully hierarchical and interactive system full of tags and links:
• For each road safety problem (risk factor) o list of relevant measures o list of other relevant road safety problems
• For each measure
o list of road safety problems addressed o list of similar measures
PROGRESS AND NEXT STEPS A high number of risks, measures and studies have been identified and coded according to the selection criteria mentioned earlier in the paper (meta-analyses, but also recent studies and high quality studies - prestigious journals preferred). So far, more than 500 studies have been analysed in the area of road risks and measures, and many more are in progress. In addition, more than 20 existing meta-analyses are updated and about 65 more are in progress. Summary reports (synopses) which will provide a critical synthesis of each risk factor and measure are under development. The design of the DSS is finalised and the first static prototype of the DSS will be available by the end of June 2016. The DSS testing phase (with test tables) will be ready in August 2016, while the DSS Pilot Operation will start on September 2016. The final opening of the DSS will start on September 2017 and will be constantly updating from April 2018 and onwards. The DSS is intended to become a major source of information for industry, policy-makers and the wider road safety community; it will incorporate the knowledge base of accident causation, risks and measures that will be developed in the project and the underlying methodological systems. It will be developed in a form that can readily be incorporated within the existing European Road Safety Observatory of the European Commission DG-MOVE. The development of the DSS presents a great potential to further support decision making at local, regional, national and international level, aiming to fill in the current gap of comparable measures effectiveness evaluation across Europe and worldwide. ACKNOWLEDGEMENTS This paper is based on work carried out within the SafetyCube project of the H2020 programme of the European Commission (Grant number 633485). The information and views set out in this paper are those of the authors and may not reflect the official opinion of the European Commission. The authors would like to thank all the partners involved in the “road user”, “infrastructure” and “vehicle” work packages of SafetyCube for their valuable contribution. Special thanks are addressed to the road safety stakeholders for their valuable feedback and suggestions during the SafetyCube workshops. REFERENCES 1 Bliss, T, Breen, J, Country Guidelines for the Conduct of Road Safety Management Capacity Reviews and the Specification of Lead Agency Reforms, Investment Strategies and Safe System Projects. The World Bank Global Road Safety Facility, 2009.

2 Elvik, R. , Hesjevoll, I. S., Papadimitriou, E., Yannis, G., Perez, C., Olabarria, M., Hermitte, T., Talbot, R., Lassarre, S., Diependaele, K., Martensen, H., Preliminary guidelines for identification of risk factors and evaluation of road safety measures, Milestone 3.1 of the H2020 project SafetyCube, 2015. 3 Hagström, L., Thomson, R., Skogsmo, I., Houtenbos, M., Durso, C., Thomas, P., Elvik, R., Wismans, J., Definition of user needs, Deliverable 2.1 of the H2020 project SafetyCube, 2015. 4 SafetyCube, SafetyCube Stakeholder Workshop, Brussels, 22nd February 2016, http://www.safetycube-project.eu/safetycube-stakeholder-workshop-brussels-february-2016, 2016

Driver less cars – the view of the consumer?
N J Greig
Director of Policy and Research IAM RoadSmart, 510 Chiswick High Road, London, W4 5RG
Abstract
At IAM RoadSmart we share the excitement about autonomous cars – who wouldn’t! However over half of the drivers we polled supported concentrating on making drivers safer – among IAM RoadSmart members it was 70%. Driverless cars are still years away but delivering safer drivers can help reduce death and injury from tomorrow. Governments, academics and car makers need to work hard to convince sceptical British and American drivers that autonomous cars can deliver the benefits promised such as a 90% plus reduction in road deaths.
DRIVERLESS CARS – UK POLICY BACKGROUND
We know driverless cars are coming; • Pilot studies are in place in three English cities – IAM RoadSmart are on the advisory board in
Greenwich and are looking to get involved in Bristol and Coventry/Milton Keynes • Lorry Convoy trials are promised on English motorways from 2017 • As we speak Volvo are recruiting drivers for a major pilot study in Gothenburg and also in
London • In the UK the government plan legislation this summer “sweep away the regulatory barriers
to autonomous driving” • Google car has racked up over a million miles of testing in the US • Car makers and new technology firms are scrambling to form alliances • Volvo are launching trials in London and Gothenburg
The UK Government want Britain to lead the world in autonomous driving and so does IAM RoadSmart. We want to share our expertise to help translate driver’s needs for the car makers - so they minimise distraction and confusion and then benchmark their systems against the best human drivers. We want to help translate the technology for drivers as we make the potentially dangerous transition towards ever greater levels of autonomy.
THE SAFE SYSTEM Most of you will have heard about the Safe System – it’s delivering safer roads in countries such as Sweden and Holland and is now fully endorsed by the UK government and the United Nations. For ultimate safety you need - Five-star cars, on five-star roads, with five-star drivers. The five star cars are here, thank to millions of pounds of investment by car makers and they are getting safer all the time. The five star road is also attainable – last year Highways England made a step change promise to make most of their roads at least three star and they are investing £15 Billion in new roads by 2020. But, Five star drivers?? Training and coaching does not attract similar levels of investment in any country. At IAM RoadSmart we believe that better drivers will maximise the benefits of better roads

and cars. Without better drivers it is unlikely that the promised reductions in road deaths of over 90% from new technology can really be delivered We wanted to find out what the public think about driverless cars, driving, and their desire to continue to do so. We carried out two surveys – one an independent market research survey of 1,000 British motorists, as well as surveying 2,000 of our own members. A FIFTH OF DRIVERS THINK DRIVERLESS CARS ARE A GOOD IDEA
A fifth (20%) of motorists think that driverless cars are a good idea, with another fifth (22%) saying that they can see driverless cars becoming the norm on the UK’s roads.
However, a third (34%) think driverless cars are a bad idea, with under half (45%) being unsure. Half (52%) say that they cannot see driverless cars becoming the norm. Following this, a sixth (16%) of motorists think that driverless cars will be exciting and the norm within years.
When asked when motorists think driverless cars will become the norm, the median time is “more than a decade away” – of which under half (45%) said this.
Interestingly, when told the statement “the driverless car has completed almost a million miles without an accident. With 95% of crashes put down to ‘human error’ there is a strong argument that taking driver control out of the equation could benefit road safety positively”, a quarter (24%) said they agree, a sixth (15%) said that they don’t, and three fifths (60%) said that we’ll have to wait and see.
A third (32%) admit that they would actually consider using a driverless car – although nearly two fifths (38%) would not and three in ten (29%) are unsure.
THE GOVERNMENT AND DRIVERLESS CARS
A quarter of respondents (26%) think that – like electric cars – driverless cars should be subsidised by the government in the same way. However, there is a mixture of views, as two fifths (41%) disagree, and a third (33%) are unsure.
Of driverless cars, half (53%) think that we should be concentrating on making drivers safer – not just cars. A third (35%), on the other hand, think that driverless cars are a good initiative for the future, and a fifth (20%) think they will help assist everyone to travel and work, in such, helping our busy lifestyles. However, a tenth (12%) brand the idea as irresponsible.
ADVANCED CAR TECHNOLOGY – ASPECTS LIKED AND DISLIKED
The best liked aspects of driverless cars are the following:
• Drivers behind not able to drive too closely to you (90%) • You as a driver not being able to drive too close to the vehicle in front (82%) • Overtaking only allowed when it is safe (81%) • Parallel and reverse parking done automatically and accurately for you (81%).
When asked to talk about their opinion on driverless cars, a good proportion of the comments were based around the potential dangers of the idea and how alien it seems, for example:

“Why would anyone not want to be in control of their car?”
“Would be worried how the car would react in a non-programmed situation.”
THE FUTURE OF CARS
Once driverless cars become readily available, only a 6% of motorists think that driving a car (that isn’t driverless) should be banned by law. In line with this, two thirds (65%) think that human beings should always be in control of a vehicle, and were the ability of driving a car abolished, the key thing that motorists would miss is being in control.
These questions were prompted by a quote:
“Driving a vehicle is too dangerous for humans and will be outlawed when autonomous cars are proven to be safer” Elon Musk, billionaire founder of Tesla. (De Zeen magazine 24 March 2015)
Both IAM members and the wider British public don’t agree with Elon and neither does IAM RoadSmart. These results give us confidence that we should be talking to government and car makers about how to deliver autonomy on the driver’s terms. In addition to the safety concerns we are also concerned about who owns the data generated by new technology in cars and how safe are they from cyber attack. MY CAR - MY DATA
Vehicle manufacturers are developing car technologies to track and transmit a range of information.
They control this information flow and can direct maintenance and repairs to selected service providers. When you buy a car, it often includes a clause which approves the transfer of your data to the vehicle manufacturers’ proprietary network. As a result:
- You are not necessarily aware when data is transmitted by your car or how your data is used
- You may not be able to opt out when service policies are changed and if you reject the conditions offered you risk losing access to all services;
- You may be solicited for unwanted services;
- Your repair bills may be higher
Since only vehicle manufacturers have direct access to vehicle data, other service providers must either pay the vehicle manufacturer to access it or develop and market their own independent systems leading to higher development costs. Or they could be entirely excluded from the market

When it comes to vehicle data, IAM RoadSmart proposes 3 consumer principles to keep you in control.
1) As the owner of your car, legislation should ensure informed consent on access to your car’s data and that you retain ownership of the data it produces and control over how it is used for as long as you own the vehicle. And this should not impact the level of service you can expect to receive.
2) You should have the right to choose and change your service provider and match the right products and level of service to your needs.
3) You should have the right to choose among service providers competing in an open market place and to enable any service provider you choose to access your vehicle data and associated functionalities via an open, secure telematics platform.
The rush to access car data has already started. But it must ensure:
- that consumers understand what data is being shared and how it is used
- there is a choice of validated services from trusted service providers
- and there are open standardised and secure data platforms accessible to multiple service providers
Motorists have the right to fully benefit from their data to improve the driving experience. CYBER SECURITY We have already seen the first examples of hacking a car causing crashes or loss of control and this can only get worse. Today’s car has in excess of 16 know cyber weak spots through which control can be taken. Who would have thought a tyre pressure monitoring system might allow access to major control functions? New legislation is needed to ensure that the connected car is always connected to just the right people. This will not be easy and could be an expensive challenge for the motor industry. CONCLUSION With 60 years’ heritage, but very much at the forefront of driver and rider skill development and helping all sectors of society to enjoy their mobility, IAM RoadSmart is uniquely positioned to play a significant role in this fundamental shift as advanced driver assist systems become available to motorists. Our experience of real world driving behaviours and the importance of the human machine interaction will be invaluable to ensure motorists can fully embrace the benefits of the best our designers have to offer. It is vital the voice of the motorists and their desire to drive is heard by governments and vehicle manufacturers and driving experts should be closely involved in every country when fundamental decisions about the future of driving are considered. We want to work at the highest levels to ensure that the transition to driverless cars is safe, smooth and embraces the best that European drivers and European engineers have to offer. As you have heard from our research at IAM RoadSmart we have asked the views of all ages and sectors of society to understand their needs as drivers and riders. We believe it is our role to ensure we support their ambitions, address their concerns and stand up for the voice of the motorist.

REFERENCES
http://www.fiaregion1.com/en/fia_region_1/news/fia-my-car-my-data.htm
https://www.iamroadsmart.com/media-and-policy/newsroom/news-details/2016/04/28/motorists-want-the-right-to-drive
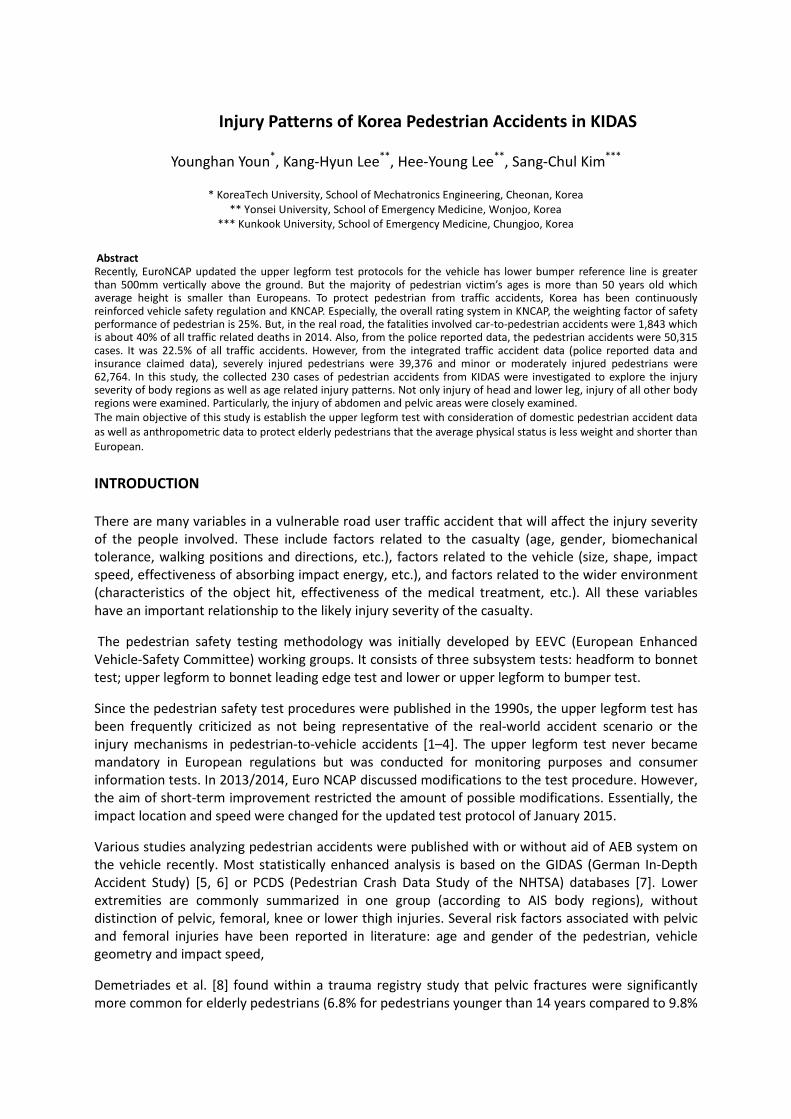
Injury Patterns of Korea Pedestrian Accidents in KIDAS
Younghan Youn*, Kang-Hyun Lee**, Hee-Young Lee**, Sang-Chul Kim***
* KoreaTech University, School of Mechatronics Engineering, Cheonan, Korea ** Yonsei University, School of Emergency Medicine, Wonjoo, Korea
*** Kunkook University, School of Emergency Medicine, Chungjoo, Korea Abstract Recently, EuroNCAP updated the upper legform test protocols for the vehicle has lower bumper reference line is greater than 500mm vertically above the ground. But the majority of pedestrian victim’s ages is more than 50 years old which average height is smaller than Europeans. To protect pedestrian from traffic accidents, Korea has been continuously reinforced vehicle safety regulation and KNCAP. Especially, the overall rating system in KNCAP, the weighting factor of safety performance of pedestrian is 25%. But, in the real road, the fatalities involved car-to-pedestrian accidents were 1,843 which is about 40% of all traffic related deaths in 2014. Also, from the police reported data, the pedestrian accidents were 50,315 cases. It was 22.5% of all traffic accidents. However, from the integrated traffic accident data (police reported data and insurance claimed data), severely injured pedestrians were 39,376 and minor or moderately injured pedestrians were 62,764. In this study, the collected 230 cases of pedestrian accidents from KIDAS were investigated to explore the injury severity of body regions as well as age related injury patterns. Not only injury of head and lower leg, injury of all other body regions were examined. Particularly, the injury of abdomen and pelvic areas were closely examined. The main objective of this study is establish the upper legform test with consideration of domestic pedestrian accident data as well as anthropometric data to protect elderly pedestrians that the average physical status is less weight and shorter than European. INTRODUCTION There are many variables in a vulnerable road user traffic accident that will affect the injury severity of the people involved. These include factors related to the casualty (age, gender, biomechanical tolerance, walking positions and directions, etc.), factors related to the vehicle (size, shape, impact speed, effectiveness of absorbing impact energy, etc.), and factors related to the wider environment (characteristics of the object hit, effectiveness of the medical treatment, etc.). All these variables have an important relationship to the likely injury severity of the casualty.
The pedestrian safety testing methodology was initially developed by EEVC (European Enhanced Vehicle-Safety Committee) working groups. It consists of three subsystem tests: headform to bonnet test; upper legform to bonnet leading edge test and lower or upper legform to bumper test.
Since the pedestrian safety test procedures were published in the 1990s, the upper legform test has been frequently criticized as not being representative of the real-world accident scenario or the injury mechanisms in pedestrian-to-vehicle accidents [1–4]. The upper legform test never became mandatory in European regulations but was conducted for monitoring purposes and consumer information tests. In 2013/2014, Euro NCAP discussed modifications to the test procedure. However, the aim of short-term improvement restricted the amount of possible modifications. Essentially, the impact location and speed were changed for the updated test protocol of January 2015.
Various studies analyzing pedestrian accidents were published with or without aid of AEB system on the vehicle recently. Most statistically enhanced analysis is based on the GIDAS (German In-Depth Accident Study) [5, 6] or PCDS (Pedestrian Crash Data Study of the NHTSA) databases [7]. Lower extremities are commonly summarized in one group (according to AIS body regions), without distinction of pelvic, femoral, knee or lower thigh injuries. Several risk factors associated with pelvic and femoral injuries have been reported in literature: age and gender of the pedestrian, vehicle geometry and impact speed,
Demetriades et al. [8] found within a trauma registry study that pelvic fractures were significantly more common for elderly pedestrians (6.8% for pedestrians younger than 14 years compared to 9.8%
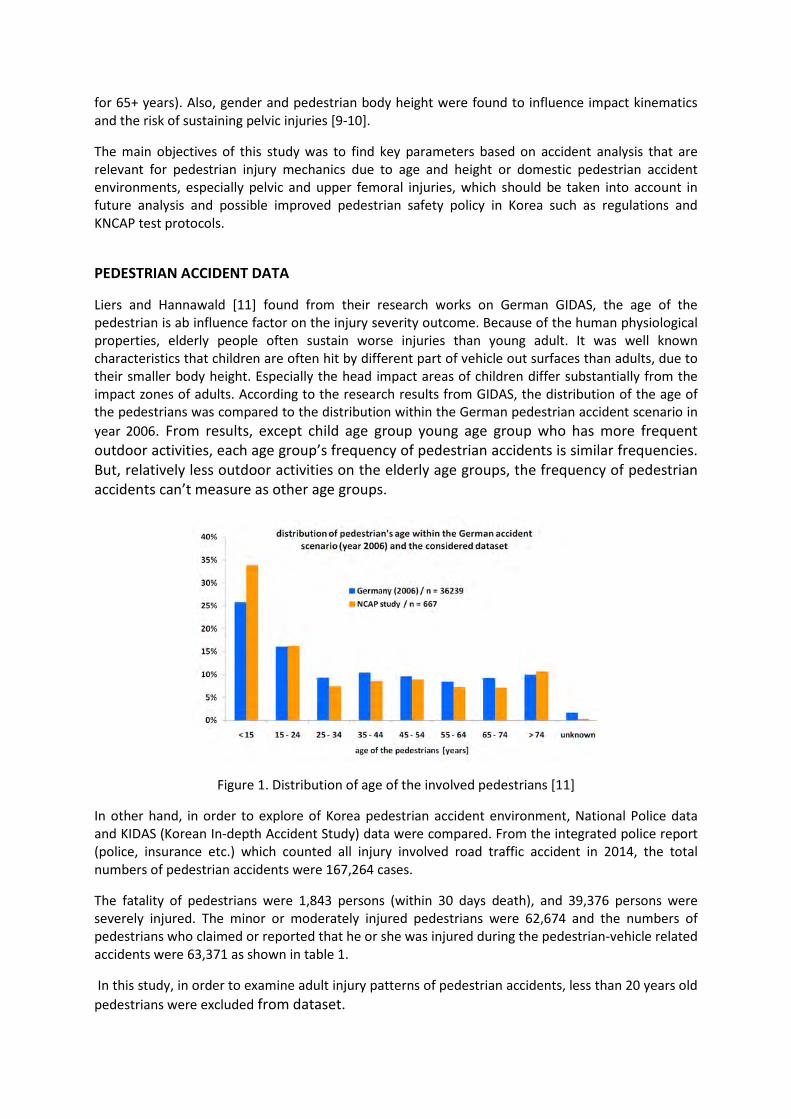
for 65+ years). Also, gender and pedestrian body height were found to influence impact kinematics and the risk of sustaining pelvic injuries [9-10].
The main objectives of this study was to find key parameters based on accident analysis that are relevant for pedestrian injury mechanics due to age and height or domestic pedestrian accident environments, especially pelvic and upper femoral injuries, which should be taken into account in future analysis and possible improved pedestrian safety policy in Korea such as regulations and KNCAP test protocols.
PEDESTRIAN ACCIDENT DATA
Liers and Hannawald [11] found from their research works on German GIDAS, the age of the pedestrian is ab influence factor on the injury severity outcome. Because of the human physiological properties, elderly people often sustain worse injuries than young adult. It was well known characteristics that children are often hit by different part of vehicle out surfaces than adults, due to their smaller body height. Especially the head impact areas of children differ substantially from the impact zones of adults. According to the research results from GIDAS, the distribution of the age of the pedestrians was compared to the distribution within the German pedestrian accident scenario in year 2006. From results, except child age group young age group who has more frequent outdoor activities, each age group’s frequency of pedestrian accidents is similar frequencies. But, relatively less outdoor activities on the elderly age groups, the frequency of pedestrian accidents can’t measure as other age groups.
Figure 1. Distribution of age of the involved pedestrians [11]
In other hand, in order to explore of Korea pedestrian accident environment, National Police data and KIDAS (Korean In-depth Accident Study) data were compared. From the integrated police report (police, insurance etc.) which counted all injury involved road traffic accident in 2014, the total numbers of pedestrian accidents were 167,264 cases.
The fatality of pedestrians were 1,843 persons (within 30 days death), and 39,376 persons were severely injured. The minor or moderately injured pedestrians were 62,674 and the numbers of pedestrians who claimed or reported that he or she was injured during the pedestrian-vehicle related accidents were 63,371 as shown in table 1.
In this study, in order to examine adult injury patterns of pedestrian accidents, less than 20 years old pedestrians were excluded from dataset.
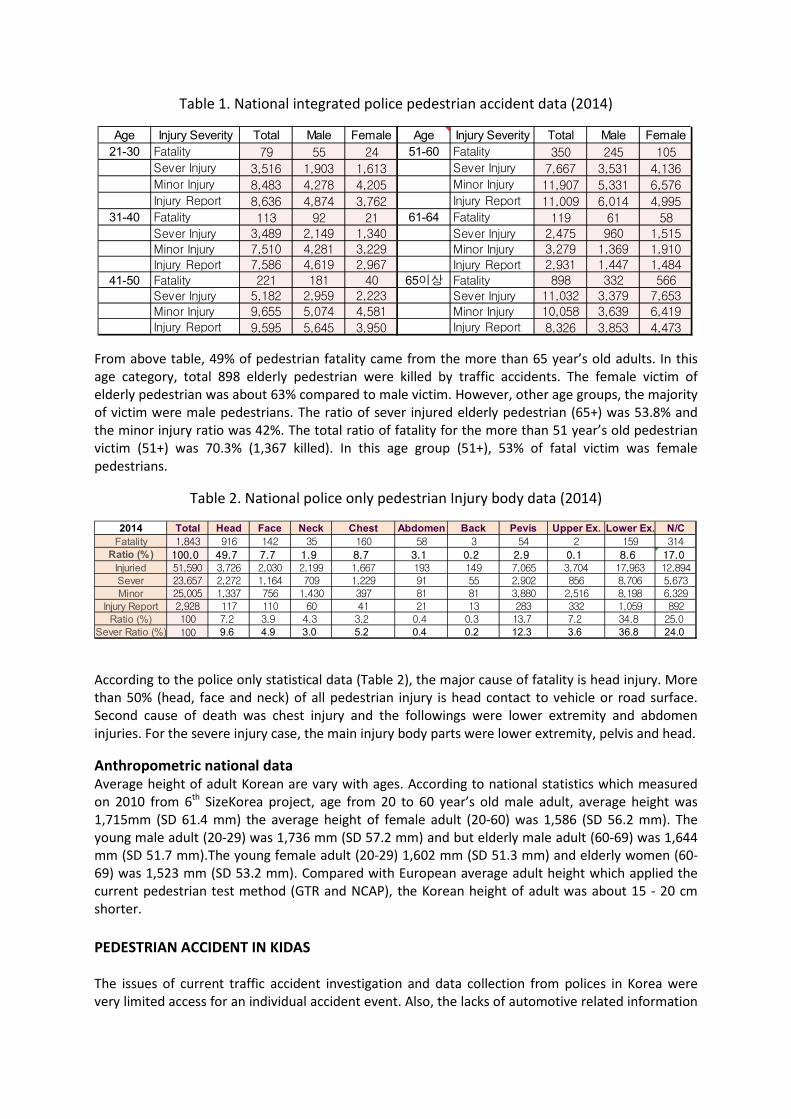
Table 1. National integrated police pedestrian accident data (2014)
From above table, 49% of pedestrian fatality came from the more than 65 year’s old adults. In this age category, total 898 elderly pedestrian were killed by traffic accidents. The female victim of elderly pedestrian was about 63% compared to male victim. However, other age groups, the majority of victim were male pedestrians. The ratio of sever injured elderly pedestrian (65+) was 53.8% and the minor injury ratio was 42%. The total ratio of fatality for the more than 51 year’s old pedestrian victim (51+) was 70.3% (1,367 killed). In this age group (51+), 53% of fatal victim was female pedestrians.
Table 2. National police only pedestrian Injury body data (2014)
According to the police only statistical data (Table 2), the major cause of fatality is head injury. More than 50% (head, face and neck) of all pedestrian injury is head contact to vehicle or road surface. Second cause of death was chest injury and the followings were lower extremity and abdomen injuries. For the severe injury case, the main injury body parts were lower extremity, pelvis and head.
Anthropometric national data Average height of adult Korean are vary with ages. According to national statistics which measured on 2010 from 6th SizeKorea project, age from 20 to 60 year’s old male adult, average height was 1,715mm (SD 61.4 mm) the average height of female adult (20-60) was 1,586 (SD 56.2 mm). The young male adult (20-29) was 1,736 mm (SD 57.2 mm) and but elderly male adult (60-69) was 1,644 mm (SD 51.7 mm).The young female adult (20-29) 1,602 mm (SD 51.3 mm) and elderly women (60-69) was 1,523 mm (SD 53.2 mm). Compared with European average adult height which applied the current pedestrian test method (GTR and NCAP), the Korean height of adult was about 15 - 20 cm shorter. PEDESTRIAN ACCIDENT IN KIDAS The issues of current traffic accident investigation and data collection from polices in Korea were very limited access for an individual accident event. Also, the lacks of automotive related information
Age Injury Severity Total Male Female Age Injury Severity Total Male Female21-30 Fatality 79 55 24 51-60 Fatality 350 245 105
Sever Injury 3,516 1,903 1,613 Sever Injury 7,667 3,531 4,136
Minor Injury 8,483 4,278 4,205 Minor Injury 11,907 5,331 6,576
Injury Report 8,636 4,874 3,762 Injury Report 11,009 6,014 4,995
31-40 Fatality 113 92 21 61-64 Fatality 119 61 58
Sever Injury 3,489 2,149 1,340 Sever Injury 2,475 960 1,515
Minor Injury 7,510 4,281 3,229 Minor Injury 3,279 1,369 1,910
Injury Report 7,586 4,619 2,967 Injury Report 2,931 1,447 1,484
41-50 Fatality 221 181 40 65이상 Fatality 898 332 566
Sever Injury 5,182 2,959 2,223 Sever Injury 11,032 3,379 7,653
Minor Injury 9,655 5,074 4,581 Minor Injury 10,058 3,639 6,419
Injury Report 9,595 5,645 3,950 Injury Report 8,326 3,853 4,473
2014 Total Head Face Neck Chest Abdomen Back Pevis Upper Ex. Lower Ex. N/CFatality 1,843 916 142 35 160 58 3 54 2 159 314
Ratio (%) 100.0 49.7 7.7 1.9 8.7 3.1 0.2 2.9 0.1 8.6 17.0Injuried 51,590 3,726 2,030 2,199 1,667 193 149 7,065 3,704 17,963 12,894Sever 23,657 2,272 1,164 709 1,229 91 55 2,902 856 8,706 5,673Minor 25,005 1,337 756 1,430 397 81 81 3,880 2,516 8,198 6,329
Injury Report 2,928 117 110 60 41 21 13 283 332 1,059 892Ratio (%) 100 7.2 3.9 4.3 3.2 0.4 0.3 13.7 7.2 34.8 25.0
Sever Ratio (%) 100 9.6 4.9 3.0 5.2 0.4 0.2 12.3 3.6 36.8 24.0
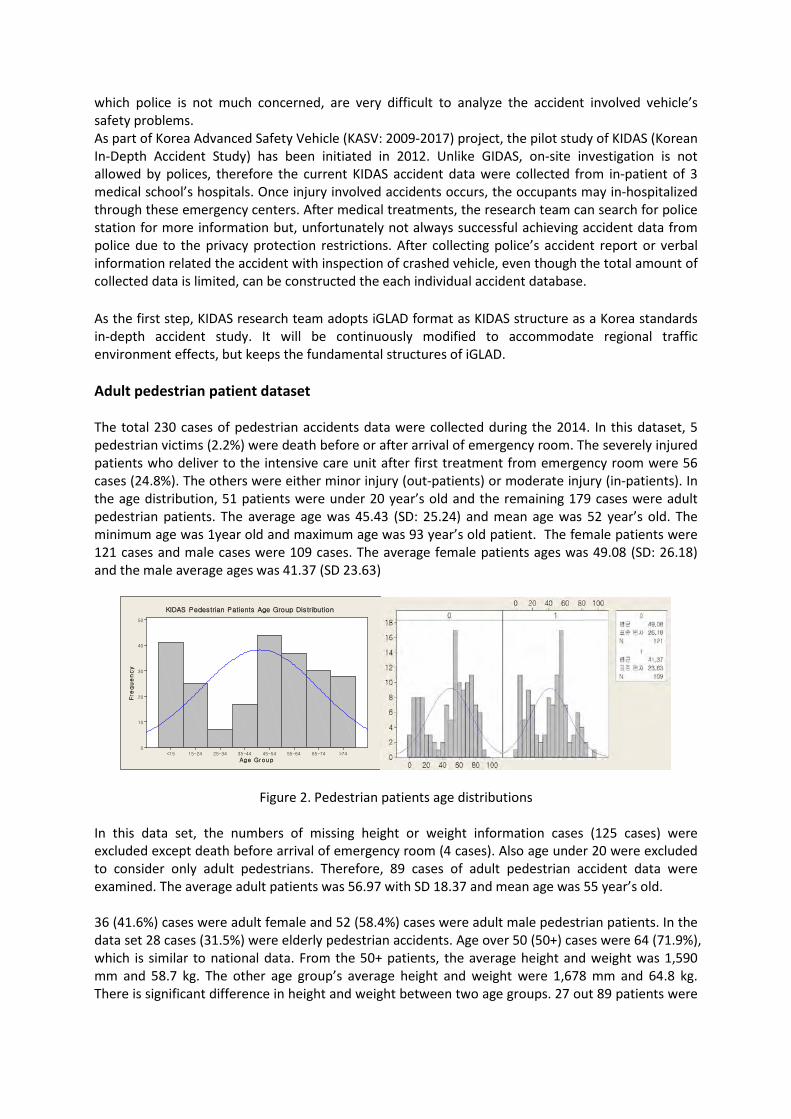
which police is not much concerned, are very difficult to analyze the accident involved vehicle’s safety problems. As part of Korea Advanced Safety Vehicle (KASV: 2009-2017) project, the pilot study of KIDAS (Korean In-Depth Accident Study) has been initiated in 2012. Unlike GIDAS, on-site investigation is not allowed by polices, therefore the current KIDAS accident data were collected from in-patient of 3 medical school’s hospitals. Once injury involved accidents occurs, the occupants may in-hospitalized through these emergency centers. After medical treatments, the research team can search for police station for more information but, unfortunately not always successful achieving accident data from police due to the privacy protection restrictions. After collecting police’s accident report or verbal information related the accident with inspection of crashed vehicle, even though the total amount of collected data is limited, can be constructed the each individual accident database. As the first step, KIDAS research team adopts iGLAD format as KIDAS structure as a Korea standards in-depth accident study. It will be continuously modified to accommodate regional traffic environment effects, but keeps the fundamental structures of iGLAD. Adult pedestrian patient dataset The total 230 cases of pedestrian accidents data were collected during the 2014. In this dataset, 5 pedestrian victims (2.2%) were death before or after arrival of emergency room. The severely injured patients who deliver to the intensive care unit after first treatment from emergency room were 56 cases (24.8%). The others were either minor injury (out-patients) or moderate injury (in-patients). In the age distribution, 51 patients were under 20 year’s old and the remaining 179 cases were adult pedestrian patients. The average age was 45.43 (SD: 25.24) and mean age was 52 year’s old. The minimum age was 1year old and maximum age was 93 year’s old patient. The female patients were 121 cases and male cases were 109 cases. The average female patients ages was 49.08 (SD: 26.18) and the male average ages was 41.37 (SD 23.63)
Age Group
Fre
qu
en
cy
>7465-7455-6445-5435-4425-3415-24<15
50
40
30
20
10
0
KIDAS Pedestrian Patients Age Group Distribution
Figure 2. Pedestrian patients age distributions
In this data set, the numbers of missing height or weight information cases (125 cases) were excluded except death before arrival of emergency room (4 cases). Also age under 20 were excluded to consider only adult pedestrians. Therefore, 89 cases of adult pedestrian accident data were examined. The average adult patients was 56.97 with SD 18.37 and mean age was 55 year’s old. 36 (41.6%) cases were adult female and 52 (58.4%) cases were adult male pedestrian patients. In the data set 28 cases (31.5%) were elderly pedestrian accidents. Age over 50 (50+) cases were 64 (71.9%), which is similar to national data. From the 50+ patients, the average height and weight was 1,590 mm and 58.7 kg. The other age group’s average height and weight were 1,678 mm and 64.8 kg. There is significant difference in height and weight between two age groups. 27 out 89 patients were
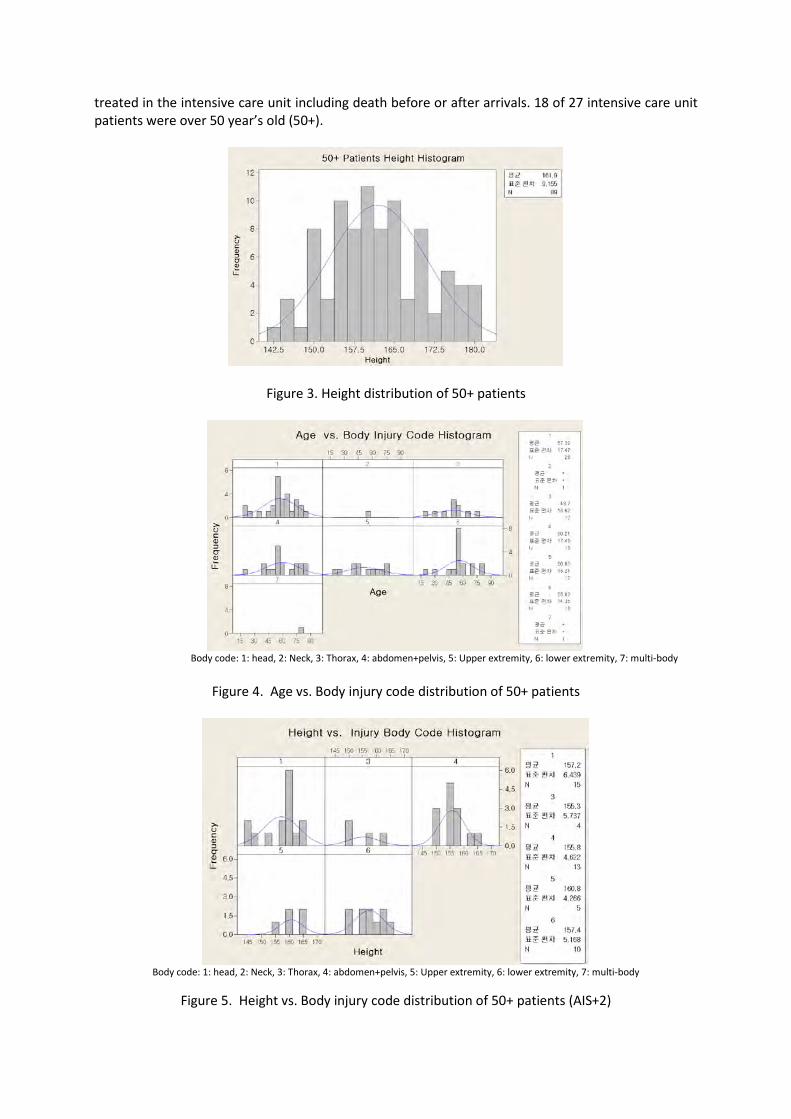
treated in the intensive care unit including death before or after arrivals. 18 of 27 intensive care unit patients were over 50 year’s old (50+).
Figure 3. Height distribution of 50+ patients
Body code: 1: head, 2: Neck, 3: Thorax, 4: abdomen+pelvis, 5: Upper extremity, 6: lower extremity, 7: multi-body
Figure 4. Age vs. Body injury code distribution of 50+ patients
Body code: 1: head, 2: Neck, 3: Thorax, 4: abdomen+pelvis, 5: Upper extremity, 6: lower extremity, 7: multi-body
Figure 5. Height vs. Body injury code distribution of 50+ patients (AIS+2)
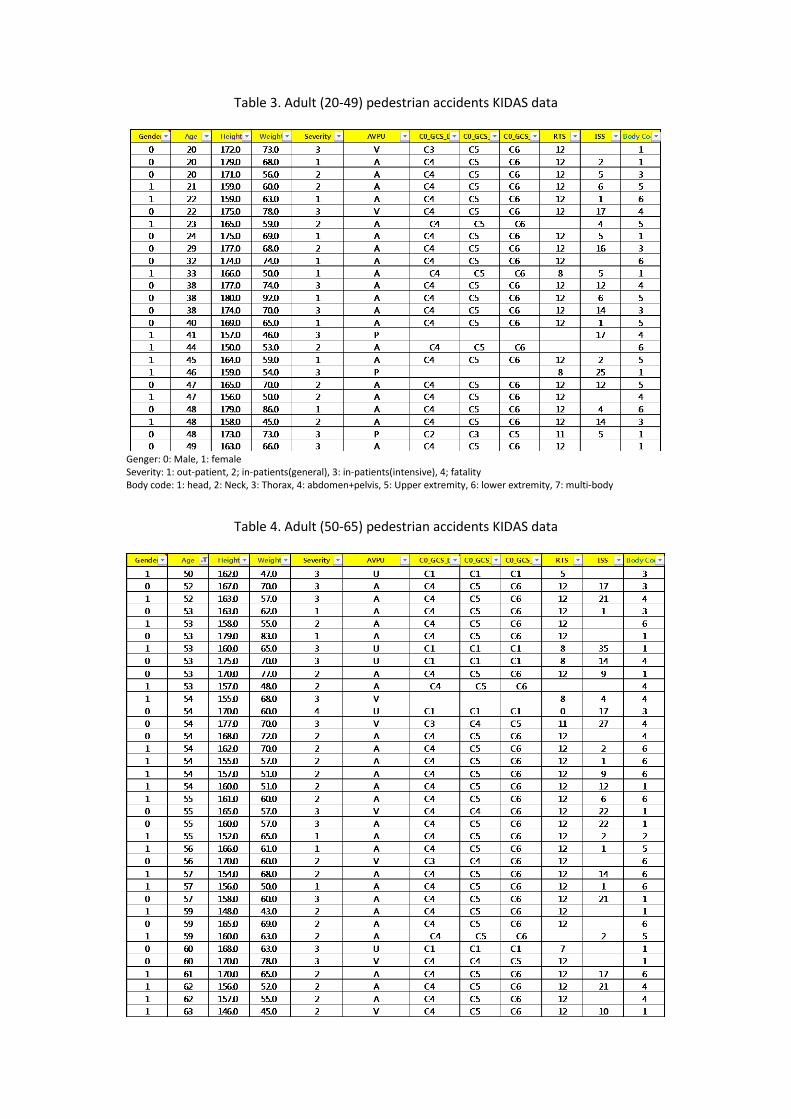
Table 3. Adult (20-49) pedestrian accidents KIDAS data
Genger: 0: Male, 1: female Severity: 1: out-patient, 2; in-patients(general), 3: in-patients(intensive), 4; fatality Body code: 1: head, 2: Neck, 3: Thorax, 4: abdomen+pelvis, 5: Upper extremity, 6: lower extremity, 7: multi-body
Table 4. Adult (50-65) pedestrian accidents KIDAS data
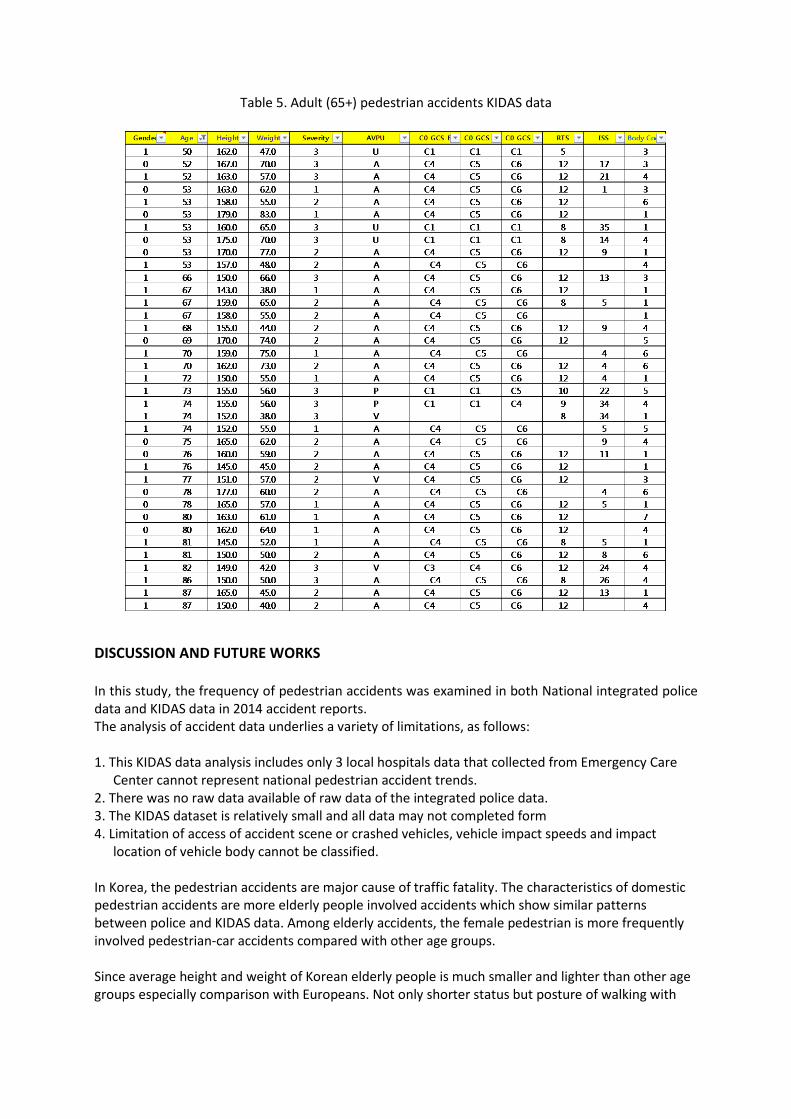
Table 5. Adult (65+) pedestrian accidents KIDAS data
DISCUSSION AND FUTURE WORKS In this study, the frequency of pedestrian accidents was examined in both National integrated police data and KIDAS data in 2014 accident reports. The analysis of accident data underlies a variety of limitations, as follows: 1. This KIDAS data analysis includes only 3 local hospitals data that collected from Emergency Care
Center cannot represent national pedestrian accident trends. 2. There was no raw data available of raw data of the integrated police data. 3. The KIDAS dataset is relatively small and all data may not completed form 4. Limitation of access of accident scene or crashed vehicles, vehicle impact speeds and impact
location of vehicle body cannot be classified. In Korea, the pedestrian accidents are major cause of traffic fatality. The characteristics of domestic pedestrian accidents are more elderly people involved accidents which show similar patterns between police and KIDAS data. Among elderly accidents, the female pedestrian is more frequently involved pedestrian-car accidents compared with other age groups. Since average height and weight of Korean elderly people is much smaller and lighter than other age groups especially comparison with Europeans. Not only shorter status but posture of walking with
bended back bone, the elderly height may much shorter than expected. Even passenger vehicle can hit the pelvis or abdomen area of elderly female pedestrians. REFERENCES [1] Roth, F., Schenk, T. and Coulongeat, F. Pelvis and Upper Leg Injuries: Potential from the View of Integrated Safety. Praxiskonferenz Fußgängerschutz, 2013, Bergisch Gladbach. [2] Snedeker, J.G., Walz, F.H., Muser, M.H., Lanz, C. and Schroeder, G. Assessing femur and pelvis injury risk in car-pedestrian collisions: comparison of full body PMTO impacts, and a human body finite element model. The 19th ESV Conference Proceedings, 2005, NHTSA, Washington, D.C., USA. [3] Lubbe, N., Hikichi, H., Takahashi, H. and Davidsson, J. Review of the EURO NCAP Upper Leg Test. The 22nd ESV Conference Proceedings, 2011, [4] Hardy, B.J., Lawrence, G.J.L., Knight, I.M., Simmons, I.C.P., Carroll, J.A., Coley, R. et al. A study of possible future developments of methods to protect pedestrians and other vulnerable road users. 2007 Mar, TRL Limited. Report No.: UPR/VE/061/07. Otte, D. and Haasper, C. Technical parameters and mechanisms for the injury risk of the knee joint of vulnerable road users impacted by cars in road traffic accidents. Proceedings of IRCOBI Conference, 2005, Prague, Czech Republic. [6] Otte, D., Jänsch, M. and Haasper, C. Injury protection and accident causation parameters for vulnerable road users based on German In-Depth Accident Study GIDAS. Accident Analysis & Prevention, 2012, 44(1):149–53. [7] Mallory, A., Fredriksson, R., Rosen, E. and Donnelly, B. Pedestrian Injuries by Source: Serious and Disabling Injuries in US and European Cases. Annals of Advances in Automotive Medicine / Annual Scientific Conference, 2012, 56:13–24. [8] Demetriades, D., Murray, J., Martin, M., Velmahos, G., Salim, A., Alo, K. et al. Pedestrians injured by automobiles: relationship of age to injury type and severity. Journal of the American College of Surgeons, 2004, 199(3):382–7. [9] Starnes, M.J., Hadjizacharia, P., Chan, L.S. and Demetriades, D. Automobile versus Pedestrian Injuries: Does Gender Matter? The Journal of Emergency Medicine, 2011, 40(6):617–22. [10] DeSantis Klinich, K. and Schneider, L. Biomechanics of Pedestrian Injuries Related to Lower Extremity Injury Assessment Tools: A Review of the Literature and Analysis of Pedestrian Crash Database. 2003 Sep, Alliance for Automobile Manufacturers. 92 Report No.: UMTRI-2003-25. [11] Liers, H. and Hannawald, L. Benefit estimation of the EuroNCAP pedestrian rating concerning real-world pedestrian safety. 2009 Mar, VUFO, Dresden
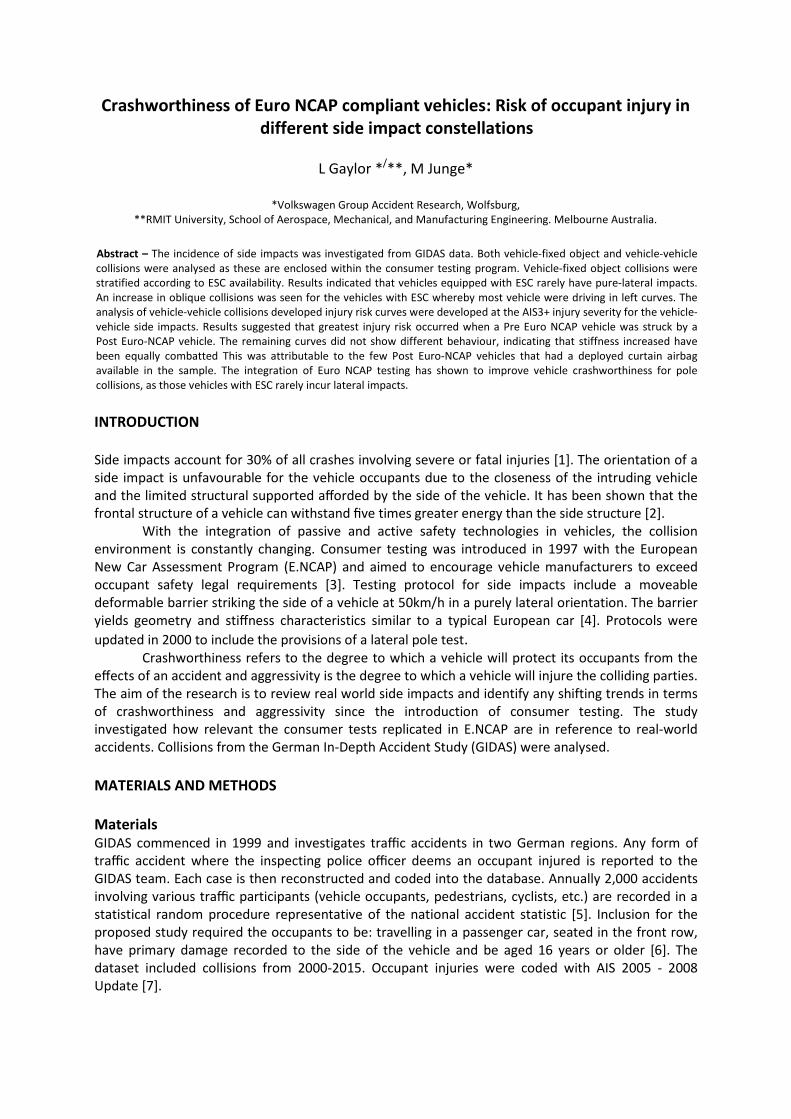
Crashworthiness of Euro NCAP compliant vehicles: Risk of occupant injury in different side impact constellations
L Gaylor */**, M Junge*
*Volkswagen Group Accident Research, Wolfsburg,
**RMIT University, School of Aerospace, Mechanical, and Manufacturing Engineering. Melbourne Australia. Abstract – The incidence of side impacts was investigated from GIDAS data. Both vehicle-fixed object and vehicle-vehicle collisions were analysed as these are enclosed within the consumer testing program. Vehicle-fixed object collisions were stratified according to ESC availability. Results indicated that vehicles equipped with ESC rarely have pure-lateral impacts. An increase in oblique collisions was seen for the vehicles with ESC whereby most vehicle were driving in left curves. The analysis of vehicle-vehicle collisions developed injury risk curves were developed at the AIS3+ injury severity for the vehicle-vehicle side impacts. Results suggested that greatest injury risk occurred when a Pre Euro NCAP vehicle was struck by a Post Euro-NCAP vehicle. The remaining curves did not show different behaviour, indicating that stiffness increased have been equally combatted This was attributable to the few Post Euro-NCAP vehicles that had a deployed curtain airbag available in the sample. The integration of Euro NCAP testing has shown to improve vehicle crashworthiness for pole collisions, as those vehicles with ESC rarely incur lateral impacts. INTRODUCTION Side impacts account for 30% of all crashes involving severe or fatal injuries [1]. The orientation of a side impact is unfavourable for the vehicle occupants due to the closeness of the intruding vehicle and the limited structural supported afforded by the side of the vehicle. It has been shown that the frontal structure of a vehicle can withstand five times greater energy than the side structure [2].
With the integration of passive and active safety technologies in vehicles, the collision environment is constantly changing. Consumer testing was introduced in 1997 with the European New Car Assessment Program (E.NCAP) and aimed to encourage vehicle manufacturers to exceed occupant safety legal requirements [3]. Testing protocol for side impacts include a moveable deformable barrier striking the side of a vehicle at 50km/h in a purely lateral orientation. The barrier yields geometry and stiffness characteristics similar to a typical European car [4]. Protocols were updated in 2000 to include the provisions of a lateral pole test. Crashworthiness refers to the degree to which a vehicle will protect its occupants from the effects of an accident and aggressivity is the degree to which a vehicle will injure the colliding parties. The aim of the research is to review real world side impacts and identify any shifting trends in terms of crashworthiness and aggressivity since the introduction of consumer testing. The study investigated how relevant the consumer tests replicated in E.NCAP are in reference to real-world accidents. Collisions from the German In-Depth Accident Study (GIDAS) were analysed. MATERIALS AND METHODS Materials GIDAS commenced in 1999 and investigates traffic accidents in two German regions. Any form of traffic accident where the inspecting police officer deems an occupant injured is reported to the GIDAS team. Each case is then reconstructed and coded into the database. Annually 2,000 accidents involving various traffic participants (vehicle occupants, pedestrians, cyclists, etc.) are recorded in a statistical random procedure representative of the national accident statistic [5]. Inclusion for the proposed study required the occupants to be: travelling in a passenger car, seated in the front row, have primary damage recorded to the side of the vehicle and be aged 16 years or older [6]. The dataset included collisions from 2000-2015. Occupant injuries were coded with AIS 2005 - 2008 Update [7].
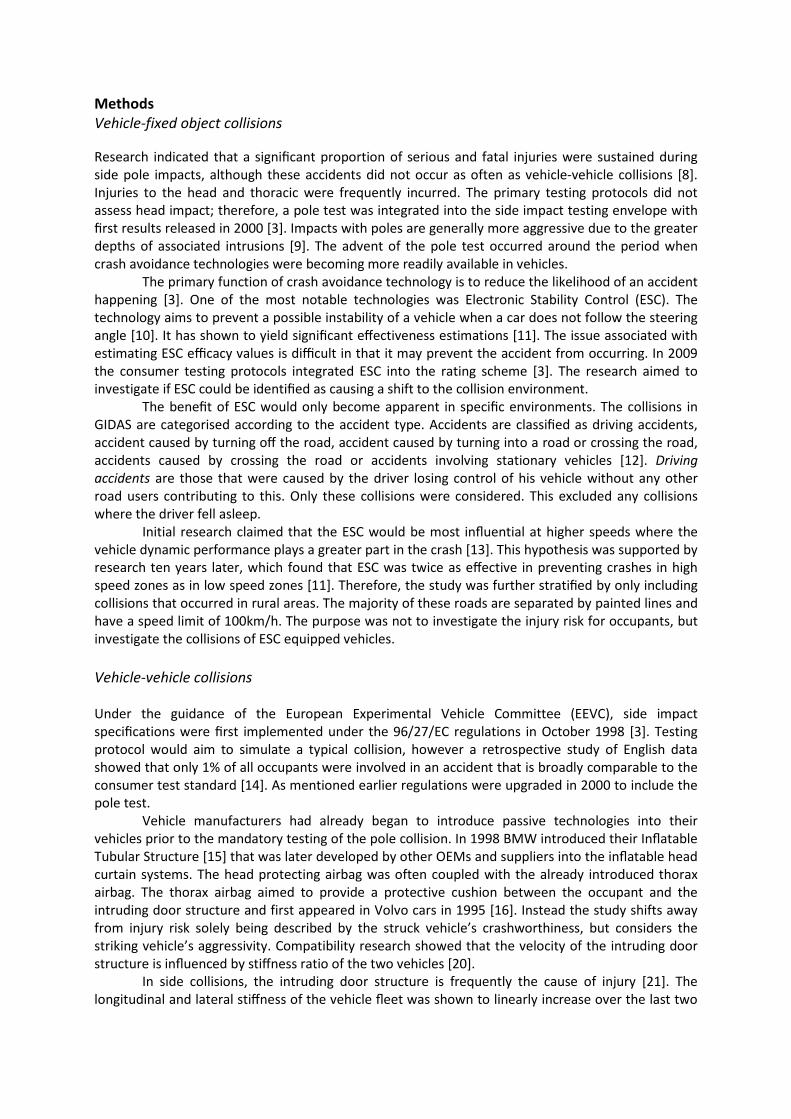
Methods Vehicle-fixed object collisions Research indicated that a significant proportion of serious and fatal injuries were sustained during side pole impacts, although these accidents did not occur as often as vehicle-vehicle collisions [8]. Injuries to the head and thoracic were frequently incurred. The primary testing protocols did not assess head impact; therefore, a pole test was integrated into the side impact testing envelope with first results released in 2000 [3]. Impacts with poles are generally more aggressive due to the greater depths of associated intrusions [9]. The advent of the pole test occurred around the period when crash avoidance technologies were becoming more readily available in vehicles.
The primary function of crash avoidance technology is to reduce the likelihood of an accident happening [3]. One of the most notable technologies was Electronic Stability Control (ESC). The technology aims to prevent a possible instability of a vehicle when a car does not follow the steering angle [10]. It has shown to yield significant effectiveness estimations [11]. The issue associated with estimating ESC efficacy values is difficult in that it may prevent the accident from occurring. In 2009 the consumer testing protocols integrated ESC into the rating scheme [3]. The research aimed to investigate if ESC could be identified as causing a shift to the collision environment.
The benefit of ESC would only become apparent in specific environments. The collisions in GIDAS are categorised according to the accident type. Accidents are classified as driving accidents, accident caused by turning off the road, accident caused by turning into a road or crossing the road, accidents caused by crossing the road or accidents involving stationary vehicles [12]. Driving accidents are those that were caused by the driver losing control of his vehicle without any other road users contributing to this. Only these collisions were considered. This excluded any collisions where the driver fell asleep.
Initial research claimed that the ESC would be most influential at higher speeds where the vehicle dynamic performance plays a greater part in the crash [13]. This hypothesis was supported by research ten years later, which found that ESC was twice as effective in preventing crashes in high speed zones as in low speed zones [11]. Therefore, the study was further stratified by only including collisions that occurred in rural areas. The majority of these roads are separated by painted lines and have a speed limit of 100km/h. The purpose was not to investigate the injury risk for occupants, but investigate the collisions of ESC equipped vehicles. Vehicle-vehicle collisions Under the guidance of the European Experimental Vehicle Committee (EEVC), side impact specifications were first implemented under the 96/27/EC regulations in October 1998 [3]. Testing protocol would aim to simulate a typical collision, however a retrospective study of English data showed that only 1% of all occupants were involved in an accident that is broadly comparable to the consumer test standard [14]. As mentioned earlier regulations were upgraded in 2000 to include the pole test.
Vehicle manufacturers had already began to introduce passive technologies into their vehicles prior to the mandatory testing of the pole collision. In 1998 BMW introduced their Inflatable Tubular Structure [15] that was later developed by other OEMs and suppliers into the inflatable head curtain systems. The head protecting airbag was often coupled with the already introduced thorax airbag. The thorax airbag aimed to provide a protective cushion between the occupant and the intruding door structure and first appeared in Volvo cars in 1995 [16]. Instead the study shifts away from injury risk solely being described by the struck vehicle’s crashworthiness, but considers the striking vehicle’s aggressivity. Compatibility research showed that the velocity of the intruding door structure is influenced by stiffness ratio of the two vehicles [20].
In side collisions, the intruding door structure is frequently the cause of injury [21]. The longitudinal and lateral stiffness of the vehicle fleet was shown to linearly increase over the last two
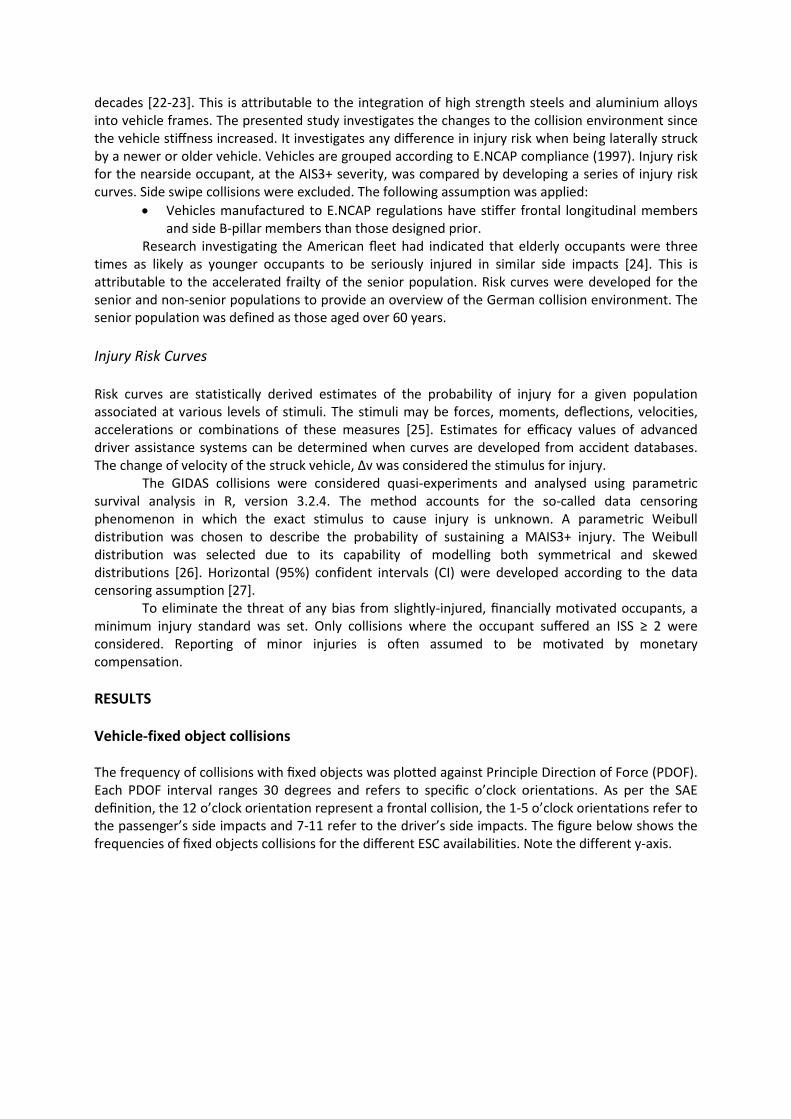
decades [22-23]. This is attributable to the integration of high strength steels and aluminium alloys into vehicle frames. The presented study investigates the changes to the collision environment since the vehicle stiffness increased. It investigates any difference in injury risk when being laterally struck by a newer or older vehicle. Vehicles are grouped according to E.NCAP compliance (1997). Injury risk for the nearside occupant, at the AIS3+ severity, was compared by developing a series of injury risk curves. Side swipe collisions were excluded. The following assumption was applied:
• Vehicles manufactured to E.NCAP regulations have stiffer frontal longitudinal members and side B-pillar members than those designed prior.
Research investigating the American fleet had indicated that elderly occupants were three times as likely as younger occupants to be seriously injured in similar side impacts [24]. This is attributable to the accelerated frailty of the senior population. Risk curves were developed for the senior and non-senior populations to provide an overview of the German collision environment. The senior population was defined as those aged over 60 years. Injury Risk Curves Risk curves are statistically derived estimates of the probability of injury for a given population associated at various levels of stimuli. The stimuli may be forces, moments, deflections, velocities, accelerations or combinations of these measures [25]. Estimates for efficacy values of advanced driver assistance systems can be determined when curves are developed from accident databases. The change of velocity of the struck vehicle, ∆v was considered the stimulus for injury.
The GIDAS collisions were considered quasi-experiments and analysed using parametric survival analysis in R, version 3.2.4. The method accounts for the so-called data censoring phenomenon in which the exact stimulus to cause injury is unknown. A parametric Weibull distribution was chosen to describe the probability of sustaining a MAIS3+ injury. The Weibull distribution was selected due to its capability of modelling both symmetrical and skewed distributions [26]. Horizontal (95%) confident intervals (CI) were developed according to the data censoring assumption [27].
To eliminate the threat of any bias from slightly-injured, financially motivated occupants, a minimum injury standard was set. Only collisions where the occupant suffered an ISS ≥ 2 were considered. Reporting of minor injuries is often assumed to be motivated by monetary compensation.
RESULTS Vehicle-fixed object collisions The frequency of collisions with fixed objects was plotted against Principle Direction of Force (PDOF). Each PDOF interval ranges 30 degrees and refers to specific o’clock orientations. As per the SAE definition, the 12 o’clock orientation represent a frontal collision, the 1-5 o’clock orientations refer to the passenger’s side impacts and 7-11 refer to the driver’s side impacts. The figure below shows the frequencies of fixed objects collisions for the different ESC availabilities. Note the different y-axis.
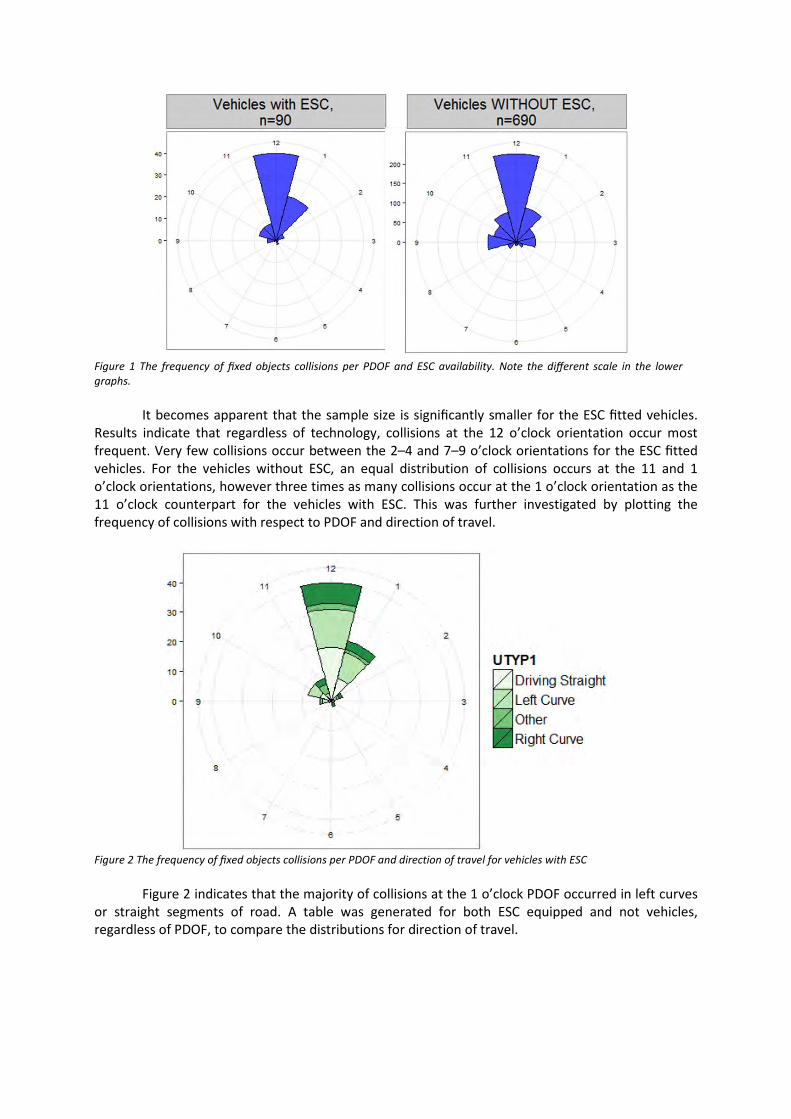
Figure 1 The frequency of fixed objects collisions per PDOF and ESC availability. Note the different scale in the lower graphs.
It becomes apparent that the sample size is significantly smaller for the ESC fitted vehicles. Results indicate that regardless of technology, collisions at the 12 o’clock orientation occur most frequent. Very few collisions occur between the 2–4 and 7–9 o’clock orientations for the ESC fitted vehicles. For the vehicles without ESC, an equal distribution of collisions occurs at the 11 and 1 o’clock orientations, however three times as many collisions occur at the 1 o’clock orientation as the 11 o’clock counterpart for the vehicles with ESC. This was further investigated by plotting the frequency of collisions with respect to PDOF and direction of travel.
Figure 2 The frequency of fixed objects collisions per PDOF and direction of travel for vehicles with ESC
Figure 2 indicates that the majority of collisions at the 1 o’clock PDOF occurred in left curves or straight segments of road. A table was generated for both ESC equipped and not vehicles, regardless of PDOF, to compare the distributions for direction of travel.
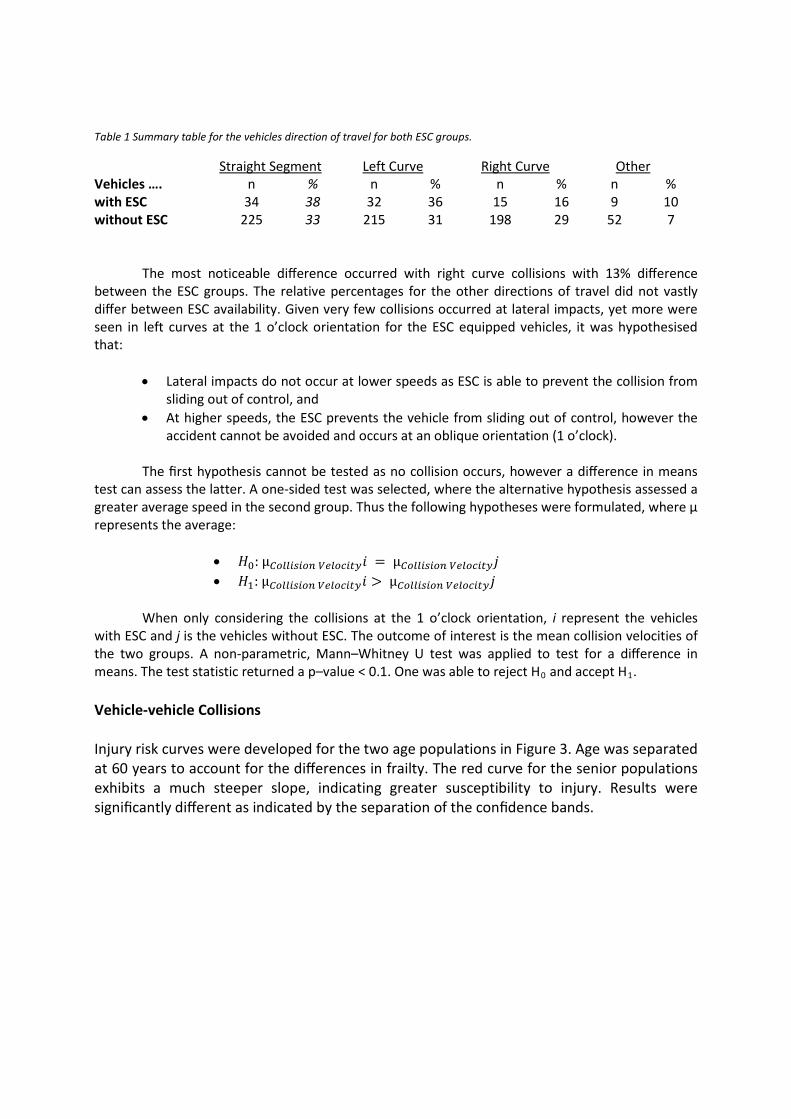
Table 1 Summary table for the vehicles direction of travel for both ESC groups.
Straight Segment Left Curve Right Curve Other Vehicles …. n % n % n % n % with ESC 34 38 32 36 15 16 9 10 without ESC 225 33 215 31 198 29 52 7 The most noticeable difference occurred with right curve collisions with 13% difference between the ESC groups. The relative percentages for the other directions of travel did not vastly differ between ESC availability. Given very few collisions occurred at lateral impacts, yet more were seen in left curves at the 1 o’clock orientation for the ESC equipped vehicles, it was hypothesised that:
• Lateral impacts do not occur at lower speeds as ESC is able to prevent the collision from sliding out of control, and
• At higher speeds, the ESC prevents the vehicle from sliding out of control, however the accident cannot be avoided and occurs at an oblique orientation (1 o’clock).
The first hypothesis cannot be tested as no collision occurs, however a difference in means test can assess the latter. A one-sided test was selected, where the alternative hypothesis assessed a greater average speed in the second group. Thus the following hypotheses were formulated, where µ represents the average:
• 𝐻0: µ𝐶𝐶𝐶𝐶𝐶𝐶𝐶𝐶𝐶 𝑉𝑉𝐶𝐶𝑜𝐶𝑜𝑜𝑖 = µ𝐶𝐶𝐶𝐶𝐶𝐶𝐶𝐶𝐶 𝑉𝑉𝐶𝐶𝑜𝐶𝑜𝑜𝑗 • 𝐻1: µ𝐶𝐶𝐶𝐶𝐶𝐶𝐶𝐶𝐶 𝑉𝑉𝐶𝐶𝑜𝐶𝑜𝑜𝑖 > µ𝐶𝐶𝐶𝐶𝐶𝐶𝐶𝐶𝐶 𝑉𝑉𝐶𝐶𝑜𝐶𝑜𝑜𝑗
When only considering the collisions at the 1 o’clock orientation, i represent the vehicles with ESC and j is the vehicles without ESC. The outcome of interest is the mean collision velocities of the two groups. A non-parametric, Mann–Whitney U test was applied to test for a difference in means. The test statistic returned a p–value < 0.1. One was able to reject H0 and accept H1. Vehicle-vehicle Collisions Injury risk curves were developed for the two age populations in Figure 3. Age was separated at 60 years to account for the differences in frailty. The red curve for the senior populations exhibits a much steeper slope, indicating greater susceptibility to injury. Results were significantly different as indicated by the separation of the confidence bands.
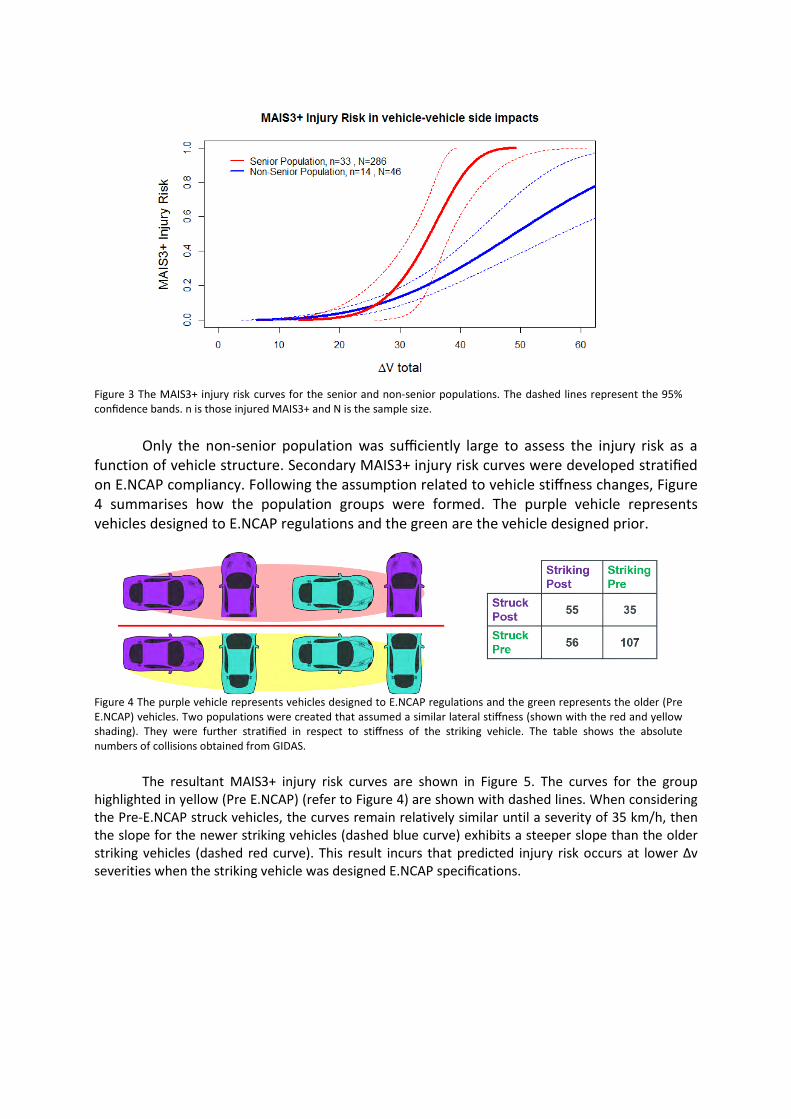
Figure 3 The MAIS3+ injury risk curves for the senior and non-senior populations. The dashed lines represent the 95% confidence bands. n is those injured MAIS3+ and N is the sample size.
Only the non-senior population was sufficiently large to assess the injury risk as a function of vehicle structure. Secondary MAIS3+ injury risk curves were developed stratified on E.NCAP compliancy. Following the assumption related to vehicle stiffness changes, Figure 4 summarises how the population groups were formed. The purple vehicle represents vehicles designed to E.NCAP regulations and the green are the vehicle designed prior.
Figure 4 The purple vehicle represents vehicles designed to E.NCAP regulations and the green represents the older (Pre E.NCAP) vehicles. Two populations were created that assumed a similar lateral stiffness (shown with the red and yellow shading). They were further stratified in respect to stiffness of the striking vehicle. The table shows the absolute numbers of collisions obtained from GIDAS.
The resultant MAIS3+ injury risk curves are shown in Figure 5. The curves for the group highlighted in yellow (Pre E.NCAP) (refer to Figure 4) are shown with dashed lines. When considering the Pre-E.NCAP struck vehicles, the curves remain relatively similar until a severity of 35 km/h, then the slope for the newer striking vehicles (dashed blue curve) exhibits a steeper slope than the older striking vehicles (dashed red curve). This result incurs that predicted injury risk occurs at lower ∆v severities when the striking vehicle was designed E.NCAP specifications.
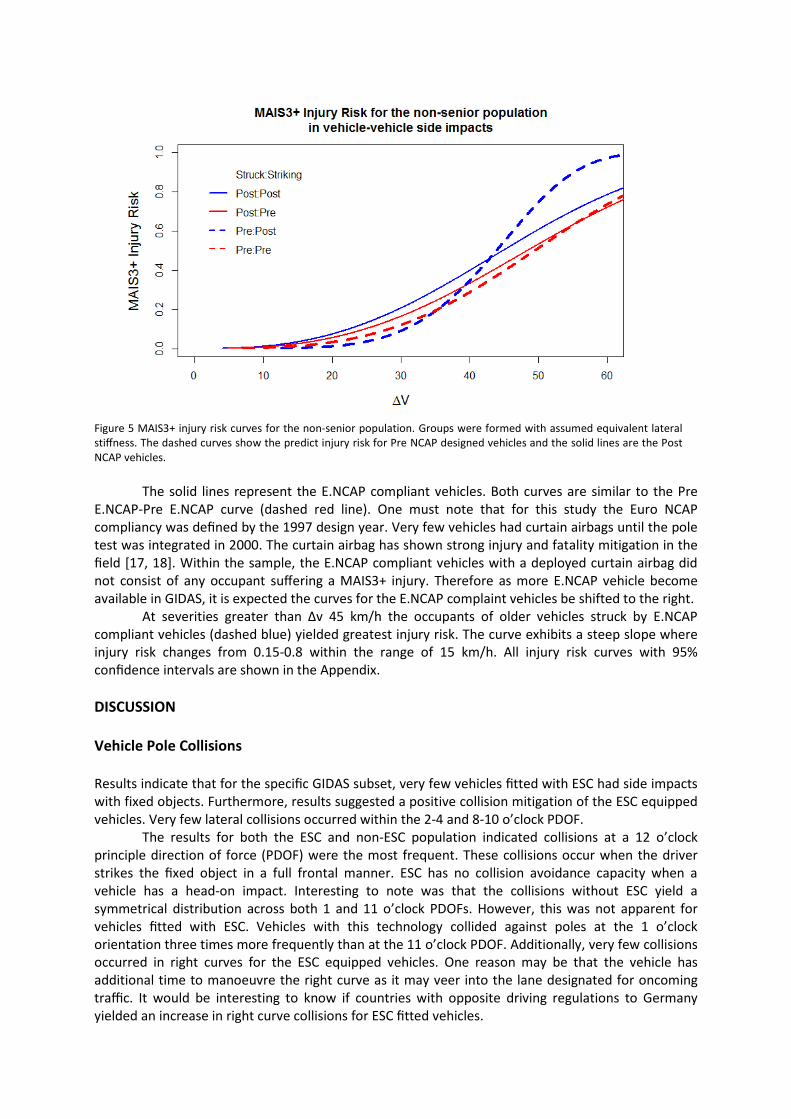
Figure 5 MAIS3+ injury risk curves for the non-senior population. Groups were formed with assumed equivalent lateral stiffness. The dashed curves show the predict injury risk for Pre NCAP designed vehicles and the solid lines are the Post NCAP vehicles.
The solid lines represent the E.NCAP compliant vehicles. Both curves are similar to the Pre
E.NCAP-Pre E.NCAP curve (dashed red line). One must note that for this study the Euro NCAP compliancy was defined by the 1997 design year. Very few vehicles had curtain airbags until the pole test was integrated in 2000. The curtain airbag has shown strong injury and fatality mitigation in the field [17, 18]. Within the sample, the E.NCAP compliant vehicles with a deployed curtain airbag did not consist of any occupant suffering a MAIS3+ injury. Therefore as more E.NCAP vehicle become available in GIDAS, it is expected the curves for the E.NCAP complaint vehicles be shifted to the right.
At severities greater than ∆v 45 km/h the occupants of older vehicles struck by E.NCAP compliant vehicles (dashed blue) yielded greatest injury risk. The curve exhibits a steep slope where injury risk changes from 0.15-0.8 within the range of 15 km/h. All injury risk curves with 95% confidence intervals are shown in the Appendix.
DISCUSSION Vehicle Pole Collisions Results indicate that for the specific GIDAS subset, very few vehicles fitted with ESC had side impacts with fixed objects. Furthermore, results suggested a positive collision mitigation of the ESC equipped vehicles. Very few lateral collisions occurred within the 2-4 and 8-10 o’clock PDOF.
The results for both the ESC and non-ESC population indicated collisions at a 12 o’clock principle direction of force (PDOF) were the most frequent. These collisions occur when the driver strikes the fixed object in a full frontal manner. ESC has no collision avoidance capacity when a vehicle has a head-on impact. Interesting to note was that the collisions without ESC yield a symmetrical distribution across both 1 and 11 o’clock PDOFs. However, this was not apparent for vehicles fitted with ESC. Vehicles with this technology collided against poles at the 1 o’clock orientation three times more frequently than at the 11 o’clock PDOF. Additionally, very few collisions occurred in right curves for the ESC equipped vehicles. One reason may be that the vehicle has additional time to manoeuvre the right curve as it may veer into the lane designated for oncoming traffic. It would be interesting to know if countries with opposite driving regulations to Germany yielded an increase in right curve collisions for ESC fitted vehicles.
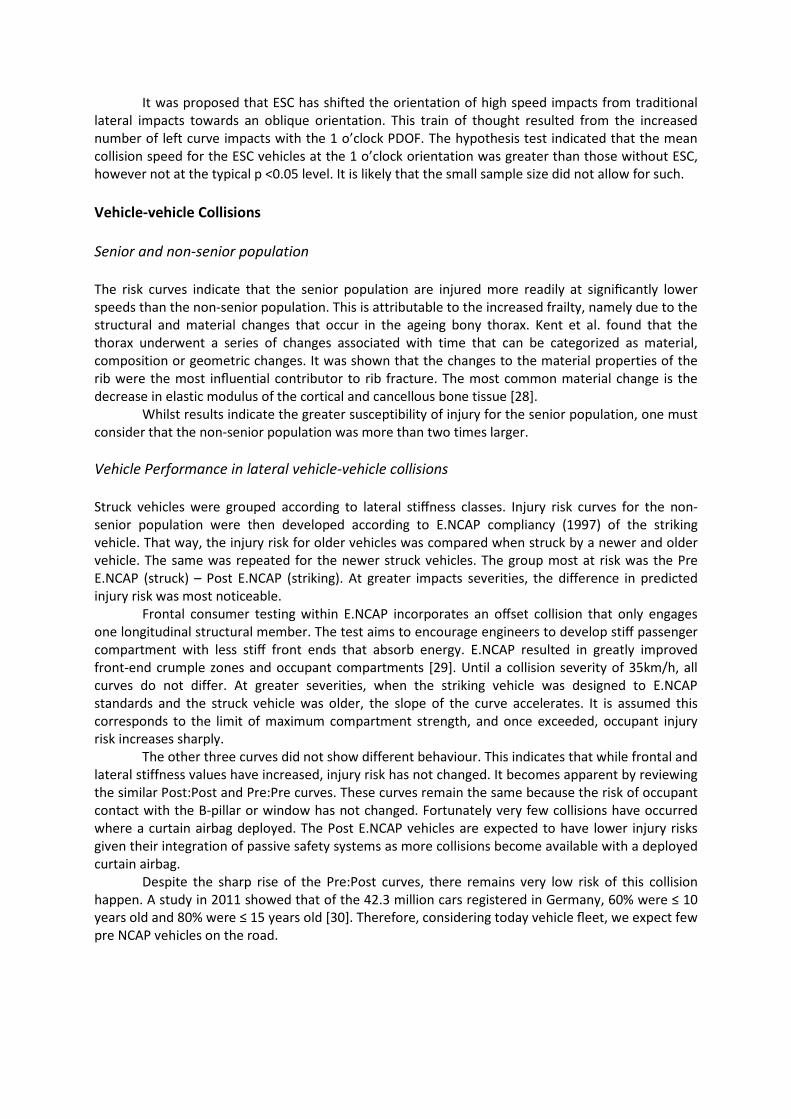
It was proposed that ESC has shifted the orientation of high speed impacts from traditional lateral impacts towards an oblique orientation. This train of thought resulted from the increased number of left curve impacts with the 1 o’clock PDOF. The hypothesis test indicated that the mean collision speed for the ESC vehicles at the 1 o’clock orientation was greater than those without ESC, however not at the typical p <0.05 level. It is likely that the small sample size did not allow for such. Vehicle-vehicle Collisions Senior and non-senior population The risk curves indicate that the senior population are injured more readily at significantly lower speeds than the non-senior population. This is attributable to the increased frailty, namely due to the structural and material changes that occur in the ageing bony thorax. Kent et al. found that the thorax underwent a series of changes associated with time that can be categorized as material, composition or geometric changes. It was shown that the changes to the material properties of the rib were the most influential contributor to rib fracture. The most common material change is the decrease in elastic modulus of the cortical and cancellous bone tissue [28].
Whilst results indicate the greater susceptibility of injury for the senior population, one must consider that the non-senior population was more than two times larger.
Vehicle Performance in lateral vehicle-vehicle collisions Struck vehicles were grouped according to lateral stiffness classes. Injury risk curves for the non-senior population were then developed according to E.NCAP compliancy (1997) of the striking vehicle. That way, the injury risk for older vehicles was compared when struck by a newer and older vehicle. The same was repeated for the newer struck vehicles. The group most at risk was the Pre E.NCAP (struck) – Post E.NCAP (striking). At greater impacts severities, the difference in predicted injury risk was most noticeable.
Frontal consumer testing within E.NCAP incorporates an offset collision that only engages one longitudinal structural member. The test aims to encourage engineers to develop stiff passenger compartment with less stiff front ends that absorb energy. E.NCAP resulted in greatly improved front-end crumple zones and occupant compartments [29]. Until a collision severity of 35km/h, all curves do not differ. At greater severities, when the striking vehicle was designed to E.NCAP standards and the struck vehicle was older, the slope of the curve accelerates. It is assumed this corresponds to the limit of maximum compartment strength, and once exceeded, occupant injury risk increases sharply.
The other three curves did not show different behaviour. This indicates that while frontal and lateral stiffness values have increased, injury risk has not changed. It becomes apparent by reviewing the similar Post:Post and Pre:Pre curves. These curves remain the same because the risk of occupant contact with the B-pillar or window has not changed. Fortunately very few collisions have occurred where a curtain airbag deployed. The Post E.NCAP vehicles are expected to have lower injury risks given their integration of passive safety systems as more collisions become available with a deployed curtain airbag.
Despite the sharp rise of the Pre:Post curves, there remains very low risk of this collision happen. A study in 2011 showed that of the 42.3 million cars registered in Germany, 60% were ≤ 10 years old and 80% were ≤ 15 years old [30]. Therefore, considering today vehicle fleet, we expect few pre NCAP vehicles on the road.
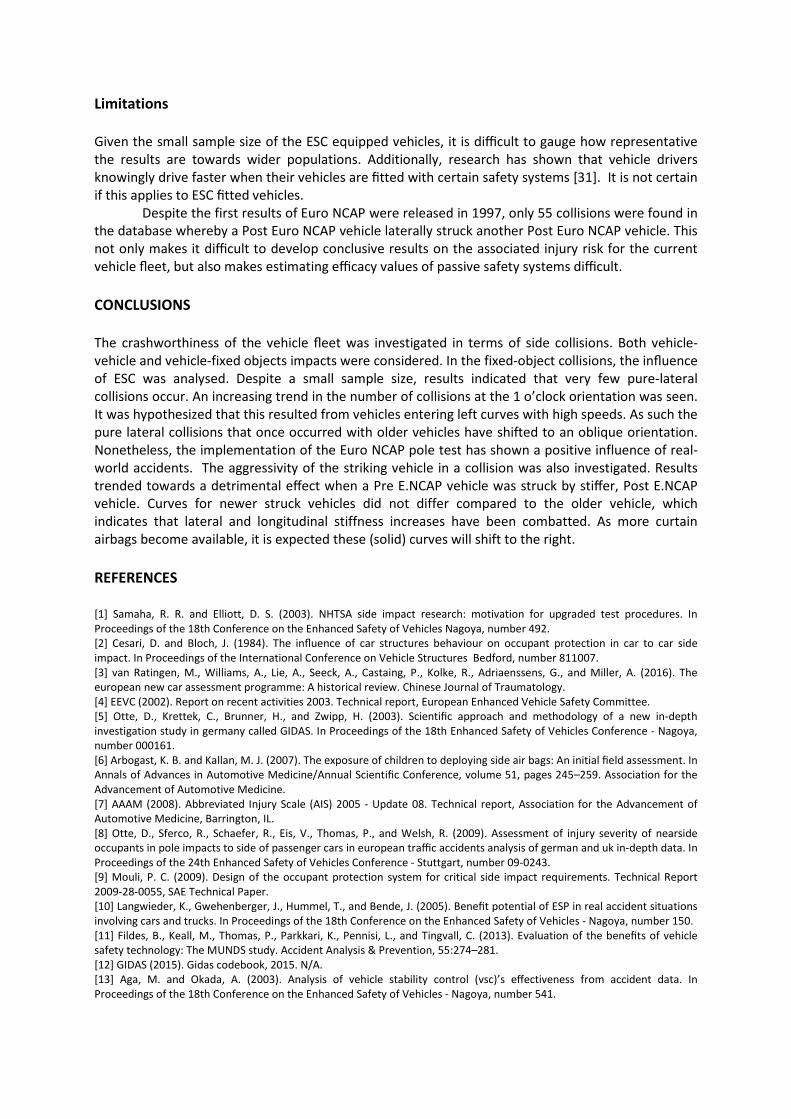
Limitations Given the small sample size of the ESC equipped vehicles, it is difficult to gauge how representative the results are towards wider populations. Additionally, research has shown that vehicle drivers knowingly drive faster when their vehicles are fitted with certain safety systems [31]. It is not certain if this applies to ESC fitted vehicles.
Despite the first results of Euro NCAP were released in 1997, only 55 collisions were found in the database whereby a Post Euro NCAP vehicle laterally struck another Post Euro NCAP vehicle. This not only makes it difficult to develop conclusive results on the associated injury risk for the current vehicle fleet, but also makes estimating efficacy values of passive safety systems difficult. CONCLUSIONS The crashworthiness of the vehicle fleet was investigated in terms of side collisions. Both vehicle-vehicle and vehicle-fixed objects impacts were considered. In the fixed-object collisions, the influence of ESC was analysed. Despite a small sample size, results indicated that very few pure-lateral collisions occur. An increasing trend in the number of collisions at the 1 o’clock orientation was seen. It was hypothesized that this resulted from vehicles entering left curves with high speeds. As such the pure lateral collisions that once occurred with older vehicles have shifted to an oblique orientation. Nonetheless, the implementation of the Euro NCAP pole test has shown a positive influence of real-world accidents. The aggressivity of the striking vehicle in a collision was also investigated. Results trended towards a detrimental effect when a Pre E.NCAP vehicle was struck by stiffer, Post E.NCAP vehicle. Curves for newer struck vehicles did not differ compared to the older vehicle, which indicates that lateral and longitudinal stiffness increases have been combatted. As more curtain airbags become available, it is expected these (solid) curves will shift to the right. REFERENCES [1] Samaha, R. R. and Elliott, D. S. (2003). NHTSA side impact research: motivation for upgraded test procedures. In Proceedings of the 18th Conference on the Enhanced Safety of Vehicles Nagoya, number 492. [2] Cesari, D. and Bloch, J. (1984). The influence of car structures behaviour on occupant protection in car to car side impact. In Proceedings of the International Conference on Vehicle Structures Bedford, number 811007. [3] van Ratingen, M., Williams, A., Lie, A., Seeck, A., Castaing, P., Kolke, R., Adriaenssens, G., and Miller, A. (2016). The european new car assessment programme: A historical review. Chinese Journal of Traumatology. [4] EEVC (2002). Report on recent activities 2003. Technical report, European Enhanced Vehicle Safety Committee. [5] Otte, D., Krettek, C., Brunner, H., and Zwipp, H. (2003). Scientific approach and methodology of a new in-depth investigation study in germany called GIDAS. In Proceedings of the 18th Enhanced Safety of Vehicles Conference - Nagoya, number 000161. [6] Arbogast, K. B. and Kallan, M. J. (2007). The exposure of children to deploying side air bags: An initial field assessment. In Annals of Advances in Automotive Medicine/Annual Scientific Conference, volume 51, pages 245–259. Association for the Advancement of Automotive Medicine. [7] AAAM (2008). Abbreviated Injury Scale (AIS) 2005 - Update 08. Technical report, Association for the Advancement of Automotive Medicine, Barrington, IL. [8] Otte, D., Sferco, R., Schaefer, R., Eis, V., Thomas, P., and Welsh, R. (2009). Assessment of injury severity of nearside occupants in pole impacts to side of passenger cars in european traffic accidents analysis of german and uk in-depth data. In Proceedings of the 24th Enhanced Safety of Vehicles Conference - Stuttgart, number 09-0243. [9] Mouli, P. C. (2009). Design of the occupant protection system for critical side impact requirements. Technical Report 2009-28-0055, SAE Technical Paper. [10] Langwieder, K., Gwehenberger, J., Hummel, T., and Bende, J. (2005). Benefit potential of ESP in real accident situations involving cars and trucks. In Proceedings of the 18th Conference on the Enhanced Safety of Vehicles - Nagoya, number 150. [11] Fildes, B., Keall, M., Thomas, P., Parkkari, K., Pennisi, L., and Tingvall, C. (2013). Evaluation of the benefits of vehicle safety technology: The MUNDS study. Accident Analysis & Prevention, 55:274–281. [12] GIDAS (2015). Gidas codebook, 2015. N/A. [13] Aga, M. and Okada, A. (2003). Analysis of vehicle stability control (vsc)’s effectiveness from accident data. In Proceedings of the 18th Conference on the Enhanced Safety of Vehicles - Nagoya, number 541.
[14] Welsh, R., Morris, A., Thomas, P., Lenard, J., Barnes, J., and Otte, D. (2009). Car to car struck side impacts-a comparison between european accident data and directive 96/27/EC. In Proceedings of IRCOBI Conference - York, pages 115–128. [15] Kompass, K., Digges, K. H., and Malliaris, A. (1998). Benefits of the inflatable tubular structure. an investigation on the casualty abatement capability of the bmw head protection systems HPS. In Proceedings of the 16th Enhanced Safety of Vehicles Conference - Windsor, number 98-S8-O-14. [16] Pilhall, S., Korner, J., and Ouchterlony, B. (1994). SIPSBAG-A new, seat-mounted side impact airbag system. In Proceedings of the 14th Conference on Enhanced Safety of Vehicles - Munich, number 94-S6-O-13. [17] Griffin, R., Huisingh, C., McGwin Jr, G., and Reiff, D. (2012). Association between side impact airbag deployment and risk of injury: A matched cohort study using the CIREN and the NASS-CDS. Journal of Trauma and Acute Care Surgery, 73(4):914–918. [18] McCartt, A. T. and Kyrychenko, S. Y. (2007). Efficacy of side airbags in reducing driver deaths in driver-side car and suv collisions. Traffic injury prevention, 8(2):162–170. [19] D’Elia, A., Newstead, S., and Scully, J. (2013). Evaluation of vehicle side airbag effectiveness in Victoria, Australia. Accident Analysis & Prevention, 54:67–72. [20] Careme, L. M. (1991). Occupant kinematics and injury causation in side impacts-field accident experience. Technical Report 910316, SAE Technical Paper. [21] Gierczycka, D., Watson, B., and Cronin, D. (2015). Investigation of occupant arm position and door properties on thorax kinematics in side impact crash scenarios–comparison of ATD and human models. International Journal of Crashworthiness, 20(3):242–269. [22] Esfahani, E. S., Marzougui, D., Digges, K., and Kan, C. (2011). Effect of increase in weight and stiffness of vehicles on the safety of rear seat occupants. International Journal of Crashworthiness, 16(3):309–318. [23] Lee, E. L., Lee, P. J., Erickson, M. S., and Hayes, W. C. (2014). Increase in vehicle front, rear and side stiffness coefficients in the past twenty years necessitates new representative database. Technical Report 2014-01-0351, SAE Technical Paper. [24] Farmer, C. M., Braver, E. R., and Mitter, E. L. (1997). Two-vehicle side impact crashes: the relationship of vehicle and crash characteristics to injury severity. Accident Analysis & Prevention, 29(3):399–406. [25] Prasad, P., Mertz, H. J., Dalmotas, D. J., Augenstein, J. S., and Digges, K. (2010). Evaluation of the field relevance of several injury risk functions. Stapp car crash journal, 54:49-72. [26] Ran, A., Koch, M., and Mellander, H. (1984). Fitting injury versus exposure data into a risk function. In Proceedings of IRCOBI Conference - Delft, pages 301–312. [27] McMurry, T. L. and Poplin, G. S. (2015). Statistical considerations in the development of injury risk functions. Traffic injury prevention, 16(6):618–626. [28] Kent, R., Sang-Hyun, L., Darvish, K., Wang, S., et al. (2005). Structural and material changes in the aging thorax and their role in crash protection for older occupants. Stapp car crash journal, 49:231–249. [29] O’Neill, B. (2009). Preventing passenger vehicle occupant injuries by vehicle design—A historical perspective from IIHS. Traffic injury prevention, 10(2):113–126. [30] Kraftfahrt-Bundesamt (2011). Fachartikel: Fahrzeugalter. Technical report, Kraftfahrt-Bundesamt. [31] Evans, L. (1999). Antilock brake systems and risk of different types of crashes in traffic. Traffic Injury Prevention, 1(1):5–23
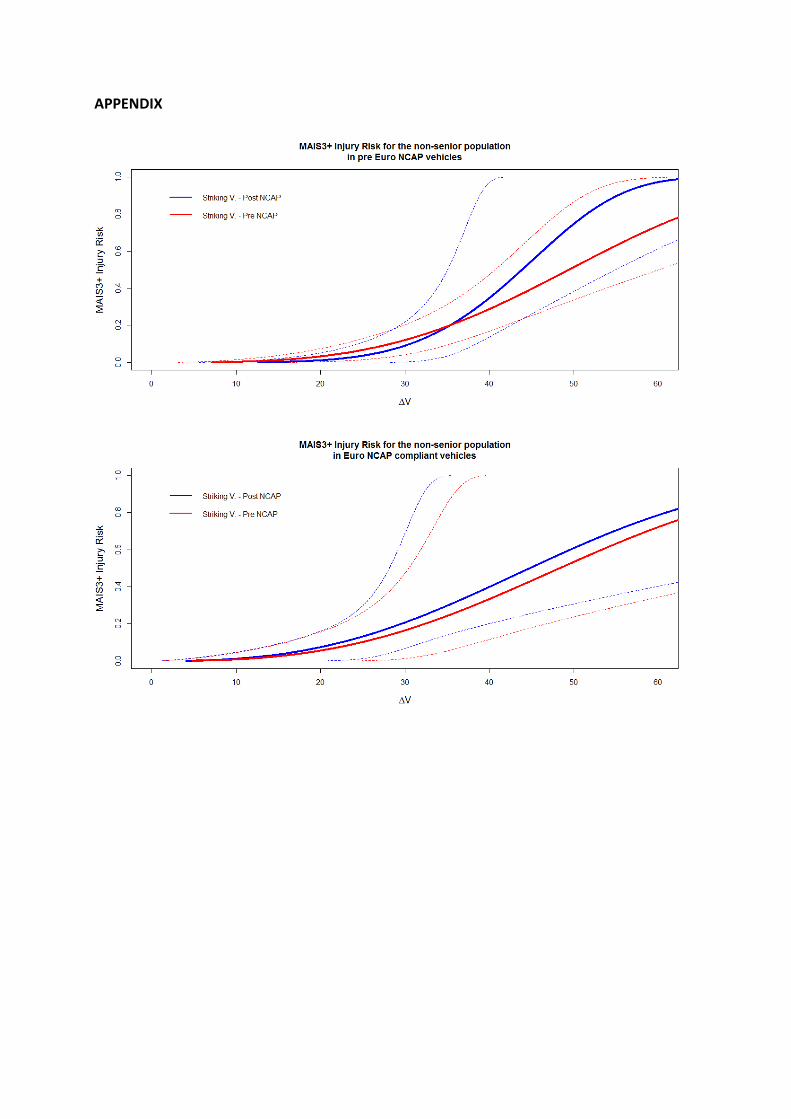
APPENDIX
Comparison of Injury Severity to Near-side and Far-side Occupants in Side
Impacts by Motor Vehicle Crashes
Hee-Young Lee*, Kang-Hyun Lee*, Young-Han Youn**, Ho-Jung Kim***, Sang-Chul Kim****
Department of Emergency Medicine, Wonju College of Medicine, Yonsei University, Wonju, Korea *
Department of Mechatronics Engineering, Korea University of Technology and Education, Cheonan, Korea**
Department of Emergency Medicine, Bucheon Hospital of Soonchunhyang Univerisity, Bucheon, Korea ***
Department of Emergency Medicine, School of Medicine, Konkuk University, Chungju, Korea ****
In this study, we compared the injury severity of occupants according to the seating position and the
crashing direction in motor vehicle accidents. In the driver’s point of view, it was separated the seating
position as ‘Near-side’ and ‘Far-side’. The study subjects were targeted by people who visited 4
regional emergency centers following motor vehicle accidents. Real-world investigation was
performed by direct and indirect methods after patient’s consent. The information of the damaged
vehicle was informed by Collision Deformation Classification (CDC) code and the information of the
injury of patients was informed by using the Abbreviated Injury Score (AIS) and Injury Severity Score
(ISS). When the column 3 in CDC code was P, damaged at the middle part of lateral side, the average
point of AIS 3 was 1.91±1.72 in near-side and 1.02±1.31 in far-side (p<0.01). The average point of
maximum AIS (MAIS) was 2.78±1.39 in near-side and 2.02±1.11 in far-side (p<0.01). The average point
of ISS was 15.74±14.71 in near-side and 8.11±8.39 in far-side (p<0.01). Also, when the column 3 in
CDC code was D, damaged at the whole part of lateral side, it was significant that the average point of
AIS 3 and MAIS in near-side was bigger than in far-side (p=0.02).
Key Words : Motor vehicle crash, Injury analysis, Lateral impact, Near-side, Far-side
Corresponding Author : Kang-Hyun Lee (Wonju College of Medicine, Yonsei University) Tel: +82-33-741-1612

Fax: +82-33-742-3030 E-mail: [email protected]
An evaluation of passive head-restraints with different stiffness and energy dissipation properties for whiplash mitigation
S Himmetoglu*
* Mechanical Engineering Department, Hacettepe University, Beytepe, Ankara 06800, Turkey
Abstract - This study investigates the protection offered by passive head-restraints with different stiffness and energy dissipation properties. For this purpose, computational multi-body models of a generic car seat and a biofidelic 50th-percentile male human for rear impact are used to study different seat designs and passive head-restraints. The validated seat-occupant model is also used in the design of two different car-seat models which are shown to effectively mitigate whiplash by utilising a crash-energy distribution technique. Five different passive head-restraints with varying stiffness (low-medium-high) and energy dissipation percentages (low-high) are successively attached to four different car-seat models. The simulation results indicate that the protection offered by head restraints is strongly dependent on the seat design. It has also been shown that the stiffness of the passive head-restraint has much more influence on whiplash-risk in comparison to its energy dissipation capacity. NOTATION AWD anti-whiplash device C i i th cervical vertebra Ea , Ed , Er energy absorbed, dissipated and returned respectively by HR EDP energy dissipation percentage EMP the medium severity crash pulse in EuroNCAP whiplash test EuroNCAP European New Car Assessment Programme FL , FU normal force generated by HR regarding the loading and unloading curves, respectively Fsh(-), Fsh(+) largest negative and positive shear forces acting on the head respectively at the OC Ftn largest tension force acting on the head at the OC g gravitational acceleration G the inertial coordinate system HR typical passive head-restraint HR1 HR with high stiffness and high EDP HR2 HR with high stiffness and low EDP HR3 HR with low stiffness and high EDP HR4 HR with low stiffness and low EDP HRB baseline HR with medium stiffness and high EDP IIWPG International Insurance Whiplash Prevention Group NDI neck distortion index NIC neck injury criterion by Boström et al. [12] Nkm neck injury criterion by Schmitt et al. [13] OC occipital condyles or upper neck OF the outer-seatback-frame in RFWMS P translational AWD R rotational AWD of ROWMS and WMS, at the recliner R+ rotational AWD of RFWMS, at the recliner R* rotational AWD of RFWMS, connecting OF to the seatback R^ the recliner joint of RONB RFWMS whiplash-mitigating car-seat model with the inner-frame RONB the car-seat model similar to a typical car-seat ROWMS a modified version of WMS T1 the first thoracic vertebra vr maximum resultant head rebound velocity WMS whiplash-mitigating car-seat model x deformation of HR ∆θ IV-UH largest (+/-) intervertebral rotations in the upper half of the neck ∆θ IV-LH largest (+/-) intervertebral rotations in the lower half of the neck ∆V change in the velocity of a vehicle subjected to a crash pulse θOC/C1 intervertebral rotation between OC and C1 θC7/T1 intervertebral rotation between C7 and T1
INTRODUCTION The term “whiplash” is used to describe neck injuries (or disorders) in which the sudden differential movement between the head and torso, leads to damage of soft tissue in the neck. The highest risk of sustaining whiplash injury has been found to occur in rear-end crashes [1,2]. A head restraint with good stiffness and energy absorbing characteristics, positioned at the right height and with an appropriate (small) backset distance, can decrease whiplash risk in rear-end crashes. However, research has shown that seats with good static head-restraint geometry do not always offer good protection dynamically [3,4]. Whiplash can be mitigated by car seats which can reduce occupant acceleration, support the head effectively, reduce ramping and limit seatback rebound [4]. The seat and the head restraint must work in unison to absorb the crash energy effectively so that neck internal motion and neck forces are reduced throughout the impact [4]. Head restraints are an essential part of car seats but there are a few detailed studies on the mechanical properties of typical passive head-restraints. Jakobsson et al. [5] showed an increase in head linear and angular acceleration, neck shear and tensile forces with a stiffer and less energy absorbing head restraint in their computer simulations. Viano [6] evaluated the energy absorption properties of head restraints by conducting tests in which the back cap of a Hybrid III dummy head was impacted vertically on different head restraints using a hydraulic material-testing machine. A high stiffness of the head restraint was considered good because it can limit head displacement and thus neck extension and shear. A high percentage of energy absorption by foam deformation was also favoured since this would reduce rebound velocity. Similarly, a high percentage of energy absorption by metal deformation and a relatively small peak metal displacement was considered good for the same reasons. It was emphasised that a stiff head restraint with good energy absorption properties can provide low head rebound velocity and reduce the differential rebound of the head and torso [6]. In this study, four different car-seat models with different structural characteristics are used. Two of these car-seat models are anti-whiplash seats possessing whiplash-mitigating features. Five different passive head-restraints with varying stiffness (low-medium-high) and energy dissipation percentages (low-high) are successively attached to each of these four different car-seat models. The mechanical properties of the head restraints are derived from the impact tests by Viano [6]. The seat-occupant models are then subjected to the EuroNCAP medium severity crash pulse. It is shown that the performances of the head restraints depend strongly on the dynamic behaviour of seats with different structural characteristics. A SEAT-OCCUPANT SYSTEM FOR REAR IMPACT SIMULATION A biofidelic 50th-percentile male multi-body human model, as shown in Figure 1, was developed using MSC VisualNastran-4D with Matlab-Simulink; and validated using the responses of seven healthy 50th-percentile male volunteers from the Japan Automobile Research Institute (JARI) sled tests [7]. The human model is composed of rigid bodies connected by rotational springs and dampers. The initial configuration of the human model, as shown in Figure 1(b), corresponds to the normal driving posture of a 50th-percentile male who is relaxed and unaware of the timing of the impact. In validating the human model, the rigid-seat used in the JARI sled tests was modelled first and a contact model was developed to simulate the interaction of the human-body segments with the rigid seat surfaces [7]. Based on the JARI rigid-seat, a generic multi-body car-seat model was developed at the same time to implement various energy absorbing devices, seatback, head restraint and recliner properties [4]. A typical passive head-restraint (HR), attached to the seatback as shown in Figure 1(b),
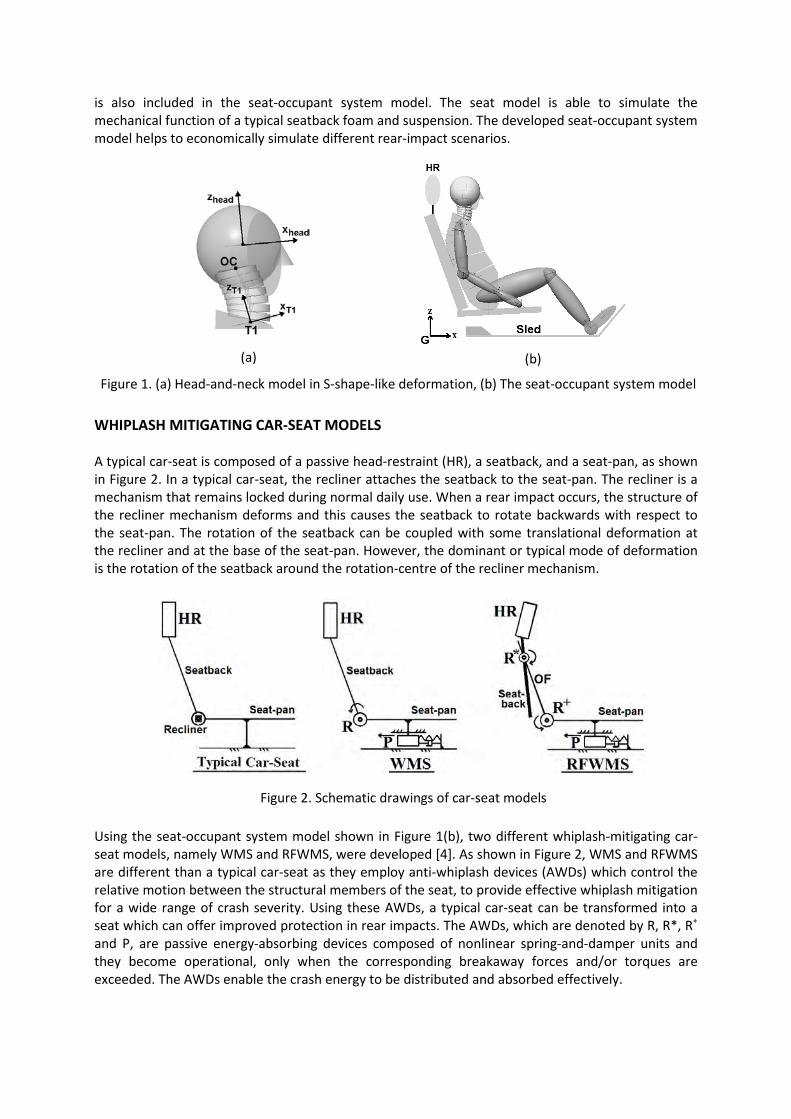
Figure 1. (a) Head-and-neck model in S-shape-like deformation, (b) The seat-occupant system model
(b) (a)
Figure 2. Schematic drawings of car-seat models
is also included in the seat-occupant system model. The seat model is able to simulate the mechanical function of a typical seatback foam and suspension. The developed seat-occupant system model helps to economically simulate different rear-impact scenarios. WHIPLASH MITIGATING CAR-SEAT MODELS A typical car-seat is composed of a passive head-restraint (HR), a seatback, and a seat-pan, as shown in Figure 2. In a typical car-seat, the recliner attaches the seatback to the seat-pan. The recliner is a mechanism that remains locked during normal daily use. When a rear impact occurs, the structure of the recliner mechanism deforms and this causes the seatback to rotate backwards with respect to the seat-pan. The rotation of the seatback can be coupled with some translational deformation at the recliner and at the base of the seat-pan. However, the dominant or typical mode of deformation is the rotation of the seatback around the rotation-centre of the recliner mechanism. Using the seat-occupant system model shown in Figure 1(b), two different whiplash-mitigating car-seat models, namely WMS and RFWMS, were developed [4]. As shown in Figure 2, WMS and RFWMS are different than a typical car-seat as they employ anti-whiplash devices (AWDs) which control the relative motion between the structural members of the seat, to provide effective whiplash mitigation for a wide range of crash severity. Using these AWDs, a typical car-seat can be transformed into a seat which can offer improved protection in rear impacts. The AWDs, which are denoted by R, R*, R+ and P, are passive energy-absorbing devices composed of nonlinear spring-and-damper units and they become operational, only when the corresponding breakaway forces and/or torques are exceeded. The AWDs enable the crash energy to be distributed and absorbed effectively.
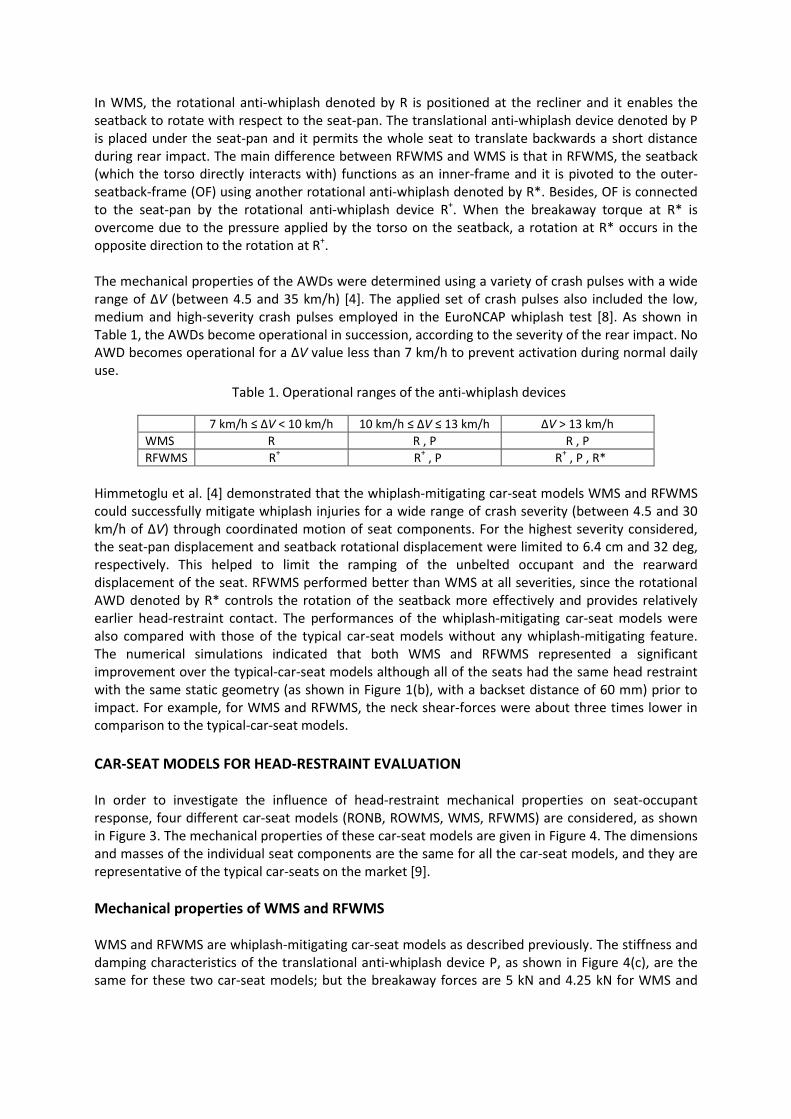
Table 1. Operational ranges of the anti-whiplash devices
In WMS, the rotational anti-whiplash denoted by R is positioned at the recliner and it enables the seatback to rotate with respect to the seat-pan. The translational anti-whiplash device denoted by P is placed under the seat-pan and it permits the whole seat to translate backwards a short distance during rear impact. The main difference between RFWMS and WMS is that in RFWMS, the seatback (which the torso directly interacts with) functions as an inner-frame and it is pivoted to the outer-seatback-frame (OF) using another rotational anti-whiplash denoted by R*. Besides, OF is connected to the seat-pan by the rotational anti-whiplash device R+. When the breakaway torque at R* is overcome due to the pressure applied by the torso on the seatback, a rotation at R* occurs in the opposite direction to the rotation at R+. The mechanical properties of the AWDs were determined using a variety of crash pulses with a wide range of ∆V (between 4.5 and 35 km/h) [4]. The applied set of crash pulses also included the low, medium and high-severity crash pulses employed in the EuroNCAP whiplash test [8]. As shown in Table 1, the AWDs become operational in succession, according to the severity of the rear impact. No AWD becomes operational for a ∆V value less than 7 km/h to prevent activation during normal daily use.
7 km/h ≤ ∆V < 10 km/h 10 km/h ≤ ∆V ≤ 13 km/h ∆V > 13 km/h WMS R R , P R , P RFWMS R+ R+ , P R+ , P , R*
Himmetoglu et al. [4] demonstrated that the whiplash-mitigating car-seat models WMS and RFWMS could successfully mitigate whiplash injuries for a wide range of crash severity (between 4.5 and 30 km/h of ∆V) through coordinated motion of seat components. For the highest severity considered, the seat-pan displacement and seatback rotational displacement were limited to 6.4 cm and 32 deg, respectively. This helped to limit the ramping of the unbelted occupant and the rearward displacement of the seat. RFWMS performed better than WMS at all severities, since the rotational AWD denoted by R* controls the rotation of the seatback more effectively and provides relatively earlier head-restraint contact. The performances of the whiplash-mitigating car-seat models were also compared with those of the typical car-seat models without any whiplash-mitigating feature. The numerical simulations indicated that both WMS and RFWMS represented a significant improvement over the typical-car-seat models although all of the seats had the same head restraint with the same static geometry (as shown in Figure 1(b), with a backset distance of 60 mm) prior to impact. For example, for WMS and RFWMS, the neck shear-forces were about three times lower in comparison to the typical-car-seat models. CAR-SEAT MODELS FOR HEAD-RESTRAINT EVALUATION In order to investigate the influence of head-restraint mechanical properties on seat-occupant response, four different car-seat models (RONB, ROWMS, WMS, RFWMS) are considered, as shown in Figure 3. The mechanical properties of these car-seat models are given in Figure 4. The dimensions and masses of the individual seat components are the same for all the car-seat models, and they are representative of the typical car-seats on the market [9]. Mechanical properties of WMS and RFWMS WMS and RFWMS are whiplash-mitigating car-seat models as described previously. The stiffness and damping characteristics of the translational anti-whiplash device P, as shown in Figure 4(c), are the same for these two car-seat models; but the breakaway forces are 5 kN and 4.25 kN for WMS and
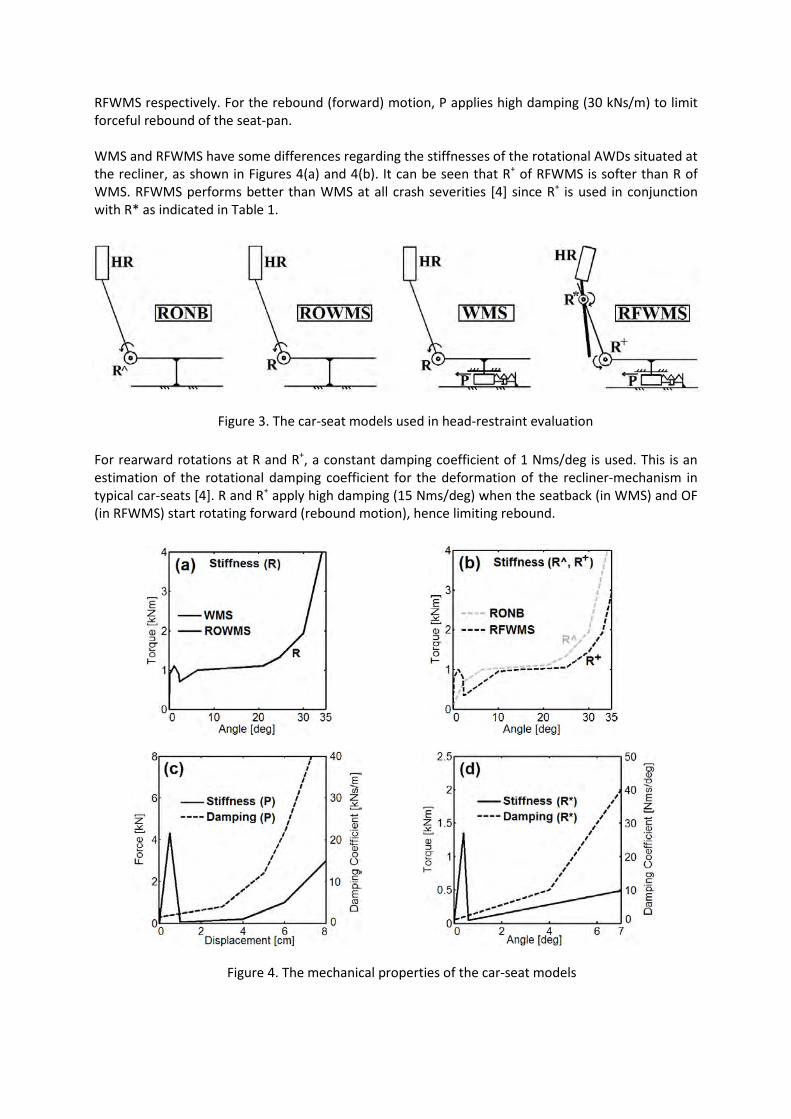
Figure 3. The car-seat models used in head-restraint evaluation
Figure 4. The mechanical properties of the car-seat models
RFWMS respectively. For the rebound (forward) motion, P applies high damping (30 kNs/m) to limit forceful rebound of the seat-pan. WMS and RFWMS have some differences regarding the stiffnesses of the rotational AWDs situated at the recliner, as shown in Figures 4(a) and 4(b). It can be seen that R+ of RFWMS is softer than R of WMS. RFWMS performs better than WMS at all crash severities [4] since R+ is used in conjunction with R* as indicated in Table 1. For rearward rotations at R and R+, a constant damping coefficient of 1 Nms/deg is used. This is an estimation of the rotational damping coefficient for the deformation of the recliner-mechanism in typical car-seats [4]. R and R+ apply high damping (15 Nms/deg) when the seatback (in WMS) and OF (in RFWMS) start rotating forward (rebound motion), hence limiting rebound.
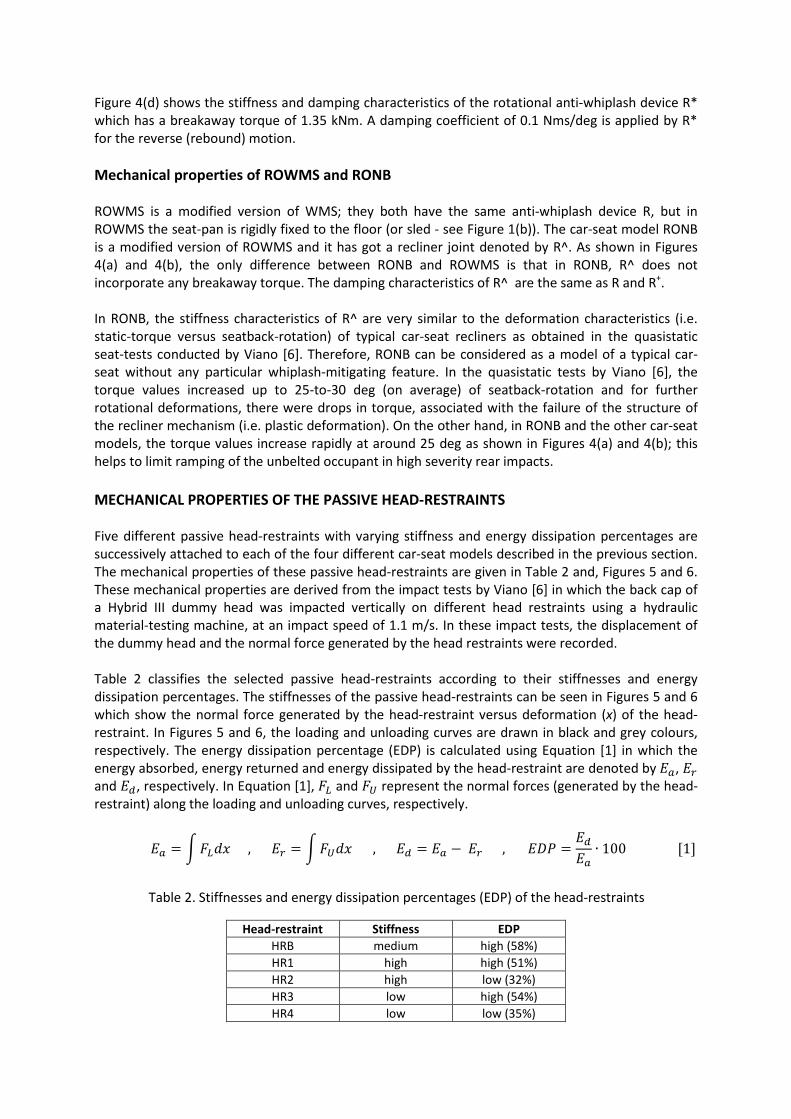
Table 2. Stiffnesses and energy dissipation percentages (EDP) of the head-restraints
Figure 4(d) shows the stiffness and damping characteristics of the rotational anti-whiplash device R* which has a breakaway torque of 1.35 kNm. A damping coefficient of 0.1 Nms/deg is applied by R* for the reverse (rebound) motion. Mechanical properties of ROWMS and RONB ROWMS is a modified version of WMS; they both have the same anti-whiplash device R, but in ROWMS the seat-pan is rigidly fixed to the floor (or sled - see Figure 1(b)). The car-seat model RONB is a modified version of ROWMS and it has got a recliner joint denoted by R^. As shown in Figures 4(a) and 4(b), the only difference between RONB and ROWMS is that in RONB, R^ does not incorporate any breakaway torque. The damping characteristics of R^ are the same as R and R+. In RONB, the stiffness characteristics of R^ are very similar to the deformation characteristics (i.e. static-torque versus seatback-rotation) of typical car-seat recliners as obtained in the quasistatic seat-tests conducted by Viano [6]. Therefore, RONB can be considered as a model of a typical car-seat without any particular whiplash-mitigating feature. In the quasistatic tests by Viano [6], the torque values increased up to 25-to-30 deg (on average) of seatback-rotation and for further rotational deformations, there were drops in torque, associated with the failure of the structure of the recliner mechanism (i.e. plastic deformation). On the other hand, in RONB and the other car-seat models, the torque values increase rapidly at around 25 deg as shown in Figures 4(a) and 4(b); this helps to limit ramping of the unbelted occupant in high severity rear impacts. MECHANICAL PROPERTIES OF THE PASSIVE HEAD-RESTRAINTS Five different passive head-restraints with varying stiffness and energy dissipation percentages are successively attached to each of the four different car-seat models described in the previous section. The mechanical properties of these passive head-restraints are given in Table 2 and, Figures 5 and 6. These mechanical properties are derived from the impact tests by Viano [6] in which the back cap of a Hybrid III dummy head was impacted vertically on different head restraints using a hydraulic material-testing machine, at an impact speed of 1.1 m/s. In these impact tests, the displacement of the dummy head and the normal force generated by the head restraints were recorded. Table 2 classifies the selected passive head-restraints according to their stiffnesses and energy dissipation percentages. The stiffnesses of the passive head-restraints can be seen in Figures 5 and 6 which show the normal force generated by the head-restraint versus deformation (x) of the head-restraint. In Figures 5 and 6, the loading and unloading curves are drawn in black and grey colours, respectively. The energy dissipation percentage (EDP) is calculated using Equation [1] in which the energy absorbed, energy returned and energy dissipated by the head-restraint are denoted by 𝐸𝑎, 𝐸𝑟 and 𝐸𝑑, respectively. In Equation [1], 𝐹𝐿 and 𝐹𝑈 represent the normal forces (generated by the head-restraint) along the loading and unloading curves, respectively.
𝐸𝑎 = �𝐹𝐿𝑑𝑑 , 𝐸𝑟 = �𝐹𝑈𝑑𝑑 , 𝐸𝑑 = 𝐸𝑎 − 𝐸𝑟 , 𝐸𝐸𝐸 =𝐸𝑑𝐸𝑎
∙ 100 [1]
Head-restraint Stiffness EDP HRB medium high (58%) HR1 high high (51%) HR2 high low (32%) HR3 low high (54%) HR4 low low (35%)
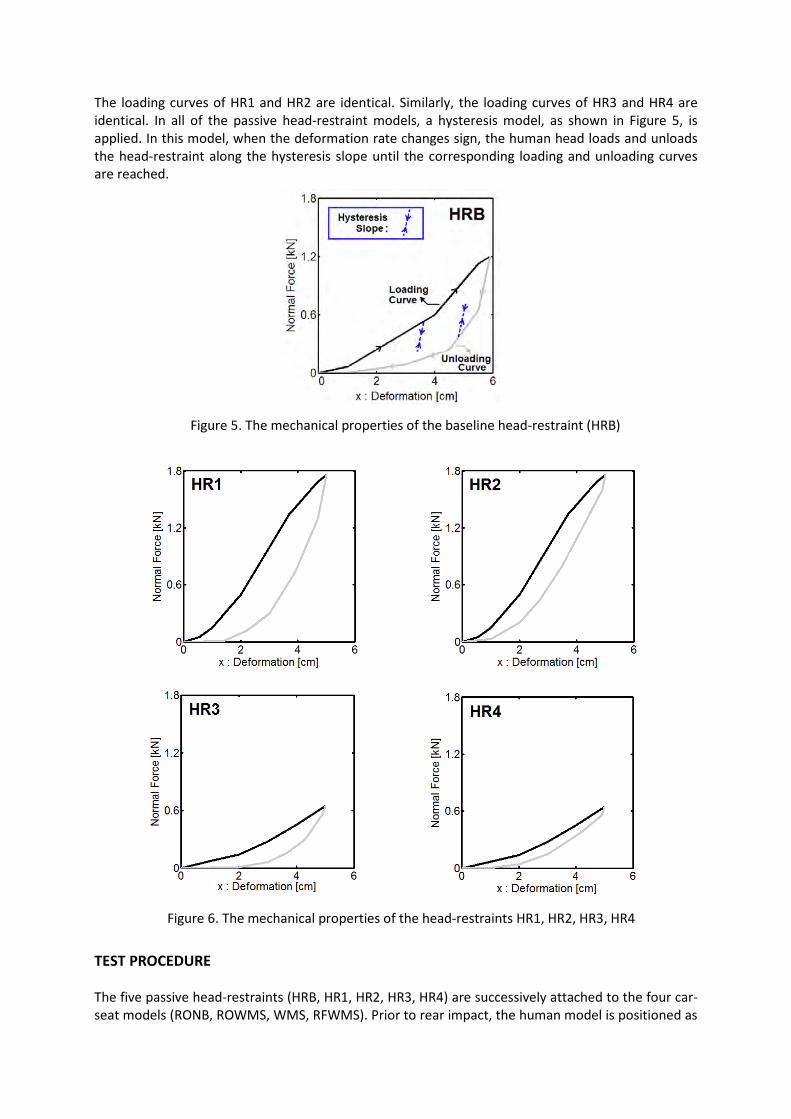
Figure 5. The mechanical properties of the baseline head-restraint (HRB)
Figure 6. The mechanical properties of the head-restraints HR1, HR2, HR3, HR4
The loading curves of HR1 and HR2 are identical. Similarly, the loading curves of HR3 and HR4 are identical. In all of the passive head-restraint models, a hysteresis model, as shown in Figure 5, is applied. In this model, when the deformation rate changes sign, the human head loads and unloads the head-restraint along the hysteresis slope until the corresponding loading and unloading curves are reached. TEST PROCEDURE The five passive head-restraints (HRB, HR1, HR2, HR3, HR4) are successively attached to the four car-seat models (RONB, ROWMS, WMS, RFWMS). Prior to rear impact, the human model is positioned as
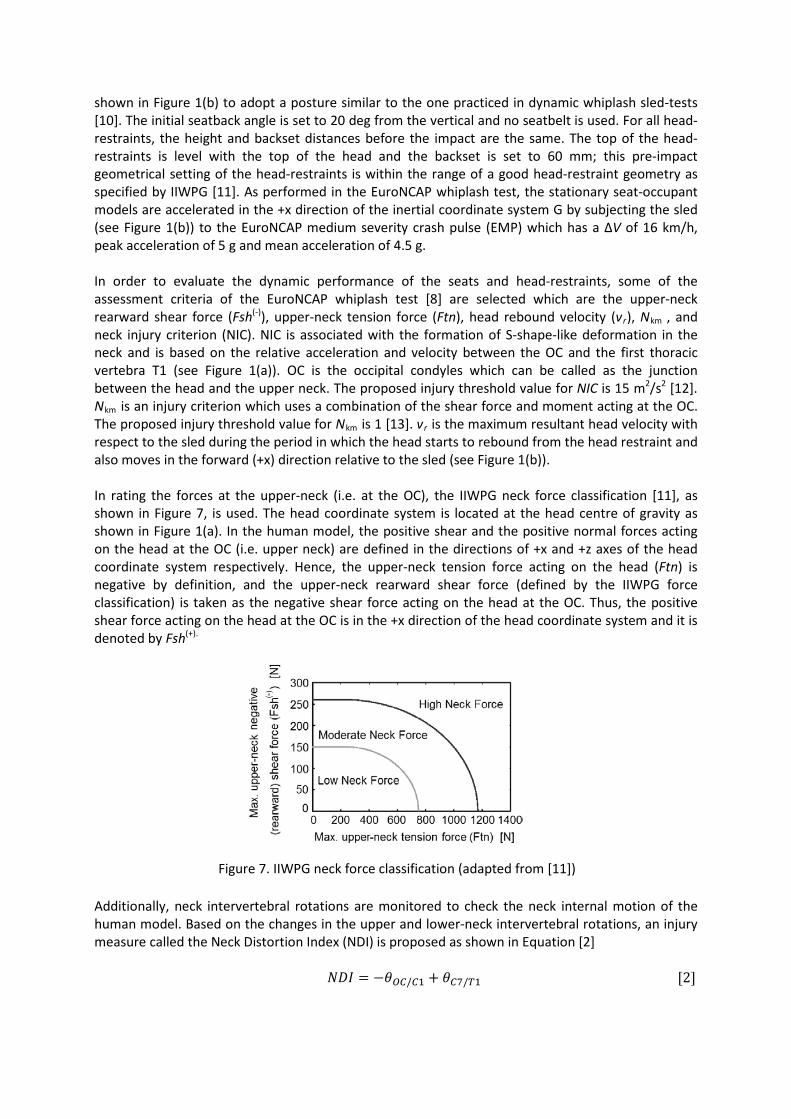
Figure 7. IIWPG neck force classification (adapted from [11])
shown in Figure 1(b) to adopt a posture similar to the one practiced in dynamic whiplash sled-tests [10]. The initial seatback angle is set to 20 deg from the vertical and no seatbelt is used. For all head-restraints, the height and backset distances before the impact are the same. The top of the head-restraints is level with the top of the head and the backset is set to 60 mm; this pre-impact geometrical setting of the head-restraints is within the range of a good head-restraint geometry as specified by IIWPG [11]. As performed in the EuroNCAP whiplash test, the stationary seat-occupant models are accelerated in the +x direction of the inertial coordinate system G by subjecting the sled (see Figure 1(b)) to the EuroNCAP medium severity crash pulse (EMP) which has a ∆V of 16 km/h, peak acceleration of 5 g and mean acceleration of 4.5 g. In order to evaluate the dynamic performance of the seats and head-restraints, some of the assessment criteria of the EuroNCAP whiplash test [8] are selected which are the upper-neck rearward shear force (Fsh(-)), upper-neck tension force (Ftn), head rebound velocity (vr), Nkm , and neck injury criterion (NIC). NIC is associated with the formation of S-shape-like deformation in the neck and is based on the relative acceleration and velocity between the OC and the first thoracic vertebra T1 (see Figure 1(a)). OC is the occipital condyles which can be called as the junction between the head and the upper neck. The proposed injury threshold value for NIC is 15 m2/s2 [12]. Nkm is an injury criterion which uses a combination of the shear force and moment acting at the OC. The proposed injury threshold value for Nkm is 1 [13]. vr is the maximum resultant head velocity with respect to the sled during the period in which the head starts to rebound from the head restraint and also moves in the forward (+x) direction relative to the sled (see Figure 1(b)). In rating the forces at the upper-neck (i.e. at the OC), the IIWPG neck force classification [11], as shown in Figure 7, is used. The head coordinate system is located at the head centre of gravity as shown in Figure 1(a). In the human model, the positive shear and the positive normal forces acting on the head at the OC (i.e. upper neck) are defined in the directions of +x and +z axes of the head coordinate system respectively. Hence, the upper-neck tension force acting on the head (Ftn) is negative by definition, and the upper-neck rearward shear force (defined by the IIWPG force classification) is taken as the negative shear force acting on the head at the OC. Thus, the positive shear force acting on the head at the OC is in the +x direction of the head coordinate system and it is denoted by Fsh(+). Additionally, neck intervertebral rotations are monitored to check the neck internal motion of the human model. Based on the changes in the upper and lower-neck intervertebral rotations, an injury measure called the Neck Distortion Index (NDI) is proposed as shown in Equation [2] 𝑁𝐸𝑁 = −𝜃𝑂𝑂/𝑂1 + 𝜃𝑂7/𝑇1 [2]
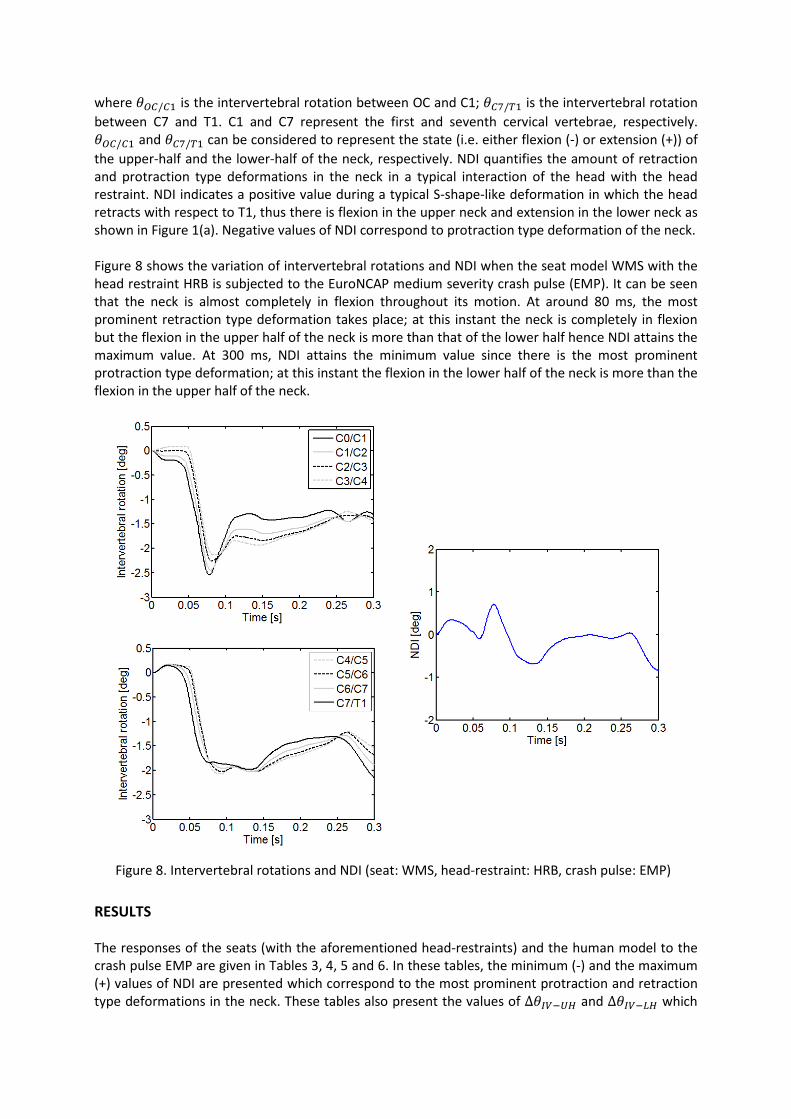
Figure 8. Intervertebral rotations and NDI (seat: WMS, head-restraint: HRB, crash pulse: EMP)
where 𝜃𝑂𝑂/𝑂1 is the intervertebral rotation between OC and C1; 𝜃𝑂7/𝑇1 is the intervertebral rotation between C7 and T1. C1 and C7 represent the first and seventh cervical vertebrae, respectively. 𝜃𝑂𝑂/𝑂1 and 𝜃𝑂7/𝑇1 can be considered to represent the state (i.e. either flexion (-) or extension (+)) of the upper-half and the lower-half of the neck, respectively. NDI quantifies the amount of retraction and protraction type deformations in the neck in a typical interaction of the head with the head restraint. NDI indicates a positive value during a typical S-shape-like deformation in which the head retracts with respect to T1, thus there is flexion in the upper neck and extension in the lower neck as shown in Figure 1(a). Negative values of NDI correspond to protraction type deformation of the neck. Figure 8 shows the variation of intervertebral rotations and NDI when the seat model WMS with the head restraint HRB is subjected to the EuroNCAP medium severity crash pulse (EMP). It can be seen that the neck is almost completely in flexion throughout its motion. At around 80 ms, the most prominent retraction type deformation takes place; at this instant the neck is completely in flexion but the flexion in the upper half of the neck is more than that of the lower half hence NDI attains the maximum value. At 300 ms, NDI attains the minimum value since there is the most prominent protraction type deformation; at this instant the flexion in the lower half of the neck is more than the flexion in the upper half of the neck. RESULTS The responses of the seats (with the aforementioned head-restraints) and the human model to the crash pulse EMP are given in Tables 3, 4, 5 and 6. In these tables, the minimum (-) and the maximum (+) values of NDI are presented which correspond to the most prominent protraction and retraction type deformations in the neck. These tables also present the values of ∆𝜃𝐼𝐼−𝑈𝑈 and ∆𝜃𝐼𝐼−𝐿𝑈 which

Table 3. Response of the seat-occupant system with different head-restraints (seat: WMS)
Table 4. Response of the seat-occupant system with different head-restraints (seat: RFWMS)
Table 5. Response of the seat-occupant system with different head-restraints (seat: ROWMS)
involve the maximum (i.e. largest (+)) and minimum (i.e. largest (-)) values of the intervertebral rotations in the upper half and lower half of the neck, respectively. In order to see the effects of head-restraint contact on neck internal motion, the maximum and minimum values of NDI, ∆𝜃𝐼𝐼−𝑈𝑈 and ∆𝜃𝐼𝐼−𝐿𝑈 are recorded before the pelvis contacts the seat-pan in the rebound phase. The injury criteria Fsh(-), Nkm , NIC, NDI and vr in Tables 3-6 are especially chosen since these are considered to be sufficient in differentiating between the dynamic performance of the seats and head restraints. Schmitt and Muser [14] made a sensitivity analysis of the criteria in the EuroNCAP dynamic whiplash test and they demonstrated that Nkm, NIC and vr formed a sufficient set of criteria that was able to rate the rear-impact performance of seats accurately.
HR Fsh(-) [N] Fsh(+) [N] Ftn [N] Nkm NDI [deg] ∆θ IV-UH [deg]
∆θ IV-LH [deg]
NIC [m2/s2] vr [m/s]
HRB -166 21.8 -147 0.40 0.71 -0.69
0.09 -2.55
0.17 -2.15 9.90 1.29
HR1 -205 25.2 -81.3 0.47 0.44 -2.79
0.09 -2.32
0.17 -2.87 9.90 1.1
HR2 -205 17.3 -81.3 0.47 0.44 -2.8
0.09 -2.32
0.17 -2.89 9.90 1.2
HR3 -142 17.3 -223 0.33 0.87 -0.09
0.09 -2.65
0.17 -2.19 9.90 1.27
HR4 -142 17.3 -223 0.325 0.87 -0.41
0.09 -2.65
0.17 -2.19 9.90 1.39
HR Fsh(-) [N] Fsh(+) [N] Ftn [N] Nkm NDI [deg] ∆θ IV-UH [deg]
∆θ IV-LH [deg]
NIC [m2/s2] vr [m/s]
HRB -136 17.1 0 0.43 0.51 -2.1
0.39 -2.02
0.17 -1.72 11.1 0.99
HR1 -145 20.6 0 0.36 0.35 -3.21
0.76 -1.63
0.17 -2.47 9.76 0.90
HR2 -145 14.6 0 0.36 0.35 -3.21
0.76 -1.64
0.17 -2.47 9.76 0.94
HR3 -130 14.6 0 0.44 1.03 -1.12
0.12 -2.26
0.17 -1.60 10.9 1.01
HR4 -130 14.6 0 0.44 1.03 -1.64
0.27 -2.26
0.17 -1.67 10.9 1.08
HR Fsh(-) [N] Fsh(+) [N] Ftn [N] Nkm NDI [deg] ∆θ IV-UH [deg]
∆θ IV-LH [deg]
NIC [m2/s2] vr [m/s]
HRB -232 8.3 -207 0.61 0.28 -1.73
0.08 -3.18
0.13 -3.31 8.88 1.52
HR1 -273 24.5 -124 0.65 0.28 -3.67
0.08 -2.90
0.13 -3.74 8.88 1.24
HR2 -273 8.3 -124 0.65 0.28 -3.68
0.08 -2.90
0.13 -3.75 8.88 1.42
HR3 -247 12.1 -287 0.68 0.28 -1.62
0.08 -3.37
0.13 -3.39 8.88 1.44
HR4 -246 8.3 -287 0.68 0.28 -1.95
0.08 -3.37
0.13 -3.39 8.88 1.55
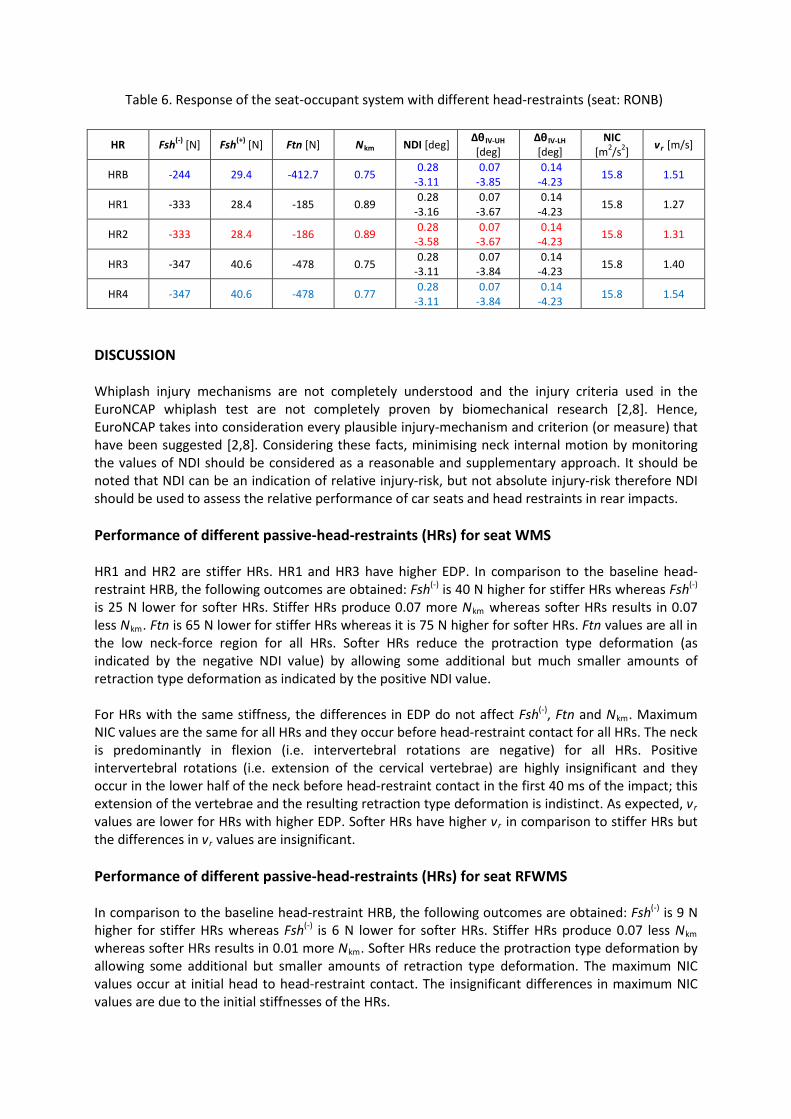
Table 6. Response of the seat-occupant system with different head-restraints (seat: RONB)
HR Fsh(-) [N] Fsh(+) [N] Ftn [N] Nkm NDI [deg] ∆θ IV-UH [deg]
∆θ IV-LH [deg]
NIC [m2/s2] vr [m/s]
HRB -244 29.4 -412.7 0.75 0.28 -3.11
0.07 -3.85
0.14 -4.23 15.8 1.51
HR1 -333 28.4 -185 0.89 0.28 -3.16
0.07 -3.67
0.14 -4.23 15.8 1.27
HR2 -333 28.4 -186 0.89 0.28 -3.58
0.07 -3.67
0.14 -4.23 15.8 1.31
HR3 -347 40.6 -478 0.75 0.28 -3.11
0.07 -3.84
0.14 -4.23 15.8 1.40
HR4 -347 40.6 -478 0.77 0.28 -3.11
0.07 -3.84
0.14 -4.23 15.8 1.54
DISCUSSION Whiplash injury mechanisms are not completely understood and the injury criteria used in the EuroNCAP whiplash test are not completely proven by biomechanical research [2,8]. Hence, EuroNCAP takes into consideration every plausible injury-mechanism and criterion (or measure) that have been suggested [2,8]. Considering these facts, minimising neck internal motion by monitoring the values of NDI should be considered as a reasonable and supplementary approach. It should be noted that NDI can be an indication of relative injury-risk, but not absolute injury-risk therefore NDI should be used to assess the relative performance of car seats and head restraints in rear impacts. Performance of different passive-head-restraints (HRs) for seat WMS HR1 and HR2 are stiffer HRs. HR1 and HR3 have higher EDP. In comparison to the baseline head-restraint HRB, the following outcomes are obtained: Fsh(-) is 40 N higher for stiffer HRs whereas Fsh(-) is 25 N lower for softer HRs. Stiffer HRs produce 0.07 more Nkm whereas softer HRs results in 0.07 less Nkm. Ftn is 65 N lower for stiffer HRs whereas it is 75 N higher for softer HRs. Ftn values are all in the low neck-force region for all HRs. Softer HRs reduce the protraction type deformation (as indicated by the negative NDI value) by allowing some additional but much smaller amounts of retraction type deformation as indicated by the positive NDI value. For HRs with the same stiffness, the differences in EDP do not affect Fsh(-), Ftn and Nkm. Maximum NIC values are the same for all HRs and they occur before head-restraint contact for all HRs. The neck is predominantly in flexion (i.e. intervertebral rotations are negative) for all HRs. Positive intervertebral rotations (i.e. extension of the cervical vertebrae) are highly insignificant and they occur in the lower half of the neck before head-restraint contact in the first 40 ms of the impact; this extension of the vertebrae and the resulting retraction type deformation is indistinct. As expected, vr values are lower for HRs with higher EDP. Softer HRs have higher vr in comparison to stiffer HRs but the differences in vr values are insignificant. Performance of different passive-head-restraints (HRs) for seat RFWMS In comparison to the baseline head-restraint HRB, the following outcomes are obtained: Fsh(-) is 9 N higher for stiffer HRs whereas Fsh(-) is 6 N lower for softer HRs. Stiffer HRs produce 0.07 less Nkm whereas softer HRs results in 0.01 more Nkm. Softer HRs reduce the protraction type deformation by allowing some additional but smaller amounts of retraction type deformation. The maximum NIC values occur at initial head to head-restraint contact. The insignificant differences in maximum NIC values are due to the initial stiffnesses of the HRs.
Ftn is zero for all HRs. For HRs with the same stiffness, the differences in EDP do not affect Fsh(-), Ftn, Nkm and NIC. The neck is predominantly in flexion for all HRs. Maximum positive intervertebral rotation occurs at the OC/C1 joint at around maximum HR deformation during the rebound of the head from the HR for all HRs. vr values are lower for HRs with higher EDP and softer HRs have higher vr in comparison to stiffer HRs. The differences in Fsh(-), Nkm , NIC and vr are quite insignificant. Performance of different passive-head-restraints (HRs) for seat ROWMS HR3 and HR4 bottom-out and the head loads the HR structure directly as a result of this. Consequently, the following outcomes are obtained in comparison to the baseline head-restraint HRB: Fsh(-) is 40 N higher for stiffer HRs whereas Fsh(-) is 15 N higher for softer HRs. Stiffer HRs produce 0.04 more Nkm whereas softer HRs results in 0.07 more Nkm. Ftn is 83 N lower for stiffer HRs whereas it is 80 N higher for softer HRs. Ftn values are all in the low neck-force region for all HRs. Softer HRs reduce the protraction type deformation while the insignificant amount of retraction type of deformation is the same for all HRs. For HRs with the same stiffness, the differences in EDP do not affect Fsh(-), Ftn, Nkm and NIC. Maximum NIC values are the same for all HRs and they occur before head-restraint contact for all HRs. The neck is predominantly in flexion for all HRs. Extension of the cervical vertebrae are highly insignificant and they occur in the lower half of the neck before head-restraint contact in the first 40 ms of the impact; this extension of the vertebrae and the resulting retraction type deformation is indistinct. vr values are lower for HRs with higher EDP and softer HRs have higher vr in comparison to stiffer HRs but these differences are insignificant. Performance of different passive-head-restraints (HRs) for seat RONB HR3 and HR4 bottom-out. Therefore in comparison to the baseline head-restraint HRB, the following outcomes are obtained: Fsh(-) is 90 N higher for stiffer HRs whereas Fsh(-) is 100 N higher for softer HRs. Stiffer HRs produce 0.14 more Nkm whereas softer HRs have almost the same Nkm as HRB. Ftn is 230 N lower for stiffer HRs whereas it is 65 N higher for softer HRs. Softer HRs reduce slightly the protraction type deformation while the insignificant amount of retraction type of deformation is the same for all HRs. For HRs with the same stiffness, the differences in EDP do not affect Fsh(-), Ftn, Nkm and NIC. Maximum NIC values are the same for all HRs and they occur before head-restraint contact for all HRs. The neck is predominantly in flexion for all HRs. Similar to seats ROWMS and WMS, Extension of the cervical vertebrae are highly insignificant and indistinct. vr values are lower for HRs with higher EDP and softer HRs have higher vr in comparison to stiffer HRs but these differences are insignificant. Comparison of the performances of seats WMS, RFWMS, ROWMS and RONB RONB produces the highest risk of whiplash since it results in the largest neck internal motion, and the largest OC forces and moments. The poor performance of RONB stems from the fact that the seatback of RONB begins to rotate early and rapidly after the onset of the impact, leading to poor support of the head and torso throughout the impact. This excessive rotation of the seatback during the first 90 ms causes the head to flex significantly relative to the upper torso; thus head restraint contact time is extended excessively. Consequently, the head interacts with the head restraint severely. RONB does not have any particular whiplash-mitigating feature. The recliner-joint R^ is only involved in energy absorption and since R^ is not strong enough by itself, the seatback yields quite easily and ineffectively. Another shortcoming of RONB is the lack of breakaway torque in the mechanical properties of R^. A relatively small breakaway torque at the recliner can enable the torso
to sink into the seatback structure without excessive rotation of the seatback at the start of the impact. RONB also shows the highest sensitivity to differences in the stiffness of HRs regarding Fsh(-), Nkm and Ftn values. On the other hand, RONB shows the least sensitivity to differences in the stiffness and energy absorption capacity of HRs regarding NDI values and the intervertebral rotations; thus neck internal motion cannot be reduced by RONB no matter which HR is used. The only difference between RONB and ROWMS is the breakaway torque that ROWMS has for the anti-whiplash device (R) at the recliner (see Figures 3 and 4). This relatively small breakaway torque improves seat performance appreciably (in comparison to RONB). For ROWMS, Fsh(-) values are in the high or moderate-force region for all HRs and this indicates a relatively higher risk of whiplash. Compared to WMS and RFWMS, ROWMS also produces larger Ftn, Nkm values and larger intervertebral rotations. The reason is that the head and the torso are not supported effectively enough by ROWMS. On the other hand, WMS and RFWMS control the rotation of the seatback more effectively and provide earlier head-restraint contact. RFWMS has three different anti-whiplash devices that control the motion of the seat components and it is the best performing car-seat model on the whole. RFWMS achieves this performance by utilising an inner-frame which controls the rotation of the seatback more effectively and provides relatively earlier head-restraint contact. In RFWMS, the seat-pan motion (at P) and the inner-frame rotation (at R*) prevent excessive rotation of the seatback and at the same time, provide early and more effective head-support. More information on WMS and RFWMS can be found in reference [4]. For all seats, the maximum NIC values are not affected by the mechanical properties of HRs since this maximum value typically occurs before or at initial head to head restraint contact. For all seats, Fsh(+)
values are very low but the occurrence of Fsh(+) is insignificant and not easy to interpret. For all seats, vr values are low [15] but in comparison to WMS and RFWMS, ROWMS and RONB produce larger vr since head interacts with the head restraint severely due to ineffective support of the seatback. RFWMS produces the lowest vr values. Due to the larger deformations of softer HRs and the shape of the force versus deformation graphs of HRs, vr values for softer HRs are slightly higher. For all seats and HRs, S-shape-like deformation (i.e. retraction type deformation) is not significant as observed visually in the simulations and as indicated by the amount of positive NDI values. For all seats (except RONB), stiffer HRs induce notable protraction type deformation (as indicated by the negative NDI values) which is still not pronounced as observed visually in the simulations. Except RFWMS, Ftn is higher for softer HRs since softer HRs produce lower normal forces which in turn lead to lower friction forces opposing the upward motion of the head along the head-restraint. A clear correlation between Nkm and HR stiffness is not found but the relative percent change in Nkm (with respect to the baseline HR) is below 18 % for all seats. The relationship between neck forces/moments and NDI is worth investigating. If RONB (with HR2) is compared to WMS (with HR1), it can be seen that the seat-HR combination with larger negative NDI has larger neck forces/moments. If ROWMS (with HR3) is compared to RFWMS (with HR2), it can be seen that the seat-HR combination with smaller NDI has much larger neck forces/moments. If RFWMS (with HR1) is compared to WMS (with HR1), it can be seen that the seat-HR combination with larger NDI has smaller neck forces/moments. Hence, one should use NDI as a complementary injury measure together with injury measures involving neck forces/moments. WMS (with HR3) and RFWMS (with HR3) are the two best seat-and-HR combinations as they provide lower neck forces/moments, and lower neck internal motion. However, RFWMS should be considered as the best performing seat since it shows the least sensitivity to differences in the stiffness and energy dissipation capacity of HRs. WMS and RFWMS perform better when they are used with softer HRs but the performance of these seats in high severity impacts should be tested to see whether the softer HRs bottom-out or not.
CONCLUSIONS In this study, five different passive-head-restraints (HRs) with varying stiffness and energy dissipation percentages (i.e. capacities) are attached to four different car-seat models. The seat-occupant models are subjected to the EuroNCAP medium severity crash pulse. Among the car-seat models, there are two whiplash mitigating car-seats named WMS and RFWMS which utilise a crash-energy distribution technique. The results indicate that the protection offered by HRs is strongly dependent on seat design. It is shown that the stiffness of the HR has much more influence on whiplash-risk in comparison to its energy dissipation percentage (EDP). The influence of energy dissipation percentage of the HRs on neck protection is minimal. Softer HRs provide better neck protection than stiffer HRs unless they bottom-out. Hence, well-designed seats perform much better when softer HRs are used. An injury measure called Neck Distortion Index (NDI) is proposed which quantifies the amount of retraction and protraction type deformations in the neck. NDI should be used as a complementary injury measure in addition to the injury criteria (or measures) in the literature. It is shown that the seat-HR combinations which allow some small amounts of retraction, reduce Fsh(-) values unless HR bottoms-out. In general, softer HRs cause more flexion in the upper half of the neck but less flexion in the lower half of the neck. On the whole, stiffer HRs cause less flexion in the upper half of the neck but more flexion in the upper half of the neck. Poorly performing seats (ROWMS and RONB) cause much larger flexion of the cervical vertebrae. RFWMS which is one of the whiplash mitigating car-seats, shows a robust performance since it shows the least sensitivity to differences in the stiffness and energy dissipation capability of HRs. Hence, the results of this study can help to select or design an optimum passive head-restraint for whiplash mitigation. REFERENCES 1 V Eis, P Fay, and R Sferco, 'A detailed analysis of the characteristics of European rear impacts', Proc of 19th ESV Conf, Washington DC, USA, National Highway Traffic Safety Administration, 2005, paper 05-0385-O.
2 M Avery, E Giblen, A M Weekes, and D S Zuby, 'Developments in dynamic whiplash assessment procedures', Int Conf on Neck Injuries in Road Traffic and Prevention Strategies, Munich, Germany, TÜV SÜD Akademie GmbH, 2007.
3 M Edwards, S Smith, D S Zuby, and A K Lund, ‘Improved seat and head restraint evaluations’, Proc of 19th ESV Conf, Washington DC, USA, National Highway Traffic Safety Administration, 2005, paper 05-0374-O.
4 S Himmetoglu, M Acar, K Bouazza-Marouf, and A J Taylor, 'Car-seat design to improve rear-impact protection', Proc of IMechE Part D: Journal of Automobile Engineering, 2011, Vol.225, 441-459.
5 L Jakobsson, H Norin, C Jernström, S E Svensson, P Johnsen, I Isaksson-Hellman, and M Y Svensson, 'Analysis of different head and neck responses in rear-end car collisions using a new humanlike mathematical model', Proc of the Int IRCOBI Conf, Lyon, France, International Research Council on Biomechanics of Injury, 1994.
6 D C Viano, Role of the seat in rear crash safety, Society of Automotive Engineers, Warrendale, PA, USA, 2002.
7 S Himmetoglu, M Acar, K Bouazza-Marouf, and A J Taylor, 'A multi-body human model for rear-impact simulation', Proc of IMechE Part D: Journal of Automobile Engineering, 2009, Vol.223, 623-638.
8 M van Ratingen, J Ellway, M Avery, P Gloyns, V Sandner, and T Versmissen, 'The EuroNCAP whiplash test', Proc of the 21st ESV Conf, Stuttgart, Germany, National Highway Traffic Safety Administration, 2009, paper 09-0231.
9 M M Verver, Numerical tools for comfort analyses of automotive seating, PhD Thesis, Eindhoven University of Technology, Eindhoven, The Netherlands, 2004.
10 The dynamic assessment of car seats for neck injury protection testing protocol, EuroNCAP, 2014.
11 RCAR-IIWPG seat/head restraint evaluation protocol, International Insurance Whiplash Prevention Group (IIWPG), 2008.
12 O Boström, M Y Svensson, B Aldman, H A Hansson, Y Håland, P Lövsund, T Seeman, A Suneson, A Säljö, and T Örtengren, ‘A new neck injury criterion candidate-based on injury findings in the cervical spinal ganglia after experimental neck extension trauma’, Proc of the Int IRCOBI Conf, Dublin, Ireland, IRCOBI, 1996.
13 K-U Schmitt, M H Muser, and P Niederer, ‘A new neck injury criterion candidate for rear-end collisions taking into account shear forces and bending moments’, Proc of 17th ESV Conf, Amsterdam, The Netherlands, National Highway Traffic Safety Administration, 2001, paper 124.

14 K-U Schmitt and M Muser, ‘Evaluating recent seat models in rear-end impacts according to currently discussed consumer test proposals’, Proc of 21st ESV Conf, Stuttgart, Germany, National Highway Traffic Safety Administration, 2009, paper 09-0116.
15 M Krafft, A Kullgren, and C Tingvall, ‘Assessment of whiplash protection in rear impacts - crash tests and real-life crashes’, Swedish National Road Administration, Stockholm, Sweden, 2004.
OCCUPANT RETENTION IN REAR IMPACT
Steven E. Meyer*, Brian Herbst**, Arin Nelson*, Jeremy McMillin*, Davis Hock* *Safety Analysis & Forensic Engineering (S.A.F.E.) **SAFE Laboratories 475 Pine Avenue Goleta, CA 93117 USA Tele: 805-964-0676 Fax: 805-964-7669 Contact: Arin Oliver Nelson [email protected]
ABSTRACT From an automotive safety occupant protection standpoint, effective occupant restraint
requires a system capable of providing non-injurious occupant ride down of anticipated crash forces. This is not only the case for frontal collisions, where occupant restraint is provided primarily by seatbelts and airbags, but is also critical for other crash modes such as side impacts, rear impacts, rollovers, as well as multiple impact events. In the rear impact crash mode, occupant restraint is provided primarily by the seatbacks and to some extent the seatbelts.
Foundationally, therefore, what becomes fundamental to the seatback’s role in rear occupant protection is its ability to contain the occupant within the seat, preventing occupant ramping, as well as preventing the seat’s, and/or its occupant’s, dangerous intrusion into the rear occupant’s survival space where contact with rear compartment components and/ or rear seated occupants can present a significant injury risk.
An analysis is presented of a series of rear impact sled testing conducted by the authors that evaluates the timing, position and extent of the front seatback’s reward displacement toward and into the rear occupant compartment as well as consideration of the front seat occupant’s ramping potential and its injury potential relative to the rear compartment. Additionally, three other series of testing are presented which assess various seat designs occupant retention capabilities. Lastly, a matched-pair comparison test series is presented which evaluates occupant motion in rear impact with and without use of a typical vehicle body mounted 3-point seatbelt. Discussion of restraint system performance observed in all the testing is included along with ATD biofidelity and thigh-gap considerations. The data collected and presented includes accelerometer instrumentation and high speed video analysis.
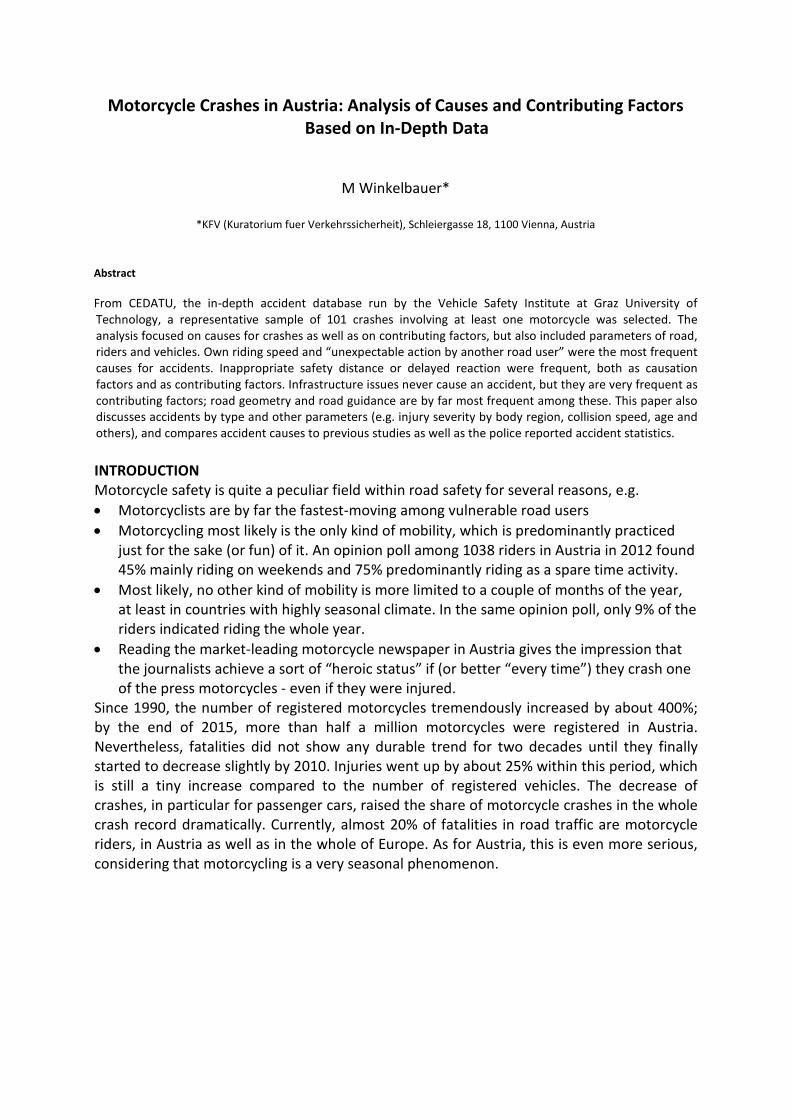
Motorcycle Crashes in Austria: Analysis of Causes and Contributing Factors Based on In-Depth Data
M Winkelbauer*
*KFV (Kuratorium fuer Verkehrssicherheit), Schleiergasse 18, 1100 Vienna, Austria
Abstract From CEDATU, the in-depth accident database run by the Vehicle Safety Institute at Graz University of Technology, a representative sample of 101 crashes involving at least one motorcycle was selected. The analysis focused on causes for crashes as well as on contributing factors, but also included parameters of road, riders and vehicles. Own riding speed and “unexpectable action by another road user” were the most frequent causes for accidents. Inappropriate safety distance or delayed reaction were frequent, both as causation factors and as contributing factors. Infrastructure issues never cause an accident, but they are very frequent as contributing factors; road geometry and road guidance are by far most frequent among these. This paper also discusses accidents by type and other parameters (e.g. injury severity by body region, collision speed, age and others), and compares accident causes to previous studies as well as the police reported accident statistics. INTRODUCTION Motorcycle safety is quite a peculiar field within road safety for several reasons, e.g. • Motorcyclists are by far the fastest-moving among vulnerable road users • Motorcycling most likely is the only kind of mobility, which is predominantly practiced
just for the sake (or fun) of it. An opinion poll among 1038 riders in Austria in 2012 found 45% mainly riding on weekends and 75% predominantly riding as a spare time activity.
• Most likely, no other kind of mobility is more limited to a couple of months of the year, at least in countries with highly seasonal climate. In the same opinion poll, only 9% of the riders indicated riding the whole year.
• Reading the market-leading motorcycle newspaper in Austria gives the impression that the journalists achieve a sort of “heroic status” if (or better “every time”) they crash one of the press motorcycles - even if they were injured.
Since 1990, the number of registered motorcycles tremendously increased by about 400%; by the end of 2015, more than half a million motorcycles were registered in Austria. Nevertheless, fatalities did not show any durable trend for two decades until they finally started to decrease slightly by 2010. Injuries went up by about 25% within this period, which is still a tiny increase compared to the number of registered vehicles. The decrease of crashes, in particular for passenger cars, raised the share of motorcycle crashes in the whole crash record dramatically. Currently, almost 20% of fatalities in road traffic are motorcycle riders, in Austria as well as in the whole of Europe. As for Austria, this is even more serious, considering that motorcycling is a very seasonal phenomenon.
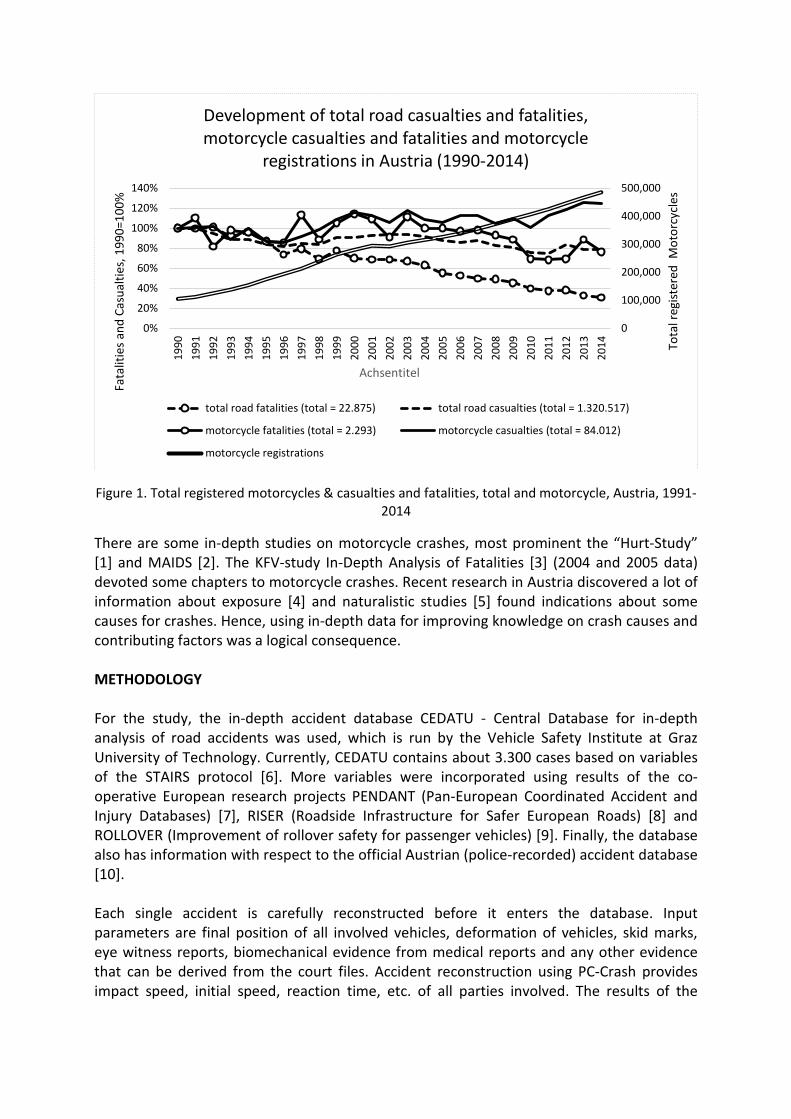
Figure 1. Total registered motorcycles & casualties and fatalities, total and motorcycle, Austria, 1991-2014
There are some in-depth studies on motorcycle crashes, most prominent the “Hurt-Study” [1] and MAIDS [2]. The KFV-study In-Depth Analysis of Fatalities [3] (2004 and 2005 data) devoted some chapters to motorcycle crashes. Recent research in Austria discovered a lot of information about exposure [4] and naturalistic studies [5] found indications about some causes for crashes. Hence, using in-depth data for improving knowledge on crash causes and contributing factors was a logical consequence. METHODOLOGY For the study, the in-depth accident database CEDATU - Central Database for in-depth analysis of road accidents was used, which is run by the Vehicle Safety Institute at Graz University of Technology. Currently, CEDATU contains about 3.300 cases based on variables of the STAIRS protocol [6]. More variables were incorporated using results of the co-operative European research projects PENDANT (Pan-European Coordinated Accident and Injury Databases) [7], RISER (Roadside Infrastructure for Safer European Roads) [8] and ROLLOVER (Improvement of rollover safety for passenger vehicles) [9]. Finally, the database also has information with respect to the official Austrian (police-recorded) accident database [10]. Each single accident is carefully reconstructed before it enters the database. Input parameters are final position of all involved vehicles, deformation of vehicles, skid marks, eye witness reports, biomechanical evidence from medical reports and any other evidence that can be derived from the court files. Accident reconstruction using PC-Crash provides impact speed, initial speed, reaction time, etc. of all parties involved. The results of the
0
100,000
200,000
300,000
400,000
500,000
0%
20%
40%
60%
80%
100%
120%
140%19
9019
9119
9219
9319
9419
9519
9619
9719
9819
9920
0020
0120
0220
0320
0420
0520
0620
0720
0820
0920
1020
1120
1220
1320
14 Tota
l reg
ister
ed M
otor
cycl
es
Fata
litie
s and
Cas
ualti
es, 1
990=
100%
Achsentitel
Development of total road casualties and fatalities, motorcycle casualties and fatalities and motorcycle
registrations in Austria (1990-2014)
total road fatalities (total = 22.875) total road casualties (total = 1.320.517)
motorcycle fatalities (total = 2.293) motorcycle casualties (total = 84.012)
motorcycle registrations

reconstruction facilitate conclusions on the primary and other causes of the crash and factors, which have contributed to occurrence and/or severity of a crash. KFV has commissioned TU Graz a study [11] on accident causation of motorcycle accidents. Mopeds were excluded. From the Austrian accident database, it is well know that moped accidents have different patterns in terms of e.g. severity and location. Hence, moped accidents could not support an extension of the sample. SAMPLE, BASIC ANALYSIS From CEDATU, a sample of 101 crashes involving a motorcycle was selected. The sample was composed as to have the same distribution of accident types as the official Austrian accident database. Single vehicle accidents (36%), crashes with an oncoming vehicle (31%) and crashes at intersections (23%) were the most frequent accident types. Most victims (motorcycle users) were male (92%): among 104 riders, there were only two women. Most of the injuries were fatal (86% of riders, 44% of pillion passengers) only 2 % remained uninjured. Victims were categorised in groups of five years. 20 to 24, 35 to 39 and40 to 44 included about 20% of the victims. The 101 crashes involved 170 road users. Most frequent crash partners were cars (76%). Truck (14%), vulnerable road users, busses and others (about 3% each) make up the rest of the collision partners. 16% of the riders, whose initial speed could be determined (n=77) were travelling above the speed limit. From those accidents, which occurred at 100 km/h speed limit, the average speed was 83 km/h, the median speed was 85.5 km/h, the maximum 140 km/h. The median collision speed was 69 km/h. CRASH CAUSES AND CONTRIBUTING FACTORS Contributing factors in general Contributing factors are determined for all parties involved in the sample of 101 crashes. For all parties involved (n=169), there is an average of 3.7 contributing factors per crash (median: 3.0). For the cars only, the average is 3.3 (n=49), for other parties it is 3.0 (n=16). For the motorcycles themselves, the average is 3.9 contributing factors per crash, the median is 4.0 (n=104). This may lead to the conclusion that riders are better than other road user groups in terms of defensive strategies. In other words, for a motorcycle it takes more adverse conditions driving a rider into trouble. Split by accident type for all the crashes (not for the parties), the average is 5.2 contributing factors, head on-collisions (n=31) have an average of seven, single vehicle crashes (n=36) and crashes at intersections (n=24) have an average of about 4.5 contributing factors. Luckily, since these are also the accidents with the most severe consequences, it takes more adverse conditions triggering a head-on collision. “Speed” and “unexpectable behaviour of other road users” are, by far, the most frequent causes for crashes (Figure 2). Three more causes were counted in considerable numbers (rider failure, overtaking and time headway / delayed reaction). Road alignment is, by far, the most frequent contributing factor and applied to almost all the crashes. Only “speed”,
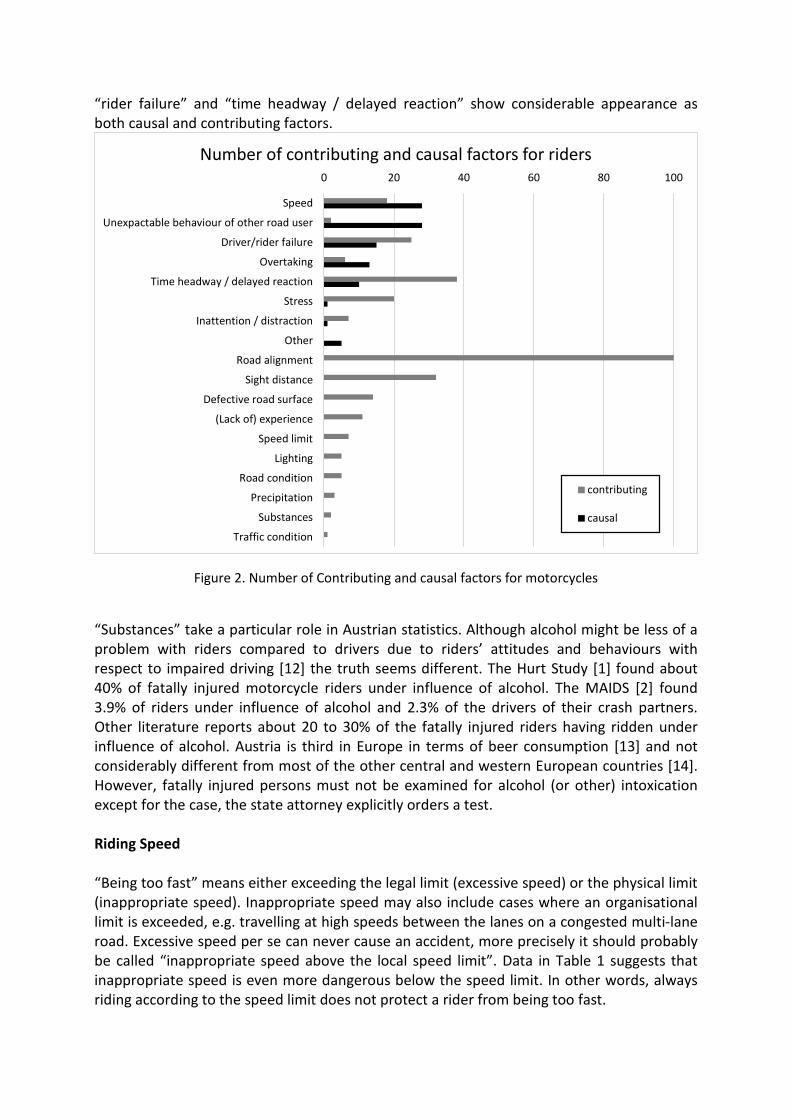
“rider failure” and “time headway / delayed reaction” show considerable appearance as both causal and contributing factors.
Figure 2. Number of Contributing and causal factors for motorcycles
“Substances” take a particular role in Austrian statistics. Although alcohol might be less of a problem with riders compared to drivers due to riders’ attitudes and behaviours with respect to impaired driving [12] the truth seems different. The Hurt Study [1] found about 40% of fatally injured motorcycle riders under influence of alcohol. The MAIDS [2] found 3.9% of riders under influence of alcohol and 2.3% of the drivers of their crash partners. Other literature reports about 20 to 30% of the fatally injured riders having ridden under influence of alcohol. Austria is third in Europe in terms of beer consumption [13] and not considerably different from most of the other central and western European countries [14]. However, fatally injured persons must not be examined for alcohol (or other) intoxication except for the case, the state attorney explicitly orders a test. Riding Speed “Being too fast” means either exceeding the legal limit (excessive speed) or the physical limit (inappropriate speed). Inappropriate speed may also include cases where an organisational limit is exceeded, e.g. travelling at high speeds between the lanes on a congested multi-lane road. Excessive speed per se can never cause an accident, more precisely it should probably be called “inappropriate speed above the local speed limit”. Data in Table 1 suggests that inappropriate speed is even more dangerous below the speed limit. In other words, always riding according to the speed limit does not protect a rider from being too fast.
0 20 40 60 80 100
Speed
Unexpactable behaviour of other road user
Driver/rider failure
Overtaking
Time headway / delayed reaction
Stress
Inattention / distraction
Other
Road alignment
Sight distance
Defective road surface
(Lack of) experience
Speed limit
Lighting
Road condition
Precipitation
Substances
Traffic condition
Number of contributing and causal factors for riders
contributing
causal
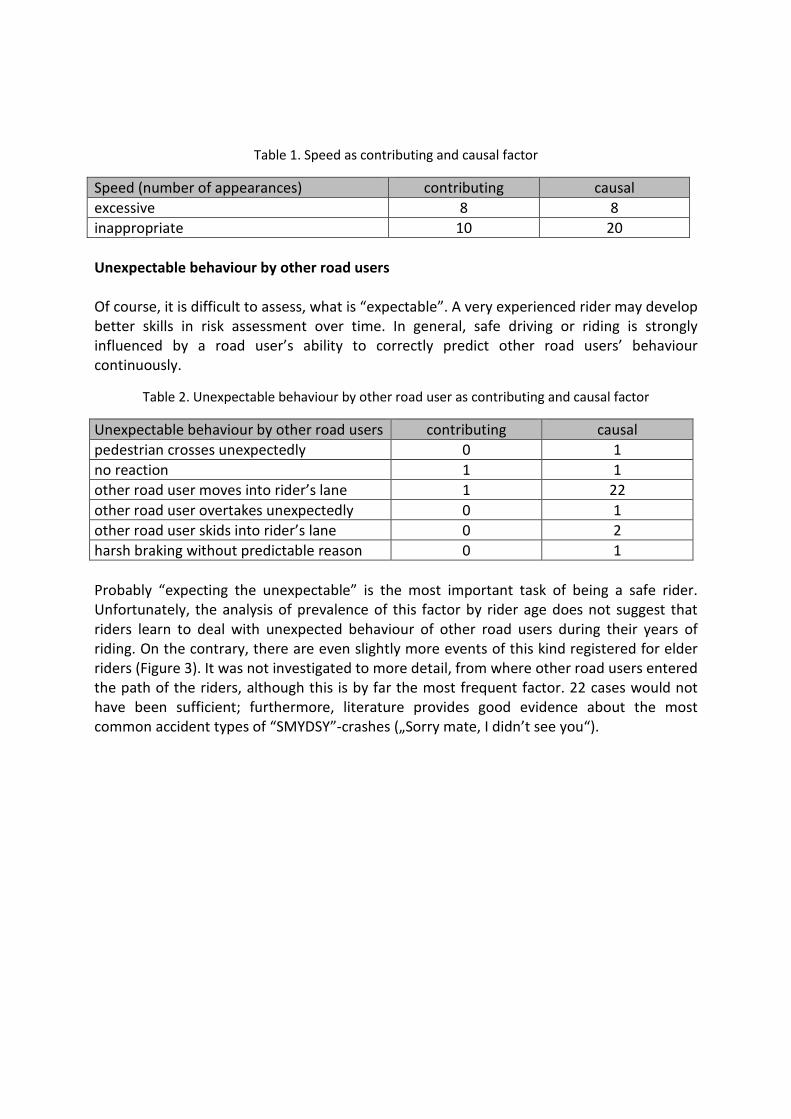
Table 1. Speed as contributing and causal factor
Speed (number of appearances) contributing causal excessive 8 8 inappropriate 10 20 Unexpectable behaviour by other road users Of course, it is difficult to assess, what is “expectable”. A very experienced rider may develop better skills in risk assessment over time. In general, safe driving or riding is strongly influenced by a road user’s ability to correctly predict other road users’ behaviour continuously.
Table 2. Unexpectable behaviour by other road user as contributing and causal factor
Unexpectable behaviour by other road users contributing causal pedestrian crosses unexpectedly 0 1 no reaction 1 1 other road user moves into rider’s lane 1 22 other road user overtakes unexpectedly 0 1 other road user skids into rider’s lane 0 2 harsh braking without predictable reason 0 1 Probably “expecting the unexpectable” is the most important task of being a safe rider. Unfortunately, the analysis of prevalence of this factor by rider age does not suggest that riders learn to deal with unexpected behaviour of other road users during their years of riding. On the contrary, there are even slightly more events of this kind registered for elder riders (Figure 3). It was not investigated to more detail, from where other road users entered the path of the riders, although this is by far the most frequent factor. 22 cases would not have been sufficient; furthermore, literature provides good evidence about the most common accident types of “SMYDSY”-crashes („Sorry mate, I didn’t see you“).
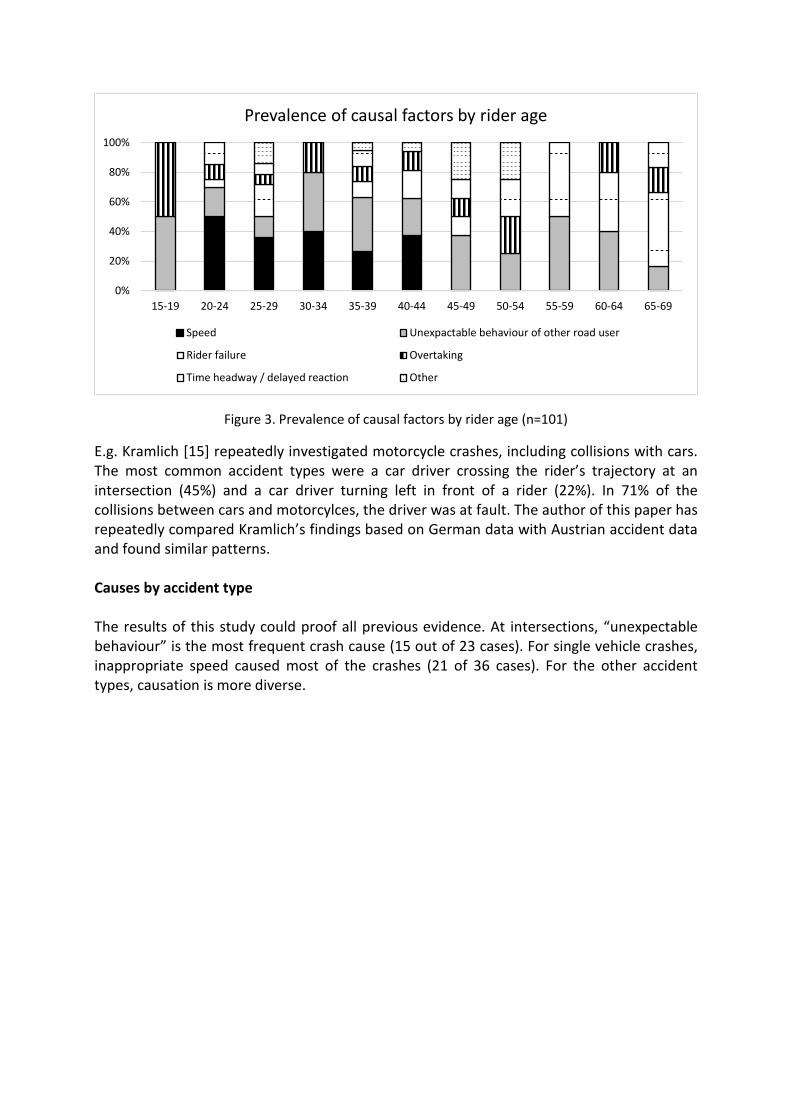
Figure 3. Prevalence of causal factors by rider age (n=101)
E.g. Kramlich [15] repeatedly investigated motorcycle crashes, including collisions with cars. The most common accident types were a car driver crossing the rider’s trajectory at an intersection (45%) and a car driver turning left in front of a rider (22%). In 71% of the collisions between cars and motorcylces, the driver was at fault. The author of this paper has repeatedly compared Kramlich’s findings based on German data with Austrian accident data and found similar patterns. Causes by accident type The results of this study could proof all previous evidence. At intersections, “unexpectable behaviour” is the most frequent crash cause (15 out of 23 cases). For single vehicle crashes, inappropriate speed caused most of the crashes (21 of 36 cases). For the other accident types, causation is more diverse.
0%
20%
40%
60%
80%
100%
15-19 20-24 25-29 30-34 35-39 40-44 45-49 50-54 55-59 60-64 65-69
Prevalence of causal factors by rider age
Speed Unexpactable behaviour of other road user
Rider failure Overtaking
Time headway / delayed reaction Other
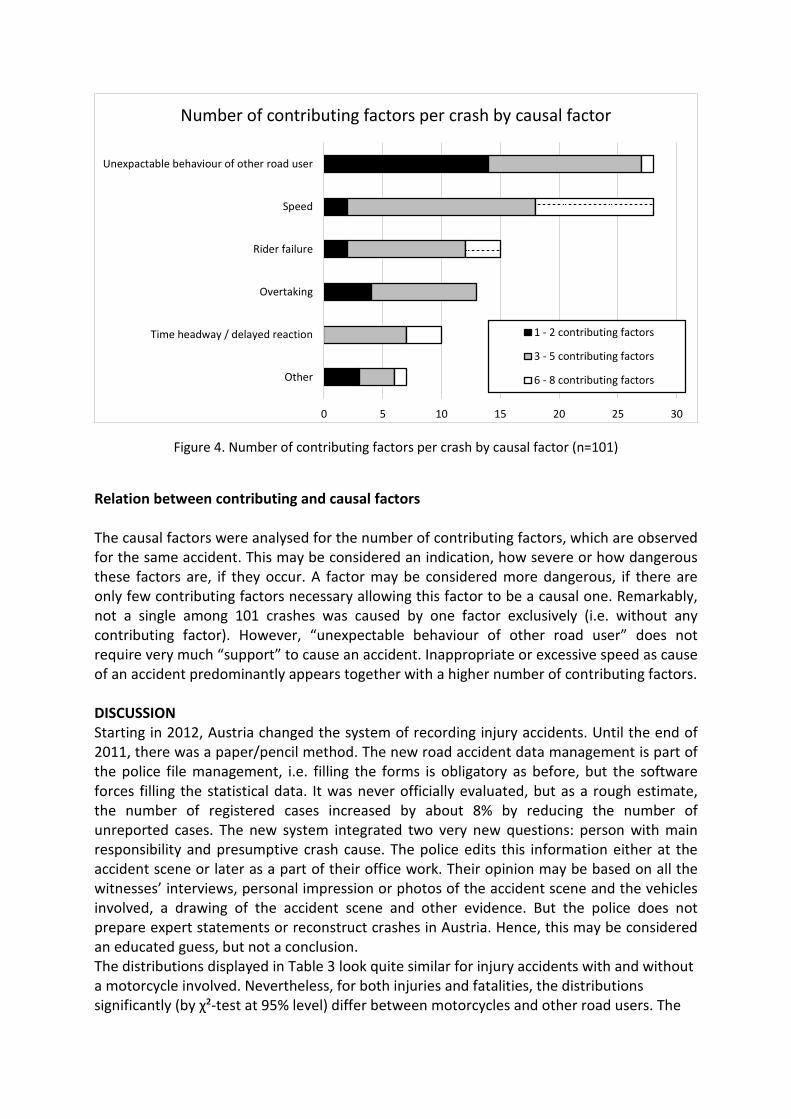
Figure 4. Number of contributing factors per crash by causal factor (n=101)
Relation between contributing and causal factors The causal factors were analysed for the number of contributing factors, which are observed for the same accident. This may be considered an indication, how severe or how dangerous these factors are, if they occur. A factor may be considered more dangerous, if there are only few contributing factors necessary allowing this factor to be a causal one. Remarkably, not a single among 101 crashes was caused by one factor exclusively (i.e. without any contributing factor). However, “unexpectable behaviour of other road user” does not require very much “support” to cause an accident. Inappropriate or excessive speed as cause of an accident predominantly appears together with a higher number of contributing factors. DISCUSSION Starting in 2012, Austria changed the system of recording injury accidents. Until the end of 2011, there was a paper/pencil method. The new road accident data management is part of the police file management, i.e. filling the forms is obligatory as before, but the software forces filling the statistical data. It was never officially evaluated, but as a rough estimate, the number of registered cases increased by about 8% by reducing the number of unreported cases. The new system integrated two very new questions: person with main responsibility and presumptive crash cause. The police edits this information either at the accident scene or later as a part of their office work. Their opinion may be based on all the witnesses’ interviews, personal impression or photos of the accident scene and the vehicles involved, a drawing of the accident scene and other evidence. But the police does not prepare expert statements or reconstruct crashes in Austria. Hence, this may be considered an educated guess, but not a conclusion. The distributions displayed in Table 3 look quite similar for injury accidents with and without a motorcycle involved. Nevertheless, for both injuries and fatalities, the distributions significantly (by χ²-test at 95% level) differ between motorcycles and other road users. The
0 5 10 15 20 25 30
Other
Time headway / delayed reaction
Overtaking
Rider failure
Speed
Unexpactable behaviour of other road user
Number of contributing factors per crash by causal factor
1 - 2 contributing factors
3 - 5 contributing factors
6 - 8 contributing factors

biggest difference can be found in Police’s assessment of speed as a causal factor. Considering that 86% of riders within this project’s sample sustained fatal injuries, it is positive that there are more similarities between causal factors (sample) and primary causes (police data) for fatalities than for injuries. However, probably the most striking “difference” is that almost 50% of the causes cannot be directly matched between the two data sets.
Table 3. Presumptive crash causes, police-recorded road crashes, Austria, 2012-2014 and causal factors
Primary cause / Causal factor causal factors
(in-depth)
Fatalities (police data) Injuries (police data) Motorcylce
involved all others Motorcylce involved all others
Inattention / distraction 0,99% 10,97% 15,01% 9,46% 8,58% Unappropriate speed 27,72% 38,40% 21,03% 16,39% 13,57% Right-of-way violation, red light running 16,03% 11,11% 22,63% 22,81% n.a. 16,03% 3,99% 7,96% 3,00% Overtaking 12,87% 13,50% 25,28% 29,42% 32,74% Time headway 9,90% 0,84% 2,29% 1,92% 4,06% Pedestrian error 0,00% 4,07% 0,24% 1,59% Substances 0,00% 0,42% 9,33% 0,77% 2,21% Other offences 0,42% 2,88% 0,17% 0,57% Fatigue 1,27% 0,93% 4,61% 6,41% Obstacle 1,27% 2,46% 2,90% 2,31% Heart attack 0,00% 0,68% 0,96% 0,75% Technical defect 0,84% 0,93% 2,56% 1,41% Unexpactable behaviour of other road user 27,72% Driver/rider failure 14,85% Stress 0,99% other 4,95% n (grey cells indicate significant results) 101 237 1179 12670 133939
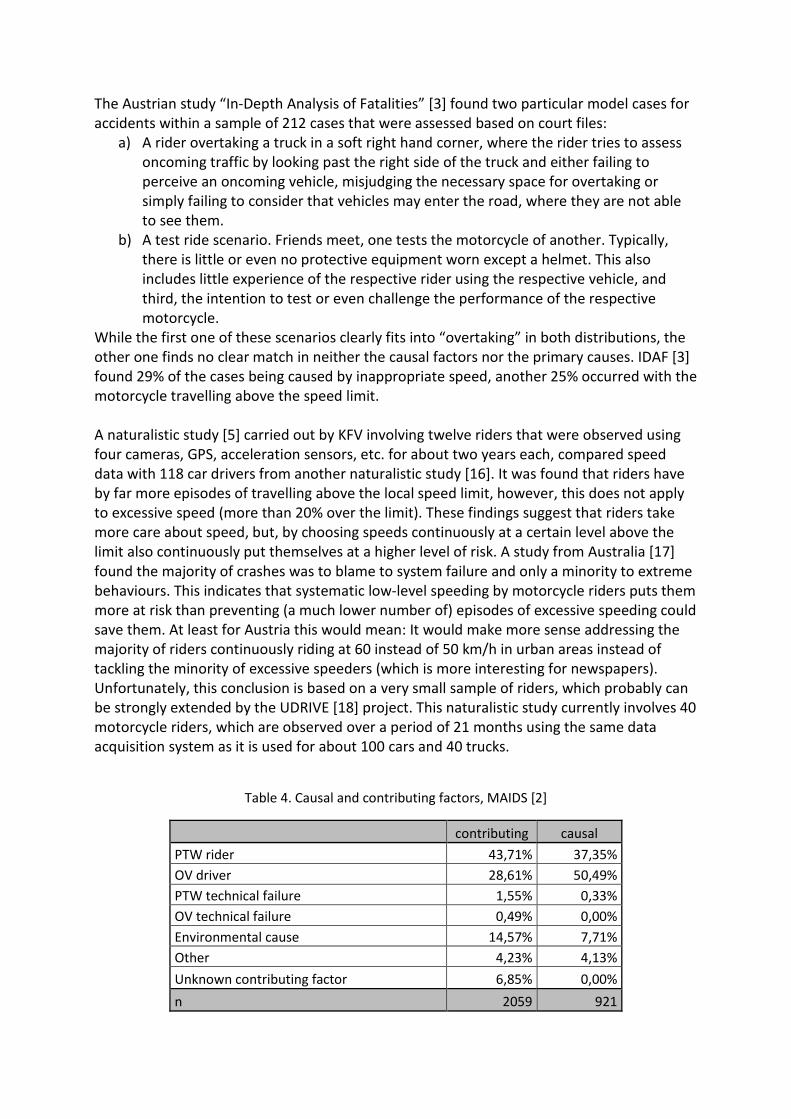
The Austrian study “In-Depth Analysis of Fatalities” [3] found two particular model cases for accidents within a sample of 212 cases that were assessed based on court files:
a) A rider overtaking a truck in a soft right hand corner, where the rider tries to assess oncoming traffic by looking past the right side of the truck and either failing to perceive an oncoming vehicle, misjudging the necessary space for overtaking or simply failing to consider that vehicles may enter the road, where they are not able to see them.
b) A test ride scenario. Friends meet, one tests the motorcycle of another. Typically, there is little or even no protective equipment worn except a helmet. This also includes little experience of the respective rider using the respective vehicle, and third, the intention to test or even challenge the performance of the respective motorcycle.
While the first one of these scenarios clearly fits into “overtaking” in both distributions, the other one finds no clear match in neither the causal factors nor the primary causes. IDAF [3] found 29% of the cases being caused by inappropriate speed, another 25% occurred with the motorcycle travelling above the speed limit. A naturalistic study [5] carried out by KFV involving twelve riders that were observed using four cameras, GPS, acceleration sensors, etc. for about two years each, compared speed data with 118 car drivers from another naturalistic study [16]. It was found that riders have by far more episodes of travelling above the local speed limit, however, this does not apply to excessive speed (more than 20% over the limit). These findings suggest that riders take more care about speed, but, by choosing speeds continuously at a certain level above the limit also continuously put themselves at a higher level of risk. A study from Australia [17] found the majority of crashes was to blame to system failure and only a minority to extreme behaviours. This indicates that systematic low-level speeding by motorcycle riders puts them more at risk than preventing (a much lower number of) episodes of excessive speeding could save them. At least for Austria this would mean: It would make more sense addressing the majority of riders continuously riding at 60 instead of 50 km/h in urban areas instead of tackling the minority of excessive speeders (which is more interesting for newspapers). Unfortunately, this conclusion is based on a very small sample of riders, which probably can be strongly extended by the UDRIVE [18] project. This naturalistic study currently involves 40 motorcycle riders, which are observed over a period of 21 months using the same data acquisition system as it is used for about 100 cars and 40 trucks.
Table 4. Causal and contributing factors, MAIDS [2]
contributing causal PTW rider 43,71% 37,35% OV driver 28,61% 50,49% PTW technical failure 1,55% 0,33% OV technical failure 0,49% 0,00% Environmental cause 14,57% 7,71% Other 4,23% 4,13% Unknown contributing factor 6,85% 0,00% n 2059 921
The MAIDS [2], among a lot of other information, looked at “Primary accident contributing factor” and “Other accident contributing factors”. This analysis distinguished more precisely which party involved was at fault than the other studies or data presented above (Table 4). The MAIDS [2] provides information about riding speed in comparison to the surrounding traffic. For 86% of the cases, “no unusual speed or no other traffic” was found, it was indicated that the speed difference to surrounding traffic contributed to the accident in only 5% of the cases. CONCLUSIONS It turns out to be very difficult comparing different studies’ results in terms of accident causation. None of the studies provided an overview on “who did what” with respect to causal or contributing factors and/or behaviours. The analysis of CEDATU data suggests that there are two major issues in terms of motorcycle crashes: speed and unexpectable behaviours of other road users, both causing 28% of the 101 crashes that have been investigated in this study. Even if the other studies approach the issue from different directions, riding speed and failures by other road users turn out to be the common denominators in all the studies. Particularly in terms of behaviours of other road users, it seems to be most important distinguishing between “unexpected” and “unexpectable”. In many European countries – with Austria among those – motorcycle riding is a very seasonal task. One could argue that, before car drivers really get familiar with motorcycles each summer, the riders get back into winter sleep. Hence, both riders and drivers lack experience in “expecting” potentially hazardous situations. Neither is “trial and error” a good strategy of gaining experience. There’s some evidence that riders are better in spotting potential hazards than car drivers [19]. The MAIDS [2] gave evidence that car drivers also holding a motorcycle license are, as car drivers, less likely to crash powered two-wheelers. These facts dissolve the concept of “unexpected” or “unexpectable” by riders. There should be more concern on the question “who has the capability to expect what?” which finally should end up in eliminating all “unexpected” events and reduce motorcycle crashes to the really “unexpectable” ones, where finally the term “accident” would be the appropriate one. It requires more awareness from both sides: Drivers should consider that there are things that cannot be done with a car, but can be done with a motorcycle. On the other side, riders need to continuously scan for situations, where other road users might fail expecting their presence. REFERENCES 1 H H Hurt, J V Ouellet, D R Thom, Motorcycle Accident Cause Factors and Identification of Countermeasures, Volume I:
Technical Report. Los Angeles : University of Soutern California, 1981 2 NN, MAIDS – In-depth investigations of accidents involving powered two wheelers - Final Report 2.0, ACEM (Association
des Constructeurs Européens de Motocycles, Brussels, 2009. 3 C Stefan et al, In-Depth Analysis of Fatalities, Forschungsarbeiten aus dem Verkehrswesen Band 176,
Bundesministerium für Verkehr, Innovation und Technologie (Hrsg.), Wien, 2008. 4 M Winkelbauer, A Pommer, Fahrleistungen von Motorraedern, Kuratorium für Verkehrssicherheit, Wien, 2014. 5 A Pommer, M Winkelbauer, M Donabauer, Naturalistic Riding – Ergebnisse einer Feldstudie, Kuratorium für
Verkehrssicherheit, Wien, 2014. 6 R Ross, P Thomas, B Sexton, D Otte, I Koßmann, G Vallet, J L Martin, B Laumon, P Lejeune, An Approach to the
Standardisation of Accident and Injury Registration Systems (STAIRS) in Europe, 1999.

7 A Morris, P Thomas, PENDANT - Pan-European Co-ordinated Accident and Injury Databases, The 18th International Technical Conference on the Enhanced Safety of Vehicles (ESV) Proceedings, Nagoya, Japan, 2003.
8 NN, RISER: Final Report - Roadside Infrastructure for Safer European Roads; Report no: Final Report, 2006. 9 J Gugler, H Steffan, ROLLOVER - Improvement of Rollover Safety for Passenger Vehicles - Final Report, 2005. 10 Statistik Austria: Erläuterungen und Definitionen zum Zählblatt über einen Straßenverkehrsunfall, 2007. 11 E Tomasch, Unfallkausale Faktoren bei Motorradunfällen, Vehicle Safety Institute, Graz, 2016 (unpublished) 12 J Cestac, P Delhomme et al, European road users’ risk perception and mobility (The SARTRE 4 survey), European
Commission, French Institute of Science and Technology for Transport, 2012, p139ff 13 M Van de Walle, Beer statistics 2015 edition, The Brewers of Europe, Brussels, 2015 14 World Health Statistics 2016 data visualizations dashboard > SDG Target 3.5 | Substance abuse, WHO, 2016 15 T Kramlich, Noch immer gefährliche Begegnungen: Die häufigsten Gefahrensituationen für Motorradfahrer und die
resultierenden Verletzungen, Proceedings of the 2002 International Motorcycle Conference, Institut für Zweiradsicherheit e. V., Essen, 2002, p55ff
16 A Pommer, M Donabauer, M Winkelbauer, F Schneider, 100-Car-Study Österreich, Kuratorium für Verkehrssicherheit, Wien, 2016.
17 L N Wundersitz, M R J Baldock, The relative contribution of system failures and extreme behaviour in South Australian crashes, Centre for Automotive Safety Research, The University of Adelaide, 2011.
18 eUropean naturalistic Driving and Riding for Infrastructure & Vehicle safety and Environment (see www.udrive.eu for more information).
19 M S Horswill, S Helman, A behavioral comparison between motorcyclists and a matched group of non-motorcycling car drivers: factors influencing accident risk. Accident Analysis & Prevention. 2003 /07 35(4) p589ff.
A pilot study for the determination of accident moderating conditions as an addition to situational accident causation factors.
Pund, B.1, Jänsch, M.2, Otte, D.2, Johannsen, H.2
1 TÜV Technische Überwachung Hessen GmbH 2 Accident Research Unit, Medizinische Hochschule Hannover
Abstract
For the avoidance of traffic accidents by means of advanced driver assistance systems the knowledge of failures and deficiencies a few seconds before the crash is of increasing importance. This information e.g. is collected in the German accident survey GIDAS by an interview derived from the ACAS methodology. However to display the whole range of accident causation factors additional information is needed on enduring factors of the system components “human”, “infrastructure” and “machine”. On the strategic level these accident moderating factors include long term influences such as medical preconditions or a general higher risk taking behavior as well as influences on the immediate conflict level such as an aggressive response to a perceived previous traffic conflict.
This study was conducted to examine the feasibility of collecting such causation information in the scope of an in-depth accident investigation like GIDAS. Due to the comprehensive amount of information necessary to estimate the moderationg factors the collection of the information is distributed to different methods. 5 cases of real world crashes have been investigated where information was collected on-scene and retrospective by interviews. The identified moderating factors of the accidents and the method for collecting the information are displayed.
Interest of in-depth investigation for studying the relation between speed and accident risk
Bastien Canu*, Christophe Perrin*, Joël Magnin*, Adrien Canu*, Thierry Serre*, Thierry
Brenac* *IFSTTAR, TS2, LMA, Department for Transport Health and Safety, Laboratory of accident mechanism analysis, 304 Chemin
de la Croix Blanche, 13300 Salon de Provence, France
Abstract In-depth accident investigation offers many advantages for the analysis and comprehension of crash mechanisms. IFSTTAR makes such investigations since 1992 without interruption. The corresponding database contains more than 1200 accident case studies. Currently, in-depth accident investigation is one of the best ways to determine the speed or cars involved in accidents. This paper first presents the methods used for accident investigation and for accident kinematic reconstruction. Then, in order to illustrate the interest and possible applications of such accident data, it shows some results from a recent study based on the IFSTTAR in-depth accident study programme (IDAS) and dealing with the link between travelling speed and accident risk.
INTRODUCTION The interest of in-depth accident investigation is well described and proved for many years
by road safety research [1]. A recent European project, DACOTA, funded by the European
Commission, presents a state of the art on in-depth accident investigation programmes in
Europe and a description of what would be the benefit if such studies were extended to
nearly all European countries [2].
Such programmes offer many advantages for the analysis and comprehension of crash
mechanisms. In particular, by offering the ability to determine the speed of crashed cars,
they represent an interesting tool to carry out research work on the role of speed in road
safety.
Various publications provide thorough states of the art on the relation between speed and
road safety, such as for example the Actes Inrets n°105 [3] or, at the international level, a
report from OECD/ECMT [4].
More precisely, the scientific literature and accident research usually suggest that the risk of
being involved in a road accident increase with the travelling speed. For example, research
work published by Nilsson in 1982 deals with the analysis of the accident data according to
the average speed of the traffic before and after modification of speed limits [5]. Others
studies are rather based on the comparison between the speeds of vehicles involved in the
accidents and the current driving speeds. In particular, matched case-control studies were
carried out in Australia. On various types of network in rural areas [6] and in urban areas
[7,8], they compare the speed of each vehicle involved in an accident (case) with the speed
of vehicles circulating at the same place (controls).
The in-depth accident investigation programme performed at IFSTTAR is named IDAS, which
stands for In-Depth Accident Study (in French EDA: Etude Détaillée d'Accidents [1]). This
paper first presents the methods used in this programme for accident investigation and for
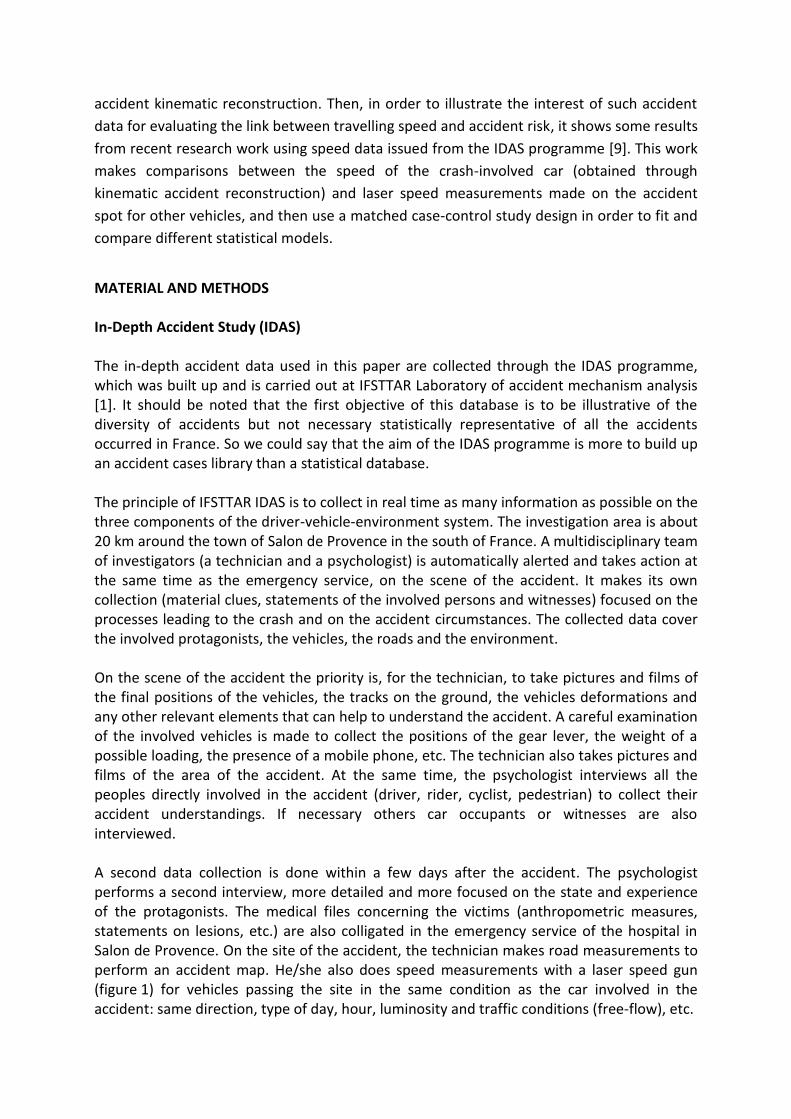
accident kinematic reconstruction. Then, in order to illustrate the interest of such accident
data for evaluating the link between travelling speed and accident risk, it shows some results
from recent research work using speed data issued from the IDAS programme [9]. This work
makes comparisons between the speed of the crash-involved car (obtained through
kinematic accident reconstruction) and laser speed measurements made on the accident
spot for other vehicles, and then use a matched case-control study design in order to fit and
compare different statistical models.
MATERIAL AND METHODS In-Depth Accident Study (IDAS) The in-depth accident data used in this paper are collected through the IDAS programme, which was built up and is carried out at IFSTTAR Laboratory of accident mechanism analysis [1]. It should be noted that the first objective of this database is to be illustrative of the diversity of accidents but not necessary statistically representative of all the accidents occurred in France. So we could say that the aim of the IDAS programme is more to build up an accident cases library than a statistical database. The principle of IFSTTAR IDAS is to collect in real time as many information as possible on the three components of the driver-vehicle-environment system. The investigation area is about 20 km around the town of Salon de Provence in the south of France. A multidisciplinary team of investigators (a technician and a psychologist) is automatically alerted and takes action at the same time as the emergency service, on the scene of the accident. It makes its own collection (material clues, statements of the involved persons and witnesses) focused on the processes leading to the crash and on the accident circumstances. The collected data cover the involved protagonists, the vehicles, the roads and the environment. On the scene of the accident the priority is, for the technician, to take pictures and films of the final positions of the vehicles, the tracks on the ground, the vehicles deformations and any other relevant elements that can help to understand the accident. A careful examination of the involved vehicles is made to collect the positions of the gear lever, the weight of a possible loading, the presence of a mobile phone, etc. The technician also takes pictures and films of the area of the accident. At the same time, the psychologist interviews all the peoples directly involved in the accident (driver, rider, cyclist, pedestrian) to collect their accident understandings. If necessary others car occupants or witnesses are also interviewed. A second data collection is done within a few days after the accident. The psychologist performs a second interview, more detailed and more focused on the state and experience of the protagonists. The medical files concerning the victims (anthropometric measures, statements on lesions, etc.) are also colligated in the emergency service of the hospital in Salon de Provence. On the site of the accident, the technician makes road measurements to perform an accident map. He/she also does speed measurements with a laser speed gun (figure 1) for vehicles passing the site in the same condition as the car involved in the accident: same direction, type of day, hour, luminosity and traffic conditions (free-flow), etc.
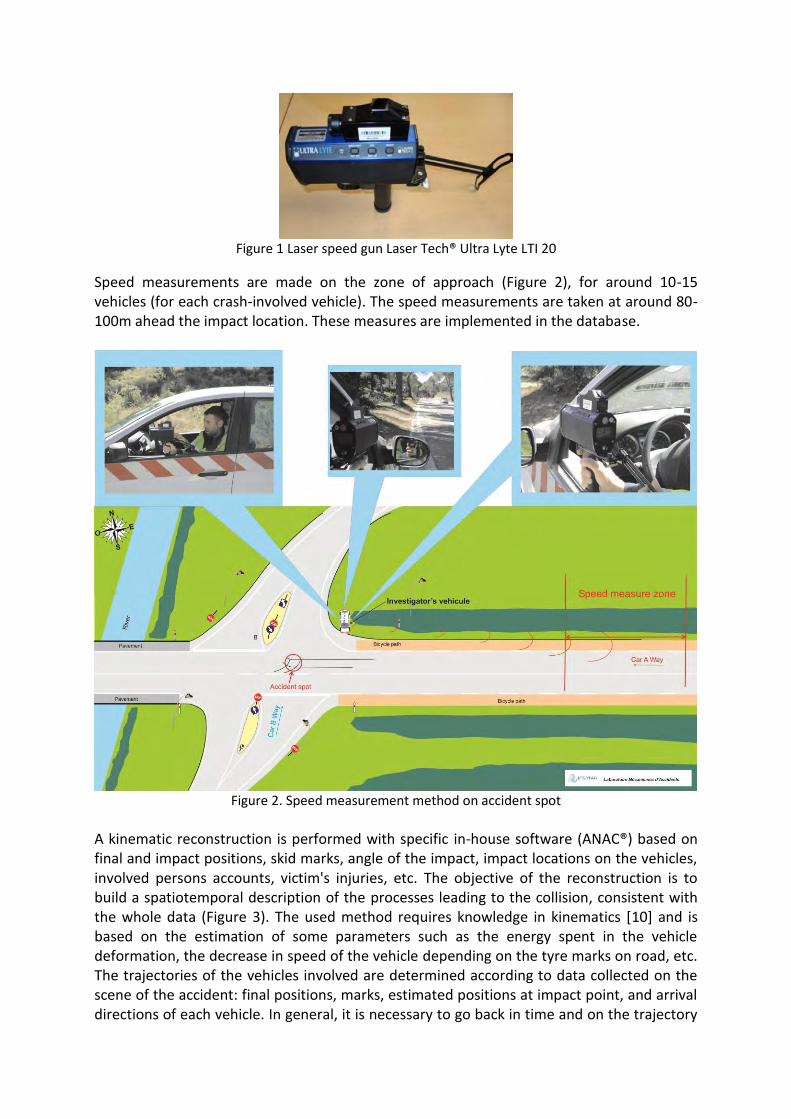
Figure 1 Laser speed gun Laser Tech® Ultra Lyte LTI 20
Speed measurements are made on the zone of approach (Figure 2), for around 10-15 vehicles (for each crash-involved vehicle). The speed measurements are taken at around 80-100m ahead the impact location. These measures are implemented in the database.
Figure 2. Speed measurement method on accident spot
A kinematic reconstruction is performed with specific in-house software (ANAC®) based on final and impact positions, skid marks, angle of the impact, impact locations on the vehicles, involved persons accounts, victim's injuries, etc. The objective of the reconstruction is to build a spatiotemporal description of the processes leading to the collision, consistent with the whole data (Figure 3). The used method requires knowledge in kinematics [10] and is based on the estimation of some parameters such as the energy spent in the vehicle deformation, the decrease in speed of the vehicle depending on the tyre marks on road, etc. The trajectories of the vehicles involved are determined according to data collected on the scene of the accident: final positions, marks, estimated positions at impact point, and arrival directions of each vehicle. In general, it is necessary to go back in time and on the trajectory
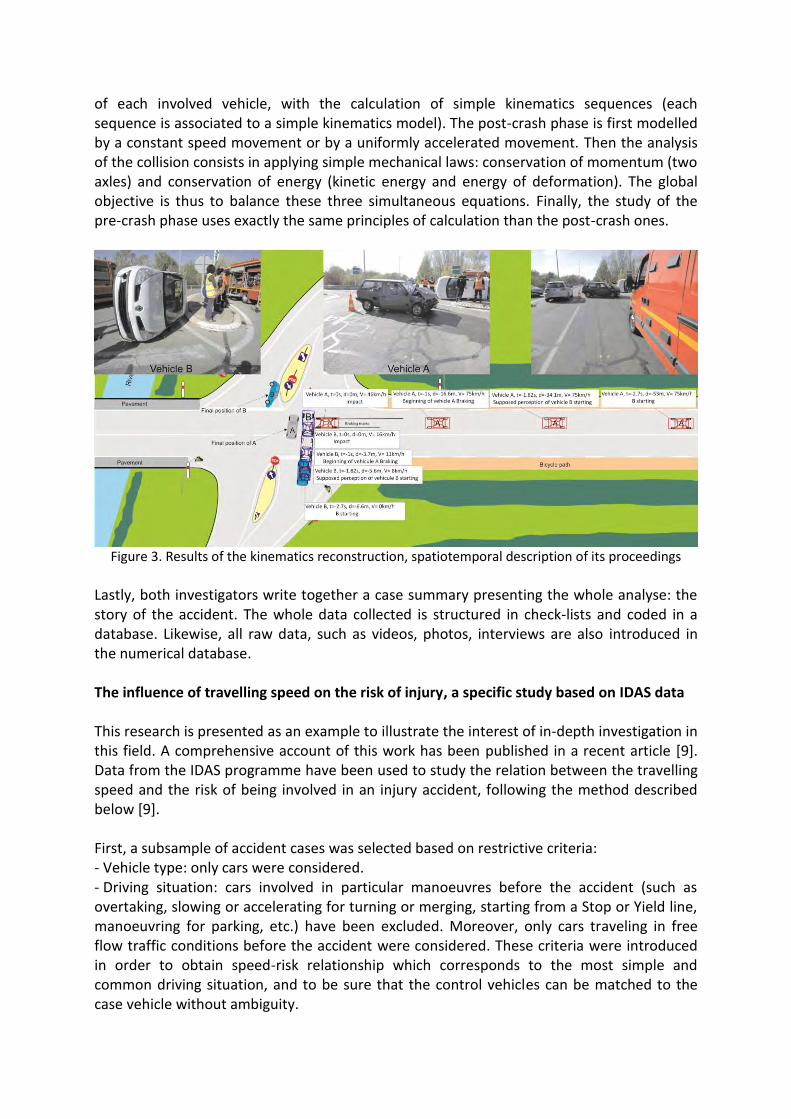
of each involved vehicle, with the calculation of simple kinematics sequences (each sequence is associated to a simple kinematics model). The post-crash phase is first modelled by a constant speed movement or by a uniformly accelerated movement. Then the analysis of the collision consists in applying simple mechanical laws: conservation of momentum (two axles) and conservation of energy (kinetic energy and energy of deformation). The global objective is thus to balance these three simultaneous equations. Finally, the study of the pre-crash phase uses exactly the same principles of calculation than the post-crash ones.
Figure 3. Results of the kinematics reconstruction, spatiotemporal description of its proceedings
Lastly, both investigators write together a case summary presenting the whole analyse: the story of the accident. The whole data collected is structured in check-lists and coded in a database. Likewise, all raw data, such as videos, photos, interviews are also introduced in the numerical database. The influence of travelling speed on the risk of injury, a specific study based on IDAS data This research is presented as an example to illustrate the interest of in-depth investigation in this field. A comprehensive account of this work has been published in a recent article [9]. Data from the IDAS programme have been used to study the relation between the travelling speed and the risk of being involved in an injury accident, following the method described below [9]. First, a subsample of accident cases was selected based on restrictive criteria: - Vehicle type: only cars were considered. - Driving situation: cars involved in particular manoeuvres before the accident (such as overtaking, slowing or accelerating for turning or merging, starting from a Stop or Yield line, manoeuvring for parking, etc.) have been excluded. Moreover, only cars traveling in free flow traffic conditions before the accident were considered. These criteria were introduced in order to obtain speed-risk relationship which corresponds to the most simple and common driving situation, and to be sure that the control vehicles can be matched to the case vehicle without ambiguity.
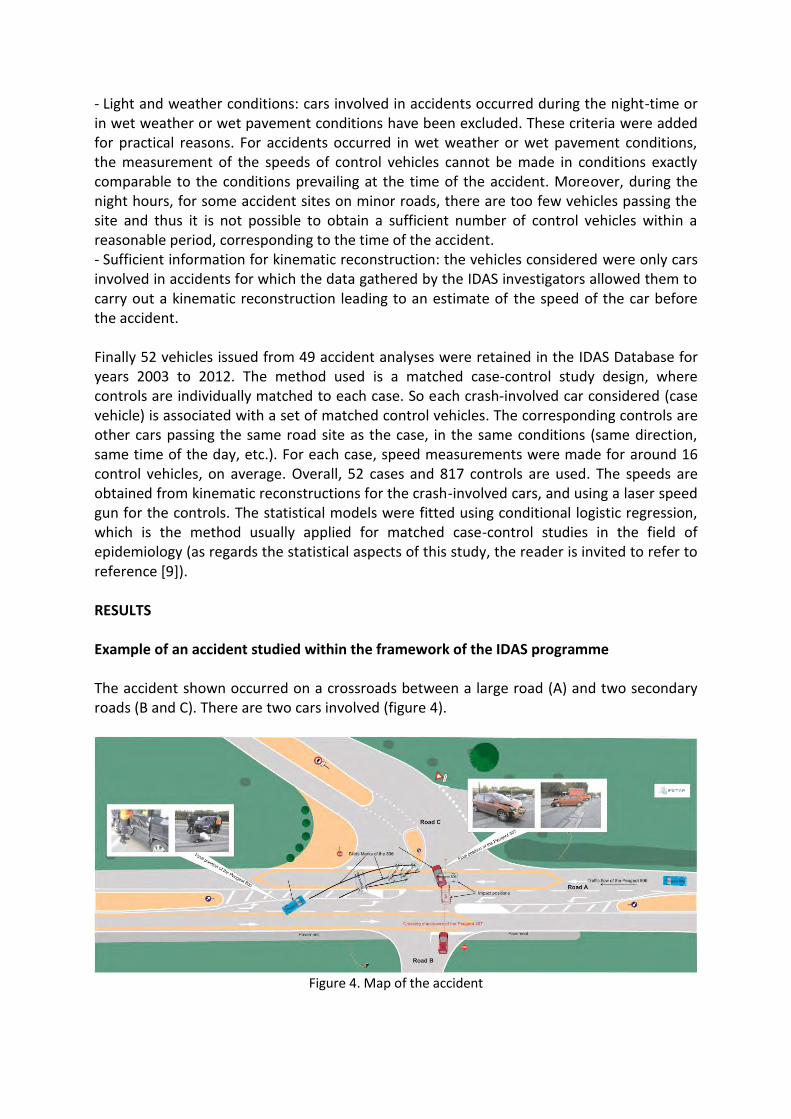
- Light and weather conditions: cars involved in accidents occurred during the night-time or in wet weather or wet pavement conditions have been excluded. These criteria were added for practical reasons. For accidents occurred in wet weather or wet pavement conditions, the measurement of the speeds of control vehicles cannot be made in conditions exactly comparable to the conditions prevailing at the time of the accident. Moreover, during the night hours, for some accident sites on minor roads, there are too few vehicles passing the site and thus it is not possible to obtain a sufficient number of control vehicles within a reasonable period, corresponding to the time of the accident. - Sufficient information for kinematic reconstruction: the vehicles considered were only cars involved in accidents for which the data gathered by the IDAS investigators allowed them to carry out a kinematic reconstruction leading to an estimate of the speed of the car before the accident. Finally 52 vehicles issued from 49 accident analyses were retained in the IDAS Database for years 2003 to 2012. The method used is a matched case-control study design, where controls are individually matched to each case. So each crash-involved car considered (case vehicle) is associated with a set of matched control vehicles. The corresponding controls are other cars passing the same road site as the case, in the same conditions (same direction, same time of the day, etc.). For each case, speed measurements were made for around 16 control vehicles, on average. Overall, 52 cases and 817 controls are used. The speeds are obtained from kinematic reconstructions for the crash-involved cars, and using a laser speed gun for the controls. The statistical models were fitted using conditional logistic regression, which is the method usually applied for matched case-control studies in the field of epidemiology (as regards the statistical aspects of this study, the reader is invited to refer to reference [9]). RESULTS Example of an accident studied within the framework of the IDAS programme The accident shown occurred on a crossroads between a large road (A) and two secondary roads (B and C). There are two cars involved (figure 4).
Figure 4. Map of the accident
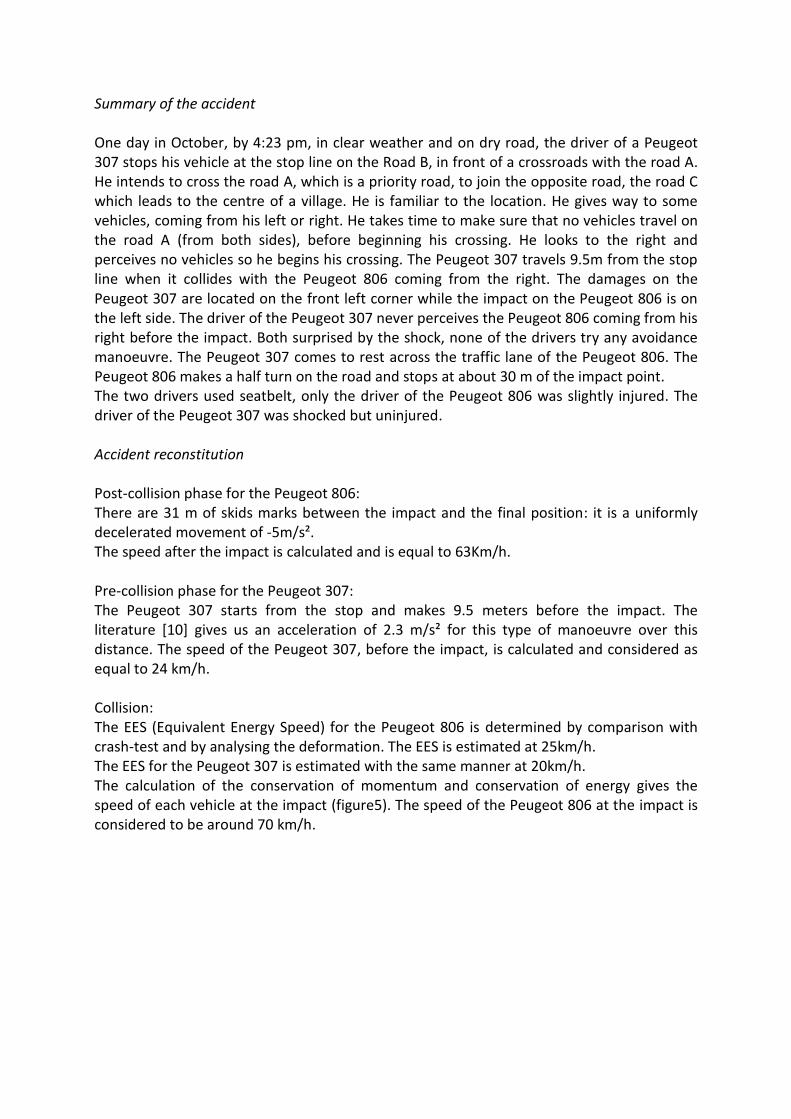
Summary of the accident
One day in October, by 4:23 pm, in clear weather and on dry road, the driver of a Peugeot 307 stops his vehicle at the stop line on the Road B, in front of a crossroads with the road A. He intends to cross the road A, which is a priority road, to join the opposite road, the road C which leads to the centre of a village. He is familiar to the location. He gives way to some vehicles, coming from his left or right. He takes time to make sure that no vehicles travel on the road A (from both sides), before beginning his crossing. He looks to the right and perceives no vehicles so he begins his crossing. The Peugeot 307 travels 9.5m from the stop line when it collides with the Peugeot 806 coming from the right. The damages on the Peugeot 307 are located on the front left corner while the impact on the Peugeot 806 is on the left side. The driver of the Peugeot 307 never perceives the Peugeot 806 coming from his right before the impact. Both surprised by the shock, none of the drivers try any avoidance manoeuvre. The Peugeot 307 comes to rest across the traffic lane of the Peugeot 806. The Peugeot 806 makes a half turn on the road and stops at about 30 m of the impact point. The two drivers used seatbelt, only the driver of the Peugeot 806 was slightly injured. The driver of the Peugeot 307 was shocked but uninjured. Accident reconstitution
Post-collision phase for the Peugeot 806: There are 31 m of skids marks between the impact and the final position: it is a uniformly decelerated movement of -5m/s². The speed after the impact is calculated and is equal to 63Km/h. Pre-collision phase for the Peugeot 307: The Peugeot 307 starts from the stop and makes 9.5 meters before the impact. The literature [10] gives us an acceleration of 2.3 m/s² for this type of manoeuvre over this distance. The speed of the Peugeot 307, before the impact, is calculated and considered as equal to 24 km/h. Collision: The EES (Equivalent Energy Speed) for the Peugeot 806 is determined by comparison with crash-test and by analysing the deformation. The EES is estimated at 25km/h. The EES for the Peugeot 307 is estimated with the same manner at 20km/h. The calculation of the conservation of momentum and conservation of energy gives the speed of each vehicle at the impact (figure5). The speed of the Peugeot 806 at the impact is considered to be around 70 km/h.
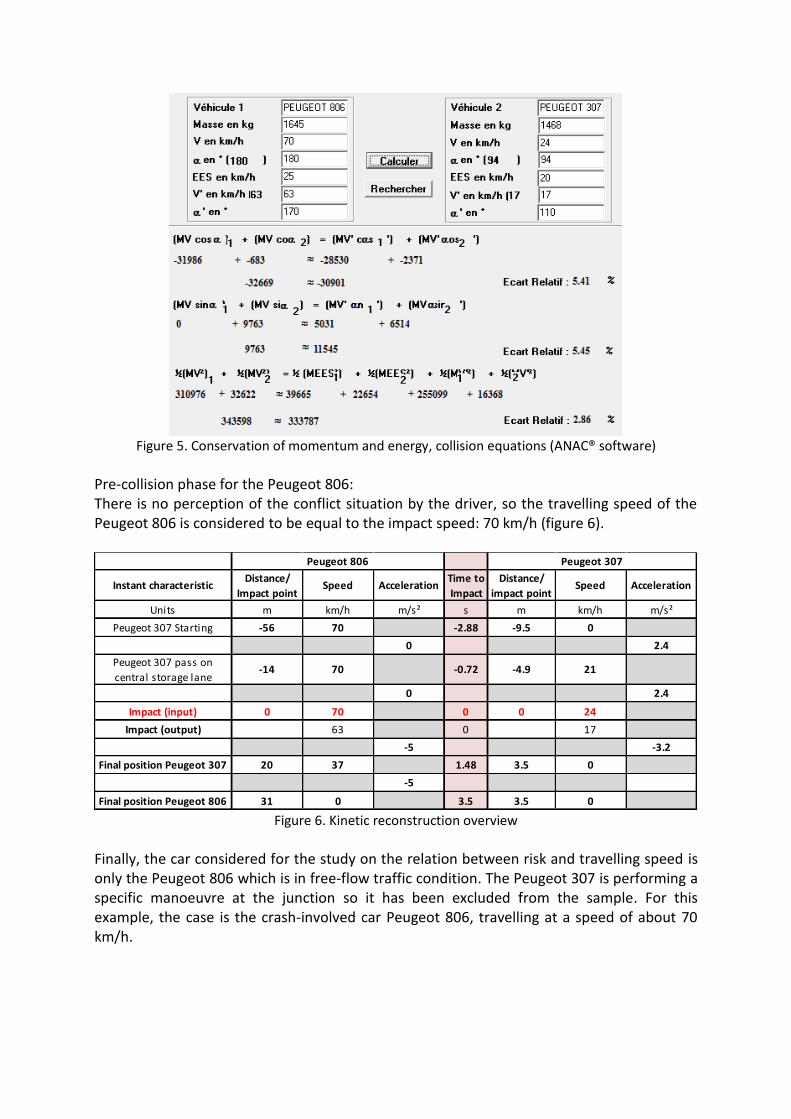
Figure 5. Conservation of momentum and energy, collision equations (ANAC® software)
Pre-collision phase for the Peugeot 806: There is no perception of the conflict situation by the driver, so the travelling speed of the Peugeot 806 is considered to be equal to the impact speed: 70 km/h (figure 6).
Figure 6. Kinetic reconstruction overview
Finally, the car considered for the study on the relation between risk and travelling speed is only the Peugeot 806 which is in free-flow traffic condition. The Peugeot 307 is performing a specific manoeuvre at the junction so it has been excluded from the sample. For this example, the case is the crash-involved car Peugeot 806, travelling at a speed of about 70 km/h.
Instant characteristicDistance/
Impact pointSpeed Acceleration
Time to
Impact
Distance/
impact pointSpeed Acceleration
Units m km/h m/s² s m km/h m/s²
Peugeot 307 Starting -56 70 -2.88 -9.5 0
0 2.4
Peugeot 307 pass on
central storage lane-14 70 -0.72 -4.9 21
0 2.4
Impact (input) 0 70 0 0 24
Impact (output) 63 0 17
-5 -3.2
Final position Peugeot 307 20 37 1.48 3.5 0
-5
Final position Peugeot 806 31 0 3.5 3.5 0
Peugeot 806 Peugeot 307
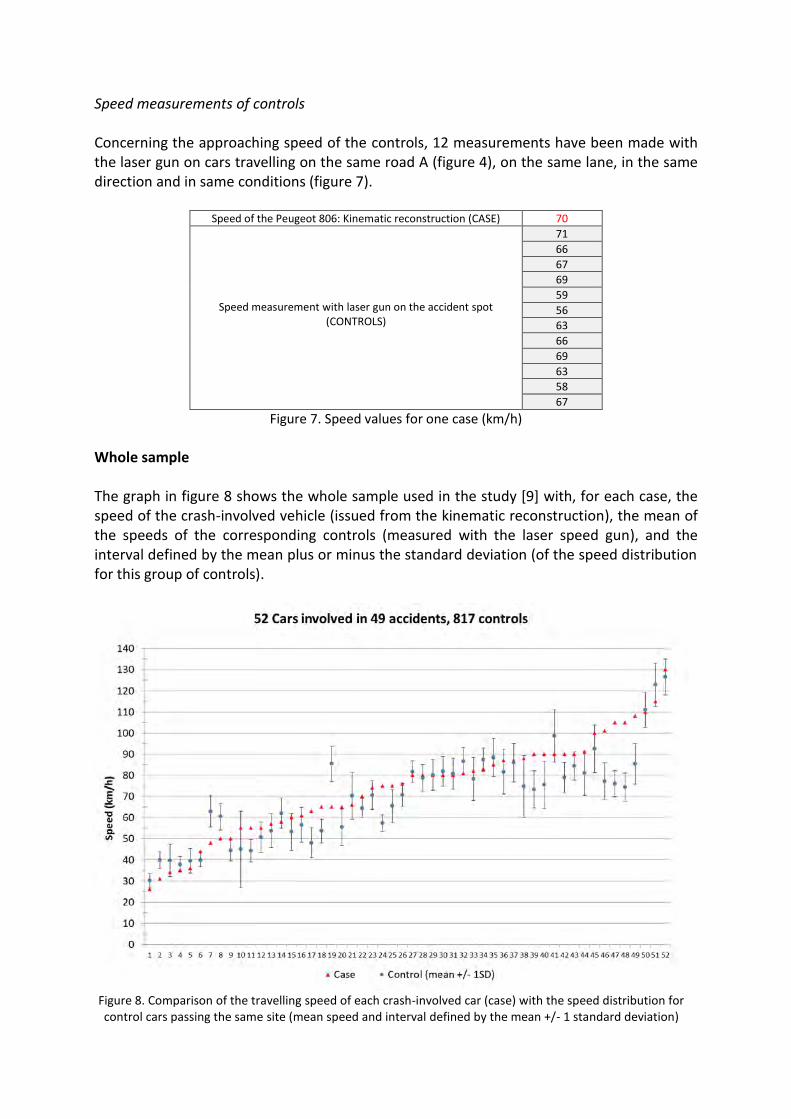
Speed measurements of controls Concerning the approaching speed of the controls, 12 measurements have been made with the laser gun on cars travelling on the same road A (figure 4), on the same lane, in the same direction and in same conditions (figure 7).
Speed of the Peugeot 806: Kinematic reconstruction (CASE) 70
Speed measurement with laser gun on the accident spot (CONTROLS)
71
66
67
69
59
56
63
66
69
63
58
67
Figure 7. Speed values for one case (km/h)
Whole sample The graph in figure 8 shows the whole sample used in the study [9] with, for each case, the speed of the crash-involved vehicle (issued from the kinematic reconstruction), the mean of the speeds of the corresponding controls (measured with the laser speed gun), and the interval defined by the mean plus or minus the standard deviation (of the speed distribution for this group of controls).
Figure 8. Comparison of the travelling speed of each crash-involved car (case) with the speed distribution for control cars passing the same site (mean speed and interval defined by the mean +/- 1 standard deviation)
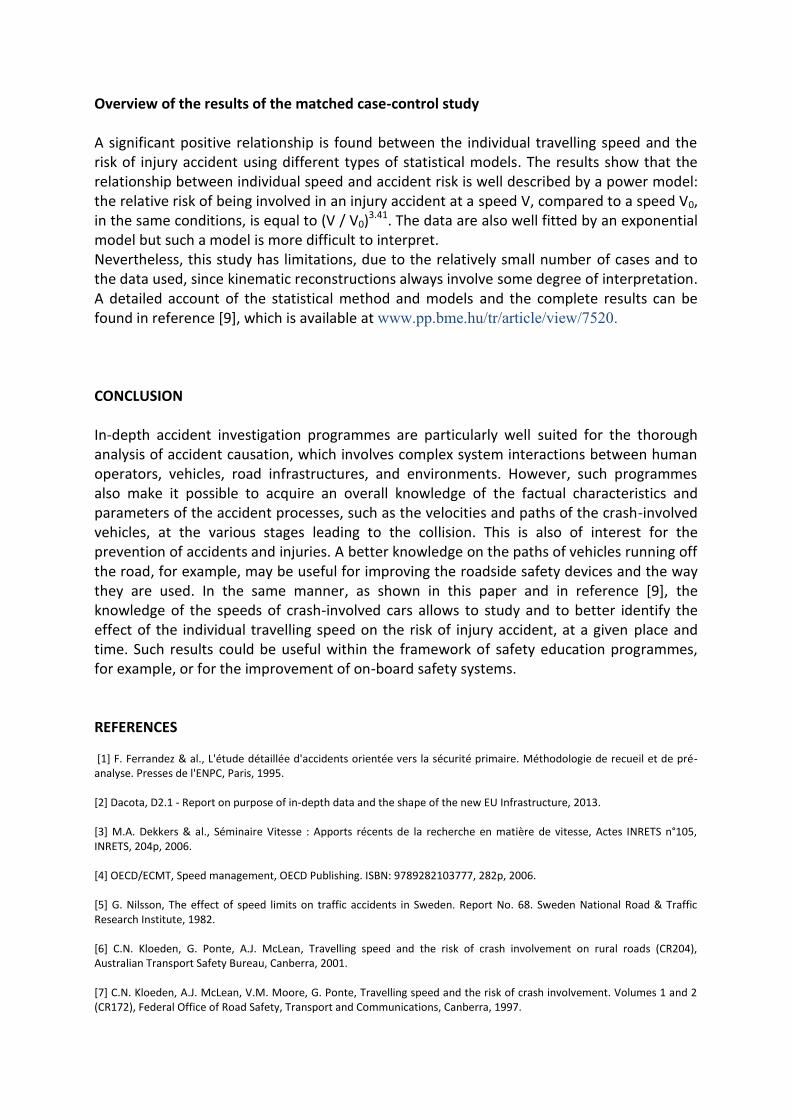
Overview of the results of the matched case-control study A significant positive relationship is found between the individual travelling speed and the risk of injury accident using different types of statistical models. The results show that the relationship between individual speed and accident risk is well described by a power model: the relative risk of being involved in an injury accident at a speed V, compared to a speed V0, in the same conditions, is equal to (V / V0)3.41. The data are also well fitted by an exponential model but such a model is more difficult to interpret. Nevertheless, this study has limitations, due to the relatively small number of cases and to the data used, since kinematic reconstructions always involve some degree of interpretation. A detailed account of the statistical method and models and the complete results can be found in reference [9], which is available at www.pp.bme.hu/tr/article/view/7520. CONCLUSION In-depth accident investigation programmes are particularly well suited for the thorough analysis of accident causation, which involves complex system interactions between human operators, vehicles, road infrastructures, and environments. However, such programmes also make it possible to acquire an overall knowledge of the factual characteristics and parameters of the accident processes, such as the velocities and paths of the crash-involved vehicles, at the various stages leading to the collision. This is also of interest for the prevention of accidents and injuries. A better knowledge on the paths of vehicles running off the road, for example, may be useful for improving the roadside safety devices and the way they are used. In the same manner, as shown in this paper and in reference [9], the knowledge of the speeds of crash-involved cars allows to study and to better identify the effect of the individual travelling speed on the risk of injury accident, at a given place and time. Such results could be useful within the framework of safety education programmes, for example, or for the improvement of on-board safety systems. REFERENCES [1] F. Ferrandez & al., L'étude détaillée d'accidents orientée vers la sécurité primaire. Méthodologie de recueil et de pré-analyse. Presses de l'ENPC, Paris, 1995. [2] Dacota, D2.1 - Report on purpose of in-depth data and the shape of the new EU Infrastructure, 2013. [3] M.A. Dekkers & al., Séminaire Vitesse : Apports récents de la recherche en matière de vitesse, Actes INRETS n°105, INRETS, 204p, 2006. [4] OECD/ECMT, Speed management, OECD Publishing. ISBN: 9789282103777, 282p, 2006. [5] G. Nilsson, The effect of speed limits on traffic accidents in Sweden. Report No. 68. Sweden National Road & Traffic Research Institute, 1982. [6] C.N. Kloeden, G. Ponte, A.J. McLean, Travelling speed and the risk of crash involvement on rural roads (CR204), Australian Transport Safety Bureau, Canberra, 2001. [7] C.N. Kloeden, A.J. McLean, V.M. Moore, G. Ponte, Travelling speed and the risk of crash involvement. Volumes 1 and 2 (CR172), Federal Office of Road Safety, Transport and Communications, Canberra, 1997.

[8] C.N. Kloeden, A.J. McLean, G. Glonek, Reanalysis of travelling speed and the risk of crash involvement in Adelaide South Australia (CR207), Australian Transport Safety Bureau, Canberra, 2002. [9] T. Brenac, C. Perrin, B. Canu, J. Magnin, A. Canu, Influence of Travelling Speed on the Risk of Injury Accident: a Matched Case-Control Study. Periodica Polytechnica Transportation Engineering, Vol. 43, No. 3, pp. 129-137, DOI: 10.3311/PPtr.7520, 2015. [10] D. Lechner, La reconstitution cinématique des accidents. Rapport de recherche INRETS n° 21, 1986.
IAM Think Piece
Neale Kinnear & Alan Stevens 1 TRL 2015 ©
Driver Distraction
Prepared for IAM RoadSmart by Dr Neale Kinnear and Professor Alan Stevens
TRL, Crowthorne House, Nine Mile Ride, Wokingham, Berks, UK, RG40 3GA.
1 Introduction This report for the Institute of Advanced Motorists (IAM) summarises recent research and knowledge from scientific studies about distracted driving. The report defines what it means to be ‘distracted’ when driving, discusses the impact of distraction on driver behaviour and safety, and what can be done to reduce distracted driving. The focus of distraction discussed here relates to how drivers engage with technology when driving.
The report begins with a background to driver distraction, followed by discussion about what is actually meant by driver distraction. It is then considered why humans cannot successfully do two things at the same time, particularly within the context of driving. The subsequent section summarises the scientific research findings to date with regard to driver distraction and technology, and how this affects different types of road user. Recommendations for how driver distraction can be mitigated in the real world and a summary conclude the report. Responses to common questions raised by drivers are presented in Appendix A.
2 Background
Being distracted can make drivers less aware of other road users such as pedestrians, cyclists and road workers and less observant of road rules such as speed limits and junction controls. The emergence of mobile and in-vehicle technology in particular has prompted much recent concern about driver distraction and its impact on driver behaviour and safety. In Britain, the Department for Transport (DfT) reports that in 2013 there were 2,995 cases where distraction in the vehicle is listed as a contributory factor, making up 3% of all accidents, and 1,627 where distraction outside the vehicle was a contributory factor, making up 1% of all accidents. Of these, 84 and 27 were fatal accidents, making up 6% and 2% of all fatal accidents respectively. These figures are likely to be underestimates given the difficulty in determining contributory factors after accidents have occurred, and the often transitory nature of distraction.
The specific influence of technology and electronic devices on distraction-related accidents is difficult to determine as there is a lack of reliable data. Although there are numerous reports containing the frequency of use of mobile phones and other electronic devices in road traffic, determining the true relationship between levels of use and accident risk is difficult.
Official accident data from across Europe indicates how varied the measured contribution of distraction to road accidents is, with estimates ranging from a few percent to over half. It is probable that various definitions of distraction and inattention are used when collecting data and this is likely to explain some of the variance in estimates; in addition some countries simply don’t collect data on distraction at all. It is also worth noting that the increase of mobile communication and in-vehicle technologies into the mass market is a relatively recent phenomenon and will have varied market penetration from country to country. It is possible that studies are relying on data that may not reflect current conditions and conditions that are not comparable between countries.
Even in-depth accident investigation studies have relied upon broad definitions of distraction and inattention as contributory factors. It is not known whether this is because there are few instances of these events occurring or whether it is due to difficulties in recording such instances because of the lack of any retrospective evidence. For example, it is often difficult to attribute the cause of an accident to a distracting event that occurred prior to the crash and is no longer present.

IAM Think Piece
Neale Kinnear & Alan Stevens 2 TRL 2015 ©
3 What actually is ‘distraction’ when driving? Drivers do much more than control the vehicle when driving. Video observation research reveals them engaging in various secondary activities including:
• Adjusting an entertainment system or climate control
• Consulting maps
• Eating / drinking / smoking
• Interacting with passengers
• Looking at roadside objects / signs / advertising
• Reading and writing
• Adjusting clothing and undertaking body care
• Text messaging, internet, social media and talking on a mobile phone
Driver distraction occurs when a driver diverts their attention away from the activities needed for safe driving. By “safe driving” we mean exercising sufficient awareness of the environment and control of the vehicle to maintain a reasonable safety margin allowing for unexpected events. This requires continuous monitoring of the road, infrastructure and traffic environment including the road ahead and the behaviour of other road users. Distracted driving is the state that occurs when attention is given to a non-driving related activity, typically to the detriment of driving performance1. Diversion of attention might be due to some event, activity, object or person, within or outside the vehicle.
Inattention is a broader term than distraction. A driver can be inattentive due to distraction (misdirected attention) OR due to being insufficiently attentive (e.g. fatigued or unmotivated) such that a gap emerges between the requirements for safe driving and the attention a driver gives to driving. Giving insufficient attention to the task of driving is rather different from misdirecting it (i.e. being distracted), although driving performance will suffer and the overall risk of a crash increases in both cases.
3.1 Types of distractions
Driver distraction can be classified into the following four sub-categories, depending on what the source of distraction is:
Cognitive or mental distraction occurs when the driver's mind is engaged with other tasks not necessary for safe driving, and that compete with mental or cognitive resources needed for driving.
Visual distraction occurs when a driver takes their eyes off the road. Typically this is caused when the driver looks away from the road to engage in a secondary activity either inside (e.g. radio, telephone, sat-nav) or outside (e.g. signs, advertisements) of the vehicle.
Auditory distraction occurs when a driver is subjected to noise that diverts attention from activities necessary for safe driving. Auditory distraction is likely to be combined with other distractions such as looking to establish the source (e.g. to locate a ringing telephone) or paying attention to a phone conversation impacting on cognitive resources. Audible vehicle warnings meanwhile may offer a positive form of ‘attention-grabbing’ when they highlight an essential safety risk (e.g. seat belt warning or lane departure warning).
1 Engström et al. (2013) – see Sources section for full reference
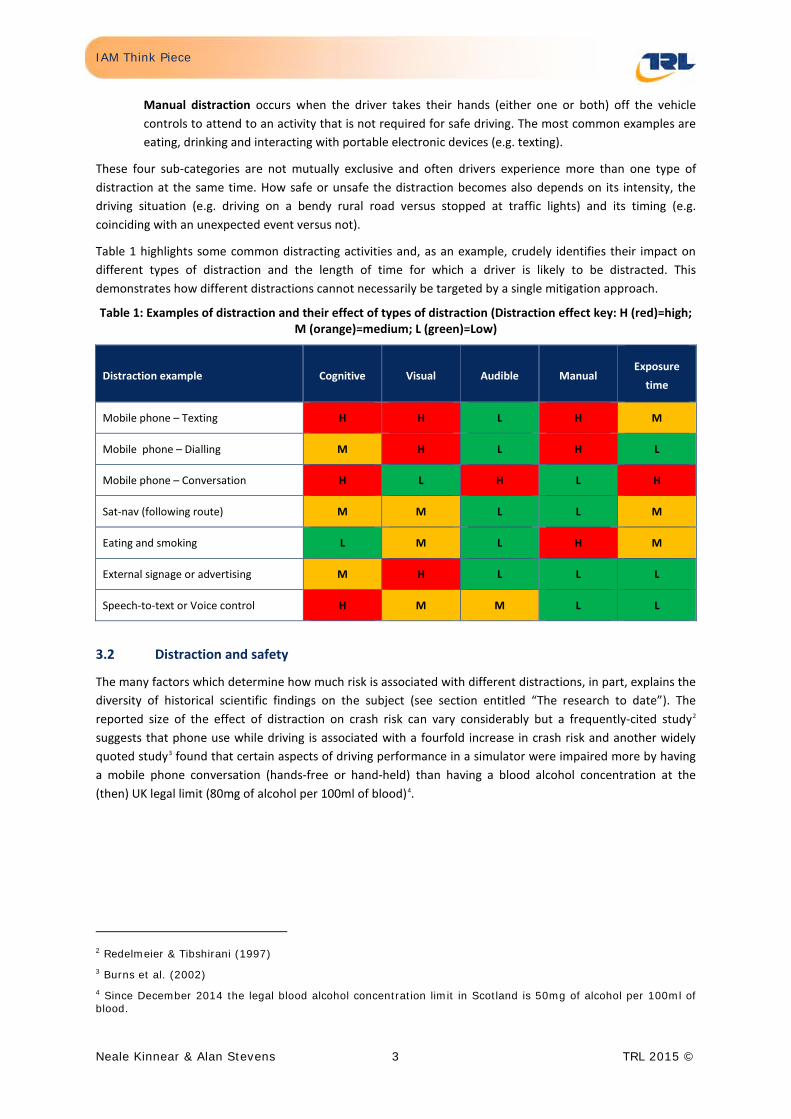
IAM Think Piece
Neale Kinnear & Alan Stevens 3 TRL 2015 ©
Manual distraction occurs when the driver takes their hands (either one or both) off the vehicle controls to attend to an activity that is not required for safe driving. The most common examples are eating, drinking and interacting with portable electronic devices (e.g. texting).
These four sub-categories are not mutually exclusive and often drivers experience more than one type of distraction at the same time. How safe or unsafe the distraction becomes also depends on its intensity, the driving situation (e.g. driving on a bendy rural road versus stopped at traffic lights) and its timing (e.g. coinciding with an unexpected event versus not).
Table 1 highlights some common distracting activities and, as an example, crudely identifies their impact on different types of distraction and the length of time for which a driver is likely to be distracted. This demonstrates how different distractions cannot necessarily be targeted by a single mitigation approach.
Table 1: Examples of distraction and their effect of types of distraction (Distraction effect key: H (red)=high; M (orange)=medium; L (green)=Low)
Distraction example Cognitive Visual Audible Manual Exposure
time
Mobile phone – Texting H H L H M
Mobile phone – Dialling M H L H L
Mobile phone – Conversation H L H L H
Sat-nav (following route) M M L L M
Eating and smoking L M L H M
External signage or advertising M H L L L
Speech-to-text or Voice control H M M L L
3.2 Distraction and safety
The many factors which determine how much risk is associated with different distractions, in part, explains the diversity of historical scientific findings on the subject (see section entitled “The research to date”). The reported size of the effect of distraction on crash risk can vary considerably but a frequently-cited study2 suggests that phone use while driving is associated with a fourfold increase in crash risk and another widely quoted study3 found that certain aspects of driving performance in a simulator were impaired more by having a mobile phone conversation (hands-free or hand-held) than having a blood alcohol concentration at the (then) UK legal limit (80mg of alcohol per 100ml of blood)4.
2 Redelmeier & Tibshirani (1997) 3 Burns et al. (2002) 4 Since December 2014 the legal blood alcohol concentration limit in Scotland is 50mg of alcohol per 100ml of blood.

IAM Think Piece
Neale Kinnear & Alan Stevens 4 TRL 2015 ©
Factors involved in distraction related crash risk Timing – coinciding with an unexpected event is more critical in a high workload situation, such as when negotiating a junction
Intensity – texting requires more resource than listening to the radio
Resumability – the extent to which tasks can be dropped and re-started efficiently
Frequency – actions repeated more often are more likely to coincide with a critical event
Duration – duration of the distraction will increase the probability of the distraction coinciding with a critical situation
Hang-over effect – any lingering cognitive or emotional distraction beyond task completion.
However, the impact of distraction on safety depends on the duration of the distraction and how frequently it happens (i.e. the length of time for which the driver is exposed to the additional risk). For example, tuning the radio may cause visual, auditory and manual distraction, but for only a very short period of time; engaging in a hands-free telephone conversation does not require so much visual attention but the cognitive and auditory distraction is likely to extend for a significantly longer period of time (i.e. for the length of the call).
What is clear from research is that drivers knowingly engage in activities that they consider distracting. For example, surveys5 suggest that the majority of drivers are concerned about driver distraction, rate certain activities (such as reading and writing a text message and having a phone conversation) as being highly distracting when driving, yet also report undertaking these activities when driving on a regular (weekly) basis. Drivers are clearly aware that certain distracting activities affect their driving, but how accurately they are judging the relationship with crash risk is unknown. It is possible that drivers overestimate their ability to multi-task and their behaviour is being driven by other social and emotional motivations, such as the innate desire for communication and social interaction.
4 Why humans cannot do two things at the same time
4.1 Driving is a complex task
To understand distraction we must first understand how humans process information and their limits. Cognitive psychology is the study of internal mental processes such as learning, memory and skilled performance. Through decades of study psychologists know a great deal about these internal mental processes. Specifically, the limitations of mental performance are well understood; for example we understand the amount of information people can generally hold in their short-term memory, and the way people process the information around them when trying to perform more than one task at once.
One relevant concept here is that we know different parts of the brain do different things. The mental processes used to perform complex skills are reliant on various areas of the brain, or combinations of them. Driving is a complex skill and therefore draws on many mental processes and parts of the brain. A brief consideration of even the simplest journey by car will confirm this; to reach your destination a driver needs to remember the route (memory – short or long term depending on whether they already know the route), they need to maintain control of their vehicle (physical and perceptual skill), interact safely with other road users (perceptual and cognitive skill involving anticipation and understanding of other road users’ intentions) and do
5 For example, RAC (2014) and Lansdown (2012)
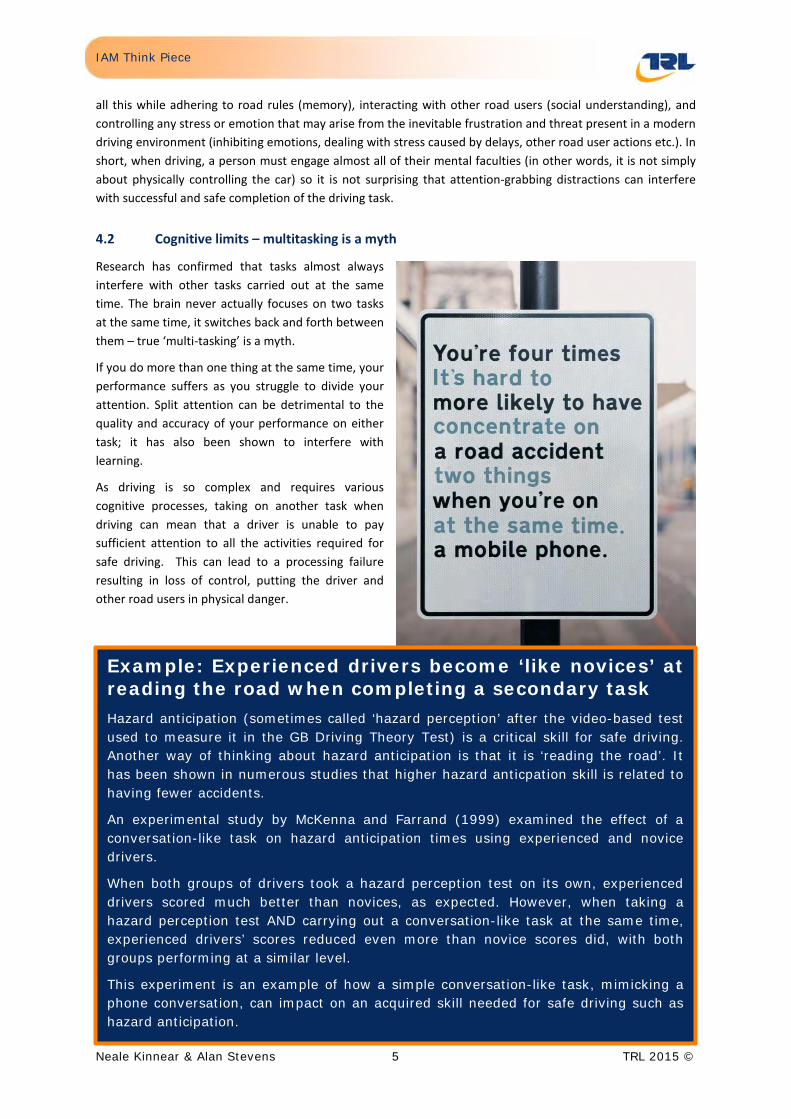
IAM Think Piece
Neale Kinnear & Alan Stevens 5 TRL 2015 ©
all this while adhering to road rules (memory), interacting with other road users (social understanding), and controlling any stress or emotion that may arise from the inevitable frustration and threat present in a modern driving environment (inhibiting emotions, dealing with stress caused by delays, other road user actions etc.). In short, when driving, a person must engage almost all of their mental faculties (in other words, it is not simply about physically controlling the car) so it is not surprising that attention-grabbing distractions can interfere with successful and safe completion of the driving task.
4.2 Cognitive limits – multitasking is a myth
Research has confirmed that tasks almost always interfere with other tasks carried out at the same time. The brain never actually focuses on two tasks at the same time, it switches back and forth between them – true ‘multi-tasking’ is a myth.
If you do more than one thing at the same time, your performance suffers as you struggle to divide your attention. Split attention can be detrimental to the quality and accuracy of your performance on either task; it has also been shown to interfere with learning.
As driving is so complex and requires various cognitive processes, taking on another task when driving can mean that a driver is unable to pay sufficient attention to all the activities required for safe driving. This can lead to a processing failure resulting in loss of control, putting the driver and other road users in physical danger.
Example: Experienced drivers become ‘like novices’ at reading the road when completing a secondary task Hazard anticipation (sometimes called ‘hazard perception’ after the video-based test used to measure it in the GB Driving Theory Test) is a critical skill for safe driving. Another way of thinking about hazard anticipation is that it is ‘reading the road’. It has been shown in numerous studies that higher hazard anticpation skill is related to having fewer accidents.
An experimental study by McKenna and Farrand (1999) examined the effect of a conversation-like task on hazard anticipation times using experienced and novice drivers.
When both groups of drivers took a hazard perception test on its own, experienced drivers scored much better than novices, as expected. However, when taking a hazard perception test AND carrying out a conversation-like task at the same time, experienced drivers’ scores reduced even more than novice scores did, with both groups performing at a similar level.
This experiment is an example of how a simple conversation-like task, mimicking a phone conversation, can impact on an acquired skill needed for safe driving such as hazard anticipation.
IAM Think Piece
Neale Kinnear & Alan Stevens 6 TRL 2015 ©
4.3 Driver behaviour and safety margins
Various simple models of driver behaviour have been proposed in which drivers adapt their behaviour and allocation of attention in order to maintain a “safety margin” and thus avoid crashes. These models suggest that drivers aim to drive within an acceptable range of task demand that feels comfortable, leaving a margin for error which the driver is prepared to accept. The physical and mental demand of driving is dependent on many factors in the driver’s environment. If demand is high and approaches a driver’s capability to control the vehicle then feelings of anxiety or fear for both safety and prosecution (e.g. if breaking the speed limit) are likely to cause a driver to take action (e.g. reduce their speed).
While a driver can often control the sense of demand by altering their speed, drivers may also take on tasks, such as speaking on a mobile phone, when the driving context is unchallenging (low task demand) or dump tasks when driving requires extra attention (high task demand). The effect of the extra demand caused by mobile phone conversations has been demonstrated with drivers found to reduce their speed and increase their following distance in order to reduce overall demand when engaged in this secondary task.
Of course, drivers may have erroneous expectations of the driving environment, may overestimate their abilities, or have strong motivations to engage in an additional (non-driving) task. Differences between novice and experienced drivers’ behaviours and particularly their allocation of attention suggest that appropriate attention allocation is a skill acquired through repeated practice at and exposure to driving. However, as already shown (box above) both inexperienced and experienced drivers are affected by performing non-driving related tasks when driving.
5 The research to date
5.1 Technology and distraction
5.1.1 A brief history
In-car radios were, perhaps, the first form of new technology to be widely used while driving a road vehicle. In-car entertainment systems have become virtually ubiquitous and fitted as standard by vehicle manufacturers. With the development of portable information and communication devices, drivers may also
IAM Think Piece
Neale Kinnear & Alan Stevens 7 TRL 2015 ©
Observational Study of Mobile Phone Use
In 2014, 1.6 per cent of all drivers in England and Scotland were observed using a hand-held mobile phone whilst driving according to a DfT study. Drivers were more likely to be observed with a mobile phone in their hand rather than holding it to their ear (1.1 % in hand and 0.5% to ear).
This suggests that while holding the phone in their hand, drivers are using the speaker-phone function while calling (perhaps to look less conspicuous when engaged in what is essentially still a hand-held call) or that they are engaged in other smartphone activities (e.g. texting, internet, social media).
bring a plethora of personal equipment into a vehicle, some of which can even connect to the vehicle (for example via Bluetooth and Wifi).
In-vehicle devices such as information and communication systems can greatly assist the driver (for example by indicating suitable routes) but each new technology that enters the market has the potential to influence driving behaviour, and may increase or decrease distraction; it is difficult to predict the precise impact of new technologies in advance.
Drivers interact with the technology using a ‘Human Machine Interface’, or HMI, and behind the interface is the logic and software of the interaction which contributes greatly to its look and feel. Designing or choosing an HMI that is appropriate for the context of use can have a decisive effect on the safety, effectiveness and ease of use of technology and services for individuals and for widely different groups of users.
One key conclusion of early research in laboratories and with driving simulators was that using a mobile phone was distracting and that text messaging causes visual as well as manual distraction in addition to cognitive distraction. Therefore, this behaviour is considered even more dangerous than simply using the phone to make calls.
Such research findings led to the introduction of laws during the 2000s in the UK and elsewhere (e.g. the Netherlands) to restrict hand-held mobile phone usage, and to educational campaigns to
raise awareness about the risks of distracted driving. There is limited evidence for the effectiveness of these approaches but drivers continue to use their mobile devices while driving, and it remains a key concern for road safety. One of the reasons has been the growing functionality of mobile phones as smartphone market penetration rose rapidly and drivers became accustomed to doing more with their phones. Numerous laboratory and simulator studies have concluded that concurrent use of a mobile phone or smartphone while driving impacts negatively on the performance of both the phone task and driving. How this relates to safety in the real world has been more difficult to determine.
Measurements made in laboratory settings and driving simulators may not be representative of real driving behaviour. This is because in real driving contexts drivers can choose when to interact (or not) with devices – and can modify their driving style to compensate to some extent for other demands on their attention.
5.1.2 Naturalistic studies
A “naturalistic” driving study aims to unobtrusively record driver behaviour. Analysis of video and other data collected during a participant’s driving can be used to identify safety-related events, although the interpretation of results can be problematic and controversial.
Recent “naturalistic” driving studies have shown that driver distraction from new technologies is a much more complex problem than initially thought. In large studies in the USA, tasks necessitating glances away from the road, such as text messaging and dialling, have been confirmed to be highly distracting but the risks associated
IAM Think Piece
Neale Kinnear & Alan Stevens 8 TRL 2015 ©
“An off road glance is only perfectly safe when the safety margins adopted are sufficient to protect the driver if the situation changes rapidly during the glance”
(Victor et al., 2014)
with conversing on a mobile phone are mixed and dependent on crash types6. Drivers make behaviour modifications (possibly unconsciously) when engaging in a mobile phone conversation while driving; for example they reduce speed, increase distance to the vehicle in front, stay in lane and increase focus on the forward road. These behaviours appear to increase the safety margin for rear-end collisions, although it is likely that the safety margin for unexpected events that occur in the driver’s periphery is consequently reduced.
In general, naturalistic studies suggest that conversing on a mobile phone is not as risky as locating the phone, dialling the phone or texting and that the critical factors in this differentiation are the time the eyes are off the road and the safety margin adopted by the driver. Clearly a driver not looking at the forward road scene is unable to properly control their vehicle and the longer they look away the more their
awareness of the external situation reduces. It is not surprising, therefore, that research shows that long glances away from the forward roadway strongly increase crash risk.
It is worth noting that phone conversations tend to last a lot longer than texting or dialling. While a driver can mitigate some of their risk (for example for rear end collisions) when driving and conversing on a mobile phone, the longer they are less engaged with driving and their surroundings, the more chance there is of something happening outside of their control, due to something they have failed to anticipate. For this reason, conversing on a mobile phone while driving is still considered to be a road safety risk overall.
The case of the mobile phone highlights why the use of technology when driving must be considered as task specific rather than device specific. The use of a mobile phone while driving can involve tasks such as locating the phone, answering a call, finding a contact, dialling a number, reading a text, writing a text, playing a game, accessing the internet, map reading and satellite navigation. Each of these sub-tasks of mobile phone use will require varying forms of physical, auditory, visual and cognitive resources, and impact driving behaviour and safety differently. Aside from a complete ban on electronic devices while driving, distraction can only be resolved with consideration of each task individually.
5.1.3 Future technologies
In the last few years vehicles have become available offering Head Up Displays (HUDs), speech-to-text and voice command functions. The impact of these on distraction in practice is largely unknown but is an increasing area for research. Some in-depth experimental studies in the USA suggest that the cognitive distraction caused by certain voice-based systems can exceed traditional forms of engagement with technology and may in fact have the unintended consequence of increasing driver distraction7. Such findings highlight the importance of device design and development of the HMI (Human Machine Interface).
A new class of technology dubbed “wearables” is also likely to affect driver behaviour and distraction. For example, smart glasses are multifunctional computers which are worn on the head and typically display visual information to the user through lenses mounted in or near the eye line. These could reduce driver distraction in comparison with conventional displays or may present information in a more compelling manner, resulting in additional distraction.
6 Victor et al. (2014); Fitch et al., (2013); Klauer et al., (2006; 2010; 2014); Hickman et al. (2010); Olson et al., (2009) 7 Strayer et al. (2013; 2014)
IAM Think Piece
Neale Kinnear & Alan Stevens 9 TRL 2015 ©
Another technology trend is that of “black box” data collection (typically for insurance or fleet management purposes) and this could be extended to identify what systems were activated and what the driver is doing. Such data would be of use in crash reconstruction, although knowledge that data on driver and other factors were being collected might influence driver behaviour.
5.2 Distraction and types of road users
5.2.1 Young drivers
Young and inexperienced drivers are at greater crash risk due to a lack of mature visual search patterns, poor calibration of expected risk with actual risk, over-confidence, and an inability to anticipate hazards effectively. Young drivers are also the most likely cohort of drivers to own and use mobile communications technology and other electronic devices.
Recent studies8 with young and novice drivers suggest that when looking away from the road for more than two seconds due to engagement with a mobile communication device there was a greater risk of a crash or near-crash event. For each additional second the driver looked away, the risk of a crash or near-crash event increased. Results also suggest that multiple short glances (e.g. <1s) are more beneficial than longer single glances. These studies have also noted that long glances away from the road for more than two seconds are rare but strongly associated with the use of mobile electronic devices, and that young drivers were more likely than older drivers to look away from the road for longer periods of time.
5.2.2 Older Drivers
In general, research suggests that age related decline in visual perception and cognitive executive functions affect older drivers’ driving performance. However, older drivers appear to compensate for such limitations by choosing when and where they drive and also how they drive. A TRL study for the IAM9 found that while older drivers took around a second longer to respond to a pedestrian walking out from behind a parked car than did younger drivers (in a simulated scenario), because of their slower initial speed they stopped further from the pedestrian than younger drivers. Possibly due to age related decline, studies10 appear to indicate that the effect of mobile phone use while driving is exaggerated for older drivers when compared with other age groups and that older drivers demonstrate greater difficulty when following route guidance technologies.
5.2.3 Professional Drivers
Professional drivers are often required to engage with more in-vehicle equipment than private drivers, spend long periods of time in their vehicles and can be under time pressure. Employers are increasingly recognising that they have a duty of care towards their employees and the public, and that it makes business as well as safety sense to have strict no-distraction policies for technologies such as mobile phones when driving.
Most of the evidence for distraction of professional drivers comes from naturalistic studies of heavy goods vehicle drivers in the USA. One study11 reported that drivers were performing tasks unrelated to driving during 56.5% of safety-critical events. In addition, drivers who texted while driving were 23 times more likely to be involved in a safety-critical event than drivers who did not. However, drivers who talked on a mobile phone (hands-free or handheld) while driving were no more likely to be involved in a safety critical event than those who did not. There is evidence that drivers self-regulate the demand of the driving task when engaging in a 8 Foss & Goodwin (2014); Klauer et al. (2014); Simons-Morton et al. (2014) 9 Reed et al. (2012) 10 For example, Aksan et al. (2013); Cooper et al. (2003); Dingus et al., (1997); Fofanova & Vollrath (2011) 11 Olson et al. (2009)
IAM Think Piece
Neale Kinnear & Alan Stevens 10 TRL 2015 ©
Standard definitions Driver inattention: “…inattention occurs when the driver’s allocation of resources to activities does not match the demands of activities required for the control of safety margins.”
Driver distraction: “…where the driver allocates resources to a non-safety critical activity while the resources allocated to activities critical for safe driving do not match the demands of these activities.”
Activities critical for safe driving: “…those activities required for the control of safety margins…”
(Engström et al., 2013)
phone conversation by manipulating their speed, following-distance and focus on the forward roadway. The main difference proposed to offset the increased demand of the phone conversation task (and risk) for commercial drivers has been found to be increased visual attention to the forward roadway when engaged in conversations on the phone.
5.2.4 Cyclists
There are very few experimental studies of distraction when cycling although surveys indicate that the use of portable electronic devices when cycling is a growing trend. Experimental studies12 indicate that the effects of mobile phone use on cycling behaviour are similar to the effects of mobile phone use on driving behaviour. When talking or texting on a mobile phone while cycling bicyclists travel at slower speeds, miss more information from the periphery and swerve more within the bike path.
5.2.5 Pedestrians
There is only a small body of research detailing the distracting effects of portable electronic devices on pedestrian behaviour. Nevertheless, secondary task use of devices such as mobile phones appears to have similar effects for pedestrians as it does for drivers and bicyclists, particularly with regard to reduced peripheral attention. These studies suggest that successful crossing behaviour is compromised when engaged with another activity, with texting on a mobile phone in particular increasing the likelihood of being hit by a vehicle in a simulated environment.
6 Recommendations for reducing distraction This section considers how to address distraction in a real-world context. It discusses some important considerations and possible mitigation strategies involving various stakeholders. There are different national and local approaches to mitigate distraction ranging from guidelines and advice, to bans on specific activities or functions (such as texting or hand-held phone use). To increase safety there appears to be a need for an array of countermeasures and a need for cooperation between different stakeholders.
6.1 Measuring and understanding the impact of distraction on safety
There are still many questions around distraction and its impact on road safety and with developments in vehicle technology and information technology more generally, there are always new opportunities for unintended impacts.
There is a particular need to better understand the role of distraction in road traffic crashes and this could involve review and development of existing reporting systems and analysis of on-board vehicle data.
12 de Waard et al. (2010; 2011; 2014)
IAM Think Piece
Neale Kinnear & Alan Stevens 11 TRL 2015 ©
Recommendations:
• Adopt agreed standard definitions.
• Continue research on distraction particularly the impact of new technologies on safety, using standardised measures of real driver behaviour and crash data where possible.
• Improve analysis and understanding of the role of distraction in crashes.
• Monitor public opinion, attitudes and behaviour regarding the issue of driver distraction on a regular basis.
6.2 Laws and enforcement
There is little international consensus on how to decrease the impact of driver distraction through legislation. The most general laws, as in the UK, address careless driving and allow authorities to reprimand drivers who pose a risk.
Although the more specific laws banning the use of handheld phones have not led to a significant decrease in the number of crashes caused by distraction, many governments are still investigating how to refine or expand these laws. Others, such as Sweden, have taken a broader approach favouring to encourage and enforce personal responsibility for driving safely rather than a specific technology-related law.
Enforcement of existing driver distraction laws may be a key issue in reducing mobile device use in particular. Deterrence theory would suggest that the probability of detection and certainty of prosecution may be a greater dis-incentive to distracted driving than the legal penalty.
Enforcement can be problematic due to the difficulties in identifying distraction from outside the vehicle. Authorities also cite that miniaturisation of devices make detection difficult.
Recommendations:
• Support the general law approach such as driving without care and attention/careless driving.
• Provide guidance (possibly in the Highway Code and for new drivers) concerning interpretation and specific technology examples (which can be readily updated).
• Enforcement of mobile phone laws needs to be highly visible and publicised to maximise its effect on driver behaviour
6.3 Guidelines for technology
The ease of use of technology in a vehicle is dependent on the design of the controls and the interaction of all the various devices used by the driver (navigation, vehicle information displays, climate control buttons etc.) including portable devices such as smartphones.
There is a wide range of international standards covering visual and audible driver interfaces and dialogue management and much of this knowledge has been incorporated into design guidelines and codes of practice on how to develop in-car systems that minimise distraction.
The European Statement of Principles (ESoP), backed by the European Commission, is an example of a set of high-level design guidelines which vehicle manufacturers find useful as part of their design process and which do not constrain innovation. These guidelines represent a consensus that (unlike laws) can be more rapidly updated as technologies evolve. Supporting good human machine interface (HMI) design without being overly-prescriptive or technology-specific is likely to be helpful.
Recommendation:
IAM Think Piece
Neale Kinnear & Alan Stevens 12 TRL 2015 ©
• Support continued updating of HMI guidelines as an important tool for governments and the automotive industry to mitigate driver distraction.
• Support industry to develop their own best practice and explore mechanisms to ensure these meet the government-backed guidelines (e.g. through certification or consumer testing).
6.4 Technical approaches to restrict distraction
Technical solutions restricting smartphone functions within vehicles are available, for example by apps on the phone. They become active when the phone’s motion exceeds some threshold. Other systems are integrated into the vehicle and affect all cell phones in the vehicle through a small transmitter. These solutions can, for example, block incoming calls, texts and emails while in motion or when moving in a specific geographic area. Each system has a different strategy for addressing the “passenger problem” – whether and how to allow calls by someone in motion who is not a driver, such as a passenger in a car or a rider on a bus or train.
Such systems can be demonstrated to work technically but there is little information on their overall effectiveness in practice. Such approaches may be more likely to work in a fleet or organisational context where the fleet owner can have such equipment installed and periodically can check how effective it is.
A related technical approach is that of “workload management” such that the vehicle collects sensor information to estimate the driver’s current workload and then manages tasks and information such that the driver is less likely to become overloaded. For example, a text message might be delayed until the driver has left a busy road junction.
Recommendation:
• Support research to determine effectiveness of technological solutions.
• Publicise the availability of systems and approaches to restrict the functionality of potentially distracting in-vehicle technologies and encourage use and evaluation by fleet operators.
• Make vehicles to support drivers and avoid distraction: in-vehicle warnings and intervention-based systems can mitigate distraction – their uptake as standard may be a faster route to risk reduction than modifying driver behaviour.
6.5 Driving for work policies
Fleet managers and employers can have a substantial influence on the safety of their employees/drivers through policies, practices, instructions, training and feedback. A number of organisations have produced corporate guidelines, policies and advice on driver distraction. This can be supported and justified both in terms of safety and business benefits.
Governments and companies can influence change by setting an example, including specific requirements on minimum safety levels in their vehicle purchase and supply procurement policies. In the US, government employees are banned from texting while driving and when they are inviting tenders for transport or other services, they can do so only to providers who can demonstrate suitable policies and practices supporting safe driving.
Recommendation:
• The risk associated with distracted driving and the use of mobile phones and electronic devices should clearly be reflected in driving for work policies. Employers should ensure that the policy is clearly articulated and broadly communicated so that employees are aware of the existence of the policies.
• Government and employers should set minimum safety standards for procurement of vehicles and service providers.
IAM Think Piece
Neale Kinnear & Alan Stevens 13 TRL 2015 ©
6.6 Education and training
In general, drivers are aware of the risks associated with distracting activities. There is a particular issue with young and inexperienced drivers who have not developed the risk awareness and risk management skills that experienced drivers employ when interacting with in-vehicle devices. Experienced drivers typically adjust their behaviour to the requirements of traffic situations, nevertheless, they too have cognitive processing limitations. It is uncertain whether vulnerable road users (i.e. children, pedestrians and cyclists) are accurately appraising the greater risk of engaging with traffic when distracted.
Simply instructing drivers and other road users to not be distracted is unlikely to be sufficient and their use of electronic devices cannot be expected to be lower than what is deemed as socially acceptable.
Technology will continue to develop and working with technology manufacturers and drivers (and other road users) to identify the safest way to interact will likely be a more fruitful route within the educational approach. This might begin with in-school road safety education, being built upon during driver licensing, possibly alongside legislation that prevents the development of undesirable habitual technology use when driving, instead encouraging a responsible approach to engagement.
Recommendations:
• Review and strengthen the advice in the Highway Code and the learning to drive competency framework regarding distracted driving.
• Provide core messages at the early stages of road skills development (e.g. when providing road safety messages for pedestrian and cycling behaviour to children).
• Develop educational and training interventions specifically to guide the use of emerging technology in vehicles.
• Education and training should be carefully developed and evaluated to ensure no harm is being done (e.g. unintended consequences).
7 Summary It is widely accepted within the scientific community that humans cannot conduct multiple tasks at the same time without adverse effects on the performance of those tasks; this is due to the need to share their limited attentional resources and switch between tasks. When specifically studying driving, numerous experimental studies overwhelmingly demonstrate that driving performance (as measured by things like speed management, lane discipline and hazard perception) is impaired when a driver is also using a mobile electronic device or in-vehicle technologies (or performs tasks that mimic. However, the relationship with safety on the road is a more complex picture with some real-world studies showing that drivers’ adapt their behaviour when speaking on the phone and driving (for example, they slow down, stay in lane, increase distance to other vehicles and increase focus on the road ahead). Studies suggest that this change in behaviour is effective at increasing the safety margin to certain crash types (i.e. rear end crashes); however during the length of a phone call it is likely that the driver is much less likely to anticipate hazards and unexpected events in their periphery.
Adapting behaviour is an indication of drivers’ coping mechanisms for dealing with the added attentional demands of using technology, in order to maintain their safety margins. These changes are (possibly non-conscious) responses to the increased demand being placed upon their limited cognitive resources.
Overall the research suggests that the impact of distraction on safety is task-dependent rather than device dependent; for example, texting appears to be more dangerous than conversing on a mobile phone while driving. It seems that this may be related to a dynamic combination of ‘eyes off the road’ time necessary to

IAM Think Piece
Neale Kinnear & Alan Stevens 14 TRL 2015 ©
conduct the task and the safety margins with which a driver can afford themselves. Any mismatch in this process (e.g. failure to correctly appraise safety margins) will increase the risk of a crash.
Essentially though, all non-driving related tasks that require our attention will reduce the attention being paid to driving safely. With technology now a key part of our day-to-day lives it is important to consider how the research knowledge collected to date can inform strategies for reducing distraction and increasing safety on the roads. The recommendations made here suggest that the input and engagement of multiple stakeholders will be necessary.
IAM Think Piece
Neale Kinnear & Alan Stevens 15 TRL 2015 ©
Appendix A
Common questions Isn’t talking on the phone just the same as talking to a passenger?
• No. Passengers are more aware of the driving context and are known to modify their interaction depending on the traffic situation. For example, they are more likely to understand why a response is delayed or a conversation is interrupted.
• Research has shown that it is more demanding to have a conversation on the phone than with a passenger. Conversations on a phone tend to be less effective and the sound quality can often require more attention.
Car radios are not critical for driving but they have been in cars for years without any known safety problems?
• Even tuning the radio is distracting to some degree, but doesn’t usually last very long, and doesn’t require a high level of cognitive engagement. The evidence suggests that phone conversations do and tend to last for longer periods of time than things like tuning a radio.
• Any non-safety critical technology that requires the driver to engage with it for a long period of time or take their eyes off the road is distracting and will increase crash risk. In addition to speaking on the phone, that could involve typing directions into a sat-nav, finding music on a music player, texting or social media.
I am an experienced driver and I know when it is safe to use my phone.
• Even experienced drivers overestimate their abilities. It has been shown that experienced drivers can sometimes be more affected by distractions – they lose the benefits of their experience by being distracted and fail to anticipate hazards they would usually ‘see early’.
Young drivers have better reactions and can easily do other things while driving?
• The limits of human attention apply to everyone, regardless of age. Young drivers may have better reactions than older drivers, but we know that young, and particularly novice, drivers are not good at accurately judging their own abilities or the risks on the road. The result of this is smaller safety margins when things go wrong.
• Young people are also used to having unlimited access to their electronic equipment such as smartphones and may be less inhibited to respond when someone calls or sends them a messages.
I use devices when driving almost every day and I have never had an accident.
• In general, your risk of being in an accident increases when you engage in a non-driving activity while driving, according to the evidence. It does not mean you will crash, but you are more likely to be involved in a crash.
• The performance of your driving is also likely to suffer without you realising – for example you may be less aware of other drivers’ actions and may make bad decisions. Other drivers are likely to notice.
• Consider other road users, you are putting them at risk too.
IAM Think Piece
Neale Kinnear & Alan Stevens 16 TRL 2015 ©
Surely I can just slow down when I use electronic devices?
• Even if you do, it is unlikely that you will completely offset the safety deficit. Travelling at a lower speed will help, but the distracting effects may limit other attentional requirements like peripheral vision and hazard anticipation.
• In addition, you may make sudden changes in speed to which other drivers may find it difficult to react
• All drivers tend to overestimate their skill – you are unlikely to be able to know for sure if you are slowing down enough.
Isn’t driving ‘automatic’?
• No it is not – this is a common misperception – for example the skill of ‘reading the road’ or ‘hazard anticipation’ has been shown to be especially badly affected by having a phone conversation – even in experienced drivers.
• The bottom line is that whenever people do more than one thing at once, they inevitably perform one of those things (and often both of those things) worse than if they performed either task by itself.
I need to use my phone for work.
• Companies who change their policy to move away from phone use while driving tend to do so on the basis of caring about the health and safety of employees; companies also have a legal obligation to reduce risk.
• Many companies now accept that it looks more professional to have a workforce that does not use their phone while driving.
Many modern cars come ‘phone-ready’ – doesn’t this indicate that it is acceptable?
• All modern cars can all be driven quite easily at speeds far in excess of the speed limit. What a car is built to do by manufacturers is not necessarily a good indicator of the safety of that behaviour.
If it is so dangerous why is hands-free phone use not illegal?
• Driving poorly because you are distracted by using a mobile phone can result in the police charging you with failing to have proper control of your vehicle (handheld or hands-free).
• If you had a crash the police could check if you were using your phone (hands-free or handheld) at the time and may choose to prosecute you – you could be responsible for causing a crash and potentially injuring or killing another person.
Can I use my phone when stationary at traffic lights?
• You may consider this a lower risk situation but the Government advice is that the rules are the same if you’re stopped at traffic lights or queuing in traffic.
• It’s also illegal to use a hand-held phone or similar device when supervising a learner driver or rider.

IAM Think Piece
Neale Kinnear & Alan Stevens 17 TRL 2015 ©
IAM Think Piece
Neale Kinnear & Alan Stevens 18 TRL 2015 ©
Sources Aksan, N., Dawson, J. D., Emerson, J. L., Yu, L., Uc, E. Y., Anderson, S. W., & Rizzo, M. (2013). Naturalistic distraction and driving safety in older drivers. Human Factors, 55(4), 841–853.
Basacik, D., & Stevens, A. (2008). Scoping study of driver distraction. London: Department for Transport. Road Safety Research Report No. 95. October 2008. ISBN 978 1 906581 24 4.
Burns, P. C., Parkes, A., Burton, S., Smith, R. K., & Burch, D. (2002). How dangerous is driving with a mobile phone? Benchmarking the impairment to alcohol. TRL report 547. Crowthorne: TRL
Caird, J. K., Johnston, K. A., Willness, C. R., Asbridge, M., & Steel, P. (2014). A meta-analysis of the effects of texting on driving. Accident Analysis & Prevention, 71, 311-318.
Cooper, P. J., Zheng, Y., Richard, C., Vavrik, J., Heinrichs, B., & Siegmund, G. (2003). The impact of hands-free message reception/response on driving task performance. Accident Analysis & Prevention, 35(1), 23-35.
de Waard, D., Schepers, P., Ormel, W., & Brookhuis, K. (2010). Mobile phone use while cycling: Incidence and effects on behaviour and safety. Ergonomics, 53(1), 30-42.
de Waard, D., Edlinger, K., & Brookhuis, K. (2011). Effects of listening to music, and of using a handheld and handsfree telephone on cycling behaviour. Transportation research part F: traffic psychology and behaviour, 14(6), 626-637.
De Waard, D., Lewis-Evans, B., Jelijs, B., Tucha, O., & Brookhuis, K. (2014). The effects of operating a touch screen smartphone and other common activities performed while bicycling on cycling behaviour. Transportation research part F: traffic psychology and behaviour, 22, 196-206.
DfT (2014) Seatbelt and mobile phone use surveys: 2014 https://www.gov.uk/government/statistics/seatbelt-and-mobile-phone-use-surveys-2014
Dingus, T. A., Klauer, S. G., Neale, V. L., Petersen, A., Lee, S. E., Sudweeks, J., Perez, M. A., Hankey, J., Ramsey, D., Gupta, S., Bucher, C., Doerzaph, Z. R., Jermeland, J., and Knipling, R. R. (2006). “The 100-Car Naturalistic Driving Study, Phase II - Results of the 100-Car Field Experiment” DOT HS 810 593. National Highway Traffic Safety Administration, USDOT.
Driver distraction - the role and impact of governments. February 2013 SBD Report ARD/CON/519
Engström, J., Monk, C. A., Hanowski, R. J., Horrey, W. J., Lee, J. D., McGehee, D. V. & Yang, C. Y. D. (2013). A conceptual framework and taxonomy for understanding and categorizing driver inattention. Brussels, Belgium: European Commission.
European Commission (2008) ESoP. European Statement of Principles on the Design of Human Machine Interface. European Commission Information Society and Media Directorate-General – G4 ICT for Transport. Available at:
http://eur-lex.europa.eu/LexUriServ/LexUriServ.do?uri=OJ:L:2008:216:0001:0042:EN:PDF
Farrand, P., & McKenna, F. P. (2001). Risk perception in novice drivers: The relationship between questionnaire measures and response latency. Transportation research part F: traffic psychology and behaviour, 4(3), 201-212.
Federal Motor Carrier Safety Administration. The Large Truck Crash Causation Study Summary Report. 2005. Available at: http://ai.fmcsa.dot.gov/ltccs/default.asp. Accessed June 5, 2011.
Fofanova, J., & Vollrath, M. (2011). Distraction while driving: The case of older drivers. Transportation research part F: traffic psychology and behaviour, 14(6), 638-648.
IAM Think Piece
Neale Kinnear & Alan Stevens 19 TRL 2015 ©
Foss, R. D., & Goodwin, A. H. (2014). Distracted driver behaviors and distracting conditions among adolescent drivers: findings from a naturalistic driving study. Journal of Adolescent Health, 54(5), S50-S60.
Fuller, R. (2011). Driver control theory: from task difficulty homeostasis to risk allostasis. In Porter, B. (Ed.), Handbook of Traffic Psychology. London: Academic Press.
Hickman, J. S., Hanowski, R. J., & Bocanegra, J. (2010). “Distraction in commercial trucks and buses: Assessing prevalence and risk in conjunction with crashes and near-crashes.” Report No. FMCSA-RRR-10-049. Washington D.C.: Federal Motor Carrier Safety Administration.
Horswill, M. S., & McKenna, F. P. (1999). The effect of interference on dynamic risk-taking judgments. British journal of psychology, 90(2), 189-199.
Hyman, I. E. Jr., Boss, S. M., Wise, B. W., McKenzie, K. E. & Caggiano, J. M. (2010). Did You See the Unicycling Clown? Inattentional Blindness while Walking and Talking on a Cell Phone. Journal of Applied Cognitive Psychology, Vol. 24, 597-607.
Klauer, S. G., Dingus, T. A., Neale, V. L., Sudweeks, J. D., & Ramsey, D. J. (2006). The Impact of Driver Inattention on Near-Crash/Crash Risk: An Analysis Using the 100-Car Naturalistic Driving Study Data. Report No. DOT HS 810 594, National Highway Traffic Safety Administration, Washington, D. C.
Klauer, S. G., Guo, F., Simons-Morton, B. G., Ouimet, M. C., Lee, S. E., & Dingus, T. A. (2014). Distracted driving and risk of road crashes among novice and experienced drivers. New England journal of medicine, 370(1), 54-59.
Lansdown, T. C. (2012). Individual differences and propensity to engage with in-vehicle distractions–A self-report survey. Transportation research part F: traffic psychology and behaviour, 15(1), 1-8.
McKenna, F. P., & Farrand, P. (1999). The role of automaticity in driving. In Behavioural Research In Road Safety IX. PA3524/99.
Olson, R.L., Hanowski, R.J., Hickman, J.S., & Bocanegra, J. (2009). “Driver Distraction in Commercial Vehicle Operations.” Report No. FMCSA-RRR-09-042. Washington D.C.: Federal Motor Carrier Safety Administration.
Penumaka, A. P., Savino, G., Baldanzini, N., & Pierini, M. (2014). In-depth investigations of PTW-car accidents caused by human errors. Safety Science, 68, 212-221.
RAC (2014). RAC Report on Motoring 2014: Britain on the road. http://www.rac.co.uk/pdfs/report-on-motoring/rac-rom-2014-v16-compressed
Redelmeier, D. A. and R. J. Tibshirani (1997). “Association between cellular-telephone calls and motor vehicle collisions.” New England Journal of Medicine 336 (7), 453-458.
Reed, N., & Robbins, R. (2008). The effect of text messaging on driver behaviour: a simulator study. PPR 367 TRL Published Project Report.
Reed, N., Kinnear, N., & Weaver, L. (2012). Why do older drivers have more ‘failed to look’ crashes? A simulator based study. PPR635. Crowthorne: TRL
Regan, M. A., Hallett, C., & Gordon, C. P. (2011). Driver distraction and driver inattention: Definition, relationship and taxonomy. Accident Analysis & Prevention, 43(5), 1771-1781.
Regan, M. A., & Strayer, D. L. (2014). Towards an understanding of driver inattention: taxonomy and theory. Annals of advances in automotive medicine, 58, 5.
Sayer, J.R., Devonshire, J.M., & Flanagan, C.A. (2007). Naturalistic driving performance during secondary tasks. Available at: http://drivingassessment.uiowa.edu/DA2007/PDF/039 SayerDevonshire.pdf
IAM Think Piece
Neale Kinnear & Alan Stevens 20 TRL 2015 ©
Schwebel, D. C., Stavrinos, D., Byington, K. W., Davis, T., O’Neal, E. E. & Jong, D. (2012). Distraction and pedestrian safety: How Talking on the Phone, Texting, And Listening to Music Impact Crossing the Street. Journal of Accident Analysis & Prevention, Vol. 45, 266-271.
Simons-Morton, B. G., Guo, F., Klauer, S. G., Ehsani, J. P., & Pradhan, A. K. (2014). Keep your eyes on the road: Young driver crash risk increases according to duration of distraction. Journal of Adolescent Health, 54(5), S61-S67.
Stavrinos, D., Byington, K.W. & Schwebel, D.C., (2011). Distracted walking: cell phones increase injury risk for college pedestrians. Journal of Safety Research 42, 101–107.
Strayer, D. L., Watson, J. M., & Drews, F. A. (2011). 2 Cognitive Distraction While Multitasking in the Automobile. Psychology of Learning and Motivation-Advances in Research and Theory, 54, 29.
Strayer, D. L., Cooper, J. M., Turrill, J., Coleman, J.R., Medeiros-Ward, N., & Biondi, F. (2013). Measuring cognitive distraction in the automobile. Washington: AAA Foundation for Traffic Safety
Strayer, D. L., Turrill, J., Coleman, J.R., Ortiz, E.V. & Cooper, J. M. (2014). Measuring cognitive distraction in the automobile II: Assessing in-vehicle voice-based interactive technologies. Washington: AAA Foundation for Traffic Safety
Victor, T., Dozza, M., Bärgman, J., Boda, C. N., Engström, J., & Markkula, G. (2014). Analysis of Naturalistic Driving Study Data: Safer Glances, Driver Inattention, and Crash Risk. SHRP2: National Academy of Sciences
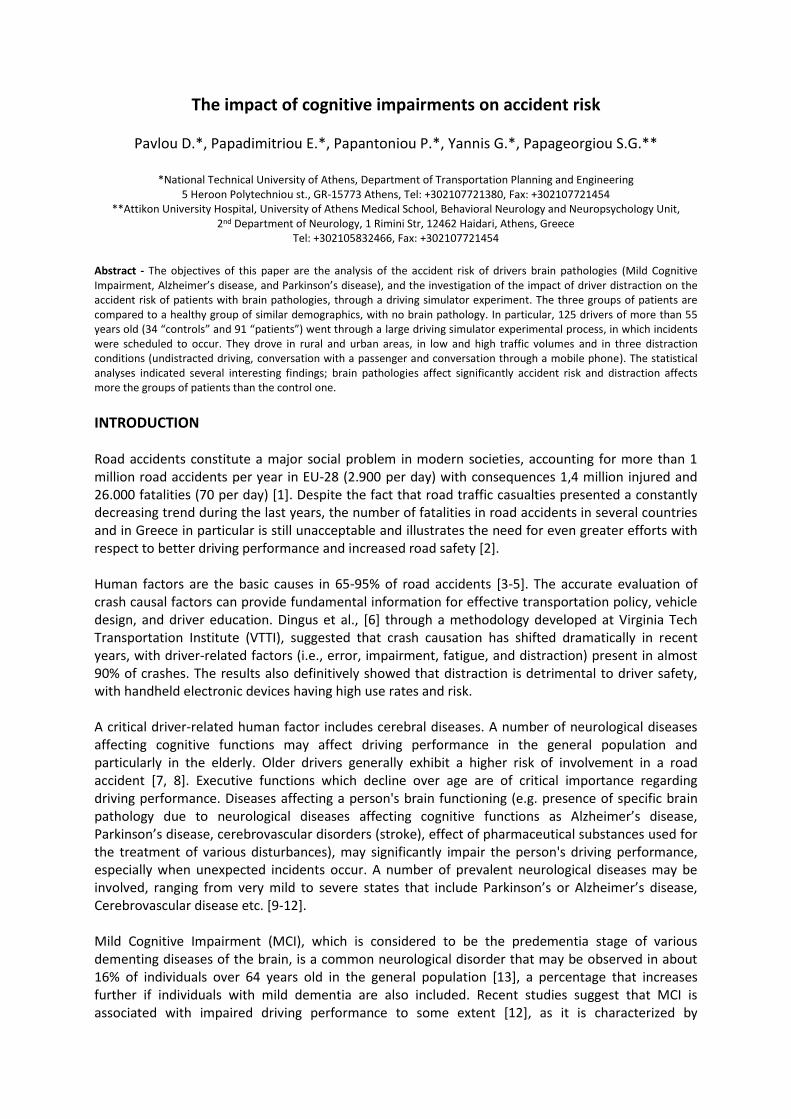
The impact of cognitive impairments on accident risk
Pavlou D.*, Papadimitriou E.*, Papantoniou P.*, Yannis G.*, Papageorgiou S.G.**
*National Technical University of Athens, Department of Transportation Planning and Engineering 5 Heroon Polytechniou st., GR-15773 Athens, Tel: +302107721380, Fax: +302107721454
**Attikon University Hospital, University of Athens Medical School, Behavioral Neurology and Neuropsychology Unit, 2nd Department of Neurology, 1 Rimini Str, 12462 Haidari, Athens, Greece
Tel: +302105832466, Fax: +302107721454
Abstract - The objectives of this paper are the analysis of the accident risk of drivers brain pathologies (Mild Cognitive Impairment, Alzheimer’s disease, and Parkinson’s disease), and the investigation of the impact of driver distraction on the accident risk of patients with brain pathologies, through a driving simulator experiment. The three groups of patients are compared to a healthy group of similar demographics, with no brain pathology. In particular, 125 drivers of more than 55 years old (34 “controls” and 91 “patients”) went through a large driving simulator experimental process, in which incidents were scheduled to occur. They drove in rural and urban areas, in low and high traffic volumes and in three distraction conditions (undistracted driving, conversation with a passenger and conversation through a mobile phone). The statistical analyses indicated several interesting findings; brain pathologies affect significantly accident risk and distraction affects more the groups of patients than the control one.
INTRODUCTION Road accidents constitute a major social problem in modern societies, accounting for more than 1 million road accidents per year in EU-28 (2.900 per day) with consequences 1,4 million injured and 26.000 fatalities (70 per day) [1]. Despite the fact that road traffic casualties presented a constantly decreasing trend during the last years, the number of fatalities in road accidents in several countries and in Greece in particular is still unacceptable and illustrates the need for even greater efforts with respect to better driving performance and increased road safety [2]. Human factors are the basic causes in 65-95% of road accidents [3-5]. The accurate evaluation of crash causal factors can provide fundamental information for effective transportation policy, vehicle design, and driver education. Dingus et al., [6] through a methodology developed at Virginia Tech Transportation Institute (VTTI), suggested that crash causation has shifted dramatically in recent years, with driver-related factors (i.e., error, impairment, fatigue, and distraction) present in almost 90% of crashes. The results also definitively showed that distraction is detrimental to driver safety, with handheld electronic devices having high use rates and risk. A critical driver-related human factor includes cerebral diseases. A number of neurological diseases affecting cognitive functions may affect driving performance in the general population and particularly in the elderly. Older drivers generally exhibit a higher risk of involvement in a road accident [7, 8]. Executive functions which decline over age are of critical importance regarding driving performance. Diseases affecting a person's brain functioning (e.g. presence of specific brain pathology due to neurological diseases affecting cognitive functions as Alzheimer’s disease, Parkinson’s disease, cerebrovascular disorders (stroke), effect of pharmaceutical substances used for the treatment of various disturbances), may significantly impair the person's driving performance, especially when unexpected incidents occur. A number of prevalent neurological diseases may be involved, ranging from very mild to severe states that include Parkinson’s or Alzheimer’s disease, Cerebrovascular disease etc. [9-12]. Mild Cognitive Impairment (MCI), which is considered to be the predementia stage of various dementing diseases of the brain, is a common neurological disorder that may be observed in about 16% of individuals over 64 years old in the general population [13], a percentage that increases further if individuals with mild dementia are also included. Recent studies suggest that MCI is associated with impaired driving performance to some extent [12], as it is characterized by
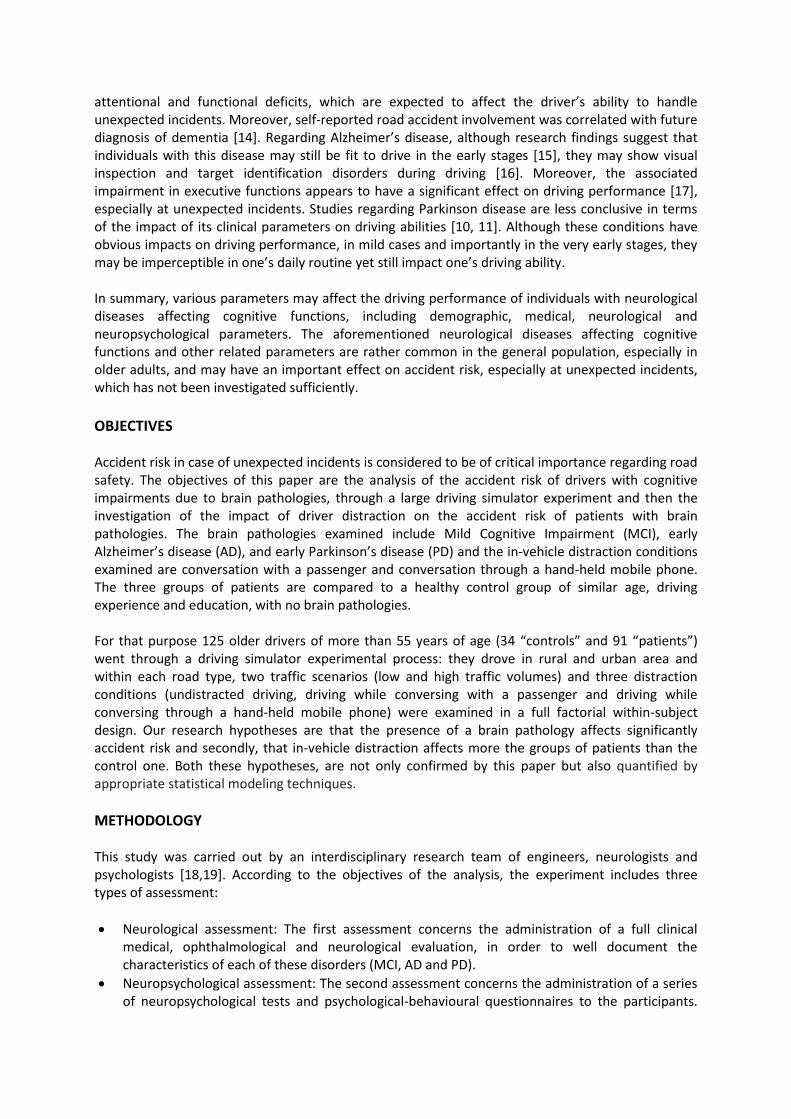
attentional and functional deficits, which are expected to affect the driver’s ability to handle unexpected incidents. Moreover, self-reported road accident involvement was correlated with future diagnosis of dementia [14]. Regarding Alzheimer’s disease, although research findings suggest that individuals with this disease may still be fit to drive in the early stages [15], they may show visual inspection and target identification disorders during driving [16]. Moreover, the associated impairment in executive functions appears to have a significant effect on driving performance [17], especially at unexpected incidents. Studies regarding Parkinson disease are less conclusive in terms of the impact of its clinical parameters on driving abilities [10, 11]. Although these conditions have obvious impacts on driving performance, in mild cases and importantly in the very early stages, they may be imperceptible in one’s daily routine yet still impact one’s driving ability. In summary, various parameters may affect the driving performance of individuals with neurological diseases affecting cognitive functions, including demographic, medical, neurological and neuropsychological parameters. The aforementioned neurological diseases affecting cognitive functions and other related parameters are rather common in the general population, especially in older adults, and may have an important effect on accident risk, especially at unexpected incidents, which has not been investigated sufficiently.
OBJECTIVES Accident risk in case of unexpected incidents is considered to be of critical importance regarding road safety. The objectives of this paper are the analysis of the accident risk of drivers with cognitive impairments due to brain pathologies, through a large driving simulator experiment and then the investigation of the impact of driver distraction on the accident risk of patients with brain pathologies. The brain pathologies examined include Mild Cognitive Impairment (MCI), early Alzheimer’s disease (AD), and early Parkinson’s disease (PD) and the in-vehicle distraction conditions examined are conversation with a passenger and conversation through a hand-held mobile phone. The three groups of patients are compared to a healthy control group of similar age, driving experience and education, with no brain pathologies. For that purpose 125 older drivers of more than 55 years of age (34 “controls” and 91 “patients”) went through a driving simulator experimental process: they drove in rural and urban area and within each road type, two traffic scenarios (low and high traffic volumes) and three distraction conditions (undistracted driving, driving while conversing with a passenger and driving while conversing through a hand-held mobile phone) were examined in a full factorial within-subject design. Our research hypotheses are that the presence of a brain pathology affects significantly accident risk and secondly, that in-vehicle distraction affects more the groups of patients than the control one. Both these hypotheses, are not only confirmed by this paper but also quantified by appropriate statistical modeling techniques.
METHODOLOGY This study was carried out by an interdisciplinary research team of engineers, neurologists and psychologists [18,19]. According to the objectives of the analysis, the experiment includes three types of assessment:
Neurological assessment: The first assessment concerns the administration of a full clinical medical, ophthalmological and neurological evaluation, in order to well document the characteristics of each of these disorders (MCI, AD and PD).
Neuropsychological assessment: The second assessment concerns the administration of a series of neuropsychological tests and psychological-behavioural questionnaires to the participants.
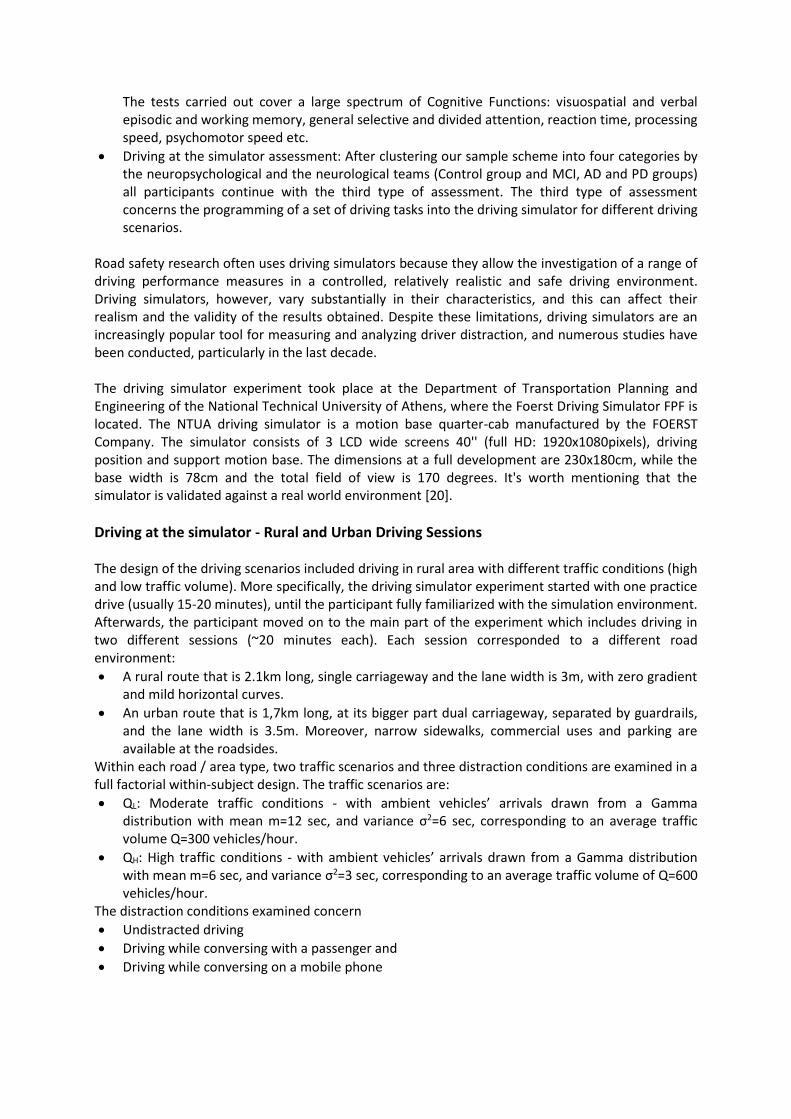
The tests carried out cover a large spectrum of Cognitive Functions: visuospatial and verbal episodic and working memory, general selective and divided attention, reaction time, processing speed, psychomotor speed etc.
Driving at the simulator assessment: After clustering our sample scheme into four categories by the neuropsychological and the neurological teams (Control group and MCI, AD and PD groups) all participants continue with the third type of assessment. The third type of assessment concerns the programming of a set of driving tasks into the driving simulator for different driving scenarios.
Road safety research often uses driving simulators because they allow the investigation of a range of driving performance measures in a controlled, relatively realistic and safe driving environment. Driving simulators, however, vary substantially in their characteristics, and this can affect their realism and the validity of the results obtained. Despite these limitations, driving simulators are an increasingly popular tool for measuring and analyzing driver distraction, and numerous studies have been conducted, particularly in the last decade. The driving simulator experiment took place at the Department of Transportation Planning and Engineering of the National Technical University of Athens, where the Foerst Driving Simulator FPF is located. The NTUA driving simulator is a motion base quarter-cab manufactured by the FOERST Company. The simulator consists of 3 LCD wide screens 40'' (full HD: 1920x1080pixels), driving position and support motion base. The dimensions at a full development are 230x180cm, while the base width is 78cm and the total field of view is 170 degrees. It's worth mentioning that the simulator is validated against a real world environment [20].
Driving at the simulator - Rural and Urban Driving Sessions The design of the driving scenarios included driving in rural area with different traffic conditions (high and low traffic volume). More specifically, the driving simulator experiment started with one practice drive (usually 15-20 minutes), until the participant fully familiarized with the simulation environment. Afterwards, the participant moved on to the main part of the experiment which includes driving in two different sessions (~20 minutes each). Each session corresponded to a different road environment:
A rural route that is 2.1km long, single carriageway and the lane width is 3m, with zero gradient and mild horizontal curves.
An urban route that is 1,7km long, at its bigger part dual carriageway, separated by guardrails, and the lane width is 3.5m. Moreover, narrow sidewalks, commercial uses and parking are available at the roadsides.
Within each road / area type, two traffic scenarios and three distraction conditions are examined in a full factorial within-subject design. The traffic scenarios are:
QL: Moderate traffic conditions - with ambient vehicles’ arrivals drawn from a Gamma distribution with mean m=12 sec, and variance σ2=6 sec, corresponding to an average traffic volume Q=300 vehicles/hour.
QH: High traffic conditions - with ambient vehicles’ arrivals drawn from a Gamma distribution with mean m=6 sec, and variance σ2=3 sec, corresponding to an average traffic volume of Q=600 vehicles/hour.
The distraction conditions examined concern
Undistracted driving
Driving while conversing with a passenger and
Driving while conversing on a mobile phone

Figure 1. Unexpected incident in rural road During each trial, 2 unexpected incidents were scheduled to occur during the drive (Figure 1). More specifically, incidents in rural area concerned the sudden appearance of an animal (deer or donkey) on the roadway, and incidents in urban areas concerned the sudden appearance of an adult pedestrian or of a child chasing a ball on the roadway or of a car suddenly getting out of a parking position and getting in the road. The hazard did appear at the same location for the same trial (i.e. rural area, high traffic) but not at the same location between the trials, in order not to have learning effects. Regarding the time that the hazard appeared, it depended on the speed and the time to collision, in order to have identical conditions for all the participants to react, either they drove fast or slowly. The accident risk was calculated as the proportion of the total incident crashes to the total incidents happened. The experiment was counterbalanced concerning the number and the order of the trials. However, rural drives were always first and urban drives were always second. This was decided for the following reasons: It was observed that urban area causes more often simulation sickness to the participants and thus it was decided to have the urban scenario second and secondly, counterbalancing in driving area means that we would have twice as much driving combinations which leads to much larger sample size requirements.
Sampling scheme For the purpose of this study 274 participants started the driving simulator experiment that was described in the above chapters. 49 participants were eliminated from the study because they had simulator sickness issues from the very beginning of the driving simulator experiment. Thus, 225 subjects (”patients” and “controls”) have been through the whole experiment procedure. 30 participants had a brain pathology which is beyond the purpose of this paper and thus, they are eliminated from the analyses. Finally, 70 participants were of younger age (<55 years old) and they are eliminated from this study too, in order not to have age as a parameter that may affects the results, but only their cerebral condition. Summarizing the above, the sampling scheme of this research is 125 participants of more than 55 years of age. Out of the 125 participants, 34 are controls (aver. 64.1 y.o., 25 males), and 91 are patients (aver. 71.2 y.o., 59 males): 28 AD patients (aver. 75.4 y.o.), 43 MCI patients (aver. 70.1 y.o.) and 20 PD patients (aver. 66.1 y.o.). In Table 1, the between-group comparisons in age, driving experience, number of days driven per week and kilometers per week, in the number of years of education, the total accidents and accidents in the past two years, and their self-reported levels of simulator sickness (caused by the driving simulator) are presented for the group of older drivers (> 55 years old). There were not statistically significant differences in the demographic characteristics of the two groups.
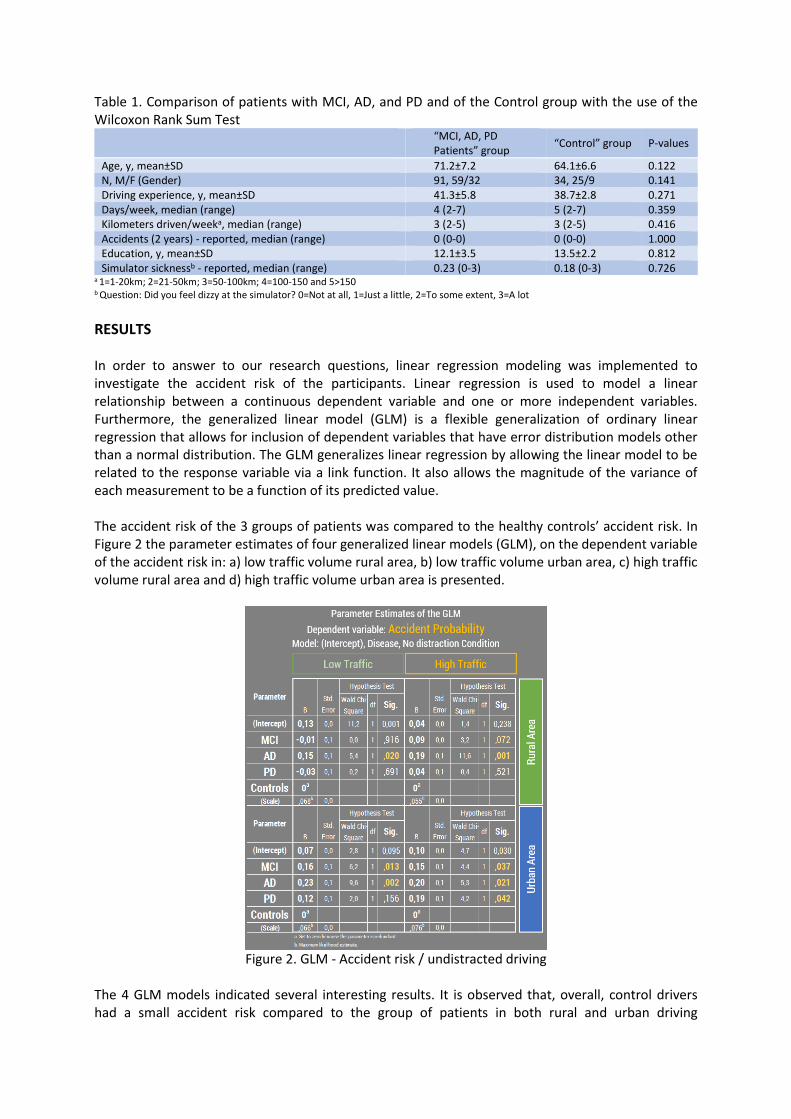
Table 1. Comparison of patients with MCI, AD, and PD and of the Control group with the use of the Wilcoxon Rank Sum Test
“MCI, AD, PD Patients” group
“Control” group P-values
Age, y, mean±SD 71.2±7.2 64.1±6.6 0.122 N, M/F (Gender) 91, 59/32 34, 25/9 0.141 Driving experience, y, mean±SD 41.3±5.8 38.7±2.8 0.271 Days/week, median (range) 4 (2-7) 5 (2-7) 0.359 Kilometers driven/weeka, median (range) 3 (2-5) 3 (2-5) 0.416 Accidents (2 years) - reported, median (range) 0 (0-0) 0 (0-0) 1.000 Education, y, mean±SD 12.1±3.5 13.5±2.2 0.812 Simulator sicknessb - reported, median (range) 0.23 (0-3) 0.18 (0-3) 0.726
a 1=1-20km; 2=21-50km; 3=50-100km; 4=100-150 and 5>150 b Question: Did you feel dizzy at the simulator? 0=Not at all, 1=Just a little, 2=To some extent, 3=A lot
RESULTS In order to answer to our research questions, linear regression modeling was implemented to investigate the accident risk of the participants. Linear regression is used to model a linear relationship between a continuous dependent variable and one or more independent variables. Furthermore, the generalized linear model (GLM) is a flexible generalization of ordinary linear regression that allows for inclusion of dependent variables that have error distribution models other than a normal distribution. The GLM generalizes linear regression by allowing the linear model to be related to the response variable via a link function. It also allows the magnitude of the variance of each measurement to be a function of its predicted value. The accident risk of the 3 groups of patients was compared to the healthy controls’ accident risk. In Figure 2 the parameter estimates of four generalized linear models (GLM), on the dependent variable of the accident risk in: a) low traffic volume rural area, b) low traffic volume urban area, c) high traffic volume rural area and d) high traffic volume urban area is presented.
Figure 2. GLM - Accident risk / undistracted driving
The 4 GLM models indicated several interesting results. It is observed that, overall, control drivers had a small accident risk compared to the group of patients in both rural and urban driving
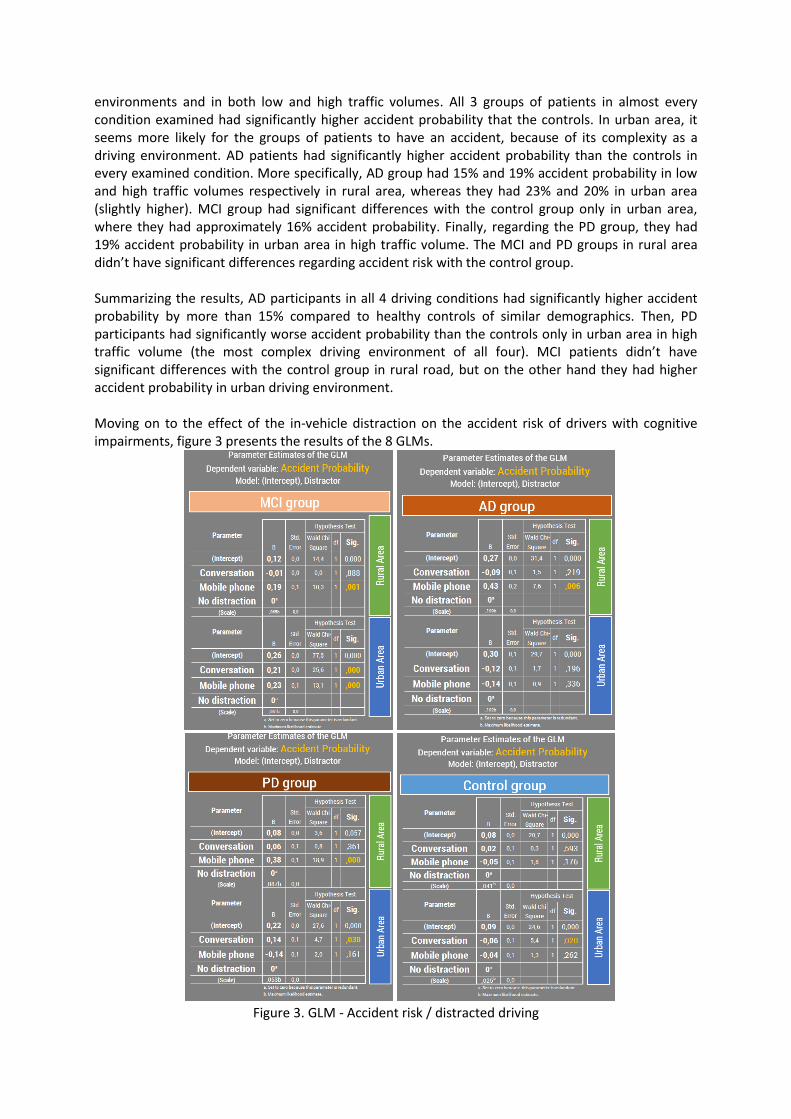
environments and in both low and high traffic volumes. All 3 groups of patients in almost every condition examined had significantly higher accident probability that the controls. In urban area, it seems more likely for the groups of patients to have an accident, because of its complexity as a driving environment. AD patients had significantly higher accident probability than the controls in every examined condition. More specifically, AD group had 15% and 19% accident probability in low and high traffic volumes respectively in rural area, whereas they had 23% and 20% in urban area (slightly higher). MCI group had significant differences with the control group only in urban area, where they had approximately 16% accident probability. Finally, regarding the PD group, they had 19% accident probability in urban area in high traffic volume. The MCI and PD groups in rural area didn’t have significant differences regarding accident risk with the control group. Summarizing the results, AD participants in all 4 driving conditions had significantly higher accident probability by more than 15% compared to healthy controls of similar demographics. Then, PD participants had significantly worse accident probability than the controls only in urban area in high traffic volume (the most complex driving environment of all four). MCI patients didn’t have significant differences with the control group in rural road, but on the other hand they had higher accident probability in urban driving environment. Moving on to the effect of the in-vehicle distraction on the accident risk of drivers with cognitive impairments, figure 3 presents the results of the 8 GLMs.
Figure 3. GLM - Accident risk / distracted driving
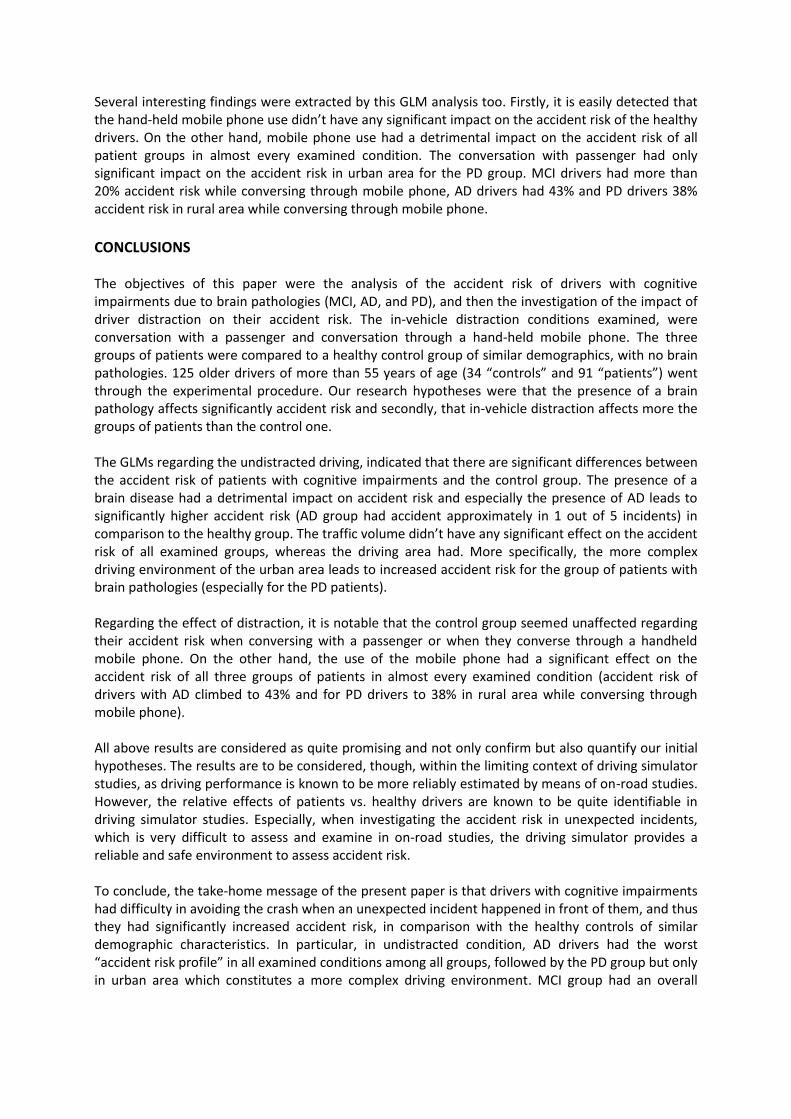
Several interesting findings were extracted by this GLM analysis too. Firstly, it is easily detected that the hand-held mobile phone use didn’t have any significant impact on the accident risk of the healthy drivers. On the other hand, mobile phone use had a detrimental impact on the accident risk of all patient groups in almost every examined condition. The conversation with passenger had only significant impact on the accident risk in urban area for the PD group. MCI drivers had more than 20% accident risk while conversing through mobile phone, AD drivers had 43% and PD drivers 38% accident risk in rural area while conversing through mobile phone.
CONCLUSIONS The objectives of this paper were the analysis of the accident risk of drivers with cognitive impairments due to brain pathologies (MCI, AD, and PD), and then the investigation of the impact of driver distraction on their accident risk. The in-vehicle distraction conditions examined, were conversation with a passenger and conversation through a hand-held mobile phone. The three groups of patients were compared to a healthy control group of similar demographics, with no brain pathologies. 125 older drivers of more than 55 years of age (34 “controls” and 91 “patients”) went through the experimental procedure. Our research hypotheses were that the presence of a brain pathology affects significantly accident risk and secondly, that in-vehicle distraction affects more the groups of patients than the control one. The GLMs regarding the undistracted driving, indicated that there are significant differences between the accident risk of patients with cognitive impairments and the control group. The presence of a brain disease had a detrimental impact on accident risk and especially the presence of AD leads to significantly higher accident risk (AD group had accident approximately in 1 out of 5 incidents) in comparison to the healthy group. The traffic volume didn’t have any significant effect on the accident risk of all examined groups, whereas the driving area had. More specifically, the more complex driving environment of the urban area leads to increased accident risk for the group of patients with brain pathologies (especially for the PD patients). Regarding the effect of distraction, it is notable that the control group seemed unaffected regarding their accident risk when conversing with a passenger or when they converse through a handheld mobile phone. On the other hand, the use of the mobile phone had a significant effect on the accident risk of all three groups of patients in almost every examined condition (accident risk of drivers with AD climbed to 43% and for PD drivers to 38% in rural area while conversing through mobile phone). All above results are considered as quite promising and not only confirm but also quantify our initial hypotheses. The results are to be considered, though, within the limiting context of driving simulator studies, as driving performance is known to be more reliably estimated by means of on-road studies. However, the relative effects of patients vs. healthy drivers are known to be quite identifiable in driving simulator studies. Especially, when investigating the accident risk in unexpected incidents, which is very difficult to assess and examine in on-road studies, the driving simulator provides a reliable and safe environment to assess accident risk. To conclude, the take-home message of the present paper is that drivers with cognitive impairments had difficulty in avoiding the crash when an unexpected incident happened in front of them, and thus they had significantly increased accident risk, in comparison with the healthy controls of similar demographic characteristics. In particular, in undistracted condition, AD drivers had the worst “accident risk profile” in all examined conditions among all groups, followed by the PD group but only in urban area which constitutes a more complex driving environment. MCI group had an overall
lower accident risk compared to the other two groups of patients, but not compared to the healthy drivers. What is more, the presence of an in-vehicle distractor while driving such as conversing through a handheld mobile phone, has a significantly deleterious effect on accident risk of drivers with cognitive impairments (AD, PD and in a lesser extend MCI). Overall, all these observations that were extracted from the present study could have considerable practical importance; they provide quite useful information for the development of policies that aim at reducing the risk for car accidents and at improving aspects of driving performance e.g. restrictive measures, training and licensing, information campaigns, medical and neuropsychological monitoring etc., especially in a sensitive group of car drivers, such that of drivers with MCI, AD or PD.
ACKNOWLEDGMENT This paper is based on two research projects implemented within the framework of the Operational Program "Education and Lifelong Learning" of the National Strategic Reference Framework (NSRF), namely the Research Funding Program: THALES. Investing in knowledge society through the European Social Fund, and the Action: ARISTEIA (Action’s Beneficiary General Secretariat for Research and Technology), co-financed by the European Union (European Social Fund) and Greek national funds.
REFERENCES 1 WHO, 2015. Global status report on Road Safety 2014, supporting a decade of action, World Health Organisation. 2 OECD (2013). IRTAD Road Safety Annual Report 2013. 3 Sabey, B.E., Taylor, H., 1980. The known Risks We Run: The Highway. TRRL Report SR 567, Crowthorne, TRRL. 4 Salmon, P., Young, K., Lenné, M., Williamson, A., Tomasevic, N., 2011. The Nature of Errors made by Drivers. Austroads
Publication No. AP–R378/11. Austroads Ltd., Australia. 5 Treat, J.R., 1980. A study of precrash factors involved in traffic accidents. HSRI Research Review 10(6)/11(1), 1-36. 6 Dingus T.A., Guo F., Lee S., Antin J.F., Perez M., Buchanan-King M., Hankey J., (2016), “Driver crash risk factors and
prevalence evaluation using naturalistic driving data”, PNAS, vol. 113 no. 10, pg. 2636–2641, doi: 10.1073/pnas.1513271113
7 Baldock, M. R. J., Mathias, J., McLean, J., & Berndt, A. (2007). Visual attention as a predictor of on-road driving performance of older adults. Australian Journal of Psychology, 59, 159-168.
8 OECD (2008). Towards Zero: Ambitious Road Safety Targets and the Safe System Approach. OECD, Paris, October 2008. 9 Wood, J. M., C. Worringham, et al. (2005). Quantitative assessment of driving performance in Parkinson's disease. J
Neurol Neurosurg Psychiatry 76(2): 176-80. 10 Cordell, R., H. C. Lee, et al. (2008). Driving assessment in Parkinson's disease - a novel predictor of performance? Mov
Disord 23(9): 1217-22. 11 Cubo, E., P. Martinez Martin, et al. (2009). "What contributes to driving ability in Parkinson's disease." Disabil Rehabil. 12 Frittelli, C., D. Borghetti, et al. (2009). Effects of Alzheimer's disease and mild cognitive impairment on driving ability: a
controlled clinical study by simulated driving test. Int J Geriatr Psychiatry 24(3): 232-8. 13 Ravaglia, G., Forti, P., Montesi, F., Lucicesare, A., Pisacane, N. Rietti, E. et al. (2008). Mild Cognitive Impairment:
Epidemiological and dementia risk in an elderly Italian population. Journal of the American Geriatrics Society, 56, 51-58. 14 Lafont, S., Laumon, B., Helmer, C., Dartigues, J. F., & Fabrigoule, C. (2008). Driving cessation and self-reported car
crashes in older drivers: The impact of cognitive impairment and dementia in a population-based study. Journal of Geriatric Psychiatry and Neurology, 21, 171-182.
15 Ott, B. R., W. C. Heindel, et al. (2008). A longitudinal study of drivers with Alzheimer disease. Neurology 70(14): 1171-8. 16 Uc, E. Y., M. Rizzo, et al. (2005). Driver landmark and traffic sign identification in early Alzheimer's disease. J Neurol
Neurosurg Psychiatry 76(6): 764-8. 17 Tomioka, H., B. Yamagata, et al. (2009). Detection of hypofrontality in drivers with Alzheimer's disease by near-infrared
spectroscopy. Neurosci Lett 451(3): 252-6. 18 Yannis G., Golias J., Antoniou C., Papadimitriou E., Vardaki S., Papantoniou P., Pavlou D., Papageorgiou S., Andronas N.,
Papatriantafyllou I., Liozidou A., Beratis I., Kontaxopoulou D., Fragkiadaki S., Economou A., "Design of a large driving simulator experiment on performance of drivers with cerebral diseases", Proceedings of the 4th International Conference on Road Safety and Simulation, Rome, October 2013

19 Pavlou D., Papadimitriou E., Yannis G., Papantoniou P., Papageorgiou S.G., "First findings from a simulator study on driving behaviour of drivers with cerebral diseases", Proceedings of the Transport Research Arena Conference, Paris, April 2014.
20 Yannis G., Papantoniou P., Nikas M., "Comparative analysis of young drivers behavior in normal and simulation conditions at a rural road", Proceedings of the 5th International Conference on Road Safety and Simulation, Universities of Central Florida and Tennessee, Orlando, Florida, October 2015
IN-DEPTH INVESTIGATION OF BUS ACCIDENTS
Ana Filipa Vieira*, João M. P. Dias*, João Lourenço Cardoso
* LAETA, IDMEC, Instituto Superior Técnico, Universidade de Lisboa, Portugal, e-mail: [email protected] ** Laboratório Nacional de Engenharia Civil, Departamento de Transportes, Núcleo de Planeamento, Tráfego e Segurança,
Av do Brasil 101, 1700-066 Lisboa, Portugal, e-mail: [email protected] Abstract - Bus or heavy vehicle passenger accidents are rare events, compared with car accidents, but sometimes leads to a large number of victims especially in rollover crash scenarios. Two accidents occurred in Portugal in 2007 and 2013 in which 28 people died and more than 50 are injured, shown the importance of the investigation of such accidents. For the investigation of these accidents multidisciplinary teams are constituted with engineers and police officers. All the factors involved are taken into consideration including road design, traffic signs, maintenance and hardware, human factors, and vehicle factors. In this work a methodology to an accurate collection of the data is proposed. From the information collected the accident is reconstructed using the PC-CrashTM software. From this all the contribution factors are determined and recommendations to mitigate these crashes are listed. These two accidents are rollover accidents and the analysis of the injuries and its correlation with the use of retention systems is very important. From the medical data and with the dynamics of the accident determined simulations of the occupants with biomechanical models are carried out in order to evaluate the effect of the retention systems in the injuries. This analysis is based on injury criteria (such as Abbreviated Injury Score (AIS) or Injury Severity Scale (ISS)). With this it is possible to determine if the seat belt was worn or not.
Causation of traffic accidents with children from the perspective of all involved participants
M Weinberger*, E Tomasch*, H Hoschopf*, H Steffan*, P Spitzer**, F Kleewein***
*Vehicle Safety Institute, University of Technology Graz, Inffeldgasse 23/I, 8010 Graz, AUT **Große Schützen Kleine, University Hospital Graz, Auenbrugger Platz 1, 8036 Graz, AUT
*** ÖAMTC Fahrtechnik GmbH, Jöß, Gewerbegebiet 1, 8403 Lang, AUT Abstract - In the year 2014 about 2,800 children between zero and 14 years got injured due to traffic accidents in Austria. More than 50% were taking part in traffic as active road users like cyclists or pedestrians. Within this study 46 real world traffic accidents between vehicles and children as pedestrians were analysed. In 39 cases, car drivers hit the crossing children. In the other cases, the collision opponents were busses, trucks or motorcycles. Most of the children got hit while crossing a road at urban sites. By analysing the traffic accidents from the perspectives of all involved participants, vehicle drivers and injured children, it is possible to identify factors for each participant, which led to the accident and factors that contributed the accident. The main task is to find patterns in the behaviour of crash victims (children and driver) before the collision. One important fact is that in more than 50% of the analysed cases sight obstructions were an important contributing factor for both, the driver and the child. From drivers view situations in which the child moved unexpected into the driven road lane were often found. For the injured child, factors like: no attention to the road traffic or no sufficient traffic observation were found to be relevant. Further it´s possible to sensitise children and adults to possible source of critical traffic situations according to the findings of this study. INTRODUCTION More than 650 children as pedestrians, aged zero to 14 years got injured due to traffic accidents on Austrian roads in 2014 [1]. Between the years 2002 – 2011 9,266 children got injured. About 94% of them had an accident at urban roads. This situation is quite similar to Germany. About 97% of all accidents with children as pedestrians in the year 2014 took place at urban roads in Germany [2]. Many studies attest male children a higher risk of being involved in a traffic accident than female children [3-5]. In Germany and Austria this situation is quite similar, 57% to 58% of the involved children were male [2,6]. The consequences of child accidents are not just physical; in long term monitoring often psychogenic pain is documented [7].
Pedestrian injuries to children most commonly occur when they get hit by an vehicle, keeping it´s direction, while the child is crossing a street [3]. In Austria it can be found that about 78% of the injured children were struck by an approaching vehicle keeping its direction while the children tried to cross the road [6]. Focusing on the youngest children it was found that fatal accidents with reversing cars are very likely, especially at driveways, apartment buildings or parking lots [8]. Austrian data shows that in relative terms, children between zero and five years got twice as often injured due to collisions with backwards driving cars than older children (6 – 10 and 11 – 14 years old children) [6].
Eder et al. [7] found that the most frequently accident patterns were: “hit at crosswalks”, “crossing without looking” and “sight obstructions”. Further frequent situations were identified for children using public transport (running across the road close before or behind a bus or tram) or playing at or next to the road. For children aged from six to eight crossing without taking care of the traffic was found to be the main common accident situation. Accidents caused by children crossing the road in front of or behind a public transport vehicle was frequently found in the behaviour of older children (10-13 years). [7]
Especially children older than nine years are at risk of being involved in accidents due to distractions such as using phones and the like [9]. So-called “dart out” situations describe situations in which children enter a street quickly, without thinking, to meet someone or something on the other side of the street. Situations, which were results of poor judgement on the part of the children were often found too. The children had entered the road thinking they were safe, but were not. [10]
In fact there are a lot of different factors which lead to accidents. Behaviour of children on the road is hard to manage and, of course, is age-dependant. Education and training is an important factor to prevent child accidents but there are typical steps in the child development which can´t be influenced. [11-13] Thus, it´s important not to solely focus on the mistakes the involved may have made; neither on the mistakes of the children nor on those of the drivers. It´s necessary to analyse an accident from both perspectives, drivers and injured children, to prioritise the pre-crash phase. Determining high risk situations and finding patterns in behaviour of the involved participants might lead to measure that improve safety. Showing real world accident situations in combination with providing supported trainings at test tracks is a proper method to sensitive adults to possible source of critical traffic situations. [14] MATERIAL For this study, the accident database CEDATU (Central Database for In-Depth Accident Study [15] [16]) was used. In total, 46 accidents with children were analysed by using information collected by the police (witness reports, injury data, etc.). In total 48 children as pedestrians got injured due to this accidents. All of these accidents were reconstructed using the reconstruction software PC-CrashTM. Infrastructures, such as roadside furniture or trees and parking vehicles, were included. Based on the reconstructed kinematics and the additional information about the road and roadside layout, complete accident situations, from the critical situations (pre-crash phase) to the final position (post-crash phase) were analysed. To find factors that might have led to the traffic accident, the behaviour of every participant prior to the accident was analysed by determining possible causal and contributing accident factors. Each case was analysed from the perspective of the involved children as well as from the perspective of the involved drivers with the goal to find relevant and recurrent accident circumstances. The data field basis of CEDATU compares to the STAIRS protocol (Standardization of Accident and Injury Registration System) [17] which was developed over the course of an EU project with the same name. Building on the STAIRS protocol, the data fields were extended using information from the EU projects PENDANT (Pan-European Coordinated Accident and Injury Databases) [18], RISER (Roadside Infrastructure for Safer European Roads) [19] and ROLLOVER (Improvement of rollover safety for passenger vehicles [20]). The data fields from national statistics are considered to enable a direct connection to the latter [21]. Furthermore, the data fields of CEDATU correspond to the IGLAD database [22]. At the moment CEDATU comprises of approximately 3,200 accident cases. About 70 cases are collected each year on a regular basis. METHOD The following example of an accident reconstruction is about a collision between a passenger car and a three-year-old boy, who was crossing a road. The child was hit by the car from the front and suffered serious injuries, especially of the lower extremities. The accident took place on a straight road with a speed limit of 30 km/h. Vehicles parked at the right and left side of the road. A 3.6 metres wide rode was given for driving vehicles. The crash occurred at daytime, the weather was bright and the road was dry. For further accident analysis, information about the damages of the involved car and pictures of the accident scene were available.
Figure 1 illustrates the parking situation at the day of the accident. The arrow marked with number one shows the driving direction of the involved driver. The arrow marked with number two shows the running direction of the child from between the parking cars at the right roadside. On the left side of the picture, the family´s house entrance can be seen. Boy’s mother and his sister were exactly standing in front of the door when the accident occurred. The right picture shows an aerial
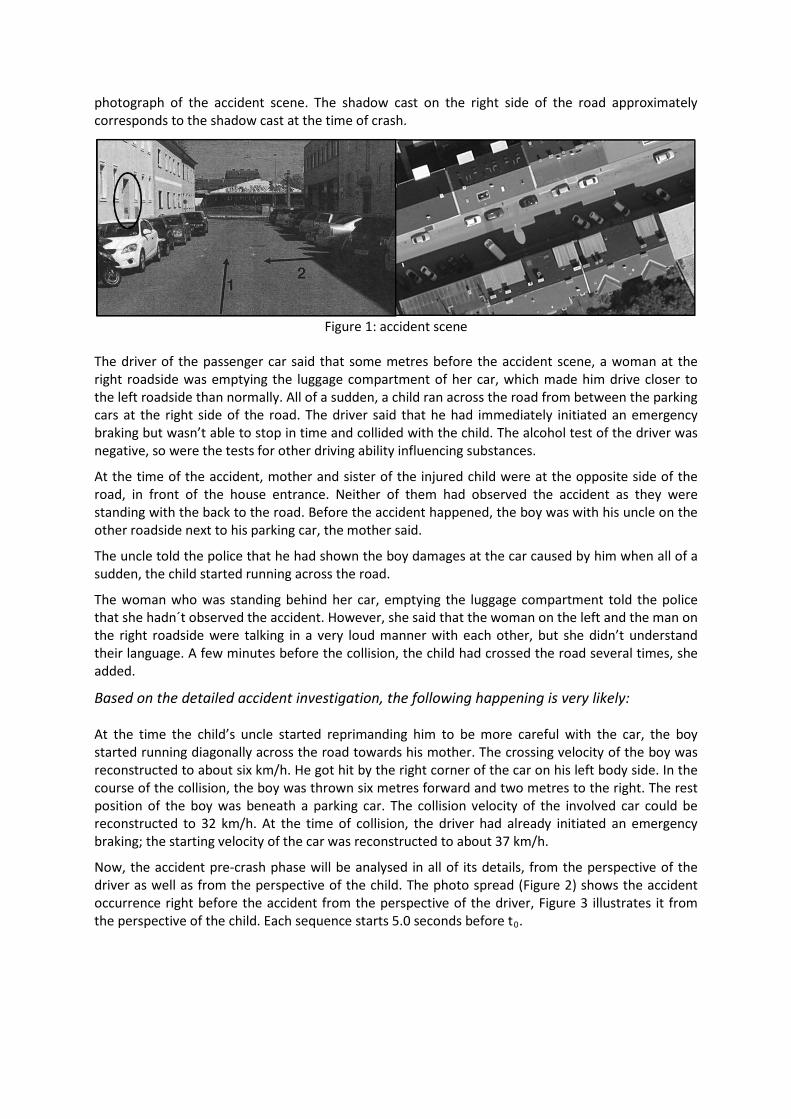
photograph of the accident scene. The shadow cast on the right side of the road approximately corresponds to the shadow cast at the time of crash.
Figure 1: accident scene
The driver of the passenger car said that some metres before the accident scene, a woman at the right roadside was emptying the luggage compartment of her car, which made him drive closer to the left roadside than normally. All of a sudden, a child ran across the road from between the parking cars at the right side of the road. The driver said that he had immediately initiated an emergency braking but wasn’t able to stop in time and collided with the child. The alcohol test of the driver was negative, so were the tests for other driving ability influencing substances.
At the time of the accident, mother and sister of the injured child were at the opposite side of the road, in front of the house entrance. Neither of them had observed the accident as they were standing with the back to the road. Before the accident happened, the boy was with his uncle on the other roadside next to his parking car, the mother said.
The uncle told the police that he had shown the boy damages at the car caused by him when all of a sudden, the child started running across the road.
The woman who was standing behind her car, emptying the luggage compartment told the police that she hadn´t observed the accident. However, she said that the woman on the left and the man on the right roadside were talking in a very loud manner with each other, but she didn’t understand their language. A few minutes before the collision, the child had crossed the road several times, she added.
Based on the detailed accident investigation, the following happening is very likely: At the time the child’s uncle started reprimanding him to be more careful with the car, the boy started running diagonally across the road towards his mother. The crossing velocity of the boy was reconstructed to about six km/h. He got hit by the right corner of the car on his left body side. In the course of the collision, the boy was thrown six metres forward and two metres to the right. The rest position of the boy was beneath a parking car. The collision velocity of the involved car could be reconstructed to 32 km/h. At the time of collision, the driver had already initiated an emergency braking; the starting velocity of the car was reconstructed to about 37 km/h.
Now, the accident pre-crash phase will be analysed in all of its details, from the perspective of the driver as well as from the perspective of the child. The photo spread (Figure 2) shows the accident occurrence right before the accident from the perspective of the driver, Figure 3 illustrates it from the perspective of the child. Each sequence starts 5.0 seconds before t0.

Pre-crash phase from the perspective of the driver: When the driver turned into the road, the following view (Figure 2) was given. On the first picture – 5.0 seconds before the collision – the driver was about 52 metres away from the accident scene. He drove with a velocity of about 37 km/h. To his left and his right, parking cars were visible. At the right side of the road, he noticed a woman emptying her car’s luggage compartment. There was no oncoming traffic.
About 4.0 seconds before the collision, he steered his car more to the left side of the road to increase the distance between his car and the woman on the right. From his perspective, there were no children or other people visible.
3.0 seconds before the collision, he was 30 metres away from the point of collision. He had almost finished his steering process. From the driver’s view, the child subsequently injured was still invisible. He still drove with a velocity of 37 km/h.
2.0 seconds (20 metres) before the collision, the crossing child would had been visible but the driver didn’t notice it. The child had started crossing the road from the right shadowed side. The driver’s attention was still focused at the woman to his right, who was now in his immediate proximity. The side distance between the car and the woman was about 1.3 metres. If the driver had reacted at this very moment (exactly 2.1 seconds before t0) and done an emergency braking, he would have been able to stop in time (reaction time of 0.8 seconds, 0.2 seconds lag time [23] included and 1.1 seconds emergency brake).
1.0 second (10 metres) before the collision, the driver had passed the woman at the right and noticed the child. He immediately initiated an emergency braking.
0.5 seconds before the collision, the distance between the car’s front and the child was about 5 metres. Yet, the initiated emergency braking hadn’t been effective. The driver was still in the phase of reaction. Shortly before the collision occurred, the driver was able to reduce his speed by 5 km/h and collided with the child with a velocity of 32 km/h.
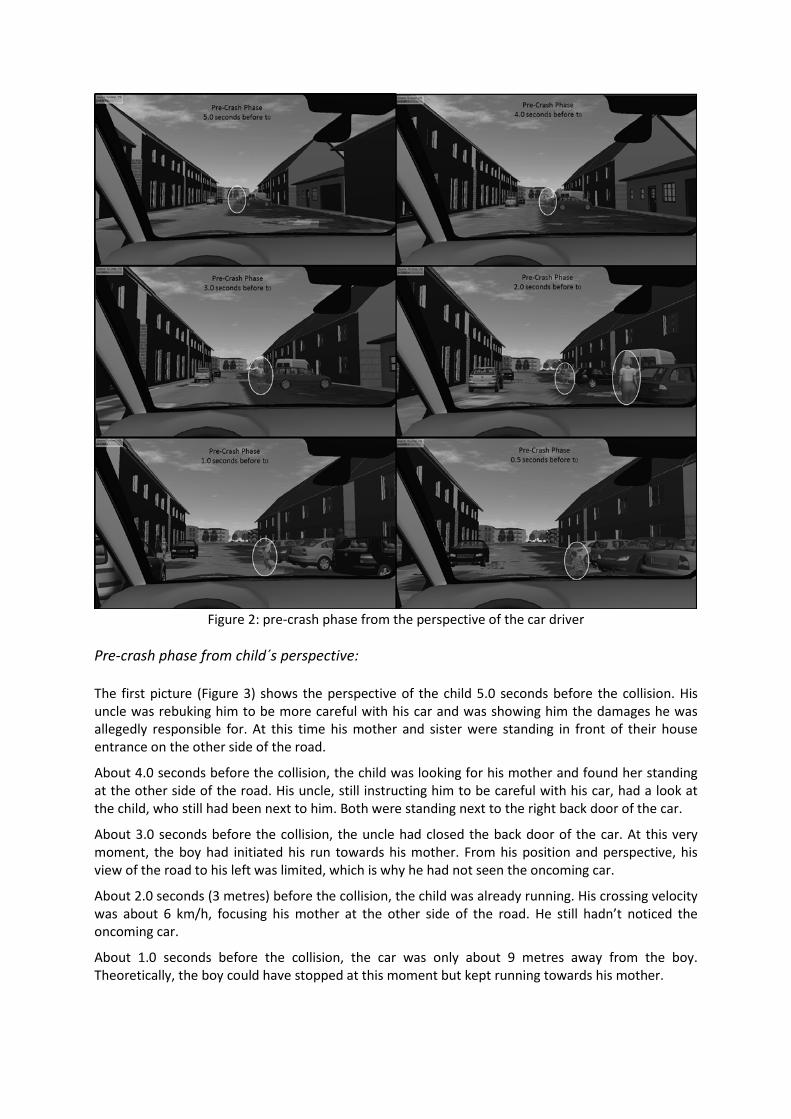
Figure 2: pre-crash phase from the perspective of the car driver
Pre-crash phase from child´s perspective: The first picture (Figure 3) shows the perspective of the child 5.0 seconds before the collision. His uncle was rebuking him to be more careful with his car and was showing him the damages he was allegedly responsible for. At this time his mother and sister were standing in front of their house entrance on the other side of the road.
About 4.0 seconds before the collision, the child was looking for his mother and found her standing at the other side of the road. His uncle, still instructing him to be careful with his car, had a look at the child, who still had been next to him. Both were standing next to the right back door of the car.
About 3.0 seconds before the collision, the uncle had closed the back door of the car. At this very moment, the boy had initiated his run towards his mother. From his position and perspective, his view of the road to his left was limited, which is why he had not seen the oncoming car.
About 2.0 seconds (3 metres) before the collision, the child was already running. His crossing velocity was about 6 km/h, focusing his mother at the other side of the road. He still hadn’t noticed the oncoming car.
About 1.0 seconds before the collision, the car was only about 9 metres away from the boy. Theoretically, the boy could have stopped at this moment but kept running towards his mother.
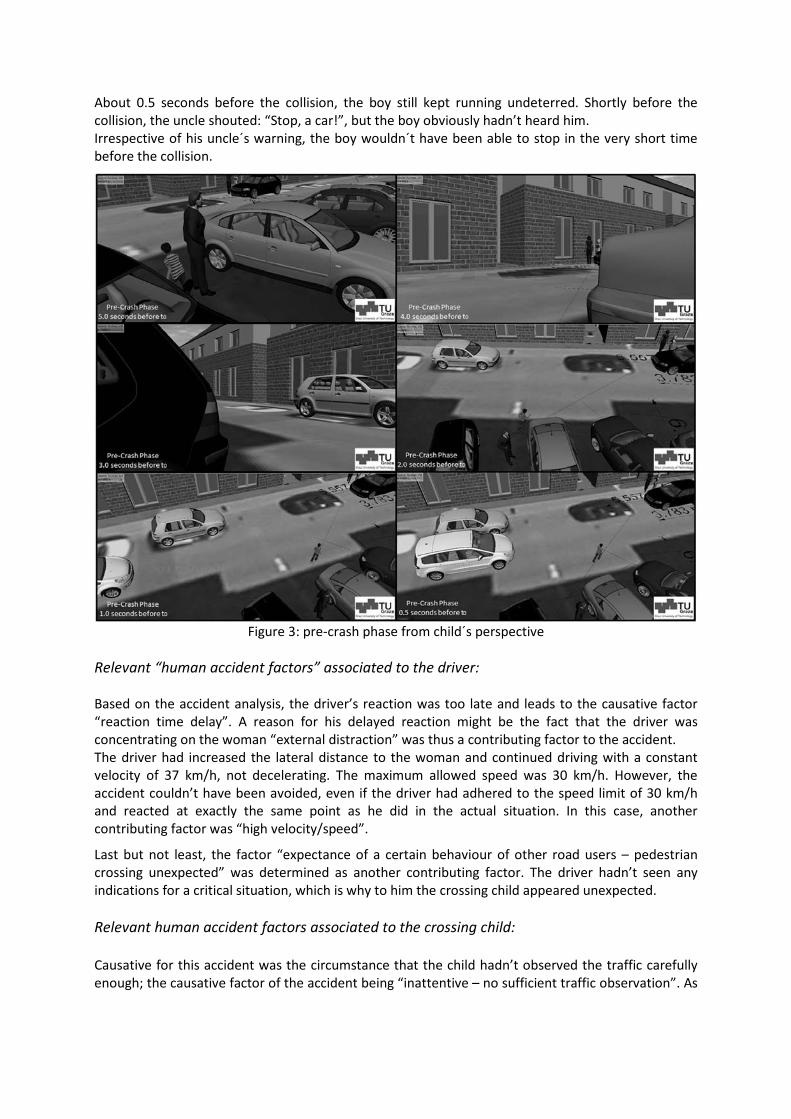
About 0.5 seconds before the collision, the boy still kept running undeterred. Shortly before the collision, the uncle shouted: “Stop, a car!”, but the boy obviously hadn’t heard him. Irrespective of his uncle´s warning, the boy wouldn´t have been able to stop in the very short time before the collision.
Figure 3: pre-crash phase from child´s perspective
Relevant “human accident factors” associated to the driver: Based on the accident analysis, the driver’s reaction was too late and leads to the causative factor “reaction time delay”. A reason for his delayed reaction might be the fact that the driver was concentrating on the woman “external distraction” was thus a contributing factor to the accident. The driver had increased the lateral distance to the woman and continued driving with a constant velocity of 37 km/h, not decelerating. The maximum allowed speed was 30 km/h. However, the accident couldn’t have been avoided, even if the driver had adhered to the speed limit of 30 km/h and reacted at exactly the same point as he did in the actual situation. In this case, another contributing factor was “high velocity/speed”.
Last but not least, the factor “expectance of a certain behaviour of other road users – pedestrian crossing unexpected” was determined as another contributing factor. The driver hadn’t seen any indications for a critical situation, which is why to him the crossing child appeared unexpected. Relevant human accident factors associated to the crossing child: Causative for this accident was the circumstance that the child hadn’t observed the traffic carefully enough; the causative factor of the accident being “inattentive – no sufficient traffic observation”. As
a reason for this and as a contributing factor, his uncle’s rebuke while his mother had already been at the other side of the road could be considered as “psychological stress”.
In addition, the fact that the child was very familiar with the surroundings at the accident scene should be taken into account. It is very likely that the child had already played in the street, just like it did minutes before the collision occurred. This factor can be termed “habitually stretching rules”. It´s a possibility that the boy either had never learned the general rule not to play on the streets or he had simply ignored it.
Last but not least the fact that the child had started to run from between two parking cars should be mentioned. In this case, a “wrong behaviour of the pedestrian – due to sudden emergence from view restricted area” was chosen.
Another contributing factor relating to both, child and driver, was the fact of temporary obstructions of view. The parking vehicles next to the road restricted their view so they couldn’t see each other in the key moment when the child had initiated its movement to cross the road. In fact, the earliest possible moment for both was about 2.5 seconds before the collision happened. RESULTS Within this analysis of 46 accidents, in which 48 children got injured (nine slight, 22 serious, 17 fatal) it was found that in just 16 cases the driver reacted with a deceleration of its car. 10 accidents took place in the immediate area of public transport stops and another 10 accidents happened at crosswalks. According to the road layout and infrastructure, the most important contributing accident factor for both, children and vehicle drivers, were found to be obstructions of view. Permanent obstructions caused by bushes, fences or similar objects in the road layout as well as temporary obstructions like parking vehicles were found to be relevant sight obstructions especially for smaller children. In more than 52% of the analysed accidents sight obstructions at or beside the roadway had a significant contribution.
Especially in relation to the involved children, the following causal human accident factors were found frequently:
• No or no sufficient traffic observation • Sudden emerge from view restricted areas • Wrong behaviour in traffic situations regulated by traffic lights • Playing on or besides the road
These factors could also be found frequently as contributing factors (Figure 4); factors that contribute to the accident e.g. playing children next to the road:
A child crosses the road to chase a ball and gets hit by an oncoming vehicle. The cause for this accident might be the fact, that the child hadn’t payed attention to the road traffic. A possible contributing factor might be the location they had chosen. If the game had taken place at another location than the road, the child wouldn’t have had to chase the ball across the street. A detailed list of factors ascribed to children as pedestrians can be found in the appendix (Table 1).

Figure 4: human accident factors ascribed to the involved children
In relation to the involved drivers, it was found that the unexpected movement of children into the driving lane and wrong behaviours towards children at pedestrian crossings were the most frequently found causal factors. External and internal distraction, too high or not adjusted speed were found to be the most common contributing factors too. (Figure 5) The detailed list of factors ascribed to the car driver can be found in the appendix (Table 2).
Figure 5: human accident factors ascribed to the involved driver
Another, not less important factor is that most of the injured children crossed the road running before they got hit by the vehicle. In fact it was found that more than 60% of the children were in a running movement when the accident occurred. Figure 6 shows the speed the children obtained according to the accident reconstructions. Typical “normal walking” velocities for children aged three
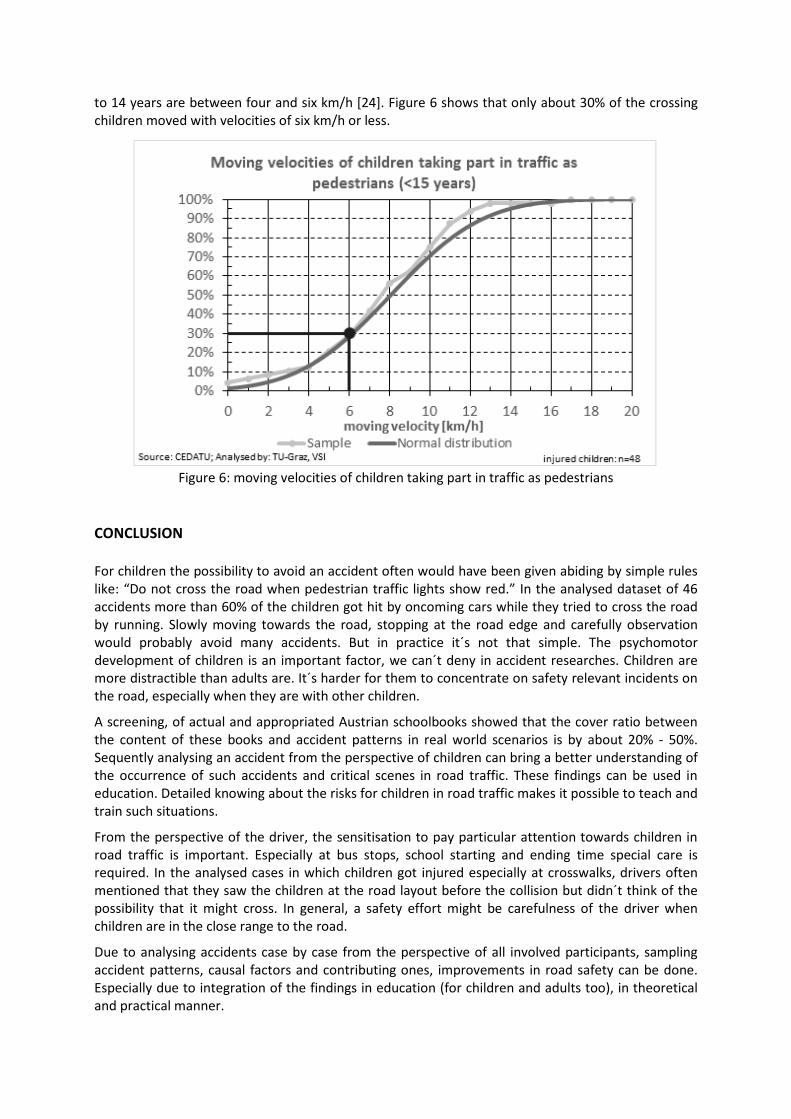
to 14 years are between four and six km/h [24]. Figure 6 shows that only about 30% of the crossing children moved with velocities of six km/h or less.
Figure 6: moving velocities of children taking part in traffic as pedestrians
CONCLUSION For children the possibility to avoid an accident often would have been given abiding by simple rules like: “Do not cross the road when pedestrian traffic lights show red.” In the analysed dataset of 46 accidents more than 60% of the children got hit by oncoming cars while they tried to cross the road by running. Slowly moving towards the road, stopping at the road edge and carefully observation would probably avoid many accidents. But in practice it´s not that simple. The psychomotor development of children is an important factor, we can´t deny in accident researches. Children are more distractible than adults are. It´s harder for them to concentrate on safety relevant incidents on the road, especially when they are with other children.
A screening, of actual and appropriated Austrian schoolbooks showed that the cover ratio between the content of these books and accident patterns in real world scenarios is by about 20% - 50%. Sequently analysing an accident from the perspective of children can bring a better understanding of the occurrence of such accidents and critical scenes in road traffic. These findings can be used in education. Detailed knowing about the risks for children in road traffic makes it possible to teach and train such situations.
From the perspective of the driver, the sensitisation to pay particular attention towards children in road traffic is important. Especially at bus stops, school starting and ending time special care is required. In the analysed cases in which children got injured especially at crosswalks, drivers often mentioned that they saw the children at the road layout before the collision but didn´t think of the possibility that it might cross. In general, a safety effort might be carefulness of the driver when children are in the close range to the road.
Due to analysing accidents case by case from the perspective of all involved participants, sampling accident patterns, causal factors and contributing ones, improvements in road safety can be done. Especially due to integration of the findings in education (for children and adults too), in theoretical and practical manner.
ACKNOWLEDGEMENT The authors would like to thank the Federal Ministry for Transport, Innovation and Technology (bmvit) for funding this study under the umbrella of the Austrian Road Safety Fund (VSF). (3rd call, project TOGETHER).
REFERENCES [1] Statistik Austria, „Straßenverkehrsunfälle Jahresergebnis 2014,“ Statistik Austria, Wien. [2] Statistisches Bundesamt, „Verkehrsunfälle 2014,“ Statistisches Bundesamt, Wiesbaden, 2015. [3] F. Rivara und M. Barber, „Demographic analysis of childhood pedestrian injuries,“ American Academy of Pediatrics,
1984. [4] M. Joly, P. Foggin und I. Barry-Pless, „Geographical and socio-ecological variations of traffic accidents among children,“
Elsevier, 1991. [5] J. Read, E. Bradley, J. Morison, D. Lewall und D. Clarke, „The epidemiology and prevention of traffic accidents involving
child pedestrians,“ Can Med Assoc J, 1963. [6] Statistik Austria and analysed by: TU-Graz, VSI, „2002 - 2011“. [7] C. Eder, J. Mayer, P. Spitzer, D. Zehedin, J. Werning und A. Berghold, „Kinderfußgängerunfall, Qualitative Analyse von
Fußgängerunfällen bei Kindern,“ 2006. [8] R. Brison, K. Wicklund und B. Mueller, „Fatal pedestrian injuries to young children: A different pattern of injury,“ Am J
Public Health, 1988. [9] D. Sleet, M. Ballesteros und N. Borse, „A review of unintentional injuries in adolescents,“ Annu Rev Public Health,
Atlanta, 2010. [10] D. Schwebel, A. Davis und E. O´Neal, „Child Pedestrian Injury: A Review of behavioral Risks and Preventive Strategies,“
National Institutes of Health, 2012. [11] A. Uhr, „Entwicklungspsychologische Grundlagen: Überblick und Bedeutung für die Verkehrssicherheit,“
Beratungsstelle für Unfallverhütung, Bern, 2015. [12] L. Werner und G. Marean, „Human auditory development,“ Springer, 1996. [13] J. Ristic und A. Kingstone, „Rethinking attentional development: refexive and volitional orienting in children and
adults,“ Developmental science, 2009. [14] G. Bartl und R. Esberger, „Mehrphasenfürerschein: Erste Wirksamkeitsanalysen,“ Wien, 2005. [15] E. Tomasch, H. Steffan und M. Darok, „Retrospective accident investigation using information from court,“ 2008. [16] E. Tomasch und H. Steffan, „ZEDATU (Zentrale Datenbank tödlicher Unfälle in Österreich): A central database of
fatalities in Austria,“ International Conference "ESAR - Expert Symposium on Accident Research", 2006. [17] R. Ross, P. Lejeune, B. Laumon, J. Martin, G. Vallet, I. Kossmann, D. Otte, B. Sexton und P. Thomas, „An approach to the
standardisation of accident and injury registration systems (STAIRS) in Europe,“ 1998. [18] A. Morris und P. Thomas, „PENDANT - Pan-European Co-ordinated Accident and Injury Databases,“ 2003. [19] RISER Final Report, „Roadside Infrastructure for Safer European Roads, 2006,“ Unpublished work. [20] J. Gugler und H. Steffan, „Rollover - Improvement of Rollover Safety for Passenger Vehicles: Final report,“ Unpublished
work, 2005. [21] Statistik Austria, „Erläuterung und Definition zum Zählblatt über einen Straßenverkehrsunfall,“ Unpublished work,
2007. [22] D. Ockel, J. Bakker und R. Schöneburg, „An initiative towards a simplified international in-depth accident database,“
Bibliothek der Bundesanstalt für Straßenwesen (BASt), Bergisch Gladbach, 2013. [23] H. Burg und A. Moser, Handbuch Verkehrsunfallrekonstruktion, Wiesbadebn: Vieweg+Teubner, 2009. [24] W. Eberhardt und G. Himbert, „Bewegungsgeschwindigkeiten - Versuchsergebnisse nichtmotorisierter
Verkehrsteilnehmer,“ 1977.
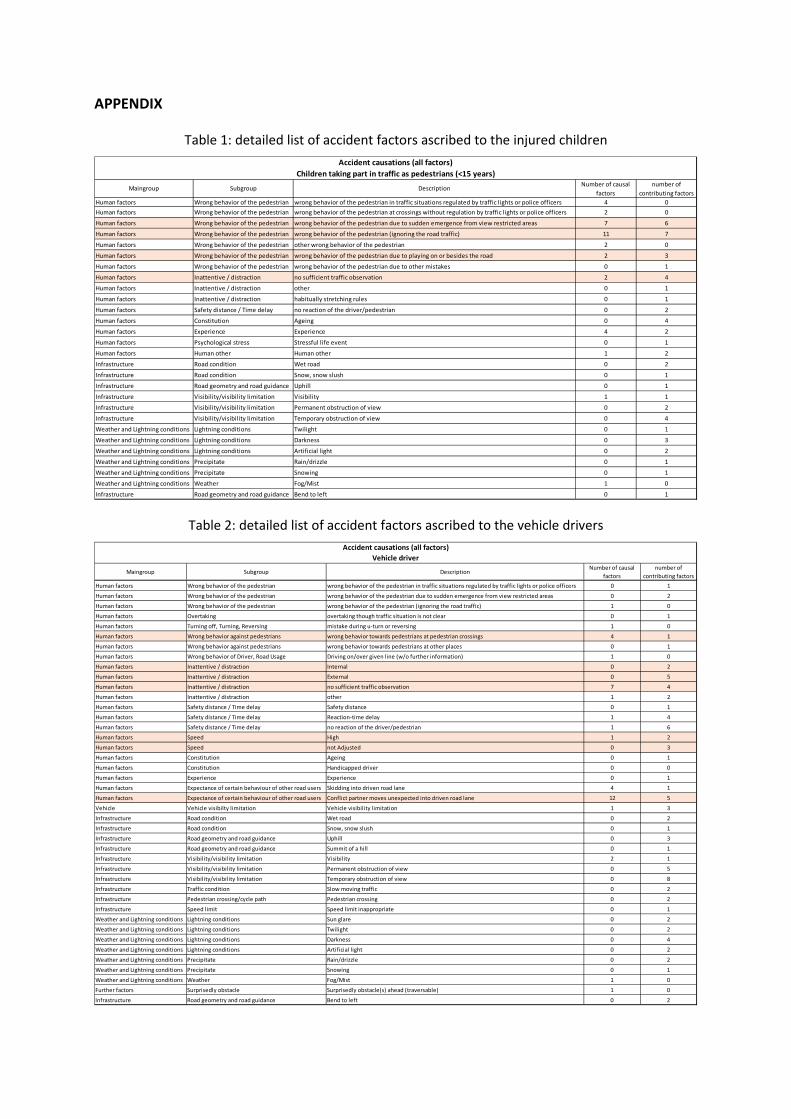
APPENDIX
Table 1: detailed list of accident factors ascribed to the injured children
Table 2: detailed list of accident factors ascribed to the vehicle drivers
Human factors Wrong behavior of the pedestrian wrong behavior of the pedestrian in traffic situations regulated by traffic lights or police officers 4 0Human factors Wrong behavior of the pedestrian wrong behavior of the pedestrian at crossings without regulation by traffic lights or police officers 2 0
Human factors Wrong behavior of the pedestrian wrong behavior of the pedestrian due to sudden emergence from view restricted areas 7 6
Human factors Wrong behavior of the pedestrian wrong behavior of the pedestrian (ignoring the road traffic) 11 7
Human factors Wrong behavior of the pedestrian other wrong behavior of the pedestrian 2 0
Human factors Wrong behavior of the pedestrian wrong behavior of the pedestrian due to playing on or besides the road 2 3
Human factors Wrong behavior of the pedestrian wrong behavior of the pedestrian due to other mistakes 0 1
Human factors Inattentive / distraction no sufficient traffic observation 2 4
Human factors Inattentive / distraction other 0 1
Human factors Inattentive / distraction habitually stretching rules 0 1
Human factors Safety distance / Time delay no reaction of the driver/pedestrian 0 2
Human factors Constitution Ageing 0 4
Human factors Experience Experience 4 2
Human factors Psychological stress Stressful life event 0 1
Human factors Human other Human other 1 2
Infrastructure Road condition Wet road 0 2
Infrastructure Road condition Snow, snow slush 0 1
Infrastructure Road geometry and road guidance Uphill 0 1
Infrastructure Visibility/visibility limitation Visibility 1 1
Infrastructure Visibility/visibility limitation Permanent obstruction of view 0 2
Infrastructure Visibility/visibility limitation Temporary obstruction of view 0 4
Weather and Lightning conditions Lightning conditions Twilight 0 1
Weather and Lightning conditions Lightning conditions Darkness 0 3
Weather and Lightning conditions Lightning conditions Artificial light 0 2
Weather and Lightning conditions Precipitate Rain/drizzle 0 1
Weather and Lightning conditions Precipitate Snowing 0 1
Weather and Lightning conditions Weather Fog/Mist 1 0
Infrastructure Road geometry and road guidance Bend to left 0 1
Accident causations (all factors)Children taking part in traffic as pedestrians (<15 years)
Maingroup Subgroup Description Number of causal factors
number of contributing factors
Human factors Wrong behavior of the pedestrian wrong behavior of the pedestrian in traffic situations regulated by traffic lights or police officers 0 1
Human factors Wrong behavior of the pedestrian wrong behavior of the pedestrian due to sudden emergence from view restricted areas 0 2
Human factors Wrong behavior of the pedestrian wrong behavior of the pedestrian (ignoring the road traffic) 1 0
Human factors Overtaking overtaking though traffic situation is not clear 0 1
Human factors Turning off, Turning, Reversing mistake during u-turn or reversing 1 0
Human factors Wrong behavior against pedestrians wrong behavior towards pedestrians at pedestrian crossings 4 1
Human factors Wrong behavior against pedestrians wrong behavior towards pedestrians at other places 0 1
Human factors Wrong behavior of Driver, Road Usage Driving on/over given line (w/o further information) 1 0
Human factors Inattentive / distraction Internal 0 2
Human factors Inattentive / distraction External 0 5
Human factors Inattentive / distraction no sufficient traffic observation 7 4
Human factors Inattentive / distraction other 1 2
Human factors Safety distance / Time delay Safety distance 0 1
Human factors Safety distance / Time delay Reaction-time delay 1 4
Human factors Safety distance / Time delay no reaction of the driver/pedestrian 1 6
Human factors Speed High 1 2
Human factors Speed not Adjusted 0 3
Human factors Constitution Ageing 0 1
Human factors Constitution Handicapped driver 0 0
Human factors Experience Experience 0 1
Human factors Expectance of certain behaviour of other road users Skidding into driven road lane 4 1
Human factors Expectance of certain behaviour of other road users Conflict partner moves unexpected into driven road lane 12 5
Vehicle Vehicle visibilty limitation Vehicle visibility limitation 1 3
Infrastructure Road condition Wet road 0 2
Infrastructure Road condition Snow, snow slush 0 1
Infrastructure Road geometry and road guidance Uphill 0 3
Infrastructure Road geometry and road guidance Summit of a hill 0 1
Infrastructure Visibility/visibility limitation Visibility 2 1
Infrastructure Visibility/visibility limitation Permanent obstruction of view 0 5
Infrastructure Visibility/visibility limitation Temporary obstruction of view 0 8
Infrastructure Traffic condition Slow moving traffic 0 2
Infrastructure Pedestrian crossing/cycle path Pedestrian crossing 0 2
Infrastructure Speed limit Speed limit inappropriate 0 1
Weather and Lightning conditions Lightning conditions Sun glare 0 2
Weather and Lightning conditions Lightning conditions Twilight 0 2
Weather and Lightning conditions Lightning conditions Darkness 0 4
Weather and Lightning conditions Lightning conditions Artificial light 0 2
Weather and Lightning conditions Precipitate Rain/drizzle 0 2
Weather and Lightning conditions Precipitate Snowing 0 1
Weather and Lightning conditions Weather Fog/Mist 1 0
Further factors Surprisedly obstacle Surprisedly obstacle(s) ahead (traversable) 1 0
Infrastructure Road geometry and road guidance Bend to left 0 2
Maingroup Subgroup DescriptionNumber of causal
factorsnumber of
contributing factors
Accident causations (all factors)Vehicle driver
The GIDAS Pre-Crash-Matrix 2016
Innovations for standardized pre-crash-scenarios on the basis of the VUFO simulation model VAST Author: Dipl.-Math. Angela Schubert* Co-Authors: Dipl.-Ing. Henrik Liers* Dipl.-Ing. (FH) Marcus Petzold* * Verkehrsunfallforschung an der TU Dresden (VUFO) GmbH Semperstraße 2a 01069 Dresden Email: [email protected] Tel.: +49 (351) 43 89 89 29 Fax: +49 (351) 43 89 89 99
Abstract Since its creation in 2011 the Pre-Crash-Matrix (PCM) offers the possibility to observe the pre-crash phase until five seconds before crash for a wide range of accidents. Currently the PCM contains more than 8.000 reconstructed accidents out of the GIDAS (German In-Depth Accident Study) database and is enlarged continuously by more than 1.000 cases per year. Hence, a detailed investigation of active safety systems in real accident situations has been made feasible.
The PCM contains all relevant data in database format to simulate the pre-crash phase until the first collision of the accident for a maximum of two participants. This includes the definition of the participants and their characteristics, the dynamic behavior of the participants as time-dependent course for five seconds before crash as well as the geometry of the traffic infrastructure.
The digital sketch of the accident and information from GIDAS as well as from supplementary databases represent the main input for the simulation of the pre-crash phase of an accident with the VUFO simulation model VAST (Vufo Accident Simulation Tool). This simulation in turn embodies the foundation of the PCM. The PCM underlies continual improvements and enhancements in consultation with its users.
In addition to collisions of cars with other cars, pedestrians, bicycles and motorcycles the PCM now also covers car to object and car to truck collisions. The paper illustrates car to truck collisions as a showcase and explains perspectives for further developments.
In 2016 a more detailed definition of the contour of the vehicle was added. Furthermore, the geometrical surroundings of the accident site will be provided in a new structure with a higher level of detail. Thus, a precise classification of road marks and objects is possible to further improve the support of developing and evaluating ADAS.
This paper gives an overview about the latest developments of the PCM with its innovations and provides an outlook to upcoming enhancements. Besides potential areas of application for the development of ADAS are shown.
Influence of ADAS on driver behavior Prof. D. Vangi*, A. Virga*, M. Conigliaro*, Prof. H. Steffan**, E. Tomasch** * University of Florence , Department of Industrial Engineering, via di Santa Marta, 3 - 50 139 Firenze, Italy +390552758782 ** TU-Graz, VSI - Vehicle Safety Institute, Inffeldgasse 23/I, A-8010 Graz, Austria Corresponding author: Prof. D. Vangi [email protected] Autonomous driving is one of the main subjects of investigation as regards road vehicles. SAE 3 level represents a transition period towards full-automation in which safety in the interaction between human driving logics and automation logics is one of the issues. Since automation logic is developed without human-like characteristics, solutions could result to be dangerous in terms of interaction with drivers. Duly conceived and developed HMIs (human machine interface) can strongly help in this transition, but human-likeness of automation is a requisite to be appropriately taken into account. Human-likeness of automation ensures more natural and safe interaction with automation logic,smoothness and effectiveness of such an interaction further increases safety. In this context, to properly design effective HMIs a development of driver models seems the main road to drive the progress towards full automation, placing safety and the user acceptance as fundamental points of this development. Current studies aim to new challenges which have to take in consideration the HMI as well as going over the previous experimentation and findings, in order to reach higher levels of automation. With the aim of addressing these new goals driver's behaviour and the HMI features have always to be considered to obtain the best performance when driving. The diffusion of such devices can influence the drivers behavior, so that taking these aspects into account will be more and more relevant in road accident reconstruction, for instance concerning the possible influence on drivers reaction time and mode. In the present study, driver behaviour was studied in road accidents involving elderly pedestrians, with different ADAS (Advanced Driver Assistance Systems) HMIs, as a base to develop a driver model in near missing pedestrian accidents. A literature research was conducted with the aim of finding out the main influencing factors, including environment, boundary conditions, configuration of impact, pedestrian and driver information, when pedestrian fatalities occur and an analysis of frequent road accidents was conducted to get more detailed information about the driver’s behaviour. A general decrease of road victims has been seen over time, but the absolute sum of deaths is still considerable and the challenge to improve pedestrian safety remains still opened. In order to obtain more detailed information about pedestrian accidents, real road accidents were reconstructed with multibody simulations on PC-Crash and, by the comparison between literature findings and reconstructions, a generic accident scenario was defined. The generic accident scenario was implemented on the driving simulator in use at the Laboratory for Safety and Traffic Accident Analysis (LaSIS, University of Florence, Italy) in order to analyse the driving behaviours of volunteers, also considering the influence of ADAS devices. The research was carried out using a full scale dynamic driving simulator. Forty-five young volunteers were enrolled for this study, resulting in forty valid tests on different testing scenarios. Two different scenarios consisted in driving with or without ADAS in the vehicle. Different kinds of ADAS, acoustic and optical, with different time of intervention were tested in order to study the different reactions of the driver. The tests showed some interesting differences between driver's behaviour when approaching the critical situation. Driver with ADAS reacted earlier, but more slowly, depending also on the type of alarm, and often with double reaction when braking. In fact, the results of the activity showed that with ADAS intervention the time to collision (TTC) increases, but the reaction time and braking modality change: a) there is a sort of "latency" time between the accelerator pedal release and the brake pressure; b) the brake pressure is initially less intense. So the driver only partially takes advance from the TTC increase. These differences were valued not only qualitatively, but quantitatively as well. This work revealed to be useful to improve the knowledge of drivers’ behaviour, in order to realize a driver model that can be implemented to help attaining and assessing higher levels of automation through new technology. This work describes the results of the experimental activity, illustrating the driving behaviour observed in different conditions, relating them to the different methods of ADAS intervention and comparing the driver behaviour without ADAS.
Evaluation of a momentum based impact model and application in an effectivity study considering junction accidents
H Kolk*, E Tomasch*, W Sinz*, J Bakker**, J Dobberstein**
*Vehicle Safety Institute, University of Technology Graz, Inffeldgasse 23/I, 8010 Graz, AUT **Accident Research and Risk Assessment, Daimler AG, Bela-Barenyi-Straße, 71059 Sindelfingen, GER
Abstract - The advent of active safety systems calls for the development of appropriate testing methods. These methods aim to assess the effectivity of active safety systems based on criteria such as their capability to avoid accidents or lower impact speeds and thus mitigate the injury severity. For prospective effectivity studies, simulation becomes an important tool that needs valid models not only to simulate driving dynamics and safety systems, but also to resolve the collision mechanics. This paper presents an impact model which is based on solving momentum conservation equations and uses it in an effectivity study of a generic collision mitigation system in reconstructed real accidents at junctions. The model assumes an infinitely short crash duration and computes output parameters such as post-crash velocities, delta-v, force directions, etc. and is applicable for all impact collision configurations such as oblique, excentric collisions. Requiring only very little computational effort, the model is especially useful for effectivity studies where large numbers of simulations are necessary. Validation of the model is done by comparison with results from the widely used reconstruction software PC-Crash. Vehicles involved in the accidents are virtually equipped with a collision mitigation system for junctions using the software X-RATE, and the simulations (referred to as system simulations) are started sufficiently early before the collision occurred. In order to assess the effectivity, the real accident (referred to as baseline) is compared with the system simulations by computing the reduction of the impact speeds and delta-v. NOMENCLATURE ADAS Advanced Driver Assistance System CMS Collision Mitigation System TTC Time to Collision X-RATE Extended Effectiveness Rating of Advanced Driver Assistance Systems CEDATU Central Database for In-Depth Accident Study GIDAS German In-Depth Accident Study POI Point of impact CP Contact plane VFS Virtual forward simulation NCAP New Car Assessment Protocol INTRODUCTION In recent years, ADAS (Advanced Driver Assistance Systems) have increasingly become standard equipment [1–3] for newly introduced cars, aiming to assist in different areas of active vehicle safety. The inclusion of test protocols for ADAS in Euro NCAP [4] or other NCAPs is not only a symptom of this development but also drives the development of such safety systems even further. For each assistance system, there are many questions that have to be addressed, such as: Which type of accident can the system avoid, which not? Which specifications are necessary at minimum to achieve a certain effect? What other positive or negative effects are there? In order to answer those questions, there are several possibilities:
• Natural driving studies • Field operational tests • Physical experiments • Driving simulator studies • Retrospective statistical analysis • Virtual forward simulation
Each method has its advantages and disadvantages and addresses different aspects of effectivity. Especially the simulative approach allows to test a huge variety of scenarios that

are very hard if not at all testable. One of the key elements is the correct assessment of crash severity. For that purpose, valid impact models to resolve the resulting collisions are necessary. This can be achieved for example by finite element methods, which are time consuming and therefore applicable only to limited extent for very high volumes of simulations, or alternatively by less detailed but fast models such as the impact model presented in this paper. OBJECTIVE The objective of this paper is to present an impact model based on momentum conservation equations and restitution principles and to investigate its applicability for effectivity studies of ADAS. Furthermore, the model’s sensitivity in respect to the point of impact and contact plane is studied. METHOD Impact model – basic principles The impact model under investigation is based on the solution of momentum conservation equations balancing the total momentum of the vehicles before and after the crash. It can also be found Burg and Moser [5], Gilardi and Sharf [6] or Steffan and Moser [7], and is based on the works of Kudlich and Slibar [8,9]. For this impact model, the following assumptions are made:
• The model only considers the contact forces that are being exchanged between the two vehicles.
• Tire forces are being neglected. • The crash duration is assumed to be infinitely small, which is why no position changes
and acceleration pulses are resolved during the crash. • No deformations are computed. • The model only considers two spatial dimensions.
Conservation of momentum Momentum conservation basically states that in a closed system, the total momentum remains constant if no external forces act on the system [10]. This principle is of fundamental importance for collision mechanics. The total pulse �⃑� of a system constituted of n interacting bodies, is the sum of the pulses of the individual bodies: �⃑� = 𝑝1���⃑ + 𝑝2����⃑ + ⋯+ 𝑝𝑛����⃑ . (1) A conclusion of this is, that after a collision of two bodies in the system, the total momentum must still be the same. Analogously, this holds for the angular momentum as well: 𝐿�⃑ = 𝐿1����⃑ + 𝐿2����⃑ + ⋯+ 𝐿𝑛����⃑ . (2) Restitution and compression In general, the collision phase can be separated into two phases: The compression and the restitution phase. During the compression phase, the kinetic energy of the colliding vehicles is transformed into deformation of the vehicles, until the relative velocity of the contact areas in normal direction is lowered to zero. Like with most other physical bodies, some of the relative kinetic energy is retained after a collision, which is called restitution. The restitution coefficient 𝜖 describes the ratio between the absolute of the exchanged momentum of both phases:
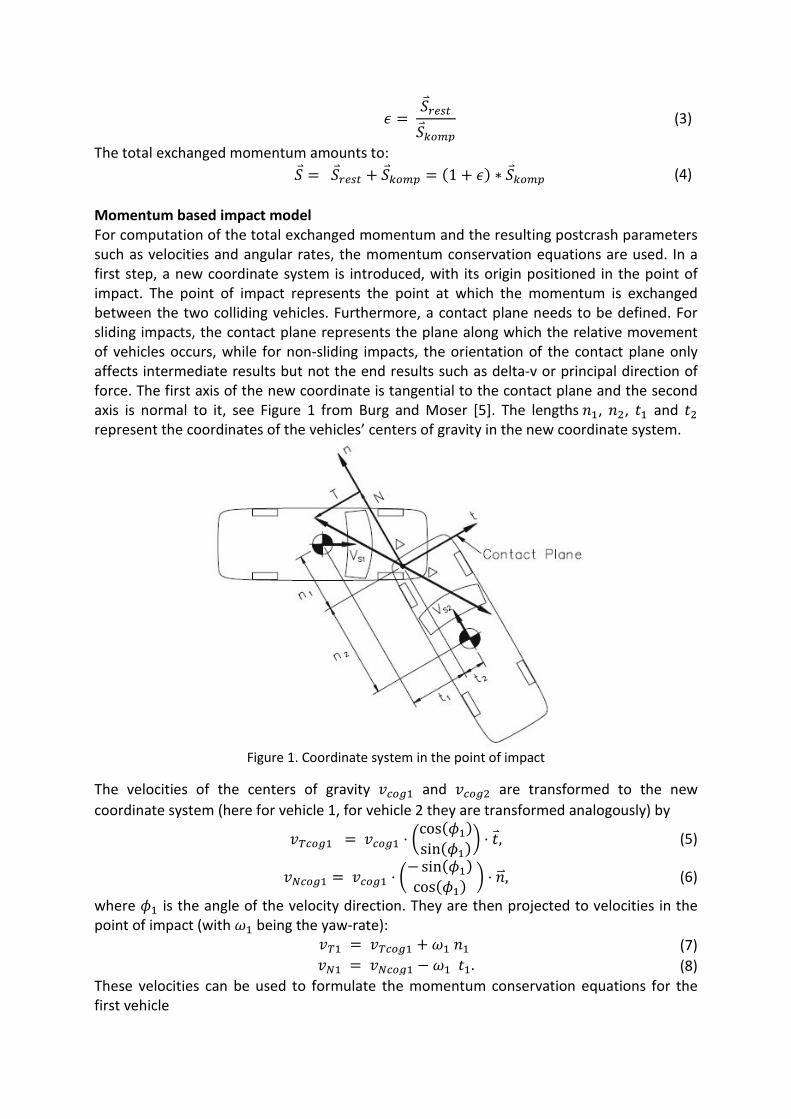
𝜖 = 𝑆𝑟𝑟𝑟𝑟𝑆𝑘𝑘𝑘𝑘
(3)
The total exchanged momentum amounts to: 𝑆 = 𝑆𝑟𝑟𝑟𝑟 + 𝑆𝑘𝑘𝑘𝑘 = (1 + 𝜖) ∗ 𝑆𝑘𝑘𝑘𝑘 (4)
Momentum based impact model For computation of the total exchanged momentum and the resulting postcrash parameters such as velocities and angular rates, the momentum conservation equations are used. In a first step, a new coordinate system is introduced, with its origin positioned in the point of impact. The point of impact represents the point at which the momentum is exchanged between the two colliding vehicles. Furthermore, a contact plane needs to be defined. For sliding impacts, the contact plane represents the plane along which the relative movement of vehicles occurs, while for non-sliding impacts, the orientation of the contact plane only affects intermediate results but not the end results such as delta-v or principal direction of force. The first axis of the new coordinate is tangential to the contact plane and the second axis is normal to it, see Figure 1 from Burg and Moser [5]. The lengths 𝑛1, 𝑛2, 𝑡1 and 𝑡2 represent the coordinates of the vehicles’ centers of gravity in the new coordinate system.
Figure 1. Coordinate system in the point of impact
The velocities of the centers of gravity 𝑣𝑐𝑘𝑐1 and 𝑣𝑐𝑘𝑐2 are transformed to the new coordinate system (here for vehicle 1, for vehicle 2 they are transformed analogously) by
𝑣𝑇𝑐𝑘𝑐1 = 𝑣𝑐𝑘𝑐1 ⋅ �cos(𝜙1)sin(𝜙1)� ⋅ 𝑡, (5)
𝑣𝑁𝑐𝑘𝑐1 = 𝑣𝑐𝑘𝑐1 ⋅ �− sin(𝜙1)cos(𝜙1) � ⋅ 𝑛�⃑ , (6)
where 𝜙1 is the angle of the velocity direction. They are then projected to velocities in the point of impact (with 𝜔1 being the yaw-rate):
𝑣𝑇1 = 𝑣𝑇𝑐𝑘𝑐1 + 𝜔1 𝑛1 (7) 𝑣𝑁1 = 𝑣𝑁𝑐𝑘𝑐1 − 𝜔1 𝑡1. (8)
These velocities can be used to formulate the momentum conservation equations for the first vehicle
𝑚1�𝑣𝑇𝑐𝑘𝑐1′ − 𝑣𝑇𝑐𝑘𝑐1� = 𝑇, (9) 𝑚1�𝑣𝑁𝑐𝑘𝑐1′ − 𝑣𝑁𝑐𝑘𝑐1� = 𝑁, (10)
and the second vehicle, 𝑚2�𝑣𝑇𝑐𝑘𝑐2′ − 𝑣𝑇𝑐𝑘𝑐2� = −𝑇, (11) 𝑚2�𝑣𝑁𝑐𝑘𝑐2′ − 𝑣𝑁𝑐𝑘𝑐2� = −𝑁, (12)
where 𝑣𝑇𝑐𝑘𝑐1′ and 𝑣𝑁𝑐𝑘𝑐1′ denote the postcrash-velocities in tangential and normal direction for the first vehicle, 𝑣𝑇𝑐𝑘𝑐2′ and 𝑣𝑁𝑐𝑘𝑐2′ analogously for the second vehicle. Furthermore, assuming that the angular momenta 𝐼1 and 𝐼2 are known, the angular momentum balance equations read (with 𝜔′ being the postcrash yaw rate):
𝐼1(𝜔1′ − 𝜔1) = 𝑇 ⋅ 𝑛1 − 𝑁 ⋅ 𝑡1, (13)
𝐼2(𝜔2′ − 𝜔2) = −𝑇 ⋅ 𝑛2 + 𝑁 ⋅ 𝑡2. (14)
By definition of the relative precrash velocities 𝑣𝑇 = 𝑣𝑇1 − 𝑣𝑇2 and 𝑣𝑁 = 𝑣𝑁1 − 𝑣𝑁2, the balance equations (9)-(14) can be rewritten into the following expression for the relative postcrash velocities:
𝑣𝑇′ = 𝑣𝑇 + 𝑐1𝑇 − 𝑐3𝑁, (15) 𝑣𝑁′ = 𝑣𝑁 − 𝑐3𝑇 + 𝑐2𝑁, (16)
with
𝑐1 =1𝑚1
+1𝑚2
+𝑛12
𝐼1+𝑛22
𝐼2, (17)
𝑐2 =1𝑚1
+1𝑚2
+𝑡12
𝐼1+𝑡22
𝐼2, (18)
𝑐3 =𝑡1𝑛1𝐼1
+𝑡2𝑛2𝐼2
. (19)
Full impact In case the collision is not a sliding collision, the relative velocities at the end of the compression phase (𝑣𝑇′ and 𝑣𝑁′ ) are zero. By rearranging the terms in (15)-(16), expressions for the crash pulse in the compression phase can be derived that only contain known values from the precrash phase:
𝑇𝐶 = 𝑣𝑁𝑐3 + 𝑣𝑇𝑐2𝑐32 − 𝑐1𝑐2
, (20)
𝑁𝐶 =𝑣𝑁𝑐1 + 𝑣𝑇𝑐3𝑐32 − 𝑐1𝑐2
. (21)
The total exchanged momentum 𝑇 = 𝑇𝐶(1 + 𝜖), (22) 𝑁 = 𝑁𝐶(1 + 𝜖), (23)
can be used to compute the postcrash velocities of the center of gravity and the postcrash yaw velocities using the conservation equations (9)-(12). Sliding collision For sliding impacts, no common velocity at the contact zones is reached, i.e. the relative tangential velocity is not zero. In this case, the contact plane becomes relevant and an inter-vehicle friction coefficient 𝜇 is required to model the impact. The direction of momentum transfer is limited by this coefficient, such that:
𝑇𝐶 = 𝜇𝑁𝐶 , (24) which replaces equation (15). Rearranging equation (16) results to
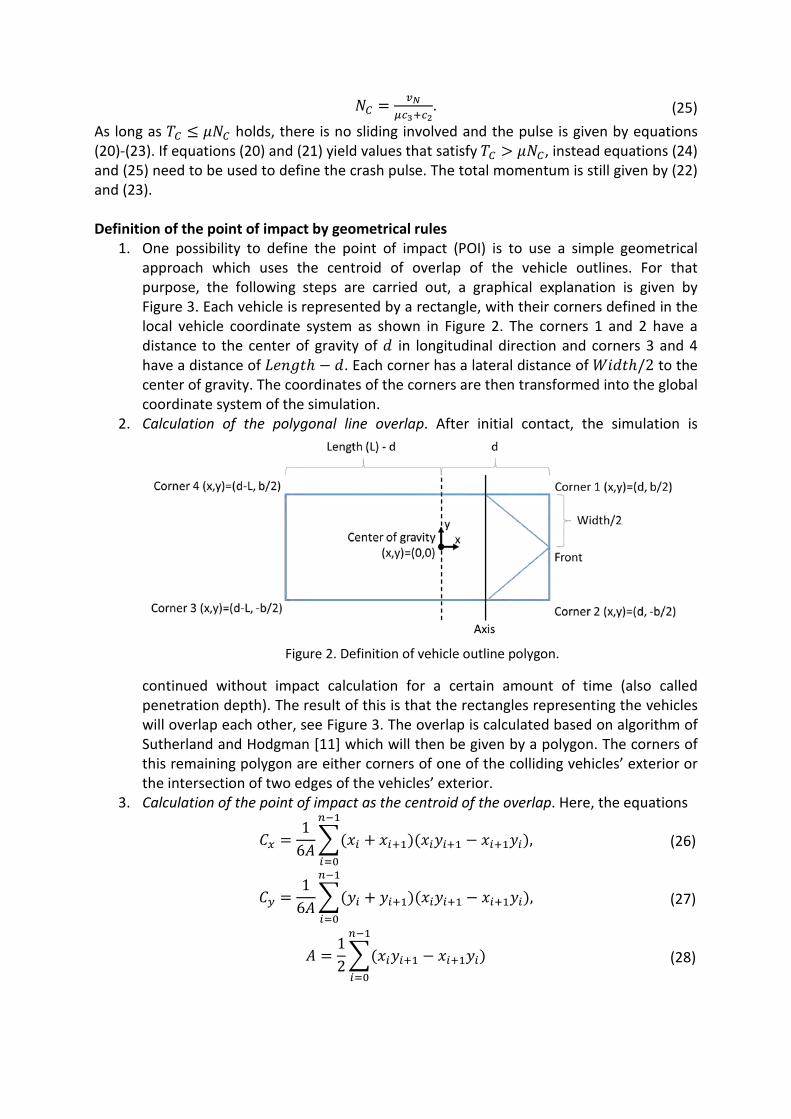
𝑁𝐶 = 𝑣𝑁𝜇𝑐3+𝑐2
. (25) As long as 𝑇𝐶 ≤ 𝜇𝑁𝐶 holds, there is no sliding involved and the pulse is given by equations (20)-(23). If equations (20) and (21) yield values that satisfy 𝑇𝐶 > 𝜇𝑁𝐶, instead equations (24) and (25) need to be used to define the crash pulse. The total momentum is still given by (22) and (23). Definition of the point of impact by geometrical rules
1. One possibility to define the point of impact (POI) is to use a simple geometrical approach which uses the centroid of overlap of the vehicle outlines. For that purpose, the following steps are carried out, a graphical explanation is given by Figure 3. Each vehicle is represented by a rectangle, with their corners defined in the local vehicle coordinate system as shown in Figure 2. The corners 1 and 2 have a distance to the center of gravity of 𝑑 in longitudinal direction and corners 3 and 4 have a distance of 𝐿𝐿𝑛𝐿𝑡ℎ − 𝑑. Each corner has a lateral distance of 𝑊𝑊𝑑𝑡ℎ/2 to the center of gravity. The coordinates of the corners are then transformed into the global coordinate system of the simulation.
2. Calculation of the polygonal line overlap. After initial contact, the simulation is
continued without impact calculation for a certain amount of time (also called penetration depth). The result of this is that the rectangles representing the vehicles will overlap each other, see Figure 3. The overlap is calculated based on algorithm of Sutherland and Hodgman [11] which will then be given by a polygon. The corners of this remaining polygon are either corners of one of the colliding vehicles’ exterior or the intersection of two edges of the vehicles’ exterior.
3. Calculation of the point of impact as the centroid of the overlap. Here, the equations
𝐶𝑥 =1
6𝐴�(𝑥𝑖 + 𝑥𝑖+1)(𝑥𝑖𝑦𝑖+1 − 𝑥𝑖+1𝑦𝑖)𝑛−1
𝑖=0
, (26)
𝐶𝑦 =1
6𝐴�(𝑦𝑖 + 𝑦𝑖+1)(𝑥𝑖𝑦𝑖+1 − 𝑥𝑖+1𝑦𝑖)𝑛−1
𝑖=0
, (27)
𝐴 =12�(𝑥𝑖𝑦𝑖+1 − 𝑥𝑖+1𝑦𝑖)𝑛−1
𝑖=0
(28)
Figure 2. Definition of vehicle outline polygon.
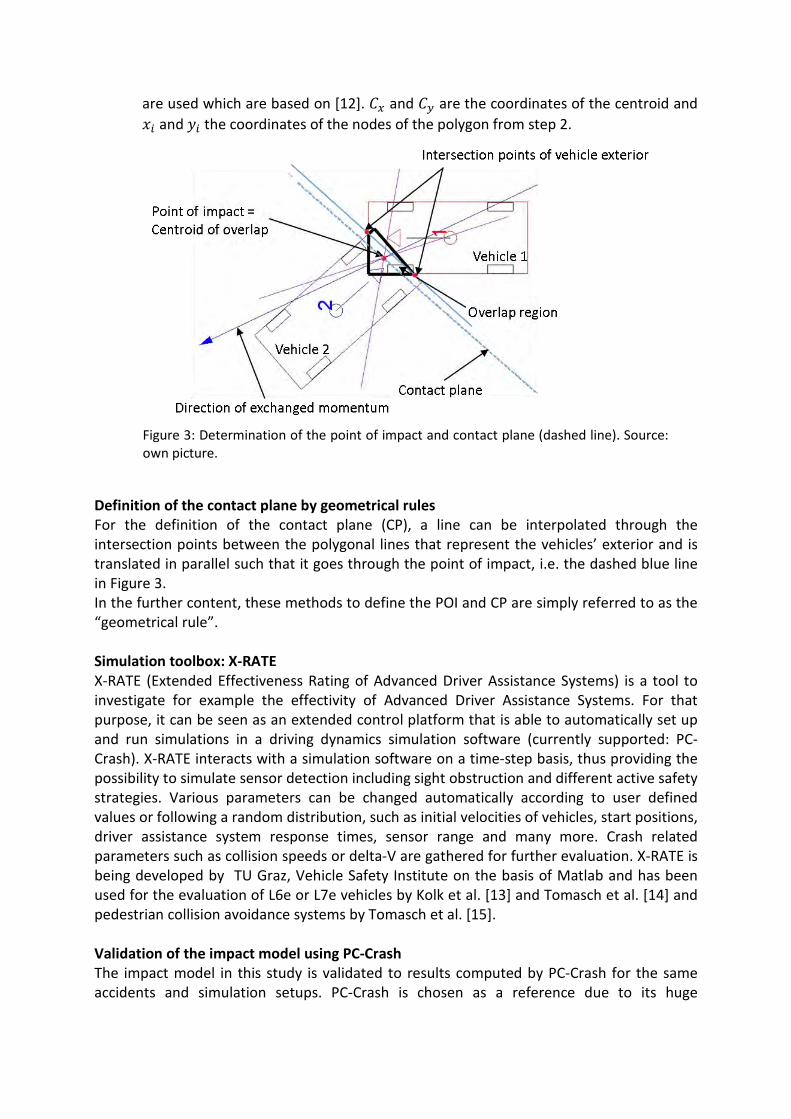
are used which are based on [12]. 𝐶𝑥 and 𝐶𝑦 are the coordinates of the centroid and 𝑥𝑖 and 𝑦𝑖 the coordinates of the nodes of the polygon from step 2.
Definition of the contact plane by geometrical rules For the definition of the contact plane (CP), a line can be interpolated through the intersection points between the polygonal lines that represent the vehicles’ exterior and is translated in parallel such that it goes through the point of impact, i.e. the dashed blue line in Figure 3. In the further content, these methods to define the POI and CP are simply referred to as the “geometrical rule”. Simulation toolbox: X-RATE X-RATE (Extended Effectiveness Rating of Advanced Driver Assistance Systems) is a tool to investigate for example the effectivity of Advanced Driver Assistance Systems. For that purpose, it can be seen as an extended control platform that is able to automatically set up and run simulations in a driving dynamics simulation software (currently supported: PC-Crash). X-RATE interacts with a simulation software on a time-step basis, thus providing the possibility to simulate sensor detection including sight obstruction and different active safety strategies. Various parameters can be changed automatically according to user defined values or following a random distribution, such as initial velocities of vehicles, start positions, driver assistance system response times, sensor range and many more. Crash related parameters such as collision speeds or delta-V are gathered for further evaluation. X-RATE is being developed by TU Graz, Vehicle Safety Institute on the basis of Matlab and has been used for the evaluation of L6e or L7e vehicles by Kolk et al. [13] and Tomasch et al. [14] and pedestrian collision avoidance systems by Tomasch et al. [15]. Validation of the impact model using PC-Crash The impact model in this study is validated to results computed by PC-Crash for the same accidents and simulation setups. PC-Crash is chosen as a reference due to its huge
Figure 3: Determination of the point of impact and contact plane (dashed line). Source: own picture.
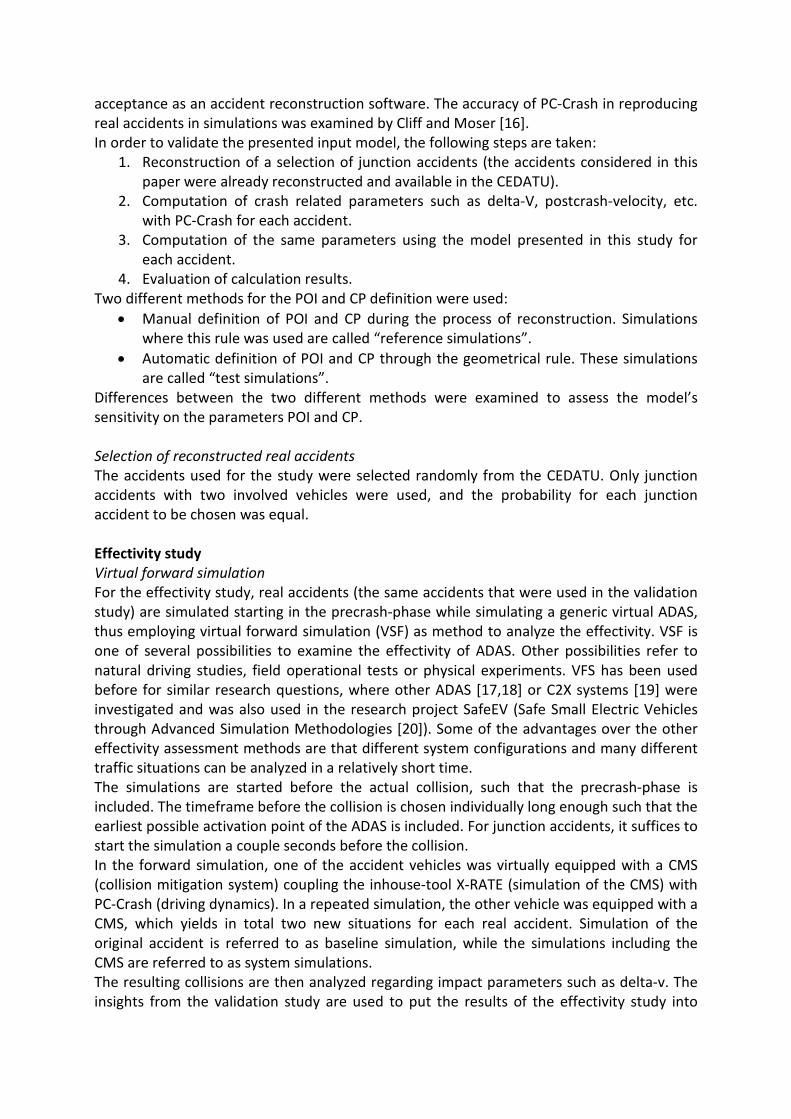
acceptance as an accident reconstruction software. The accuracy of PC-Crash in reproducing real accidents in simulations was examined by Cliff and Moser [16]. In order to validate the presented input model, the following steps are taken:
1. Reconstruction of a selection of junction accidents (the accidents considered in this paper were already reconstructed and available in the CEDATU).
2. Computation of crash related parameters such as delta-V, postcrash-velocity, etc. with PC-Crash for each accident.
3. Computation of the same parameters using the model presented in this study for each accident.
4. Evaluation of calculation results. Two different methods for the POI and CP definition were used:
• Manual definition of POI and CP during the process of reconstruction. Simulations where this rule was used are called “reference simulations”.
• Automatic definition of POI and CP through the geometrical rule. These simulations are called “test simulations”.
Differences between the two different methods were examined to assess the model’s sensitivity on the parameters POI and CP. Selection of reconstructed real accidents The accidents used for the study were selected randomly from the CEDATU. Only junction accidents with two involved vehicles were used, and the probability for each junction accident to be chosen was equal. Effectivity study Virtual forward simulation For the effectivity study, real accidents (the same accidents that were used in the validation study) are simulated starting in the precrash-phase while simulating a generic virtual ADAS, thus employing virtual forward simulation (VSF) as method to analyze the effectivity. VSF is one of several possibilities to examine the effectivity of ADAS. Other possibilities refer to natural driving studies, field operational tests or physical experiments. VFS has been used before for similar research questions, where other ADAS [17,18] or C2X systems [19] were investigated and was also used in the research project SafeEV (Safe Small Electric Vehicles through Advanced Simulation Methodologies [20]). Some of the advantages over the other effectivity assessment methods are that different system configurations and many different traffic situations can be analyzed in a relatively short time. The simulations are started before the actual collision, such that the precrash-phase is included. The timeframe before the collision is chosen individually long enough such that the earliest possible activation point of the ADAS is included. For junction accidents, it suffices to start the simulation a couple seconds before the collision. In the forward simulation, one of the accident vehicles was virtually equipped with a CMS (collision mitigation system) coupling the inhouse-tool X-RATE (simulation of the CMS) with PC-Crash (driving dynamics). In a repeated simulation, the other vehicle was equipped with a CMS, which yields in total two new situations for each real accident. Simulation of the original accident is referred to as baseline simulation, while the simulations including the CMS are referred to as system simulations. The resulting collisions are then analyzed regarding impact parameters such as delta-v. The insights from the validation study are used to put the results of the effectivity study into
perspective. In order to assess the effectivity of the CMS, the baseline simulations are compared to the system simulations. Sensor representation The simulation of the sensor is based on a simple geometrical consideration. Originating from the sensor, so-called “vision rays” were considered, which could represent e.g. the laser rays of a LiDAR-sensor. They are emitted horizontally in equal angular distances. The angular distances are chosen in such a way, that the whole range of the horizontal opening angle is covered for a defined number of rays. When a ray intersects an object, the object is only labeled by the algorithm as detected if the distance of the intersection point to the sensor is less than a defined sensor range. Only the closest intersecting object is detected by a ray, thus modelling sight occlusion, see Figure 4 [13].
Due to the similarity of the geometrical sensor model to the LiDAR operation principle, the specifications for range (150m) and horizontal opening angle (145°) from the LiDAR sensor “ScaLa” by Ibeo were used as an example sensor [21]. ADAS simulation For the effectivity study, a virtual CMS is considered that is able to estimate whether another object (vehicle) is on collision course with the ego vehicle under the assumption of constant velocity and velocity direction of both vehicles. A braking maneuver is triggered as soon as the time to collision is lower than 1.8s. The brake deceleration was defined as 8m/s² and a system latency time was taken into account as well as a lag time (time to full activation of brakes). This represents one of the strategies presented in Zauner et al. [22] and there is no reason why this specific strategy was chosen – for this paper, it serves just as an example strategy while the focus lies on the impact model. The values do not represent an existing system. MATERIAL The in-depth database CEDATU (Central Database for In-Depth Accident Study) was the source for the real accidents which were then analyzed [23,24]. Each individual traffic accident was reconstructed using the traffic accident reconstruction program PC-Crash and saved on CEDATU with all accident related data. Information on initial speed, collision speed, overlap, etc. were calculated on the basis of accident reports which consist of reports such as police reports and medical reports, attached photos and photogrammetric analyses of the accident site. The data field basis of CEDATU is the STAIRS protocol (Standardization of Accident and Injury Registration System [25]) which was developed over the course of an EU project with the
Origin of vehicle coordinate system
Sensor position Laser beams
Detected points
Figure 4. Top view of the geometrical sensor vision algorithm.
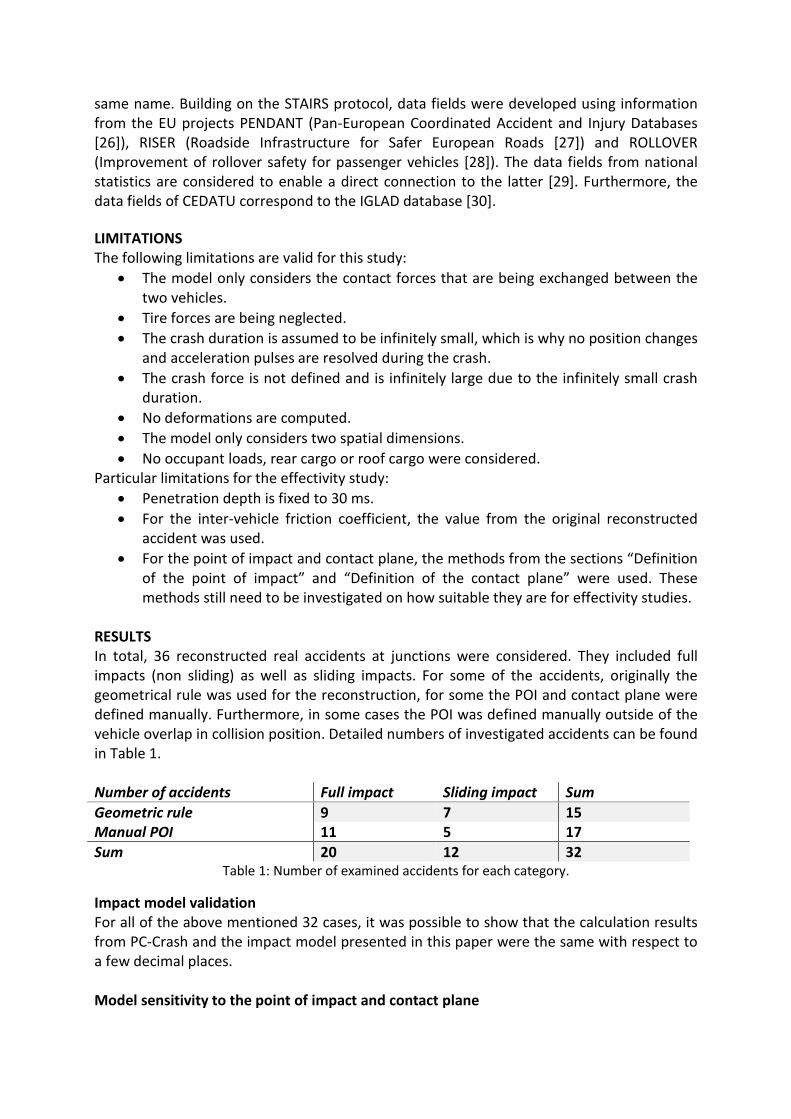
same name. Building on the STAIRS protocol, data fields were developed using information from the EU projects PENDANT (Pan-European Coordinated Accident and Injury Databases [26]), RISER (Roadside Infrastructure for Safer European Roads [27]) and ROLLOVER (Improvement of rollover safety for passenger vehicles [28]). The data fields from national statistics are considered to enable a direct connection to the latter [29]. Furthermore, the data fields of CEDATU correspond to the IGLAD database [30]. LIMITATIONS The following limitations are valid for this study:
• The model only considers the contact forces that are being exchanged between the two vehicles.
• Tire forces are being neglected. • The crash duration is assumed to be infinitely small, which is why no position changes
and acceleration pulses are resolved during the crash. • The crash force is not defined and is infinitely large due to the infinitely small crash
duration. • No deformations are computed. • The model only considers two spatial dimensions. • No occupant loads, rear cargo or roof cargo were considered.
Particular limitations for the effectivity study: • Penetration depth is fixed to 30 ms. • For the inter-vehicle friction coefficient, the value from the original reconstructed
accident was used. • For the point of impact and contact plane, the methods from the sections “Definition
of the point of impact” and “Definition of the contact plane” were used. These methods still need to be investigated on how suitable they are for effectivity studies.
RESULTS In total, 36 reconstructed real accidents at junctions were considered. They included full impacts (non sliding) as well as sliding impacts. For some of the accidents, originally the geometrical rule was used for the reconstruction, for some the POI and contact plane were defined manually. Furthermore, in some cases the POI was defined manually outside of the vehicle overlap in collision position. Detailed numbers of investigated accidents can be found in Table 1. Number of accidents Full impact Sliding impact Sum Geometric rule 9 7 15 Manual POI 11 5 17 Sum 20 12 32
Table 1: Number of examined accidents for each category.
Impact model validation For all of the above mentioned 32 cases, it was possible to show that the calculation results from PC-Crash and the impact model presented in this paper were the same with respect to a few decimal places. Model sensitivity to the point of impact and contact plane
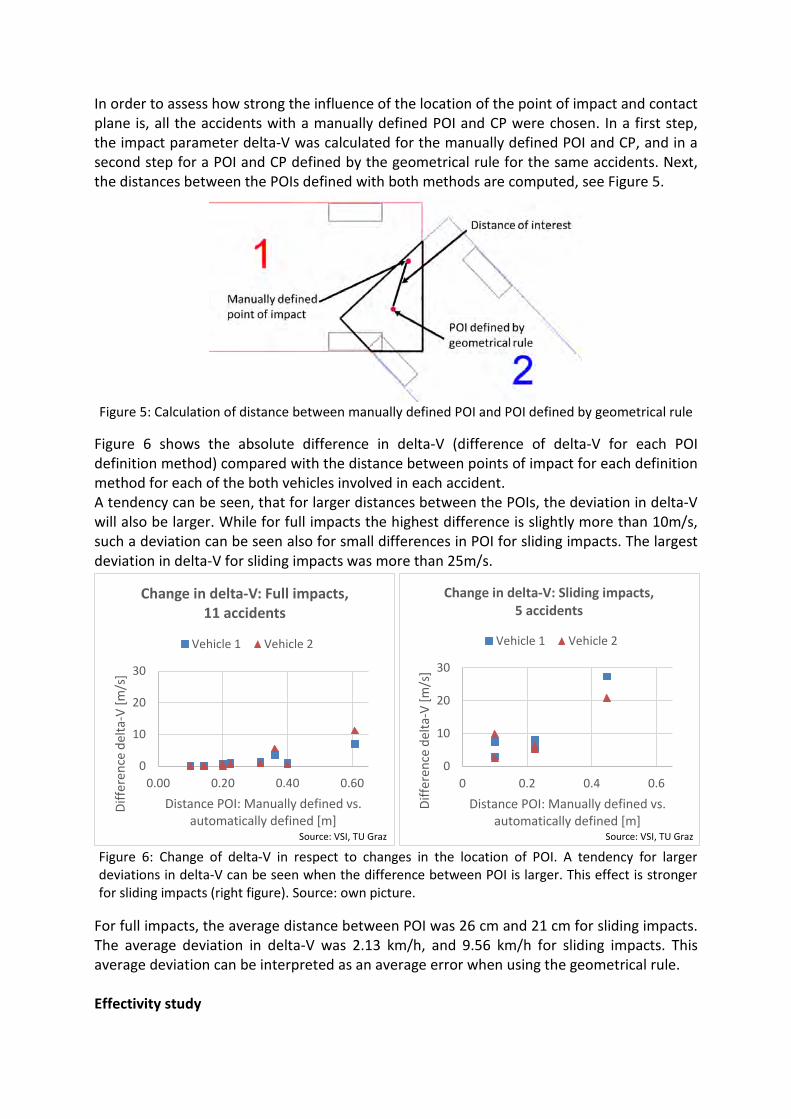
In order to assess how strong the influence of the location of the point of impact and contact plane is, all the accidents with a manually defined POI and CP were chosen. In a first step, the impact parameter delta-V was calculated for the manually defined POI and CP, and in a second step for a POI and CP defined by the geometrical rule for the same accidents. Next, the distances between the POIs defined with both methods are computed, see Figure 5.
Figure 5: Calculation of distance between manually defined POI and POI defined by geometrical rule
Figure 6 shows the absolute difference in delta-V (difference of delta-V for each POI definition method) compared with the distance between points of impact for each definition method for each of the both vehicles involved in each accident. A tendency can be seen, that for larger distances between the POIs, the deviation in delta-V will also be larger. While for full impacts the highest difference is slightly more than 10m/s, such a deviation can be seen also for small differences in POI for sliding impacts. The largest deviation in delta-V for sliding impacts was more than 25m/s.
For full impacts, the average distance between POI was 26 cm and 21 cm for sliding impacts. The average deviation in delta-V was 2.13 km/h, and 9.56 km/h for sliding impacts. This average deviation can be interpreted as an average error when using the geometrical rule. Effectivity study
0
10
20
30
0 0.2 0.4 0.6
Diffe
renc
e de
lta-V
[m/s
]
Distance POI: Manually defined vs. automatically defined [m]
Change in delta-V: Sliding impacts, 5 accidents
Vehicle 1 Vehicle 2
Figure 6: Change of delta-V in respect to changes in the location of POI. A tendency for larger deviations in delta-V can be seen when the difference between POI is larger. This effect is stronger for sliding impacts (right figure). Source: own picture.
0
10
20
30
0.00 0.20 0.40 0.60
Diffe
renc
e de
lta-V
[m/s
]
Distance POI: Manually defined vs. automatically defined [m]
Change in delta-V: Full impacts, 11 accidents
Vehicle 1 Vehicle 2
Source: VSI, TU Graz Source: VSI, TU Graz
In an example effectivity study for a collision mitigation system, the accidents were simulated starting 5 seconds before the crash. The CMS was able to avoid 20 of 32 accidents, and reduce the average delta-V from 31.8 km/h in the baseline to 8.8 km/h in the system simulation (including avoided accidents in the calculation with a delta-V of 0) which is a reduction by around 72%. Using only the remaining accidents for the calculation of the average yields a delta-V of 22.9 km/h. Only 4 of the remaining 10 accidents resulted in a sliding collision. CONCLUSION AND OUTLOOK
1. Impact model validation: The presented model produces the same results as PC-Crash under the mentioned limitations.
2. Model sensitivity: The results of the model are highly dependent to the input parameters point of impact and contact plane. For full impacts, the largest observed deviation in delta-V was around 11.2 km/h for a change of 61 cm in the POI, while it was much larger, 27 km/h, for sliding impacts for a change in POI of only 45 cm.
3. Effectivity study: Since the introduction of the CMS changes the original accident scenario dramatically, the manually defined POI and CP from the reconstruction could not be used, so the geometrical rule was employed. The CMS led to an impressive reduction of average delta-V from 31.8 to 8.8 km/h. However, since for full impacts the average error of the geometrical rule was 2.1 km/h and especially 9.6 km/h for sliding impacts, such hypothetical reduction rates of delta-V have to be taken with care.
In future research, the following things could be investigated:
• Extension to a 3D model. • Further investigation of the model’s sensitivity to input parameters. • Exploration for better rules to define POI and CP, especially a better rule for sliding
impacts. REFERENCES [1] PwC, Weltweites Marktvolumen von autonomen Fahrfunktionen im Vergleich der Jahre 2016 und 2021 (in Milliarden
Euro), 2015, http://de.statista.com/statistik/daten/studie/468552/umfrage/marktvolumen-von-autonomen-fahrfunktionen/, accessed 31st of May, 2016.
[2] LMC Automotive, Oliver Wyman, Prognose zur globalen Produktion von voll- und teilautomatisierten Fahrzeugen in den Jahren 2014 und 2035 (in Millionen Stück), 2015, http://de.statista.com/statistik/daten/studie/454011/umfrage/autonome-fahrzeuge-prognose-zur-globalen-produktion/, accessed 31st of May, 2016.
[3] EY, Mit welchen der folgenden Fahrer-Assistenzsysteme haben Sie bereits selbst Erfahrungen gemacht – im eigenen oder in fremden Autos?, 2013, http://de.statista.com/statistik/daten/studie/256071/umfrage/fahrer-assistenzsysteme-in-den-autos-deutscher-autofahrer/, accessed 31st of May, 2016.
[4] Euro NCAP, European New Car Assessment Programme: Test protocol - AEB systems. Version 1.1, 2015. Unpublished work.
[5] H. Burg, A. Moser, Handbuch Verkehrsunfallrekonstruktion: Unfallaufnahme, Fahrdynamik, Simulation, 2., aktualisierte Auflage ed., Vieweg+Teubner Verlag / GWV Fachverlage GmbH Wiesbaden, Wiesbaden, 2009.
[6] G. Gilardi, I. Sharf, Literature survey of contact dynamics modelling, Mechanism and Machine Theory 37 (2002) 1213–1239.
[7] H. Steffan, A. Moser, The Collision and Trajectory Models of PC-CRASH, in: International Congress & Exposition, SAE International400 Commonwealth Drive, Warrendale, PA, United States, 1996.
[8] A. Slibar, Die mechanischen Grundsätze des Stoßvorganges freier und geführter Körper und ihre Anwendung auf den Stoßvorgang von Fahrzeugen, in: Archiv für Unfallforschung, p. 31.
[9] H. Kudlich, Beitrag zur Mechanik des Kraftfahrzeug-Verkehrsunfalls. Techn. Hochsch., Diss.--Wien, 1966. [10] R.P. Feynman, R.B. Leighton, M.L. Sands, The Feynman Lectures on Physics, Addison-Wesley, 1963. [11] I.E. Sutherland, G.W. Hodgman, Reentrant Polygon Clipping, Commun. ACM 17 (1974) 32–42.
[12] Centroid of polygon, https://en.wikipedia.org/wiki/Centroid, accessed 18 February 2016. [13] H. Kolk, S.K. Kirschbichler, E. Tomasch, H. Hoschopf, P. Luttenberger, W. Sinz, Prospective evaluation of the collision
severity of L7e vehicles considering a Collision Mitigation System, in: Transportation Research Procedia, Elsevier, 2016. [14] Ernst Tomasch, Harald Kolk, Wolfgang Sinz, Heinz Hoschopf, Stefan Kirschbichler, Prospektive Bewertung der
Kollisionsschwere von L6e Fahrzeugen unter Berücksichtigung eines Kollisionsminderungssystems, in: 10. VDI-Tagung Fahrzeugsicherheit - Sicherheit 2.0, 2015, pp. 407–418.
[15] Ernst Tomasch, Wolfgang Sinz, Heinz Hoschopf, Harald Kolk, Hermann Steffan, Bewertungsmethodik von integralen Sicherheitssystemen durch Kombination von Test und Simulation am Beispiel von Fußgängerunfällen, in: 10. VDI-Tagung Fahrzeugsicherheit - Sicherheit 2.0, 2015, pp. 157–169.
[16] W.E. Cliff, A. Moser, Reconstruction of twenty staged collisions with PC-Crash's optimizer, 2001. [17] E. Tomasch, W. Sinz, H. Hoschopf, H. Kolk, H. Steffan, Bewertungsmethodik von integralen Sicherheitssystemen durch
Kombination von Test und Simulation am Beispiel von Fußgängerunfällen, in: 10. VDI-Tagung Fahrzeugsicherheit - Sicherheit 2.0, 2015, pp. 157–169.
[18] E. Tomasch, H. Kolk, W. Sinz, H. Hoschopf, S. Kirschbichler, Prospektive Bewertung der Kollisionsschwere von L6e Fahrzeugen unter Berücksichtigung eines Kollisionsminderungssystems, in: 10. VDI-Tagung Fahrzeugsicherheit - Sicherheit 2.0, 2015, pp. 407–418.
[19] S. Billicsich, E. Tomasch, W. Sinz, A. Eichberger, G. Markovic, Z.F. Magosi, Potentieller Einfluss von C2X auf die Vermeidung von Motorradunfällen bzw. Reduktion der Verletzungsschwere, in: 10. VDI-Tagung Fahrzeugsicherheit - Sicherheit 2.0, 2015, pp. 383–392.
[20] Safe Small Electric Vehicles through Advanced Simulation Methodologies: Methodical analysis on future accident scenarios involving SEV´s. Deliverable D 1.1, 2013. Unpublished work.
[21] H. Winner, S. Hakuli, F. Lotz, C. Singer, Handbuch Fahrerassistenzsysteme: Grundlagen, Komponenten und Systeme für aktive Sicherheit und Komfort, 3., überarbeitete und ergänzte Auflage ed., Springer Vieweg, Wiesbaden, 2015.
[22] C. Zauner, E. Tomasch, W. Sinz, C. Ellersdorfer, H. Steffan, Assessment of the effectiveness of Intersection Assistance Systems at urban and rural accident sites, in: ESAR - Expert Symposium on Accident Research, 2014.
[23] E. Tomasch, H. Steffan, M. Darok (Eds.), Retrospective accident investigation using information from court, 2008. [24] E. Tomasch, H. Steffan, ZEDATU (Zentrale Datenbank tödlicher Unfälle in Österreich): A central database of fatalities in
Austria, International Conference "ESAR - Expert Symposium on Accident Research", 2006. [25] R. Ross, P. Lejeune, B. Laumon, J.L. Martin, G. Vallet, I. Kossmann, D. Otte, B. Sexton, P. Thomas, An approach to the
standardisation of accident and injury registration systems (STAIRS) in Europe, 1998. [26] A. Morris, P. Thomas, PENDANT - Pan-European Co-ordinated Accident and Injury Databases, in: NHTSA (Ed.), The 18th
International Technical Conference on the Enhanced Safety of Vehicles (ESV), 2003. [27] RISER Final report - Roadside Infrastructure for Safer European Roads, 2006. Unpublished work. [28] J. Gugler, H. Steffan, ROLLOVER - Improvement of Rollover Safety for Passenger Vehicels: Final report, 2005.
Unpublished work. [29] Statistik Austria, Erläuterungen und Definitionen zum Zählblatt über einen Straßenverkehrsunfall, 2007. Unpublished
work. [30] D. Ockel, J. Bakker, R. Schöneburg, An initiative towards a simplified international in-depth accident database,
Bibliothek der Bundesanstalt für Straßenwesen (BASt), Bergisch Gladbach, 2013, http://bast.opus.hbz-nrw.de/volltexte/2013/671.
ADAC accident research – accident analysis based simulation of the most dangerous scenarios
Thomas Unger*, Johannes Ludwig Haslbeck*, Prof Dr Stefan-Alexander Schneider**
*ADAC Technik Zentrum, Otto-Lilienthal-Strasse 2, 86899 Landsberg a. Lech, Germany ** Kempten University of Applied Sciences, Bahnhofstrasse 61, 87435 Kempten, Germany
Abstract
For more than a decade, ADAC accident researchers have analysed road accidents with severe injuries, recording
some 20,000 accidents. An important task in accident research is to determine the causative factors of road
accidents. Apart from vehicle engineering and human factors, accident research also focuses on infrastructural and
environmental aspects.
To find out what accident scenarios are the most common in ADAC accident research and what driver assistance
systems can prevent them, our first task was to conduct a detailed accident analysis.
Using CarMaker, we performed a realistic simulation of accident scenarios, including crashes, with varying
parameters. To begin with, we made an initial selection of driver assistance systems in order to determine those
with the greatest accident prevention potential.
One important finding of this study is that the safety potential of the individual driver assistance systems can
actually be examined. It also turned out that active safety offers even much more potential for development and
innovation than passive safety. At the same time, testing becomes more demanding, too, as new systems keep
entering the market, many of them differing in functional details.
ADAC will continue to test all driver assistance systems as realistically as possible so as to be able to provide advice
to car buyers. Therefore, it will be essential to develop and improve test conditions and criteria.

MOTIVATION There is evidence that active and passive safety systems have contributed substantially to the
positive trend in accident statistics over the past decades. Unlike passive safety systems, which
are designed to mitigate the consequences of accidents, active safety systems can actually
prevent accidents. Among the latter, ESC (electronic stability control) and ABS (anti-blocking
systems) have proved to be particularly effective in the past few years.
Passive safety systems, such as belt tensioners, airbags, improved crumple zones and passenger
compartments, also reduced the number of accident victims. Although there is still some
potential for development here, too, it is considered much lower than that of active safety
systems.
Current safety-oriented driver assistance systems can already contribute to active accident
prevention. The aim of this paper is to determine the most promising of these systems. For this
purpose, we will identify the most common accident scenarios, simulate them using special
software (IPG CarMaker), conduct an efficiency analysis to determine the most important driver
assistance systems for these scenarios and then apply them to the accident scenarios in another
simulation.
ADAC ACCIDENT RESEARCH Launched by the ADAC Technik Zentrum in Landsberg am Lech in 2005, the ADAC accident
research project aims to contribute to improvements in active and passive vehicle safety and to
increase road safety in general.
The key data source for ADAC accident research is air rescue. ADAC HEMS crews are tasked with
documenting and keeping records of accidents allowing the subsequent assessment of accident
parameters by accident researchers.
Further accident-related information is then culled from other data sources (police, public
prosecutors) to complete the picture.
A total of 18,925 cases were documented in the ADAC accident research database from the
beginning of the project until mid-August 2015. This means an average of 155 cases per month
or approx. 1,860 cases per year since the start of the project. The current average is approx.
3,200 cases per year. It should be noted though that the database includes hardly any night-time
accidents because – with few exceptions – HEMS helicopters are not on standby around the
clock. This is a unique feature of ADAC accident research. The statistics comprise a total of 639
individual data per case, split up into various subcategories, such as vehicle, patient, etc.
Evaluations of these cases allow e.g. an efficiency analysis of individual components of differently
equipped vehicles in similar accident scenarios. For instance, if ESC is installed in vehicle A but
not in vehicle B (their equipment being the same otherwise), the efficiency of a system is easy to
determine by evaluating the accident dynamics, such as lane deviation. This frequently involves
accident reconstruction. In addition to improving vehicle safety, the ADAC accident research

project also aims to further improve crash test procedures. It goes without saying that accident
data are a particularly important criterion in this regard. ADAC accident research data can also be
useful for first responders.
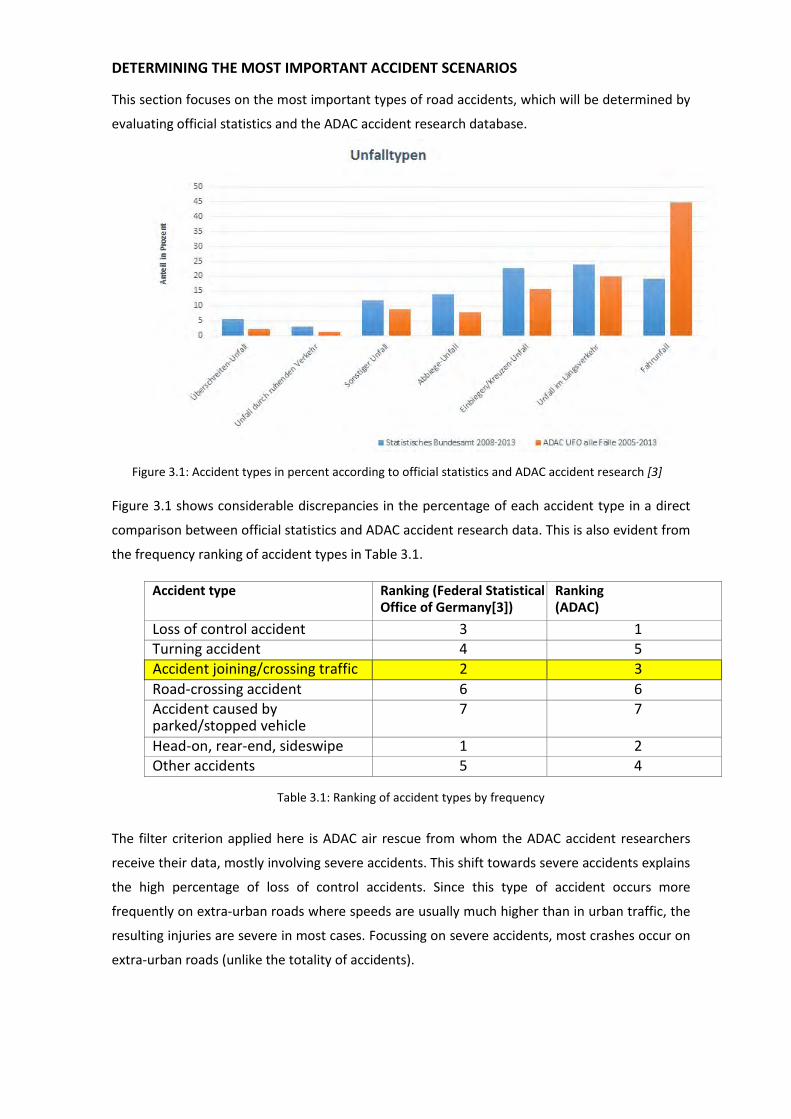
DETERMINING THE MOST IMPORTANT ACCIDENT SCENARIOS This section focuses on the most important types of road accidents, which will be determined by
evaluating official statistics and the ADAC accident research database.
Figure 3.1: Accident types in percent according to official statistics and ADAC accident research [3] Figure 3.1 shows considerable discrepancies in the percentage of each accident type in a direct
comparison between official statistics and ADAC accident research data. This is also evident from
the frequency ranking of accident types in Table 3.1.
Accident type Ranking (Federal Statistical Office of Germany[3])
Ranking (ADAC)
Loss of control accident 3 1 Turning accident 4 5 Accident joining/crossing traffic 2 3 Road-crossing accident 6 6 Accident caused by parked/stopped vehicle
7 7
Head-on, rear-end, sideswipe
1 2 Other accidents 5 4
Table 3.1: Ranking of accident types by frequency
The filter criterion applied here is ADAC air rescue from whom the ADAC accident researchers
receive their data, mostly involving severe accidents. This shift towards severe accidents explains
the high percentage of loss of control accidents. Since this type of accident occurs more
frequently on extra-urban roads where speeds are usually much higher than in urban traffic, the
resulting injuries are severe in most cases. Focussing on severe accidents, most crashes occur on
extra-urban roads (unlike the totality of accidents).
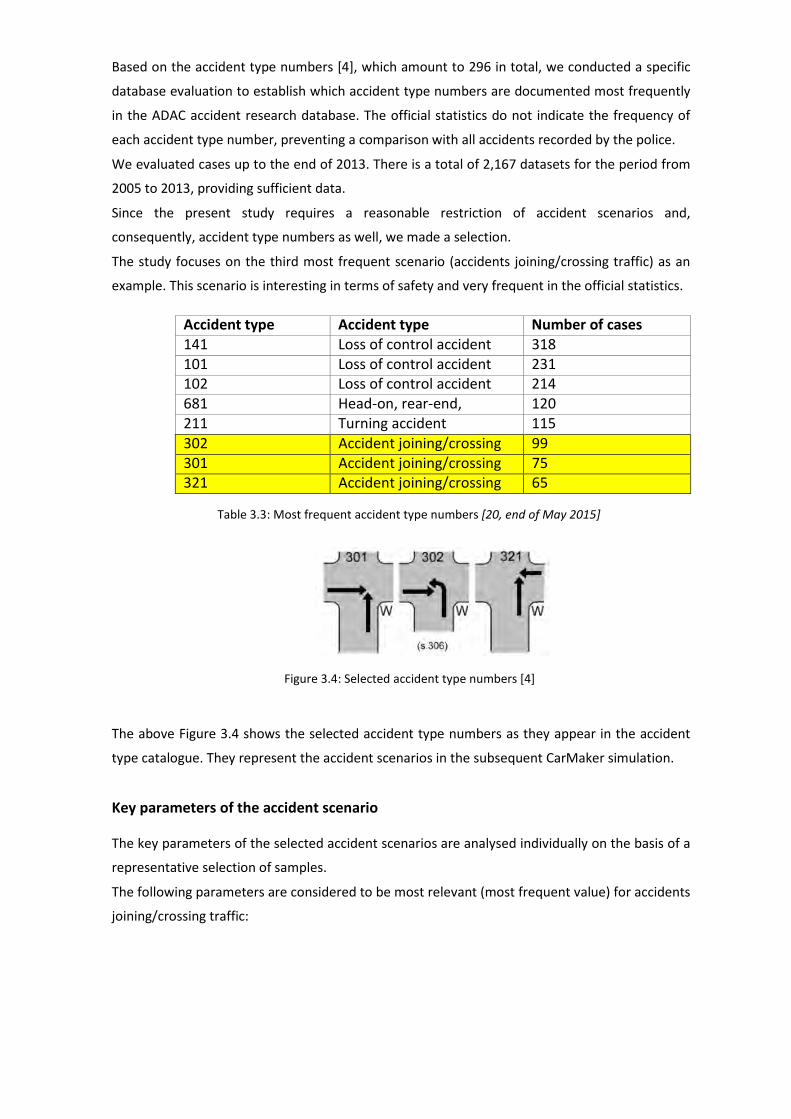
Based on the accident type numbers [4], which amount to 296 in total, we conducted a specific
database evaluation to establish which accident type numbers are documented most frequently
in the ADAC accident research database. The official statistics do not indicate the frequency of
each accident type number, preventing a comparison with all accidents recorded by the police.
We evaluated cases up to the end of 2013. There is a total of 2,167 datasets for the period from
2005 to 2013, providing sufficient data.
Since the present study requires a reasonable restriction of accident scenarios and,
consequently, accident type numbers as well, we made a selection.
The study focuses on the third most frequent scenario (accidents joining/crossing traffic) as an
example. This scenario is interesting in terms of safety and very frequent in the official statistics.
Accident type
Accident type Number of cases 141 Loss of control accident 318 101 Loss of control accident 231 102 Loss of control accident 214 681 Head-on, rear-end,
120
211 Turning accident 115 302 Accident joining/crossing
99
301 Accident joining/crossing
75 321 Accident joining/crossing
65
Table 3.3: Most frequent accident type numbers [20, end of May 2015]
Figure 3.4: Selected accident type numbers [4]
The above Figure 3.4 shows the selected accident type numbers as they appear in the accident
type catalogue. They represent the accident scenarios in the subsequent CarMaker simulation.
Key parameters of the accident scenario The key parameters of the selected accident scenarios are analysed individually on the basis of a
representative selection of samples.
The following parameters are considered to be most relevant (most frequent value) for accidents
joining/crossing traffic:
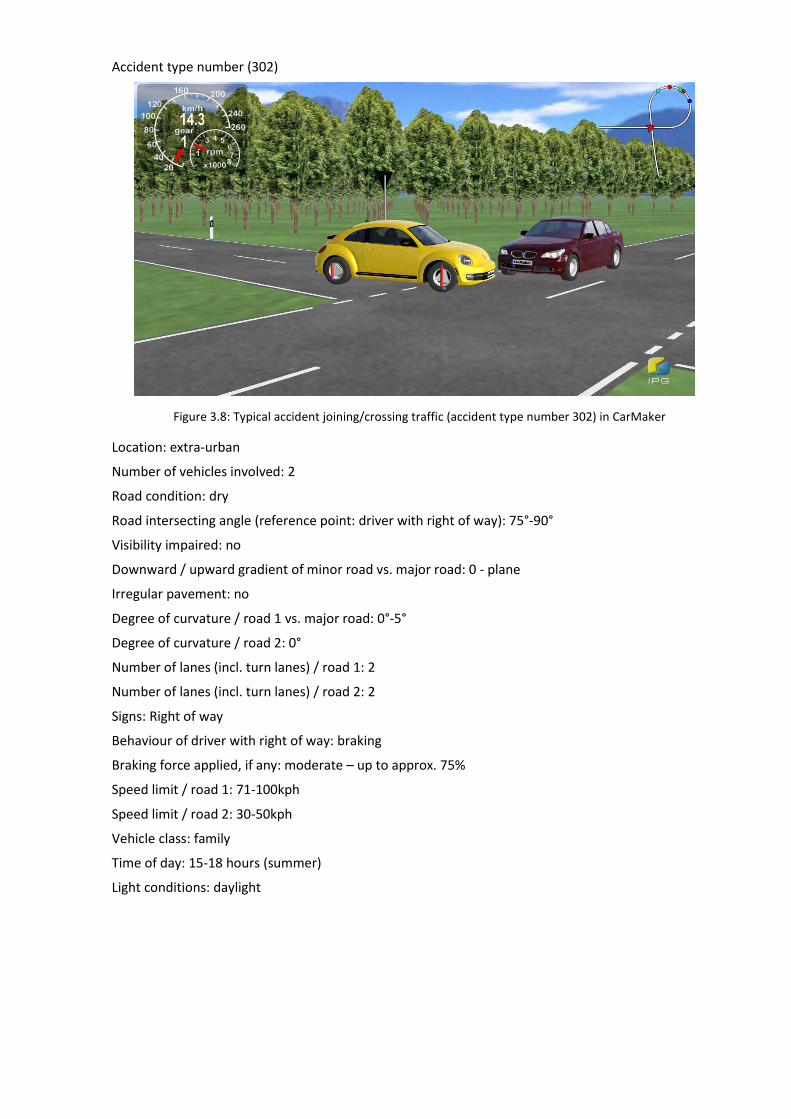
Accident type number (302)
Figure 3.8: Typical accident joining/crossing traffic (accident type number 302) in CarMaker Location: extra-urban
Number of vehicles involved: 2
Road condition: dry
Road intersecting angle (reference point: driver with right of way): 75°-90°
Visibility impaired: no
Downward / upward gradient of minor road vs. major road: 0 - plane
Irregular pavement: no
Degree of curvature / road 1 vs. major road: 0°-5°
Degree of curvature / road 2: 0°
Number of lanes (incl. turn lanes) / road 1: 2
Number of lanes (incl. turn lanes) / road 2: 2
Signs: Right of way
Behaviour of driver with right of way: braking
Braking force applied, if any: moderate – up to approx. 75%
Speed limit / road 1: 71-100kph
Speed limit / road 2: 30-50kph
Vehicle class: family
Time of day: 15-18 hours (summer)
Light conditions: daylight
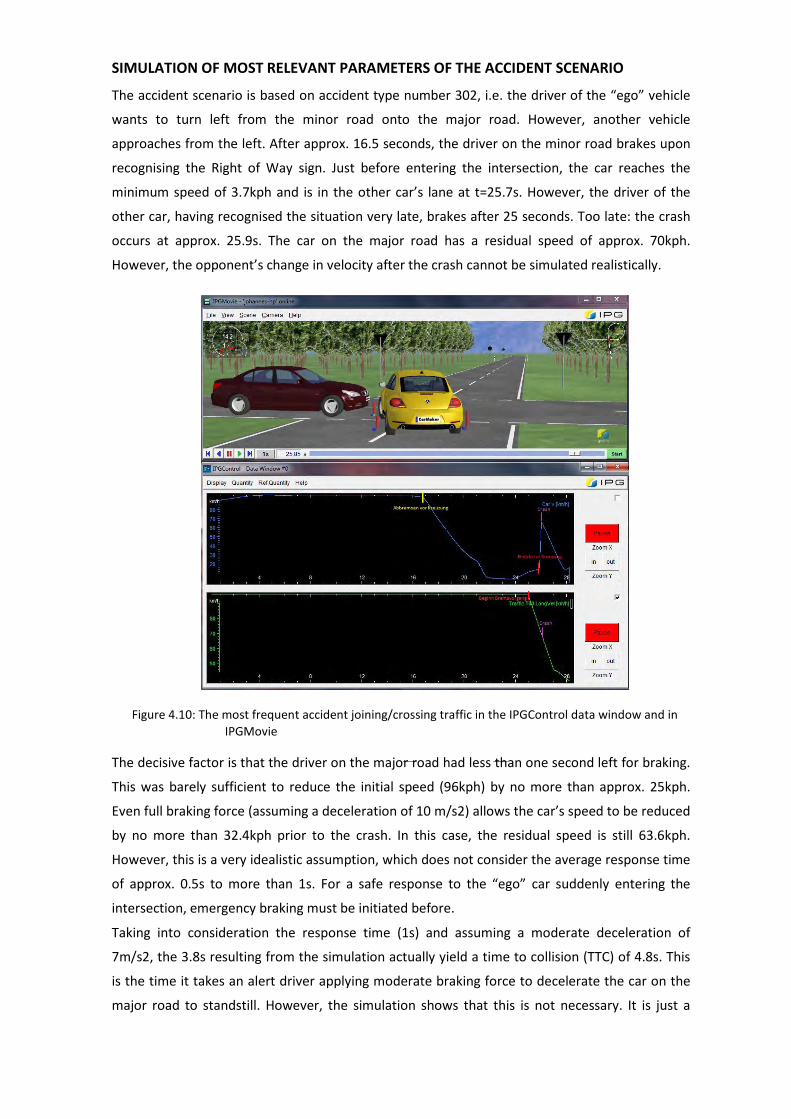
SIMULATION OF MOST RELEVANT PARAMETERS OF THE ACCIDENT SCENARIO
The accident scenario is based on accident type number 302, i.e. the driver of the “ego” vehicle
wants to turn left from the minor road onto the major road. However, another vehicle
approaches from the left. After approx. 16.5 seconds, the driver on the minor road brakes upon
recognising the Right of Way sign. Just before entering the intersection, the car reaches the
minimum speed of 3.7kph and is in the other car’s lane at t=25.7s. However, the driver of the
other car, having recognised the situation very late, brakes after 25 seconds. Too late: the crash
occurs at approx. 25.9s. The car on the major road has a residual speed of approx. 70kph.
However, the opponent’s change in velocity after the crash cannot be simulated realistically.
Figure 4.10: The most frequent accident joining/crossing traffic in the IPGControl data window and in IPGMovie
The decisive factor is that the driver on the major road had less than one second left for braking.
This was barely sufficient to reduce the initial speed (96kph) by no more than approx. 25kph.
Even full braking force (assuming a deceleration of 10 m/s2) allows the car’s speed to be reduced
by no more than 32.4kph prior to the crash. In this case, the residual speed is still 63.6kph.
However, this is a very idealistic assumption, which does not consider the average response time
of approx. 0.5s to more than 1s. For a safe response to the “ego” car suddenly entering the
intersection, emergency braking must be initiated before. Taking into consideration the response time (1s) and assuming a moderate deceleration of
7m/s2, the 3.8s resulting from the simulation actually yield a time to collision (TTC) of 4.8s. This
is the time it takes an alert driver applying moderate braking force to decelerate the car on the
major road to standstill. However, the simulation shows that this is not necessary. It is just a
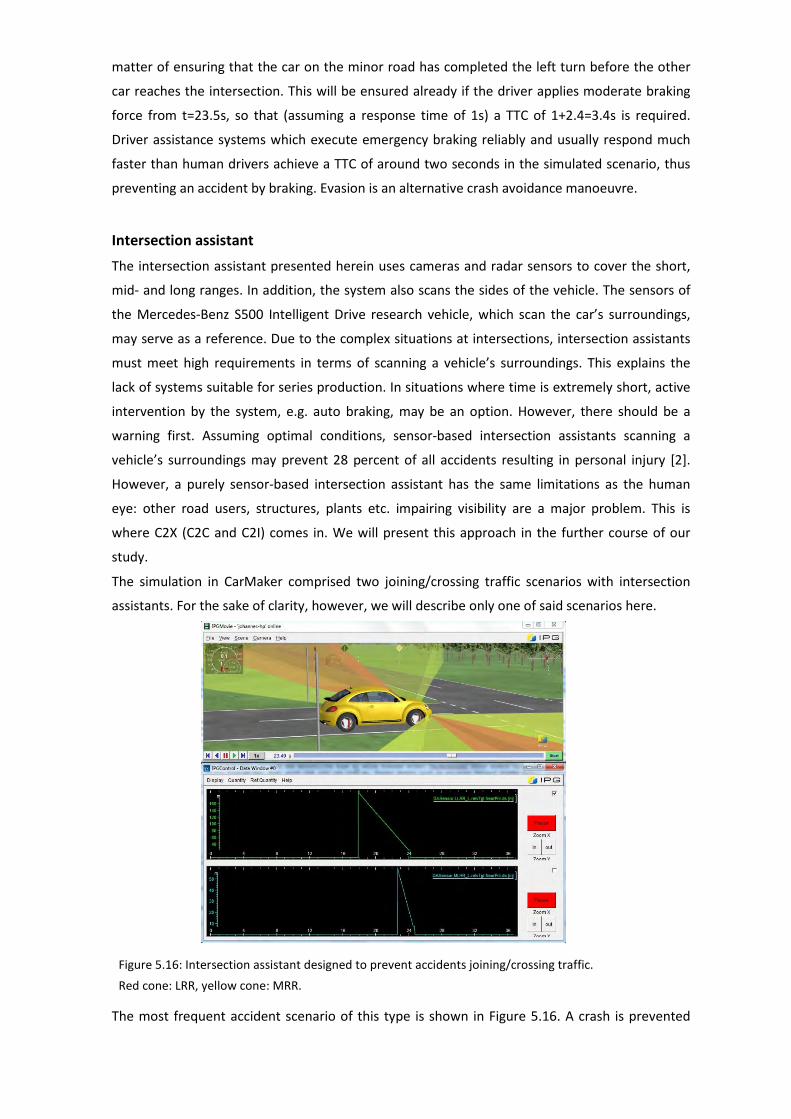
matter of ensuring that the car on the minor road has completed the left turn before the other
car reaches the intersection. This will be ensured already if the driver applies moderate braking
force from t=23.5s, so that (assuming a response time of 1s) a TTC of 1+2.4=3.4s is required.
Driver assistance systems which execute emergency braking reliably and usually respond much
faster than human drivers achieve a TTC of around two seconds in the simulated scenario, thus
preventing an accident by braking. Evasion is an alternative crash avoidance manoeuvre.
Intersection assistant
The intersection assistant presented herein uses cameras and radar sensors to cover the short,
mid- and long ranges. In addition, the system also scans the sides of the vehicle. The sensors of
the Mercedes-Benz S500 Intelligent Drive research vehicle, which scan the car’s surroundings,
may serve as a reference. Due to the complex situations at intersections, intersection assistants
must meet high requirements in terms of scanning a vehicle’s surroundings. This explains the
lack of systems suitable for series production. In situations where time is extremely short, active
intervention by the system, e.g. auto braking, may be an option. However, there should be a
warning first. Assuming optimal conditions, sensor-based intersection assistants scanning a
vehicle’s surroundings may prevent 28 percent of all accidents resulting in personal injury [2].
However, a purely sensor-based intersection assistant has the same limitations as the human
eye: other road users, structures, plants etc. impairing visibility are a major problem. This is
where C2X (C2C and C2I) comes in. We will present this approach in the further course of our
study.
The simulation in CarMaker comprised two joining/crossing traffic scenarios with intersection
assistants. For the sake of clarity, however, we will describe only one of said scenarios here.
Figure 5.16: Intersection assistant designed to prevent accidents joining/crossing traffic. Red cone: LRR, yellow cone: MRR.
The most frequent accident scenario of this type is shown in Figure 5.16. A crash is prevented

because the other car is detected early by the long range radar and the mid-range radar. Even
the detection by the MRR after 22.8 seconds means a remaining TTC of 3.1 seconds, i.e.
sufficient time to prevent the collision (based on the calculations in section 4.4). Plus, the LRR
recognises the other car already after approx. 18 seconds and can alert the driver from that
moment on.
Car-to-car communication
Car-to-car communication, or C2C for short (also abbreviated as V2V), is a very interesting
approach towards increased road safety. The connected car concept was already tested in a
large-scale field experiment called “simTD - Sichere Intelligente Mobilität Deutschland”.
C2C is a warning system relying on sensors to detect critical situations in traffic by scanning the
car’s surroundings. These sensors vary from one vehicle to another. However, to ensure the
system’s safe operation, there should be a standard. In the simTD field experiment, the system
had a range of 580m measured on a straight extra-urban road and urban ranges, even with
buildings in the way, of no less than 100m. TTC and the reliability of data transmission were very
satisfactory in most cases, which means the system is basically ready for the market.
For the CarMaker simulation, the ego vehicle was equipped with the four sensors already used
for the intersection assistant. These sensors scan the surroundings of the car and were used to
cover the vehicle front. However, we did not mark the detection areas with cones in various
colours, not least because the C2C in the scenarios analysed was always the driver assistance
system that first detected the other road user. An exact simulation of its function was not
feasible, however. To indicate our own location by periodic signalling, we flashed the left
reversing light. Even under the pessimistic assumption of a signal range of 200m, the 5.3s
remaining in the joining/crossing traffic scenario when braking extremely late and at only 5 m/s2
are still sufficient to stop the ego vehicle completely before entering the intersection. The other
car would take 5.9s to get there. However, a longer signal range (cf. simTD) and earlier braking of
the ego vehicle are realistic. Due to the long range of C2C, the accidents joining/crossing traffic
considered are easily avoidable even in the case of objects impairing visibility.
FINDINGS AND OUTLOOK One important finding of this study is that a large number of road accidents can be mitigated or
prevented by driver assistance systems. Driver assistance systems also proved to be an
important element in ADAC statistics. We compared the safety potential of each driver
assistance system by an extensive analysis of the existing literature. It also turned out that active
safety offers even much more potential for development and innovation than passive safety. At
the same time, testing becomes more demanding, too, as new systems keep entering the
market, many of them differing in functional details. ADAC will continue to test all driver
assistance systems as realistically as possible so as to be able to provide advice to car buyers.
Therefore, it will be essential to develop and improve test conditions and criteria.
Outlook
Pedestrians and cyclists are rarely involved in the accident scenarios presently analysed, but
frequently appear in the totality of accidents, especially in urban accident scenarios. Subsequent
studies could focus on this aspect and analyse the corresponding scenarios as well as simulate
them in CarMaker. Customer acceptance will play an important role in the success of novel driver
assistance systems. In this connection, surveys and assessments by test subjects are important
tools which are available to ADAC and should keep on being used. An automated test routine
could be written for CarMaker in the form of an easy-to-use graphic user interface or
programme. Should ADAC continue to test driver assistance systems by simulation, CarMaker
could be a useful tool.
With a few exceptions, the test procedures for driver assistance systems are not very far
advanced. Therefore, the suggestions made by this study are no more than that. Rather, they
serve as guidelines for the actual test.
Limitations of the study
Since the IPG CarMaker vehicle dynamics simulation provides no model for damage to the ego
vehicle, it does not allow simulation of the actual crash. Therefore, it is also impossible to assess
the deformation of the bodywork and the severity of the accident victims’ injuries. A dummy was
used, for example, in the VISAPS research project[1], but dummies are not always available. The
present study focuses exclusively on passenger cars, which predominate much more in the ADAC
UFO than in the totality of accidents. Moreover, scenarios involving motorcycles can only be
simulated using MotorcycleMaker. CarMaker5 allows moving pedestrians to be simulated and
detected by the vehicle sensors. Therefore, this version should be used to simulate accidents
involving pedestrians.
LITERATURE
[1] T Brandmeier, Vernetzung und Integration von Sicherheitssystemen der Aktiven und Passiven Sicherheit
(VISAPS und VISAPS2); website, 2012
[2] D Daschner, J Gwehenberger, S Schwarz, G Wermuth; M Schönfelder, F Hofmann, Unfallstruktur- und
Wirkpotenzialanalysen zu den AKTIV-Applikationen auf der Basis von PKW- Haftpflichtschäden mit
Personenschaden / AZT Automotive GmbH; Forschungsbericht 2010
[3] Federal Statistical Office: German road accident statistics. Website, 2015.
ZahlenFakten/Wirtschaftsbereiche/TransportVerkehr/Verkehrsunfaelle/ Verkehrsunfaelle.html#Tabellen
[4] Institut für Straßenverkehr Köln; ISK, Unfalltypenkatalog, 2010
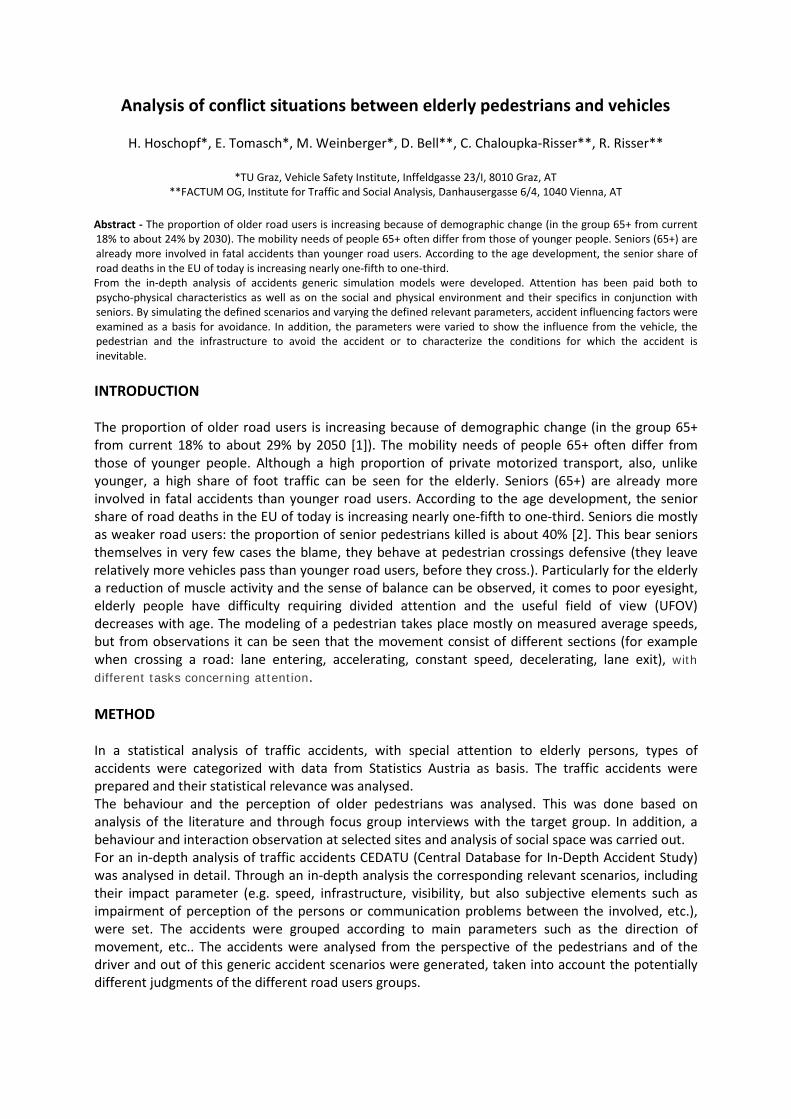
Analysis of conflict situations between elderly pedestrians and vehicles
H. Hoschopf*, E. Tomasch*, M. Weinberger*, D. Bell**, C. Chaloupka-Risser**, R. Risser**
*TU Graz, Vehicle Safety Institute, Inffeldgasse 23/I, 8010 Graz, AT **FACTUM OG, Institute for Traffic and Social Analysis, Danhausergasse 6/4, 1040 Vienna, AT
Abstract - The proportion of older road users is increasing because of demographic change (in the group 65+ from current 18% to about 24% by 2030). The mobility needs of people 65+ often differ from those of younger people. Seniors (65+) are already more involved in fatal accidents than younger road users. According to the age development, the senior share of road deaths in the EU of today is increasing nearly one-fifth to one-third. From the in-depth analysis of accidents generic simulation models were developed. Attention has been paid both to psycho-physical characteristics as well as on the social and physical environment and their specifics in conjunction with seniors. By simulating the defined scenarios and varying the defined relevant parameters, accident influencing factors were examined as a basis for avoidance. In addition, the parameters were varied to show the influence from the vehicle, the pedestrian and the infrastructure to avoid the accident or to characterize the conditions for which the accident is inevitable. INTRODUCTION The proportion of older road users is increasing because of demographic change (in the group 65+ from current 18% to about 29% by 2050 [1]). The mobility needs of people 65+ often differ from those of younger people. Although a high proportion of private motorized transport, also, unlike younger, a high share of foot traffic can be seen for the elderly. Seniors (65+) are already more involved in fatal accidents than younger road users. According to the age development, the senior share of road deaths in the EU of today is increasing nearly one-fifth to one-third. Seniors die mostly as weaker road users: the proportion of senior pedestrians killed is about 40% [2]. This bear seniors themselves in very few cases the blame, they behave at pedestrian crossings defensive (they leave relatively more vehicles pass than younger road users, before they cross.). Particularly for the elderly a reduction of muscle activity and the sense of balance can be observed, it comes to poor eyesight, elderly people have difficulty requiring divided attention and the useful field of view (UFOV) decreases with age. The modeling of a pedestrian takes place mostly on measured average speeds, but from observations it can be seen that the movement consist of different sections (for example when crossing a road: lane entering, accelerating, constant speed, decelerating, lane exit), with different tasks concerning attention. METHOD In a statistical analysis of traffic accidents, with special attention to elderly persons, types of accidents were categorized with data from Statistics Austria as basis. The traffic accidents were prepared and their statistical relevance was analysed. The behaviour and the perception of older pedestrians was analysed. This was done based on analysis of the literature and through focus group interviews with the target group. In addition, a behaviour and interaction observation at selected sites and analysis of social space was carried out. For an in-depth analysis of traffic accidents CEDATU (Central Database for In-Depth Accident Study) was analysed in detail. Through an in-depth analysis the corresponding relevant scenarios, including their impact parameter (e.g. speed, infrastructure, visibility, but also subjective elements such as impairment of perception of the persons or communication problems between the involved, etc.), were set. The accidents were grouped according to main parameters such as the direction of movement, etc.. The accidents were analysed from the perspective of the pedestrians and of the driver and out of this generic accident scenarios were generated, taken into account the potentially different judgments of the different road users groups.
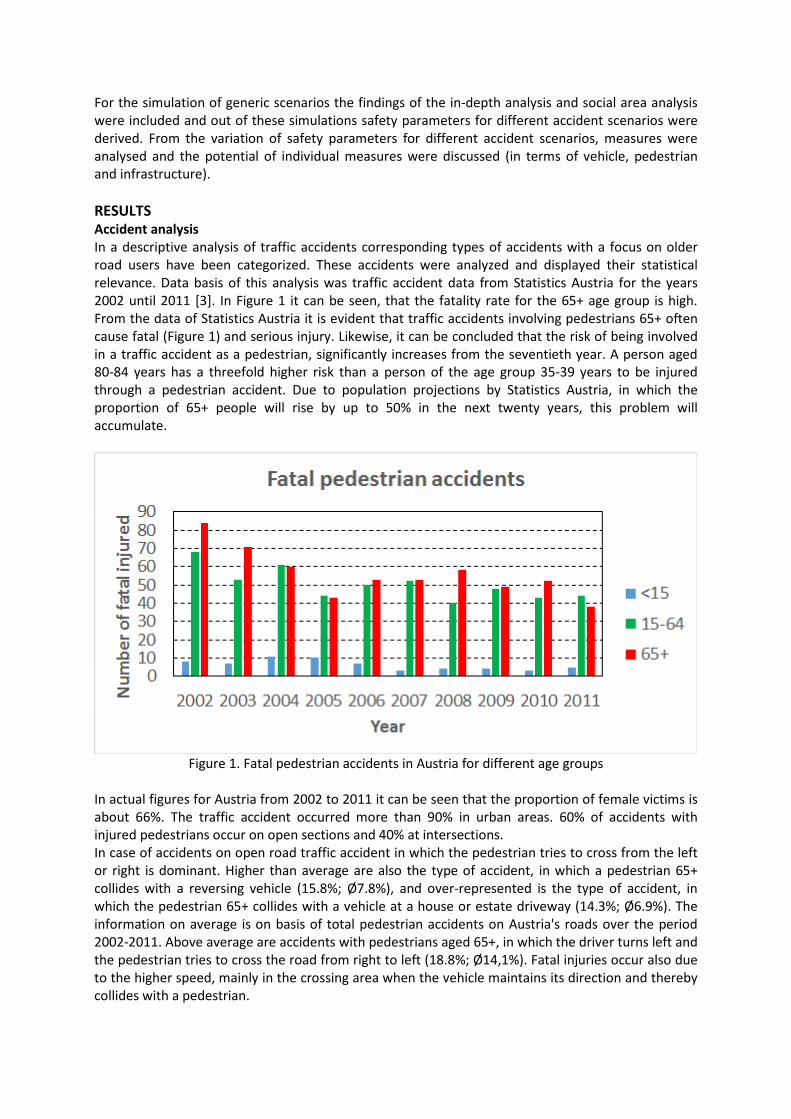
For the simulation of generic scenarios the findings of the in-depth analysis and social area analysis were included and out of these simulations safety parameters for different accident scenarios were derived. From the variation of safety parameters for different accident scenarios, measures were analysed and the potential of individual measures were discussed (in terms of vehicle, pedestrian and infrastructure). RESULTS Accident analysis In a descriptive analysis of traffic accidents corresponding types of accidents with a focus on older road users have been categorized. These accidents were analyzed and displayed their statistical relevance. Data basis of this analysis was traffic accident data from Statistics Austria for the years 2002 until 2011 [3]. In Figure 1 it can be seen, that the fatality rate for the 65+ age group is high. From the data of Statistics Austria it is evident that traffic accidents involving pedestrians 65+ often cause fatal (Figure 1) and serious injury. Likewise, it can be concluded that the risk of being involved in a traffic accident as a pedestrian, significantly increases from the seventieth year. A person aged 80-84 years has a threefold higher risk than a person of the age group 35-39 years to be injured through a pedestrian accident. Due to population projections by Statistics Austria, in which the proportion of 65+ people will rise by up to 50% in the next twenty years, this problem will accumulate.
Figure 1. Fatal pedestrian accidents in Austria for different age groups
In actual figures for Austria from 2002 to 2011 it can be seen that the proportion of female victims is about 66%. The traffic accident occurred more than 90% in urban areas. 60% of accidents with injured pedestrians occur on open sections and 40% at intersections. In case of accidents on open road traffic accident in which the pedestrian tries to cross from the left or right is dominant. Higher than average are also the type of accident, in which a pedestrian 65+ collides with a reversing vehicle (15.8%; Ø7.8%), and over-represented is the type of accident, in which the pedestrian 65+ collides with a vehicle at a house or estate driveway (14.3%; Ø6.9%). The information on average is on basis of total pedestrian accidents on Austria's roads over the period 2002-2011. Above average are accidents with pedestrians aged 65+, in which the driver turns left and the pedestrian tries to cross the road from right to left (18.8%; Ø14,1%). Fatal injuries occur also due to the higher speed, mainly in the crossing area when the vehicle maintains its direction and thereby collides with a pedestrian.
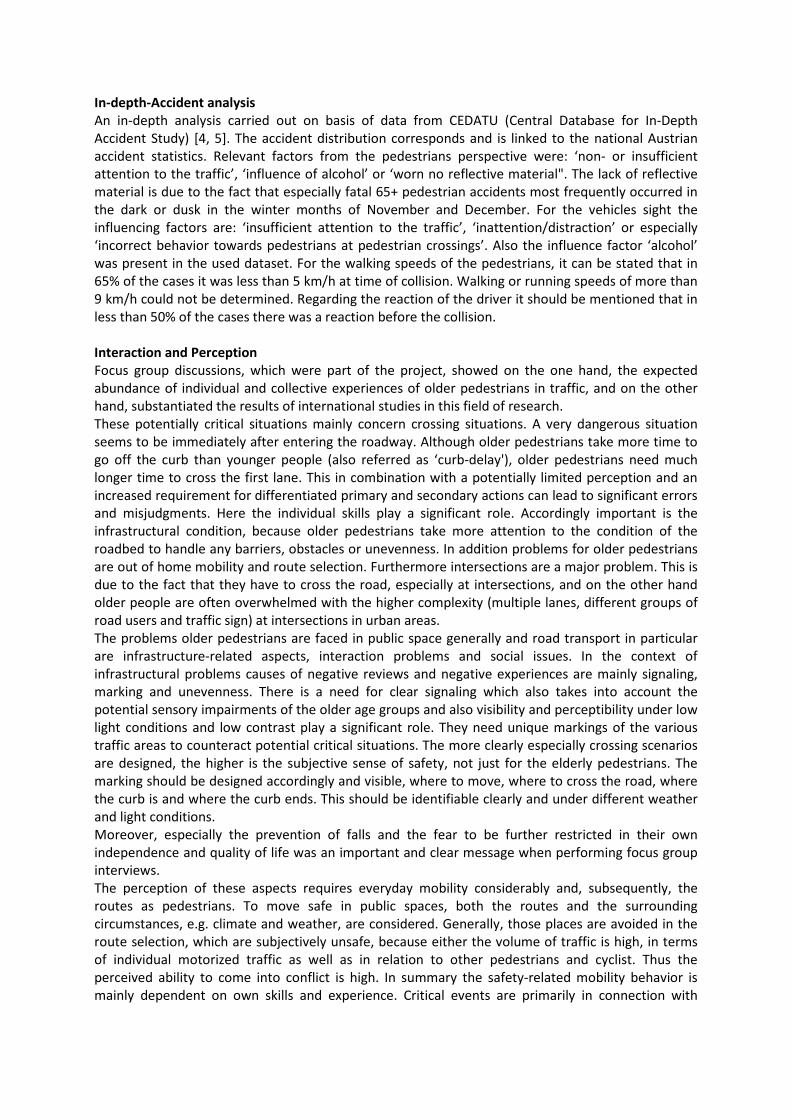
In-depth-Accident analysis An in-depth analysis carried out on basis of data from CEDATU (Central Database for In-Depth Accident Study) [4, 5]. The accident distribution corresponds and is linked to the national Austrian accident statistics. Relevant factors from the pedestrians perspective were: ‘non- or insufficient attention to the traffic’, ‘influence of alcohol’ or ‘worn no reflective material". The lack of reflective material is due to the fact that especially fatal 65+ pedestrian accidents most frequently occurred in the dark or dusk in the winter months of November and December. For the vehicles sight the influencing factors are: ‘insufficient attention to the traffic’, ‘inattention/distraction’ or especially ‘incorrect behavior towards pedestrians at pedestrian crossings’. Also the influence factor ‘alcohol’ was present in the used dataset. For the walking speeds of the pedestrians, it can be stated that in 65% of the cases it was less than 5 km/h at time of collision. Walking or running speeds of more than 9 km/h could not be determined. Regarding the reaction of the driver it should be mentioned that in less than 50% of the cases there was a reaction before the collision. Interaction and Perception Focus group discussions, which were part of the project, showed on the one hand, the expected abundance of individual and collective experiences of older pedestrians in traffic, and on the other hand, substantiated the results of international studies in this field of research. These potentially critical situations mainly concern crossing situations. A very dangerous situation seems to be immediately after entering the roadway. Although older pedestrians take more time to go off the curb than younger people (also referred as ‘curb-delay'), older pedestrians need much longer time to cross the first lane. This in combination with a potentially limited perception and an increased requirement for differentiated primary and secondary actions can lead to significant errors and misjudgments. Here the individual skills play a significant role. Accordingly important is the infrastructural condition, because older pedestrians take more attention to the condition of the roadbed to handle any barriers, obstacles or unevenness. In addition problems for older pedestrians are out of home mobility and route selection. Furthermore intersections are a major problem. This is due to the fact that they have to cross the road, especially at intersections, and on the other hand older people are often overwhelmed with the higher complexity (multiple lanes, different groups of road users and traffic sign) at intersections in urban areas. The problems older pedestrians are faced in public space generally and road transport in particular are infrastructure-related aspects, interaction problems and social issues. In the context of infrastructural problems causes of negative reviews and negative experiences are mainly signaling, marking and unevenness. There is a need for clear signaling which also takes into account the potential sensory impairments of the older age groups and also visibility and perceptibility under low light conditions and low contrast play a significant role. They need unique markings of the various traffic areas to counteract potential critical situations. The more clearly especially crossing scenarios are designed, the higher is the subjective sense of safety, not just for the elderly pedestrians. The marking should be designed accordingly and visible, where to move, where to cross the road, where the curb is and where the curb ends. This should be identifiable clearly and under different weather and light conditions. Moreover, especially the prevention of falls and the fear to be further restricted in their own independence and quality of life was an important and clear message when performing focus group interviews. The perception of these aspects requires everyday mobility considerably and, subsequently, the routes as pedestrians. To move safe in public spaces, both the routes and the surrounding circumstances, e.g. climate and weather, are considered. Generally, those places are avoided in the route selection, which are subjectively unsafe, because either the volume of traffic is high, in terms of individual motorized traffic as well as in relation to other pedestrians and cyclist. Thus the perceived ability to come into conflict is high. In summary the safety-related mobility behavior is mainly dependent on own skills and experience. Critical events are primarily in connection with

prevention and compensation of falls. The infrastructure and the behavior of other pedestrians affect behavior and perception of older road users more than safety considerations.
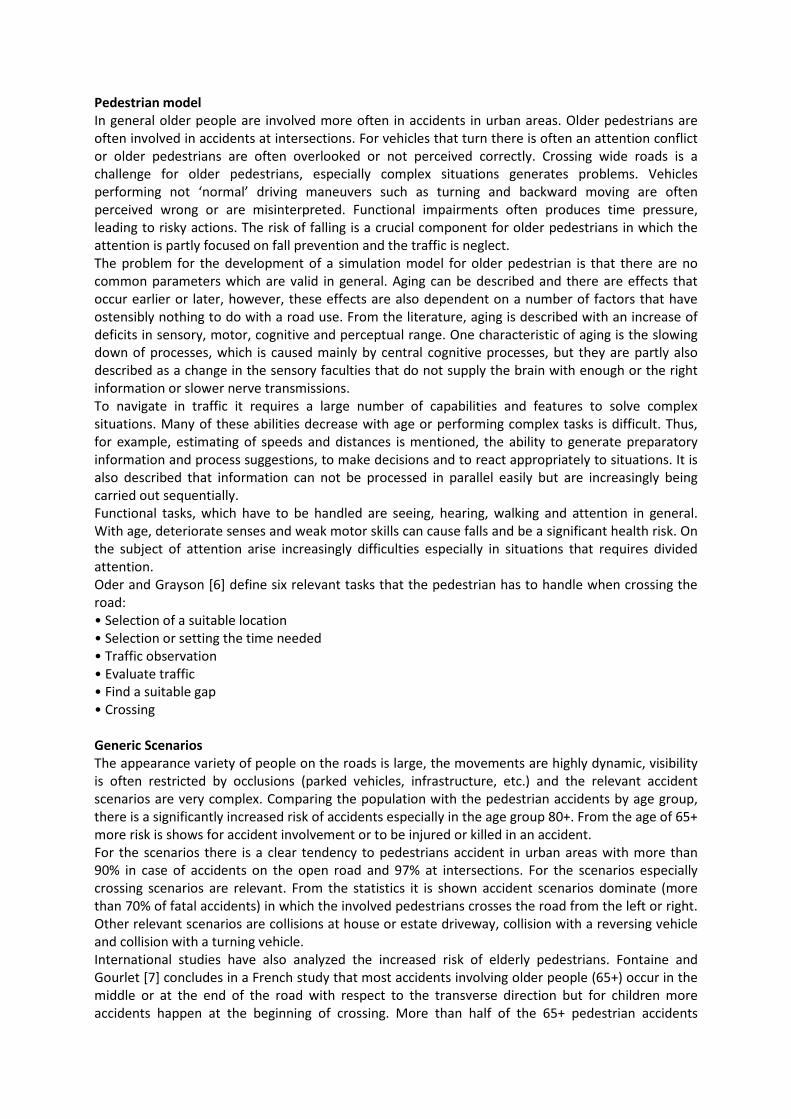
Pedestrian model In general older people are involved more often in accidents in urban areas. Older pedestrians are often involved in accidents at intersections. For vehicles that turn there is often an attention conflict or older pedestrians are often overlooked or not perceived correctly. Crossing wide roads is a challenge for older pedestrians, especially complex situations generates problems. Vehicles performing not ‘normal’ driving maneuvers such as turning and backward moving are often perceived wrong or are misinterpreted. Functional impairments often produces time pressure, leading to risky actions. The risk of falling is a crucial component for older pedestrians in which the attention is partly focused on fall prevention and the traffic is neglect. The problem for the development of a simulation model for older pedestrian is that there are no common parameters which are valid in general. Aging can be described and there are effects that occur earlier or later, however, these effects are also dependent on a number of factors that have ostensibly nothing to do with a road use. From the literature, aging is described with an increase of deficits in sensory, motor, cognitive and perceptual range. One characteristic of aging is the slowing down of processes, which is caused mainly by central cognitive processes, but they are partly also described as a change in the sensory faculties that do not supply the brain with enough or the right information or slower nerve transmissions. To navigate in traffic it requires a large number of capabilities and features to solve complex situations. Many of these abilities decrease with age or performing complex tasks is difficult. Thus, for example, estimating of speeds and distances is mentioned, the ability to generate preparatory information and process suggestions, to make decisions and to react appropriately to situations. It is also described that information can not be processed in parallel easily but are increasingly being carried out sequentially. Functional tasks, which have to be handled are seeing, hearing, walking and attention in general. With age, deteriorate senses and weak motor skills can cause falls and be a significant health risk. On the subject of attention arise increasingly difficulties especially in situations that requires divided attention. Oder and Grayson [6] define six relevant tasks that the pedestrian has to handle when crossing the road: • Selection of a suitable location • Selection or setting the time needed • Traffic observation • Evaluate traffic • Find a suitable gap • Crossing Generic Scenarios The appearance variety of people on the roads is large, the movements are highly dynamic, visibility is often restricted by occlusions (parked vehicles, infrastructure, etc.) and the relevant accident scenarios are very complex. Comparing the population with the pedestrian accidents by age group, there is a significantly increased risk of accidents especially in the age group 80+. From the age of 65+ more risk is shows for accident involvement or to be injured or killed in an accident. For the scenarios there is a clear tendency to pedestrians accident in urban areas with more than 90% in case of accidents on the open road and 97% at intersections. For the scenarios especially crossing scenarios are relevant. From the statistics it is shown accident scenarios dominate (more than 70% of fatal accidents) in which the involved pedestrians crosses the road from the left or right. Other relevant scenarios are collisions at house or estate driveway, collision with a reversing vehicle and collision with a turning vehicle. International studies have also analyzed the increased risk of elderly pedestrians. Fontaine and Gourlet [7] concludes in a French study that most accidents involving older people (65+) occur in the middle or at the end of the road with respect to the transverse direction but for children more accidents happen at the beginning of crossing. More than half of the 65+ pedestrian accidents
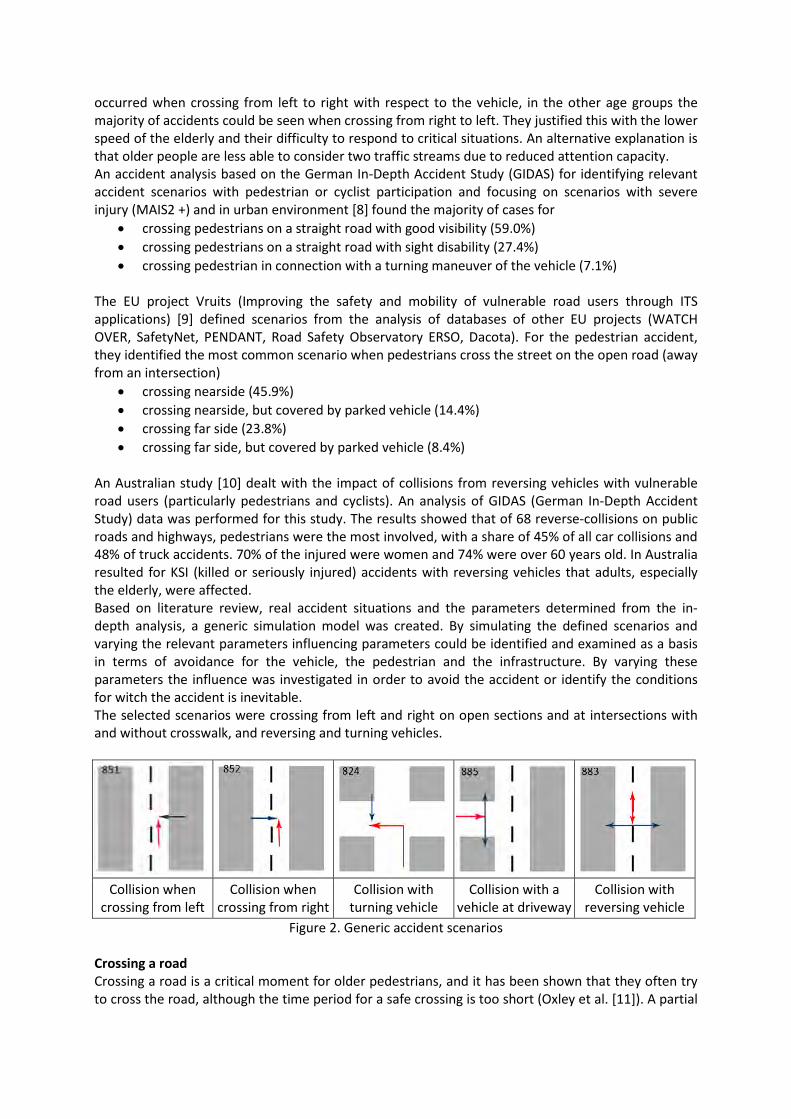
occurred when crossing from left to right with respect to the vehicle, in the other age groups the majority of accidents could be seen when crossing from right to left. They justified this with the lower speed of the elderly and their difficulty to respond to critical situations. An alternative explanation is that older people are less able to consider two traffic streams due to reduced attention capacity. An accident analysis based on the German In-Depth Accident Study (GIDAS) for identifying relevant accident scenarios with pedestrian or cyclist participation and focusing on scenarios with severe injury (MAIS2 +) and in urban environment [8] found the majority of cases for
• crossing pedestrians on a straight road with good visibility (59.0%) • crossing pedestrians on a straight road with sight disability (27.4%) • crossing pedestrian in connection with a turning maneuver of the vehicle (7.1%)
The EU project Vruits (Improving the safety and mobility of vulnerable road users through ITS applications) [9] defined scenarios from the analysis of databases of other EU projects (WATCH OVER, SafetyNet, PENDANT, Road Safety Observatory ERSO, Dacota). For the pedestrian accident, they identified the most common scenario when pedestrians cross the street on the open road (away from an intersection)
• crossing nearside (45.9%) • crossing nearside, but covered by parked vehicle (14.4%) • crossing far side (23.8%) • crossing far side, but covered by parked vehicle (8.4%)
An Australian study [10] dealt with the impact of collisions from reversing vehicles with vulnerable road users (particularly pedestrians and cyclists). An analysis of GIDAS (German In-Depth Accident Study) data was performed for this study. The results showed that of 68 reverse-collisions on public roads and highways, pedestrians were the most involved, with a share of 45% of all car collisions and 48% of truck accidents. 70% of the injured were women and 74% were over 60 years old. In Australia resulted for KSI (killed or seriously injured) accidents with reversing vehicles that adults, especially the elderly, were affected. Based on literature review, real accident situations and the parameters determined from the in-depth analysis, a generic simulation model was created. By simulating the defined scenarios and varying the relevant parameters influencing parameters could be identified and examined as a basis in terms of avoidance for the vehicle, the pedestrian and the infrastructure. By varying these parameters the influence was investigated in order to avoid the accident or identify the conditions for witch the accident is inevitable. The selected scenarios were crossing from left and right on open sections and at intersections with and without crosswalk, and reversing and turning vehicles.
Collision when
crossing from left Collision when
crossing from right Collision with
turning vehicle Collision with a
vehicle at driveway Collision with
reversing vehicle Figure 2. Generic accident scenarios
Crossing a road Crossing a road is a critical moment for older pedestrians, and it has been shown that they often try to cross the road, although the time period for a safe crossing is too short (Oxley et al. [11]). A partial
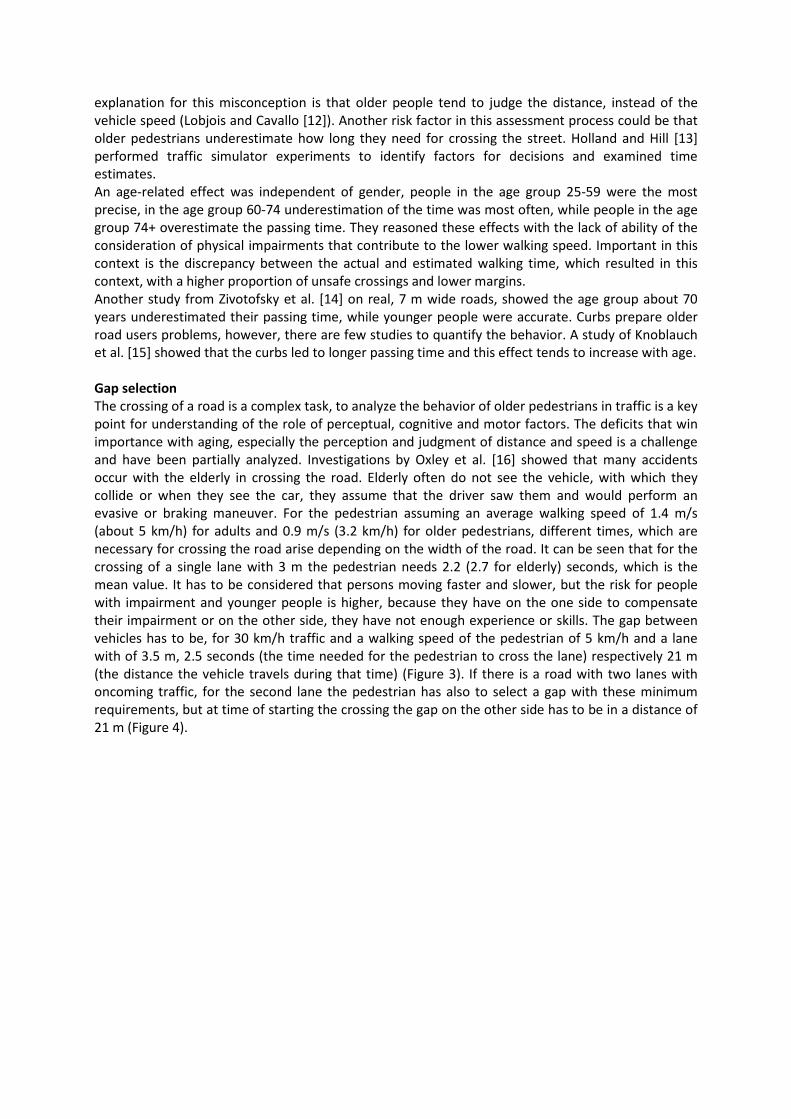
explanation for this misconception is that older people tend to judge the distance, instead of the vehicle speed (Lobjois and Cavallo [12]). Another risk factor in this assessment process could be that older pedestrians underestimate how long they need for crossing the street. Holland and Hill [13] performed traffic simulator experiments to identify factors for decisions and examined time estimates. An age-related effect was independent of gender, people in the age group 25-59 were the most precise, in the age group 60-74 underestimation of the time was most often, while people in the age group 74+ overestimate the passing time. They reasoned these effects with the lack of ability of the consideration of physical impairments that contribute to the lower walking speed. Important in this context is the discrepancy between the actual and estimated walking time, which resulted in this context, with a higher proportion of unsafe crossings and lower margins. Another study from Zivotofsky et al. [14] on real, 7 m wide roads, showed the age group about 70 years underestimated their passing time, while younger people were accurate. Curbs prepare older road users problems, however, there are few studies to quantify the behavior. A study of Knoblauch et al. [15] showed that the curbs led to longer passing time and this effect tends to increase with age. Gap selection The crossing of a road is a complex task, to analyze the behavior of older pedestrians in traffic is a key point for understanding of the role of perceptual, cognitive and motor factors. The deficits that win importance with aging, especially the perception and judgment of distance and speed is a challenge and have been partially analyzed. Investigations by Oxley et al. [16] showed that many accidents occur with the elderly in crossing the road. Elderly often do not see the vehicle, with which they collide or when they see the car, they assume that the driver saw them and would perform an evasive or braking maneuver. For the pedestrian assuming an average walking speed of 1.4 m/s (about 5 km/h) for adults and 0.9 m/s (3.2 km/h) for older pedestrians, different times, which are necessary for crossing the road arise depending on the width of the road. It can be seen that for the crossing of a single lane with 3 m the pedestrian needs 2.2 (2.7 for elderly) seconds, which is the mean value. It has to be considered that persons moving faster and slower, but the risk for people with impairment and younger people is higher, because they have on the one side to compensate their impairment or on the other side, they have not enough experience or skills. The gap between vehicles has to be, for 30 km/h traffic and a walking speed of the pedestrian of 5 km/h and a lane with of 3.5 m, 2.5 seconds (the time needed for the pedestrian to cross the lane) respectively 21 m (the distance the vehicle travels during that time) (Figure 3). If there is a road with two lanes with oncoming traffic, for the second lane the pedestrian has also to select a gap with these minimum requirements, but at time of starting the crossing the gap on the other side has to be in a distance of 21 m (Figure 4).
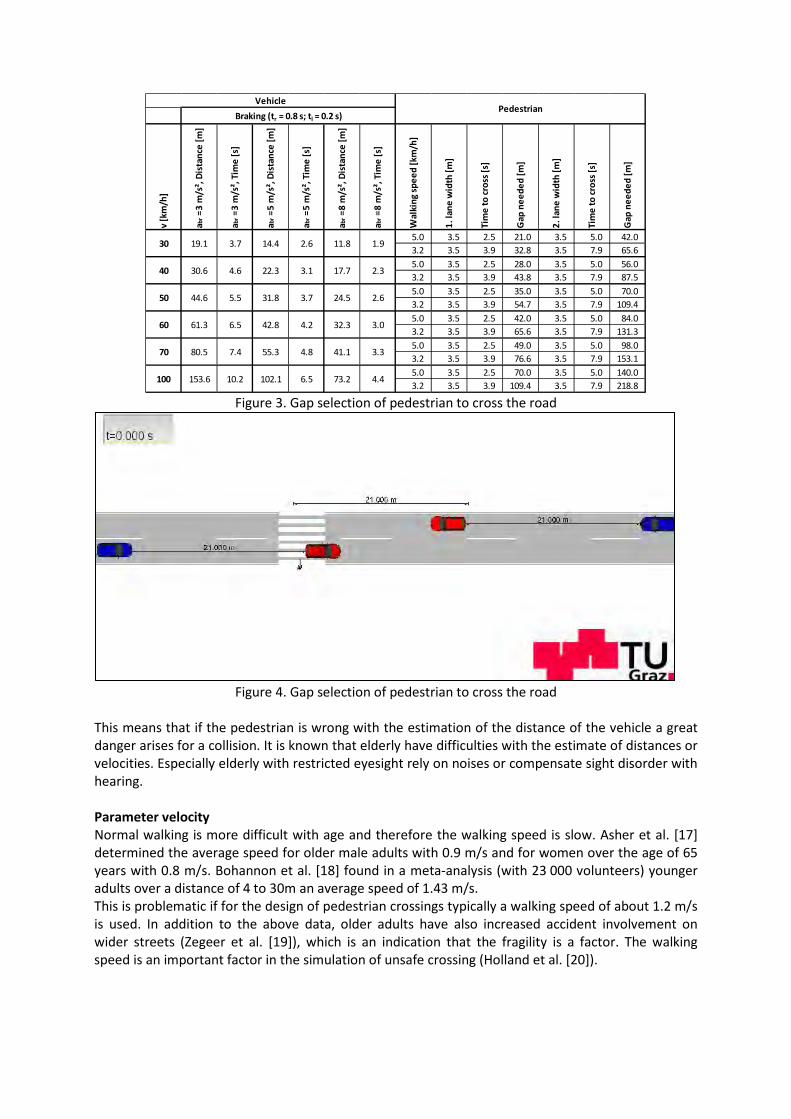
Figure 3. Gap selection of pedestrian to cross the road
Figure 4. Gap selection of pedestrian to cross the road
This means that if the pedestrian is wrong with the estimation of the distance of the vehicle a great danger arises for a collision. It is known that elderly have difficulties with the estimate of distances or velocities. Especially elderly with restricted eyesight rely on noises or compensate sight disorder with hearing. Parameter velocity Normal walking is more difficult with age and therefore the walking speed is slow. Asher et al. [17] determined the average speed for older male adults with 0.9 m/s and for women over the age of 65 years with 0.8 m/s. Bohannon et al. [18] found in a meta-analysis (with 23 000 volunteers) younger adults over a distance of 4 to 30m an average speed of 1.43 m/s. This is problematic if for the design of pedestrian crossings typically a walking speed of about 1.2 m/s is used. In addition to the above data, older adults have also increased accident involvement on wider streets (Zegeer et al. [19]), which is an indication that the fragility is a factor. The walking speed is an important factor in the simulation of unsafe crossing (Holland et al. [20]).
v [k
m/h
]
abr =
3 m
/s²,
Dist
ance
[m]
abr =
3 m
/s²,
Tim
e [s
]
abr =
5 m
/s²,
Dist
ance
[m]
abr =
5 m
/s²,
Tim
e [s
]
abr =
8 m
/s²,
Dist
ance
[m]
a br =
8 m
/s²,
Tim
e [s
]
Wal
king
spee
d [k
m/h
]
1. la
ne w
idth
[m]
Tim
e to
cros
s [s]
Gap
nee
ded
[m]
2. la
ne w
idth
[m]
Tim
e to
cros
s [s]
Gap
nee
ded
[m]
5.0 3.5 2.5 21.0 3.5 5.0 42.03.2 3.5 3.9 32.8 3.5 7.9 65.65.0 3.5 2.5 28.0 3.5 5.0 56.03.2 3.5 3.9 43.8 3.5 7.9 87.55.0 3.5 2.5 35.0 3.5 5.0 70.03.2 3.5 3.9 54.7 3.5 7.9 109.45.0 3.5 2.5 42.0 3.5 5.0 84.03.2 3.5 3.9 65.6 3.5 7.9 131.35.0 3.5 2.5 49.0 3.5 5.0 98.03.2 3.5 3.9 76.6 3.5 7.9 153.15.0 3.5 2.5 70.0 3.5 5.0 140.03.2 3.5 3.9 109.4 3.5 7.9 218.8
Pedestrian
17.7
24.5
32.3
41.1
73.2
2.3
2.6
3.0
3.3
4.4
42.8
55.3
102.1
3.1
3.7
4.2
4.8
6.5153.6 10.2
7.4
6.5
5.5
4.6
70
100
19.1 3.7 14.4 2.6
30.6
44.6
61.3
80.5
Braking (tr = 0.8 s; tl = 0.2 s)Vehicle
30
40
50
60
11.8 1.9
22.3
31.8
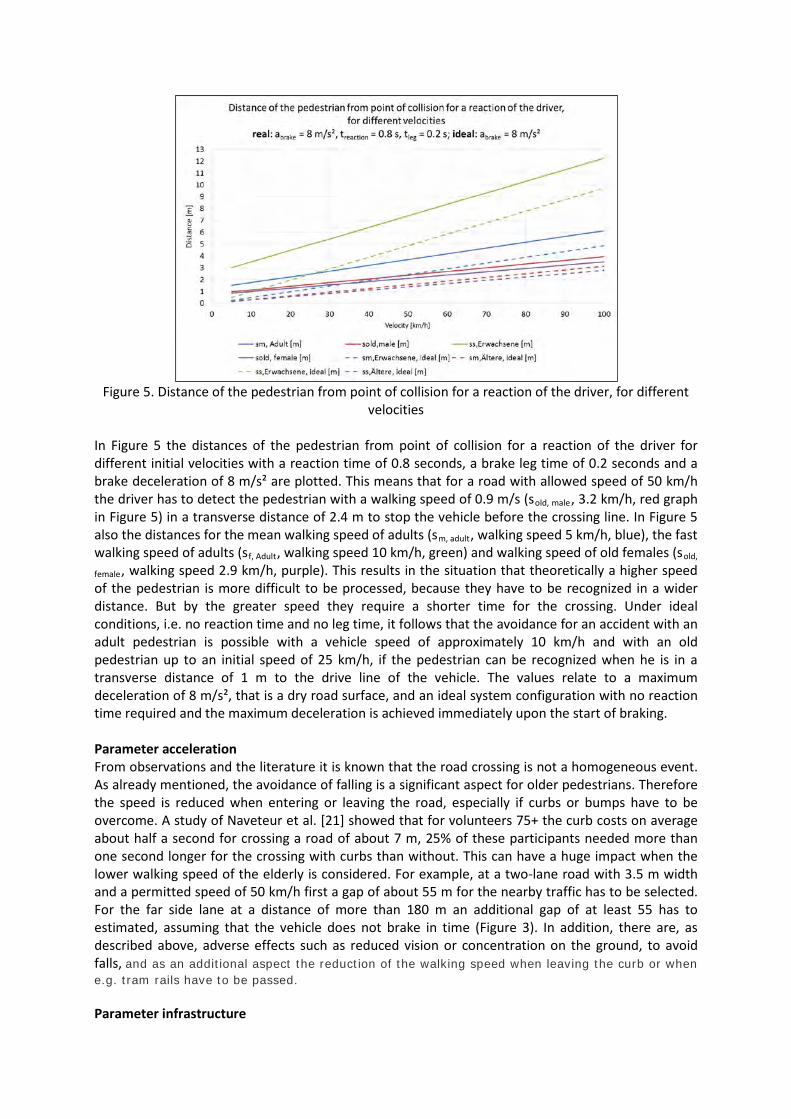
Figure 5. Distance of the pedestrian from point of collision for a reaction of the driver, for different
velocities In Figure 5 the distances of the pedestrian from point of collision for a reaction of the driver for different initial velocities with a reaction time of 0.8 seconds, a brake leg time of 0.2 seconds and a brake deceleration of 8 m/s² are plotted. This means that for a road with allowed speed of 50 km/h the driver has to detect the pedestrian with a walking speed of 0.9 m/s (sold, male, 3.2 km/h, red graph in Figure 5) in a transverse distance of 2.4 m to stop the vehicle before the crossing line. In Figure 5 also the distances for the mean walking speed of adults (sm, adult, walking speed 5 km/h, blue), the fast walking speed of adults (sf, Adult, walking speed 10 km/h, green) and walking speed of old females (sold,
female, walking speed 2.9 km/h, purple). This results in the situation that theoretically a higher speed of the pedestrian is more difficult to be processed, because they have to be recognized in a wider distance. But by the greater speed they require a shorter time for the crossing. Under ideal conditions, i.e. no reaction time and no leg time, it follows that the avoidance for an accident with an adult pedestrian is possible with a vehicle speed of approximately 10 km/h and with an old pedestrian up to an initial speed of 25 km/h, if the pedestrian can be recognized when he is in a transverse distance of 1 m to the drive line of the vehicle. The values relate to a maximum deceleration of 8 m/s², that is a dry road surface, and an ideal system configuration with no reaction time required and the maximum deceleration is achieved immediately upon the start of braking. Parameter acceleration From observations and the literature it is known that the road crossing is not a homogeneous event. As already mentioned, the avoidance of falling is a significant aspect for older pedestrians. Therefore the speed is reduced when entering or leaving the road, especially if curbs or bumps have to be overcome. A study of Naveteur et al. [21] showed that for volunteers 75+ the curb costs on average about half a second for crossing a road of about 7 m, 25% of these participants needed more than one second longer for the crossing with curbs than without. This can have a huge impact when the lower walking speed of the elderly is considered. For example, at a two-lane road with 3.5 m width and a permitted speed of 50 km/h first a gap of about 55 m for the nearby traffic has to be selected. For the far side lane at a distance of more than 180 m an additional gap of at least 55 has to estimated, assuming that the vehicle does not brake in time (Figure 3). In addition, there are, as described above, adverse effects such as reduced vision or concentration on the ground, to avoid falls, and as an additional aspect the reduction of the walking speed when leaving the curb or when e.g. tram rails have to be passed. Parameter infrastructure
As already known from the accident analysis, many accidents occur in situations where the driver has no clear view of the pedestrian because they are covered e.g. by parked vehicles, trees, etc.. The main influencing factors are road design, geometry of crossing, crossing opportunities, lightning, signals, marking, weather, public transport (e.g. stopping place) and town planning. There are a number of possible actions with positive effects, such as spatial separation by underpasses and overpasses. Design of the stops of public transport, appropriate design of the area for the pedestrian, e.g. guide through structural measures, relocation of stops to avoid coverage, lighting, etc.. At locations where pedestrian have to cross multilane roads with high speeds and heavy traffic, the following countermeasures may be effective to reduce the frequency and severity of pedestrian accidents
• create crossings possibilities • lead pedestrian so that they cross at corresponding locations • design of the entrances from the sidewalk, e.g. curb ramps, which are on the one hand
facilitate the crossing of the road and are perceived easier for visually impaired pedestrians by tactile design. They should be performed perpendicular to the road and guide the pedestrian (e.g. colors and architecture design) and enable the access the for disabled people.
• lighting of the corridor • traffic calming measures such as speed limits, narrowing lane, etc.
Multi-lane roads with increased traffic are a problem especially for older pedestrians. Traffic islands act as pedestrian refuges, providing an opportunity to pause, during the crossing of several lanes. This also allows the finding of suitable gaps in order to cross the road safely. They should be of sufficient width and length corresponding to offer pedestrians movement ability and time to be able to safely wait until they find a suitable gap for crossing. Sidewalk encourage not only to walk, but also improve significantly the safety of pedestrians. On roads without sidewalks pedestrians are forced to walk along the edge of the road, which increases the risk of accidents. Parameter vehicle and driver There are many influencing factors related to the vehicle and the driver, which often are decisive for an accident but are also often occur in combination with other factors and lead to an accident. An influence have the vehicle fleet such as the proportion of large vehicles, the speed, the vehicle design as well as electric vehicles by the reduced noise. An important factor is the driver, with the parameters skills, education, experience, distraction, unsafe driving, speed selecting, alcohol and drugs. The vehicle technology has an influence, especially the increasing proportion of active systems, and it can be expected that they partially improve the situation. CONCLUSION An important step in pedestrian planning is to identify critical sites and prioritize them. A systematic approach is necessary to find out what (and where) countermeasures should be taken. Factors such as speed, friction and the available space will be used as criteria for the quality of motorized traffic. These factors, however, are not the primary factors for pedestrians, but much more comfort, mobility and safety. The question of the responsibility of the driver is not always clear. The basic premise is that the driver performs his duty of care towards pedestrians. But also the pedestrians have to comply with the care for their own safety and the safety of others. Therefore also awareness campaigns on pedestrian safety and relevant laws, training and education of the drivers and the pedestrian are components for improving safety. ACKNOWLEDGEMENTS
The authors would like to thank the Federal Ministry for Transport, Innovation and Technology (bmvit) for funding this study under the umbrella of the Austrian Road Safety Fund (VSF). (4rd call, project ATTENTION) REFERENCES Published book - author, title, location, publisher, year 1. bmask; Fact Sheet, Daten & Fakten zur demographischen Entwicklung, Vienna, Austria, Bundesministerium für Arbeit,
Soziales und Konsumentenschutz, 2012 2. ERSO, European Road Safety Observatory; Traffic Safety Basic Facts 2012, The Elderly (Aged >64); European Road Safety
Observatory; 2013 3. Statistik Austria; Straßenverkehrsunfälle, Straßenverkehrsunfälle mit Personenschaden 2002-2011, Statistik Austria,
Wien, 2003-2012. 4. Tomasch E., Steffan H.; ZEDATU - Zentrale Datenbank tödlicher Unfälle in Österreich - A Central Database of Fatalities in
Austria. In: ESAR (Hg.): 2nd Expert Symposium Accident Research (ESAR). Hanover, Germany, 2006 5. Tomasch E., Steffan H., Darok M.; Retrospective accident investigation using information from court. In: TRA (Hg.):
Transport Research Arena Europe 2008 (TRA). Ljubljana, April 21-24 2008 6. Older S.J., Grayson G.B.; Perception and Decision in the Pedestrian Task (Report 49 UC). Crowthorne, Berkshire:
Transport and Road Research Laboratory; 1974 7. Fontaine H., Gourlet Y.; Fatal Pedestrian Accidents in France: A Typological Analysis; Accident Analysis and Prevention,
Vol. 29, No. 3, pp. 303-312; 1197 8. Bundesministerium für Bildung und Forschung; Aktiv - Adaptive und kooperative Technologien für den intelligenten
Verkehr; Ergebnisse, 2010 9. Vruits - Improving the safety and mobility of vulnerable road users through ITS applications; D2.2 - Assessment
methodology; 2014 10. Fildes B., Newstead S., Keall M., Budd L.; CAMERA EFFECTIVENESS AND BACKOVER COLLISIONS WITH PEDESTRIANS: A
FEASIBILITY STUDY; Australian Government Department of Infrastructure and Regional Development; Report No 321; 2014
11. Oxley J., Ihsen E., Fildes B.N., Charlton J.L., Day R.H.; Crossing roads safely: an experimental study of age differences in gap selection by pedestrians; Accid. Anal. Prev. 37 (5), 962–971, 2005
12. Lobjois R., Cavallo V.; Age-related differences in street-crossing decisions: the effects of vehicle speed and time constraints on gap selection in an estimation task; Accid. Anal. Prev. 39 (5), 934–943, 2007
13. Holland C., Hil, R; Gender differences in factors predicting unsafe crossing decisions in adult pedestrians across the lifespan: a simulation study; Accid. Anal. Prev. 42 (4), 1097–1106, 2010
14. Zivotofsky A.Z., Eldror E., Mandel R., Rosenbloom T.; Misjudging their own steps: why elderly people have trouble crossing the road; Hum. Factors 54 (4), 600–607, 2012
15. Knoblauch R.L., Pietrucha M.T., Nitzburg M.; Field studies of pedestrian walking speed and start-up time. Transport. Res. Record 1538, 27–38, 1999
16. Oxley J., Fildes B., Ihsen E., Day R. & Charlton, J.; An investigation of road crossing behaviour of older pedestrian. Report # 81, 19965. http://www.monash.edu/__data/assets/pdf_file/0020/216434/muarc081.pdf, accessed March 2016
17. Asher L., Aresu M., Falaschetti E., Mindell J.; Most older pedestrians are unable to cross the road in time: a cross-sectional study; Age Ageing 41 (5), 690–694, 2012
18. Bohannon R.W., Andrews A.W.; Normal walking speed: a descriptive meta-analysis. Physiotherapy 97, 182–189, 2011 19. Zegeer C. V., Stutts J. C., Huang H., Zhou M., Rodgman E. ;Current trends in crashes to older pedestrians and related
safety treatments in the United States; Proceedings of the Conference Strategic Highway Research Program (SHRP) and Traffic Safety on Two Continents, September 1993, The Hague (pp. 53-71). Stockholm: Swedish National Road and Transport Research Institute; 1994
20. Holland C. A., Hill R.; Gender differences in factors predicting unsafe crossing decisions in adult pedestrians across the lifespan: A simulation study; Accident Analysis & Prevention, Volume 42, Issue 4, July 2010, Pages 1097-1106; 2010
21. Naveteur J., Delzenne J., Sockeel P., Watelain E., Dupuy M. A.; Crosswalk time estimation and time perception: An experimental study among older female pedestrians; Accident Analysis and Prevention 60 (2013) 42– 49, 2013
22.
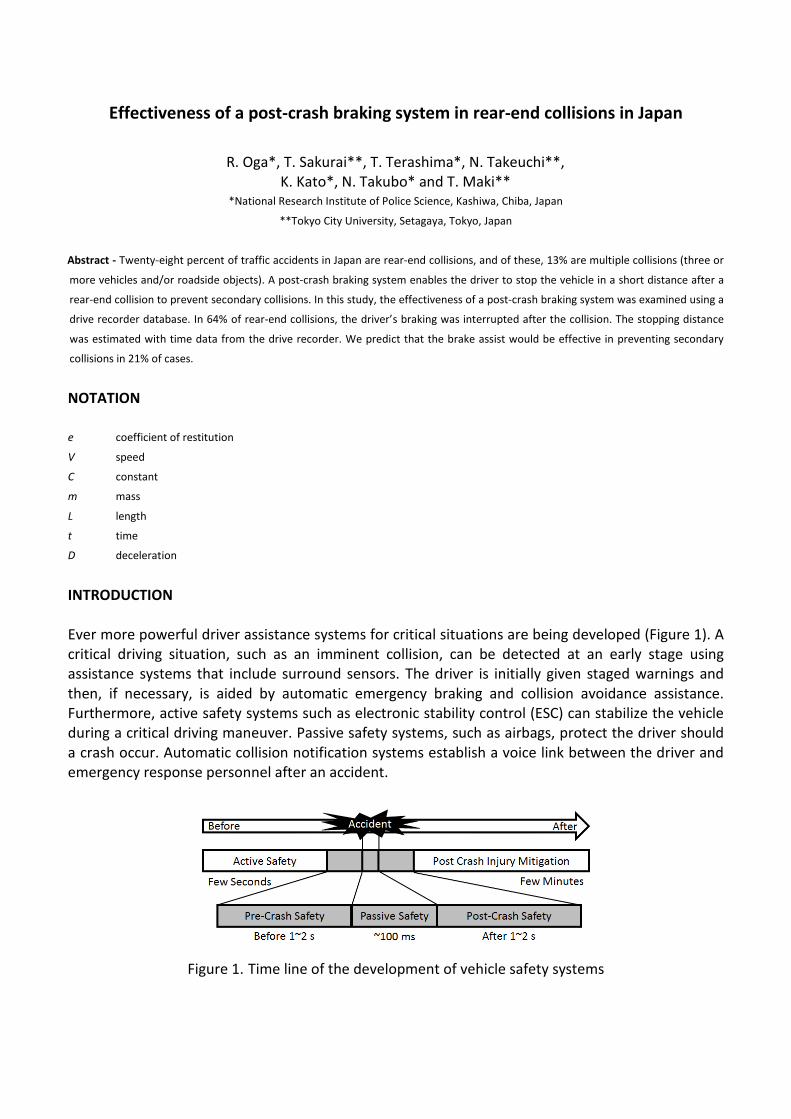
Effectiveness of a post-crash braking system in rear-end collisions in Japan
R. Oga*, T. Sakurai**, T. Terashima*, N. Takeuchi**, K. Kato*, N. Takubo* and T. Maki**
*National Research Institute of Police Science, Kashiwa, Chiba, Japan
**Tokyo City University, Setagaya, Tokyo, Japan
Abstract - Twenty-eight percent of traffic accidents in Japan are rear-end collisions, and of these, 13% are multiple collisions (three or
more vehicles and/or roadside objects). A post-crash braking system enables the driver to stop the vehicle in a short distance after a
rear-end collision to prevent secondary collisions. In this study, the effectiveness of a post-crash braking system was examined using a
drive recorder database. In 64% of rear-end collisions, the driver’s braking was interrupted after the collision. The stopping distance
was estimated with time data from the drive recorder. We predict that the brake assist would be effective in preventing secondary
collisions in 21% of cases.
NOTATION
e coefficient of restitution
V speed
C constant
m mass
L length
t time
D deceleration
INTRODUCTION
Ever more powerful driver assistance systems for critical situations are being developed (Figure 1). A critical driving situation, such as an imminent collision, can be detected at an early stage using assistance systems that include surround sensors. The driver is initially given staged warnings and then, if necessary, is aided by automatic emergency braking and collision avoidance assistance. Furthermore, active safety systems such as electronic stability control (ESC) can stabilize the vehicle during a critical driving maneuver. Passive safety systems, such as airbags, protect the driver should a crash occur. Automatic collision notification systems establish a voice link between the driver and emergency response personnel after an accident.
Figure 1. Time line of the development of vehicle safety systems

Post-crash safety systems are one of the promising technologies for minimizing damage in traffic accidents. For example, Hino motor equips their large trucks and buses with post-crash braking systems, which prevent collisions with the vehicle ahead after an initial rear-end collision [1]. Post-crash braking systems are developed for normal passenger cars by auto manufacturers in Europe [2-4]. The system automatically brakes the vehicle after impact when the vehicle is driving at high speed. Thus the system reduces the risk of and the severity of secondary collisions, even if the driver is no longer operating the brake pedal. The extended time span between the initial and secondary collisions provides the driver with more opportunities to intervene. Some post-crash braking systems also have cooperative control with ESC. Consider, for example, the serious situation in which a car is skidding immediately after collision. The ESC activated after the collision helps the driver stabilize the vehicle attitude. Some post-crash braking systems, however, are designed to stop for traffic signals in rear-end collisions [5]. For example, consider the scenario in which two consecutive vehicles (Vehicle 2 and Vehicle 3 in Figure 2(A)) are stopping at a red traffic signal. A third vehicle (Vehicle 1 in Figure 2(A)) collides with vehicle 2, as shown Figure 2(A). The impact causes vehicle 2 to move towards vehicle 3 (Figure 2(B)). If a post-crash braking system automatically locks the tires during the rear impact, it will reduce the stopping distance. Thus, vehicle 2 prevents a secondary collision with vehicle 3.
Figure 2. Schematic drawing of rear-end collision with post-crash braking system
OBJECTIVE
In this paper we evaluated the effectiveness of post-crash braking systems in rear-end collisions. First, we investigated the nature of traffic accidents in Japan and determined from the drive recorder database how many drivers lost brake control after a collision. Next, we estimated by how much the post-crash braking system reduced the stopping distance after collision. Finally, we predicted in how many of these cases that the post-crash braking system prevented a secondary collision.
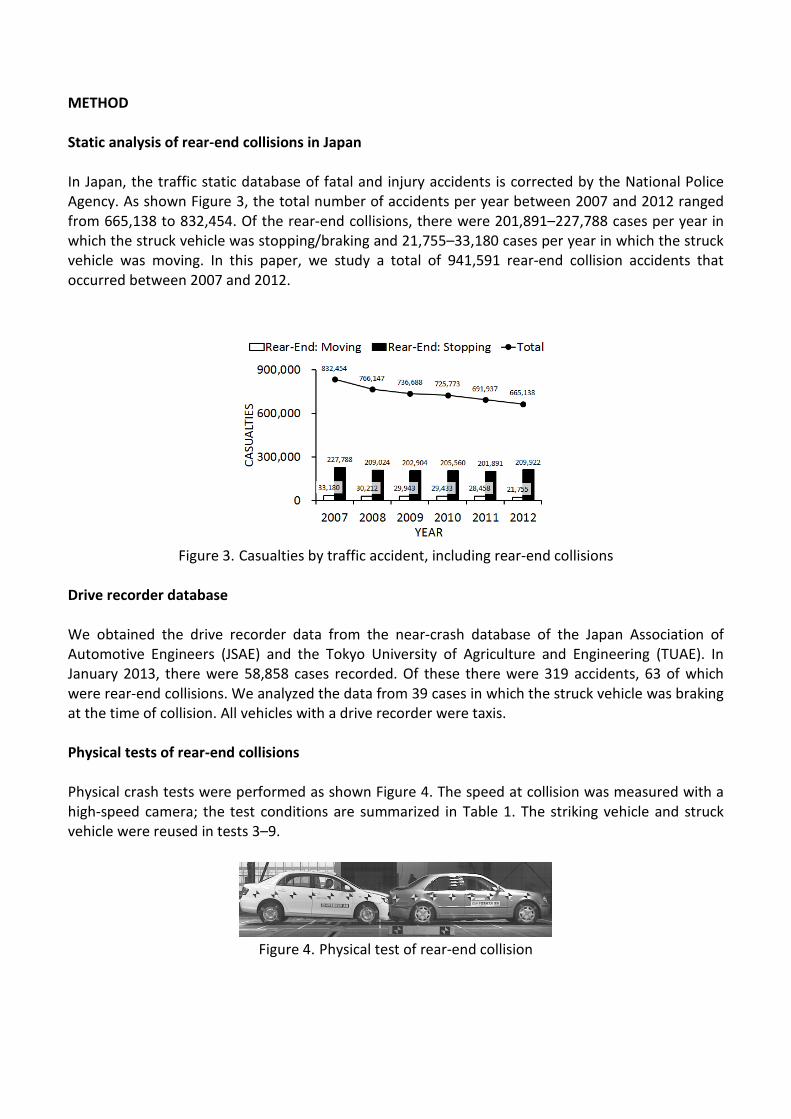
METHOD
Static analysis of rear-end collisions in Japan
In Japan, the traffic static database of fatal and injury accidents is corrected by the National Police Agency. As shown Figure 3, the total number of accidents per year between 2007 and 2012 ranged from 665,138 to 832,454. Of the rear-end collisions, there were 201,891–227,788 cases per year in which the struck vehicle was stopping/braking and 21,755–33,180 cases per year in which the struck vehicle was moving. In this paper, we study a total of 941,591 rear-end collision accidents that occurred between 2007 and 2012.
Figure 3. Casualties by traffic accident, including rear-end collisions
Drive recorder database
We obtained the drive recorder data from the near-crash database of the Japan Association of Automotive Engineers (JSAE) and the Tokyo University of Agriculture and Engineering (TUAE). In January 2013, there were 58,858 cases recorded. Of these there were 319 accidents, 63 of which were rear-end collisions. We analyzed the data from 39 cases in which the struck vehicle was braking at the time of collision. All vehicles with a drive recorder were taxis.
Physical tests of rear-end collisions
Physical crash tests were performed as shown Figure 4. The speed at collision was measured with a high-speed camera; the test conditions are summarized in Table 1. The striking vehicle and struck vehicle were reused in tests 3–9.
Figure 4. Physical test of rear-end collision
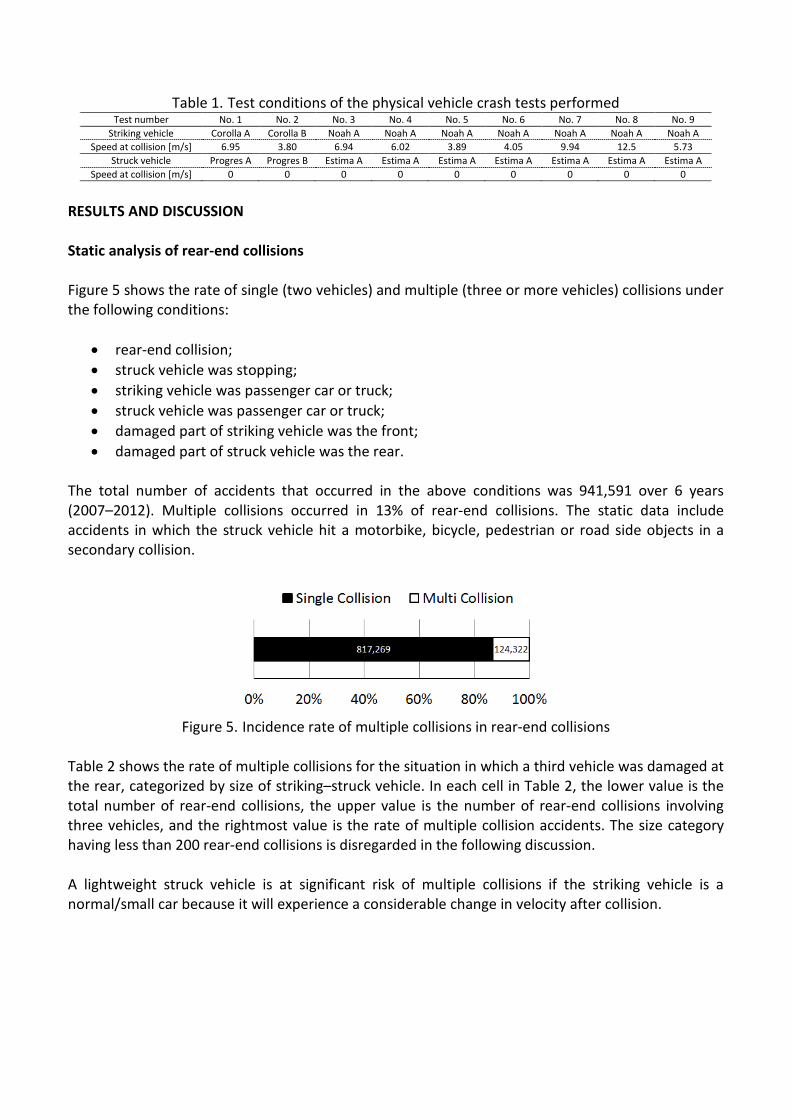
Table 1. Test conditions of the physical vehicle crash tests performed Test number No. 1 No. 2 No. 3 No. 4 No. 5 No. 6 No. 7 No. 8 No. 9
Striking vehicle Corolla A Corolla B Noah A Noah A Noah A Noah A Noah A Noah A Noah A Speed at collision [m/s] 6.95 3.80 6.94 6.02 3.89 4.05 9.94 12.5 5.73
Struck vehicle Progres A Progres B Estima A Estima A Estima A Estima A Estima A Estima A Estima A Speed at collision [m/s] 0 0 0 0 0 0 0 0 0
RESULTS AND DISCUSSION
Static analysis of rear-end collisions
Figure 5 shows the rate of single (two vehicles) and multiple (three or more vehicles) collisions under the following conditions:
• rear-end collision; • struck vehicle was stopping; • striking vehicle was passenger car or truck; • struck vehicle was passenger car or truck; • damaged part of striking vehicle was the front; • damaged part of struck vehicle was the rear.
The total number of accidents that occurred in the above conditions was 941,591 over 6 years (2007–2012). Multiple collisions occurred in 13% of rear-end collisions. The static data include accidents in which the struck vehicle hit a motorbike, bicycle, pedestrian or road side objects in a secondary collision.
Figure 5. Incidence rate of multiple collisions in rear-end collisions
Table 2 shows the rate of multiple collisions for the situation in which a third vehicle was damaged at the rear, categorized by size of striking–struck vehicle. In each cell in Table 2, the lower value is the total number of rear-end collisions, the upper value is the number of rear-end collisions involving three vehicles, and the rightmost value is the rate of multiple collision accidents. The size category having less than 200 rear-end collisions is disregarded in the following discussion. A lightweight struck vehicle is at significant risk of multiple collisions if the striking vehicle is a normal/small car because it will experience a considerable change in velocity after collision.
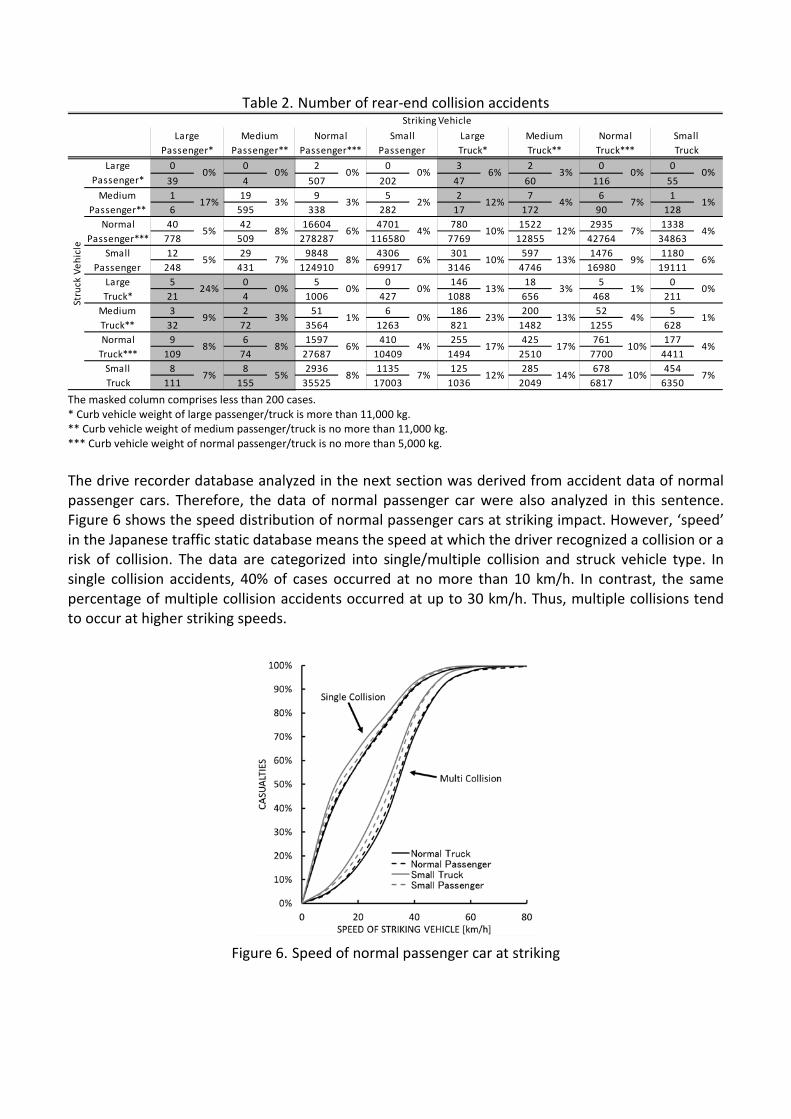
Table 2. Number of rear-end collision accidents
The masked column comprises less than 200 cases. * Curb vehicle weight of large passenger/truck is more than 11,000 kg. ** Curb vehicle weight of medium passenger/truck is no more than 11,000 kg. *** Curb vehicle weight of normal passenger/truck is no more than 5,000 kg. The drive recorder database analyzed in the next section was derived from accident data of normal passenger cars. Therefore, the data of normal passenger car were also analyzed in this sentence. Figure 6 shows the speed distribution of normal passenger cars at striking impact. However, ‘speed’ in the Japanese traffic static database means the speed at which the driver recognized a collision or a risk of collision. The data are categorized into single/multiple collision and struck vehicle type. In single collision accidents, 40% of cases occurred at no more than 10 km/h. In contrast, the same percentage of multiple collision accidents occurred at up to 30 km/h. Thus, multiple collisions tend to occur at higher striking speeds.
Figure 6. Speed of normal passenger car at striking
0 0 2 0 3 2 0 039 4 507 202 47 60 116 551 19 9 5 2 7 6 16 595 338 282 17 172 90 128
40 42 16604 4701 780 1522 2935 1338778 509 278287 116580 7769 12855 42764 3486312 29 9848 4306 301 597 1476 1180
248 431 124910 69917 3146 4746 16980 191115 0 5 0 146 18 5 0
21 4 1006 427 1088 656 468 2113 2 51 6 186 200 52 5
32 72 3564 1263 821 1482 1255 6289 6 1597 410 255 425 761 177
109 74 27687 10409 1494 2510 7700 44118 8 2936 1135 125 285 678 454
111 155 35525 17003 1036 2049 6817 6350SmallTruck
7% 5% 8% 7% 12% 14% 10% 7%
NormalTruck***
8% 8% 6% 4% 17% 17% 10% 4%
MediumTruck**
9% 3% 1% 0% 23% 13% 4% 1%
LargeTruck*
24% 0% 0% 0% 13% 3% 1% 0%
SmallPassenger
5% 7% 8% 6% 10% 13% 9% 6%
Stru
ck V
ehic
le
LargePassenger*
0% 0% 0% 0% 6% 3% 0%
MediumPassenger**
17% 3% 3% 2% 12% 4% 7%
NormalPassenger***
5% 8% 6% 4% 10% 12%
Striking VehicleLarge
Passenger*Medium
Passenger**Normal
Passenger***Small
PassengerLargeTruck*
MediumTruck**
NormalTruck***
SmallTruck
0%
1%
7% 4%
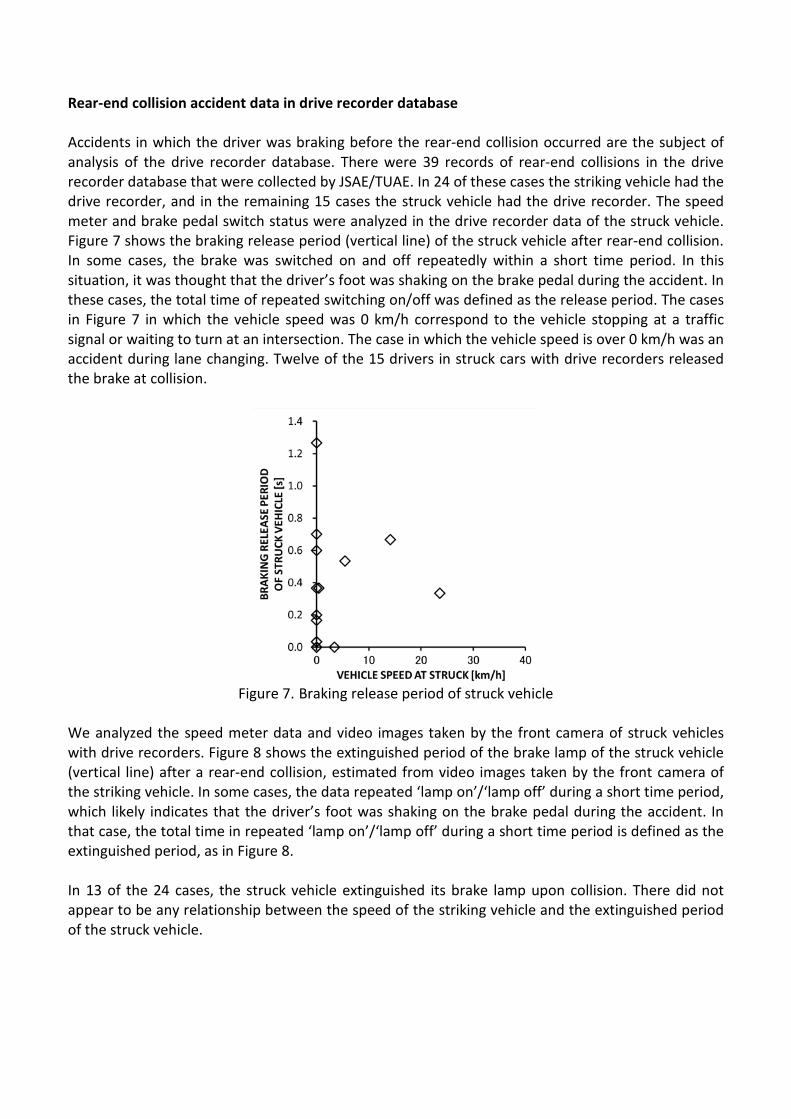
Rear-end collision accident data in drive recorder database
Accidents in which the driver was braking before the rear-end collision occurred are the subject of analysis of the drive recorder database. There were 39 records of rear-end collisions in the drive recorder database that were collected by JSAE/TUAE. In 24 of these cases the striking vehicle had the drive recorder, and in the remaining 15 cases the struck vehicle had the drive recorder. The speed meter and brake pedal switch status were analyzed in the drive recorder data of the struck vehicle. Figure 7 shows the braking release period (vertical line) of the struck vehicle after rear-end collision. In some cases, the brake was switched on and off repeatedly within a short time period. In this situation, it was thought that the driver’s foot was shaking on the brake pedal during the accident. In these cases, the total time of repeated switching on/off was defined as the release period. The cases in Figure 7 in which the vehicle speed was 0 km/h correspond to the vehicle stopping at a traffic signal or waiting to turn at an intersection. The case in which the vehicle speed is over 0 km/h was an accident during lane changing. Twelve of the 15 drivers in struck cars with drive recorders released the brake at collision.
Figure 7. Braking release period of struck vehicle
We analyzed the speed meter data and video images taken by the front camera of struck vehicles with drive recorders. Figure 8 shows the extinguished period of the brake lamp of the struck vehicle (vertical line) after a rear-end collision, estimated from video images taken by the front camera of the striking vehicle. In some cases, the data repeated ‘lamp on’/‘lamp off’ during a short time period, which likely indicates that the driver’s foot was shaking on the brake pedal during the accident. In that case, the total time in repeated ‘lamp on’/‘lamp off’ during a short time period is defined as the extinguished period, as in Figure 8. In 13 of the 24 cases, the struck vehicle extinguished its brake lamp upon collision. There did not appear to be any relationship between the speed of the striking vehicle and the extinguished period of the struck vehicle.
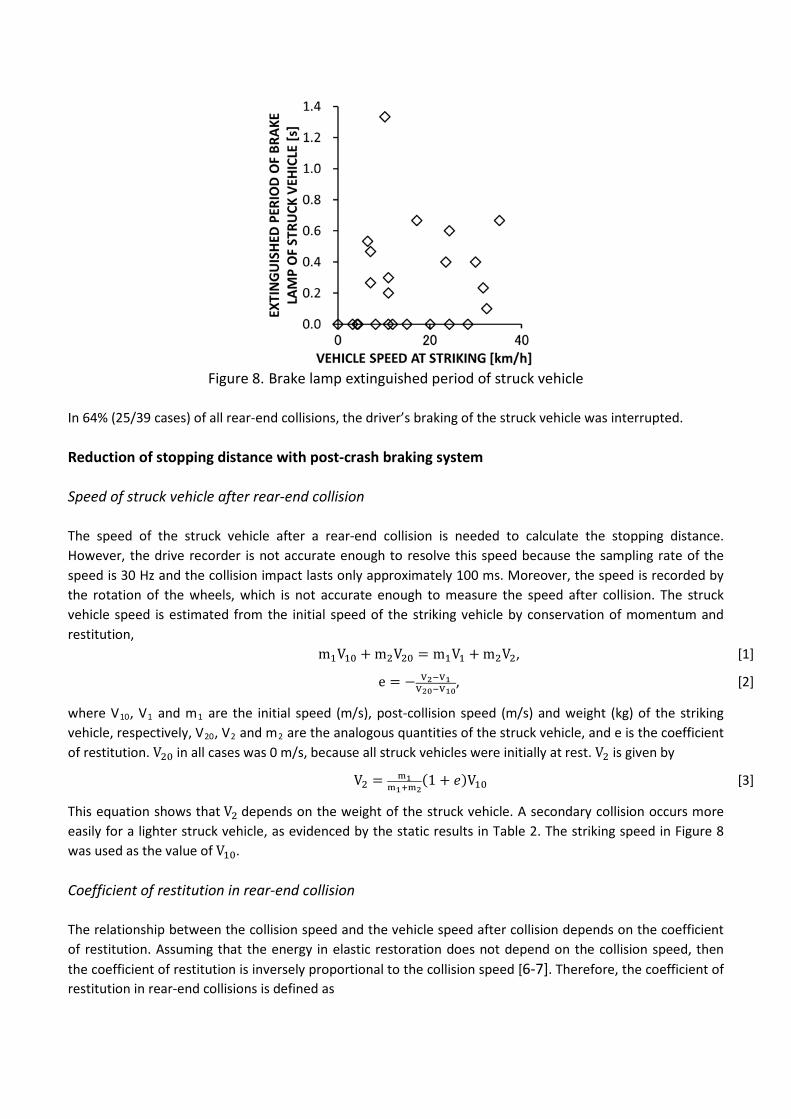
Figure 8. Brake lamp extinguished period of struck vehicle
In 64% (25/39 cases) of all rear-end collisions, the driver’s braking of the struck vehicle was interrupted.
Reduction of stopping distance with post-crash braking system
Speed of struck vehicle after rear-end collision
The speed of the struck vehicle after a rear-end collision is needed to calculate the stopping distance. However, the drive recorder is not accurate enough to resolve this speed because the sampling rate of the speed is 30 Hz and the collision impact lasts only approximately 100 ms. Moreover, the speed is recorded by the rotation of the wheels, which is not accurate enough to measure the speed after collision. The struck vehicle speed is estimated from the initial speed of the striking vehicle by conservation of momentum and restitution, m1V10 + m2V20 = m1V1 + m2V2, [1]
e = − V2−V1V20−V10
, [2]
where V10, V1 and m1 are the initial speed (m/s), post-collision speed (m/s) and weight (kg) of the striking vehicle, respectively, V20, V2 and m2 are the analogous quantities of the struck vehicle, and e is the coefficient of restitution. V20 in all cases was 0 m/s, because all struck vehicles were initially at rest. V2 is given by
V2 = m1m1+m2
(1 + 𝑒)V10 [3]
This equation shows that V2 depends on the weight of the struck vehicle. A secondary collision occurs more easily for a lighter struck vehicle, as evidenced by the static results in Table 2. The striking speed in Figure 8 was used as the value of V10.
Coefficient of restitution in rear-end collision
The relationship between the collision speed and the vehicle speed after collision depends on the coefficient of restitution. Assuming that the energy in elastic restoration does not depend on the collision speed, then the coefficient of restitution is inversely proportional to the collision speed [6-7]. Therefore, the coefficient of restitution in rear-end collisions is defined as
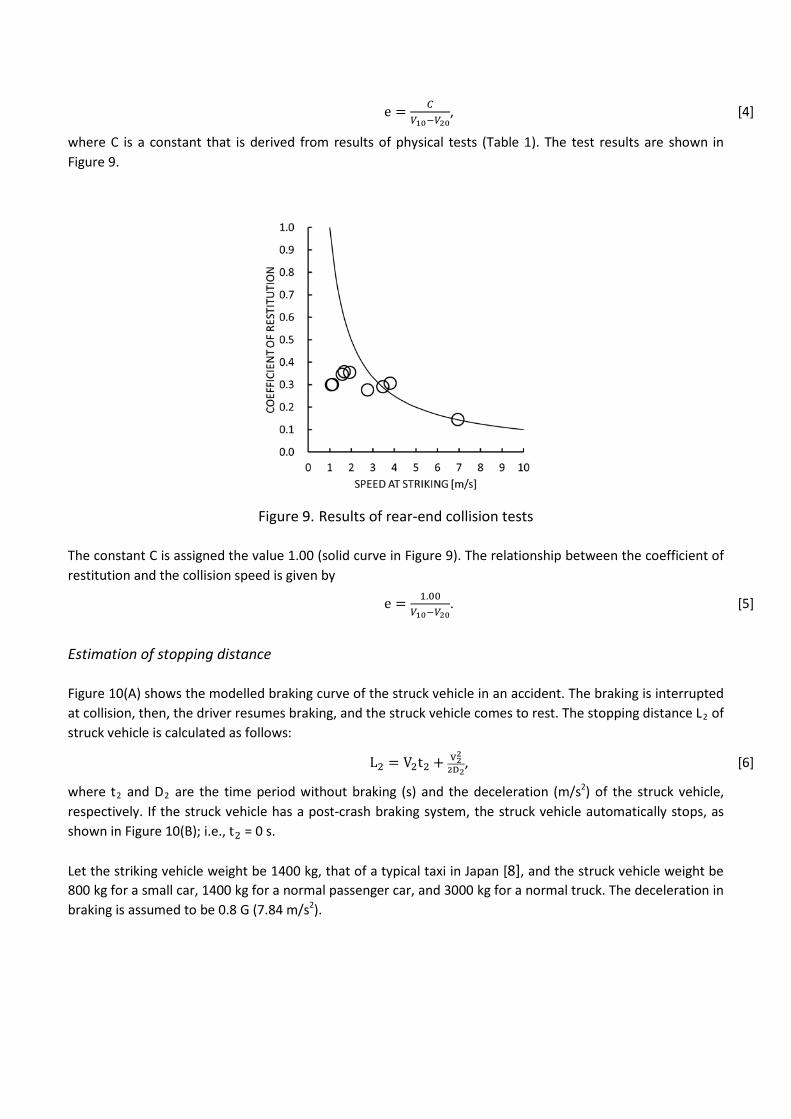
e = 𝐶𝑉10−𝑉20
, [4]
where C is a constant that is derived from results of physical tests (Table 1). The test results are shown in Figure 9.
Figure 9. Results of rear-end collision tests
The constant C is assigned the value 1.00 (solid curve in Figure 9). The relationship between the coefficient of restitution and the collision speed is given by
e = 1.00𝑉10−𝑉20
. [5]
Estimation of stopping distance
Figure 10(A) shows the modelled braking curve of the struck vehicle in an accident. The braking is interrupted at collision, then, the driver resumes braking, and the struck vehicle comes to rest. The stopping distance L2 of struck vehicle is calculated as follows:
L2 = V2t2 + V22
2D2, [6]
where t2 and D2 are the time period without braking (s) and the deceleration (m/s2) of the struck vehicle, respectively. If the struck vehicle has a post-crash braking system, the struck vehicle automatically stops, as shown in Figure 10(B); i.e., t2 = 0 s. Let the striking vehicle weight be 1400 kg, that of a typical taxi in Japan [8], and the struck vehicle weight be 800 kg for a small car, 1400 kg for a normal passenger car, and 3000 kg for a normal truck. The deceleration in braking is assumed to be 0.8 G (7.84 m/s2).
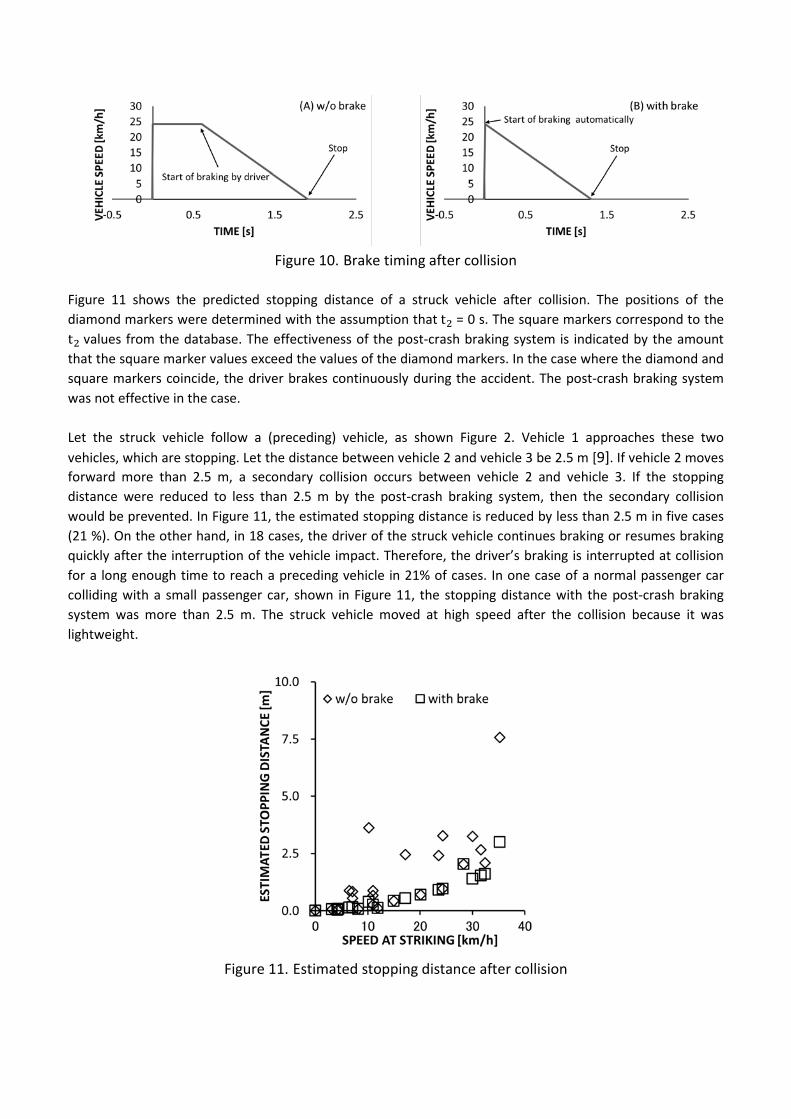
Figure 10. Brake timing after collision
Figure 11 shows the predicted stopping distance of a struck vehicle after collision. The positions of the diamond markers were determined with the assumption that t2 = 0 s. The square markers correspond to the t2 values from the database. The effectiveness of the post-crash braking system is indicated by the amount that the square marker values exceed the values of the diamond markers. In the case where the diamond and square markers coincide, the driver brakes continuously during the accident. The post-crash braking system was not effective in the case. Let the struck vehicle follow a (preceding) vehicle, as shown Figure 2. Vehicle 1 approaches these two vehicles, which are stopping. Let the distance between vehicle 2 and vehicle 3 be 2.5 m [9]. If vehicle 2 moves forward more than 2.5 m, a secondary collision occurs between vehicle 2 and vehicle 3. If the stopping distance were reduced to less than 2.5 m by the post-crash braking system, then the secondary collision would be prevented. In Figure 11, the estimated stopping distance is reduced by less than 2.5 m in five cases (21 %). On the other hand, in 18 cases, the driver of the struck vehicle continues braking or resumes braking quickly after the interruption of the vehicle impact. Therefore, the driver’s braking is interrupted at collision for a long enough time to reach a preceding vehicle in 21% of cases. In one case of a normal passenger car colliding with a small passenger car, shown in Figure 11, the stopping distance with the post-crash braking system was more than 2.5 m. The struck vehicle moved at high speed after the collision because it was lightweight.
Figure 11. Estimated stopping distance after collision
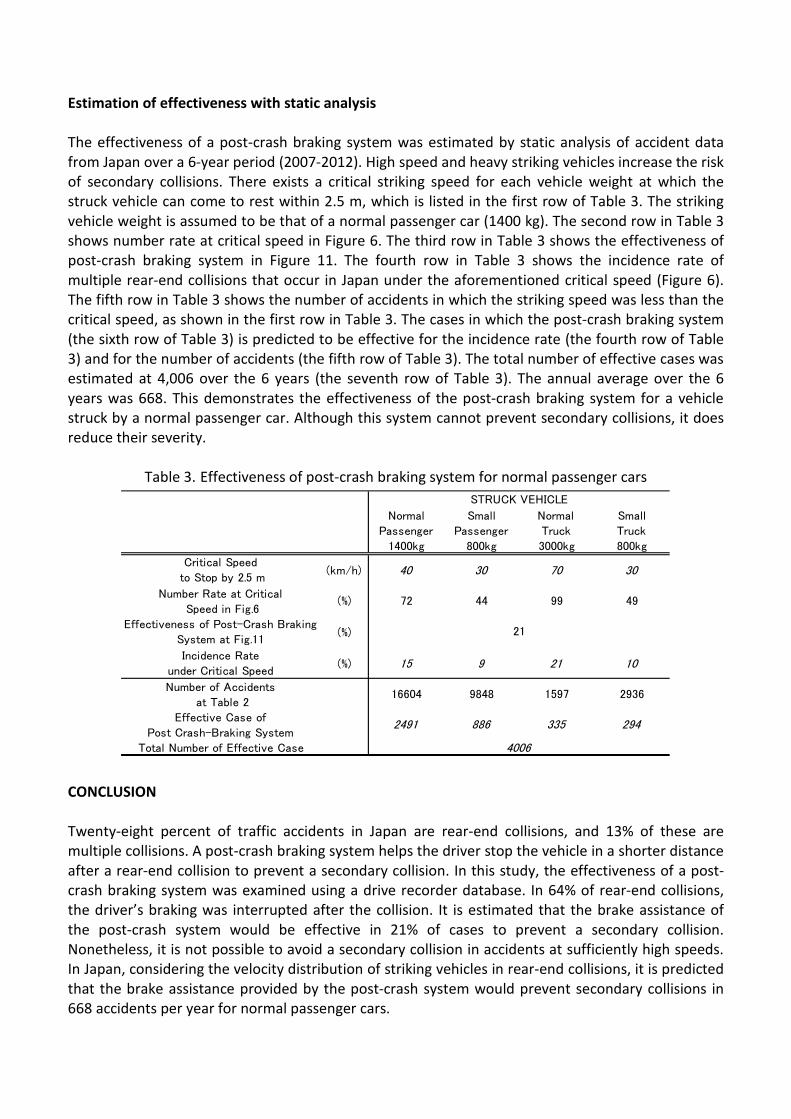
Estimation of effectiveness with static analysis
The effectiveness of a post-crash braking system was estimated by static analysis of accident data from Japan over a 6-year period (2007-2012). High speed and heavy striking vehicles increase the risk of secondary collisions. There exists a critical striking speed for each vehicle weight at which the struck vehicle can come to rest within 2.5 m, which is listed in the first row of Table 3. The striking vehicle weight is assumed to be that of a normal passenger car (1400 kg). The second row in Table 3 shows number rate at critical speed in Figure 6. The third row in Table 3 shows the effectiveness of post-crash braking system in Figure 11. The fourth row in Table 3 shows the incidence rate of multiple rear-end collisions that occur in Japan under the aforementioned critical speed (Figure 6). The fifth row in Table 3 shows the number of accidents in which the striking speed was less than the critical speed, as shown in the first row in Table 3. The cases in which the post-crash braking system (the sixth row of Table 3) is predicted to be effective for the incidence rate (the fourth row of Table 3) and for the number of accidents (the fifth row of Table 3). The total number of effective cases was estimated at 4,006 over the 6 years (the seventh row of Table 3). The annual average over the 6 years was 668. This demonstrates the effectiveness of the post-crash braking system for a vehicle struck by a normal passenger car. Although this system cannot prevent secondary collisions, it does reduce their severity.
Table 3. Effectiveness of post-crash braking system for normal passenger cars
CONCLUSION
Twenty-eight percent of traffic accidents in Japan are rear-end collisions, and 13% of these are multiple collisions. A post-crash braking system helps the driver stop the vehicle in a shorter distance after a rear-end collision to prevent a secondary collision. In this study, the effectiveness of a post-crash braking system was examined using a drive recorder database. In 64% of rear-end collisions, the driver’s braking was interrupted after the collision. It is estimated that the brake assistance of the post-crash system would be effective in 21% of cases to prevent a secondary collision. Nonetheless, it is not possible to avoid a secondary collision in accidents at sufficiently high speeds. In Japan, considering the velocity distribution of striking vehicles in rear-end collisions, it is predicted that the brake assistance provided by the post-crash system would prevent secondary collisions in 668 accidents per year for normal passenger cars.
Normal
Passenger
Small
Passenger
Normal
Truck
Small
Truck
1400kg 800kg 3000kg 800kg
Critical Speed
to Stop by 2.5 m(km/h) 40 30 70 30
Number Rate at Critical
Speed in Fig.6(%) 72 44 99 49
Effectiveness of Post-Crash Braking
System at Fig.11(%)
Incidence Rate
under Critical Speed(%) 15 9 21 10
Number of Accidents
at Table 216604 9848 1597 2936
Effective Case of
Post Crash-Braking System2491 886 335 294
Total Number of Effective Case
STRUCK VEHICLE
21
4006
ACKNOWLEDGMENT
This work was supported by JSPS KAKENHI Grant number 15K06267.
REFERENCES
1 Hino Motors: Safety Map, online at http://www.hino.co.jp/selega/safety/index.html (Accessed: 5th March 2016).
2 A. Häussler, R. Schäffler, A. Georgi, S. Stabrey: Networking of airbag and ESP for prevention of further collisions: Chassis
Handbook, Vieweg+Teubner Verlag, Germany, pp. 22-26 (2011).
3 Continental: Continental’s Technology Reduces the Probability and Severity of Secondary Collisions, 2014, online at
http://www.continental-
corporation.com/www/pressportal_com_en/themes/press_releases/3_automotive_group/chassis_safety/press_releases/pr_20
12_07_12_post_crash_braking_en.html. (Accessed: 5th March 2016).
4 Volks Wagen: Brake System, online at
http://www.volkswagen.co.jp/ja.s7_layer_print.suffix.html/features~2Fholzauto_highlights~2Fgolf7~2Ffeature01~2Ffeature01_
05.html (in Japanese) (Accessed: 5th March 2016).
5 Yanase: Rader Safety Package, online at http://www.yanase.co.jp/mercedes-benz/e-class/safety/ (Accessed: 5th March 2016).
6 I. Emori: Engineering for automotive accidents – methodology for accident reconstruction -, Gijutsu-shoin, Japanese, pp. 82-83
(1993).
7 H. Ishikawa: Kinematics of Automobile Collision – Analytical Formulars for One Dimensional Impact -, JARI Research Journal, Vol.
12, No. 10, Japanese, pp. 403-410 (1990).
8 Japan Automobile Manufacturers Association, Crown Comfort, Japanese Motor Vehicles Guidebook (60), Toppan Printing, p.217
(2014).
9 K. Mori, N. Yano, T. Yokozeki, H. Makishita: CHARACTERISTICS OF THE VEHICLES’ BEHAVIOR UNDER PRACTICAL ENERGY SAVING
DRIVES, Journal of Japan Society of Civil Engineers, Ser. D3 (Infrastructure Planning and Management), Vol. 68, No.5, I_1149-
I_1152 (2012).
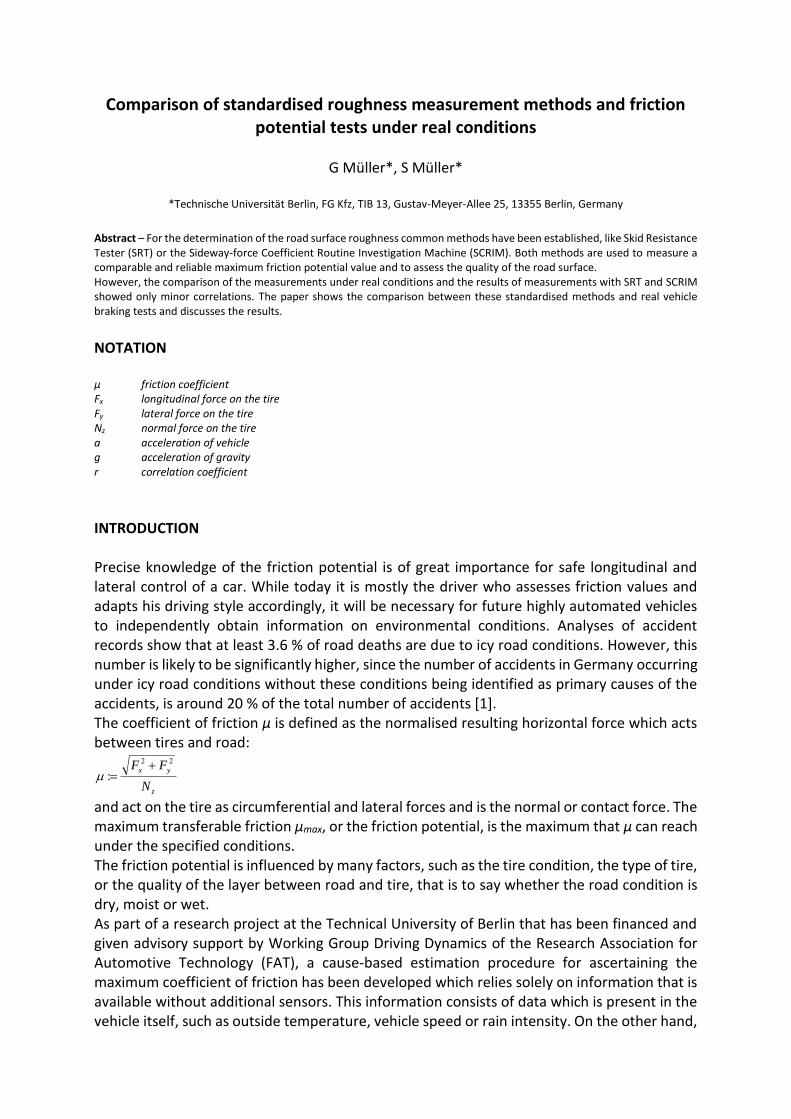
Comparison of standardised roughness measurement methods and friction potential tests under real conditions
G Müller*, S Müller*
*Technische Universität Berlin, FG Kfz, TIB 13, Gustav-Meyer-Allee 25, 13355 Berlin, Germany
Abstract – For the determination of the road surface roughness common methods have been established, like Skid Resistance Tester (SRT) or the Sideway-force Coefficient Routine Investigation Machine (SCRIM). Both methods are used to measure a comparable and reliable maximum friction potential value and to assess the quality of the road surface. However, the comparison of the measurements under real conditions and the results of measurements with SRT and SCRIM showed only minor correlations. The paper shows the comparison between these standardised methods and real vehicle braking tests and discusses the results.
NOTATION µ friction coefficient Fx longitudinal force on the tire Fy lateral force on the tire Nz normal force on the tire a acceleration of vehicle g acceleration of gravity r correlation coefficient
INTRODUCTION Precise knowledge of the friction potential is of great importance for safe longitudinal and lateral control of a car. While today it is mostly the driver who assesses friction values and adapts his driving style accordingly, it will be necessary for future highly automated vehicles to independently obtain information on environmental conditions. Analyses of accident records show that at least 3.6 % of road deaths are due to icy road conditions. However, this number is likely to be significantly higher, since the number of accidents in Germany occurring under icy road conditions without these conditions being identified as primary causes of the accidents, is around 20 % of the total number of accidents [1]. The coefficient of friction μ is defined as the normalised resulting horizontal force which acts between tires and road:
z
yx
N
FF 22
:
and act on the tire as circumferential and lateral forces and is the normal or contact force. The maximum transferable friction μmax, or the friction potential, is the maximum that μ can reach under the specified conditions. The friction potential is influenced by many factors, such as the tire condition, the type of tire, or the quality of the layer between road and tire, that is to say whether the road condition is dry, moist or wet. As part of a research project at the Technical University of Berlin that has been financed and given advisory support by Working Group Driving Dynamics of the Research Association for Automotive Technology (FAT), a cause-based estimation procedure for ascertaining the maximum coefficient of friction has been developed which relies solely on information that is available without additional sensors. This information consists of data which is present in the vehicle itself, such as outside temperature, vehicle speed or rain intensity. On the other hand,
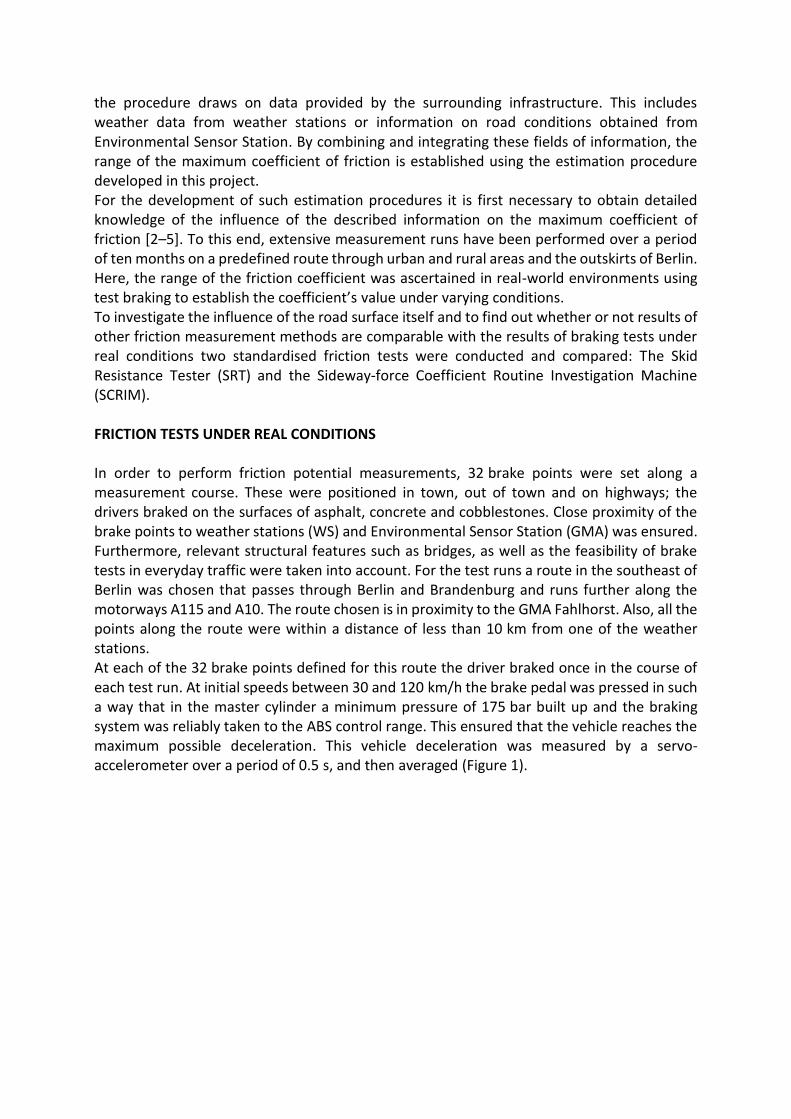
the procedure draws on data provided by the surrounding infrastructure. This includes weather data from weather stations or information on road conditions obtained from Environmental Sensor Station. By combining and integrating these fields of information, the range of the maximum coefficient of friction is established using the estimation procedure developed in this project. For the development of such estimation procedures it is first necessary to obtain detailed knowledge of the influence of the described information on the maximum coefficient of friction [2–5]. To this end, extensive measurement runs have been performed over a period of ten months on a predefined route through urban and rural areas and the outskirts of Berlin. Here, the range of the friction coefficient was ascertained in real-world environments using test braking to establish the coefficient’s value under varying conditions. To investigate the influence of the road surface itself and to find out whether or not results of other friction measurement methods are comparable with the results of braking tests under real conditions two standardised friction tests were conducted and compared: The Skid Resistance Tester (SRT) and the Sideway-force Coefficient Routine Investigation Machine (SCRIM). FRICTION TESTS UNDER REAL CONDITIONS In order to perform friction potential measurements, 32 brake points were set along a measurement course. These were positioned in town, out of town and on highways; the drivers braked on the surfaces of asphalt, concrete and cobblestones. Close proximity of the brake points to weather stations (WS) and Environmental Sensor Station (GMA) was ensured. Furthermore, relevant structural features such as bridges, as well as the feasibility of brake tests in everyday traffic were taken into account. For the test runs a route in the southeast of Berlin was chosen that passes through Berlin and Brandenburg and runs further along the motorways A115 and A10. The route chosen is in proximity to the GMA Fahlhorst. Also, all the points along the route were within a distance of less than 10 km from one of the weather stations. At each of the 32 brake points defined for this route the driver braked once in the course of each test run. At initial speeds between 30 and 120 km/h the brake pedal was pressed in such a way that in the master cylinder a minimum pressure of 175 bar built up and the braking system was reliably taken to the ABS control range. This ensured that the vehicle reaches the maximum possible deceleration. This vehicle deceleration was measured by a servo-accelerometer over a period of 0.5 s, and then averaged (Figure 1).
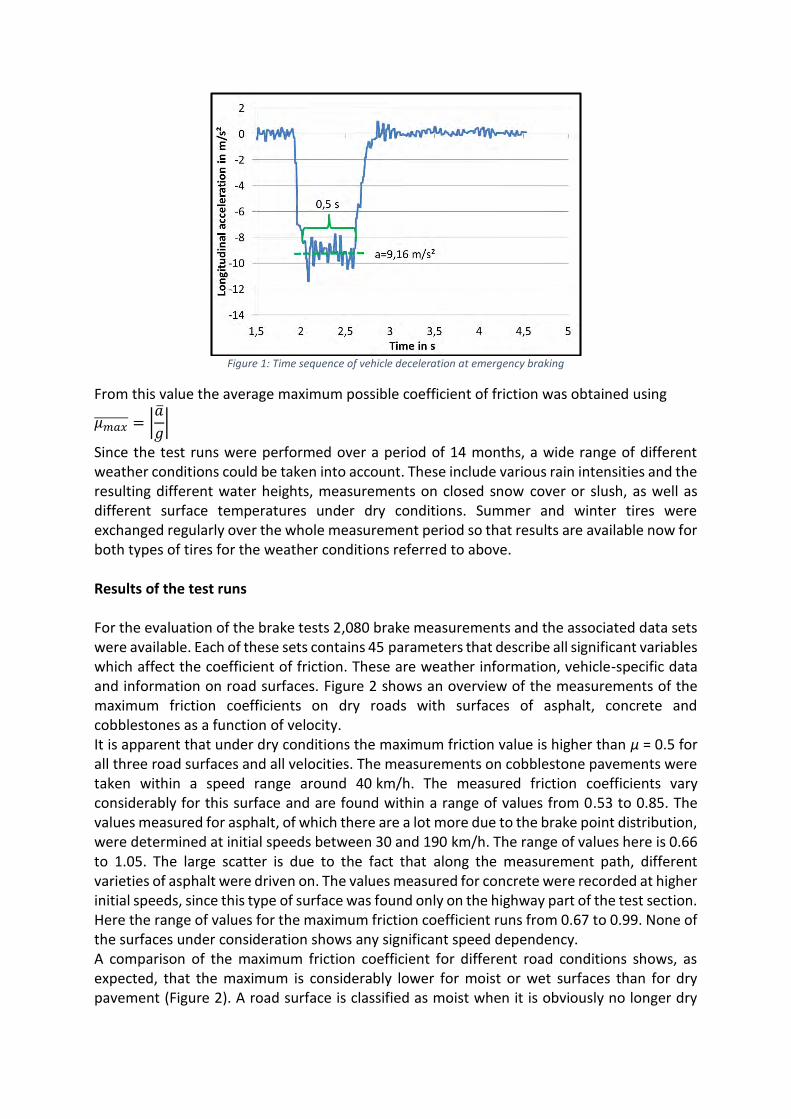
Figure 1: Time sequence of vehicle deceleration at emergency braking
From this value the average maximum possible coefficient of friction was obtained using
𝜇𝑚𝑎𝑥̅̅ ̅̅ ̅̅ ̅ = |�̅�
𝑔|
Since the test runs were performed over a period of 14 months, a wide range of different weather conditions could be taken into account. These include various rain intensities and the resulting different water heights, measurements on closed snow cover or slush, as well as different surface temperatures under dry conditions. Summer and winter tires were exchanged regularly over the whole measurement period so that results are available now for both types of tires for the weather conditions referred to above. Results of the test runs For the evaluation of the brake tests 2,080 brake measurements and the associated data sets were available. Each of these sets contains 45 parameters that describe all significant variables which affect the coefficient of friction. These are weather information, vehicle-specific data and information on road surfaces. Figure 2 shows an overview of the measurements of the maximum friction coefficients on dry roads with surfaces of asphalt, concrete and cobblestones as a function of velocity. It is apparent that under dry conditions the maximum friction value is higher than μ = 0.5 for all three road surfaces and all velocities. The measurements on cobblestone pavements were taken within a speed range around 40 km/h. The measured friction coefficients vary considerably for this surface and are found within a range of values from 0.53 to 0.85. The values measured for asphalt, of which there are a lot more due to the brake point distribution, were determined at initial speeds between 30 and 190 km/h. The range of values here is 0.66 to 1.05. The large scatter is due to the fact that along the measurement path, different varieties of asphalt were driven on. The values measured for concrete were recorded at higher initial speeds, since this type of surface was found only on the highway part of the test section. Here the range of values for the maximum friction coefficient runs from 0.67 to 0.99. None of the surfaces under consideration shows any significant speed dependency. A comparison of the maximum friction coefficient for different road conditions shows, as expected, that the maximum is considerably lower for moist or wet surfaces than for dry pavement (Figure 2). A road surface is classified as moist when it is obviously no longer dry

but no water is being sprayed by moving vehicles, the pores of the road surface are not closed by water, and no reflective surface has formed yet.
Figure 2: Maximum coefficient of friction for dry road surfaces as a function of vehicle velocity (right)
Maximum coefficient of friction on asphalt for different road conditions (left)
FRICTION TESTS WITH SRT The Skid Resistance Tester (SRT) is a standardised measuring device. The basic principle of that measuring method is, that a defined rubber cube slides over the wet road surface. This rubber cube is connected with a pendulum. Depending on the friction coefficient between rubber and road surface the pendulum reaches different deflections (Figure 3).
Figure 3: Skid Resistance Tester (SRT)
Within the project a total of 24 road sections were tested for their grip. Here at each braking point road sections of approximately 10 – 40 m length were measured with the SRT. The length of the measuring range varied, depending on the stopping distance achieved at the point of a fully developed deceleration. At three measuring points (at the start, in the middle and end of each braking distance) five measurements were carried out. This results in 15 measured values each braking point.
The range of values of the SRT measurements is between 20 and 60. Therefore, a quantitative comparison of the measured values with those of the tests under real conditions is not possible. However, there should be a correlation between both data sets. The results of the SRT measurements showed a good reproducibility. For the 15 values of each breaking point only minor scatterings occurred (Figure 4).
Figure 4: Results of SRT measurements for 24 brake points (scatter)
FRICTION TESTS WITH SCRIM The Sideway-force Coefficient Routine Investigation Machine (SCRIM) is a standardised measurement method which is used e.g. in Germany by the Federal Highway Research Institute (BASt) to observe the condition of motorways and national roads. In this measurement method, a wheel is pulled under a defined slip angle of 20° on the road surface by a truck (Figure 5). The occurring side force is the value of the measured friction of the road.
Figure 5: SCRIM and measurement method
The measuring wheel is a profile-free narrow measuring tire which is loaded with a normal load of 1.96 kN [6]. This results in a slip of about 34%. At speeds of 40, 60 and 80 km/h (for
Normal Force
Side Force
Slip Angle 20°
Lateral
Coefficient of
Friction
=
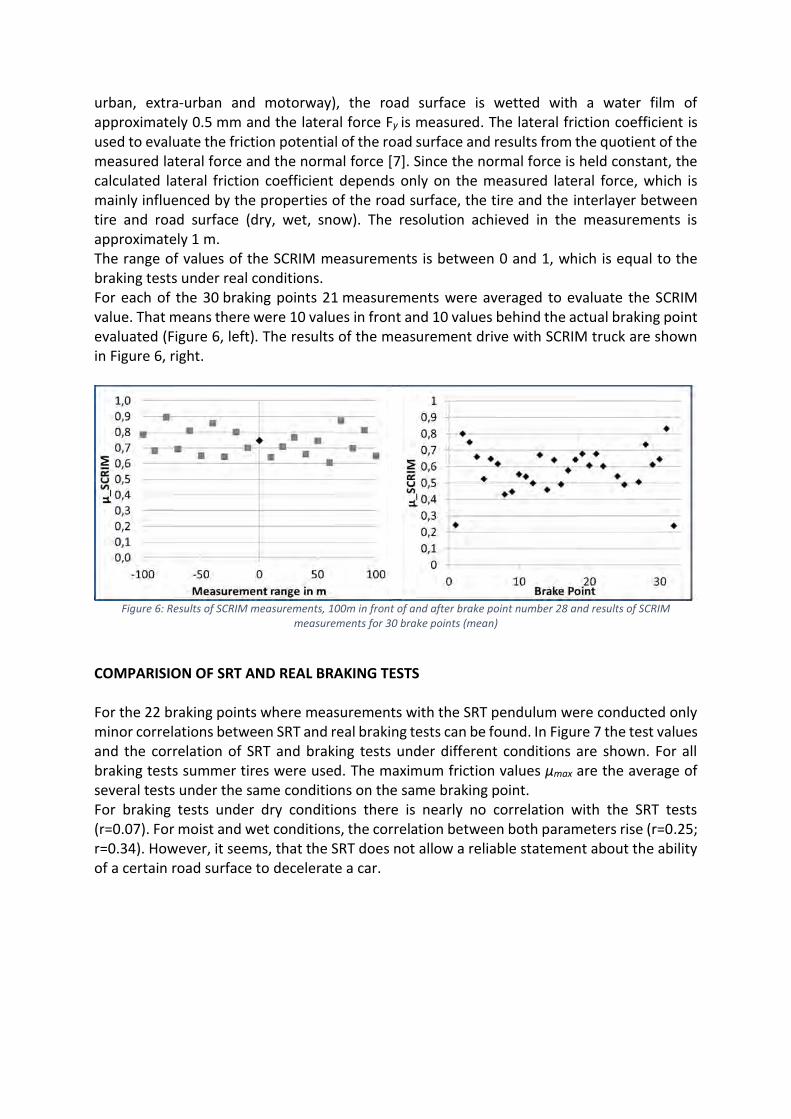
urban, extra-urban and motorway), the road surface is wetted with a water film of approximately 0.5 mm and the lateral force Fy is measured. The lateral friction coefficient is used to evaluate the friction potential of the road surface and results from the quotient of the measured lateral force and the normal force [7]. Since the normal force is held constant, the calculated lateral friction coefficient depends only on the measured lateral force, which is mainly influenced by the properties of the road surface, the tire and the interlayer between tire and road surface (dry, wet, snow). The resolution achieved in the measurements is approximately 1 m. The range of values of the SCRIM measurements is between 0 and 1, which is equal to the braking tests under real conditions. For each of the 30 braking points 21 measurements were averaged to evaluate the SCRIM value. That means there were 10 values in front and 10 values behind the actual braking point evaluated (Figure 6, left). The results of the measurement drive with SCRIM truck are shown in Figure 6, right.
Figure 6: Results of SCRIM measurements, 100m in front of and after brake point number 28 and results of SCRIM
measurements for 30 brake points (mean)
COMPARISION OF SRT AND REAL BRAKING TESTS For the 22 braking points where measurements with the SRT pendulum were conducted only minor correlations between SRT and real braking tests can be found. In Figure 7 the test values and the correlation of SRT and braking tests under different conditions are shown. For all braking tests summer tires were used. The maximum friction values µmax are the average of several tests under the same conditions on the same braking point. For braking tests under dry conditions there is nearly no correlation with the SRT tests (r=0.07). For moist and wet conditions, the correlation between both parameters rise (r=0.25; r=0.34). However, it seems, that the SRT does not allow a reliable statement about the ability of a certain road surface to decelerate a car.
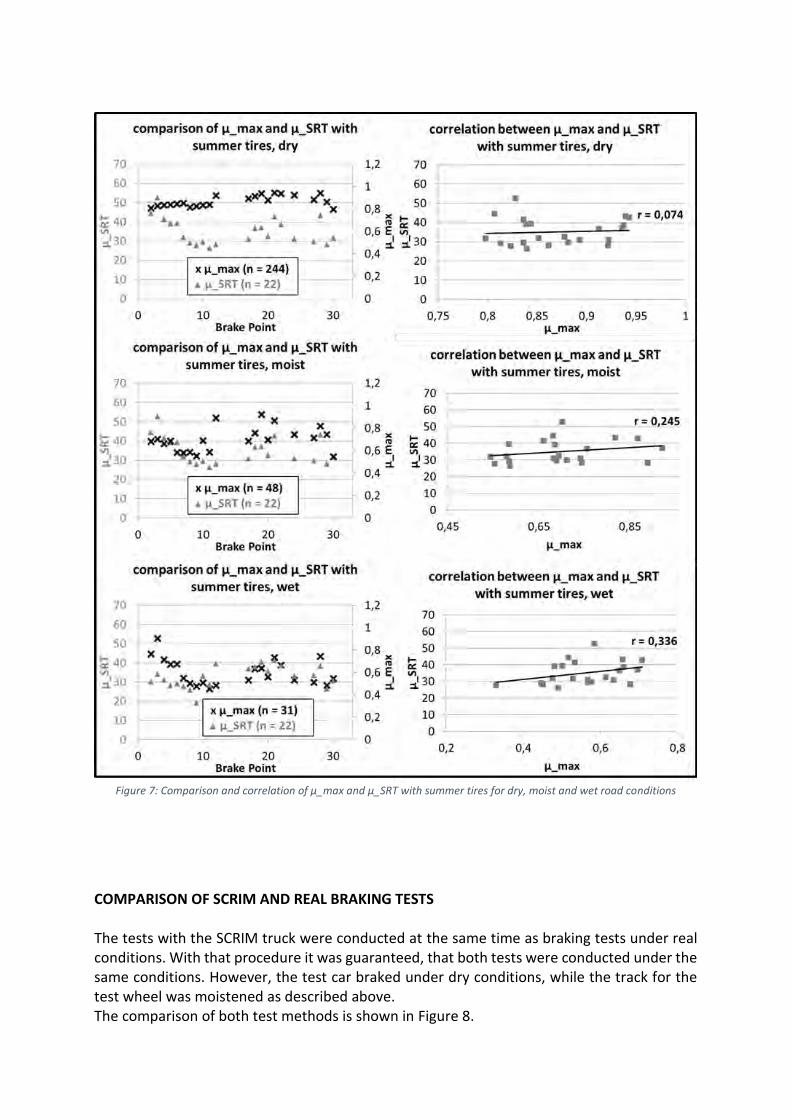
Figure 7: Comparison and correlation of µ_max and µ_SRT with summer tires for dry, moist and wet road conditions
COMPARISON OF SCRIM AND REAL BRAKING TESTS The tests with the SCRIM truck were conducted at the same time as braking tests under real conditions. With that procedure it was guaranteed, that both tests were conducted under the same conditions. However, the test car braked under dry conditions, while the track for the test wheel was moistened as described above. The comparison of both test methods is shown in Figure 8.
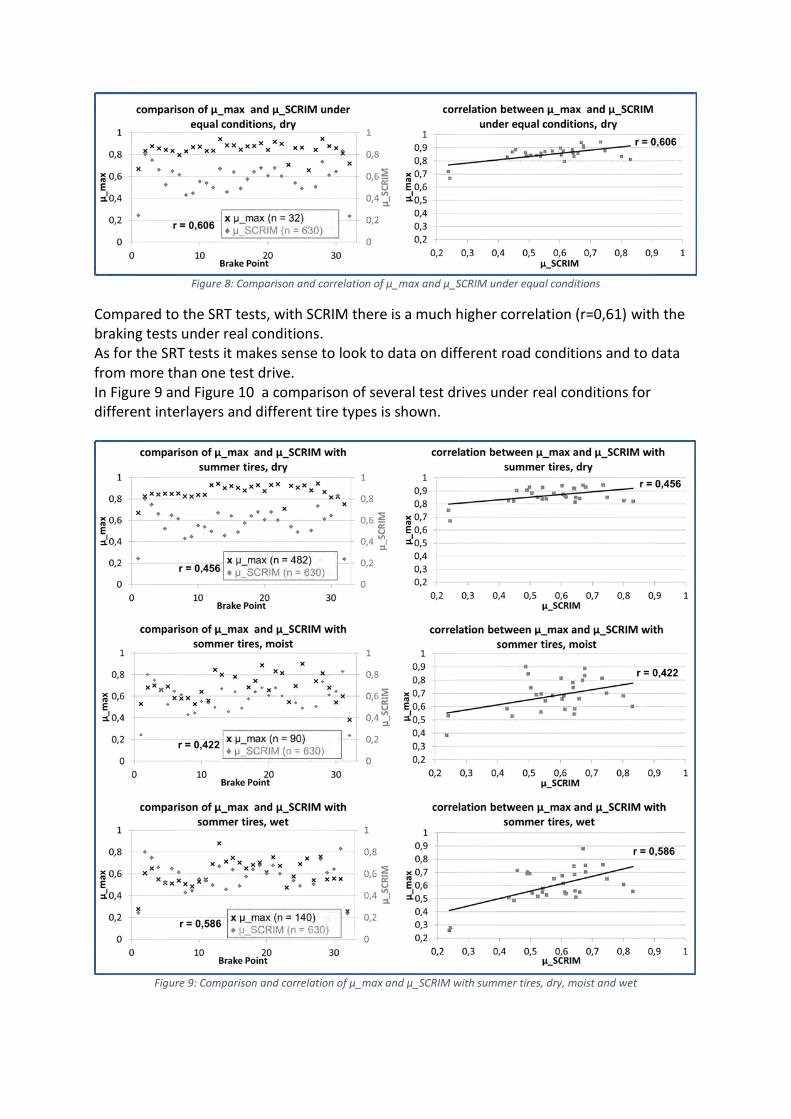
Figure 8: Comparison and correlation of µ_max and µ_SCRIM under equal conditions
Compared to the SRT tests, with SCRIM there is a much higher correlation (r=0,61) with the braking tests under real conditions. As for the SRT tests it makes sense to look to data on different road conditions and to data from more than one test drive. In Figure 9 and Figure 10 a comparison of several test drives under real conditions for different interlayers and different tire types is shown.
Figure 9: Comparison and correlation of µ_max and µ_SCRIM with summer tires, dry, moist and wet
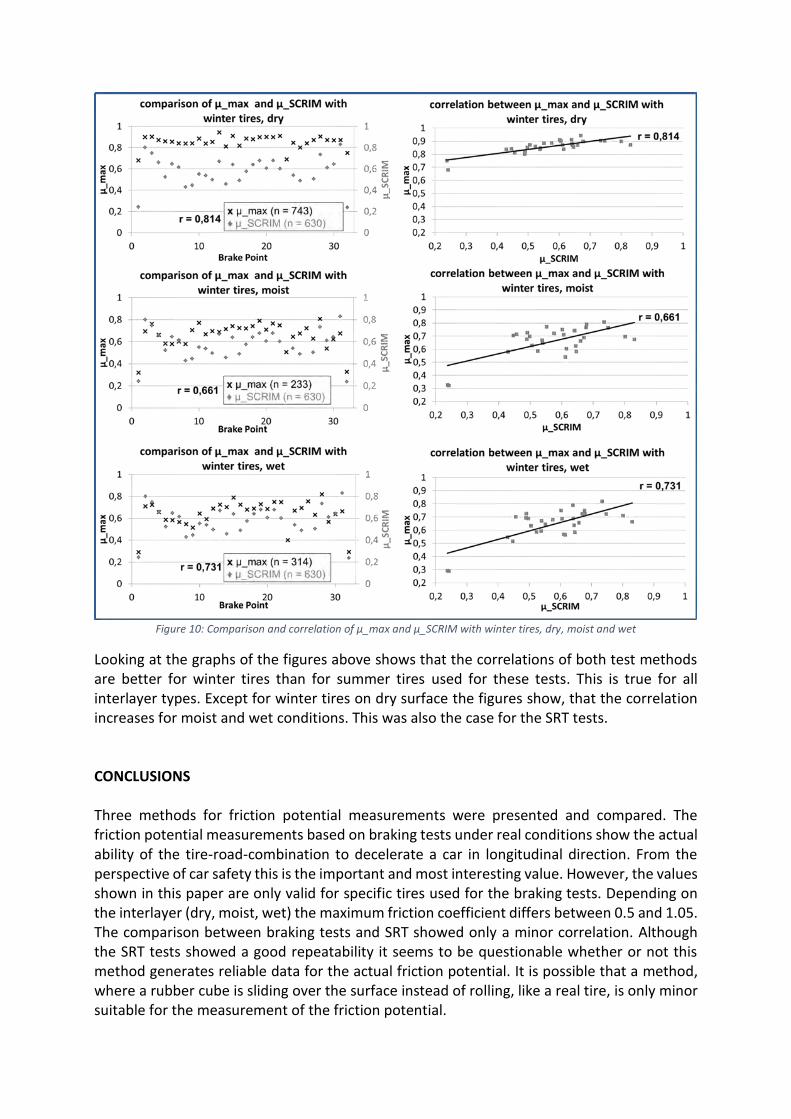
Figure 10: Comparison and correlation of µ_max and µ_SCRIM with winter tires, dry, moist and wet
Looking at the graphs of the figures above shows that the correlations of both test methods are better for winter tires than for summer tires used for these tests. This is true for all interlayer types. Except for winter tires on dry surface the figures show, that the correlation increases for moist and wet conditions. This was also the case for the SRT tests. CONCLUSIONS Three methods for friction potential measurements were presented and compared. The friction potential measurements based on braking tests under real conditions show the actual ability of the tire-road-combination to decelerate a car in longitudinal direction. From the perspective of car safety this is the important and most interesting value. However, the values shown in this paper are only valid for specific tires used for the braking tests. Depending on the interlayer (dry, moist, wet) the maximum friction coefficient differs between 0.5 and 1.05. The comparison between braking tests and SRT showed only a minor correlation. Although the SRT tests showed a good repeatability it seems to be questionable whether or not this method generates reliable data for the actual friction potential. It is possible that a method, where a rubber cube is sliding over the surface instead of rolling, like a real tire, is only minor suitable for the measurement of the friction potential.
In contrast, the SCRIM method showed a much better correlation with the braking tests. Especially for most of the moist and wet conditions and for winter tires correlations higher than 0.55 were achieved. However, this value is still defined as “medium correlation” [8] which means that tests with the SCRIM have only a “medium” reliability for the actual estimation of friction potential. It must be noted, that the SCRIM method was defined in the 70s. The test tire and its rubber compound were also defined at that time. It might be likely, that a more modern tire type would lead to better results. For the future it should be investigated how friction potential could be measured with new or modified standardized test procedures. REFERENCES [1] Müller, G. and S. Müller: Messung von Reibwerten unter Realbedingungen zur Erhöhung der Fahrzeugsicherheit:
10th VDI-Tagung Fahrzeugsicherheit 2.0, VDI-Berichte 2265; VDI Verlag GmbH; Düsseldorf 2015; ISBN: 978-3-18-
092265-2
[2] Müller, S., Uchanski, M. and K. Hedrick: Estimation of the maximum tire-road friction coefficient, JDSMC, 125(4), pp.
607-618, 2003.
[3] Breuer, B., Eichhorn, U. and J. Roth: Measurement of tyre/road friction ahead of the car and inside the tyre.
Proceedings of AVEC’92 (International Symposium on Advanced Vehicle Control), pages 347-353, 1992.
[4] Eichhorn, U. and J. Roth: Prediction and monitoring of tyre/road Friction. XXIV FISITA Congress, London, GB, 2:67-
74, June 7-11 1992. “Safety of the Vehicle and the Road”.
[5] Pasterkamp, W.; Pacejka, H.: Application of Neural Networks in the Estimation of Tire/Road Friction Using the Tire
as Sensor. SAE Technical Paper 971122, 1997, DOI: 10.4271/971122
[6] Überblick über die Griffigkeitsmessverfahren. Gütegemeinschaft Griffigkeitsmessungen e.V.; http://ggm-
ev.de/messverfahren/skm.php, Letzter Abruf: 19.01.2016
[7] Brückert M., Gauterin F. und H-J. Unrau: Untersuchung des Einflusses der Grobtextur auf Messergebnisse mit dem
SKM-Messverfahren. Berichte der Bundesanstalt für Straßenwesen. Karlsruher Institut für Technologie (KIT), 2012
[8] Bühl, A.: SPSS 14: Einführung in die moderne Datenanalyse, Pearson Studium, München
1
Analysis of Road Accident according to road Surface Condition
Jaehong Park*, Dukgeun Yun**
* Highway & Transportation Research Institute, Korea Institute of Civil Engineering and Building Technology, Korea,
** Highway & Transportation Research Institute, Korea Institute of Civil Engineering and Building Technology, Korea, Abstract In this study, the mean profile depth (MPD) that expresses roughness of road pavements was calculated using the road survey equipment vehicle and the calculated MPD was compared with the real number of traffic accidents. The analysis method used in this study was to classify the appropriate clustering in relation to traffic accidents using the K-means clustering and to compare this with the presence of traffic accidents via the MPDs to derive the result. K-means clustering was used in the analysis method and four clusters were found using the clustering analysis results. The center of each cluster was 0.627, 0.850, 1.118, and 1.237, respectively. The result of this study is expected to be utilized as foundational research in the traffic safety area. 1. BACKGROUND The road environment is divided into three factors: personal factor, road environmental factor, and vehicle factor. In relation to traffic accidents, personal, road environmental, and vehicle factors are known to contribute 93%, 34%, and 13% of traffic accident approximately. Among the three factors, the road environmental factor affects traffic accidents via geometric road structure and damage or defects of road (safety) facilities. In appropriate road environmental factors can jeopardy the balance between driver and vehicle thereby causing a risk factor to traffic safety. Furthermore, a condition of road pavements can also be highly important to influence traffic accidents. In particular, a relationship of road pavement conditions with traffic accidents can be meaningful and ensuring a friction factor at the same road condition is highly important. However, in-depth studies on the relationship with real accidents revealed that not only the friction factor but also degrading road safety due to rutting or pothole as well as crack on the road pavements can increase the severity of traffic accident significantly. A change in road pavement surface can be caused by heavy vehicle traffic and poor quality of mixtures. The change in pavement surface not only increases a risk of accidents as it can prevent safety vehicle driving due to inadequate draining during rainfall but also degrade skid resistance significantly due to standing water in the road, resulting in hydroplaning and making vehicle steering difficult to increase a risk of accidents. The analysis on the traffic accidents for three years (2010–2012) showed that fatality of traffic accidents was 2.7, which was higher than that of total traffic accidents (2.4). This result explains that severity of rain-related traffic is very high. Moreover, standing water in the road which occurs more often due to the climate change around the world can cause frost roads (in particular, tunnel connecting parts or shaded area in bridges) in winter thereby becoming a cause of hindrance to traffic safety. In this study, the mean profile depth (MPD) that expresses roughness of road pavements was calculated using the road survey equipment vehicle and the calculated MPD was compared with the real number of traffic accidents. The MPD is an index to indicate a state of the road surface and roughness of the road surface can be found through the comparison of MPDs. The analysis method used in this study was to classify the appropriate clustering in relation to traffic accidents using the K-means clustering and to compare this with the presence of traffic accidents via the MPDs to derive the result.
2
2. LITERATURE REVIEW In this chapter, road surface-related studies performed in Korea and other nations were reviewed. Korea Institute of Civil Engineering and Building Technology (1997) identified a correlation between standing water in the road and skid resistance and hydroplaning according to road conditions and skid resistance was reduced as a vehicle speed increased at wet road conditions due to rainfall [1]. Chan et al. performed a study on analysis on effects between asphalt road condition and traffic accidents utilizing the pavement management system (PMS) data. They utilized the negative binomial model for the analysis and reported that there was a correlation of traffic accidents with the number of total traffic accidents, daytime driving, good weather condition, and traffic peak hour ratio when a model using plastic deformation was applied [2]. Kwon (2009) reported that a grade of road pavement was closely related to traffic accidents and analyzed that a traffic accident rate was up to 25 times difference due to the pavement grade. He also analyzed the importance of the factors in the Fish-Bone and structural equation model thereby verifying that plastic deformation and misalignment were the main factors of standing water in the road [3]. The Korea Expressway Corporation (2004) reported that vulnerable areas of standing water and road drainage were main reasons for vulnerability due to superelevation runoff among the geometric structural causes in expressways in Korea and traffic accidents occurred frequently due to the poor drainage when 0.3–0.5% of the minimum vertical gradient was applied at a section where a superelevation was 0% [4]. Hankook Tire (2000) reported that when hydroplaning occurred, tires in the axes where driving force was not transferred experienced deceleration of rotational speed due to the resistance with water and the driving axle was in idling state, resulting in vehicle driving with only inertial force and a loss of breaking function as well as motion function of tires thereby leading to lost control of vehicle. The company suggested that the minimum depth of water was 2.5 mm–10.0 mm although it varied according to tire speed, a level of wear, and roughness of the road surface [5]. 3. RESEARCH OVERVIEW 3.1. Process for Research The analysis process in this study is shown in Figure 1.
Selection of target area
↓
Inspection on road surface (standing water area, MPD)
↓
Standing water area, MPD calculation, accident probability calculation
↓
Clustering (Ward, K-means)
↓
Final outcome
Figure 1. Analysis Methodology
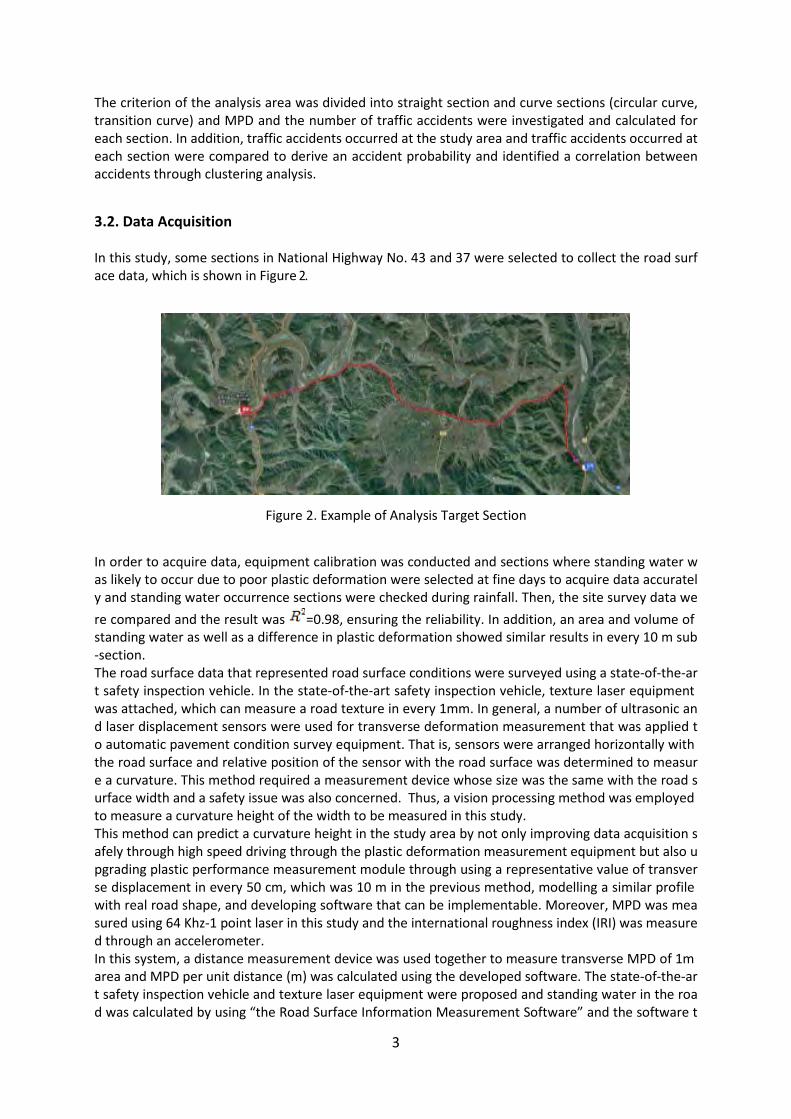
3
The criterion of the analysis area was divided into straight section and curve sections (circular curve, transition curve) and MPD and the number of traffic accidents were investigated and calculated for each section. In addition, traffic accidents occurred at the study area and traffic accidents occurred at each section were compared to derive an accident probability and identified a correlation between accidents through clustering analysis.
3.2. Data Acquisition In this study, some sections in National Highway No. 43 and 37 were selected to collect the road surface data, which is shown in Figure 2.
Figure 2. Example of Analysis Target Section
In order to acquire data, equipment calibration was conducted and sections where standing water was likely to occur due to poor plastic deformation were selected at fine days to acquire data accurately and standing water occurrence sections were checked during rainfall. Then, the site survey data were compared and the result was =0.98, ensuring the reliability. In addition, an area and volume of standing water as well as a difference in plastic deformation showed similar results in every 10 m sub-section. The road surface data that represented road surface conditions were surveyed using a state-of-the-art safety inspection vehicle. In the state-of-the-art safety inspection vehicle, texture laser equipment was attached, which can measure a road texture in every 1mm. In general, a number of ultrasonic and laser displacement sensors were used for transverse deformation measurement that was applied to automatic pavement condition survey equipment. That is, sensors were arranged horizontally with the road surface and relative position of the sensor with the road surface was determined to measure a curvature. This method required a measurement device whose size was the same with the road surface width and a safety issue was also concerned. Thus, a vision processing method was employed to measure a curvature height of the width to be measured in this study. This method can predict a curvature height in the study area by not only improving data acquisition safely through high speed driving through the plastic deformation measurement equipment but also upgrading plastic performance measurement module through using a representative value of transverse displacement in every 50 cm, which was 10 m in the previous method, modelling a similar profile with real road shape, and developing software that can be implementable. Moreover, MPD was measured using 64 Khz-1 point laser in this study and the international roughness index (IRI) was measured through an accelerometer. In this system, a distance measurement device was used together to measure transverse MPD of 1m area and MPD per unit distance (m) was calculated using the developed software. The state-of-the-art safety inspection vehicle and texture laser equipment were proposed and standing water in the road was calculated by using “the Road Surface Information Measurement Software” and the software t
4
hat calculates the MPD values in real time is shown in Figure 3 and Figure 4.
Figure 3. Configuration of the Road Surface Information Measurement Software
Figure 4. Example of Calculation with Road Surface Analysis Software
3.3. Methodology for Research In general, International Friction Index (IFI) is used to calculate the skid number (SN) but in this study, it was used to match the MPD value and accidents in every subsection. The MPD can be used to determine material separation of aggregates during paving but it can be also used to calculate the IFI, which is a new index to measure a friction of pavement in recent years ((It is an international safety evaluation index that is measured by considering micro and macro texture for accurate safety evaluation by the Permanent International Association of Road Congresses (PIARC)). The MPD in every subsection was surveyed using the road surface measurement equipment-mounted vehicle. The MPD is one of the factors that evaluate macro textures. The MPD is calculated by averaging the first highest value (Peak Level 1st) in the first 50 mm section in the unit section and the highest value (Peak level 2nd) in the second 50 mm section after measuring a profile depth as shown in the figure via the macro texture data measured in every 1 mm gap and then a mean profile depth is cal
5
culated by calculating a difference between the profile mean within 100 mm in the total unit section and a mean value of the two highest values. Eq. (1) shows this measurement equation.
[1]
MPD : Average Profile Depth P.L 1st : The High Value at 1st 50mm Section P.L 2nd : The High Value at 2nd 50mm Section A.L : Average Profile at 100mm
In addition, hierarchical clustering analysis and non-hierarchical clustering analysis were used to analyze the MPD setup statistically. The hierarchical clustering analysis produced bendrogram. This was analyzed by applying a member cluster of K-means, which was a non-hierarchical clustering method.
4. ANALYSIS RESULT The geometric structure of National Highway No. 24 and Local Road No. 897 was divided into circular curve and tangent curve using the state-of-the-art safety inspection vehicle. The MPD calculation results are summarized in Table 1. The circular curve and tangent curve sections were divided into 27 sections and the maximum and minimum values of the MPD after the analysis were 1.366 and 0.497 and a mean MPD was 0.907. Moreover, a probability in each section was revealed and the accident probability maximum was 0.185 and the minimum was 0.000 in the analyzed section.
Table 1. Result of MPD calculation by geometric structure
MPD P(A) MPD P(A) Circular Curve 1 0.760 0.000 Tangent Curve 1 0.564 0.074 Circular Curve 2 1.128 0.000 Tangent Curve 2 0.497 0.000 Circular Curve 3 0.942 0.037 Tangent Curve 3 0.585 0.000 Circular Curve 4 0.750 0.111 Tangent Curve 4 0.571 0.185 Circular Curve 5 0.706 0.000 Tangent Curve 5 0.596 0.000 Circular Curve 6 0.652 0.000 Tangent Curve 6 0.560 0.000 Circular Curve 7 0.643 0.000 Tangent Curve 7 0.713 0.074 Circular Curve 8 0.758 0.000 Tangent Curve 8 0.691 0.000 Circular Curve 9 0.788 0.037 Tangent Curve 9 0.821 0.000
Circular Curve 10 0.647 0.074 Tangent Curve 10 0.707 0.000 Circular Curve 11 0.873 0.111 Tangent Curve 11 0.930 0.000 Circular Curve 12 0.658 0.037 Tangent Curve 12 0.664 0.000 Circular Curve 13 0.641 0.037 Tangent Curve 13 0.592 0.000 Circular Curve 14 0.933 0.000 Tangent Curve 14 1.160 0.000 Circular Curve 15 1.044 0.000 Tangent Curve 15 0.921 0.074 Circular Curve 16 0.842 0.037 Tangent Curve 16 0.602 0.000 Circular Curve 17 1.084 0.000 Tangent Curve 17 1.148 0.000 Circular Curve 18 0.970 0.000 Tangent Curve 18 1.012 0.000 Circular Curve 19 0.758 0.000 Tangent Curve 19 1.188 0.037

6
MPD P(A) MPD P(A) Circular Curve 20 1.192 0.000 Tangent Curve 20 1.266 0.000 Circular Curve 21 1.222 0.037 Tangent Curve 21 1.212 0.000 Circular Curve 22 1.156 0.000 Tangent Curve 22 1.168 0.000 Circular Curve 23 1.366 0.000 Tangent Curve 23 1.139 0.000 Circular Curve 24 1.276 0.000 Tangent Curve 24 1.224 0.000 Circular Curve 25 1.227 0.000 Tangent Curve 25 1.061 0.000 Circular Curve 26 1.170 0.000 Tangent Curve 26 0.855 0.000 Circular Curve 27 1.139 0.037 Tangent Curve 27 1.199 0.000
The MPD calculation results were analyzed using the clustering analysis so that four groups were made. The bendrogram according to clustering is shown in Figure 5.
Figure 5. Bendrogram In addition, Tables 2, 3, and 4 present the analysis results determined by the number of clustering in the K-means for four clusters derived by the hierarchical clustering method. The number of clustering was four and the number of members in each cluster was 18, 10, 14, and 12, respectively. The center of the cluster was as follows: 0.627 for clustering 1, 1.237 for clustering 2, 0.850 for clustering 3, and 1.118 for clustering 4. The accident probability for each cluster was 0.027, 0.007, 0.029, and 0.003, respectively. The result showed that the larger the MPD on the basis of the center of the cluster, the more the accident likely to occur.
Table 2. Result of clustering analysis
Clustering
1 2 3 4
MPD 0.627 1.237 0.850 1.118
7
P(A) 0.027 0.007 0.029 0.003
Table 3. Final distance between clustering center
Clustering 1 2 3 4
1 - 0.610 0.223 0.491
2 0.610 - 0.388 0.120
3 0.223 0.388 - 0.269
4 0.491 0.120 0.269 -
Table 4. Number of cases in each cluster
Clustering
1 18.000
2 10.000
3 14.000
4 12.000
5. CONCLUSION AND FUTURE RESEARCH
The road environment is divided into three factors: personal factor, road environmental factor, and vehicle factor. In relation to traffic accidents, personal, road environmental, and vehicle factors are known to contribute 93%, 34%, and 13% of traffic accident approximately. In this study, analysis on environmental factor and traffic accidents was conducted among the three factors. In particular, in this study, a correlation between road surface condition and accidents was analyzed using the MPD, which represented the roughness of road surface, in order to analyze a relationship between road surface and traffic accident. The study on road surface was analyzed using a state-of-the-art safety inspection vehicle and an accident probability was analyzed through matching with real accidents. K-means clustering was used in the analysis method and four clusters were found using the clustering analysis results. The center of each cluster was 0.627, 0.850, 1.118, and 1.237, respectively. The comparison result of accident probability according to the center of the cluster showed that the larger the MPD on the basis of the center of the cluster, the more the accident likely to occur. In order to advance the study result, the following contents shall be complemented. First, additional analysis is needed to collect data from various road sections through additional survey on the study area. Second, it is necessary to add research that identifies a relationship of accidents under various conditions by adding more variables that represent the road surface conditions. The result of this study is expected to be utilized as foundational research in the traffic safety area.
REFERENCES Korea Institute of Civil Engineering and Building Technology, A Study on Side Friction Factor and Radius of curve, 1997 Chun Yip Chan, Baoshan Huang, Xuedong Yan, Stephen Richards, Effect of Asphalt Pavement Conditions on Traffic Accidents in Tennessee Utilizing Pavement Management System(PMS), Southeastern Transportation Center, University of Tennessee,

8
2008 Jaesuk Kwon, An analysis of factors affecting water-resovoir phenomenon in rainy situation on highway, Hanyang Univ. Master’s degree, 2009 Korea Expressway Corporation, Establishing criteria for evaluation of distress and safety on pavements, 2004 Hankook Tire, Tire hydroplaning, 2000
Proposed ESAR Paper: Motorcyclist Post Impact Trajectory Analysis Authors: Michael S. Varat, Principal Scientist Stein E. Husher, Principal Scientist KEVA Engineering, LLC 840 Calle Plano Camarillo, CA 93012 Phone: (805)388-6016 Facsimile: (805)388-6046 [email protected] [email protected] ABSTRACT: Powered Two Wheeler (Motorcycle) crashes are overrepresented in EU, England, and United States casualty statistics for both fatal and serious injuries. While regional geographic differences are evident for motorcycle size, type, and engine displacement, the casualty statistics consistently indicate significantly higher injury rates for all motorcycle riders when compared to car occupants. Accident analysis and reconstruction of these motorcycle crashes is a necessary process to gain further understanding of potential injury mitigation strategies. This paper focuses on the analysis of the rider post impact trajectory in the immediate moments following a crash. The rider and motorcycle, while loosely coupled by seating position leading up to a crash, quickly decouple as the crash forces develop. As a result, the rider moves relative to the motorcycle and relative to the collision partner. This movement, or trajectory, is primarily influenced by the type and configuration of the impact, the type and configuration of the motorcycle and collision partner, and the speeds involved. Understanding the rider’s post impact trajectory will assist in the development of injury mitigation strategies. Both the free flight trajectory of the rider and the rider’s trajectory as influenced by interaction with the motorcycle and collision partner are examined. Rider trajectories in full scale crash testing and real world motorcycle crashes are both studied and presented. The resulting physical evidence that can be observed by an accident analyst is discussed. The application of projectile motion physics is analyzed and the necessary input parameters, such as initial launch angle, are studied. This study will assist in understanding the post-impact dynamics of a motorcyclist, and will provide useful information to analysts evaluating real world crashes.
Identifying conflict clusters of cyclists at a roundabout by automated traffic surveillance
H Saul, M Junghans and R Hoffmann*
*Institute of Transportation Systems, German Aerospace Center (DLR), Rutherfordstr. 2, 12489 Berlin, Germany
Abstract Cyclists are more likely to be injured in fatal crashes than motorised vehicles. To gain detailed and precise behav-ioural data of road users, i.e. trajectories, a measuring campaign was conducted. Therefore, a black-spot for accidents with cyclists in Berlin, Germany was selected. The traffic has been detected by a fully automated traffic video analysis system continuously for twelve hours. The video surveillance system is capable of automatically extracting trajectories, classifying road user types and precise determining and positioning of conflicts and accidents. Additionally, pre-conflict and pre-accident situations could be analysed to provide further in-depth understanding of accident causation. The evaluation of the measuring campaign comprised the investigation of traffic parameters, e.g. traffic flow, as well as traffic-safety related parameters based on Surrogate Safety Measures (SSM). Furthermore, the spatial and temporal distributions of conflicts involving cyclists were determined. As a result, three possible conflict clusters could be identified, of which one cluster could be confirmed by detailed video analysis, showing conflicts caused by right turning vehicles. NOTATION bmax Maximum Braking Deceleration C2C Car to Car Communication C2I Car to Infrastructure Communication DLR German Aerospace Center DRAC Deceleration Rate to Avoid Crash MV Motorised Vehicle PDM Probability Density Map SOFM Self-organising Feature Map SSM Surrogate Safety Measures TCT Traffic Conflict Technique TTC Time to Collision VRU Vulnerable Road User INTRODUCTION The number of cyclists in urban areas of Germany is rising. Rethinking in transport mode selection leads to a changing modal split as well as new road safety challenges. The number of accidents in-volving cyclists has been steadily increasing within the last years. In Berlin 7,699 accidents involving cyclists were reported in 2014 (+10.7% compared to 2013). Thereof 639 cyclists were seriously in-jured (+1.3% compared to 2013) and 12 cyclists died. The high vulnerability is reflected in a high crash severity: almost one out of four road fatalities in Berlin was a cyclist and 72.1% of all accidents involving cyclists resulted in physical injuries. Responsibility for 42.1% of cycling accidents laid at the driver’s door. 49.1% of cycling accidents have been caused by cyclists. The main causes for accidents caused by cyclists were (i) use of wrong lane, (ii) insufficient safety distance, (iii) wrong behaviour when entering the traffic flow and (iv) inadequate speeds. The main causes for accidents involving cyclists caused by car drivers were wrong behaviour when turning and entering the traffic flow as well as ignoring the right of way [1]. Accident data bases provide comprehensive information about cycling accidents. However, there is a lack of knowledge about safety related road user behaviour, particularly interactions between cy-clists and cyclists as well as between cyclists and other road users at particular places and conditions. Detailed knowledge in this regard is expected to improve the identification of systematic deficits in road design, traffic control, road surface markings and other factors. In addition, not much is known
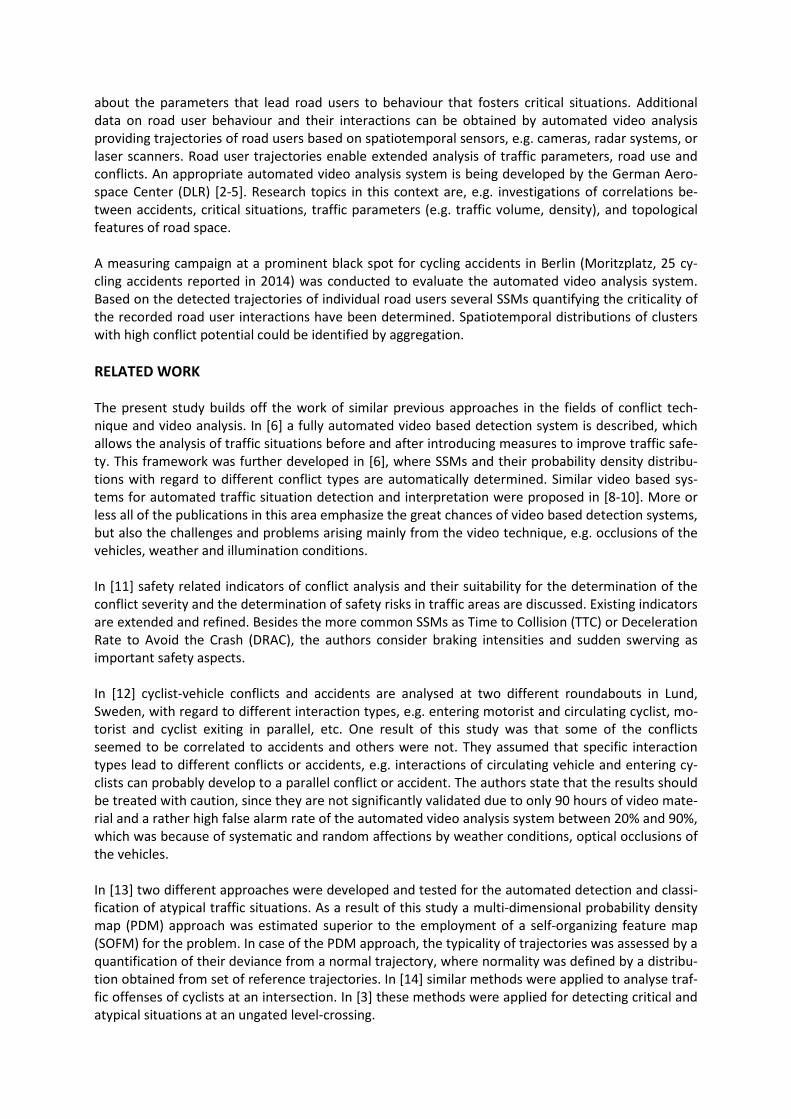
about the parameters that lead road users to behaviour that fosters critical situations. Additional data on road user behaviour and their interactions can be obtained by automated video analysis providing trajectories of road users based on spatiotemporal sensors, e.g. cameras, radar systems, or laser scanners. Road user trajectories enable extended analysis of traffic parameters, road use and conflicts. An appropriate automated video analysis system is being developed by the German Aero-space Center (DLR) [2-5]. Research topics in this context are, e.g. investigations of correlations be-tween accidents, critical situations, traffic parameters (e.g. traffic volume, density), and topological features of road space. A measuring campaign at a prominent black spot for cycling accidents in Berlin (Moritzplatz, 25 cy-cling accidents reported in 2014) was conducted to evaluate the automated video analysis system. Based on the detected trajectories of individual road users several SSMs quantifying the criticality of the recorded road user interactions have been determined. Spatiotemporal distributions of clusters with high conflict potential could be identified by aggregation. RELATED WORK The present study builds off the work of similar previous approaches in the fields of conflict tech-nique and video analysis. In [6] a fully automated video based detection system is described, which allows the analysis of traffic situations before and after introducing measures to improve traffic safe-ty. This framework was further developed in [6], where SSMs and their probability density distribu-tions with regard to different conflict types are automatically determined. Similar video based sys-tems for automated traffic situation detection and interpretation were proposed in [8-10]. More or less all of the publications in this area emphasize the great chances of video based detection systems, but also the challenges and problems arising mainly from the video technique, e.g. occlusions of the vehicles, weather and illumination conditions. In [11] safety related indicators of conflict analysis and their suitability for the determination of the conflict severity and the determination of safety risks in traffic areas are discussed. Existing indicators are extended and refined. Besides the more common SSMs as Time to Collision (TTC) or Deceleration Rate to Avoid the Crash (DRAC), the authors consider braking intensities and sudden swerving as important safety aspects. In [12] cyclist-vehicle conflicts and accidents are analysed at two different roundabouts in Lund, Sweden, with regard to different interaction types, e.g. entering motorist and circulating cyclist, mo-torist and cyclist exiting in parallel, etc. One result of this study was that some of the conflicts seemed to be correlated to accidents and others were not. They assumed that specific interaction types lead to different conflicts or accidents, e.g. interactions of circulating vehicle and entering cy-clists can probably develop to a parallel conflict or accident. The authors state that the results should be treated with caution, since they are not significantly validated due to only 90 hours of video mate-rial and a rather high false alarm rate of the automated video analysis system between 20% and 90%, which was because of systematic and random affections by weather conditions, optical occlusions of the vehicles. In [13] two different approaches were developed and tested for the automated detection and classi-fication of atypical traffic situations. As a result of this study a multi-dimensional probability density map (PDM) approach was estimated superior to the employment of a self-organizing feature map (SOFM) for the problem. In case of the PDM approach, the typicality of trajectories was assessed by a quantification of their deviance from a normal trajectory, where normality was defined by a distribu-tion obtained from set of reference trajectories. In [14] similar methods were applied to analyse traf-fic offenses of cyclists at an intersection. In [3] these methods were applied for detecting critical and atypical situations at an ungated level-crossing.
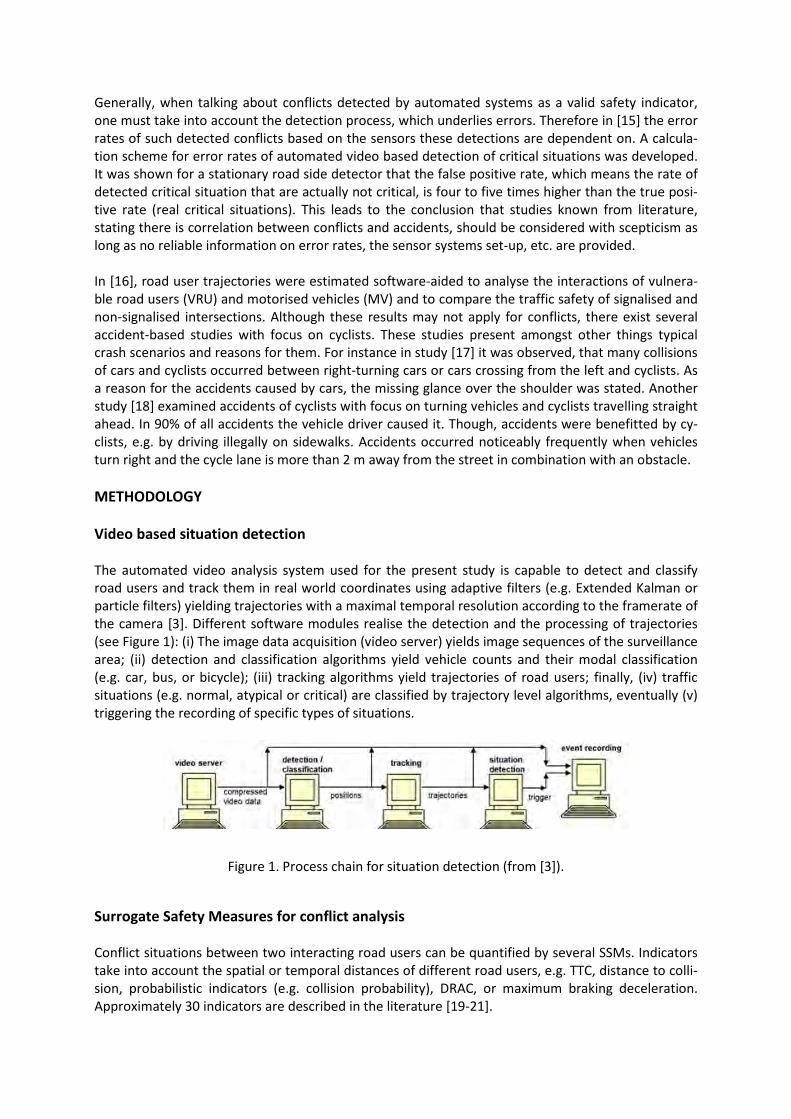
Generally, when talking about conflicts detected by automated systems as a valid safety indicator, one must take into account the detection process, which underlies errors. Therefore in [15] the error rates of such detected conflicts based on the sensors these detections are dependent on. A calcula-tion scheme for error rates of automated video based detection of critical situations was developed. It was shown for a stationary road side detector that the false positive rate, which means the rate of detected critical situation that are actually not critical, is four to five times higher than the true posi-tive rate (real critical situations). This leads to the conclusion that studies known from literature, stating there is correlation between conflicts and accidents, should be considered with scepticism as long as no reliable information on error rates, the sensor systems set-up, etc. are provided. In [16], road user trajectories were estimated software-aided to analyse the interactions of vulnera-ble road users (VRU) and motorised vehicles (MV) and to compare the traffic safety of signalised and non-signalised intersections. Although these results may not apply for conflicts, there exist several accident-based studies with focus on cyclists. These studies present amongst other things typical crash scenarios and reasons for them. For instance in study [17] it was observed, that many collisions of cars and cyclists occurred between right-turning cars or cars crossing from the left and cyclists. As a reason for the accidents caused by cars, the missing glance over the shoulder was stated. Another study [18] examined accidents of cyclists with focus on turning vehicles and cyclists travelling straight ahead. In 90% of all accidents the vehicle driver caused it. Though, accidents were benefitted by cy-clists, e.g. by driving illegally on sidewalks. Accidents occurred noticeably frequently when vehicles turn right and the cycle lane is more than 2 m away from the street in combination with an obstacle. METHODOLOGY Video based situation detection The automated video analysis system used for the present study is capable to detect and classify road users and track them in real world coordinates using adaptive filters (e.g. Extended Kalman or particle filters) yielding trajectories with a maximal temporal resolution according to the framerate of the camera [3]. Different software modules realise the detection and the processing of trajectories (see Figure 1): (i) The image data acquisition (video server) yields image sequences of the surveillance area; (ii) detection and classification algorithms yield vehicle counts and their modal classification (e.g. car, bus, or bicycle); (iii) tracking algorithms yield trajectories of road users; finally, (iv) traffic situations (e.g. normal, atypical or critical) are classified by trajectory level algorithms, eventually (v) triggering the recording of specific types of situations.
Figure 1. Process chain for situation detection (from [3]).
Surrogate Safety Measures for conflict analysis Conflict situations between two interacting road users can be quantified by several SSMs. Indicators take into account the spatial or temporal distances of different road users, e.g. TTC, distance to colli-sion, probabilistic indicators (e.g. collision probability), DRAC, or maximum braking deceleration. Approximately 30 indicators are described in the literature [19-21].
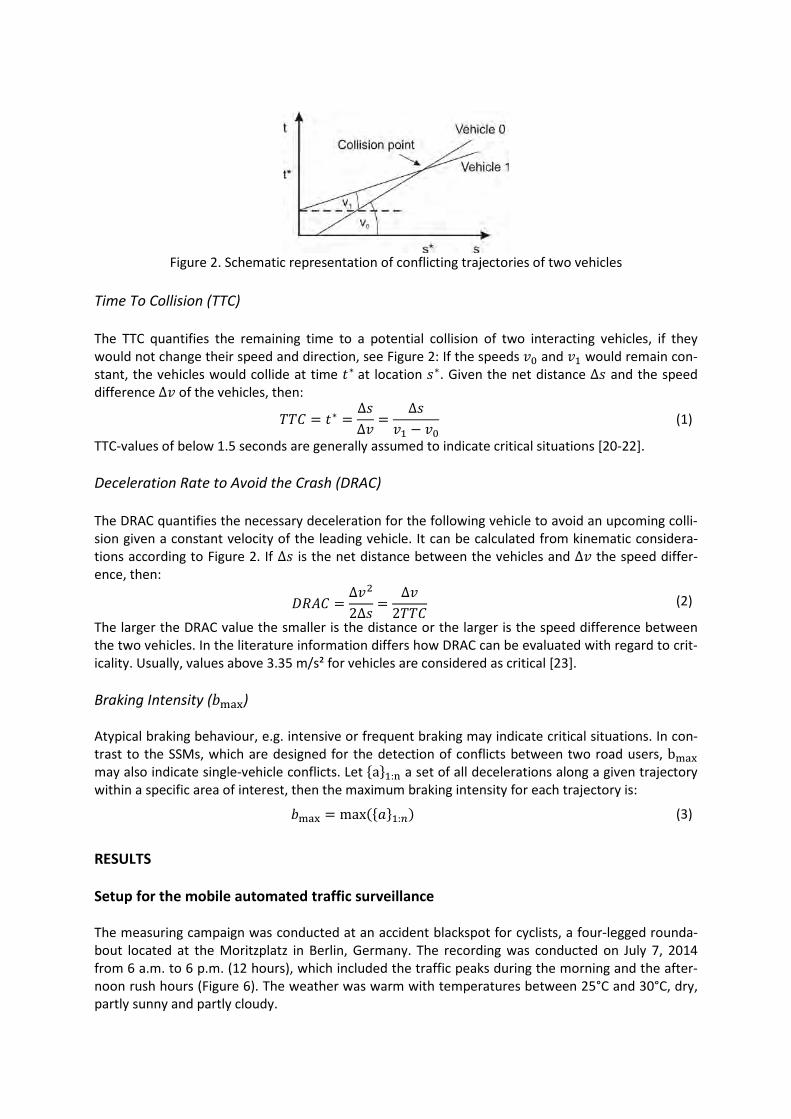
Figure 2. Schematic representation of conflicting trajectories of two vehicles
Time To Collision (TTC) The TTC quantifies the remaining time to a potential collision of two interacting vehicles, if they would not change their speed and direction, see Figure 2: If the speeds 𝑣0 and 𝑣1 would remain con-stant, the vehicles would collide at time 𝑡∗ at location 𝑠∗. Given the net distance Δ𝑠 and the speed difference Δ𝑣 of the vehicles, then:
𝑇𝑇𝑇 = 𝑡∗ =∆𝑠∆𝑣
=∆𝑠
𝑣1 − 𝑣0 (1)
TTC-values of below 1.5 seconds are generally assumed to indicate critical situations [20-22]. Deceleration Rate to Avoid the Crash (DRAC) The DRAC quantifies the necessary deceleration for the following vehicle to avoid an upcoming colli-sion given a constant velocity of the leading vehicle. It can be calculated from kinematic considera-tions according to Figure 2. If Δ𝑠 is the net distance between the vehicles and Δ𝑣 the speed differ-ence, then:
𝐷𝐷𝐷𝑇 =∆𝑣2
2∆𝑠=
Δ𝑣2𝑇𝑇𝑇
(2)
The larger the DRAC value the smaller is the distance or the larger is the speed difference between the two vehicles. In the literature information differs how DRAC can be evaluated with regard to crit-icality. Usually, values above 3.35 m/s² for vehicles are considered as critical [23]. Braking Intensity (𝑏max) Atypical braking behaviour, e.g. intensive or frequent braking may indicate critical situations. In con-trast to the SSMs, which are designed for the detection of conflicts between two road users, bmax may also indicate single-vehicle conflicts. Let {a}1:n a set of all decelerations along a given trajectory within a specific area of interest, then the maximum braking intensity for each trajectory is:
𝑏max = max({𝑎}1:𝑛) (3)
RESULTS Setup for the mobile automated traffic surveillance The measuring campaign was conducted at an accident blackspot for cyclists, a four-legged rounda-bout located at the Moritzplatz in Berlin, Germany. The recording was conducted on July 7, 2014 from 6 a.m. to 6 p.m. (12 hours), which included the traffic peaks during the morning and the after-noon rush hours (Figure 6). The weather was warm with temperatures between 25°C and 30°C, dry, partly sunny and partly cloudy.
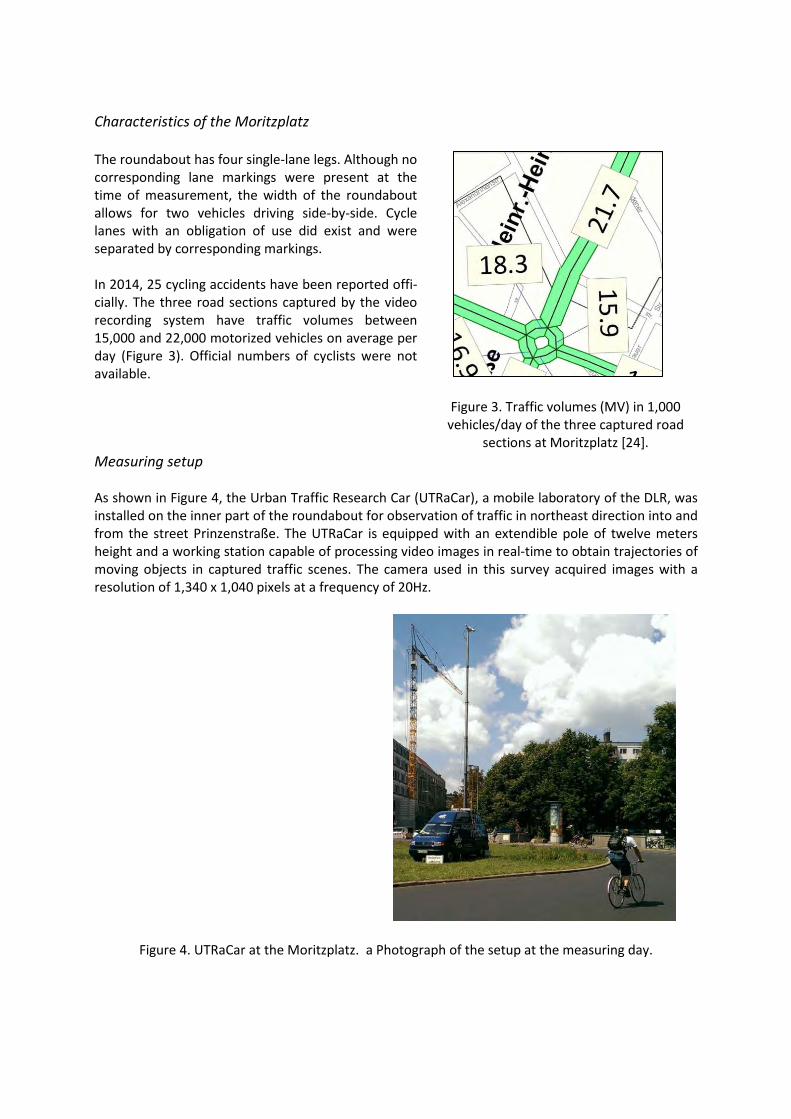
Characteristics of the Moritzplatz
The roundabout has four single-lane legs. Although no corresponding lane markings were present at the time of measurement, the width of the roundabout allows for two vehicles driving side-by-side. Cycle lanes with an obligation of use did exist and were separated by corresponding markings.
In 2014, 25 cycling accidents have been reported offi-cially. The three road sections captured by the video recording system have traffic volumes between 15,000 and 22,000 motorized vehicles on average per day (Figure 3). Official numbers of cyclists were not available.
Measuring setup
As shown in Figure 4, the Urban Traffic Research Car (UTRaCar), a mobile laboratory of the DLR, was installed on the inner part of the roundabout for observation of traffic in northeast direction into and from the street Prinzenstraße. The UTRaCar is equipped with an extendible pole of twelve meters height and a working station capable of processing video images in real-time to obtain trajectories of moving objects in captured traffic scenes. The camera used in this survey acquired images with a resolution of 1,340 x 1,040 pixels at a frequency of 20Hz.
Figure 4. UTRaCar at the Moritzplatz. a Photograph of the setup at the measuring day.
Figure 3. Traffic volumes (MV) in 1,000 vehicles/day of the three captured road
sections at Moritzplatz [24].
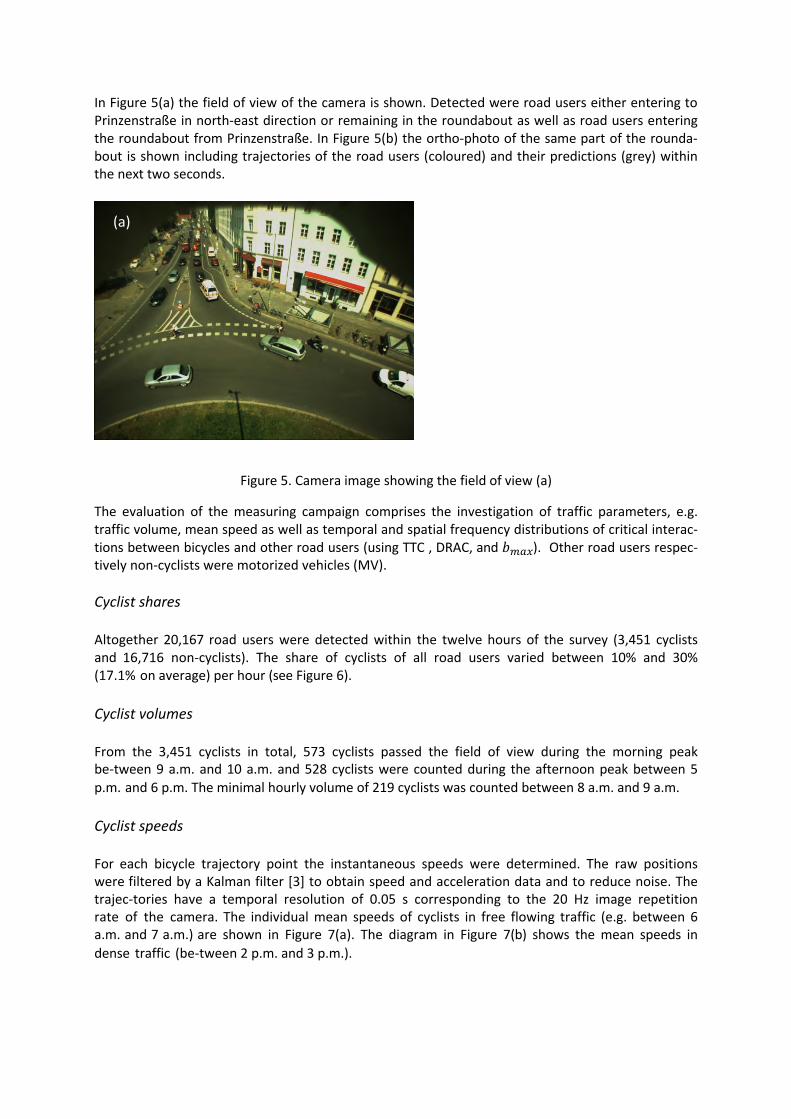
In Figure 5(a) the field of view of the camera is shown. Detected were road users either entering to Prinzenstraße in north-east direction or remaining in the roundabout as well as road users entering the roundabout from Prinzenstraße. In Figure 5(b) the ortho-photo of the same part of the rounda-bout is shown including trajectories of the road users (coloured) and their predictions (grey) within the next two seconds.
Figure 5. Camera image showing the field of view (a)
The evaluation of the measuring campaign comprises the investigation of traffic parameters, e.g. traffic volume, mean speed as well as temporal and spatial frequency distributions of critical interac-tions between bicycles and other road users (using TTC , DRAC, and 𝑏𝑚𝑚𝑚). Other road users respec-tively non-cyclists were motorized vehicles (MV).
Cyclist shares
Altogether 20,167 road users were detected within the twelve hours of the survey (3,451 cyclists and 16,716 non-cyclists). The share of cyclists of all road users varied between 10% and 30% (17.1% on average) per hour (see Figure 6).
Cyclist volumes
From the 3,451 cyclists in total, 573 cyclists passed the field of view during the morning peak be-tween 9 a.m. and 10 a.m. and 528 cyclists were counted during the afternoon peak between 5 p.m. and 6 p.m. The minimal hourly volume of 219 cyclists was counted between 8 a.m. and 9 a.m.
Cyclist speeds
For each bicycle trajectory point the instantaneous speeds were determined. The raw positions were filtered by a Kalman filter [3] to obtain speed and acceleration data and to reduce noise. The trajec-tories have a temporal resolution of 0.05 s corresponding to the 20 Hz image repetition rate of the camera. The individual mean speeds of cyclists in free flowing traffic (e.g. between 6 a.m. and 7 a.m.) are shown in Figure 7(a). The diagram in Figure 7(b) shows the mean speeds in dense traffic (be-tween 2 p.m. and 3 p.m.).
(a) (b)
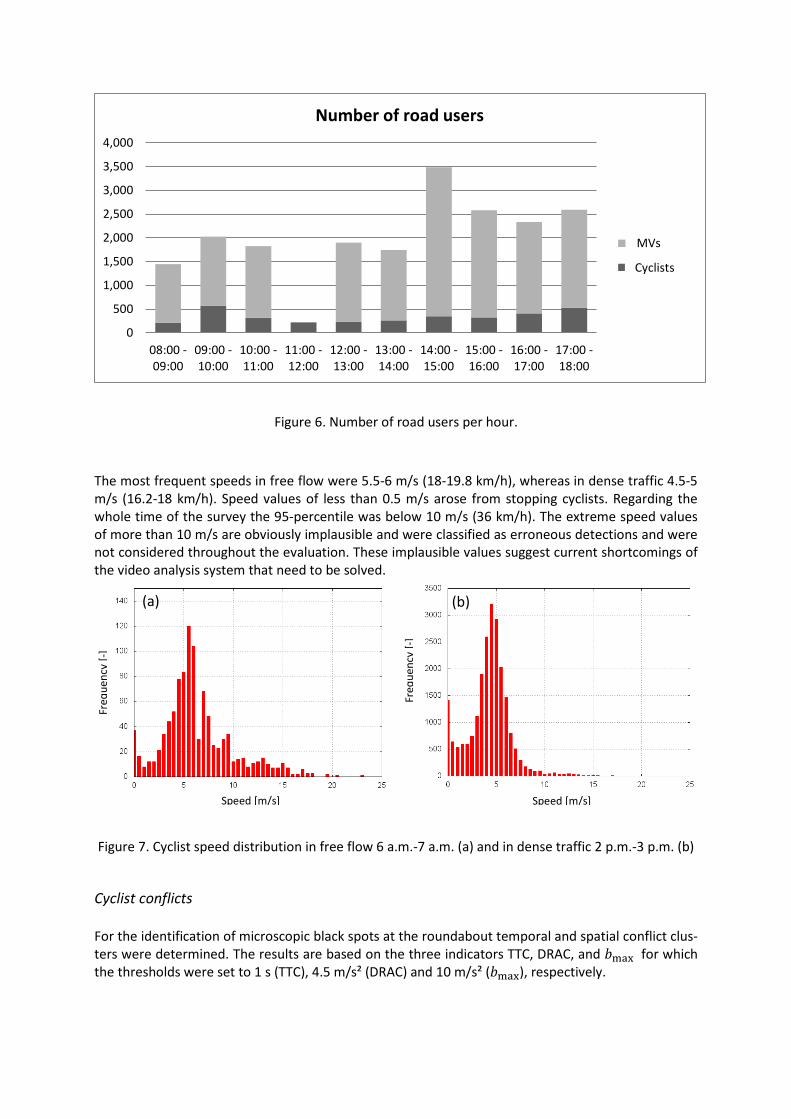
Figure 6. Number of road users per hour.
The most frequent speeds in free flow were 5.5-6 m/s (18-19.8 km/h), whereas in dense traffic 4.5-5 m/s (16.2-18 km/h). Speed values of less than 0.5 m/s arose from stopping cyclists. Regarding the whole time of the survey the 95-percentile was below 10 m/s (36 km/h). The extreme speed values of more than 10 m/s are obviously implausible and were classified as erroneous detections and were not considered throughout the evaluation. These implausible values suggest current shortcomings of the video analysis system that need to be solved.
Figure 7. Cyclist speed distribution in free flow 6 a.m.-7 a.m. (a) and in dense traffic 2 p.m.-3 p.m. (b)
Cyclist conflicts
For the identification of microscopic black spots at the roundabout temporal and spatial conflict clus-ters were determined. The results are based on the three indicators TTC, DRAC, and 𝑏max for which the thresholds were set to 1 s (TTC), 4.5 m/s² (DRAC) and 10 m/s² (𝑏max), respectively.
0
500
1,000
1,500
2,000
2,500
3,000
3,500
4,000
08:00 -09:00
09:00 -10:00
10:00 -11:00
11:00 -12:00
12:00 -13:00
13:00 -14:00
14:00 -15:00
15:00 -16:00
16:00 -17:00
17:00 -18:00
Number of road users
non-cyclists
cyclists
(b) (a)
MVs
Cyclists
Freq
uenc
y [-]
Freq
uenc
y [-]
Speed [m/s] Speed [m/s]
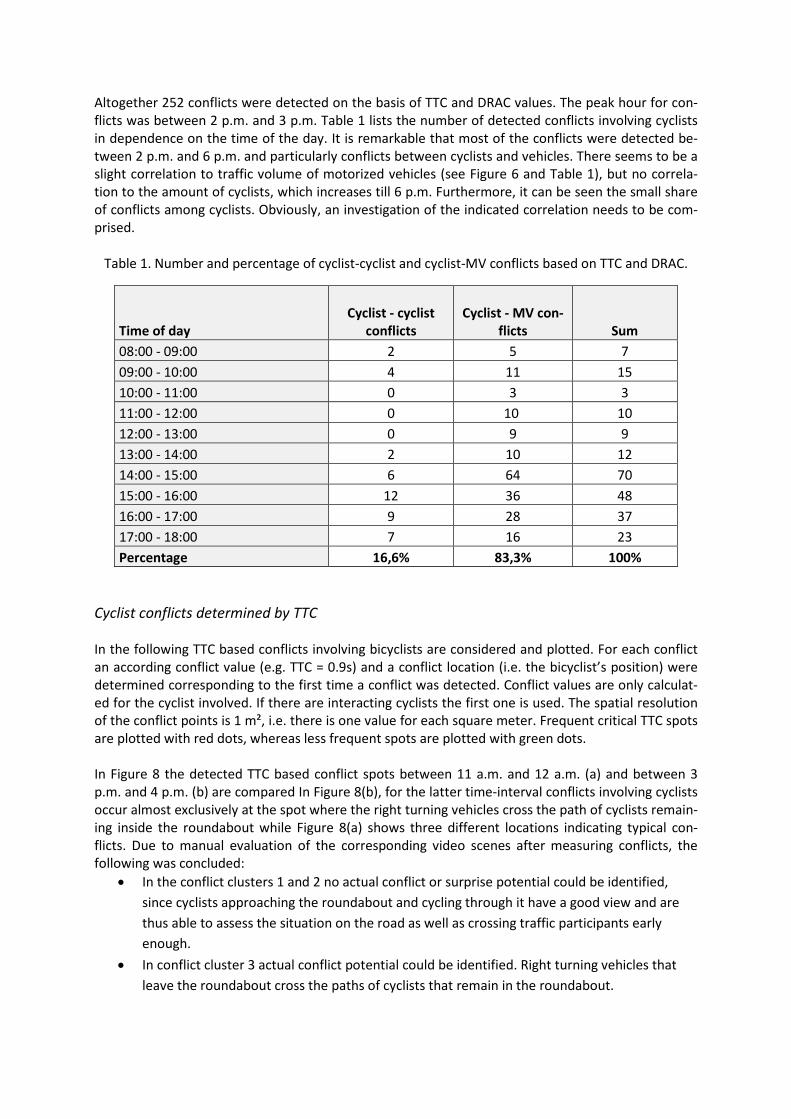
Altogether 252 conflicts were detected on the basis of TTC and DRAC values. The peak hour for con-flicts was between 2 p.m. and 3 p.m. Table 1 lists the number of detected conflicts involving cyclists in dependence on the time of the day. It is remarkable that most of the conflicts were detected be-tween 2 p.m. and 6 p.m. and particularly conflicts between cyclists and vehicles. There seems to be a slight correlation to traffic volume of motorized vehicles (see Figure 6 and Table 1), but no correla-tion to the amount of cyclists, which increases till 6 p.m. Furthermore, it can be seen the small share of conflicts among cyclists. Obviously, an investigation of the indicated correlation needs to be com-prised.
Table 1. Number and percentage of cyclist-cyclist and cyclist-MV conflicts based on TTC and DRAC.
Time of day Cyclist - cyclist
conflicts Cyclist - MV con-
flicts Sum 08:00 - 09:00 2 5 7 09:00 - 10:00 4 11 15 10:00 - 11:00 0 3 3 11:00 - 12:00 0 10 10 12:00 - 13:00 0 9 9 13:00 - 14:00 2 10 12 14:00 - 15:00 6 64 70 15:00 - 16:00 12 36 48 16:00 - 17:00 9 28 37 17:00 - 18:00 7 16 23 Percentage 16,6% 83,3% 100%
Cyclist conflicts determined by TTC
In the following TTC based conflicts involving bicyclists are considered and plotted. For each conflict an according conflict value (e.g. TTC = 0.9s) and a conflict location (i.e. the bicyclist’s position) were determined corresponding to the first time a conflict was detected. Conflict values are only calculat-ed for the cyclist involved. If there are interacting cyclists the first one is used. The spatial resolution of the conflict points is 1 m², i.e. there is one value for each square meter. Frequent critical TTC spots are plotted with red dots, whereas less frequent spots are plotted with green dots.
In Figure 8 the detected TTC based conflict spots between 11 a.m. and 12 a.m. (a) and between 3 p.m. and 4 p.m. (b) are compared In Figure 8(b), for the latter time-interval conflicts involving cyclistsoccur almost exclusively at the spot where the right turning vehicles cross the path of cyclists remain-ing inside the roundabout while Figure 8(a) shows three different locations indicating typical con-flicts. Due to manual evaluation of the corresponding video scenes after measuring conflicts, thefollowing was concluded:
• In the conflict clusters 1 and 2 no actual conflict or surprise potential could be identified,since cyclists approaching the roundabout and cycling through it have a good view and arethus able to assess the situation on the road as well as crossing traffic participants earlyenough.
• In conflict cluster 3 actual conflict potential could be identified. Right turning vehicles thatleave the roundabout cross the paths of cyclists that remain in the roundabout.
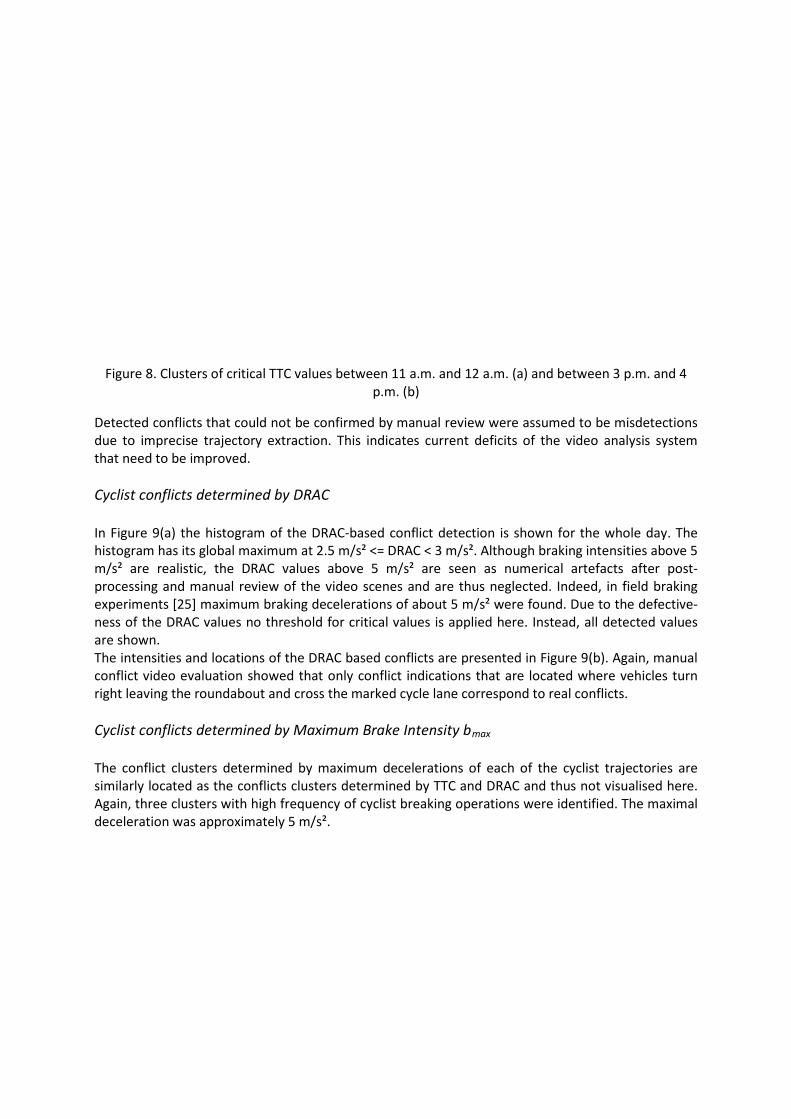
Figure 8. Clusters of critical TTC values between 11 a.m. and 12 a.m. (a) and between 3 p.m. and 4 p.m. (b)
Detected conflicts that could not be confirmed by manual review were assumed to be misdetections due to imprecise trajectory extraction. This indicates current deficits of the video analysis system that need to be improved.
Cyclist conflicts determined by DRAC
In Figure 9(a) the histogram of the DRAC-based conflict detection is shown for the whole day. The histogram has its global maximum at 2.5 m/s² <= DRAC < 3 m/s². Although braking intensities above 5 m/s² are realistic, the DRAC values above 5 m/s² are seen as numerical artefacts after post-processing and manual review of the video scenes and are thus neglected. Indeed, in field braking experiments [25] maximum braking decelerations of about 5 m/s² were found. Due to the defective-ness of the DRAC values no threshold for critical values is applied here. Instead, all detected values are shown. The intensities and locations of the DRAC based conflicts are presented in Figure 9(b). Again, manual conflict video evaluation showed that only conflict indications that are located where vehicles turn right leaving the roundabout and cross the marked cycle lane correspond to real conflicts.
Cyclist conflicts determined by Maximum Brake Intensity bmax
The conflict clusters determined by maximum decelerations of each of the cyclist trajectories are similarly located as the conflicts clusters determined by TTC and DRAC and thus not visualised here. Again, three clusters with high frequency of cyclist breaking operations were identified. The maximal deceleration was approximately 5 m/s².
(b) (a)
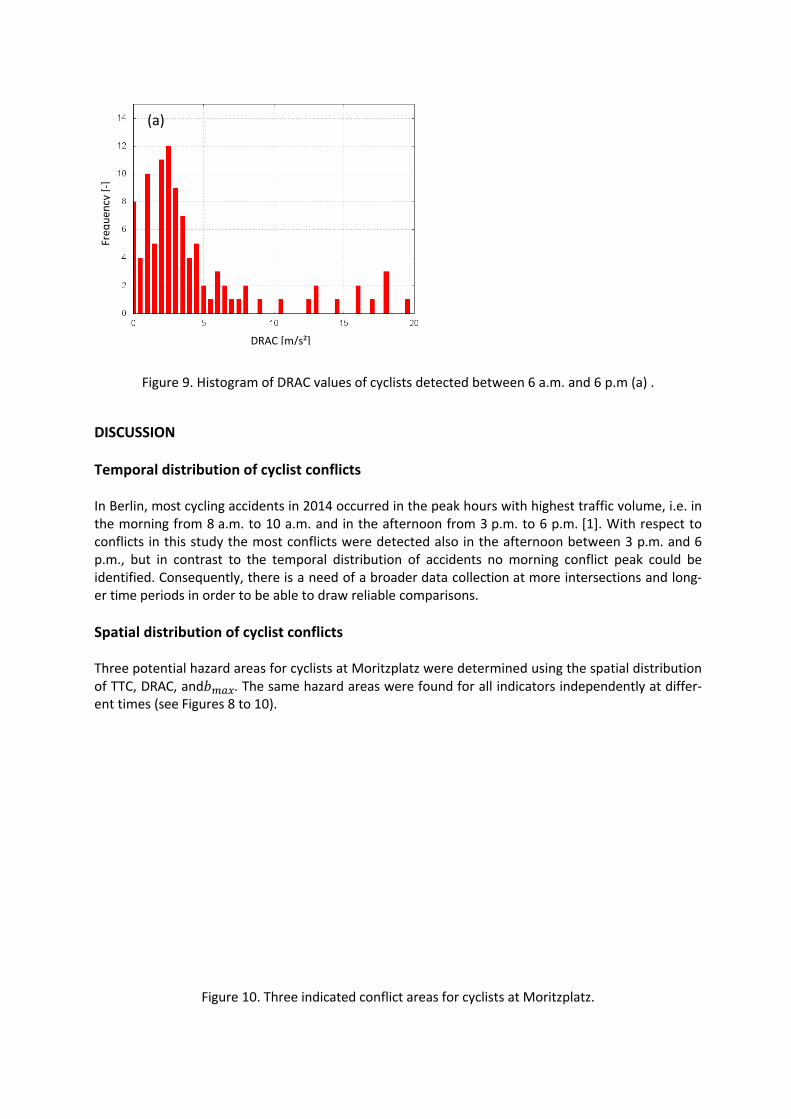
Figure 9. Histogram of DRAC values of cyclists detected between 6 a.m. and 6 p.m (a) .
DISCUSSION
Temporal distribution of cyclist conflicts
In Berlin, most cycling accidents in 2014 occurred in the peak hours with highest traffic volume, i.e. in the morning from 8 a.m. to 10 a.m. and in the afternoon from 3 p.m. to 6 p.m. [1]. With respect to conflicts in this study the most conflicts were detected also in the afternoon between 3 p.m. and 6 p.m., but in contrast to the temporal distribution of accidents no morning conflict peak could be identified. Consequently, there is a need of a broader data collection at more intersections and long-er time periods in order to be able to draw reliable comparisons.
Spatial distribution of cyclist conflicts
Three potential hazard areas for cyclists at Moritzplatz were determined using the spatial distribution of TTC, DRAC, and𝑏𝑚𝑚𝑚. The same hazard areas were found for all indicators independently at differ-ent times (see Figures 8 to 10).
Figure 10. Three indicated conflict areas for cyclists at Moritzplatz.
(b) (a)
Freq
uenc
y [-]
DRAC [m/s²]
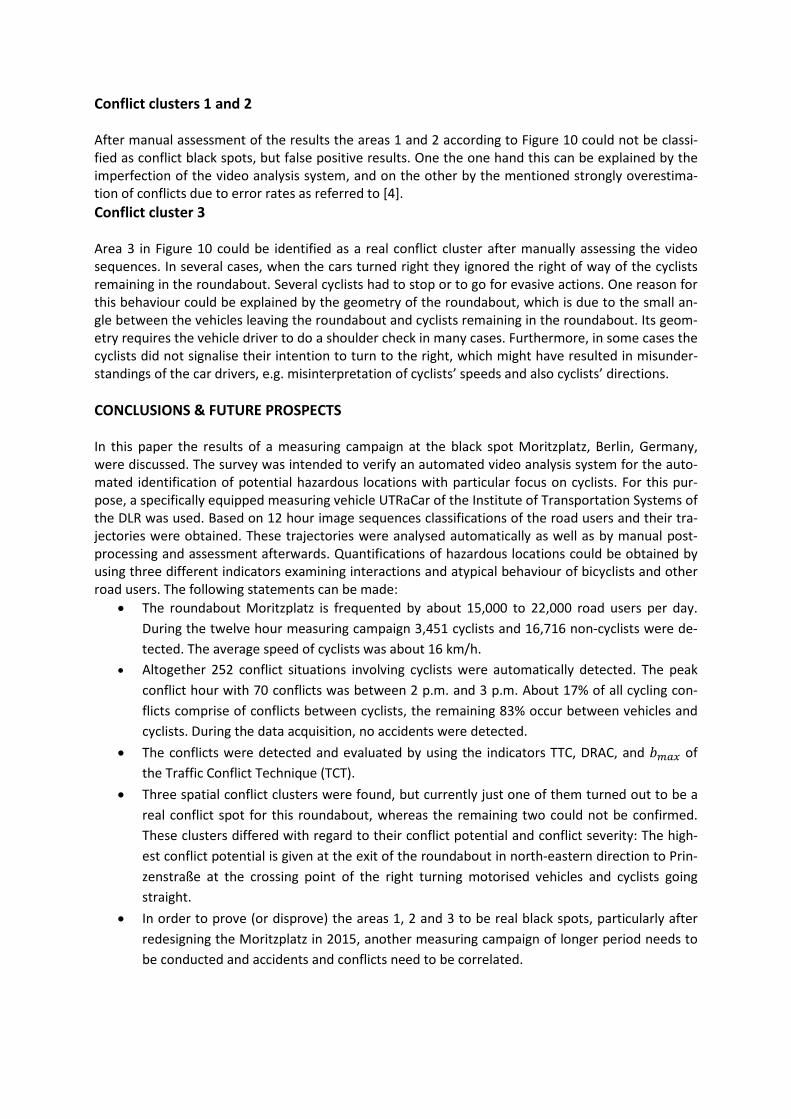
Conflict clusters 1 and 2
After manual assessment of the results the areas 1 and 2 according to Figure 10 could not be classi-fied as conflict black spots, but false positive results. One the one hand this can be explained by the imperfection of the video analysis system, and on the other by the mentioned strongly overestima-tion of conflicts due to error rates as referred to [4]. Conflict cluster 3
Area 3 in Figure 10 could be identified as a real conflict cluster after manually assessing the video sequences. In several cases, when the cars turned right they ignored the right of way of the cyclists remaining in the roundabout. Several cyclists had to stop or to go for evasive actions. One reason for this behaviour could be explained by the geometry of the roundabout, which is due to the small an-gle between the vehicles leaving the roundabout and cyclists remaining in the roundabout. Its geom-etry requires the vehicle driver to do a shoulder check in many cases. Furthermore, in some cases the cyclists did not signalise their intention to turn to the right, which might have resulted in misunder-standings of the car drivers, e.g. misinterpretation of cyclists’ speeds and also cyclists’ directions.
CONCLUSIONS & FUTURE PROSPECTS
In this paper the results of a measuring campaign at the black spot Moritzplatz, Berlin, Germany, were discussed. The survey was intended to verify an automated video analysis system for the auto-mated identification of potential hazardous locations with particular focus on cyclists. For this pur-pose, a specifically equipped measuring vehicle UTRaCar of the Institute of Transportation Systems of the DLR was used. Based on 12 hour image sequences classifications of the road users and their tra-jectories were obtained. These trajectories were analysed automatically as well as by manual post-processing and assessment afterwards. Quantifications of hazardous locations could be obtained by using three different indicators examining interactions and atypical behaviour of bicyclists and other road users. The following statements can be made:
• The roundabout Moritzplatz is frequented by about 15,000 to 22,000 road users per day.During the twelve hour measuring campaign 3,451 cyclists and 16,716 non-cyclists were de-tected. The average speed of cyclists was about 16 km/h.
• Altogether 252 conflict situations involving cyclists were automatically detected. The peakconflict hour with 70 conflicts was between 2 p.m. and 3 p.m. About 17% of all cycling con-flicts comprise of conflicts between cyclists, the remaining 83% occur between vehicles andcyclists. During the data acquisition, no accidents were detected.
• The conflicts were detected and evaluated by using the indicators TTC, DRAC, and 𝑏𝑚𝑚𝑚 ofthe Traffic Conflict Technique (TCT).
• Three spatial conflict clusters were found, but currently just one of them turned out to be areal conflict spot for this roundabout, whereas the remaining two could not be confirmed.These clusters differed with regard to their conflict potential and conflict severity: The high-est conflict potential is given at the exit of the roundabout in north-eastern direction to Prin-zenstraße at the crossing point of the right turning motorised vehicles and cyclists goingstraight.
• In order to prove (or disprove) the areas 1, 2 and 3 to be real black spots, particularly afterredesigning the Moritzplatz in 2015, another measuring campaign of longer period needs tobe conducted and accidents and conflicts need to be correlated.
Research issues
The research issues mentioned at the beginning of this study could be answered partially. A high potential for optimisation of the automated video analysis system, particularly the estimation of mo-tion and tracking of cyclists was identified, since a high accuracy is a prerequisite for reliable results of indicators as previously shown by the mentioned SSMs . As a result of the lack of accuracy most of the detected conflicts could not be classified as real conflicts, because they were identified as false-positives by manual evaluation afterwards. This could be explained by (i) the current imperfection of the video analysis system and (ii) by the objectively justified strong overestimation of conflicts due to the error rates of any sensor system for safety analysis [4]. However, the determined conflict clusters are plausible and led to insights on cyclist behaviour and safety aspects.
Outlook
In the future it is planned to gather more representative and reliable data. This includes long-term measurements with different traffic states, illumination and weather conditions at different infra-structures to get more significant insights into road safety aspects, particularly of cyclists. Further-more, it is intended to investigate and develop further conflict measures and their appropriate appli-cation for certain situations. The automated analysis system will be improved regarding automated categorization of road user types and conflict types. Moreover, it is planned to conduct automatic clustering and marking of conflict/hazardous clusters as well as to compare these clusters to accident distributions. A repetition of the survey could give insights in the effectiveness of recently imple-mented safety measures, since the cycle lane markings at the roundabout Moritzplatz were rede-signed in August 2015 (one year after the data acquisition of this study).
Following needs of further research can be derived based on this study and related previous ap-proaches:
• Infrastructure based detection of critical and atypical traffic situations needs to be combinedwith driver related information (e.g. extraction of data from Naturalistic Driving Studies) andenvironmental information (e.g. road condition generated from Car to Car- (C2C) or Car to In-frastructure (C2I) communication data) for a better understanding of accident causation.
• Challenges of automated video analysis need to be solved, which are affections by weatherand illumination conditions and mutual occlusions of traffic participants for instance. Also,those systems have a high false positive rate which has to be corrected by an additional anal-ysis.
• SSMs need to be adequately extended and/or combined for related traffic and safety situa-tions. Furthermore, kinematic parameters, e.g. braking intensities and their distributionsshould be taken into account for conflict quantification.
• Focus is to be put on research to prevent and to mitigate accidents of VRU as they count fora high number and high severity of accidents, particularly in urban areas.
• Repetition of the campaign to assess the redesign of the lane markings at Moritzplatz.
REFERENCES
1 Der Polizeipräsident in Berlin, Stab des Polizeipräsidenten, Sachbereich Verkehr: Sonderuntersuchung Radfahrerver-kehrsunfälle in Berlin 2014, URL: https://www.berlin.de/polizei/_assets/aufgaben/anlagen-verkehrssicherheit/radfahrer2014.pdf (in German)
2 S Detzer, M Junghans, K Kozempel, H Saul, Analysis of traffic safety for cyclists - an automatic detection of critical traf-fic situations of cyclists. In: 20th International Conference on Urban Transport and the Environment, pp. 491-503. WIT Press. 28. - 30. Mai 2014, The Algarve, Portugal. ISBN 978-1-84564-778-0.
3 M Junghans, A Leich, K Kozempel, H Saul, S Knake-Langhorst, Wide-area based traffic situation detection at an ungated level crossing, submitted for publication at 10th International Conference on Risk Analysis, 25.-27. May 2016, Her-sonissos, Crete, Greece, 2016.
4 A Leich, A Kendziorra, H Saul, R Hoffmann, Calculation of Error Rates for the Detection of Critical Situations in Road Traffic. In Proceedings at TRB Annual meeting, Washington D.C., 2016.
5 H Saul, K Kozempel, M Haberjahn, A Comparison of Methods for Detecting atypical Trajectories. In: 20th International Conference on Urban Transport and the Environment, pp. 491-503. WIT Press. 28. - 30. Mai 2014, The Algarve, Portu-gal. ISBN 978-1-84564-778-0.
6 K Ismail, T Sayed und N Saunier, Automated Analysis of Pedestrian-Vehicle Conflicts: A Context for Before-and-After Studies. In Transportation Research Board (TRB): Journal of the Transportation Research Board 2009, URL: http://dx.doi.org/10.3141/2198-07.
7 N Saunier, T Sayed, K Ismail, Large Scale Automated Analysis of Vehicle Interactions and Collisions. In Transportation Research Board (TRB): Journal of the Transportation Research Board 2010, URL: http://dx.doi.org/10.3141/2147-06.
8 A Laureshyn und H Ardö, Automated Video Analysis as a Tool for Analysing Road User Behaviour. In Proceedings of ITS World Congress, London, UK, 2006.
9 A Laureshyn, Å Svensson, C. Hydén, Evaluation of traffic safety, based on micro-level behavioural data: Theoretical framework and first implementation. In Journal Accident Analysis and Prevention, Vol. 42, pp. 1637-1647, 2010.
10 S Knake-Langhorst, T Frankiewicz, K Gimm, F Köster, Test Site AIM – Toolbox and Enabler for Applied Research and Development in Traffic and Mobility. Accepted for publication at Traffic Research Arena (TRA) 2016, Warsaw, 2016.
11 A Laureshyn, Å Svensson, C. Hydén, Evaluation of traffic safety, based on micro-level behavioural data: Theoretical framework and first implementation. In Journal Accident Analysis and Prevention, Vol. 42, pp. 1637-1647, 2010.
12 L Sakshaug, A Laureshyn, Å Svensson, C Hydén, Cyclists in roundabouts – Different design solutions. In Journal Accident Analysis and Prevention, Vol. 42, pp. 1338-1351, 2010.
13 H Saul, K Kozempel, M Haberjahn, A Comparison of Methods for Detecting atypical Trajectories. In: 20th International Conference on Urban Transport and the Environment, pp. 491-503. WIT Press. 28. - 30. Mai 2014, The Algarve, Portu-gal. ISBN 978-1-84564-778-0.
14 S Detzer, M Junghans, K Kozempel, H Saul, Analysis of traffic safety for cyclists - an automatic detection of critical traf-fic situations of cyclists. In: 20th International Conference on Urban Transport and the Environment, pp. 491-503. WIT Press. 28. - 30. Mai 2014, The Algarve, Portugal. ISBN 978-1-84564-778-0.
15 A Leich, A Kendziorra, H Saul, R Hoffmann, Calculation of Error Rates for the Detection of Critical Situations in Road Traffic. In Proceedings at TRB Annual meeting, Washington D.C., 2016.
16 S Daniels, T De Ceunynck, M De Smet, A Laureshyn: VRU safety at signalized versus unsignalized crossings: an empirical analysis of crossing behaviour and conflict indicators, International Co-operation on Theories and Concepts in Traffic Safety workshop, 29th-30th October 2015, Ashdod, Israel.
17 Unfallforschung der Versicherer GDV, Fahrradunfallstudie Münster, 2010, Berlin. 18 Unfallforschung der Versicherer GDV, Fahrradunfallstudie, Unfälle zwischen abbiegenden Kfz und Radfahrern, 2013,
Berlin. 19 K Gimm, Analyse von Trajektoriendaten aus der Forschungskreuzung zur Ableitung der Kritikalität von Ereignissen.
Master thesis, German Aerospace Center, 2014. 20 C Hydén, The development of a method for traffic safety evaluation: the Swedish traffic conflict technique, Doctoral
thesis, Lund University, Department of Traffic Planning and Engineering, 1987. 21 O Thom, Untersuchung der Eignung von Surrogate Safety Measures (SSM) zur Beschreibung von Unfall- und kritischen
Situationen. Master thesis, Dresden University of Technology, 2014. 22 M Green, How Long Does It Take to Stop? Methodological Analysis of Driver Perception-Brake Times. Transportation
Human Factors, Vol. 2, No. 3, 2000, pp. 195–216. 23 J Q Souza, M W Sasaki, F J C Cunto, Comparing Simulated Road Safety Performance to Observed Crash Frequency at
Signalized Intersections. In 3rd International Conference on Road Safety and Simulation, September 14-16, 2011, Indi-anapolis, USA.
24 Verkehrslenkung Berlin (VLB), Verkehrsmengenkarte 2014, 2014, Berlin, URL: http://www.stadtentwicklung.berlin.de/verkehr/lenkung/vlb/download/verkehrsmengen_2014.pdf
25 R F Beck, Mountain Bicycle Acceleration and Braking Factors, Proceedings of the Canadian Multidisciplinary Road Safe-ty Conference XIV, June 27-30, 2004, Ottawa, Ontario.
An overview of car occupant fatalities in the European countries George Yannis, Alexandra Laiou, Katerina Folla, Dimosthenis Pavlou*
Robert Bauer, Klaus Machata, Christian Brandstaetter** Pete Thomas, Alan Kirk***
* National Technical University of Athens, Iroon Polytecheiou 5, Athens, 15773, Greece
** Austrian Road Safety Board, Schleiergasse 18, Vienna, 1100, Austria *** Loughborough University, Epinal Way, Leicestershire, LE11 3TU, United Kingdom
Abstract Car occupants have a high level of mortality in road accidents, since passenger cars are the prevalent mode of transport. In 2013, car occupant fatalities accounted for 45% of all road accident fatalities in the EU. The objective of this research is the analysis of basic road safety parameters related to car occupants in the European countries over a period of 10 years (2004-2013), through the exploitation of the EU CARE database with disaggregate data on road accidents. Data from the EU Injury Database for the period 2005 - 2008 are used to identify injury patterns, and additional insight into accident causation for car occupants is offered through the use of in-depth accident data from the EC SafetyNet project Accident Causation System (SNACS). The results of the analysis allow for a better understanding of the car occupants’ safety situation in Europe, thus providing useful support to decision makers working for the improvement of road safety level in Europe. INTRODUCTION The principal mode of passenger transport is that of the passenger car, since it is linked to the desire for greater mobility and flexibility. Car use is growing rapidly in many countries worldwide and in 2014 alone, a record 67 million passenger cars came into circulation on world’s roads [1]. In the European Union in 2013, passenger cars accounted for 83,2% of inland passenger transport, with motor coaches, buses and trolley buses (9,2%) and trains (7,6%) both accounting for less than a tenth of all traffic (as measured by the number of inland passenger-kilometres (pkm) travelled by each mode) [2]. The high dependence on the use of the car as a means of passenger transport, as well as the subsequent increase in interaction between cars, heavy vehicles and vulnerable road users have contributed to more conflicts and road accidents. Around 180.000 car occupants were killed in road accidents in the EU during the decade 2004 - 2013. Car occupant fatalities hold the largest part of road fatalities in the Europe, constituting almost half of them. However, in the 2004 - 2013 period, car occupant fatalities were reduced more than the overall accident death rate (51% and 45% respectively) and thus, more than the rate for other road users. Car occupants have therefore benefitted more than other road users from road safety measures adopted over those years. This is not surprising, as many of those measures were targeted at car occupants including increased enforcement of the main traffic offences, improved vehicle occupant protection, and, to a lesser extent, improved infrastructure [3]. Despite that considerable decrease, the number of car occupant fatalities still remains high and an analysis of their characteristics would be useful in the better understanding of the effects of the implemented measures on their evolution. The objective of this research is the analysis of basic road safety parameters related to car occupants in European countries, through the exploitation of the EU CARE database with disaggregate data on road accidents, the EU Injury Database (EU IDB) and the SafetyNet Accident Causation System (SNACS). More specifically, time-series road accident data involving car occupants from CARE for 27 EU countries over a period of 10 years (2004 - 2013) are correlated with basic safety parameters, such as road type, presence of junction, season of the year, day of the week and time of the day, as well as person related characteristics, like age and gender. Moreover, EU IDB data for the period 2005 - 2008 are used to identify injury patterns and improve the assessment of injury severity. Additional insight into accident causation recorded for car occupants is offered through analysis of a set of in-depth data, collected for the period 2005 – 2008, using a common methodology for samples
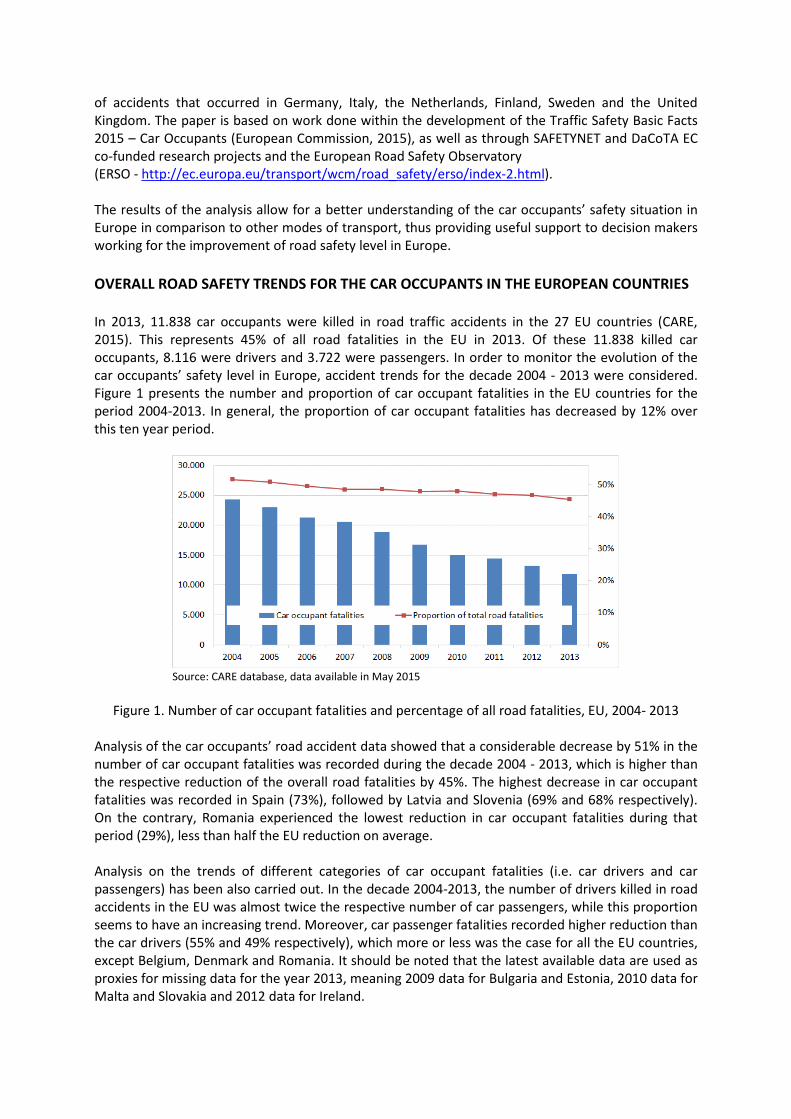
of accidents that occurred in Germany, Italy, the Netherlands, Finland, Sweden and the United Kingdom. The paper is based on work done within the development of the Traffic Safety Basic Facts 2015 – Car Occupants (European Commission, 2015), as well as through SAFETYNET and DaCoTA EC co-funded research projects and the European Road Safety Observatory (ERSO - http://ec.europa.eu/transport/wcm/road_safety/erso/index-2.html). The results of the analysis allow for a better understanding of the car occupants’ safety situation in Europe in comparison to other modes of transport, thus providing useful support to decision makers working for the improvement of road safety level in Europe. OVERALL ROAD SAFETY TRENDS FOR THE CAR OCCUPANTS IN THE EUROPEAN COUNTRIES In 2013, 11.838 car occupants were killed in road traffic accidents in the 27 EU countries (CARE, 2015). This represents 45% of all road fatalities in the EU in 2013. Of these 11.838 killed car occupants, 8.116 were drivers and 3.722 were passengers. In order to monitor the evolution of the car occupants’ safety level in Europe, accident trends for the decade 2004 - 2013 were considered. Figure 1 presents the number and proportion of car occupant fatalities in the EU countries for the period 2004-2013. In general, the proportion of car occupant fatalities has decreased by 12% over this ten year period.
Source: CARE database, data available in May 2015
Figure 1. Number of car occupant fatalities and percentage of all road fatalities, EU, 2004- 2013
Analysis of the car occupants’ road accident data showed that a considerable decrease by 51% in the number of car occupant fatalities was recorded during the decade 2004 - 2013, which is higher than the respective reduction of the overall road fatalities by 45%. The highest decrease in car occupant fatalities was recorded in Spain (73%), followed by Latvia and Slovenia (69% and 68% respectively). On the contrary, Romania experienced the lowest reduction in car occupant fatalities during that period (29%), less than half the EU reduction on average. Analysis on the trends of different categories of car occupant fatalities (i.e. car drivers and car passengers) has been also carried out. In the decade 2004-2013, the number of drivers killed in road accidents in the EU was almost twice the respective number of car passengers, while this proportion seems to have an increasing trend. Moreover, car passenger fatalities recorded higher reduction than the car drivers (55% and 49% respectively), which more or less was the case for all the EU countries, except Belgium, Denmark and Romania. It should be noted that the latest available data are used as proxies for missing data for the year 2013, meaning 2009 data for Bulgaria and Estonia, 2010 data for Malta and Slovakia and 2012 data for Ireland.
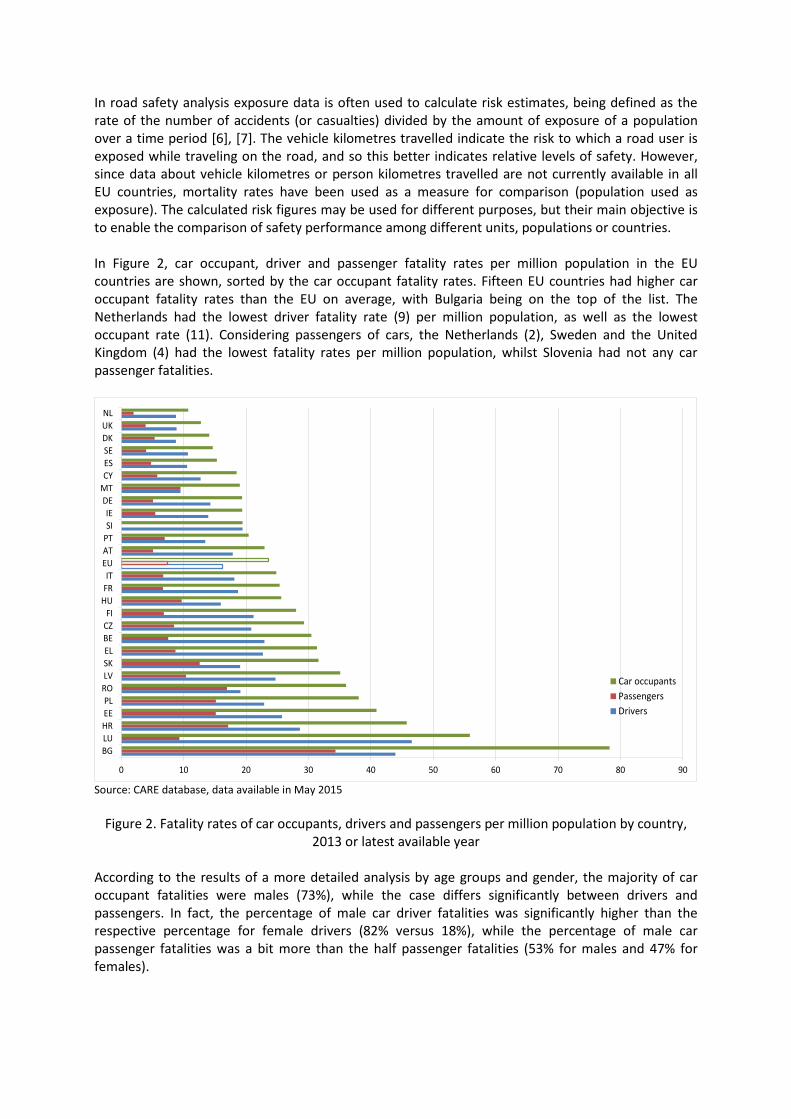
In road safety analysis exposure data is often used to calculate risk estimates, being defined as the rate of the number of accidents (or casualties) divided by the amount of exposure of a population over a time period [6], [7]. The vehicle kilometres travelled indicate the risk to which a road user is exposed while traveling on the road, and so this better indicates relative levels of safety. However, since data about vehicle kilometres or person kilometres travelled are not currently available in all EU countries, mortality rates have been used as a measure for comparison (population used as exposure). The calculated risk figures may be used for different purposes, but their main objective is to enable the comparison of safety performance among different units, populations or countries. In Figure 2, car occupant, driver and passenger fatality rates per million population in the EU countries are shown, sorted by the car occupant fatality rates. Fifteen EU countries had higher car occupant fatality rates than the EU on average, with Bulgaria being on the top of the list. The Netherlands had the lowest driver fatality rate (9) per million population, as well as the lowest occupant rate (11). Considering passengers of cars, the Netherlands (2), Sweden and the United Kingdom (4) had the lowest fatality rates per million population, whilst Slovenia had not any car passenger fatalities.
Source: CARE database, data available in May 2015
Figure 2. Fatality rates of car occupants, drivers and passengers per million population by country, 2013 or latest available year
According to the results of a more detailed analysis by age groups and gender, the majority of car occupant fatalities were males (73%), while the case differs significantly between drivers and passengers. In fact, the percentage of male car driver fatalities was significantly higher than the respective percentage for female drivers (82% versus 18%), while the percentage of male car passenger fatalities was a bit more than the half passenger fatalities (53% for males and 47% for females).
0 10 20 30 40 50 60 70 80 90
BGLUHREEPL
ROLVSKELBECZFI
HUFRIT
EUATPTSIIE
DEMTCYESSEDKUKNL
Car occupantsPassengersDrivers
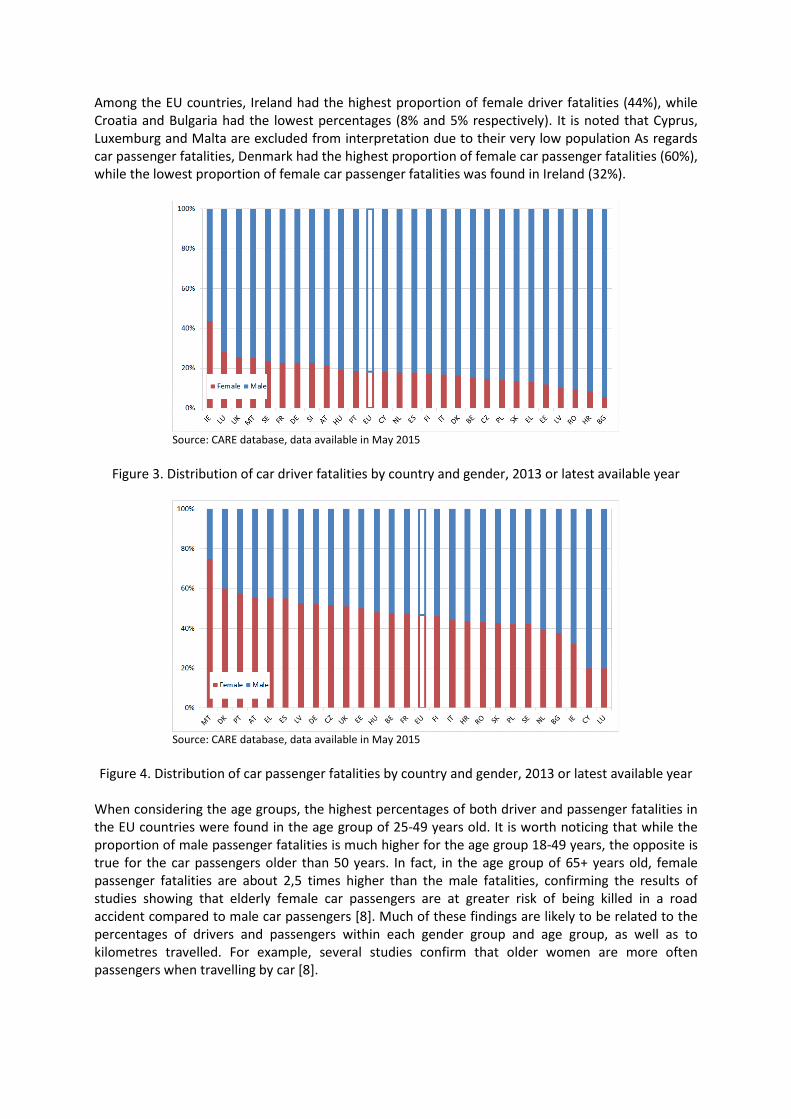
Among the EU countries, Ireland had the highest proportion of female driver fatalities (44%), while Croatia and Bulgaria had the lowest percentages (8% and 5% respectively). It is noted that Cyprus, Luxemburg and Malta are excluded from interpretation due to their very low population As regards car passenger fatalities, Denmark had the highest proportion of female car passenger fatalities (60%), while the lowest proportion of female car passenger fatalities was found in Ireland (32%).
Source: CARE database, data available in May 2015
Figure 3. Distribution of car driver fatalities by country and gender, 2013 or latest available year
Source: CARE database, data available in May 2015
Figure 4. Distribution of car passenger fatalities by country and gender, 2013 or latest available year
When considering the age groups, the highest percentages of both driver and passenger fatalities in the EU countries were found in the age group of 25-49 years old. It is worth noticing that while the proportion of male passenger fatalities is much higher for the age group 18-49 years, the opposite is true for the car passengers older than 50 years. In fact, in the age group of 65+ years old, female passenger fatalities are about 2,5 times higher than the male fatalities, confirming the results of studies showing that elderly female car passengers are at greater risk of being killed in a road accident compared to male car passengers [8]. Much of these findings are likely to be related to the percentages of drivers and passengers within each gender group and age group, as well as to kilometres travelled. For example, several studies confirm that older women are more often passengers when travelling by car [8].
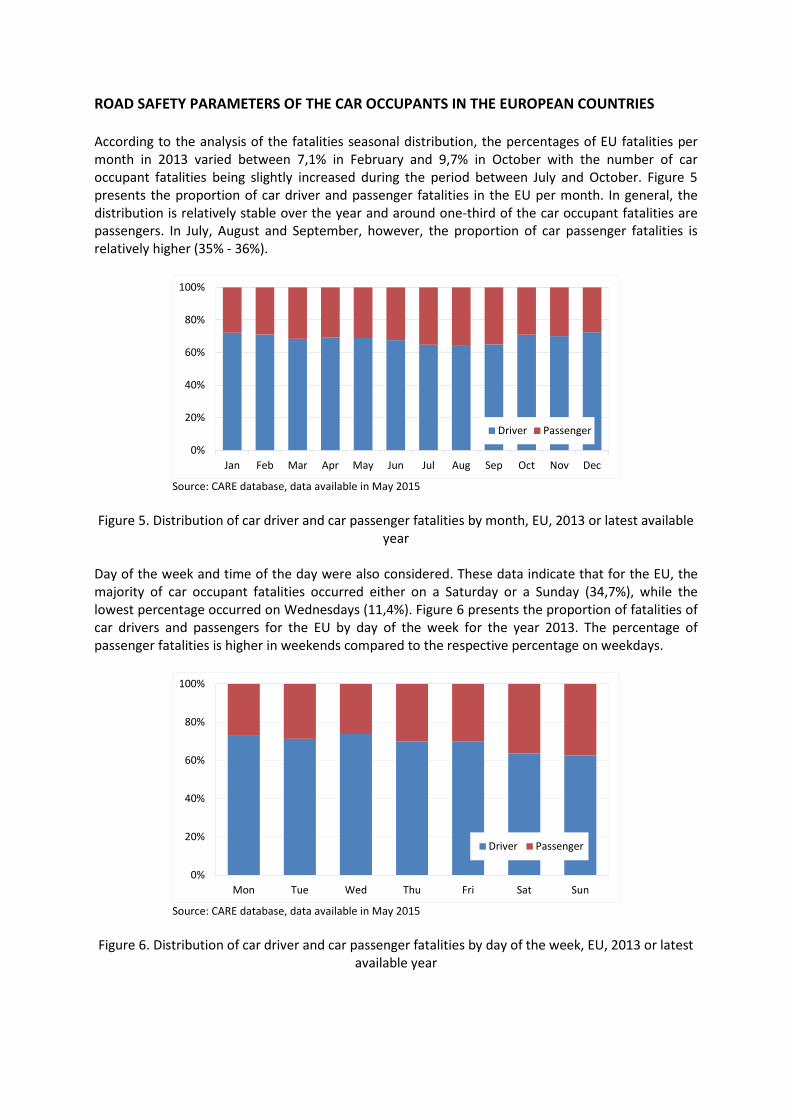
ROAD SAFETY PARAMETERS OF THE CAR OCCUPANTS IN THE EUROPEAN COUNTRIES According to the analysis of the fatalities seasonal distribution, the percentages of EU fatalities per month in 2013 varied between 7,1% in February and 9,7% in October with the number of car occupant fatalities being slightly increased during the period between July and October. Figure 5 presents the proportion of car driver and passenger fatalities in the EU per month. In general, the distribution is relatively stable over the year and around one-third of the car occupant fatalities are passengers. In July, August and September, however, the proportion of car passenger fatalities is relatively higher (35% - 36%).
Source: CARE database, data available in May 2015
Figure 5. Distribution of car driver and car passenger fatalities by month, EU, 2013 or latest available
year Day of the week and time of the day were also considered. These data indicate that for the EU, the majority of car occupant fatalities occurred either on a Saturday or a Sunday (34,7%), while the lowest percentage occurred on Wednesdays (11,4%). Figure 6 presents the proportion of fatalities of car drivers and passengers for the EU by day of the week for the year 2013. The percentage of passenger fatalities is higher in weekends compared to the respective percentage on weekdays.
Source: CARE database, data available in May 2015
Figure 6. Distribution of car driver and car passenger fatalities by day of the week, EU, 2013 or latest
available year
0%
20%
40%
60%
80%
100%
Jan Feb Mar Apr May Jun Jul Aug Sep Oct Nov Dec
Driver Passenger
0%
20%
40%
60%
80%
100%
Mon Tue Wed Thu Fri Sat Sun
Driver Passenger
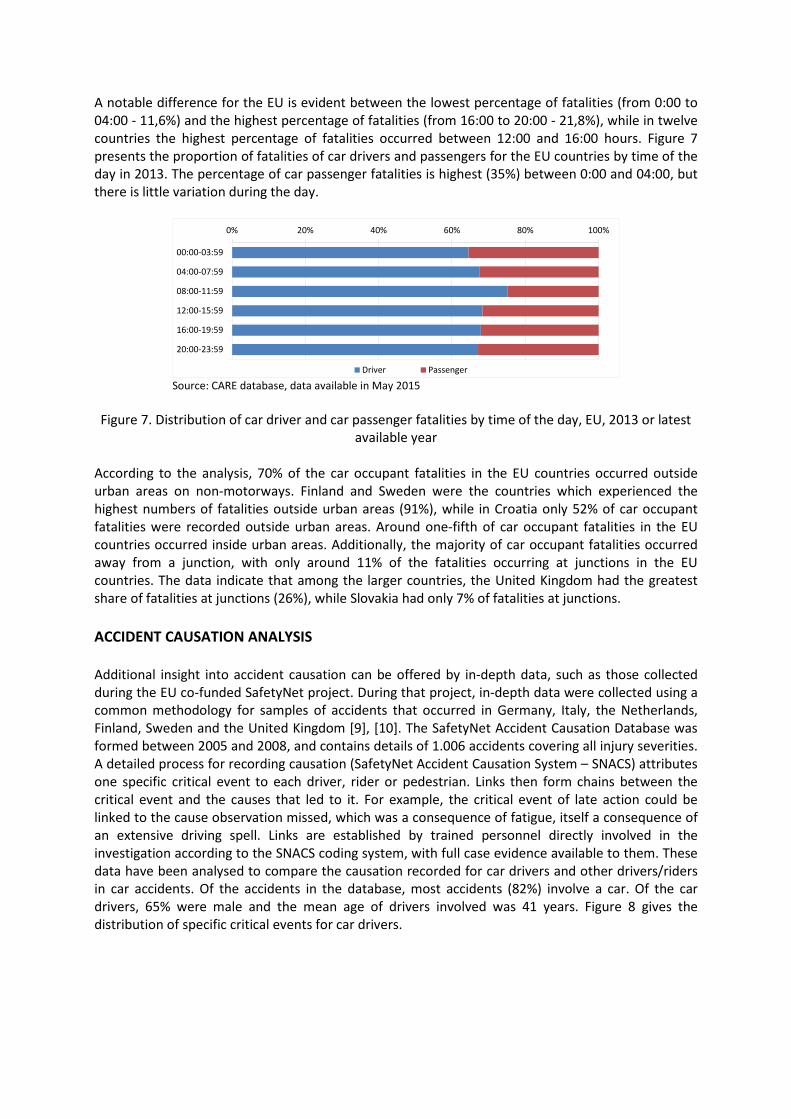
A notable difference for the EU is evident between the lowest percentage of fatalities (from 0:00 to 04:00 - 11,6%) and the highest percentage of fatalities (from 16:00 to 20:00 - 21,8%), while in twelve countries the highest percentage of fatalities occurred between 12:00 and 16:00 hours. Figure 7 presents the proportion of fatalities of car drivers and passengers for the EU countries by time of the day in 2013. The percentage of car passenger fatalities is highest (35%) between 0:00 and 04:00, but there is little variation during the day.
Source: CARE database, data available in May 2015
Figure 7. Distribution of car driver and car passenger fatalities by time of the day, EU, 2013 or latest
available year According to the analysis, 70% of the car occupant fatalities in the EU countries occurred outside urban areas on non-motorways. Finland and Sweden were the countries which experienced the highest numbers of fatalities outside urban areas (91%), while in Croatia only 52% of car occupant fatalities were recorded outside urban areas. Around one-fifth of car occupant fatalities in the EU countries occurred inside urban areas. Additionally, the majority of car occupant fatalities occurred away from a junction, with only around 11% of the fatalities occurring at junctions in the EU countries. The data indicate that among the larger countries, the United Kingdom had the greatest share of fatalities at junctions (26%), while Slovakia had only 7% of fatalities at junctions. ACCIDENT CAUSATION ANALYSIS Additional insight into accident causation can be offered by in-depth data, such as those collected during the EU co-funded SafetyNet project. During that project, in-depth data were collected using a common methodology for samples of accidents that occurred in Germany, Italy, the Netherlands, Finland, Sweden and the United Kingdom [9], [10]. The SafetyNet Accident Causation Database was formed between 2005 and 2008, and contains details of 1.006 accidents covering all injury severities. A detailed process for recording causation (SafetyNet Accident Causation System – SNACS) attributes one specific critical event to each driver, rider or pedestrian. Links then form chains between the critical event and the causes that led to it. For example, the critical event of late action could be linked to the cause observation missed, which was a consequence of fatigue, itself a consequence of an extensive driving spell. Links are established by trained personnel directly involved in the investigation according to the SNACS coding system, with full case evidence available to them. These data have been analysed to compare the causation recorded for car drivers and other drivers/riders in car accidents. Of the accidents in the database, most accidents (82%) involve a car. Of the car drivers, 65% were male and the mean age of drivers involved was 41 years. Figure 8 gives the distribution of specific critical events for car drivers.
0% 20% 40% 60% 80% 100%
00:00-03:59
04:00-07:59
08:00-11:59
12:00-15:59
16:00-19:59
20:00-23:59
Driver Passenger
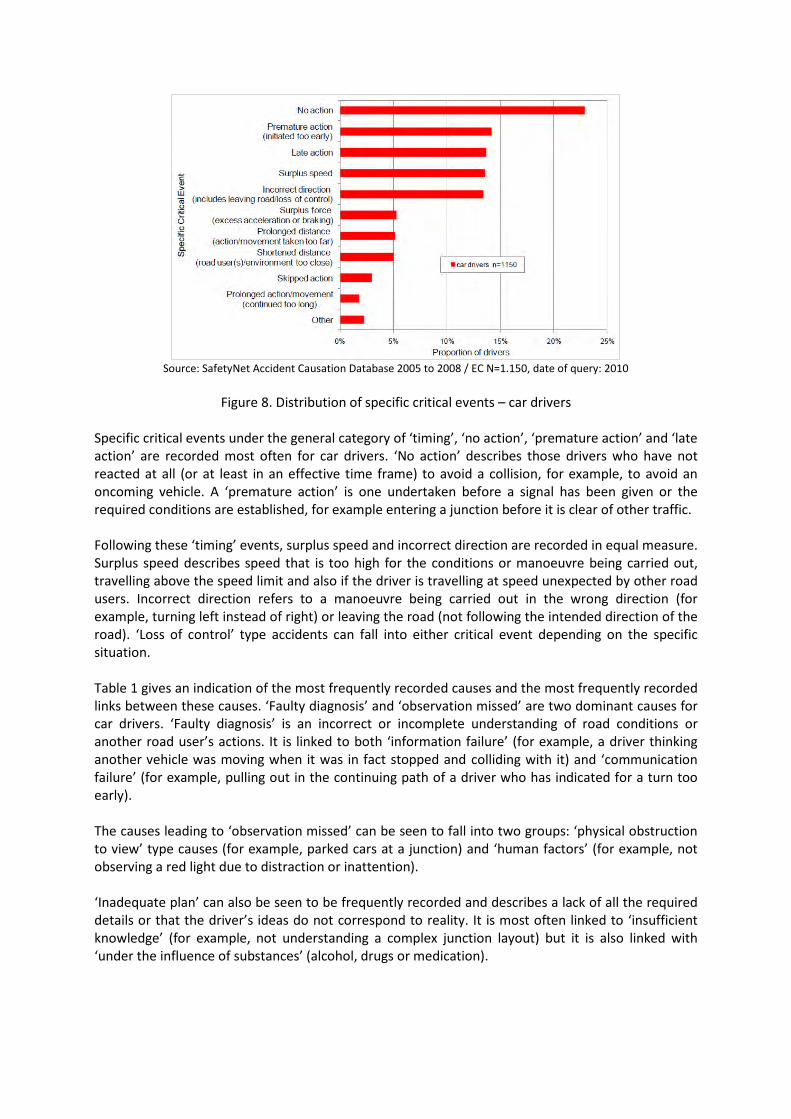
Source: SafetyNet Accident Causation Database 2005 to 2008 / EC N=1.150, date of query: 2010
Figure 8. Distribution of specific critical events – car drivers
Specific critical events under the general category of ‘timing’, ‘no action’, ‘premature action’ and ‘late action’ are recorded most often for car drivers. ‘No action’ describes those drivers who have not reacted at all (or at least in an effective time frame) to avoid a collision, for example, to avoid an oncoming vehicle. A ‘premature action’ is one undertaken before a signal has been given or the required conditions are established, for example entering a junction before it is clear of other traffic. Following these ‘timing’ events, surplus speed and incorrect direction are recorded in equal measure. Surplus speed describes speed that is too high for the conditions or manoeuvre being carried out, travelling above the speed limit and also if the driver is travelling at speed unexpected by other road users. Incorrect direction refers to a manoeuvre being carried out in the wrong direction (for example, turning left instead of right) or leaving the road (not following the intended direction of the road). ‘Loss of control’ type accidents can fall into either critical event depending on the specific situation. Table 1 gives an indication of the most frequently recorded causes and the most frequently recorded links between these causes. ‘Faulty diagnosis’ and ‘observation missed’ are two dominant causes for car drivers. ‘Faulty diagnosis’ is an incorrect or incomplete understanding of road conditions or another road user’s actions. It is linked to both ‘information failure’ (for example, a driver thinking another vehicle was moving when it was in fact stopped and colliding with it) and ‘communication failure’ (for example, pulling out in the continuing path of a driver who has indicated for a turn too early). The causes leading to ‘observation missed’ can be seen to fall into two groups: ‘physical obstruction to view’ type causes (for example, parked cars at a junction) and ‘human factors’ (for example, not observing a red light due to distraction or inattention). ‘Inadequate plan’ can also be seen to be frequently recorded and describes a lack of all the required details or that the driver’s ideas do not correspond to reality. It is most often linked to ‘insufficient knowledge’ (for example, not understanding a complex junction layout) but it is also linked with ‘under the influence of substances’ (alcohol, drugs or medication).
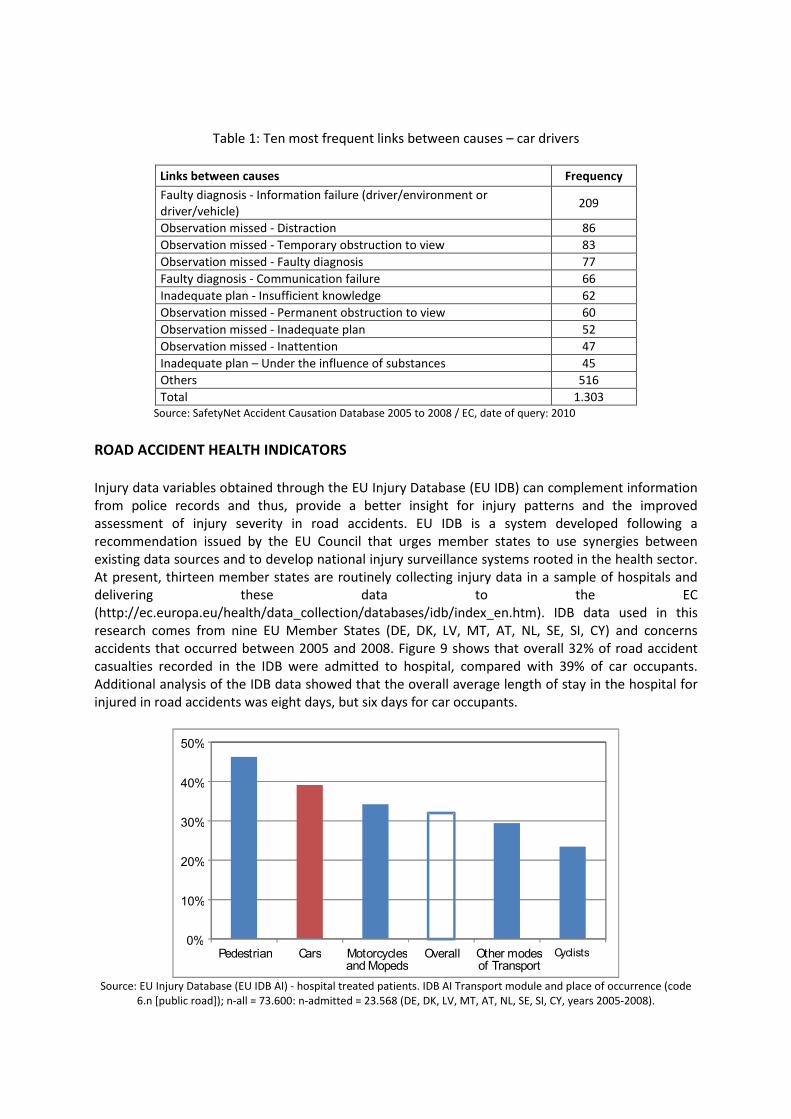
Table 1: Ten most frequent links between causes – car drivers
Links between causes Frequency Faulty diagnosis - Information failure (driver/environment or driver/vehicle) 209
Observation missed - Distraction 86 Observation missed - Temporary obstruction to view 83 Observation missed - Faulty diagnosis 77 Faulty diagnosis - Communication failure 66 Inadequate plan - Insufficient knowledge 62 Observation missed - Permanent obstruction to view 60 Observation missed - Inadequate plan 52 Observation missed - Inattention 47 Inadequate plan – Under the influence of substances 45 Others 516 Total 1.303
Source: SafetyNet Accident Causation Database 2005 to 2008 / EC, date of query: 2010 ROAD ACCIDENT HEALTH INDICATORS Injury data variables obtained through the EU Injury Database (EU IDB) can complement information from police records and thus, provide a better insight for injury patterns and the improved assessment of injury severity in road accidents. EU IDB is a system developed following a recommendation issued by the EU Council that urges member states to use synergies between existing data sources and to develop national injury surveillance systems rooted in the health sector. At present, thirteen member states are routinely collecting injury data in a sample of hospitals and delivering these data to the EC (http://ec.europa.eu/health/data_collection/databases/idb/index_en.htm). IDB data used in this research comes from nine EU Member States (DE, DK, LV, MT, AT, NL, SE, SI, CY) and concerns accidents that occurred between 2005 and 2008. Figure 9 shows that overall 32% of road accident casualties recorded in the IDB were admitted to hospital, compared with 39% of car occupants. Additional analysis of the IDB data showed that the overall average length of stay in the hospital for injured in road accidents was eight days, but six days for car occupants.
Source: EU Injury Database (EU IDB AI) - hospital treated patients. IDB AI Transport module and place of occurrence (code
6.n [public road]); n-all = 73.600: n-admitted = 23.568 (DE, DK, LV, MT, AT, NL, SE, SI, CY, years 2005-2008).
0%
10%
20%
30%
40%
50%
Pedestrian Cars Motorcycles and Mopeds
Overall Other modes of Transport
Cyclists

Figure 9. Percentage of non-fatal road accident casualties who were admitted to hospital by mode of
transport Figure 10 illustrates the distribution of body parts injured of the various road user types. Car occupants, for example, show the greatest proportion of neck and throat injuries among all types of road users, presumably linked to the incidence of whip-lash.
Source: EU Injury Database (EU IDB AI) - hospital treated patients. IDB AI Transport module and place of occurrence (code
6.n [public road]); n-all = 73.600: n-admitted = 23.568 (DE, DK, LV, MT, AT, NL, SE, SI, CY, years 2005-2008).
Figure 10. Distribution of non-fatal road accident casualties by mode of transport and body part injured
CONCLUSIONS As cars comprise a considerable share of the vehicle fleet, better understanding of the characteristics specific to this user group provides an opportunity to address a high proportion of fatalities recorded every year in Europe. The various road safety parameters examined revealed that the safety problem for the car occupants vary among the countries, reflecting different levels of infrastructure development and traffic enforcement, as well as behavioural characteristics. Analysis of the car occupants’ road accident data derived from the EC CARE database for the decade 2004 – 2013, showed that a considerable decrease by 51% in the number of car occupant fatalities was recorded within that decade, which is higher than the respective reduction of the overall road fatalities by 45%. It was also found that in 2013, the majority of driver fatalities in the EU countries were males, while male passenger fatalities were slightly higher than half the car occupant fatalities. Moreover, the percentage of female car passenger fatalities was significantly higher than the respective percentage of female drivers. When considering the age groups, the highest percentage of driver fatalities in the EU countries was found in the age of 25 and 49 years old. In addition, most of the car occupant fatalities in the EU countries occurred outside urban areas, on non-motorways, with the percentages varying among the examined countries. The analysis of other types of data such as in-depth accident data and injury data, allowed for additional insight into accident causation recorded for car occupants, as well as for the identification of injury patterns improvement of the assessment of injury severity for casualties of this road user group. The results of the analysis allow for a better understanding of the car occupant safety problem in the European road network, providing thus useful support to decision makers working for the
0% 20% 40% 60% 80% 100%
Pedestrians
Cyclists
Motorcycles and Mopeds
Cars
Other modes of Transport
Overall
Head Neck, throat Trunk Upper extremities Lower extremities Multiple body parts other
improvement of safety in the European road network. Certainly, the effort of data-collection is an on-going challenge and there are additional data that could help shed light to the problem of the car occupants’ road safety. Of particular interest are exposure data related to the mobility of road users (veh-kms, passenger-kms travelled). Furthermore, the macroscopic analysis presented in this paper could be also combined with more detailed analysis using statistical models, which is necessary for the identification of the combined correlation of the parameters with an impact on car occupants’ road safety and the underlining reasons behind their casualties. ACKNOWLEDGEMENTS This paper is based on work carried out by the National Technical University of Athens (NTUA), the Austrian Road Safety Board (KFV) and the European Union Road Federation (ERF) for the European Commission DG Mobility and Transport, updating work carried out within the SafetyNet (The European Road Safety Observatory) and DaCoTA (Data Collection Transfer and Analysis) projects of the 6th and 7th (respectively) Framework Programmes for Research, Technological Development and Demonstration of the European Commission. APPENDIX A – COUNTRY ABBREVIATIONS Belgium BE Italy IT Romania RO Bulgaria BG Cyprus CY Slovenia SI Czech Republic CZ Latvia LV Slovakia SK Denmark DK Lithuania LT Finland FI Germany DE Luxembourg LU Sweden SE Estonia EE Hungary HU United Kingdom UK Ireland IE Malta MT Greece EL Netherlands NL Spain ES Austria AT France FR Poland PL Croatia HR Portugal PT REFERENCES 1 World Health Organisation, Global status report on road safety 2015, Geneva, WHO, 2015. 2 Eurostat, Passenger transport statistics, 2016
http://ec.europa.eu/eurostat/statistics-explained/index.php/Passenger_transport_statistics. 3 ETSC, Ranking EU progress on car occupant safety, PIN Flash Report 27, Brussels, ETSC, 2014. 4 Injury Database (IDB) - http://ec.europa.eu/health/data_collection/databases/idb/index_en.htm. 5 European Road Safety Observatory (ERSO), http://ec.europa.eu/transport/wcm/road_safety/erso/index-2.html. 6 A.S. Hakkert, L. Braimaister, The uses of exposure and risk in road safety studies, SWOV report R-2002-12,
Leidschendam, the Netherlands, SWOV, 2002. 7 E. Hauer, On exposure and accident rate, Traffic Engineering and Control, 36 (3), pp. 134-138, 1995. 8 E. Polders, T. Brijs, E. Vlachogianni, E. Papadimitriou, G. Yannis, F. Leopold, C. Durso, K. Diamandouros, ElderSafe - Risks
and countermeasures for road traffic of elderly in Europe, Final report, N° MOVE/C4/2014-244, Brussels, European Commission, 2015.
9 Bjorkman K. et al., In-depth accident causation database and analysis report, Deliverable 5.8 of the SafetyNet research Project, Brussels, European Commission, 2008.
10 Reed S., Morris A., Glossary of data variables for fatal and accident causation databases. Deliverable 5.5 of the SafetyNet research Project, Brussels, European Commission, 2008.
Injury probability functions for pedestrians and bicyclists based on real-world accident data Author: Dipl.-Ing. Henrik Liers* Co-Authors: Dipl.-Ing. Florian Spitzhüttl* * Verkehrsunfallforschung an der TU Dresden (VUFO) GmbH Semperstraße 2a 01069 Dresden Email: Henrik.liers @vufo.de Tel.: +49 (351) 43 89 89 23 Fax: +49 (351) 43 89 89 99 Abstract The paper is focusing on the modelling of injury severity probabilities, often called as Injury Risk Functions (IRF). These are mathematical functions describing the probability for a defined population and for possible explanatory factors (variables) to sustain a certain injury severity. Injury risk functions are becoming more and more important as basis for the assessment of automotive safety systems. They contribute to the understanding of injury mechanisms, (prospective) evaluation of safety systems and definition of protection criteria or are used within regulation and/or consumer ratings. In all cases, knowledge about the correlation between mechanical behavior and injury severity is needed. IRFs are often based on biomechanical data. This paper is focusing on the derivation of injury probability models from real world accident data of the GIDAS database (German In-depth Accident Study).
In contrast to most academic terms there is no explicit term definition or definition of creation processes existing for injury probability models based on empirical data. Different approaches are existing for such kind of models in the field of accident research. There is a need for harmonization in terms of the used methods and data as well as the handling with the existing challenges. These are preparation of the dataset, model assumptions, censored/unknown data, evaluation of model accuracy, definition of dependent and independent variable, and others. In the presented study, several empirical, statistical and phenomenological approaches were analyzed regarding their advantages and disadvantages and also their applicability. Furthermore, the identification of appropriate prediction parameters for the injury severity of pedestrians has been considered. Due to its main effect on injuries of pedestrians and bicyclists, the importance of the secondary impact has also been analyzed. Finally, the model accuracy, evaluated by several criteria, is the rating factor that gives the quality and reliability for application of the resulting models.
After the investigation and evaluation of statistical approaches one method was chosen and appropriate prediction variables were examined. Finally, all findings were summarized and injury risk functions for pedestrians in real world accidents were created. Additionally, the paper gives instructions for the interpretation and usage of such functions. The presented results include IRFs for several injury severity levels and age groups.
The presented models are based on a high amount of real world accidents and describe very well the injury severity probability of pedestrians and bicyclists in frontal collisions with current vehicles. The functions can serve as basis for the evaluation of effectiveness of systems like Pedestrian-AEB or Bicycle-AEB.
Long Term Consequences of Road Accidents
H Johannsen*
*Accident Research Unit, Medizinische Hochschule Hannover, Carl-Neuberg-Str. 1, 30625 Hannover, Germany Abstract When assessing the consequences of accidents normally the injury severity and the damage costs are considered. The injury severity is either expressed within the police categories (slight injury, severe injury or fatal injury) or the AIS code that rates the fatality risk of a given injury. Both injury metrics are assessing the consequences of the accident directly after the accident. However, not all consequences of accidents are visible directly after the accident and the duration of the consequences are different. Besides a physiological reduction of functionality social and psychological implications such as reduced mobility options, problems to continue the original job etc. are happening. In order to assess long term consequences of accidents the MHH Accident Research Unit established a brief questionnaire that is distributed to accident involved people of the Hannover subset of the GIDAS data set approx. one year after the accident beginning with the accident year 2013. The basic idea of using a brief questionnaire (in fact only one page) is to obtain a relatively large return rate because the questionnaire appears to be simple and quickly answered. This appears to be important because it is believed that the majority of accident involved people will not report long term consequences. In order to allow a more detailed survey amongst those responders that are reporting long term consequences they are asked for a written consent for the additional questionnaire that will be distributed at a time that is not yet defined. Long term consequences are reported for all addressed areas, medical, physiological, psychological and sociological by people without injuries, with minor injuries and with severe injuries. NOTATION HGV Heavy Goods Vehicle PTW Powered Two-Wheeler RTC Road Traffic Causalities INTRODUCTION Historically the severity of the consequences of road traffic accidents is assessed by the injury severity. However, this approach normally considers the short term consequences only. It remains unclear whether the victims are completely recovering from the accident or long term consequences will remain (except for fatal accidents). Long term consequences can generally be distinguished into medical, physiological, psychological, mental and social burden. In the last years a number of long term studies have been conducted [1-7]. However, most of these studies were focussing on severely injured Road Traffic Causalities (RTC). By focussing on severely injured people long term consequences of uninjured and slightly injured people are neglected. This appears to be a problem because the large majority of people being involved in road traffic accidents are not injured or only slightly injured. In order to get an impression of the kind of long term consequences and the extend of the problem the Hannover team of the GIDAS accident collection project started with the accident year 2013 a survey amongst the accident involved people asking for long term consequences by a brief questionnaire.
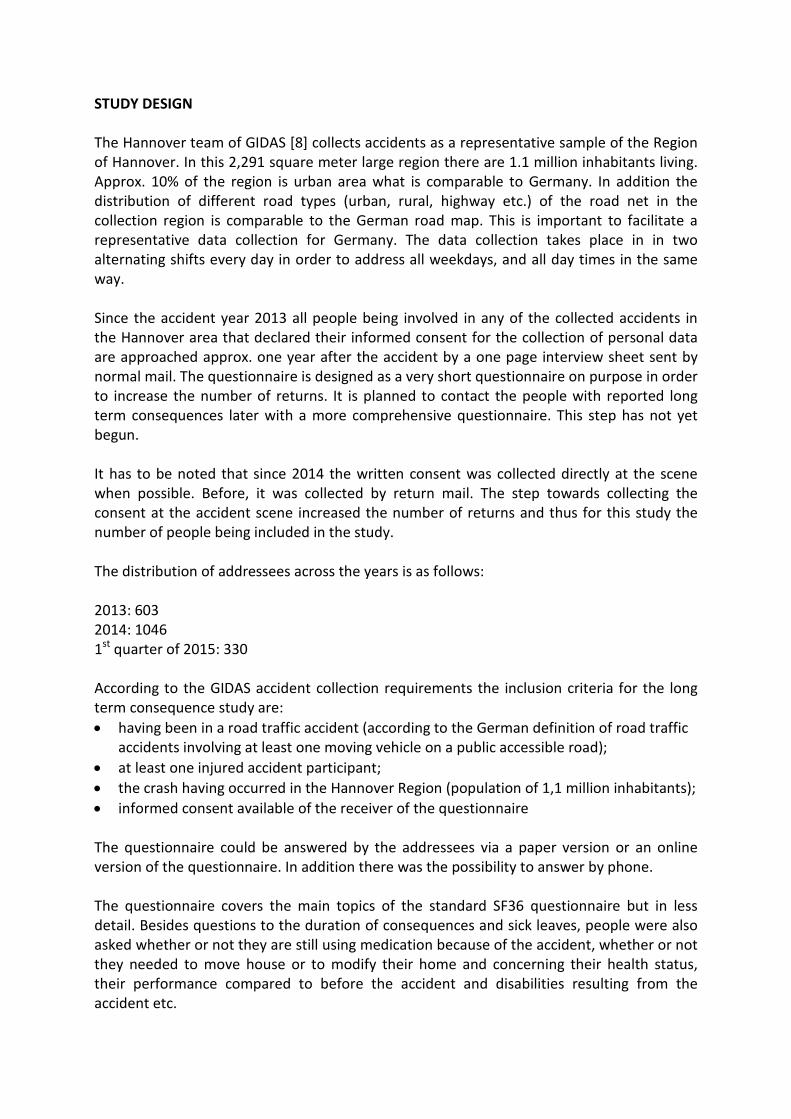
STUDY DESIGN The Hannover team of GIDAS [8] collects accidents as a representative sample of the Region of Hannover. In this 2,291 square meter large region there are 1.1 million inhabitants living. Approx. 10% of the region is urban area what is comparable to Germany. In addition the distribution of different road types (urban, rural, highway etc.) of the road net in the collection region is comparable to the German road map. This is important to facilitate a representative data collection for Germany. The data collection takes place in in two alternating shifts every day in order to address all weekdays, and all day times in the same way. Since the accident year 2013 all people being involved in any of the collected accidents in the Hannover area that declared their informed consent for the collection of personal data are approached approx. one year after the accident by a one page interview sheet sent by normal mail. The questionnaire is designed as a very short questionnaire on purpose in order to increase the number of returns. It is planned to contact the people with reported long term consequences later with a more comprehensive questionnaire. This step has not yet begun. It has to be noted that since 2014 the written consent was collected directly at the scene when possible. Before, it was collected by return mail. The step towards collecting the consent at the accident scene increased the number of returns and thus for this study the number of people being included in the study. The distribution of addressees across the years is as follows: 2013: 603 2014: 1046 1st quarter of 2015: 330 According to the GIDAS accident collection requirements the inclusion criteria for the long term consequence study are: • having been in a road traffic accident (according to the German definition of road traffic
accidents involving at least one moving vehicle on a public accessible road); • at least one injured accident participant; • the crash having occurred in the Hannover Region (population of 1,1 million inhabitants); • informed consent available of the receiver of the questionnaire The questionnaire could be answered by the addressees via a paper version or an online version of the questionnaire. In addition there was the possibility to answer by phone. The questionnaire covers the main topics of the standard SF36 questionnaire but in less detail. Besides questions to the duration of consequences and sick leaves, people were also asked whether or not they are still using medication because of the accident, whether or not they needed to move house or to modify their home and concerning their health status, their performance compared to before the accident and disabilities resulting from the accident etc.
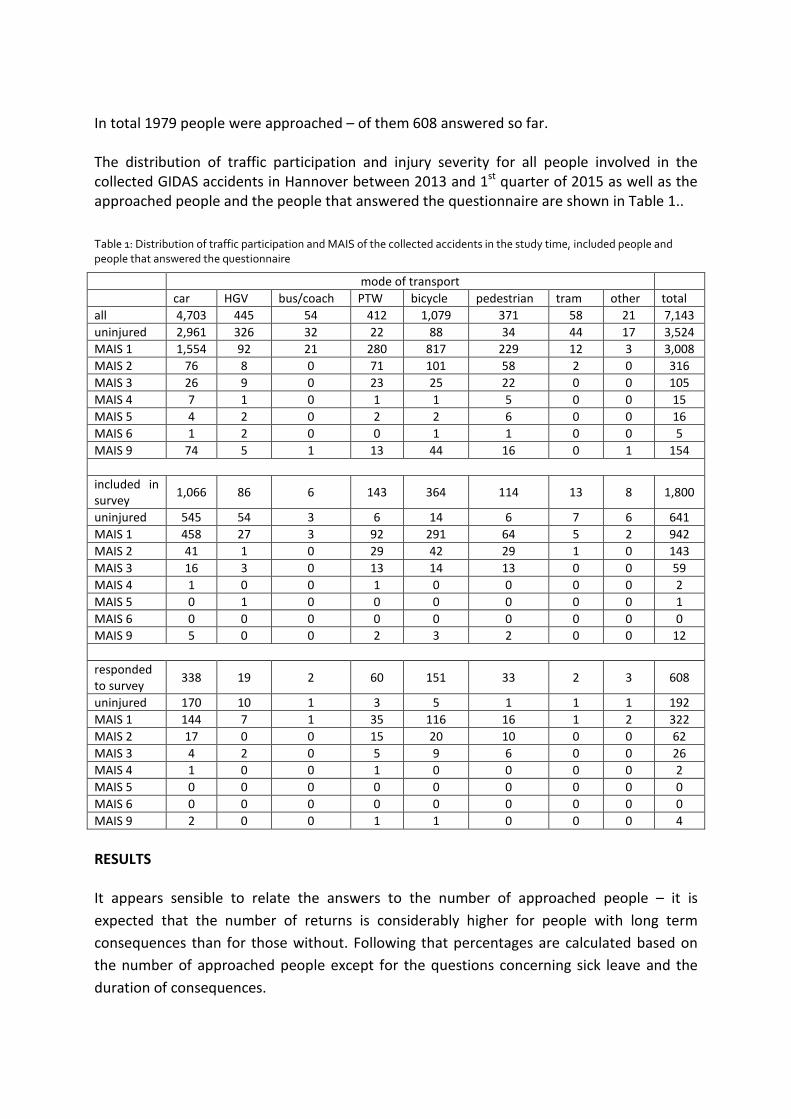
In total 1979 people were approached – of them 608 answered so far. The distribution of traffic participation and injury severity for all people involved in the collected GIDAS accidents in Hannover between 2013 and 1st quarter of 2015 as well as the approached people and the people that answered the questionnaire are shown in Table 1.. Table 1: Distribution of traffic participation and MAIS of the collected accidents in the study time, included people and people that answered the questionnaire
mode of transport car HGV bus/coach PTW bicycle pedestrian tram other total all 4,703 445 54 412 1,079 371 58 21 7,143 uninjured 2,961 326 32 22 88 34 44 17 3,524 MAIS 1 1,554 92 21 280 817 229 12 3 3,008 MAIS 2 76 8 0 71 101 58 2 0 316 MAIS 3 26 9 0 23 25 22 0 0 105 MAIS 4 7 1 0 1 1 5 0 0 15 MAIS 5 4 2 0 2 2 6 0 0 16 MAIS 6 1 2 0 0 1 1 0 0 5 MAIS 9 74 5 1 13 44 16 0 1 154
included in survey 1,066 86 6 143 364 114 13 8 1,800
uninjured 545 54 3 6 14 6 7 6 641 MAIS 1 458 27 3 92 291 64 5 2 942 MAIS 2 41 1 0 29 42 29 1 0 143 MAIS 3 16 3 0 13 14 13 0 0 59 MAIS 4 1 0 0 1 0 0 0 0 2 MAIS 5 0 1 0 0 0 0 0 0 1 MAIS 6 0 0 0 0 0 0 0 0 0 MAIS 9 5 0 0 2 3 2 0 0 12
responded to survey 338 19 2 60 151 33 2 3 608
uninjured 170 10 1 3 5 1 1 1 192 MAIS 1 144 7 1 35 116 16 1 2 322 MAIS 2 17 0 0 15 20 10 0 0 62 MAIS 3 4 2 0 5 9 6 0 0 26 MAIS 4 1 0 0 1 0 0 0 0 2 MAIS 5 0 0 0 0 0 0 0 0 0 MAIS 6 0 0 0 0 0 0 0 0 0 MAIS 9 2 0 0 1 1 0 0 0 4 RESULTS It appears sensible to relate the answers to the number of approached people – it is expected that the number of returns is considerably higher for people with long term consequences than for those without. Following that percentages are calculated based on the number of approached people except for the questions concerning sick leave and the duration of consequences.
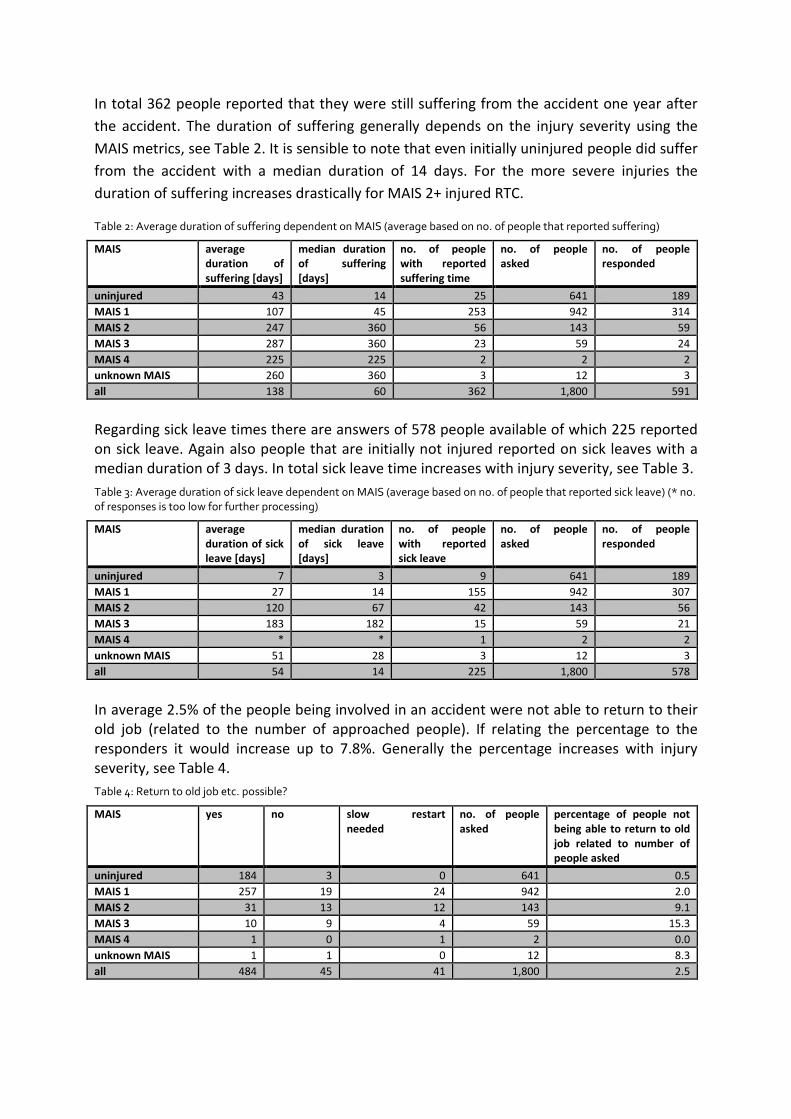
In total 362 people reported that they were still suffering from the accident one year after the accident. The duration of suffering generally depends on the injury severity using the MAIS metrics, see Table 2. It is sensible to note that even initially uninjured people did suffer from the accident with a median duration of 14 days. For the more severe injuries the duration of suffering increases drastically for MAIS 2+ injured RTC.
Table 2: Average duration of suffering dependent on MAIS (average based on no. of people that reported suffering)
MAIS average duration of suffering [days]
median duration of suffering [days]
no. of people with reported suffering time
no. of people asked
no. of people responded
uninjured 43 14 25 641 189 MAIS 1 107 45 253 942 314 MAIS 2 247 360 56 143 59 MAIS 3 287 360 23 59 24 MAIS 4 225 225 2 2 2 unknown MAIS 260 360 3 12 3 all 138 60 362 1,800 591
Regarding sick leave times there are answers of 578 people available of which 225 reported on sick leave. Again also people that are initially not injured reported on sick leaves with a median duration of 3 days. In total sick leave time increases with injury severity, see Table 3. Table 3: Average duration of sick leave dependent on MAIS (average based on no. of people that reported sick leave) (* no. of responses is too low for further processing)
MAIS average duration of sick leave [days]
median duration of sick leave [days]
no. of people with reported sick leave
no. of people asked
no. of people responded
uninjured 7 3 9 641 189 MAIS 1 27 14 155 942 307 MAIS 2 120 67 42 143 56 MAIS 3 183 182 15 59 21 MAIS 4 * * 1 2 2 unknown MAIS 51 28 3 12 3 all 54 14 225 1,800 578
In average 2.5% of the people being involved in an accident were not able to return to their old job (related to the number of approached people). If relating the percentage to the responders it would increase up to 7.8%. Generally the percentage increases with injury severity, see Table 4. Table 4: Return to old job etc. possible?
MAIS yes no slow restart needed
no. of people asked
percentage of people not being able to return to old job related to number of people asked
uninjured 184 3 0 641 0.5 MAIS 1 257 19 24 942 2.0 MAIS 2 31 13 12 143 9.1 MAIS 3 10 9 4 59 15.3 MAIS 4 1 0 1 2 0.0 unknown MAIS 1 1 0 12 8.3 all 484 45 41 1,800 2.5
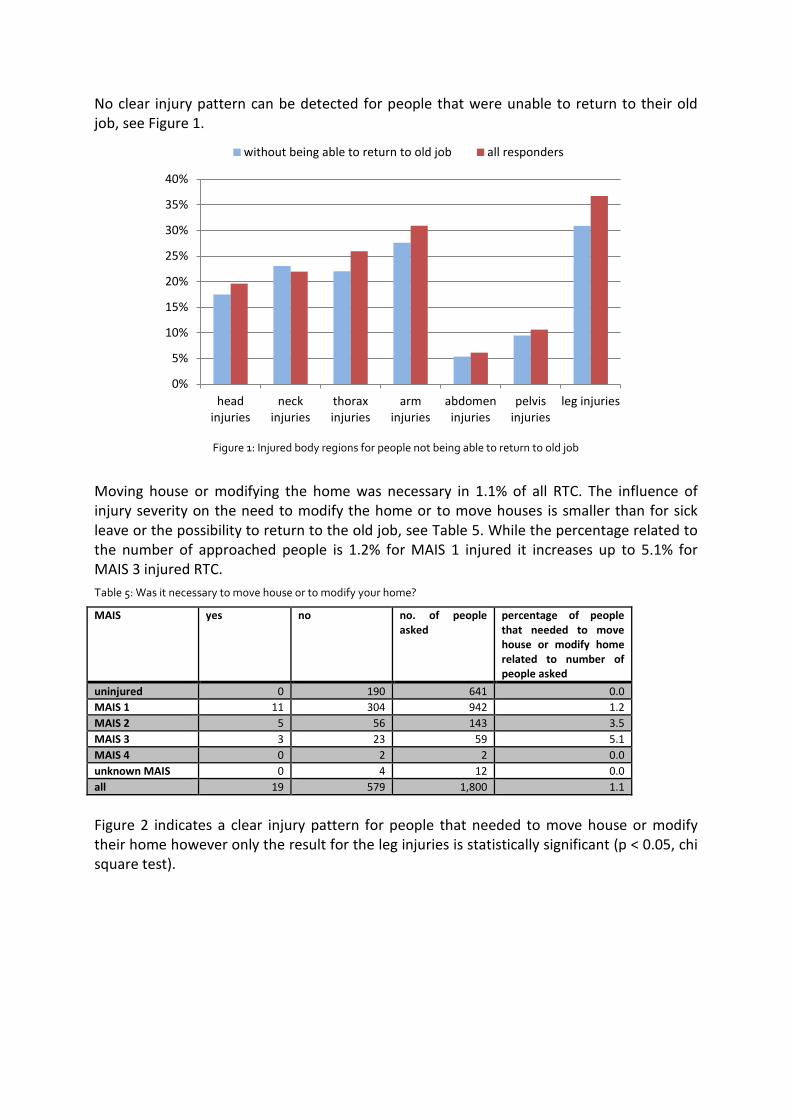
No clear injury pattern can be detected for people that were unable to return to their old job, see Figure 1.
Figure 1: Injured body regions for people not being able to return to old job
Moving house or modifying the home was necessary in 1.1% of all RTC. The influence of injury severity on the need to modify the home or to move houses is smaller than for sick leave or the possibility to return to the old job, see Table 5. While the percentage related to the number of approached people is 1.2% for MAIS 1 injured it increases up to 5.1% for MAIS 3 injured RTC. Table 5: Was it necessary to move house or to modify your home?
MAIS yes no no. of people asked
percentage of people that needed to move house or modify home related to number of people asked
uninjured 0 190 641 0.0 MAIS 1 11 304 942 1.2 MAIS 2 5 56 143 3.5 MAIS 3 3 23 59 5.1 MAIS 4 0 2 2 0.0 unknown MAIS 0 4 12 0.0 all 19 579 1,800 1.1
Figure 2 indicates a clear injury pattern for people that needed to move house or modify their home however only the result for the leg injuries is statistically significant (p < 0.05, chi square test).
0%
5%
10%
15%
20%
25%
30%
35%
40%
headinjuries
neckinjuries
thoraxinjuries
arminjuries
abdomeninjuries
pelvisinjuries
leg injuries
without being able to return to old job all responders
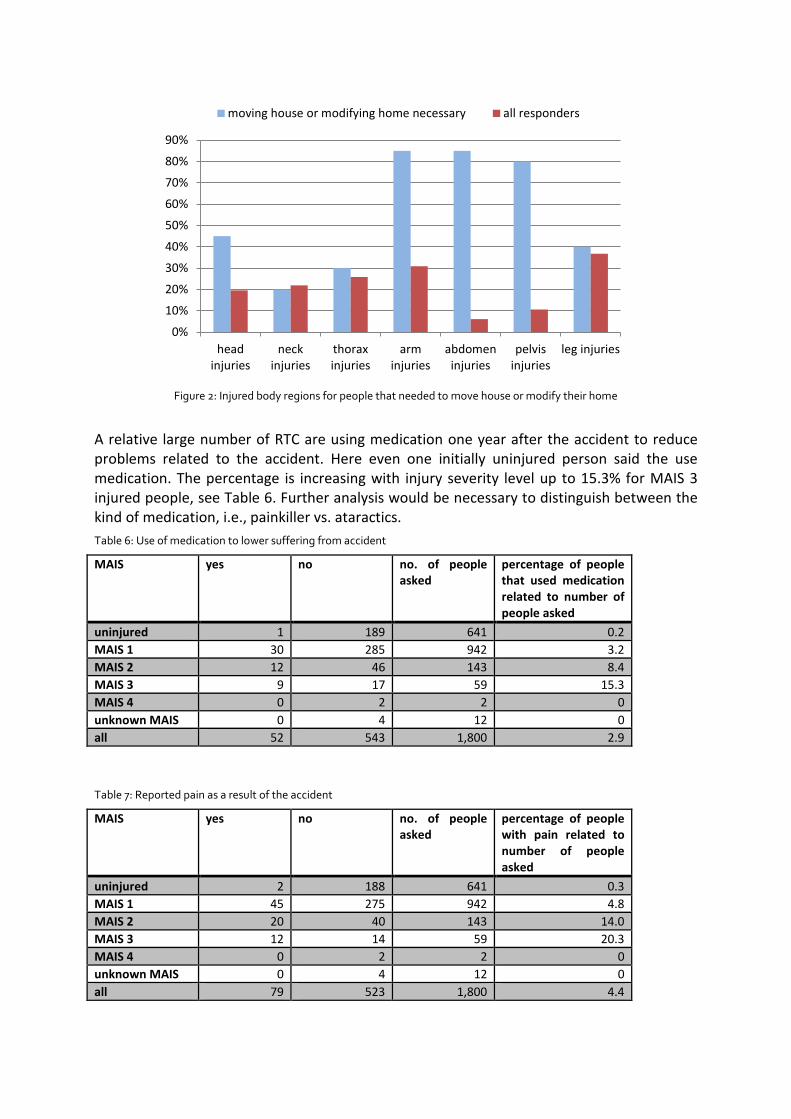
Figure 2: Injured body regions for people that needed to move house or modify their home
A relative large number of RTC are using medication one year after the accident to reduce problems related to the accident. Here even one initially uninjured person said the use medication. The percentage is increasing with injury severity level up to 15.3% for MAIS 3 injured people, see Table 6. Further analysis would be necessary to distinguish between the kind of medication, i.e., painkiller vs. ataractics. Table 6: Use of medication to lower suffering from accident
MAIS yes no no. of people asked
percentage of people that used medication related to number of people asked
uninjured 1 189 641 0.2 MAIS 1 30 285 942 3.2 MAIS 2 12 46 143 8.4 MAIS 3 9 17 59 15.3 MAIS 4 0 2 2 0 unknown MAIS 0 4 12 0 all 52 543 1,800 2.9
Table 7: Reported pain as a result of the accident
MAIS yes no no. of people asked
percentage of people with pain related to number of people asked
uninjured 2 188 641 0.3 MAIS 1 45 275 942 4.8 MAIS 2 20 40 143 14.0 MAIS 3 12 14 59 20.3 MAIS 4 0 2 2 0 unknown MAIS 0 4 12 0 all 79 523 1,800 4.4
0%
10%
20%
30%
40%
50%
60%
70%
80%
90%
headinjuries
neckinjuries
thoraxinjuries
arminjuries
abdomeninjuries
pelvisinjuries
leg injuries
moving house or modifying home necessary all responders
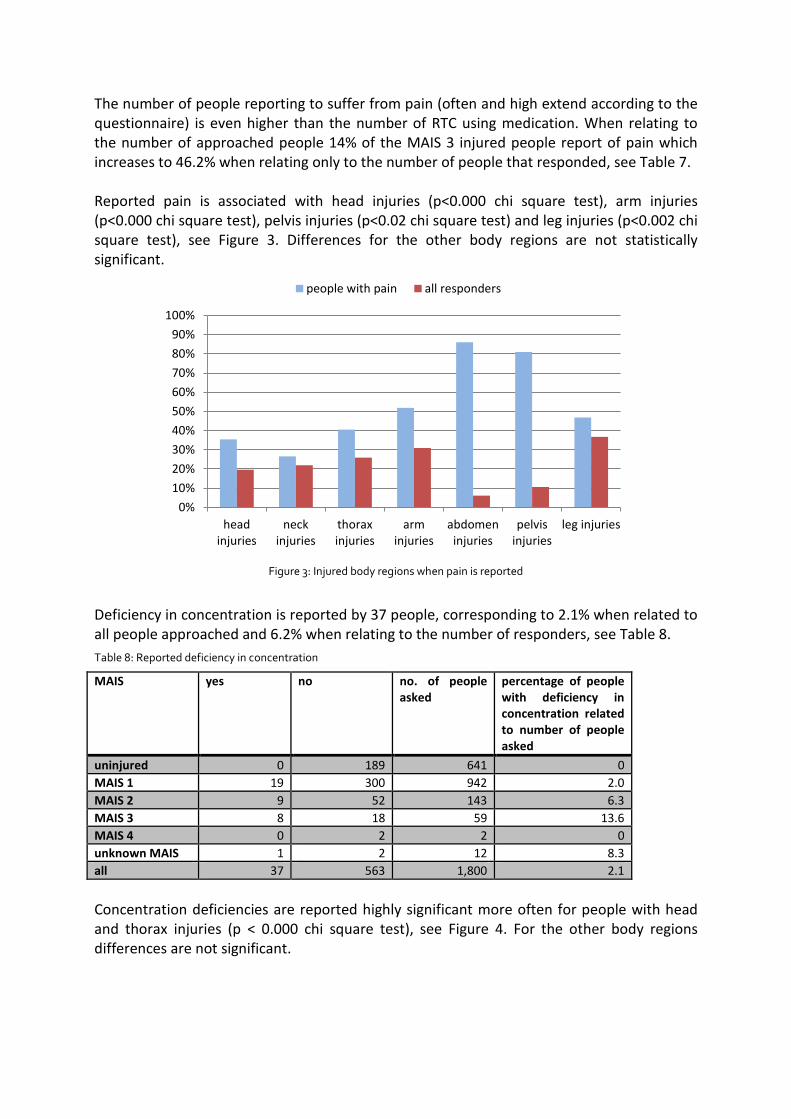
The number of people reporting to suffer from pain (often and high extend according to the questionnaire) is even higher than the number of RTC using medication. When relating to the number of approached people 14% of the MAIS 3 injured people report of pain which increases to 46.2% when relating only to the number of people that responded, see Table 7. Reported pain is associated with head injuries (p<0.000 chi square test), arm injuries (p<0.000 chi square test), pelvis injuries (p<0.02 chi square test) and leg injuries (p<0.002 chi square test), see Figure 3. Differences for the other body regions are not statistically significant.
Figure 3: Injured body regions when pain is reported
Deficiency in concentration is reported by 37 people, corresponding to 2.1% when related to all people approached and 6.2% when relating to the number of responders, see Table 8. Table 8: Reported deficiency in concentration
MAIS yes no no. of people asked
percentage of people with deficiency in concentration related to number of people asked
uninjured 0 189 641 0 MAIS 1 19 300 942 2.0 MAIS 2 9 52 143 6.3 MAIS 3 8 18 59 13.6 MAIS 4 0 2 2 0 unknown MAIS 1 2 12 8.3 all 37 563 1,800 2.1 Concentration deficiencies are reported highly significant more often for people with head and thorax injuries (p < 0.000 chi square test), see Figure 4. For the other body regions differences are not significant.
0%10%20%30%40%50%60%70%80%90%
100%
headinjuries
neckinjuries
thoraxinjuries
arminjuries
abdomeninjuries
pelvisinjuries
leg injuries
people with pain all responders
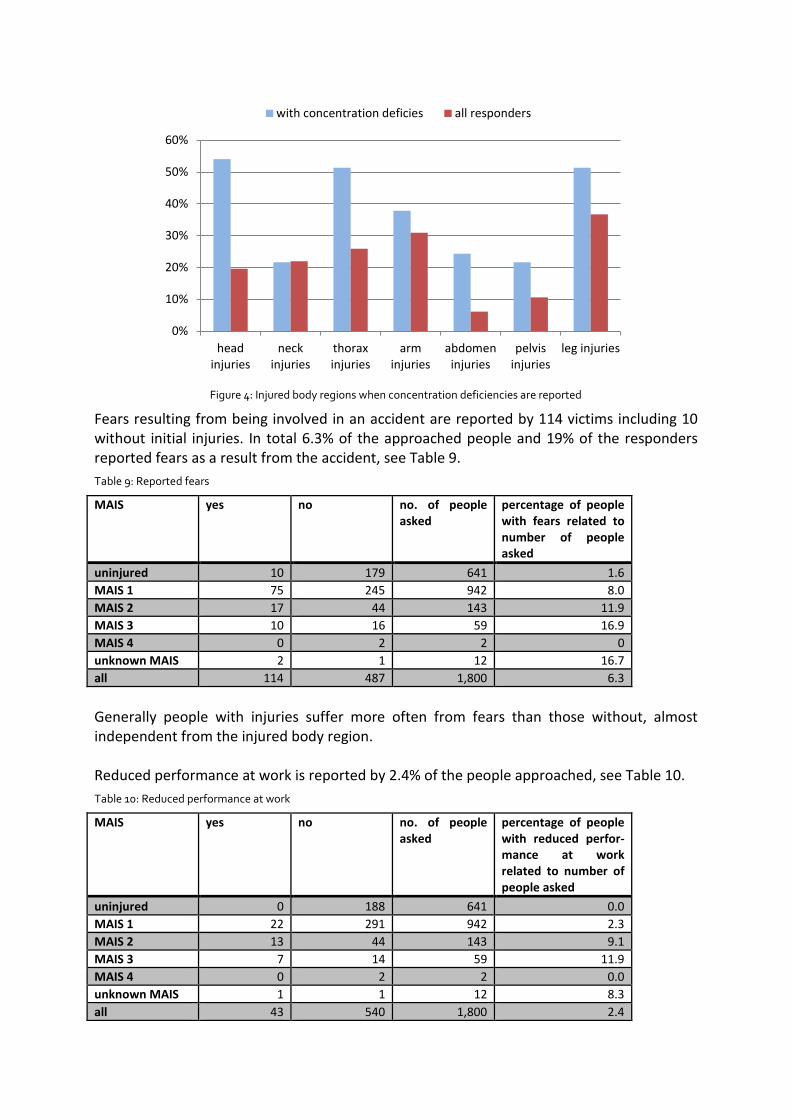
Figure 4: Injured body regions when concentration deficiencies are reported
Fears resulting from being involved in an accident are reported by 114 victims including 10 without initial injuries. In total 6.3% of the approached people and 19% of the responders reported fears as a result from the accident, see Table 9. Table 9: Reported fears
MAIS yes no no. of people asked
percentage of people with fears related to number of people asked
uninjured 10 179 641 1.6 MAIS 1 75 245 942 8.0 MAIS 2 17 44 143 11.9 MAIS 3 10 16 59 16.9 MAIS 4 0 2 2 0 unknown MAIS 2 1 12 16.7 all 114 487 1,800 6.3 Generally people with injuries suffer more often from fears than those without, almost independent from the injured body region. Reduced performance at work is reported by 2.4% of the people approached, see Table 10. Table 10: Reduced performance at work
MAIS yes no no. of people asked
percentage of people with reduced perfor-mance at work related to number of people asked
uninjured 0 188 641 0.0 MAIS 1 22 291 942 2.3 MAIS 2 13 44 143 9.1 MAIS 3 7 14 59 11.9 MAIS 4 0 2 2 0.0 unknown MAIS 1 1 12 8.3 all 43 540 1,800 2.4
0%
10%
20%
30%
40%
50%
60%
headinjuries
neckinjuries
thoraxinjuries
arminjuries
abdomeninjuries
pelvisinjuries
leg injuries
with concentration deficies all responders
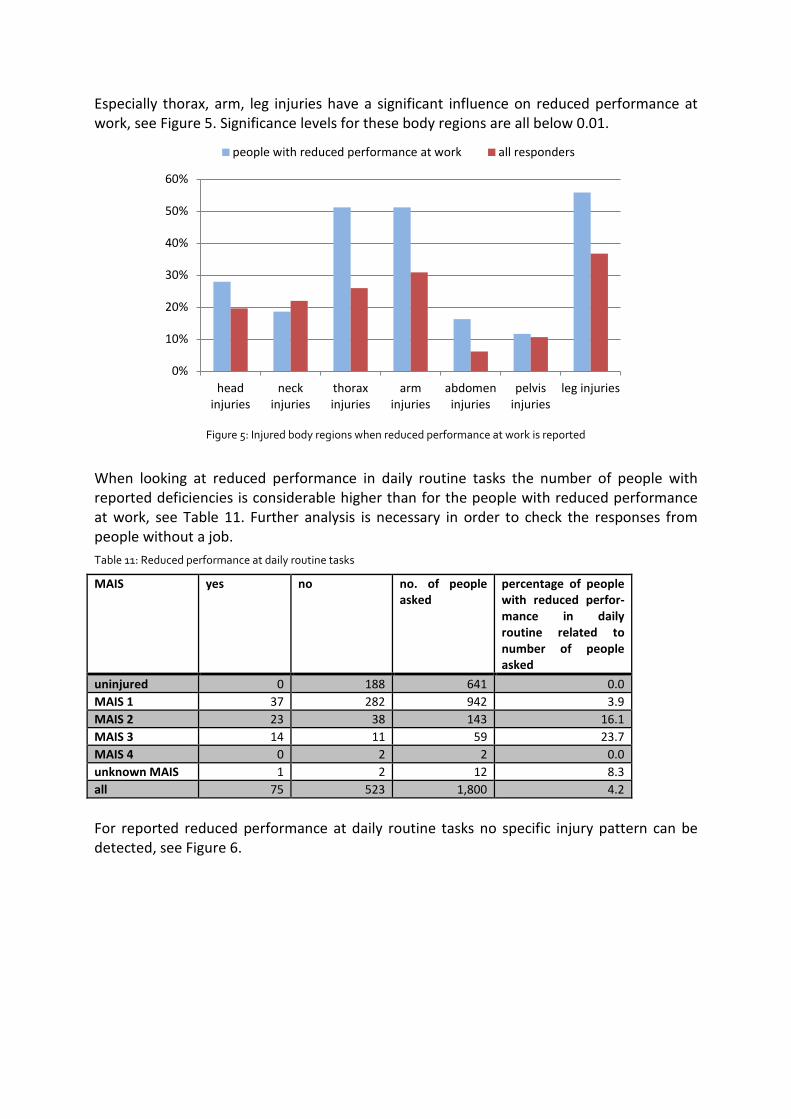
Especially thorax, arm, leg injuries have a significant influence on reduced performance at work, see Figure 5. Significance levels for these body regions are all below 0.01.
Figure 5: Injured body regions when reduced performance at work is reported
When looking at reduced performance in daily routine tasks the number of people with reported deficiencies is considerable higher than for the people with reduced performance at work, see Table 11. Further analysis is necessary in order to check the responses from people without a job. Table 11: Reduced performance at daily routine tasks
MAIS yes no no. of people asked
percentage of people with reduced perfor-mance in daily routine related to number of people asked
uninjured 0 188 641 0.0 MAIS 1 37 282 942 3.9 MAIS 2 23 38 143 16.1 MAIS 3 14 11 59 23.7 MAIS 4 0 2 2 0.0 unknown MAIS 1 2 12 8.3 all 75 523 1,800 4.2 For reported reduced performance at daily routine tasks no specific injury pattern can be detected, see Figure 6.
0%
10%
20%
30%
40%
50%
60%
headinjuries
neckinjuries
thoraxinjuries
arminjuries
abdomeninjuries
pelvisinjuries
leg injuries
people with reduced performance at work all responders
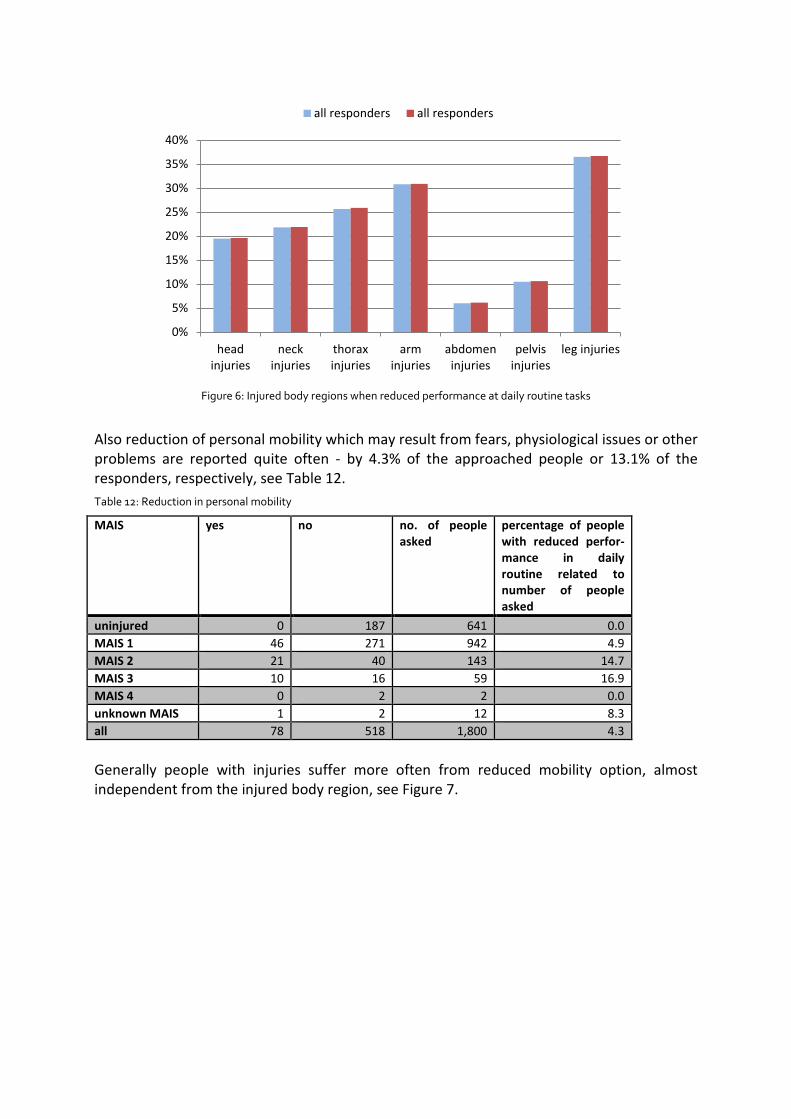
Figure 6: Injured body regions when reduced performance at daily routine tasks
Also reduction of personal mobility which may result from fears, physiological issues or other problems are reported quite often - by 4.3% of the approached people or 13.1% of the responders, respectively, see Table 12. Table 12: Reduction in personal mobility
MAIS yes no no. of people asked
percentage of people with reduced perfor-mance in daily routine related to number of people asked
uninjured 0 187 641 0.0 MAIS 1 46 271 942 4.9 MAIS 2 21 40 143 14.7 MAIS 3 10 16 59 16.9 MAIS 4 0 2 2 0.0 unknown MAIS 1 2 12 8.3 all 78 518 1,800 4.3 Generally people with injuries suffer more often from reduced mobility option, almost independent from the injured body region, see Figure 7.
0%
5%
10%
15%
20%
25%
30%
35%
40%
headinjuries
neckinjuries
thoraxinjuries
arminjuries
abdomeninjuries
pelvisinjuries
leg injuries
all responders all responders
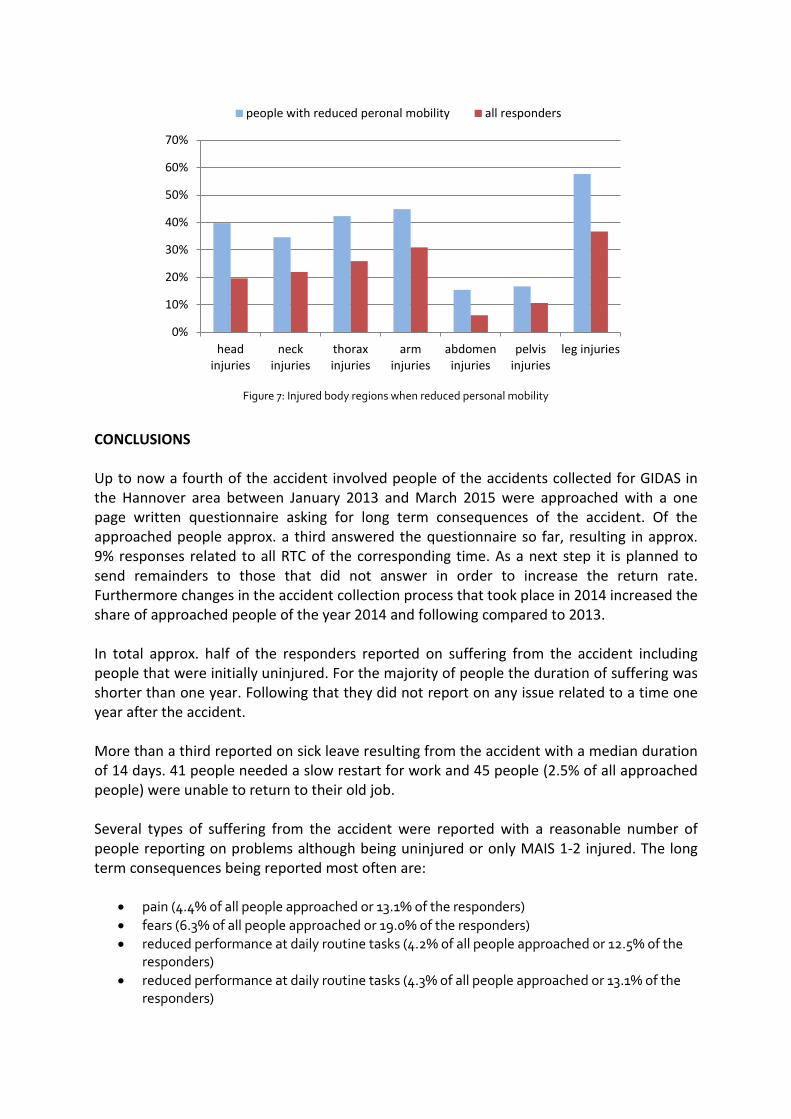
Figure 7: Injured body regions when reduced personal mobility
CONCLUSIONS Up to now a fourth of the accident involved people of the accidents collected for GIDAS in the Hannover area between January 2013 and March 2015 were approached with a one page written questionnaire asking for long term consequences of the accident. Of the approached people approx. a third answered the questionnaire so far, resulting in approx. 9% responses related to all RTC of the corresponding time. As a next step it is planned to send remainders to those that did not answer in order to increase the return rate. Furthermore changes in the accident collection process that took place in 2014 increased the share of approached people of the year 2014 and following compared to 2013. In total approx. half of the responders reported on suffering from the accident including people that were initially uninjured. For the majority of people the duration of suffering was shorter than one year. Following that they did not report on any issue related to a time one year after the accident. More than a third reported on sick leave resulting from the accident with a median duration of 14 days. 41 people needed a slow restart for work and 45 people (2.5% of all approached people) were unable to return to their old job. Several types of suffering from the accident were reported with a reasonable number of people reporting on problems although being uninjured or only MAIS 1-2 injured. The long term consequences being reported most often are:
• pain (4.4% of all people approached or 13.1% of the responders) • fears (6.3% of all people approached or 19.0% of the responders) • reduced performance at daily routine tasks (4.2% of all people approached or 12.5% of the
responders) • reduced performance at daily routine tasks (4.3% of all people approached or 13.1% of the
responders)
0%
10%
20%
30%
40%
50%
60%
70%
headinjuries
neckinjuries
thoraxinjuries
arminjuries
abdomeninjuries
pelvisinjuries
leg injuries
people with reduced peronal mobility all responders
When analyzing the injury pattern depending on the kind of problem head, thorax, pelvis and legs are often significantly associated with individual problems. After increasing the number of responses it is planned to ask the people with reported long term consequences for more details. 293 responders gave their informed consent for future studies (people without any problem were not explicitly asked for their consent). Most of the participants answered by normal mail (87%). However, 10.2% used the option of the online questionnaire and 2.8% answered by phone (mainly those without any problem). For future studies regarding long term consequences it appears important not to focus on RTC with high injury severity (e.g., MAIS 3+) because an important share of issues was also reported by people without injuries or low injury severity level. REFERENCES [1] REHABIL Partners: “Main Study Results.” http://rehabil-aid.seyp.teicrete.gr/main-study-
results/ [2] Andruszkow H et al. Subjective impact of traumatic brain injury on long-term outcome
at a minimum of 10 years after trauma – first results of a survey on 368 patients from a single academic trauma center in Germany. Patient Saf Surg 2013
[3] Andruszkow H et al. Physical and psychological long-term outcome after traumatic brain
injury in children and adult patients. Health Qual Life Outcomes 2014 [4] Auerbach K. Psychische Folgen von Verkehrsunfällen. Berichte der Bundesanstalt für
Straßenwesen, Mensch und Sicherheit Heft M245. 2014 [5] Blincoe, L. J., Miller, T. R., Zaloshnja, E., & Lawrence, B. A. (2014, May). The economic
and societal impact of motor vehicle crashes, 2010. (Report No. DOT HS 812 013). Washington, DC: National Highway Traffic Safety Administration.
[6] Löwe B, Zipfel S, Herzog W. Gesundheitsfragebogen für Patienten (PHQ-D).
Komplettversion und Kurzform. Testmappe mit vorläufigem Manual, Fragebögen, Schablonen. Karlsruhe: Pfizer, 2001, Evidenzklasse III
[7] Zeckey C et al. Head injury in polytrauma – is there an effect on outcome more than 10
years after the injury? Brain Inj 2011 [8] Otte D; Krettek C; Brunner H and Zwipp H (2003): “Scientific Approach and Methodology
of a New In-Depth-Investigation Study in Germany so called GIDAS”, ESV Conference, Japan, 2003
1
Hospitalization costs due to road traffic injuries: Results from a 1-year long-term study in 3 European countries Germany, Greece and Italy (REHABIL-
AID)
Otte, D. (1); von der Geest, M.(1); Wilhelmi, M.(1); Chliaoutakis, J. E.(2); Papadakaki, M.(2); Tzamalouka, G.(2); Montomoli, C.(3); Morandi, A.(3); Orsi, Ch.(3); Ottavia, F.(3);
(1) Hannover Medical School, Accident Research Unit and Surgeon Department, Germany
(2) Technological Educational Institute of Crete, School of Health and Social Welfare Department of Social Work, Laboratory of Health and Road Safety (LaHeRS), Greece
(3) Centre of Study and Research on Road Safety (CIRSS), University of Pavia, Italy A large number of road users involved in road traffic crashes recover from their injuries, but some of them never recover fully and suffer from some kind of permanent disability. In addition to loss of life or reduced quality of life, road accidents carry many and diverse consequences to the survivors such as legal implications, economic burden, job absences, need of care from a third person, home and vehicle adaptations as well as psychological Consequences (1). Within an EU funded project MOVE/C4/SUB/2011-294/SI2.628846 (REHABIL AID) these consequences were analyzed more detailed. Research strategy A total of seven public hospitals were involved in all the study sites; five in Greece (Region of Crete), one in Italy (Pavia) and one in Germany (Hannover). The study participants were enrolled during a 12-month period starting from April 2013. Eligibility for participation in the study was based on the following list of inclusion criteria: (a) injury sustained at Road Traffic Causes independently of the type of vehicle, (b) hospitalization ≥1day in the intensive or sub-intensive care unit of the selected hospitals, (c) age ≥18 years. Patients who accepted the invitation to participate in the study were monitored for one year after the date of admission to the intensive or sub-intensive care unit and were interviewed at three different time-points as follows: (a) at one month (baseline data), (b) at six months (1st follow up), and (c) at twelve months (2nd follow up). In addition to the self-reported information, all the eligible participants provided information drawn from their medical records. Procedures and Data Collection All patients that were admitted in the intensive or sub-intensive care units within 12-month enrollment period and met the inclusion criteria were invited to participate in the study. Written consent was requested by all the eligible patients prior to participation in the study upon receiving information about the study objectives and procedures. All patients were informed that the completion of the questionnaire was optional, all information provided would be handled with confidentiality, and that the questionnaires would become available to the principal investigators only and would be strictly used for research purposes. The interviewers were notified by the appointed nurses in each hospital about new admissions and arranged a meeting at a convenient time for the patients and their carers, so that the interviewers could come and collect the baseline data. The baseline data collection was carried out either at a hospital unit (usually orthopedics or neurological clinic), where the patient was transferred after discharge from the intensive or sub-intensive care unit or at their house if no further hospitalization was needed. The first and second follow up were carried out at the patients’ house upon telephone arrangement.
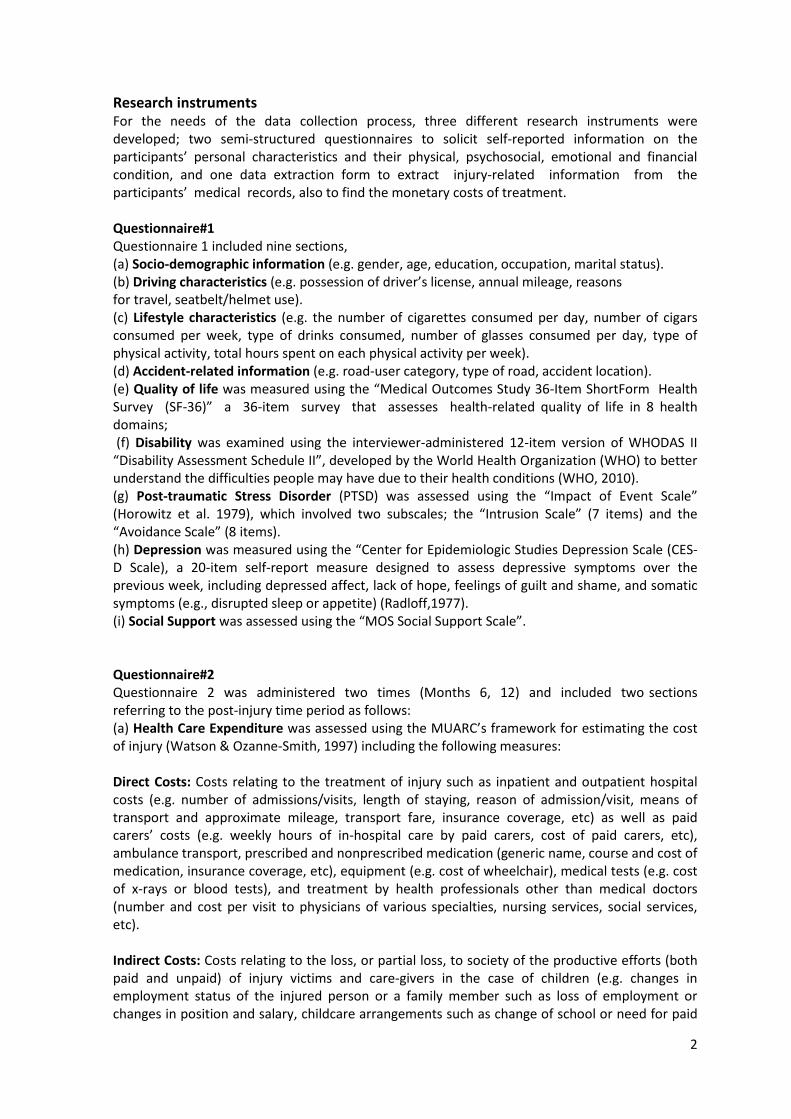
2
Research instruments For the needs of the data collection process, three different research instruments were developed; two semi-structured questionnaires to solicit self-reported information on the participants’ personal characteristics and their physical, psychosocial, emotional and financial condition, and one data extraction form to extract injury-related information from the participants’ medical records, also to find the monetary costs of treatment. Questionnaire#1 Questionnaire 1 included nine sections, (a) Socio-demographic information (e.g. gender, age, education, occupation, marital status). (b) Driving characteristics (e.g. possession of driver’s license, annual mileage, reasons for travel, seatbelt/helmet use). (c) Lifestyle characteristics (e.g. the number of cigarettes consumed per day, number of cigars consumed per week, type of drinks consumed, number of glasses consumed per day, type of physical activity, total hours spent on each physical activity per week). (d) Accident-related information (e.g. road-user category, type of road, accident location). (e) Quality of life was measured using the “Medical Outcomes Study 36-Item ShortForm Health Survey (SF-36)” a 36-item survey that assesses health-related quality of life in 8 health domains; (f) Disability was examined using the interviewer-administered 12-item version of WHODAS II “Disability Assessment Schedule II”, developed by the World Health Organization (WHO) to better understand the difficulties people may have due to their health conditions (WHO, 2010). (g) Post-traumatic Stress Disorder (PTSD) was assessed using the “Impact of Event Scale” (Horowitz et al. 1979), which involved two subscales; the “Intrusion Scale” (7 items) and the “Avoidance Scale” (8 items). (h) Depression was measured using the “Center for Epidemiologic Studies Depression Scale (CES-D Scale), a 20-item self-report measure designed to assess depressive symptoms over the previous week, including depressed affect, lack of hope, feelings of guilt and shame, and somatic symptoms (e.g., disrupted sleep or appetite) (Radloff,1977). (i) Social Support was assessed using the “MOS Social Support Scale”. Questionnaire#2 Questionnaire 2 was administered two times (Months 6, 12) and included two sections referring to the post-injury time period as follows: (a) Health Care Expenditure was assessed using the MUARC’s framework for estimating the cost of injury (Watson & Ozanne-Smith, 1997) including the following measures: Direct Costs: Costs relating to the treatment of injury such as inpatient and outpatient hospital costs (e.g. number of admissions/visits, length of staying, reason of admission/visit, means of transport and approximate mileage, transport fare, insurance coverage, etc) as well as paid carers’ costs (e.g. weekly hours of in-hospital care by paid carers, cost of paid carers, etc), ambulance transport, prescribed and nonprescribed medication (generic name, course and cost of medication, insurance coverage, etc), equipment (e.g. cost of wheelchair), medical tests (e.g. cost of x-rays or blood tests), and treatment by health professionals other than medical doctors (number and cost per visit to physicians of various specialties, nursing services, social services, etc). Indirect Costs: Costs relating to the loss, or partial loss, to society of the productive efforts (both paid and unpaid) of injury victims and care-givers in the case of children (e.g. changes in employment status of the injured person or a family member such as loss of employment or changes in position and salary, childcare arrangements such as change of school or need for paid

3
child-caregiver, in-house 12 adaptations such as ramp or stair lift or moving to a different house, etc.). In addition to the above, the questionnaire explored the participants governmental benefits and allowances due to disability. (b) Satisfaction from Medical Care was measured using the “Short-Form Patient Satisfaction Questionnaire (PSQ-18)” (Marshall & Hays, 1993). The PSQ-18 comprises The Data Extraction Form replicated an abbreviated structure and content of the national accident and injury database in Germany (German In-Depth Accident Study, GIDAS) for describing the detailed injuries with information on the body area of the injury (head, face, neck, thorax, abdomen, spine, upper extremities, lower extremities, and external), the type and the extent of the injury as well as information on the physical condition of the patient. The Abbreviated Injury Scale (AIS) was calculated for each participant based on AIS -2005 (Update 2008). A database Rehabil-Aid was developed by the coordinating team using the statistical package SPSS v. 21.0 and was delivered to all the participating countries for the data storage Description of participants in the study In Greece, a total of 52 patients admitted in the ICU due to injuries caused in a road traffic accident during the 12 months enrollment period (1st April 2013-31st March 2014). Out of the total patients admitted in ICU, 42 enrolled in the study and 10 dropped out before baseline. Out of the 42 patients that enrolled in the study, 4 patients dropped out at various stages (9.7% drop-out). Medical data have been obtained for all the patients admitted in ICU upon official permission. A total of 38 patients completed all follow up questionnaires and provided full data. In Germany, a total of 131 patients admitted in the ICU during the 12 months enrollment period (1st August 2013-31st July 2014). Out of the total patients admitted in ICU, 39 enrolled in the study and 92 dropped out before baseline (died, refused, in coma, foreigners unable to communicate, etc.). Out of the 39 patients that enrolled in the study, 19 patients dropped out at various stages (48.7% drop-out). Medical data have been obtained for all the patients admitted in ICU upon official permission. A total of 20 patients completed all follow up questionnaires and provided full data. In Italy, a total of 56 patients admitted in the ICU due to injury caused in a road accident during the 12 months enrollment period (1st April 2013-31st March 2014). Out of the total patients admitted in ICU, 40 enrolled in the study and 16 dropped out before baseline. Out of the 40 patients that enrolled in the study, 5 patients dropped out at various stages (12.5% drop-out). Medical data have been obtained for all the patients admitted in ICU upon official permission. A total of 35 patients completed all follow up questionnaires and provided full data. A total of 120 patients enrolled in the study in all the partner countries (GR=41, DE=39, IT=40). The majority of the respondents in all three countries were men. The Greek respondents were younger than the German and Italian. Most of the respondents in all the three countries were employed, with Germany having the highest percentage of employed respondents among the partner countries (table 1). The highest average number of km driven per year was recorded in the German respondents (p=0.03), while the highest percentage of road traffic crash involvement was recorded among the Greek and the Italian respondents (GR=41.5%, IT=37.5%) without this difference being statistically significant. The highest number of unemployed persons as patient were found for Greece (19.5%).
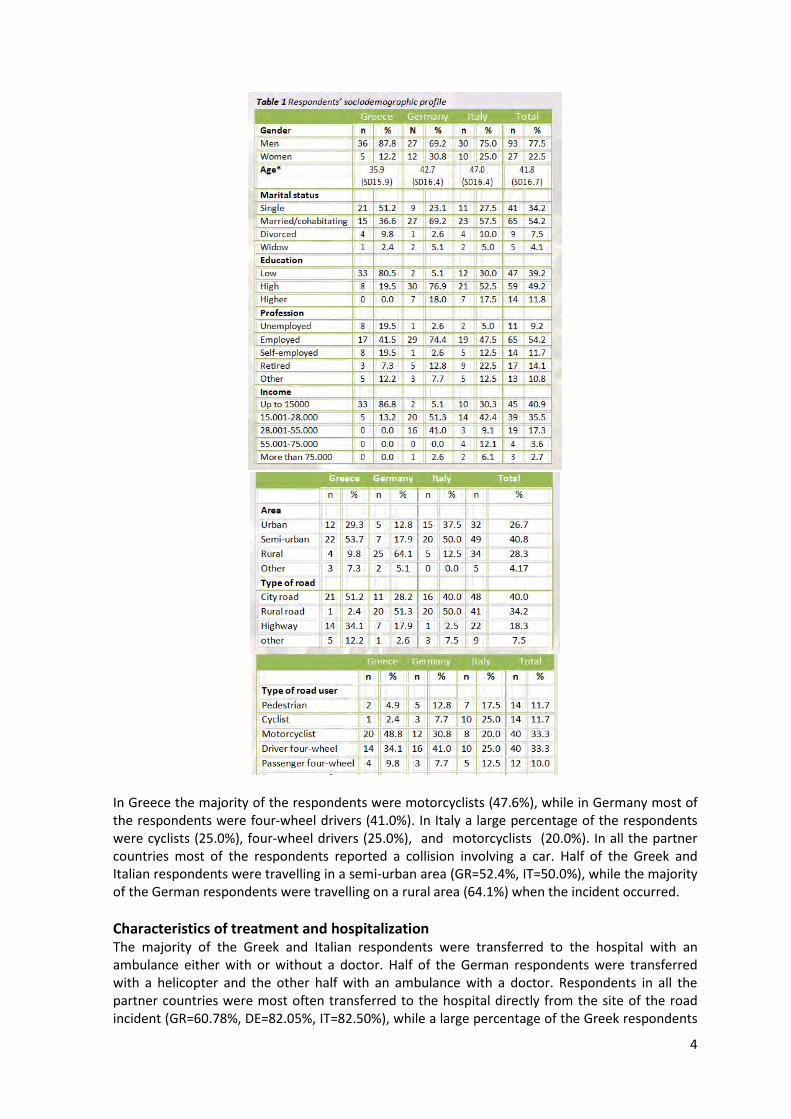
4
In Greece the majority of the respondents were motorcyclists (47.6%), while in Germany most of the respondents were four-wheel drivers (41.0%). In Italy a large percentage of the respondents were cyclists (25.0%), four-wheel drivers (25.0%), and motorcyclists (20.0%). In all the partner countries most of the respondents reported a collision involving a car. Half of the Greek and Italian respondents were travelling in a semi-urban area (GR=52.4%, IT=50.0%), while the majority of the German respondents were travelling on a rural area (64.1%) when the incident occurred. Characteristics of treatment and hospitalization The majority of the Greek and Italian respondents were transferred to the hospital with an ambulance either with or without a doctor. Half of the German respondents were transferred with a helicopter and the other half with an ambulance with a doctor. Respondents in all the partner countries were most often transferred to the hospital directly from the site of the road incident (GR=60.78%, DE=82.05%, IT=82.50%), while a large percentage of the Greek respondents
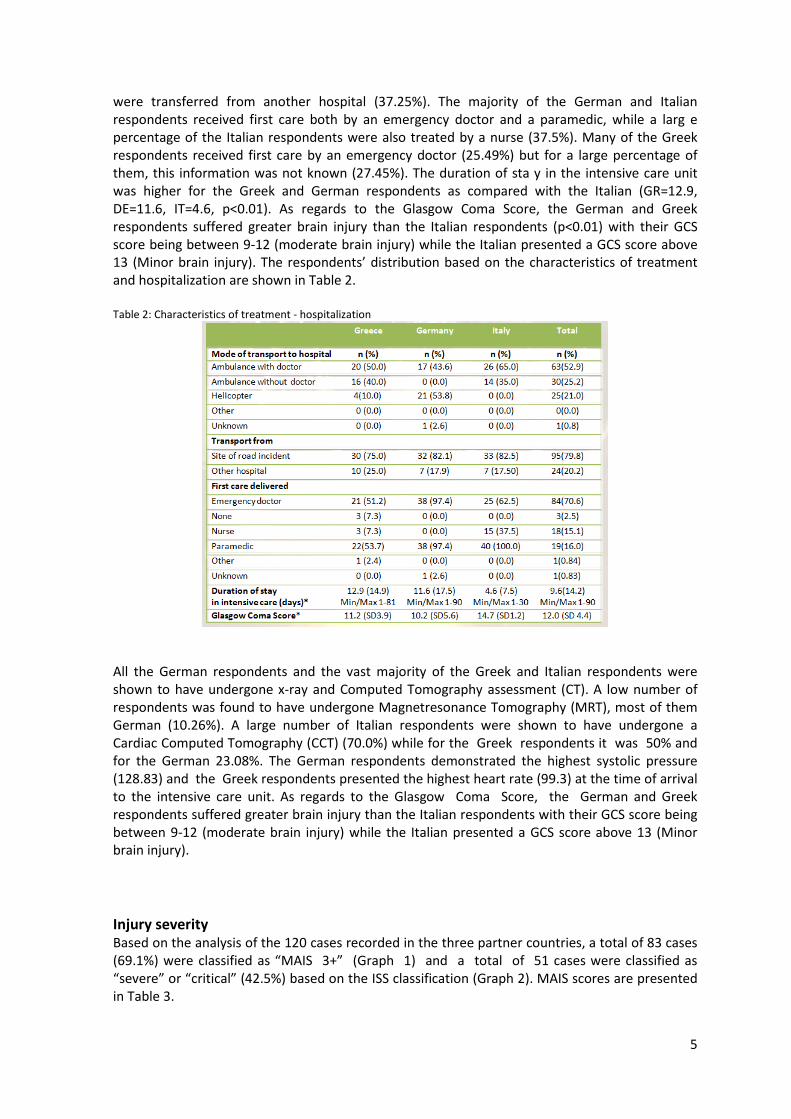
5
were transferred from another hospital (37.25%). The majority of the German and Italian respondents received first care both by an emergency doctor and a paramedic, while a larg e percentage of the Italian respondents were also treated by a nurse (37.5%). Many of the Greek respondents received first care by an emergency doctor (25.49%) but for a large percentage of them, this information was not known (27.45%). The duration of sta y in the intensive care unit was higher for the Greek and German respondents as compared with the Italian (GR=12.9, DE=11.6, IT=4.6, p<0.01). As regards to the Glasgow Coma Score, the German and Greek respondents suffered greater brain injury than the Italian respondents (p<0.01) with their GCS score being between 9-12 (moderate brain injury) while the Italian presented a GCS score above 13 (Minor brain injury). The respondents’ distribution based on the characteristics of treatment and hospitalization are shown in Table 2. Table 2: Characteristics of treatment - hospitalization
All the German respondents and the vast majority of the Greek and Italian respondents were shown to have undergone x-ray and Computed Tomography assessment (CT). A low number of respondents was found to have undergone Magnetresonance Tomography (MRT), most of them German (10.26%). A large number of Italian respondents were shown to have undergone a Cardiac Computed Tomography (CCT) (70.0%) while for the Greek respondents it was 50% and for the German 23.08%. The German respondents demonstrated the highest systolic pressure (128.83) and the Greek respondents presented the highest heart rate (99.3) at the time of arrival to the intensive care unit. As regards to the Glasgow Coma Score, the German and Greek respondents suffered greater brain injury than the Italian respondents with their GCS score being between 9-12 (moderate brain injury) while the Italian presented a GCS score above 13 (Minor brain injury). Injury severity Based on the analysis of the 120 cases recorded in the three partner countries, a total of 83 cases (69.1%) were classified as “MAIS 3+” (Graph 1) and a total of 51 cases were classified as “severe” or “critical” (42.5%) based on the ISS classification (Graph 2). MAIS scores are presented in Table 3.
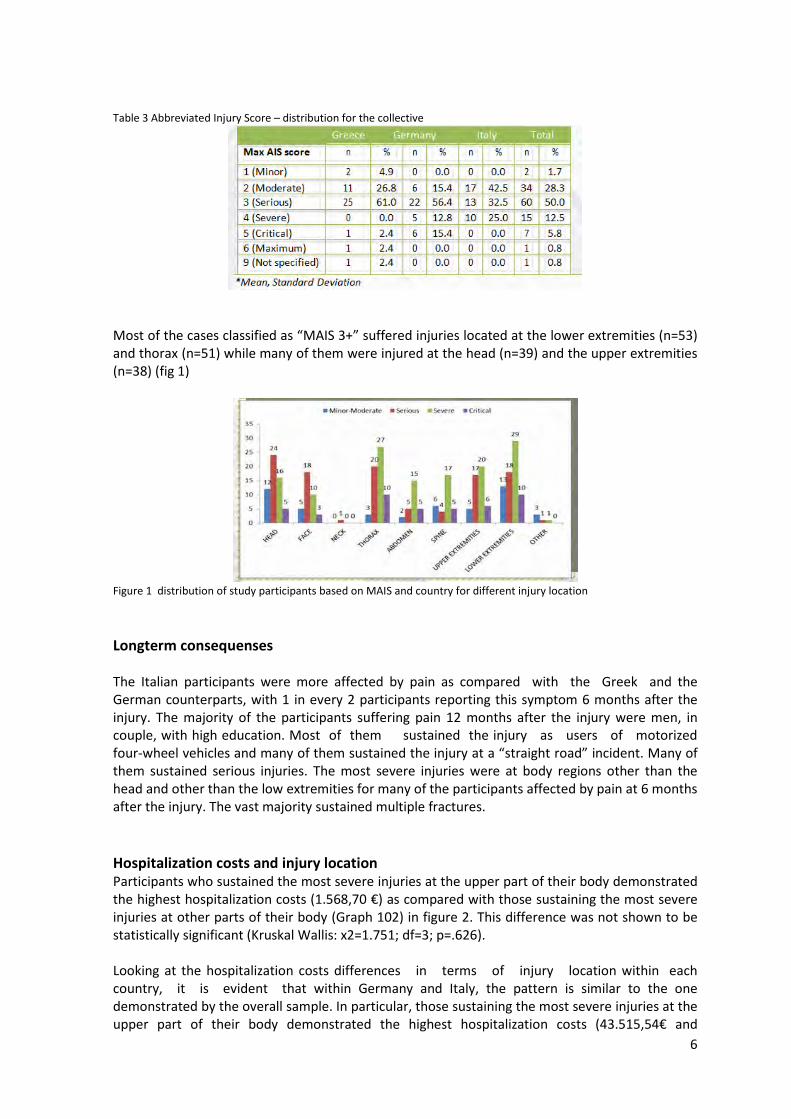
6
Table 3 Abbreviated Injury Score – distribution for the collective
Most of the cases classified as “MAIS 3+” suffered injuries located at the lower extremities (n=53) and thorax (n=51) while many of them were injured at the head (n=39) and the upper extremities (n=38) (fig 1)
Figure 1 distribution of study participants based on MAIS and country for different injury location Longterm consequenses The Italian participants were more affected by pain as compared with the Greek and the German counterparts, with 1 in every 2 participants reporting this symptom 6 months after the injury. The majority of the participants suffering pain 12 months after the injury were men, in couple, with high education. Most of them sustained the injury as users of motorized four-wheel vehicles and many of them sustained the injury at a “straight road” incident. Many of them sustained serious injuries. The most severe injuries were at body regions other than the head and other than the low extremities for many of the participants affected by pain at 6 months after the injury. The vast majority sustained multiple fractures. Hospitalization costs and injury location Participants who sustained the most severe injuries at the upper part of their body demonstrated the highest hospitalization costs (1.568,70 €) as compared with those sustaining the most severe injuries at other parts of their body (Graph 102) in figure 2. This difference was not shown to be statistically significant (Kruskal Wallis: x2=1.751; df=3; p=.626). Looking at the hospitalization costs differences in terms of injury location within each country, it is evident that within Germany and Italy, the pattern is similar to the one demonstrated by the overall sample. In particular, those sustaining the most severe injuries at the upper part of their body demonstrated the highest hospitalization costs (43.515,54€ and
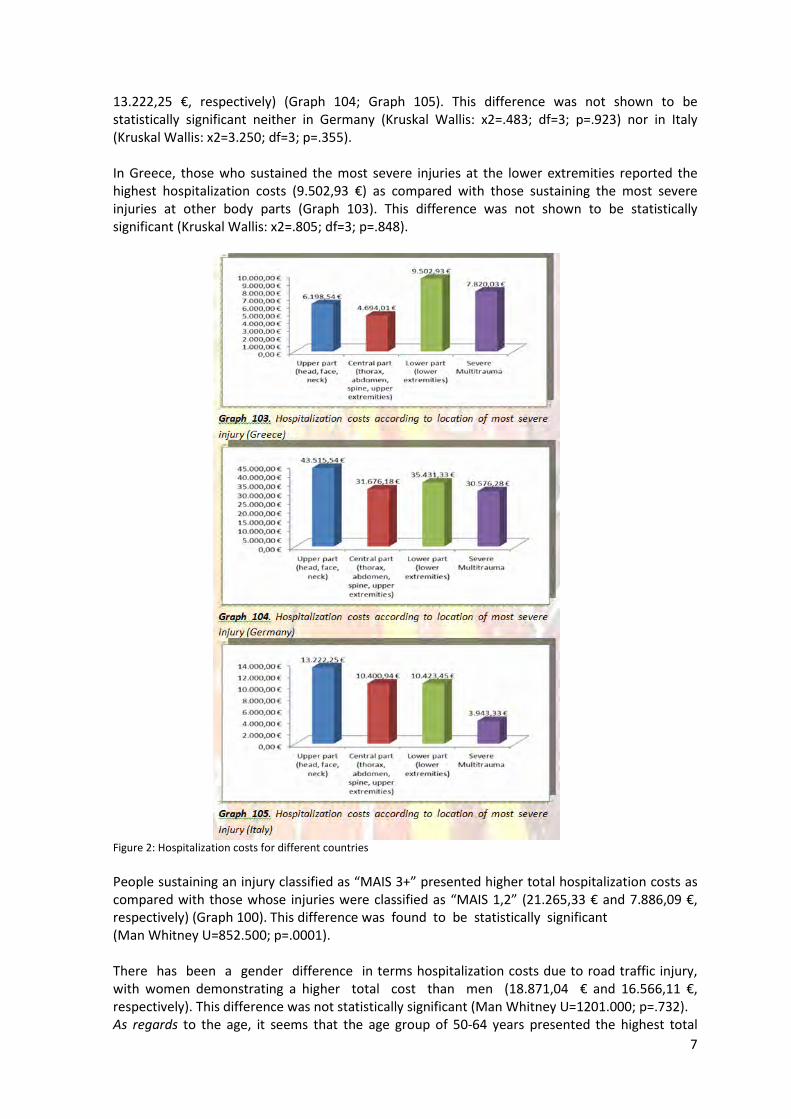
7
13.222,25 €, respectively) (Graph 104; Graph 105). This difference was not shown to be statistically significant neither in Germany (Kruskal Wallis: x2=.483; df=3; p=.923) nor in Italy (Kruskal Wallis: x2=3.250; df=3; p=.355). In Greece, those who sustained the most severe injuries at the lower extremities reported the highest hospitalization costs (9.502,93 €) as compared with those sustaining the most severe injuries at other body parts (Graph 103). This difference was not shown to be statistically significant (Kruskal Wallis: x2=.805; df=3; p=.848).
Figure 2: Hospitalization costs for different countries People sustaining an injury classified as “MAIS 3+” presented higher total hospitalization costs as compared with those whose injuries were classified as “MAIS 1,2” (21.265,33 € and 7.886,09 €, respectively) (Graph 100). This difference was found to be statistically significant (Man Whitney U=852.500; p=.0001). There has been a gender difference in terms hospitalization costs due to road traffic injury, with women demonstrating a higher total cost than men (18.871,04 € and 16.566,11 €, respectively). This difference was not statistically significant (Man Whitney U=1201.000; p=.732). As regards to the age, it seems that the age group of 50-64 years presented the highest total

8
hospitalization costs (23.346,48€) followed by the age group of >65 years (17.597,35 €). This difference was shown to be statistically significant (Kruskal Wallis: x2=8.002; df=3; p=.046) (Graph 98). Upon further analysis, statistically significant differences were demonstrated between the age groups “15-24 years” and “50-64 years” (Man Whitney U=220.000; p=.054) as well as between the age groups “25-49 years” and “50-64 years” (Man Whitney U=458.000; p=.005). As for the type of road user, it seems that those sustaining the injury as motorcyclists demonstrated the highest total hospitalization costs (23.766,83 €) as compared with those sustaining an injury as drivers or passengers of other means of transport (Graph 99). This difference was not shown to be statistically significant (Kruskal Wallis: x2=7.000; df=6; p=.321). Summary It is not surprising that Mediterranean countries have high proportions of motorcycle crash involvement with Greece, Malta, Cyprus, Italy and France having the highest proportions of deaths of motorized two-wheeler users among victims of road crashes, exceeding 1 in 4. A remarkable finding of this study is that the Italian respondents were less severely injured as compared with the Greek and the German respondents since the majority of them had a MAIS <3, a higher Glasgow Coma Score and a lower duration of stay in the intensive care unit than the Greek and German respondents. The characteristics of the road incident that caused the injury could explain this variation as many Italian respondents were pedestrians and cyclists and had a single collision, which was not very often the case for the Greek and German counterparts. Most importantly, the current study revealed several variations in the initial injury assessment and first care offered to the injured, which could be attributed to differences in the organization of the trauma care, the levels of investments in the trauma care infrastructure, the level of maturation of trauma systems and the level of enhancement of care protocols. In Greece for example, a large number of respondents were transferred from another hospital, which was not the case for Germany and Italy. In addition, rural health centres in Greece are often used as the first point of care in non - urban settings, without having the capacity to treat trauma patients. This implies that valuable time is lost from patient pre-hospital care and underlines the lack of appropriate units to treat trauma patients. Greece, in contrast with Germany and Italy, lacks an organized trauma system at the present moment and this is a serious shortcoming preventing optimized care and outcomes for trauma patients. This is evident also from the fact that a variety of health care providers were involved in the initial assessment and care of the respondents in Greece, while in the case of German and Italy this task was almost always under the responsibility of an emergency doctor along with a nurse or a paramedic. It has been noted that the composition of the health care providers treating trauma patients differs from country to country and that the level of training and the degree of professionalism involved can show wide variation. In Europe, the multi-specialist trauma team usually comprises anesthesiologists, surgeons, radiologists, emergency physicians etc. while trauma team leaders tend to be either emergency physicians, surgeons (orthopedic surgeons, neurosurgeons, general surgeons) or anesthesiologists and specialists in intensive care. The emergency dispatch centre is considered to play a critical role in the efficient use of trauma systems especially in order not to lose time for adequate treatment of the severely injured patients. Further to this, a two-tiered system with emergency medical technicians as the first tier and a MICU-team (mobile intensive care units) as the second tier has been set up in some countries in Europe (such as in Belgium, Germany, France, Italy) with promising outcomes. In fact trauma registries exist in Germany and Italy and many other European countries but not in Greece, even though this has been included among the national strategic action plan for road safety of 2008-2012.
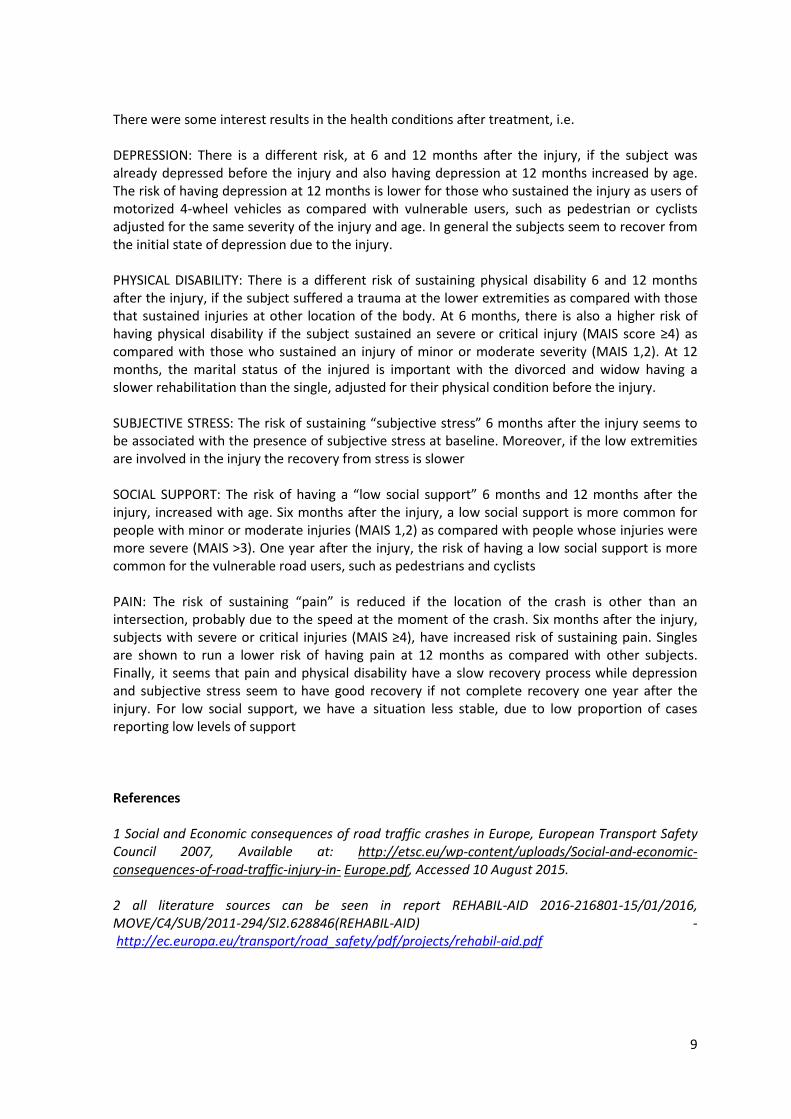
9
There were some interest results in the health conditions after treatment, i.e. DEPRESSION: There is a different risk, at 6 and 12 months after the injury, if the subject was already depressed before the injury and also having depression at 12 months increased by age. The risk of having depression at 12 months is lower for those who sustained the injury as users of motorized 4-wheel vehicles as compared with vulnerable users, such as pedestrian or cyclists adjusted for the same severity of the injury and age. In general the subjects seem to recover from the initial state of depression due to the injury. PHYSICAL DISABILITY: There is a different risk of sustaining physical disability 6 and 12 months after the injury, if the subject suffered a trauma at the lower extremities as compared with those that sustained injuries at other location of the body. At 6 months, there is also a higher risk of having physical disability if the subject sustained an severe or critical injury (MAIS score ≥4) as compared with those who sustained an injury of minor or moderate severity (MAIS 1,2). At 12 months, the marital status of the injured is important with the divorced and widow having a slower rehabilitation than the single, adjusted for their physical condition before the injury. SUBJECTIVE STRESS: The risk of sustaining “subjective stress” 6 months after the injury seems to be associated with the presence of subjective stress at baseline. Moreover, if the low extremities are involved in the injury the recovery from stress is slower SOCIAL SUPPORT: The risk of having a “low social support” 6 months and 12 months after the injury, increased with age. Six months after the injury, a low social support is more common for people with minor or moderate injuries (MAIS 1,2) as compared with people whose injuries were more severe (MAIS >3). One year after the injury, the risk of having a low social support is more common for the vulnerable road users, such as pedestrians and cyclists PAIN: The risk of sustaining “pain” is reduced if the location of the crash is other than an intersection, probably due to the speed at the moment of the crash. Six months after the injury, subjects with severe or critical injuries (MAIS ≥4), have increased risk of sustaining pain. Singles are shown to run a lower risk of having pain at 12 months as compared with other subjects. Finally, it seems that pain and physical disability have a slow recovery process while depression and subjective stress seem to have good recovery if not complete recovery one year after the injury. For low social support, we have a situation less stable, due to low proportion of cases reporting low levels of support References 1 Social and Economic consequences of road traffic crashes in Europe, European Transport Safety Council 2007, Available at: http://etsc.eu/wp-content/uploads/Social-and-economic-consequences-of-road-traffic-injury-in- Europe.pdf, Accessed 10 August 2015. 2 all literature sources can be seen in report REHABIL-AID 2016-216801-15/01/2016, MOVE/C4/SUB/2011-294/SI2.628846(REHABIL-AID) - http://ec.europa.eu/transport/road_safety/pdf/projects/rehabil-aid.pdf
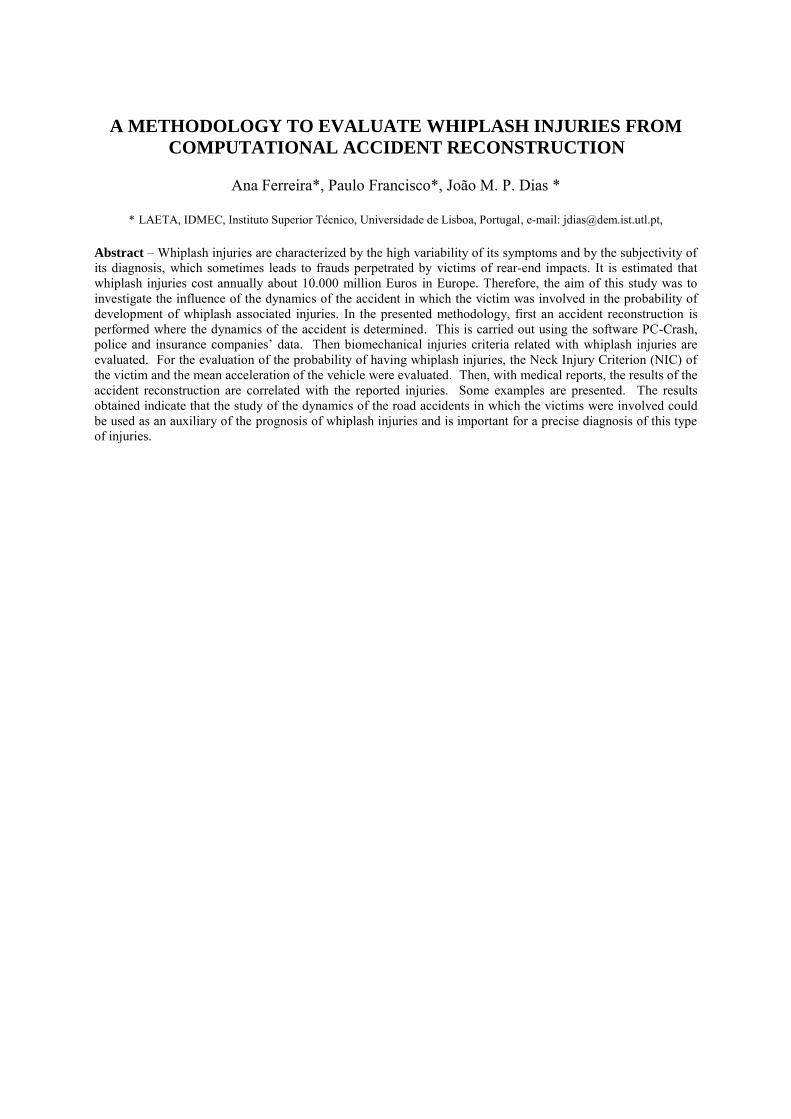
A METHODOLOGY TO EVALUATE WHIPLASH INJURIES FROM
COMPUTATIONAL ACCIDENT RECONSTRUCTION
Ana Ferreira*, Paulo Francisco*, João M. P. Dias *
* LAETA, IDMEC, Instituto Superior Técnico, Universidade de Lisboa, Portugal, e-mail: [email protected], Abstract – Whiplash injuries are characterized by the high variability of its symptoms and by the subjectivity of its diagnosis, which sometimes leads to frauds perpetrated by victims of rear-end impacts. It is estimated that whiplash injuries cost annually about 10.000 million Euros in Europe. Therefore, the aim of this study was to investigate the influence of the dynamics of the accident in which the victim was involved in the probability of development of whiplash associated injuries. In the presented methodology, first an accident reconstruction is performed where the dynamics of the accident is determined. This is carried out using the software PC-Crash, police and insurance companies’ data. Then biomechanical injuries criteria related with whiplash injuries are evaluated. For the evaluation of the probability of having whiplash injuries, the Neck Injury Criterion (NIC) of the victim and the mean acceleration of the vehicle were evaluated. Then, with medical reports, the results of the accident reconstruction are correlated with the reported injuries. Some examples are presented. The results obtained indicate that the study of the dynamics of the road accidents in which the victims were involved could be used as an auxiliary of the prognosis of whiplash injuries and is important for a precise diagnosis of this type of injuries.

The whiplash injuries are characterized by the high variability of its symptoms and by the subjectivity of its diagnosis, which sometimes leads to frauds perpetrated by the victims of rear-end impacts. Currently, there are no specific neuropsychological studies or electrophysiological tests that can be performed to diagnose a whiplash injury on the victim (Yadla, Ratliff, & Harrop, 2008) . Therefore, the aim of this study was to investigate the influence of the dynamic of the accident in which the victim was involved in the probability of development of whiplash associated injuries. Thus, computational simulations for three of the road accidents studied were performed, with the Pc-Crash software, to verify the influence of the dynamic of the impact on the development of whiplash. For the evaluation of the probability of having whiplash injuries, the Neck Injury Criterion (NIC) of the victim was implemented and the mean acceleration of the vehicle was also computed. The results obtained indicate that the study of the dynamic of the road accidents in which the victims were involved could be used as an auxiliary of the prognosis of whiplash injuries and is important for a precise diagnosis of this type of injuries.
Severe Abdominal Injuries for Car Occupants in Frontal Impact
T Hermitte and M Labrousse*, S Cuny**
*Laboratory of Accidentology Biomechanic and Human behavior, 132 rue des Suisses, 92000 Nanterre, France **Centre Européen d’Etudes et Sécurité et d’Analyse des Risques, 132 rue des Suisses, 92000 Nanterre, France
Abstract - In most of developed countries, the progress made in passive safety during the last three decades allowed to drastically reduce the number of killed and severely injured especially for occupants of passenger cars. This reduction is mainly observed for frontal impacts for which the AIS3+ injuries has been reduced about 52% for drivers and 38% for front passengers. The stiffening of the cars’ structure coupled with the generalization of airbags and the improvement of the seatbelt restraint (load limiter, pretension, etc.) allowed to protect vital body regions such as head, neck and thorax. However, the abdomen did not take advantage with so much success of this progress. The objective of this study is to draw up an inventory on the abdominal injuries of the belted car occupants involved in frontal impact, to present adapted counter-measures and to assess their potential effectiveness. In the first part the stakes corresponding to the abdominal injuries will be defined according to types of impact, seat location, occupants’ age and type of injured organs. Then, we shall focus on the abdominal injury risk curves for adults involved in frontal impact and on the comparisons of the average risks according to the seat location. In the second part we will list counter-measures and we shall calculate their effectiveness. The method of case control will be used in order to estimate odds ratio, comparing two samples, given by occupants having or not having the studied safety system. For this study, two type of data sources are used: national road injured accident census and retrospective in-depth accident data collection. Abdominal injuries are mainly observed in frontal impact (52%). Fatal or severe abdominal occupant’s injuries are observed at least in 27% of cases, ranking this body region as the most injured just after the thorax (51%). In spite of a twice lower occupation rate in the back seats compared to the front seats, the number of persons sustaining abdominal injuries at the rear place is higher than in the front place. In recent cars, the risk of having a serious or fatal abdominal injury in a frontal impact is 1.6% for the driver, 3.6% for the front passenger and 6.3% for the rear occupants. The most frequently hurt organs are the small intestine (17%), the spleen (16%) and the liver (13%). The most common countermeasures have a good efficiency in the reduction of the abdominal injuries for the adults: the stiffness of the structure of the seats allows decreasing the abdominal injury risk from 54% (driver) to 60% (front occupant), the seatbelt pretensioners decrease also this risk from 90% (driver) to 83% (front passenger). NOTATION EES Energy Equivalent Speed AIS2+ Injuries with an AIS ≥ 2 PC Passenger car INTRODUCTION In most of developed countries, the progress made in passive safety during the last three decades allowed to drastically reduce the number of killed and severely injured especially for occupants of passenger cars. This reduction is mainly observed for frontal impacts for which the AIS3+ injuries has been decreased about 52% for drivers and 38% for front passengers [1]. The stiffening of the cars’ structure coupled with the generalization of airbags and the improvement of the seatbelt restraint (load limiter, pretension, etc.) allowed to protect vital body regions such as head, neck and thorax. However, the abdomen did not take advantage with so much success of this progress. The aim of this paper is to highlight that abdominal injuries frequently occur in frontal crash today, either in front seat but especially in rear seats. Studies regarding abdominal injuries in the U.S. are already available in the literature [2, 3, 4]. The first part is based to a descriptive analysis on abdominal injuries from the databases available at LAB while the second part will be dedicated to the adapted counter-measure and their effect on the risk reduction.
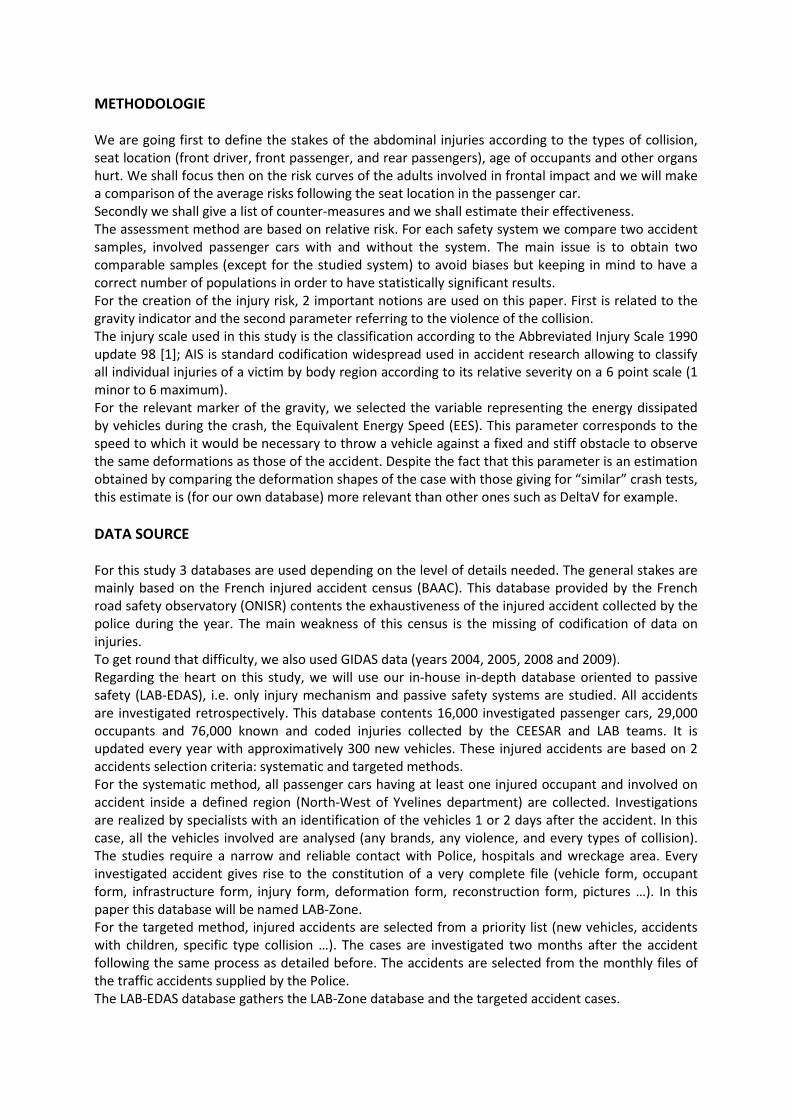
METHODOLOGIE We are going first to define the stakes of the abdominal injuries according to the types of collision, seat location (front driver, front passenger, and rear passengers), age of occupants and other organs hurt. We shall focus then on the risk curves of the adults involved in frontal impact and we will make a comparison of the average risks following the seat location in the passenger car. Secondly we shall give a list of counter-measures and we shall estimate their effectiveness. The assessment method are based on relative risk. For each safety system we compare two accident samples, involved passenger cars with and without the system. The main issue is to obtain two comparable samples (except for the studied system) to avoid biases but keeping in mind to have a correct number of populations in order to have statistically significant results. For the creation of the injury risk, 2 important notions are used on this paper. First is related to the gravity indicator and the second parameter referring to the violence of the collision. The injury scale used in this study is the classification according to the Abbreviated Injury Scale 1990 update 98 [1]; AIS is standard codification widespread used in accident research allowing to classify all individual injuries of a victim by body region according to its relative severity on a 6 point scale (1 minor to 6 maximum). For the relevant marker of the gravity, we selected the variable representing the energy dissipated by vehicles during the crash, the Equivalent Energy Speed (EES). This parameter corresponds to the speed to which it would be necessary to throw a vehicle against a fixed and stiff obstacle to observe the same deformations as those of the accident. Despite the fact that this parameter is an estimation obtained by comparing the deformation shapes of the case with those giving for “similar” crash tests, this estimate is (for our own database) more relevant than other ones such as DeltaV for example. DATA SOURCE For this study 3 databases are used depending on the level of details needed. The general stakes are mainly based on the French injured accident census (BAAC). This database provided by the French road safety observatory (ONISR) contents the exhaustiveness of the injured accident collected by the police during the year. The main weakness of this census is the missing of codification of data on injuries. To get round that difficulty, we also used GIDAS data (years 2004, 2005, 2008 and 2009). Regarding the heart on this study, we will use our in-house in-depth database oriented to passive safety (LAB-EDAS), i.e. only injury mechanism and passive safety systems are studied. All accidents are investigated retrospectively. This database contents 16,000 investigated passenger cars, 29,000 occupants and 76,000 known and coded injuries collected by the CEESAR and LAB teams. It is updated every year with approximatively 300 new vehicles. These injured accidents are based on 2 accidents selection criteria: systematic and targeted methods. For the systematic method, all passenger cars having at least one injured occupant and involved on accident inside a defined region (North-West of Yvelines department) are collected. Investigations are realized by specialists with an identification of the vehicles 1 or 2 days after the accident. In this case, all the vehicles involved are analysed (any brands, any violence, and every types of collision). The studies require a narrow and reliable contact with Police, hospitals and wreckage area. Every investigated accident gives rise to the constitution of a very complete file (vehicle form, occupant form, infrastructure form, injury form, deformation form, reconstruction form, pictures …). In this paper this database will be named LAB-Zone. For the targeted method, injured accidents are selected from a priority list (new vehicles, accidents with children, specific type collision …). The cases are investigated two months after the accident following the same process as detailed before. The accidents are selected from the monthly files of the traffic accidents supplied by the Police. The LAB-EDAS database gathers the LAB-Zone database and the targeted accident cases.
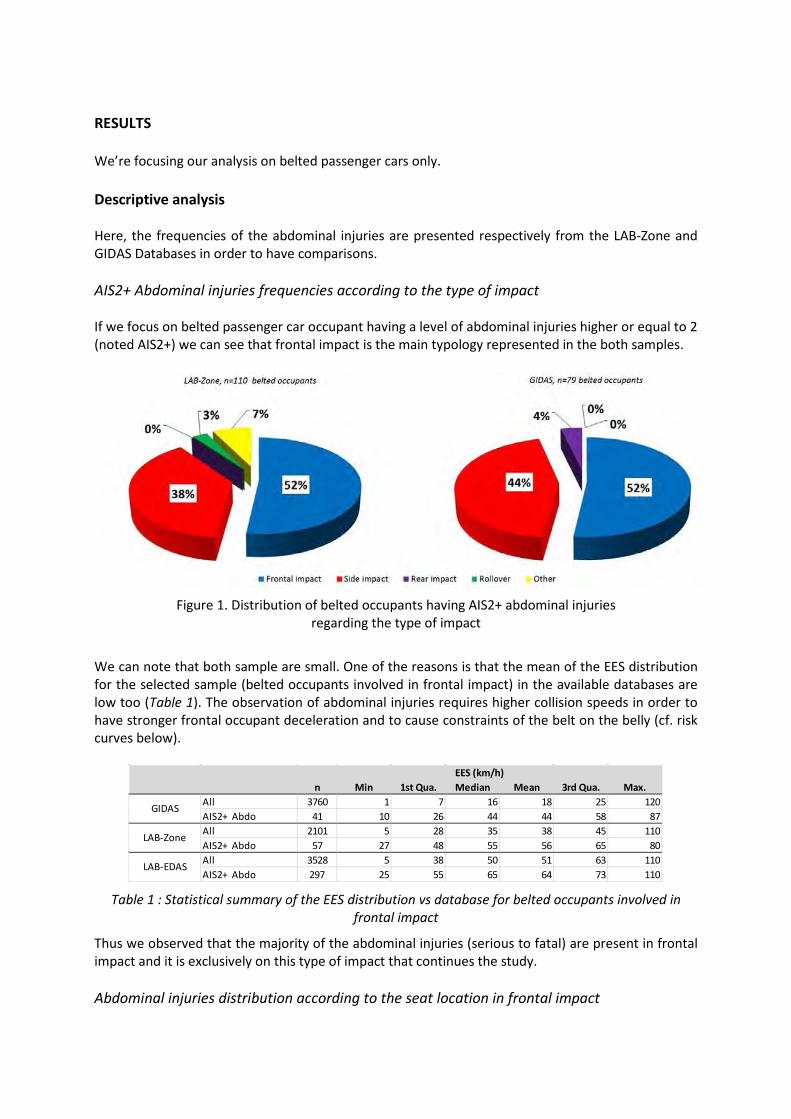
RESULTS We’re focusing our analysis on belted passenger cars only. Descriptive analysis Here, the frequencies of the abdominal injuries are presented respectively from the LAB-Zone and GIDAS Databases in order to have comparisons. AIS2+ Abdominal injuries frequencies according to the type of impact If we focus on belted passenger car occupant having a level of abdominal injuries higher or equal to 2 (noted AIS2+) we can see that frontal impact is the main typology represented in the both samples.
Figure 1. Distribution of belted occupants having AIS2+ abdominal injuries regarding the type of impact
We can note that both sample are small. One of the reasons is that the mean of the EES distribution for the selected sample (belted occupants involved in frontal impact) in the available databases are low too (Table 1). The observation of abdominal injuries requires higher collision speeds in order to have stronger frontal occupant deceleration and to cause constraints of the belt on the belly (cf. risk curves below).
Table 1 : Statistical summary of the EES distribution vs database for belted occupants involved in
frontal impact
Thus we observed that the majority of the abdominal injuries (serious to fatal) are present in frontal impact and it is exclusively on this type of impact that continues the study. Abdominal injuries distribution according to the seat location in frontal impact
n Min 1st Qua. Median Mean 3rd Qua. Max.All 3760 1 7 16 18 25 120AIS2+ Abdo 41 10 26 44 44 58 87All 2101 5 28 35 38 45 110AIS2+ Abdo 57 27 48 55 56 65 80All 3528 5 38 50 51 63 110AIS2+ Abdo 297 25 55 65 64 73 110
LAB-EDAS
EES (km/h)
GIDAS
LAB-Zone
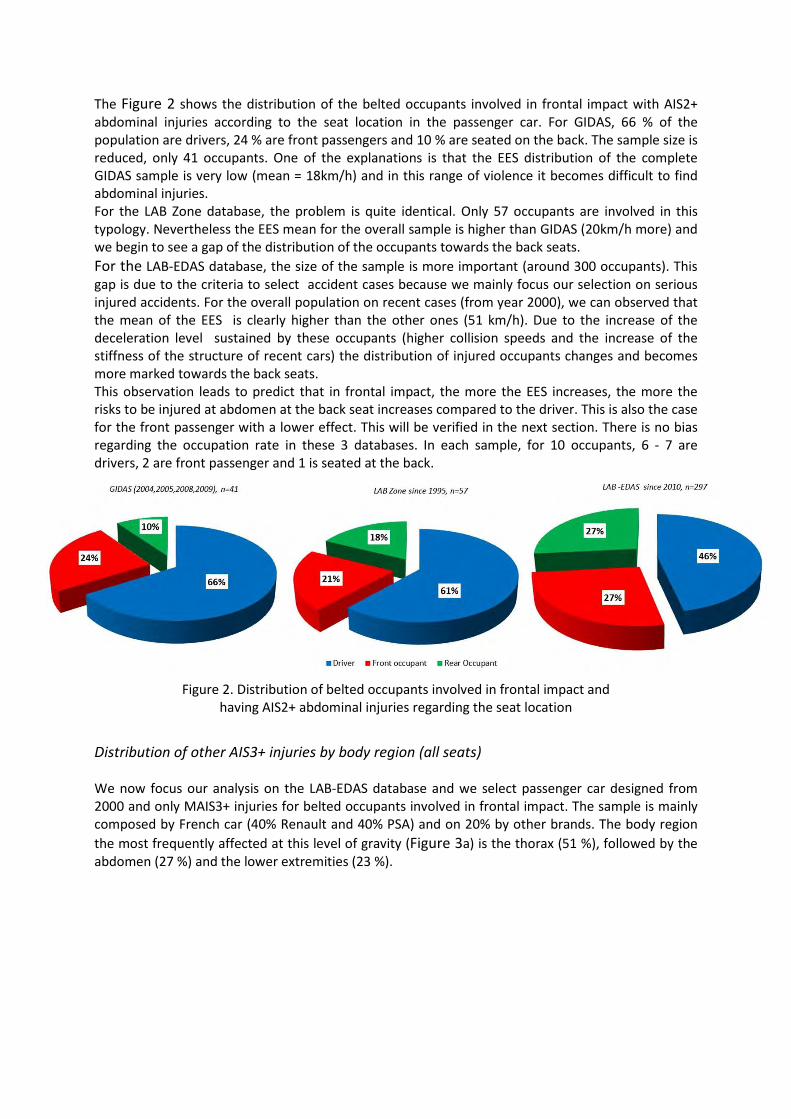
The Figure 2 shows the distribution of the belted occupants involved in frontal impact with AIS2+ abdominal injuries according to the seat location in the passenger car. For GIDAS, 66 % of the population are drivers, 24 % are front passengers and 10 % are seated on the back. The sample size is reduced, only 41 occupants. One of the explanations is that the EES distribution of the complete GIDAS sample is very low (mean = 18km/h) and in this range of violence it becomes difficult to find abdominal injuries. For the LAB Zone database, the problem is quite identical. Only 57 occupants are involved in this typology. Nevertheless the EES mean for the overall sample is higher than GIDAS (20km/h more) and we begin to see a gap of the distribution of the occupants towards the back seats. For the LAB-EDAS database, the size of the sample is more important (around 300 occupants). This gap is due to the criteria to select accident cases because we mainly focus our selection on serious injured accidents. For the overall population on recent cases (from year 2000), we can observed that the mean of the EES is clearly higher than the other ones (51 km/h). Due to the increase of the deceleration level sustained by these occupants (higher collision speeds and the increase of the stiffness of the structure of recent cars) the distribution of injured occupants changes and becomes more marked towards the back seats. This observation leads to predict that in frontal impact, the more the EES increases, the more the risks to be injured at abdomen at the back seat increases compared to the driver. This is also the case for the front passenger with a lower effect. This will be verified in the next section. There is no bias regarding the occupation rate in these 3 databases. In each sample, for 10 occupants, 6 - 7 are drivers, 2 are front passenger and 1 is seated at the back.
Figure 2. Distribution of belted occupants involved in frontal impact and having AIS2+ abdominal injuries regarding the seat location
Distribution of other AIS3+ injuries by body region (all seats) We now focus our analysis on the LAB-EDAS database and we select passenger car designed from 2000 and only MAIS3+ injuries for belted occupants involved in frontal impact. The sample is mainly composed by French car (40% Renault and 40% PSA) and on 20% by other brands. The body region the most frequently affected at this level of gravity (Figure 3a) is the thorax (51 %), followed by the abdomen (27 %) and the lower extremities (23 %).
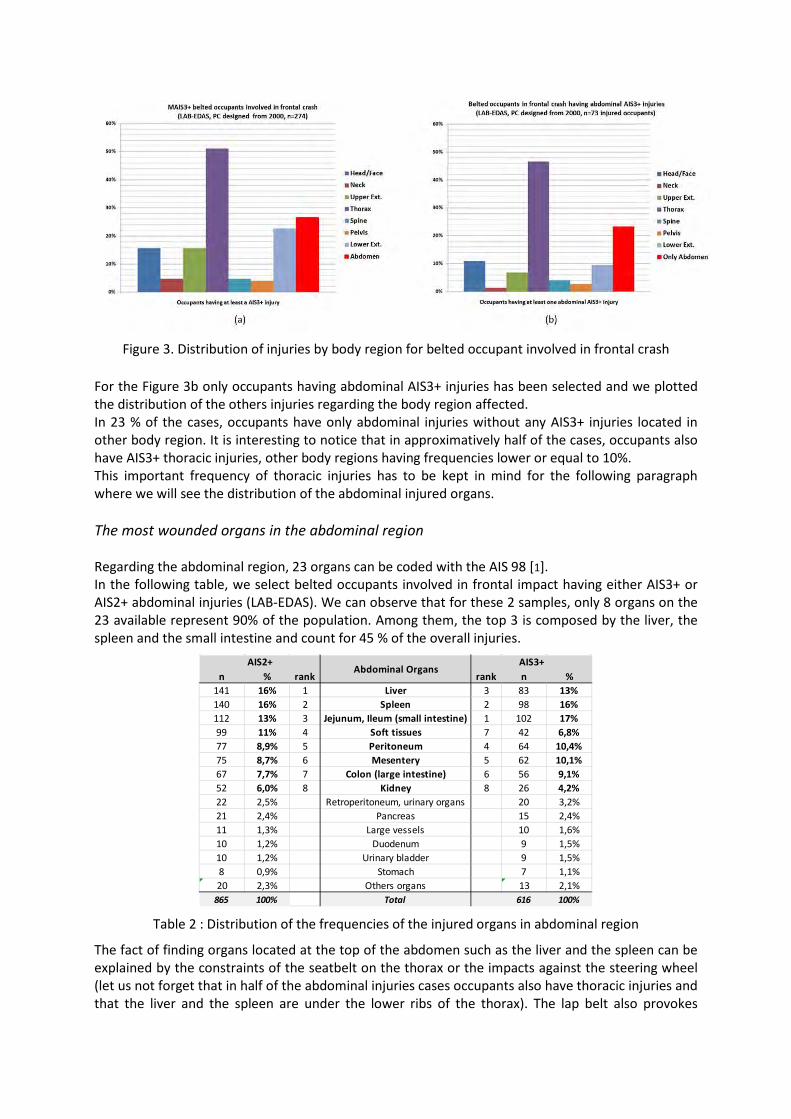
Figure 3. Distribution of injuries by body region for belted occupant involved in frontal crash For the Figure 3b only occupants having abdominal AIS3+ injuries has been selected and we plotted the distribution of the others injuries regarding the body region affected. In 23 % of the cases, occupants have only abdominal injuries without any AIS3+ injuries located in other body region. It is interesting to notice that in approximatively half of the cases, occupants also have AIS3+ thoracic injuries, other body regions having frequencies lower or equal to 10%. This important frequency of thoracic injuries has to be kept in mind for the following paragraph where we will see the distribution of the abdominal injured organs. The most wounded organs in the abdominal region Regarding the abdominal region, 23 organs can be coded with the AIS 98 [1]. In the following table, we select belted occupants involved in frontal impact having either AIS3+ or AIS2+ abdominal injuries (LAB-EDAS). We can observe that for these 2 samples, only 8 organs on the 23 available represent 90% of the population. Among them, the top 3 is composed by the liver, the spleen and the small intestine and count for 45 % of the overall injuries.
Table 2 : Distribution of the frequencies of the injured organs in abdominal region
The fact of finding organs located at the top of the abdomen such as the liver and the spleen can be explained by the constraints of the seatbelt on the thorax or the impacts against the steering wheel (let us not forget that in half of the abdominal injuries cases occupants also have thoracic injuries and that the liver and the spleen are under the lower ribs of the thorax). The lap belt also provokes
n % rank rank n %141 16% 1 Liver 3 83 13%140 16% 2 Spleen 2 98 16%112 13% 3 Jejunum, Ileum (small intestine) 1 102 17%99 11% 4 Soft tissues 7 42 6,8%77 8,9% 5 Peritoneum 4 64 10,4%75 8,7% 6 Mesentery 5 62 10,1%67 7,7% 7 Colon (large intestine) 6 56 9,1%52 6,0% 8 Kidney 8 26 4,2%22 2,5% Retroperitoneum, urinary organs 20 3,2%21 2,4% Pancreas 15 2,4%11 1,3% Large vessels 10 1,6%10 1,2% Duodenum 9 1,5%10 1,2% Urinary bladder 9 1,5%8 0,9% Stomach 7 1,1%20 2,3% Others organs 13 2,1%
865 100% Total 616 100%
AIS3+AIS2+Abdominal Organs
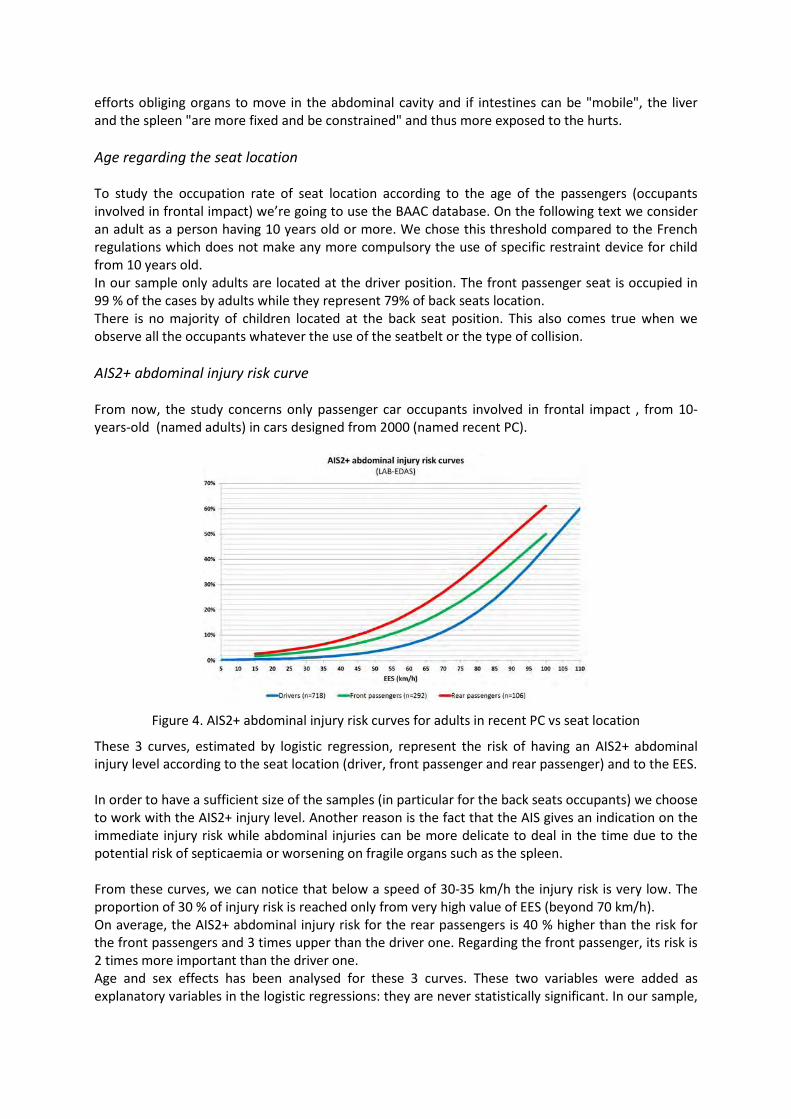
efforts obliging organs to move in the abdominal cavity and if intestines can be "mobile", the liver and the spleen "are more fixed and be constrained" and thus more exposed to the hurts. Age regarding the seat location To study the occupation rate of seat location according to the age of the passengers (occupants involved in frontal impact) we’re going to use the BAAC database. On the following text we consider an adult as a person having 10 years old or more. We chose this threshold compared to the French regulations which does not make any more compulsory the use of specific restraint device for child from 10 years old. In our sample only adults are located at the driver position. The front passenger seat is occupied in 99 % of the cases by adults while they represent 79% of back seats location. There is no majority of children located at the back seat position. This also comes true when we observe all the occupants whatever the use of the seatbelt or the type of collision. AIS2+ abdominal injury risk curve From now, the study concerns only passenger car occupants involved in frontal impact , from 10-years-old (named adults) in cars designed from 2000 (named recent PC).
Figure 4. AIS2+ abdominal injury risk curves for adults in recent PC vs seat location
These 3 curves, estimated by logistic regression, represent the risk of having an AIS2+ abdominal injury level according to the seat location (driver, front passenger and rear passenger) and to the EES. In order to have a sufficient size of the samples (in particular for the back seats occupants) we choose to work with the AIS2+ injury level. Another reason is the fact that the AIS gives an indication on the immediate injury risk while abdominal injuries can be more delicate to deal in the time due to the potential risk of septicaemia or worsening on fragile organs such as the spleen. From these curves, we can notice that below a speed of 30-35 km/h the injury risk is very low. The proportion of 30 % of injury risk is reached only from very high value of EES (beyond 70 km/h). On average, the AIS2+ abdominal injury risk for the rear passengers is 40 % higher than the risk for the front passengers and 3 times upper than the driver one. Regarding the front passenger, its risk is 2 times more important than the driver one. Age and sex effects has been analysed for these 3 curves. These two variables were added as explanatory variables in the logistic regressions: they are never statistically significant. In our sample,
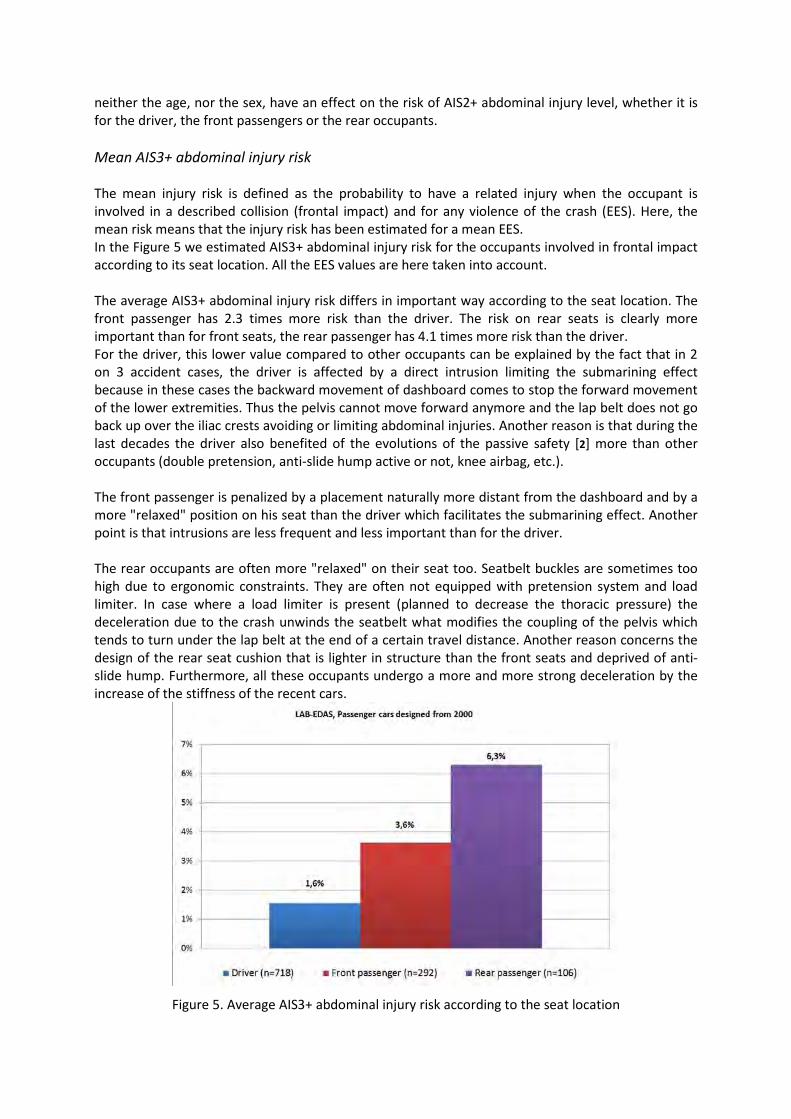
neither the age, nor the sex, have an effect on the risk of AIS2+ abdominal injury level, whether it is for the driver, the front passengers or the rear occupants. Mean AIS3+ abdominal injury risk The mean injury risk is defined as the probability to have a related injury when the occupant is involved in a described collision (frontal impact) and for any violence of the crash (EES). Here, the mean risk means that the injury risk has been estimated for a mean EES. In the Figure 5 we estimated AIS3+ abdominal injury risk for the occupants involved in frontal impact according to its seat location. All the EES values are here taken into account. The average AIS3+ abdominal injury risk differs in important way according to the seat location. The front passenger has 2.3 times more risk than the driver. The risk on rear seats is clearly more important than for front seats, the rear passenger has 4.1 times more risk than the driver. For the driver, this lower value compared to other occupants can be explained by the fact that in 2 on 3 accident cases, the driver is affected by a direct intrusion limiting the submarining effect because in these cases the backward movement of dashboard comes to stop the forward movement of the lower extremities. Thus the pelvis cannot move forward anymore and the lap belt does not go back up over the iliac crests avoiding or limiting abdominal injuries. Another reason is that during the last decades the driver also benefited of the evolutions of the passive safety [2] more than other occupants (double pretension, anti-slide hump active or not, knee airbag, etc.). The front passenger is penalized by a placement naturally more distant from the dashboard and by a more "relaxed" position on his seat than the driver which facilitates the submarining effect. Another point is that intrusions are less frequent and less important than for the driver. The rear occupants are often more "relaxed" on their seat too. Seatbelt buckles are sometimes too high due to ergonomic constraints. They are often not equipped with pretension system and load limiter. In case where a load limiter is present (planned to decrease the thoracic pressure) the deceleration due to the crash unwinds the seatbelt what modifies the coupling of the pelvis which tends to turn under the lap belt at the end of a certain travel distance. Another reason concerns the design of the rear seat cushion that is lighter in structure than the front seats and deprived of anti-slide hump. Furthermore, all these occupants undergo a more and more strong deceleration by the increase of the stiffness of the recent cars.
Figure 5. Average AIS3+ abdominal injury risk according to the seat location
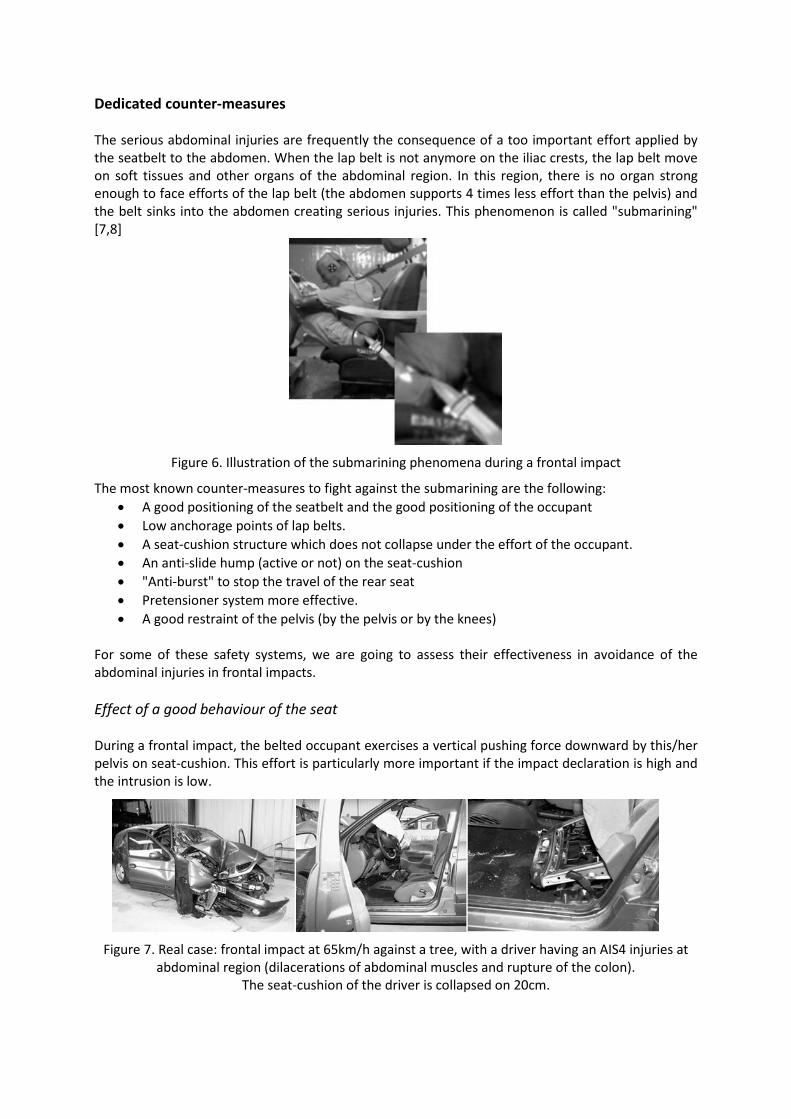
Dedicated counter-measures The serious abdominal injuries are frequently the consequence of a too important effort applied by the seatbelt to the abdomen. When the lap belt is not anymore on the iliac crests, the lap belt move on soft tissues and other organs of the abdominal region. In this region, there is no organ strong enough to face efforts of the lap belt (the abdomen supports 4 times less effort than the pelvis) and the belt sinks into the abdomen creating serious injuries. This phenomenon is called "submarining" [7,8]
Figure 6. Illustration of the submarining phenomena during a frontal impact
The most known counter-measures to fight against the submarining are the following: • A good positioning of the seatbelt and the good positioning of the occupant • Low anchorage points of lap belts. • A seat-cushion structure which does not collapse under the effort of the occupant. • An anti-slide hump (active or not) on the seat-cushion • "Anti-burst" to stop the travel of the rear seat • Pretensioner system more effective. • A good restraint of the pelvis (by the pelvis or by the knees)
For some of these safety systems, we are going to assess their effectiveness in avoidance of the abdominal injuries in frontal impacts. Effect of a good behaviour of the seat During a frontal impact, the belted occupant exercises a vertical pushing force downward by this/her pelvis on seat-cushion. This effort is particularly more important if the impact declaration is high and the intrusion is low.
Figure 7. Real case: frontal impact at 65km/h against a tree, with a driver having an AIS4 injuries at abdominal region (dilacerations of abdominal muscles and rupture of the colon).
The seat-cushion of the driver is collapsed on 20cm.
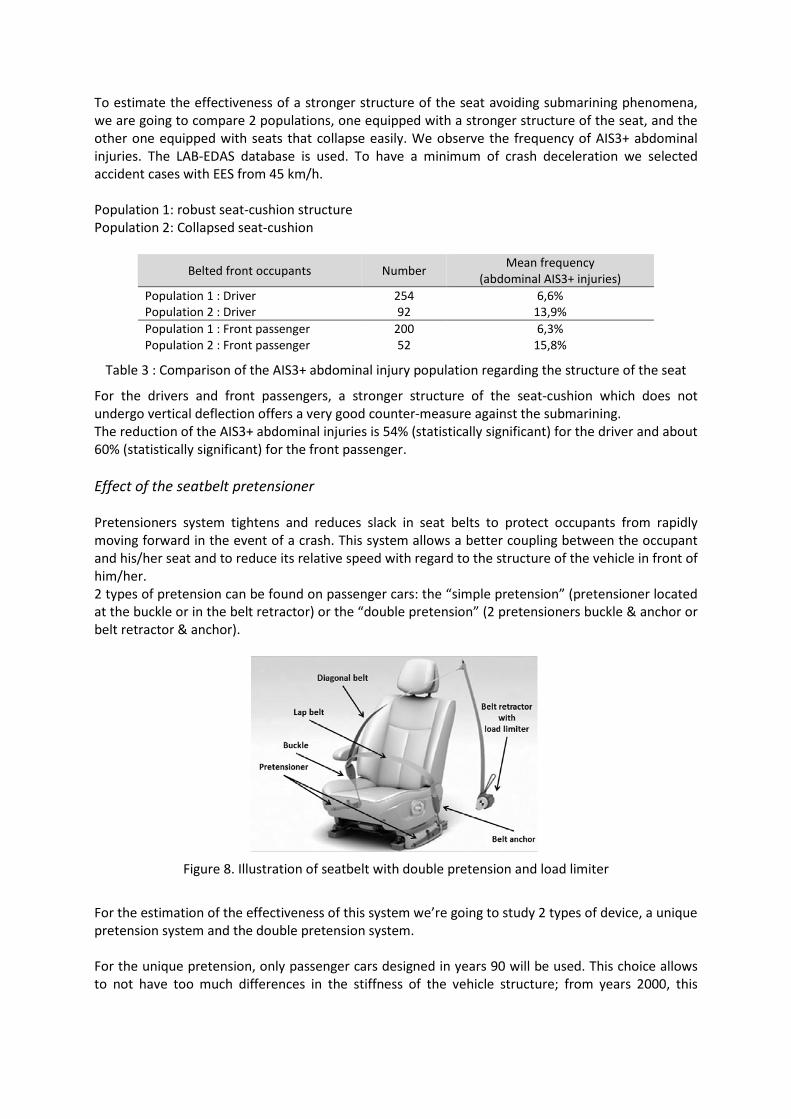
To estimate the effectiveness of a stronger structure of the seat avoiding submarining phenomena, we are going to compare 2 populations, one equipped with a stronger structure of the seat, and the other one equipped with seats that collapse easily. We observe the frequency of AIS3+ abdominal injuries. The LAB-EDAS database is used. To have a minimum of crash deceleration we selected accident cases with EES from 45 km/h. Population 1: robust seat-cushion structure Population 2: Collapsed seat-cushion
Belted front occupants Number Mean frequency (abdominal AIS3+ injuries)
Population 1 : Driver 254 6,6% Population 2 : Driver 92 13,9% Population 1 : Front passenger 200 6,3% Population 2 : Front passenger 52 15,8%
Table 3 : Comparison of the AIS3+ abdominal injury population regarding the structure of the seat
For the drivers and front passengers, a stronger structure of the seat-cushion which does not undergo vertical deflection offers a very good counter-measure against the submarining. The reduction of the AIS3+ abdominal injuries is 54% (statistically significant) for the driver and about 60% (statistically significant) for the front passenger. Effect of the seatbelt pretensioner Pretensioners system tightens and reduces slack in seat belts to protect occupants from rapidly moving forward in the event of a crash. This system allows a better coupling between the occupant and his/her seat and to reduce its relative speed with regard to the structure of the vehicle in front of him/her. 2 types of pretension can be found on passenger cars: the “simple pretension” (pretensioner located at the buckle or in the belt retractor) or the “double pretension” (2 pretensioners buckle & anchor or belt retractor & anchor).
Figure 8. Illustration of seatbelt with double pretension and load limiter
For the estimation of the effectiveness of this system we’re going to study 2 types of device, a unique pretension system and the double pretension system. For the unique pretension, only passenger cars designed in years 90 will be used. This choice allows to not have too much differences in the stiffness of the vehicle structure; from years 2000, this

stiffness increases appreciably and before 1990 the structures are less stiff. Furthermore from 2000s, there are almost no more cars without pretension. In that case we compare the 2 following populations:
• Population 1: occupants having a unique pretension system (85% at the buckle, 15% at the seatbelt retractor)
• Population 2: occupants without any pretension system For the both population, we selected only passengers cars without airbags and with an intrusion of the dashboard limited to 5cm.
Belted front occupants Number Mean frequency (abdominal AIS3+ injuries)
Population 1 : Driver 253 0% Population 2 : Driver 204 1,7% Population 1 : Front passenger 180 0,8% Population 2 : Front passenger 115 4,8%
Table 4 : Comparison of the AIS3+ abdominal injury population regarding the unique pretension
None of 253 drivers equipped with simple pretension has AIS3 + abdominal injury while there are 2 drivers on 204 for the population 2 (not equipped with the pretension). Considering the low number of injured occupants these results are not significant. For the front passenger the reduction of the risk by the simple pretension is significant. This system allows to reduce AIS3+ abdominal injuries by 83% (63% for the AIS2+). Regarding the double pretension system, we selected passenger cars designed from 2000. In that case we compare the 2 following populations:
• Population 1: occupants having a double pretension system • Population 2: occupants having a unique pretension system
For the both population, we selected only passengers cars without knee airbags and with an intrusion of the dashboard limited to 5cm.
Belted front occupants Number Mean frequency (abdominal AIS3+ injuries)
Population 1 : Driver 193 1,1% Population 2 : Driver 266 1,9% Population 1 : Front passenger 63 0,5% Population 2 : Front passenger 198 4,5%
Table 5 : Comparison of the AIS3+ abdominal injury population regarding the double pretension
From this table we can see that drivers equipped with double pretension have an average AIS3+ abdominal injury risk 42 % lower compared with the driver equipped with simple pretension, but this result is not statistically significant and request to be verified when a more consequent sample will be available. Concerning the front passengers, this risk for those who are equipped with a double pretension is 90% lower than those equipped with a simple pretension, this result being statistically significant. Effect of the knee airbag Knee airbags are installed in the lower portion of the dashboard, directly in front of the driver’s knees. When a collision occurs, they inflate to fill the space between the dashboard and the driver’s lower legs. By reducing the amount of movement of the occupant’s pelvis region and back, these airbags reduce the load on the pelvis support area. In order to estimate the effectiveness of this device, we compare the two following populations:
• Population 1: drivers equipped with knee airbag (without double pretention) • Population 2: drivers not equipped and without double pretension
For the both population, we selected only passengers cars designed from 2000 and with an intrusion of the dashboard limited to 5cm.
Belted drivers Number Mean frequency (abdominal AIS3+ injuries)
Population 1 : with knee airbag 50 0% Population 2 : not equipped 279 2,3%
Table 6 : Comparison of the AIS3+ abdominal injury population regarding the presence or not of the knee airbag
No AIS3+ abdominal injury is observed for the sample equipped with airbag of knee (only an AIS2 in the spleen is listed) while 9 cases are present in the population 2. Because the size of the populations are not big enough the estimation of the effectiveness is not possible here. Effect of double pretension coupled with knee airbag Considering the previous analysis, the combination of the double pretension and the knee airbag, in theory, present a big effectiveness in the reduction of abdominal injuries. However, the LAB-EDAS database, includes only 12 passengers cars involved in frontal impact and equipped with both systems. Any statistical processing is consequently excluded. Nevertheless, it is interesting to indicate that among this 12 passenger cars (11 Citroën C4 Picasso and 1 Mercedes C Class), no abdominal injury is observed on the belted drivers. The EES of these crashes are relatively high and go from 28km/h to 105km/h with a mean and a median at 60 km/h. CONCLUSION The abdominal injuries are mainly observed in frontal impact (52%). For this type of collision the abdomen is the region the most severely injured (AIS3+) just after the thorax. In the abdominal region, the liver, the spleen and the small intestine are the most often injured organs. The deceleration level plays an important role on abdominal injuries: the more the violence of impact increases, the more abdominal injuries are observed for front passengers and especially for the rear occupants. For the adults: the rear passenger has 4 times more risk to have severe abdominal injuries than the driver and 1.7 times more than the front passenger. The risk of severe abdominal injuries is a major problem for the rear passengers and for the front passenger but not for the driver (do not to forget the thorax which is always at the top of the severe injuries risks). Regarding adapted counter-measures:
• the resistance of the seat-cushion don’t have to be neglected • the location of the seatbelt buckles have to be low • Prevent the displacement of the pelvis by pretension, anti-sliding hump (active or not) or
airbag knee without focusing to avoid small intrusions REFERENCES 1. Labrousse M., Hermitte T., Hervé V., Bertholon N., Guillaume A.., Evolution of front car occupants injuries in frontal impacts considering the improvements of passive safety technologies, EAEC 2011

2. Huelke D., Mackay G. & Morris A.Intrabdominal injuries associated with lap shoulder belt usage. Proc., S.A.E. Conf.,S.A.E. Paper 930639; 1993.
3. Elhagediab A. & Rouhana S. Patterns of abdominal injury in frontal automotive crashes. 16th ESV Conference, Windsor Canada, 98-Sl-W-26; 1998.
4. Yoganandan N., Pintar F., Generalli A. & al. Patterns of abdominal injuries in frontal and side impacts. 44th Annual Proceedings AAAM, Chicago, Illinois, 44:17-36; 2000.
5. Huere J.F., Forêt-Bruno J.Y., Faverjon, G.,Le Coz J.Y., Airbag efficiency in frontal real world accidents, 18 th ESV Conference, Amsterdam, June 2001, Paper number: 2001-S1-O-193
6. Association for the Advancement of Automotive Medicine. The Abbreviated Injury Scale 1990 revision-Update 98Des Plains, IL 60018. USA: Association for the Advancement of Automotive Medicine.
7. Couturier S., Faure J., Satué R. Huguet J. Hordonneau J., Procedure to assess submarining in frontal impact, Paper Number 07-0481, ESV 2007
8. Uriot J., Baudrit P., Potier P., Trosseille X., Petit P., Guillemot H. Guerin L. Valencien G., Investigations on the belt-to-pelvis interaction in case of submarining, Stapp Car Crash J., 50, 2006
9. Faure J., Couturier S., Labrousse M., The benefits of double pretension in decreasing knees & lower legs injuries in frontal impacts, ESV 2007
10. Leport T., Baudrit P. Petit P., Trosseille X. , Evaluation of the risk of injury caused by a knee airbag in out-of- position, ESV 2009
Working Paper ESAR 2016
Biomechanical Analysis of traffic Accident related aortic Injuries over the
past 40 Years
Stephan Brand, Christian Müller, Thorsten Facius, Sebastian Decker, Christian Krettek and
Dietmar Otte
Hannover Medical School, Germany, with Traffic Accident Research Unit
ABSTRACT –
Still correlated with high mortality rates in traffic accidents traumatic aortic ruptures were frequently detected in
unprotected car occupants in the early years. This biomechanical analysis investigates the different kinds of
injury mechanisms leading to traumatic aortic injuries in today`s traffic accidents and how the way of traffic
participation affects the frequency of those injuries over the years. Based on GIDAS reported traffic accidents
from 1973 to 2014 are analyzed.
Results show that traumatic aortic injuries are mainly observed in high-speed accidents with high body
deceleration and direct load force to the chest. Mostly chest compression is responsible for the load direction to
the cardiac vessels. The main observed load vector is from caudal-ventral and from ventral solely, but also force
impact from left and right side and in roll-over events with chest compression lead to traumatic aortic injuries.
Classically, the injury appeares at the junction between the well-fixed aortic arch and the pars decendens
following a kind of a scoop mechanism, a few cases with a hyperflexion mechanism are also described. In our
analysis the deceleration effect alone never led to an aortic rupture.
Comparing the past 40 years aortic injuries shift from unprotected car occupants to today`s unprotected
vulnerable road users like pedestrians, cyclists and motorcyclists.
Still the accident characteristics are linked with chest compression force under high speed impact, no seatbelt
and direct body impact.
KEYWORDS – Injury Mechanism, Aortic Ruptures, Biomechanics, In-Depth-Accident-Study, Traffic
Accidents
Introduction
In this study, the occurrence and frequencies as well as the mechanisms and the causes
of aortic ruptures are analyzed over the past 40 years. Traffic accidents from the years
1973 to 2014 are included with car occupants, occupants of trucks, pedestrians and
riders of motorized two wheelers as well as bicyclists.
Earlier studies already showed the high percentage of lethal aortic injuries following
vehicle accidents making these injuries the second most common death behind
traumatic brain injuries.
Literature research on the biomechanical impact leading to fatal aortic injuries showed a
shoveling effect on the thorax site transferring the load by the steering wheel following
most frequently frontal impacts in unbelted situations.
Methods, Data Acquisition and Results For this study accidents from the years 1973-2014 were analyzed. In order to avoid any
bias in the database, the data collected in the study is compared annually to the official
accident statistics and all police reported accidents for estimation of weighting factors.
This process explains why the data captured by the research teams can be seen as
representative for their areas .
As reference data the official accident data of the respective year from the German
National Statistics Office (Destatis 2014 - Federal Bureau of Statistics) was used. As
weighting factors the accident site (rural, urban), the main accident type (1 to 7) and the
injury severity (slightly injured, severely injured, fatal) were used. This resulted in 2 × 7
× 3 = 42 weighting factors for the analysis. This implies that the used absolute n-
numbers in this study and the percentage numbers can't be directly converted into each
other if weighting was done.
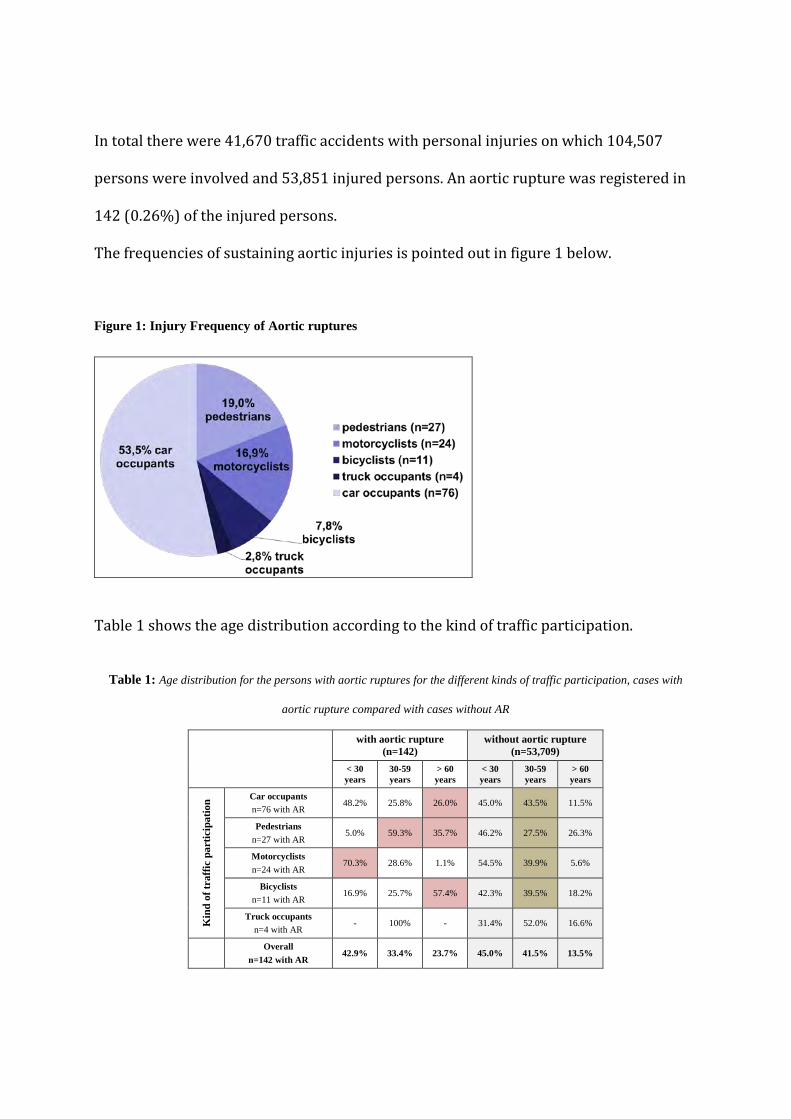
In total there were 41,670 traffic accidents with personal injuries on which 104,507
persons were involved and 53,851 injured persons. An aortic rupture was registered in
142 (0.26%) of the injured persons.
The frequencies of sustaining aortic injuries is pointed out in figure 1 below.
Figure 1: Injury Frequency of Aortic ruptures
Table 1 shows the age distribution according to the kind of traffic participation.
Table 1: Age distribution for the persons with aortic ruptures for the different kinds of traffic participation, cases with
aortic rupture compared with cases without AR
with aortic rupture
(n=142) without aortic rupture
(n=53,709) < 30 years
30-59 years
> 60 years
< 30 years
30-59 years
> 60 years
Kin
d of
traf
fic p
artic
ipat
ion Car occupants
n=76 with AR 48.2% 25.8% 26.0% 45.0% 43.5% 11.5%
Pedestrians n=27 with AR
5.0% 59.3% 35.7% 46.2% 27.5% 26.3%
Motorcyclists n=24 with AR
70.3% 28.6% 1.1% 54.5% 39.9% 5.6%
Bicyclists n=11 with AR
16.9% 25.7% 57.4% 42.3% 39.5% 18.2%
Truck occupants n=4 with AR
- 100% - 31.4% 52.0% 16.6%
Overall n=142 with AR
42.9% 33.4% 23.7% 45.0% 41.5% 13.5%
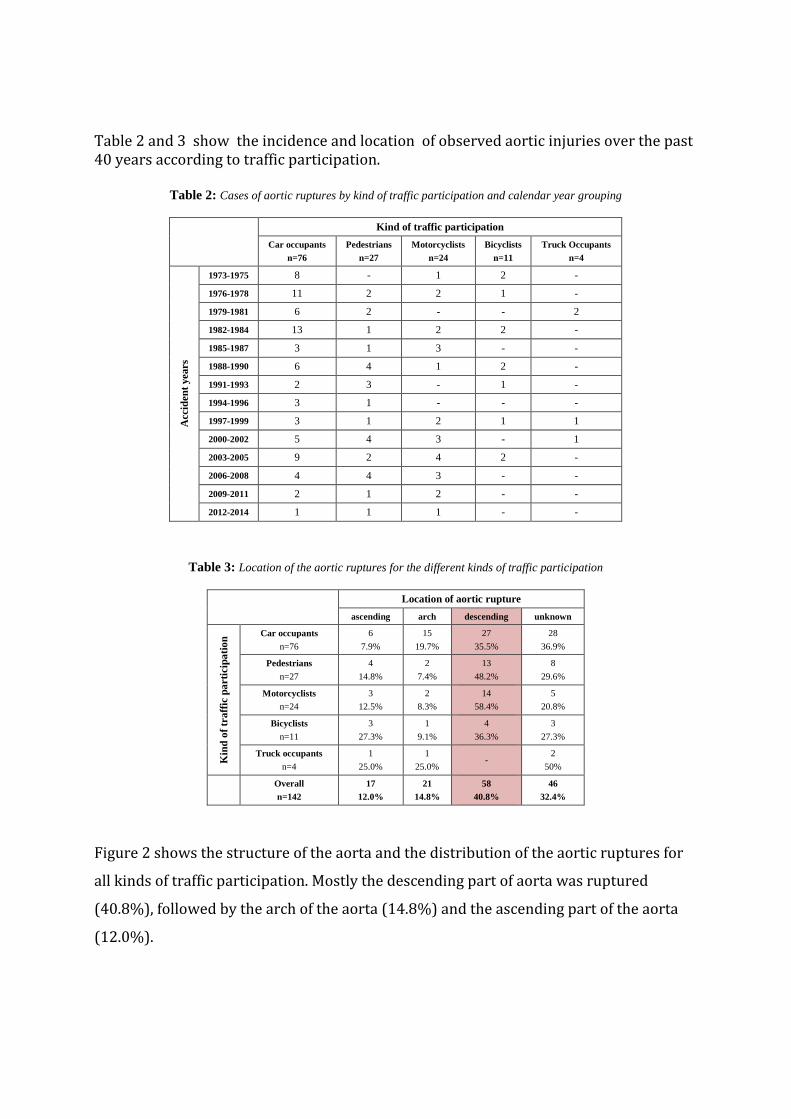
Table 2 and 3 show the incidence and location of observed aortic injuries over the past 40 years according to traffic participation.
Table 2: Cases of aortic ruptures by kind of traffic participation and calendar year grouping
Kind of traffic participation
Car occupants n=76
Pedestrians n=27
Motorcyclists n=24
Bicyclists n=11
Truck Occupants n=4
Acc
iden
t yea
rs
1973-1975 8 - 1 2 -
1976-1978 11 2 2 1 -
1979-1981 6 2 - - 2
1982-1984 13 1 2 2 -
1985-1987 3 1 3 - -
1988-1990 6 4 1 2 -
1991-1993 2 3 - 1 -
1994-1996 3 1 - - -
1997-1999 3 1 2 1 1
2000-2002 5 4 3 - 1
2003-2005 9 2 4 2 -
2006-2008 4 4 3 - -
2009-2011 2 1 2 - -
2012-2014 1 1 1 - -
Table 3: Location of the aortic ruptures for the different kinds of traffic participation
Location of aortic rupture ascending arch descending unknown
Kin
d of
traf
fic p
artic
ipat
ion Car occupants
n=76 6
7.9% 15
19.7% 27
35.5% 28
36.9%
Pedestrians n=27
4 14.8%
2 7.4%
13 48.2%
8 29.6%
Motorcyclists n=24
3 12.5%
2 8.3%
14 58.4%
5 20.8%
Bicyclists n=11
3 27.3%
1 9.1%
4 36.3%
3 27.3%
Truck occupants n=4
1 25.0%
1 25.0%
- 2
50%
Overall n=142
17 12.0%
21 14.8%
58 40.8%
46 32.4%
Figure 2 shows the structure of the aorta and the distribution of the aortic ruptures for
all kinds of traffic participation. Mostly the descending part of aorta was ruptured
(40.8%), followed by the arch of the aorta (14.8%) and the ascending part of the aorta
(12.0%).
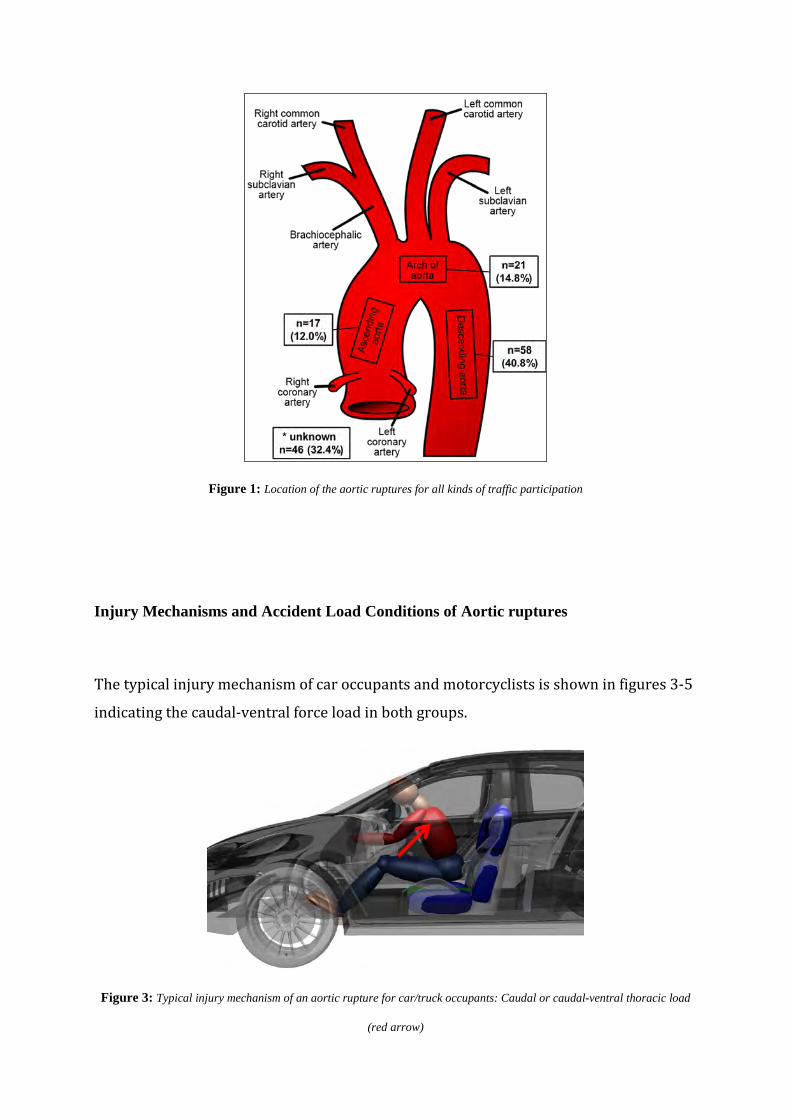
Figure 1: Location of the aortic ruptures for all kinds of traffic participation
Injury Mechanisms and Accident Load Conditions of Aortic ruptures
The typical injury mechanism of car occupants and motorcyclists is shown in figures 3-5
indicating the caudal-ventral force load in both groups.
Figure 3: Typical injury mechanism of an aortic rupture for car/truck occupants: Caudal or caudal-ventral thoracic load
(red arrow)
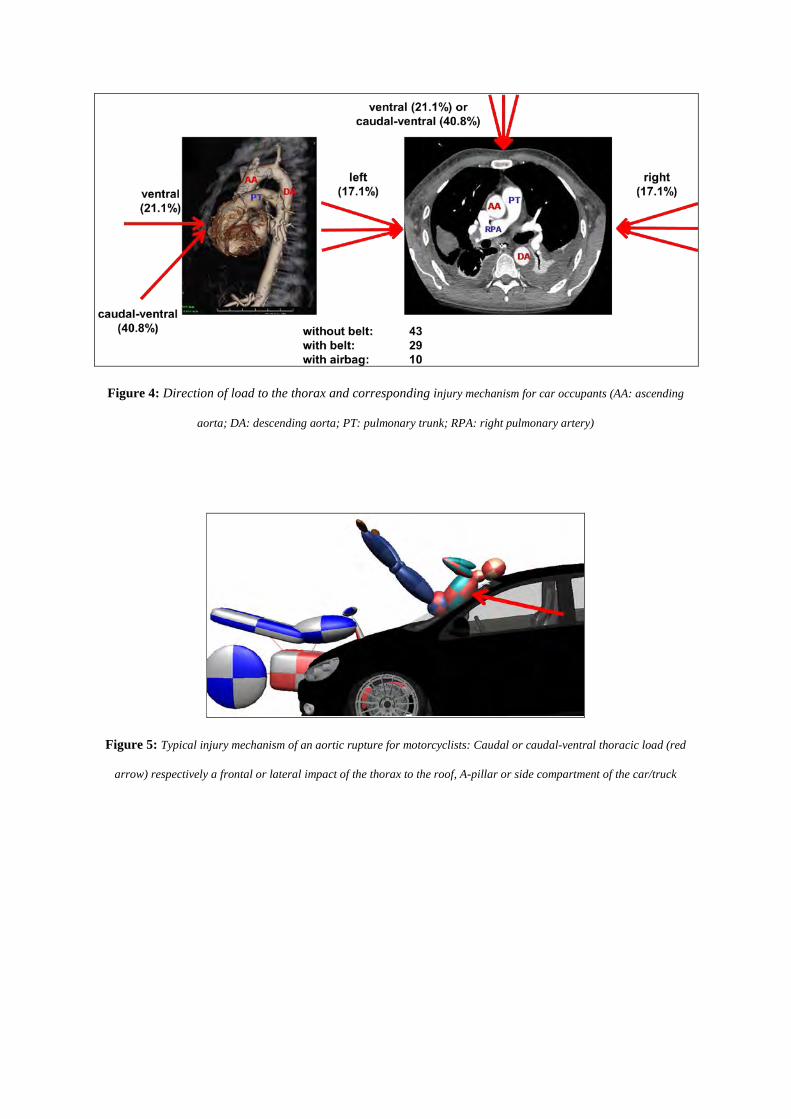
Figure 4: Direction of load to the thorax and corresponding injury mechanism for car occupants (AA: ascending
aorta; DA: descending aorta; PT: pulmonary trunk; RPA: right pulmonary artery)
Figure 5: Typical injury mechanism of an aortic rupture for motorcyclists: Caudal or caudal-ventral thoracic load (red
arrow) respectively a frontal or lateral impact of the thorax to the roof, A-pillar or side compartment of the car/truck
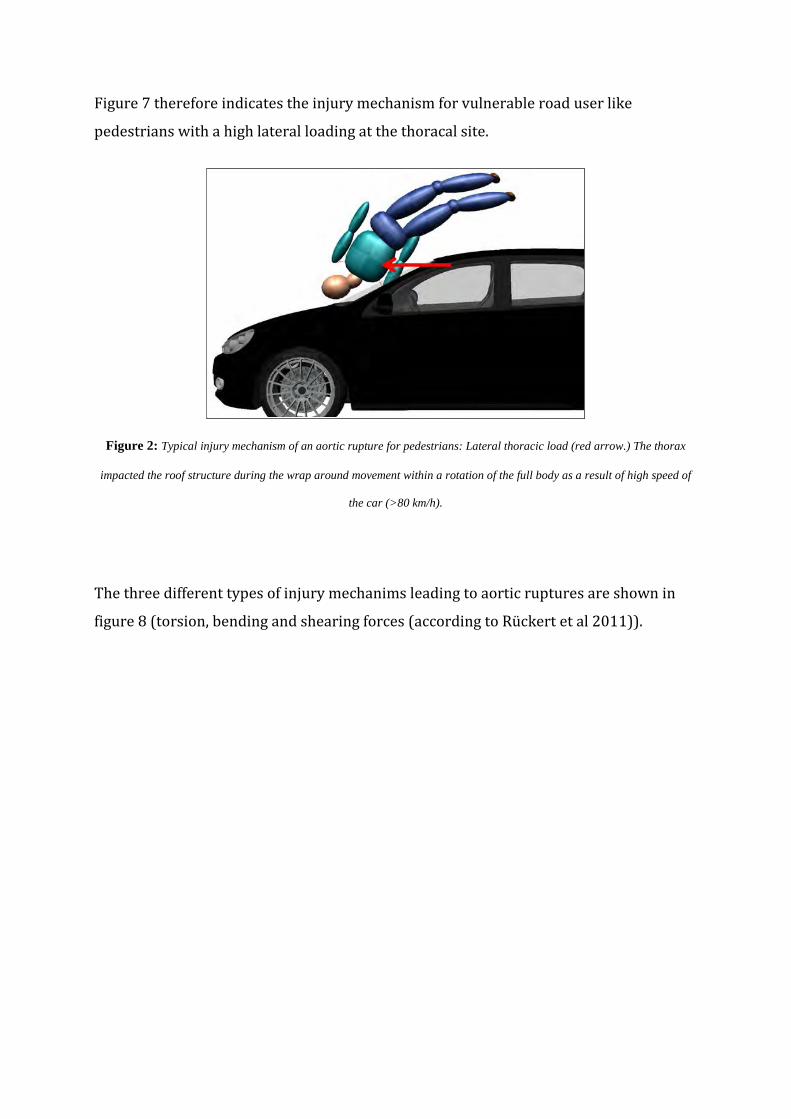
Figure 7 therefore indicates the injury mechanism for vulnerable road user like
pedestrians with a high lateral loading at the thoracal site.
Figure 2: Typical injury mechanism of an aortic rupture for pedestrians: Lateral thoracic load (red arrow.) The thorax
impacted the roof structure during the wrap around movement within a rotation of the full body as a result of high speed of
the car (>80 km/h).
The three different types of injury mechanims leading to aortic ruptures are shown in
figure 8 (torsion, bending and shearing forces (according to Rückert et al 2011)).
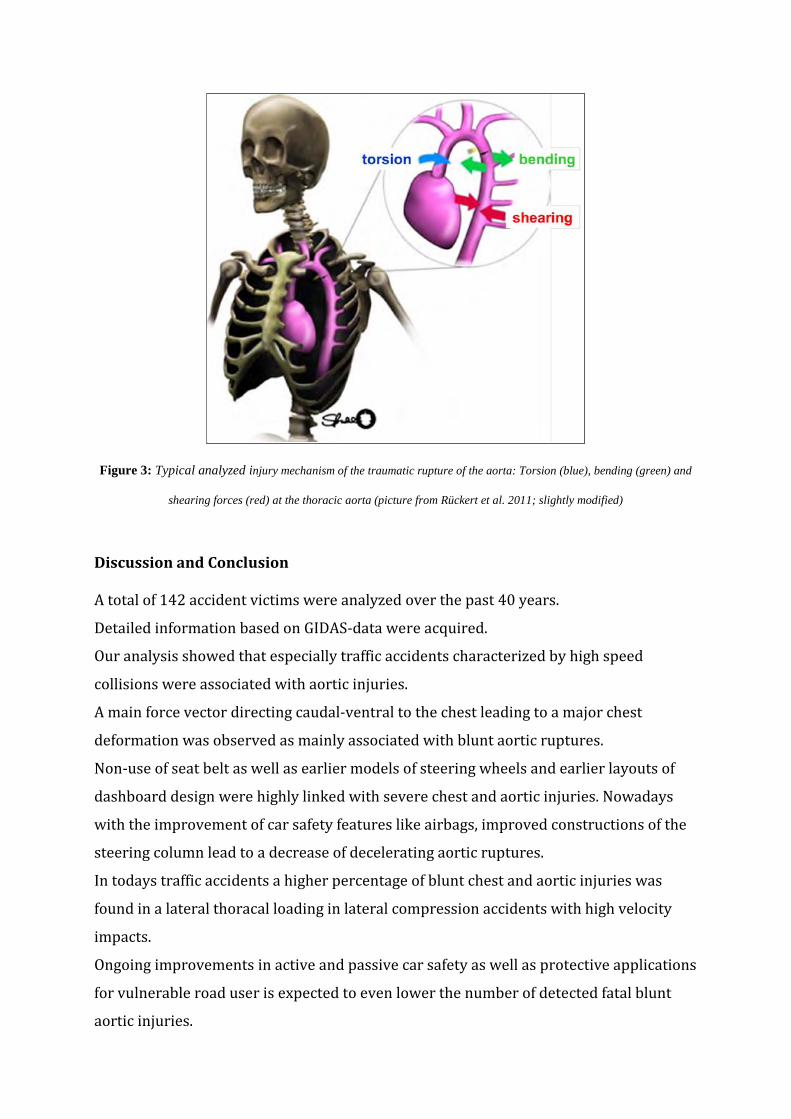
Figure 3: Typical analyzed injury mechanism of the traumatic rupture of the aorta: Torsion (blue), bending (green) and
shearing forces (red) at the thoracic aorta (picture from Rückert et al. 2011; slightly modified)
Discussion and Conclusion A total of 142 accident victims were analyzed over the past 40 years.
Detailed information based on GIDAS-data were acquired.
Our analysis showed that especially traffic accidents characterized by high speed
collisions were associated with aortic injuries.
A main force vector directing caudal-ventral to the chest leading to a major chest
deformation was observed as mainly associated with blunt aortic ruptures.
Non-use of seat belt as well as earlier models of steering wheels and earlier layouts of
dashboard design were highly linked with severe chest and aortic injuries. Nowadays
with the improvement of car safety features like airbags, improved constructions of the
steering column lead to a decrease of decelerating aortic ruptures.
In todays traffic accidents a higher percentage of blunt chest and aortic injuries was
found in a lateral thoracal loading in lateral compression accidents with high velocity
impacts.
Ongoing improvements in active and passive car safety as well as protective applications
for vulnerable road user is expected to even lower the number of detected fatal blunt
aortic injuries.
Spine injuries in vulnerable road users – a technical and medical analysis of 14295 injured pedestrians, bicycle and motorbike users
C. W. Müller*, D. Otte**, S. Decker*, T. Stübig*, H. Johannsen**, S. Brand* and C. Krettek*
*Trauma Department and **Accident Research Unit,
Hannover Medical School (MHH), Carl-Neuberg-Strasse 1, D-30625 Hannover, Germany Abstract To elucidate the risk of pedestrians, bicycle and motorbike users, data of two accident research units from 1999 to 2014 were analysed in regard to demographic data, collision details, preclinical and clinical data using SPSS. 14.295 injured vulnerable road users were included. 92 out of 3610 pedestrians (“P”, 2.5%), 90 out of 8307 bicyclists (“B”, 1.1%) and 115 out of 4094 motorcycle users (“M”, 2.8%) were diagnosed with spinal fractures. Thoracic fractures were most frequent ahead of lumbar and cervical fractures. Car collisions were most frequent mechanism (68, 62 and 36%). MAIS was 3.8, 2.8 and 3.2 for P, B and A with ISS 32, 16 and 23. AIS-head was 2.2, 1.3 and 1.5). Vulnerable road users are at significant risk for spine fractures. These are often associated with severe additional injuries, e.g. the head and a very high overall trauma severity (polytrauma). NOTATION “P” pedestrians “B” bicycle users “M” motor bike users INTRODUCTION The total number of road deaths has markedly decreased during the last centuries. As we showed earlier, likewise the number of vertebral fractures in restrained front seat car occupants has declined[1]. In both car occupants and pedestrians the mean injury severity – depending on the impact velocity – has declined, too[2]; however, little is known how this is reflected in the burden of spine fractures of vulnerable road users. METHODS Two accident research units document around 2000 accidents per year according to a statistical sample plan reflecting the overall traffic accident situation in Germany. Specially trained documentation personnel are notified by police dispatchers and arrive on scene, often simultaneously with the rescue personnel. Thus, investigation of the crash (measurements by photography, stereo photography, three dimensional (3D)-laser technique), and clinical injury documentation is performed on site. This case report is then completed at the hospital, where all of the injured victims are taken, with proper documentation of x-ray examination, injury type, and severity. Among the technical measurement techniques, the modern 3D-laser technique, especially, is a quick and exact method to document the exact position of all objects at the crash site. A 3D-data cube with a maximum size of 50 m3 is generated from the data obtained by the 3D-laser scanner. This data allows an exactly scaled reconstruction of the crash site for later technical analysis of the crash. Slide and skid marks of vehicles, objects, and victims and any kind of deformation of involved vehicles or objects are also measured, and this data are included in the crash analysis. Furthermore, data from a database containing technical features of involved vehicles (size, weight, and detailed structural data comparable to finite element analysis data) are included in the analysis. The inclusion of the described data in a software-based calculation allows an exact estimation of parameters as delta-v or collision speed. In total, the monitoring of the crash research unit includes demographic data, type of road user (car/truck occupant, motorcyclist, cyclist, pedestrian), delta-v (km/h) for motorized vehicle user; vehicle collision speed (km/h) for bicyclists/pedestrians, Abbreviated Injury
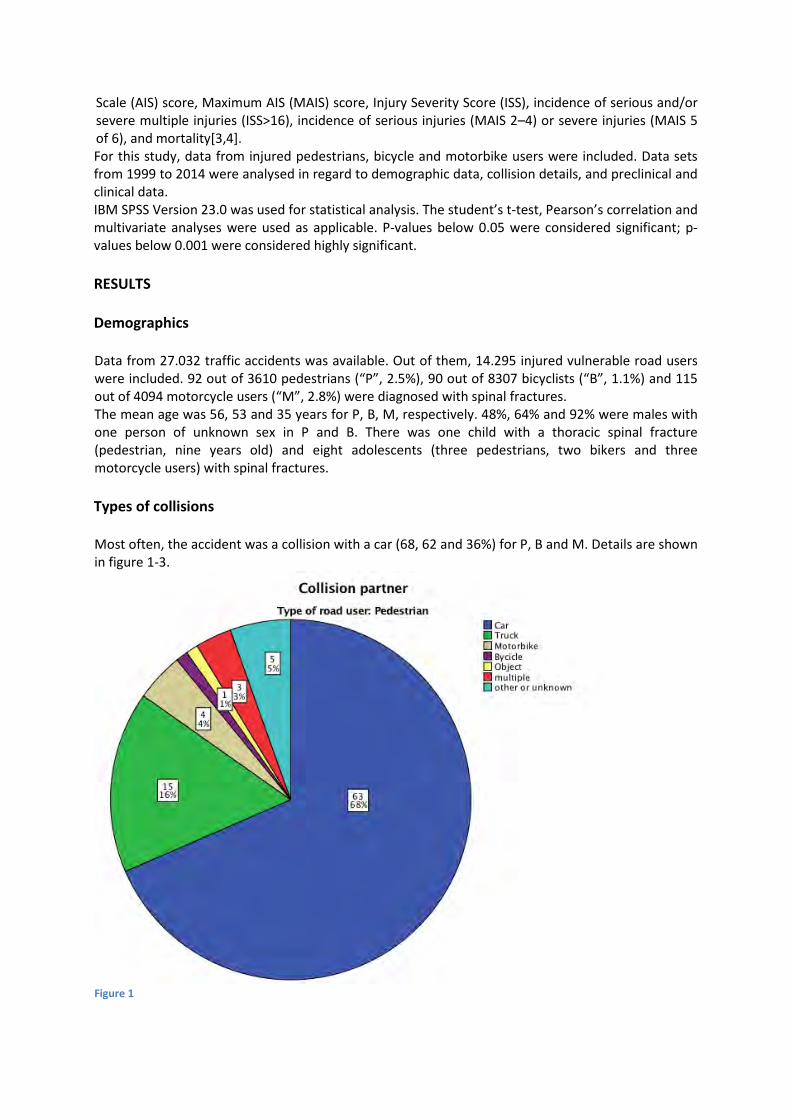
Scale (AIS) score, Maximum AIS (MAIS) score, Injury Severity Score (ISS), incidence of serious and/or severe multiple injuries (ISS>16), incidence of serious injuries (MAIS 2–4) or severe injuries (MAIS 5 of 6), and mortality[3,4]. For this study, data from injured pedestrians, bicycle and motorbike users were included. Data sets from 1999 to 2014 were analysed in regard to demographic data, collision details, and preclinical and clinical data. IBM SPSS Version 23.0 was used for statistical analysis. The student’s t-test, Pearson’s correlation and multivariate analyses were used as applicable. P-values below 0.05 were considered significant; p-values below 0.001 were considered highly significant. RESULTS Demographics Data from 27.032 traffic accidents was available. Out of them, 14.295 injured vulnerable road users were included. 92 out of 3610 pedestrians (“P”, 2.5%), 90 out of 8307 bicyclists (“B”, 1.1%) and 115 out of 4094 motorcycle users (“M”, 2.8%) were diagnosed with spinal fractures. The mean age was 56, 53 and 35 years for P, B, M, respectively. 48%, 64% and 92% were males with one person of unknown sex in P and B. There was one child with a thoracic spinal fracture (pedestrian, nine years old) and eight adolescents (three pedestrians, two bikers and three motorcycle users) with spinal fractures. Types of collisions Most often, the accident was a collision with a car (68, 62 and 36%) for P, B and M. Details are shown in figure 1-3.
Figure 1

Figure 2
Figure 3
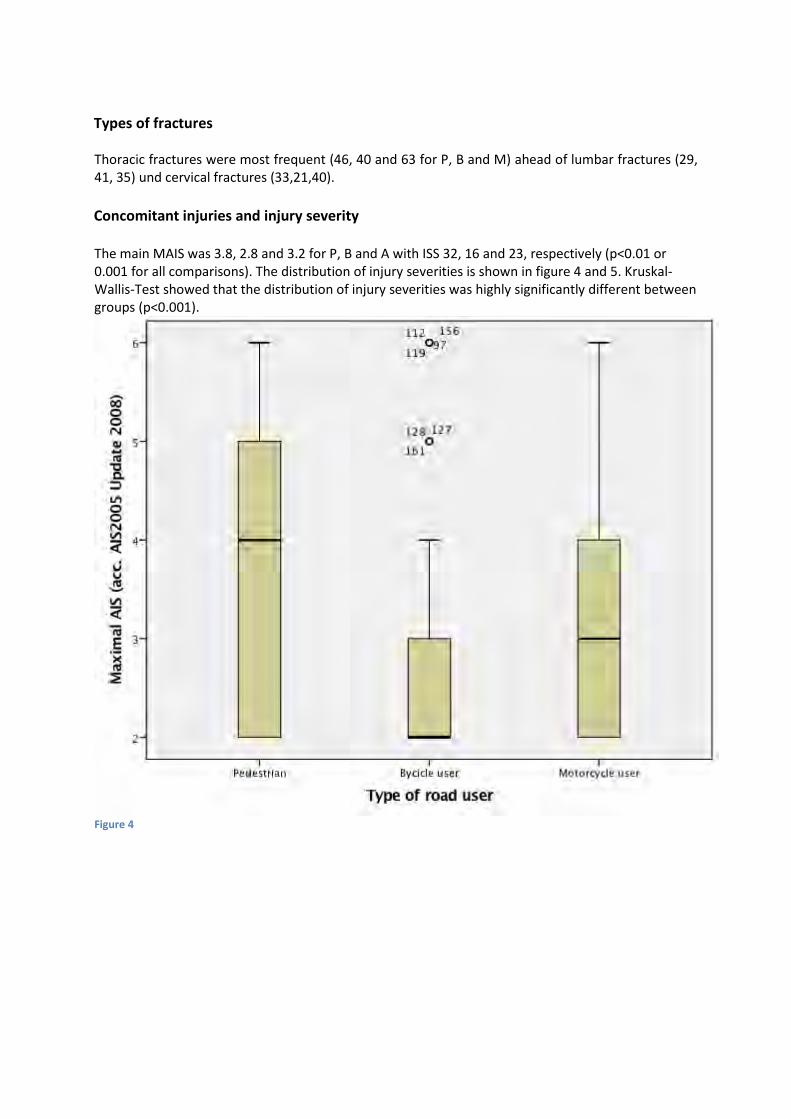
Types of fractures Thoracic fractures were most frequent (46, 40 and 63 for P, B and M) ahead of lumbar fractures (29, 41, 35) und cervical fractures (33,21,40). Concomitant injuries and injury severity The main MAIS was 3.8, 2.8 and 3.2 for P, B and A with ISS 32, 16 and 23, respectively (p<0.01 or 0.001 for all comparisons). The distribution of injury severities is shown in figure 4 and 5. Kruskal-Wallis-Test showed that the distribution of injury severities was highly significantly different between groups (p<0.001).
Figure 4
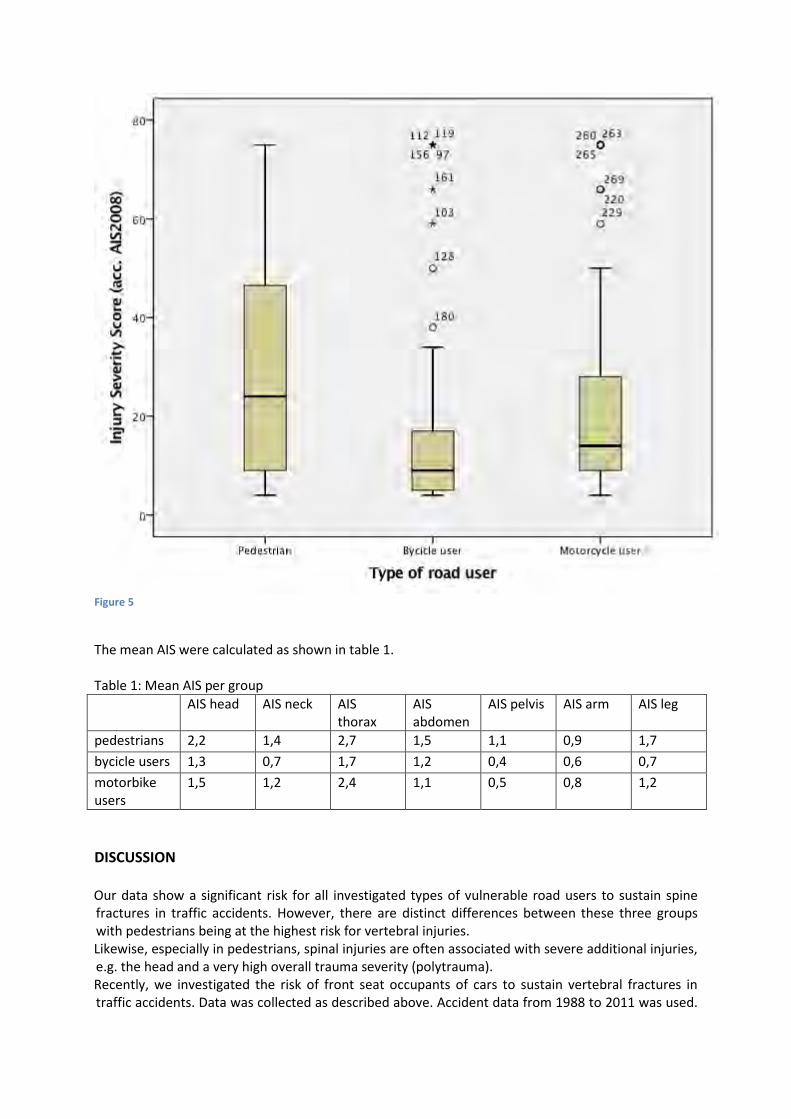
Figure 5
The mean AIS were calculated as shown in table 1. Table 1: Mean AIS per group AIS head AIS neck AIS
thorax AIS abdomen
AIS pelvis AIS arm AIS leg
pedestrians 2,2 1,4 2,7 1,5 1,1 0,9 1,7 bycicle users 1,3 0,7 1,7 1,2 0,4 0,6 0,7 motorbike users
1,5 1,2 2,4 1,1 0,5 0,8 1,2
DISCUSSION Our data show a significant risk for all investigated types of vulnerable road users to sustain spine fractures in traffic accidents. However, there are distinct differences between these three groups with pedestrians being at the highest risk for vertebral injuries. Likewise, especially in pedestrians, spinal injuries are often associated with severe additional injuries, e.g. the head and a very high overall trauma severity (polytrauma). Recently, we investigated the risk of front seat occupants of cars to sustain vertebral fractures in traffic accidents. Data was collected as described above. Accident data from 1988 to 2011 was used.
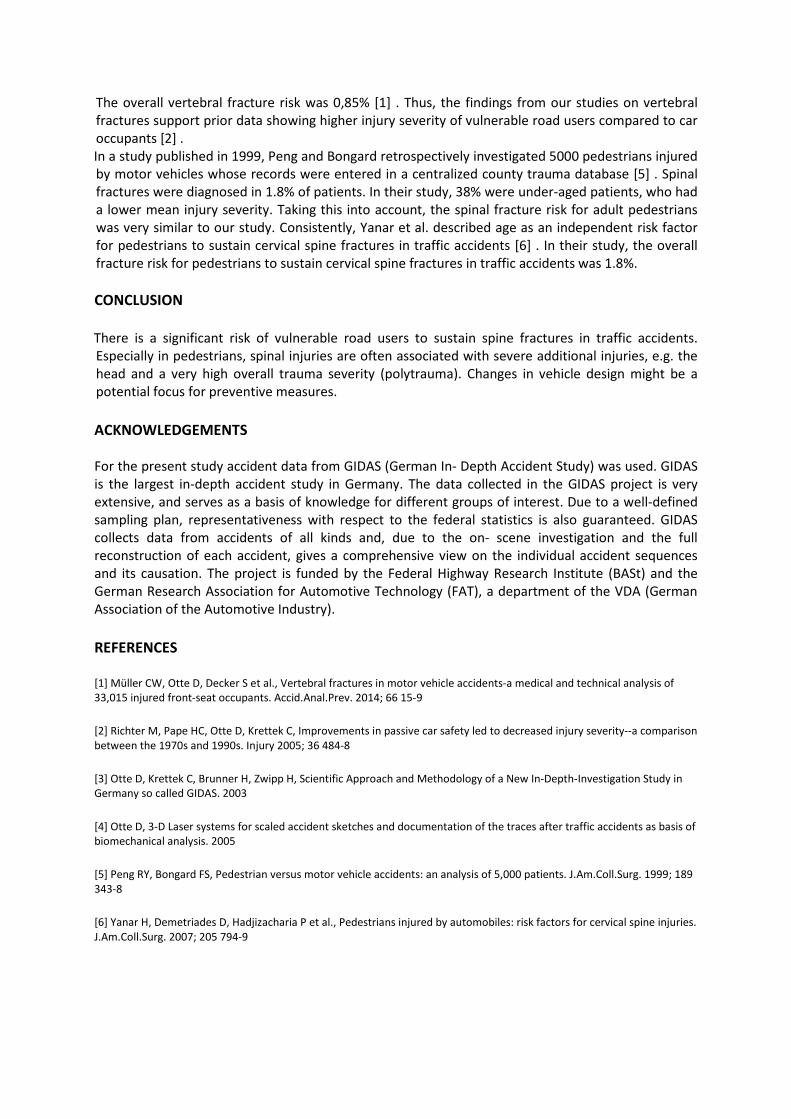
The overall vertebral fracture risk was 0,85% [1] . Thus, the findings from our studies on vertebral fractures support prior data showing higher injury severity of vulnerable road users compared to car occupants [2] . In a study published in 1999, Peng and Bongard retrospectively investigated 5000 pedestrians injured by motor vehicles whose records were entered in a centralized county trauma database [5] . Spinal fractures were diagnosed in 1.8% of patients. In their study, 38% were under-aged patients, who had a lower mean injury severity. Taking this into account, the spinal fracture risk for adult pedestrians was very similar to our study. Consistently, Yanar et al. described age as an independent risk factor for pedestrians to sustain cervical spine fractures in traffic accidents [6] . In their study, the overall fracture risk for pedestrians to sustain cervical spine fractures in traffic accidents was 1.8%. CONCLUSION There is a significant risk of vulnerable road users to sustain spine fractures in traffic accidents. Especially in pedestrians, spinal injuries are often associated with severe additional injuries, e.g. the head and a very high overall trauma severity (polytrauma). Changes in vehicle design might be a potential focus for preventive measures. ACKNOWLEDGEMENTS For the present study accident data from GIDAS (German In- Depth Accident Study) was used. GIDAS is the largest in-depth accident study in Germany. The data collected in the GIDAS project is very extensive, and serves as a basis of knowledge for different groups of interest. Due to a well-defined sampling plan, representativeness with respect to the federal statistics is also guaranteed. GIDAS collects data from accidents of all kinds and, due to the on- scene investigation and the full reconstruction of each accident, gives a comprehensive view on the individual accident sequences and its causation. The project is funded by the Federal Highway Research Institute (BASt) and the German Research Association for Automotive Technology (FAT), a department of the VDA (German Association of the Automotive Industry). REFERENCES
[1] Müller CW, Otte D, Decker S et al., Vertebral fractures in motor vehicle accidents-a medical and technical analysis of 33,015 injured front-seat occupants. Accid.Anal.Prev. 2014; 66 15-9
[2] Richter M, Pape HC, Otte D, Krettek C, Improvements in passive car safety led to decreased injury severity--a comparison between the 1970s and 1990s. Injury 2005; 36 484-8
[3] Otte D, Krettek C, Brunner H, Zwipp H, Scientific Approach and Methodology of a New In-Depth-Investigation Study in Germany so called GIDAS. 2003
[4] Otte D, 3-D Laser systems for scaled accident sketches and documentation of the traces after traffic accidents as basis of biomechanical analysis. 2005
[5] Peng RY, Bongard FS, Pedestrian versus motor vehicle accidents: an analysis of 5,000 patients. J.Am.Coll.Surg. 1999; 189 343-8
[6] Yanar H, Demetriades D, Hadjizacharia P et al., Pedestrians injured by automobiles: risk factors for cervical spine injuries. J.Am.Coll.Surg. 2007; 205 794-9

Road traffic related injury severity in truck drivers: a prospective medical and technical
analysis of 582 truck crashes
Decker, Sebastian1, M.D.; Otte, Dietmar2; Müller, Christian W.1, M.D.; Krettek, Christian1, M.D.; Brand, Stephan1 M.D
1 Trauma Department, Hannover Medical School, Germany
2 Accident Research Unit, Hannover Medical School, Germany
Author for Correspondence: Sebastian Decker. Address: Trauma Department, Hannover Medical School, Carl-Neuberg-Str. 1, 30625 Hannover, Germany. Tel.: +49-511-5322026 Fax: +49-511-5325877. E-mail address: [email protected].
Background: While cyclists and pedestrians are known to be at significant risk for severe
injuries when exposed to road traffic accidents (RTA) involving trucks, little is known about
RTA injury risk for truck drivers. The objective of this study is to analyze the injury severity
in truck drivers following RTAs.
Methods: Our local accident research unit prospectively documented 43000 RTAs involving
582 trucks in between 1999-2008. Injury severity including the abbreviated injury scale (AIS)
and the maximum abbreviated injury scale (MAIS) were analyzed. Technical parameters (e.g.
delta-v, direction of impact), the location of accident, and its dependency on the road type
were also taken into consideration.
Results: 77/582 (13%) truck drivers were injured compared to 82% of the crash opponents.
Extremities were found to be at highest risk of injury with the lower extremities (36x) being
injured most severely (10x: AIS 2 and 3). Death occurred only after collisions with other
trucks, and severity of injuries increased with an increased speed limit. MAIS was higher in
the crash opponents (56x MAIS ≥ 3, figure 1) compared to the truck drivers (8x MAIS ≥ 3,
figure 2).
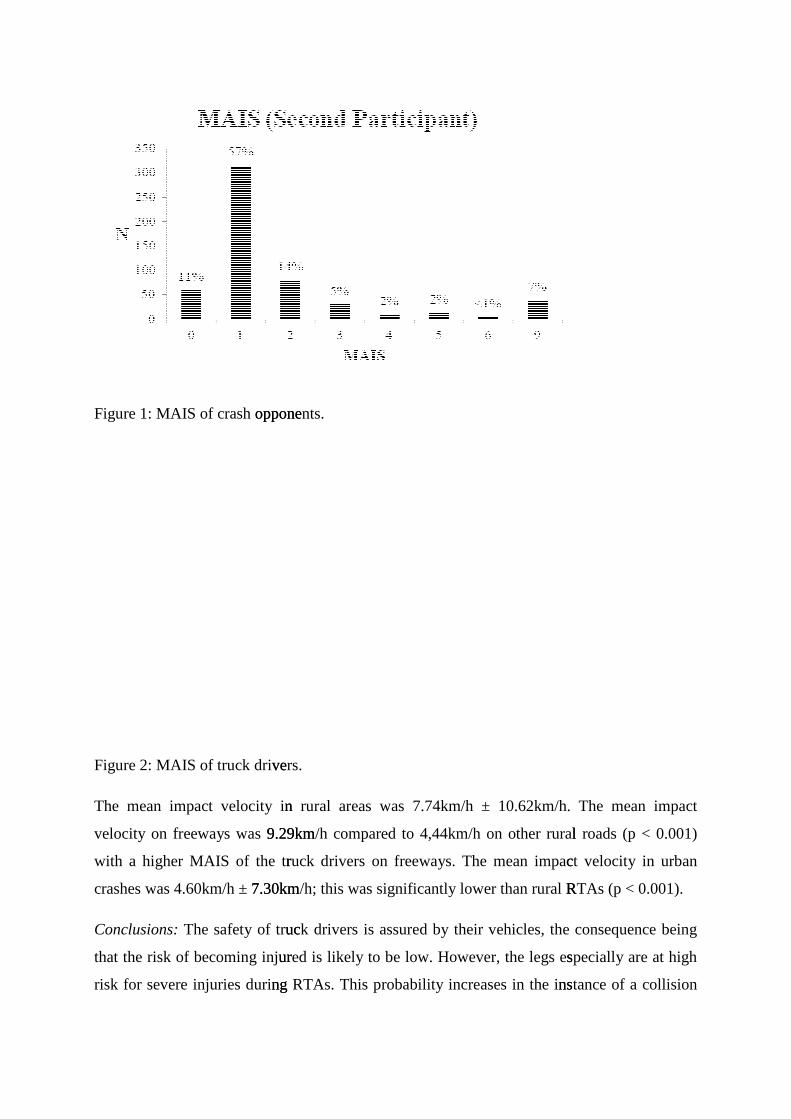
Figure 1: MAIS of crash opponeopponents.
nts.
Figure 2: MAIS of truck drivevers.
rs.
The mean impact velocity in n rural areas was 7.74km/h ± 10.62km/h. The mean impact
velocity on freeways was 9.29km9.29km/h compared to 4,44km/h on other rurall roads (p < 0.001)
with a higher MAIS of the trruck drivers on freeways. The mean impacct velocity in urban
crashes was 4.60km/h ± 7.30km 7.30km/h; this was significantly lower than rural RRTAs (p < 0.001).
Conclusions: The safety of trucuck drivers is assured by their vehicles, the consequence being
that the risk of becoming injurured is likely to be low. However, the legs esspecially are at high
risk for severe injuries duringng RTAs. This probability increases in the insnstance of a collision
ru
/h compared to 4,44km/h on other rural roads (p < 0.001)
uck driver
k drivers is assured by their vehicles, the consequence being
ed is likely to be low. However, the legs especially are at high
RTAs. This probability increases in the instance of a collision
Figure 1: MAIS of crash
Figure 2: MAIS of truck dri
The mean impact velocity i The mean impact
velocity on freeways was roads (p < 0.001)
with a higher MAIS of the t t velocity
was 4.60km/h ± TAs (p < 0.001).
The safety of tr consequence being
that the risk of becoming inj pecially are at high
for severe injuries duri tance of a collision
was 7.74km/h ± 10.62km/h.
velocity on freeways was 9.29km/h compared to 4,44km/h on other rura
. The mean impa
/h; this was significantly lower than rural
The safety of truck drivers is assured by their vehicles, the
that the risk of becoming injured is likely to be low. However, the legs e
for severe injuries during RTAs. This probability increases in the i

with another truck. Nevertheless, in RTAs involving trucks and regular passenger vehicles,
the other party is in higher risk of injury.
Keywords: truck, abbreviated injury scale, trauma, AIS, MAIS
A study on knowledge and practices of first aid and cpr among police officers in colombo and gampaha
James K.A.R.1
Nazeer A.A.A.1
Perera M.P.H.1
Tissera S.R.1
Silva S.N.2
1Diploma student in Nursing at International Institute of Health Sciences- Sri Lanka 2 (Supervisor) Medical Officer- Ministry of Health (National Hospital of Sri Lanka)
Introduction: Around 85% of deaths in developing countries have found to be due to road traffic accidents (RTAs), which cost the country around 1-2% of its gross national product (GNP). In Sri Lanka there were 2436 deaths reported from 36,045 RTAs in 2014.
Objectives: To assess first aid and CPR knowledge among police officers and to identify its relationship to their first aid and CPR practices.
Methodology: A study was done on 493 police officers from Colombo and Gampaha whom were selected using convenience sampling through a self-administered questionnaire.
Results: 85.8% officers reported being trained in first aid. However 50% of officers less than 30 years would not use first aid for RTA because of legal implications. 40-50 year officers (37.5%) reported lack of knowledge. 66.9% identified left lateral as the recovery position. 22.9% stated that a victim with external bleeding should be taken to the hospital immediately, of which 42.3% would not apply pressure on bleeding site while 54% are incompetent at checking pulse. 79.7% have transported casualties of which 42.6% did not know log rolling technique. 20.3% and 14.5% disagreed on supporting and splinting a fractured limb respectively. From those who were trained in CPR (30.4%), 67.3% were incompetent, while those less than 30 years were most competent (60.4%) in comparison with other groups.
Conclusion: The police officers had unsatisfactory knowledge and practices of CPR and interventions for bleeding and fractures. These should therefore be focused in their further training.
Key words: First aid, CPR, Police Officer
Schriftenreihe
Berichte der Bundesanstaltfür Straßenwesen
Unterreihe „Fahrzeugtechnik“
2010
F 74: Auswirkungen des Fahrens mit Tempomat und ACC auf das Fahrerverhalten Vollrath, Briest, Oeltze E 15,50
F 75: Fehlgebrauch der Airbagabschaltung bei der Beförderung von Kindern in Kinderschutzsystemen Müller, Johannsen, Fastenmaier E 15,50
2011
F 76: Schutz von Fußgängern beim Scheibenanprall IIDieser Bericht liegt nur in digitaler Form vor und kann kostenpflich-tig unter www.nw-verlag.de heruntergeladen werden.Bovenkerk, Gies, Urban E 19,50
F 77: 4th International Conference on ESAR „Expert Symposium on Accident Research“ Dieser Bericht liegt nur in digitaler Form vor und kann kostenpflich-tig unter www.nw-verlag.de heruntergeladen werden. E 29,50
F 78: Elektronische Manipulation von Fahrzeug- und Infrastruktur- systemen Dittmann, Hoppe, Kiltz, Tuchscheerer E 17,50
F 79: Internationale und nationale Telematik-Leitbilder und IST-Architekturen im Straßenverkehr Boltze, Krüger, Reusswig, Hillebrand E 22,00
F 80: Untersuchungskonzepte für die Evaluation von Systemen zur Erkennung des Fahrerzustands Eichinger E 15,00
F 81: Potential aktiver Fahrwerke für die Fahrsicherheit von Motor- rädernWunram, Eckstein, Rettweiler E 15,50
F 82: Qualität von on-trip Verkehrsinformationen im Straßenver-kehr – Quality of on-trip road traffic information – BASt-Kolloqui-um 23. & 24.03.2011Lotz, Luks E 17,50Dieser Bericht liegt nur in digitaler Form vor und kann kostenpflich-tig unter www.nw-verlag.de heruntergeladen werden.
2012F 83: Rechtsfolgen zunehmender Fahrzeugautomatisierung – Gemeinsamer Schlussbericht der ProjektgruppeGasser, Arzt, Ayoubi, Bartels, Bürkle, Eier, Flemisch,Häcker, Hesse, Huber, Lotz, Maurer, Ruth-Schumacher,Schwarz, Vogt E 19,50
F 84: Sicherheitswirkungen von Verkehrsinformationen – Ent-wicklung und Evaluation verschiedener Warnkonzepte für Stau-endewarnungenBogenberger, Dinkel, Totzke, Naujoks, Mühlbacher E 17,00
F 85: Cooperative Systems Stakeholder AnalysisSchindhelm, Calderaro, Udin, Larsson, Kernstock,Jandrisits, Ricci, Geißler, Herb, Vierkötter E 15,50
2013F 86: Experimentelle Untersuchung zur Unterstützung der Ent-wicklung von Fahrerassistenzsystemen für ältere KraftfahrerHoffmann, Wipking, Blanke, Falkenstein E 16,50
F 87: 5th International Conference on ESAR „Expert Symposium on Accident Research“Dieser Bericht liegt nur in digitaler Form vor und kann unter http://bast.opus.hbz-nrw.de/ heruntergeladen werden.
F 88: Comparative tests with laminated safety glass panes and polycarbonate panesGehring, Zander E 14,00
F 89: Erfassung der FahrermüdigkeitPlatho, Pietrek, Kolrep E 16,50
F 90: Aktive Systeme der passiven FahrzeugsicherheitNuß, Eckstein, Berger E 17,90
F 91: Standardisierungsprozess für offene Systeme der Straßen-verkehrstelematikKroen E 17,00
F 92: Elektrofahrzeuge – Auswirkungen auf die periodisch tech-nische ÜberwachungBeyer, Blumenschein, Bönninger, Grohmann, Lehmann, Meißner,Paulan, Richter, Stiller, Calker E 17,00
2014F 93: Entwicklung eines Verfahrens zur Erfassung der Fahrerbe-anspruchung beim MotorradfahrenBuld, Will, Kaussner, Krüger E 17,50
F 94: Biokraftstoffe – Fahrzeugtechnische Voraussetzungen und EmissionenPellmann, Schmidt, Eckhardt, Wagner E 19,50
F 95: Taxonomie von Fehlhandlungen bei der FahrzeugführungOehme, Kolrep, Person, Byl E 16,50
F 96: Auswirkungen alternativer Antriebskonzepte auf die Fahr-dynamik von PkwSchönemann, Henze E 15,50
F 97: Matrix von Lösungsvarianten Intelligenter Verkehrssysteme (IVS) im StraßenverkehrMatrix of alternative implementation approaches of Intelligent Transport Systems (ITS) in road traffic Lotz, Herb, Schindhelm, VierkötterDieser Bericht liegt nur in digitaler Form vor und kann unter http://bast.opus.hbz-nrw.de/ heruntergeladen werden.
F 98: Absicherungsstrategien für Fahrerassistenzsysteme mit UmfeldwahrnehmunWeitzel, Winner, Peng, Geyer, Lotz Sefati E 16,50
F 99: Study on smoke production, development and toxicity in bus fires Hofmann, Dülsen E 16,50
2015F 100: Verhaltensbezogene Kennwerte zeitkritischer Fahrma-növer Powelleit, Muhrer, Vollrath, Henze, Liesner, Pawellek E 17,50
F 101: Altersabhängige Anpassung von Menschmodellen für die passive FahrzeugsicherheitWagner, Segura, Mühlbauer, Fuchs, Peldschus,Freßmann E 19,00
XX
F 102: 6th International Conference on ESAR „Expert Symposium on Accident Research“Dieser Bericht liegt nur in digitaler Form vor und kann unter http://bast.opus.hbz-nrw.de/ heruntergeladen werden.
F 103: Technische Möglichkeiten für die Reduktion der CO2-Emissionen von NutzfahrzeugenSüßmann, LienkampDieser Bericht liegt nur in digitaler Form vor und kann unter http://bast.opus.hbz-nrw.de/ heruntergeladen werden.
F 104: Abbiege-Assistenzsystem für Lkw – Grundlagen eine Test-verfahrensSchreck, Seiniger E 14,50
F 105: Abgasverhalten von in Betrieb befindlichen Fahrzeugen und emissionsrelevanten Bauteilen – FeldüberwachungSchmidt, Georges E 14,50
F 105b: Examination of pollutants emitted by vehicles in operati-on and of emission relevant components – In-service conformitySchmidt, Johannsen Dieser Bericht liegt nur in digitaler Form vor und kann unter http://bast.opus.hbz-nrw.de/ heruntergeladen werden.
F 106: Untersuchung des Abgasverhaltens von in Betrieb befind-lichen Fahrzeugen und emissionsrelevanten Bauteilen – Aus-tauschkatalysatorenSchmidt, Johannsen E 13,50
F 106b: Examination of pollutants emitted by vehicles in operati-on and of emission relevant components – Replacementcatalytic convertersSchmidt, JohannsenDieser Bericht liegt nur in digitaler Form vor und kann unter http://bast.opus.hbz-nrw.de/ heruntergeladen werden.
F 107: Sicherheitsaspekte beim Laden von ElektrofahrzeugenVogt, Link, Ritzinger, Ablingyte, Reindl E 16,50
F 108: Interoperabilität zwischen öffentlichem Verkehrsmanage-ment und individuellen Navigationsdiensten – Maßnahmen zur Gewährleistungvon der Ruhren, Kirschfink, Ansorge, Reusswig, Riegelhuth,Karina-Wedrich, Schopf, Sparmann, Wöbbeking,Kannenberg E 17,50
F 109: Ermittlung des Umfangs von Abweichungen bei Durch-führung der Abgasuntersuchung zwischen Messung am Auspuff und Abfrage des On-Board-DiagnosesystemsSchröder, Steickert, Walther, RanftlDieser Bericht liegt nur in digitaler Form vor und kann unter http://bast.opus.hbz-nrw.de/ heruntergeladen werden.
F 110: Wahrnehmung und Bewertung von Fahrzeugaußenge-räuschen durch Fußgänger in verschiedenen Verkehrssituatio-nen und unterschiedlichen BetriebszuständenAltinsoy, Landgraf, Rosenkranz, Lachmann, Hagen,Schulze, SchlagDieser Bericht liegt nur in digitaler Form vor und kann unter http://bast.opus.hbz-nrw.de/ heruntergeladen werden.
F 111: Geräuschminderung von DünnschichtbelägenSchulze, Kluth, Ruhnau, HübeltDieser Bericht liegt nur in digitaler Form vor und kann unter http://bast.opus.hbz-nrw.de/ heruntergeladen werden.
2016F 112: Ersatz von Außenspiegeln durch Kamera-Monitor-Syste-me bei Pkw und LkwSchmidt, Hoffmann, Krautscheid, Bierbach,Frey, Gail, Lotz-Keens E 17,50
F 112b: Final Report Camera-Monitor-Systems as a Replacement for Exterior Mirrors in Cars and TrucksSchmidt, Hoffmann, Krautscheid, Bierbach, Frey, Gail, Lotz-KeensDieser Bericht liegt nur in digitaler Form vor und kann unter http://bast.opus.hbz-nrw.de/ heruntergeladen werden.
F 113: Erweiterung der Software TREMOD um zukünftige Fahr-zeugkonzepte, Antriebe und KraftstoffeBergk, Heidt, Knörr, Keller E 15,50
F 114: Barrierefreiheit bei FernlinienbussenOehme, Berberich, Maier, Böhm E 17,50
F 115: Statischer und dynamischer Fahrsimulator im Vergleich – Wahrnehmung von Abstand und GeschwindigkeitFreyDieser Bericht liegt nur in digitaler Form vor und kann unter http://bast.opus.hbz-nrw.de/ heruntergeladen werden.
2017F 116: Lang-Lkw – Auswirkung auf Fahrzeugsicherheit und Um-weltSüßmann, Förg, WenzelisDieser Bericht liegt nur in digitaler Form vor und kann unter http://bast.opus.hbz-nrw.de/ heruntergeladen werden.
F 117: 7th International Conference on ESAR „Expert Symposium on Accident Research“ – Reports on the ESAR-Conference 2016 at Hannover Medical SchoolDieser Bericht liegt nur in digitaler Form vor und kann unter http://bast.opus.hbz-nrw.de/ heruntergeladen werden.
XX
Fordern Sie auch unser kostenloses Gesamtverzeichnis aller lieferbaren Titel an! Dieses sowie alle Titel der Schriftenreihe können Sie unter der folgenden Adresse bestellen:
Fachverlag NW in der Carl Schünemann Verlag GmbHZweite Schlachtpforte 7 · 28195 BremenTel. +(0)421/3 69 03-53 · Fax +(0)421/3 69 03-63
Alternativ können Sie alle lieferbaren Titel auch auf unserer Website finden und bestellen.
www.schuenemann-verlag.de


