7th Grade Mathematics Unpacked Content
45
7 th Grade Mathematics l Unpacked Content October, 2012 Update to 7.NS.3 (Jan, 2016) 7 th Grade Mathematics ● Unpacked Content For the new Common Core standards that will be effective in all North Carolina schools in the 2012-13 School Year. This document is designed to help North Carolina educators teach the Common Core (Standard Course of Study). NCDPI staff are continually updating and improving these tools to better serve teachers. What is the purpose of this document? To increase student achievement by ensuring educators understand specifically what the new standards mean a student must know, understand and be able to do. What is in the document? Descriptions of what each standard means a student will know, understand and be able to do. The “unpacking” of the standards done in this document is an effort to answer a simple question “What does this standard mean that a student must know and be able to do?” and to ensure the description is helpful, specific and comprehensive for educators. How do I send Feedback? We intend the explanations and examples in this document to be helpful and specific. That said, we believe that as this document is used, teachers and educators will find ways in which the unpacking can be improved and made ever more useful. Please send feedback to us at [email protected] and we will use your input to refine our unpacking of the standards. Thank You! Just want the standards alone? You can find the standards alone at www.corestandards.org .
-
Upload
phungkhanh -
Category
Documents
-
view
237 -
download
3
Transcript of 7th Grade Mathematics Unpacked Content
7th Grade Mathematics l Unpacked Content October, 2012 Update to 7.NS.3 (Jan, 2016)
7th Grade Mathematics ● Unpacked Content For the new Common Core standards that will be effective in all North Carolina schools in the 2012-13 School Year.
This document is designed to help North Carolina educators teach the Common Core (Standard Course of Study). NCDPI staff are continually updating and improving these tools to better serve teachers.
What is the purpose of this document? To increase student achievement by ensuring educators understand specifically what the new standards mean a student must know, understand and be able to do.
What is in the document? Descriptions of what each standard means a student will know, understand and be able to do. The “unpacking” of the standards done in this document is an effort to answer a simple question “What does this standard mean that a student must know and be able to do?” and to ensure the description is helpful, specific and comprehensive for educators.
How do I send Feedback? We intend the explanations and examples in this document to be helpful and specific. That said, we believe that as this document is used, teachers and educators will find ways in which the unpacking can be improved and made ever more useful. Please send feedback to us at [email protected] and we will use your input to refine our unpacking of the standards. Thank You!
Just want the standards alone? You can find the standards alone at www.corestandards.org .
7th Grade Mathematics Unpacked Content Page 2
At A Glance
New to 7th Grade: • Constant of proportionality (7.RP.2b) • Percent of error (7.RP.3) • Factoring to create equivalent expressions (7.EE.1) • Triangle side lengths (7.G.2) • Area and circumference of circles (7.G.4) • Angles (supplementary, complementary, vertical) (7. G.5) • Surface area and volume of pyramids (7.G.6) • Probability (7.SP.5 – 7.SP.8) Moved from 7th Grade: • Similar and congruent polygons (moved to 8th grade) • Surface area and volume of cylinders (moved to 8th grade – volume only) • Creation of box plots and histograms (moved to 6th grade – 7th grade continues to compare) • Linear relations and functions (y-intercept moved to 8th grade) • Views from 3-Dimensional figures (removed from CCSS) • Statistical measures (moved to 6th grade) Notes: • Topics may appear to be similar between the CCSS and the 2003 NCSCOS; however, the CCSS may be presented at a higher cognitive
demand. • Proportionality in 7th grade now includes identifying proportional relationships from tables and graphs; writing equations to represent
proportional relationships. • Using a number line for rational number operations is emphasized in CCSS. • For more detailed information, see the crosswalks (http://www.ncpublicschools.org/acre/standards/common-core-tools) Instructional considerations for CCSS implementation in 2012 – 2013: • Work with ratio tables and relationships between tables, graphs and equations; focus on the multiplicative relationship between and within ratios
(6.RP.3a, 6.RP.3b) • Unit conversions within systems (6.RP.3d) • Opposites and absolute value (6.NS.6a, 6.NS.7c) • Distributive property with area models and factoring (6.EE.3) – prerequisite to 7.EE.1 • Volume of rectangular prisms (6.G.2) and surface area (6.G.4) – prerequisite to 7.G.6 • Mean Absolute Deviation (6.SP.5c) – prerequisite to 7.SP.3 and foundational to standard deviation in Math One
7th Grade Mathematics Unpacked Content Page 3
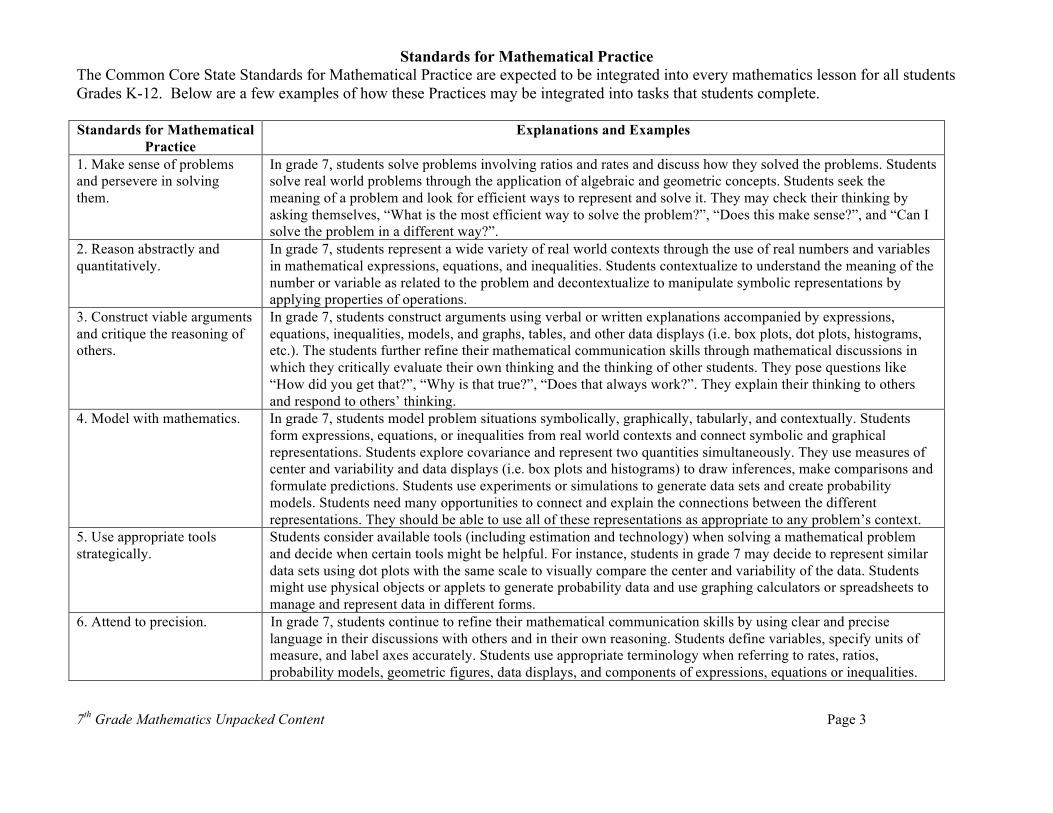
Standards for Mathematical Practice The Common Core State Standards for Mathematical Practice are expected to be integrated into every mathematics lesson for all students Grades K-12. Below are a few examples of how these Practices may be integrated into tasks that students complete. Standards for Mathematical
Practice Explanations and Examples
1. Make sense of problems and persevere in solving them.
In grade 7, students solve problems involving ratios and rates and discuss how they solved the problems. Students solve real world problems through the application of algebraic and geometric concepts. Students seek the meaning of a problem and look for efficient ways to represent and solve it. They may check their thinking by asking themselves, “What is the most efficient way to solve the problem?”, “Does this make sense?”, and “Can I solve the problem in a different way?”.
2. Reason abstractly and quantitatively.
In grade 7, students represent a wide variety of real world contexts through the use of real numbers and variables in mathematical expressions, equations, and inequalities. Students contextualize to understand the meaning of the number or variable as related to the problem and decontextualize to manipulate symbolic representations by applying properties of operations.
3. Construct viable arguments and critique the reasoning of others.
In grade 7, students construct arguments using verbal or written explanations accompanied by expressions, equations, inequalities, models, and graphs, tables, and other data displays (i.e. box plots, dot plots, histograms, etc.). The students further refine their mathematical communication skills through mathematical discussions in which they critically evaluate their own thinking and the thinking of other students. They pose questions like “How did you get that?”, “Why is that true?”, “Does that always work?”. They explain their thinking to others and respond to others’ thinking.
4. Model with mathematics. In grade 7, students model problem situations symbolically, graphically, tabularly, and contextually. Students form expressions, equations, or inequalities from real world contexts and connect symbolic and graphical representations. Students explore covariance and represent two quantities simultaneously. They use measures of center and variability and data displays (i.e. box plots and histograms) to draw inferences, make comparisons and formulate predictions. Students use experiments or simulations to generate data sets and create probability models. Students need many opportunities to connect and explain the connections between the different representations. They should be able to use all of these representations as appropriate to any problem’s context.
5. Use appropriate tools strategically.
Students consider available tools (including estimation and technology) when solving a mathematical problem and decide when certain tools might be helpful. For instance, students in grade 7 may decide to represent similar data sets using dot plots with the same scale to visually compare the center and variability of the data. Students might use physical objects or applets to generate probability data and use graphing calculators or spreadsheets to manage and represent data in different forms.
6. Attend to precision. In grade 7, students continue to refine their mathematical communication skills by using clear and precise language in their discussions with others and in their own reasoning. Students define variables, specify units of measure, and label axes accurately. Students use appropriate terminology when referring to rates, ratios, probability models, geometric figures, data displays, and components of expressions, equations or inequalities.
7th Grade Mathematics Unpacked Content Page 4
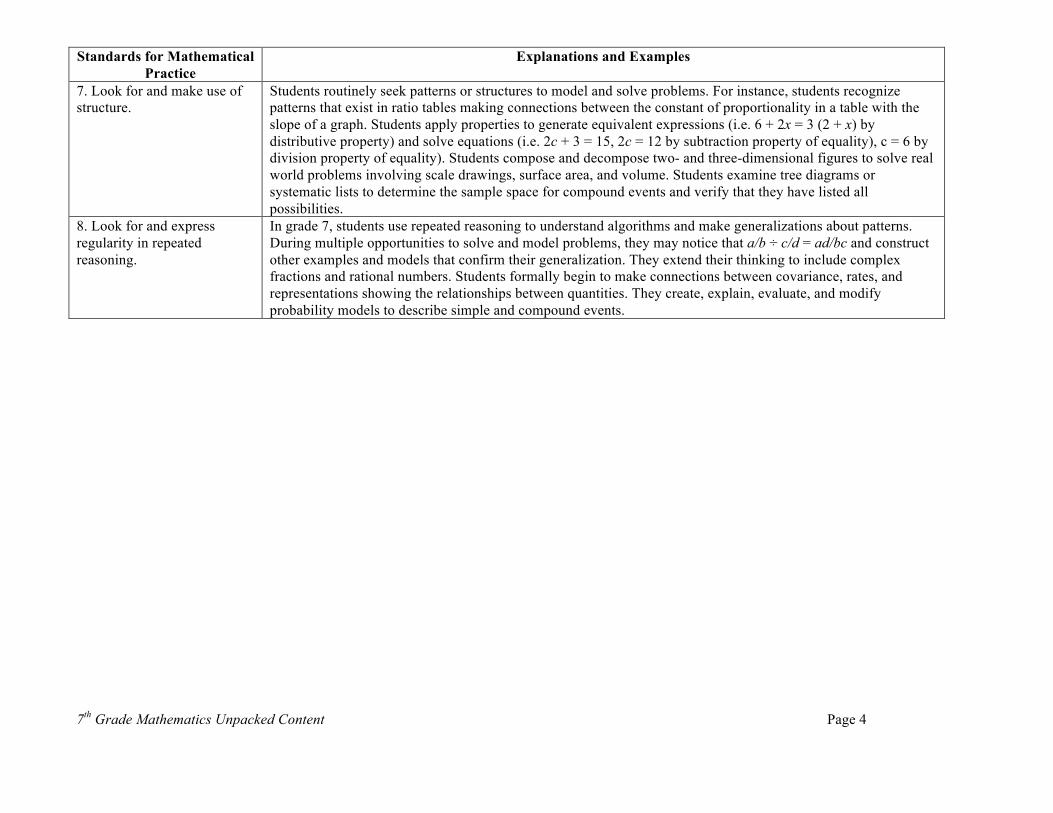
Standards for Mathematical Practice
Explanations and Examples
7. Look for and make use of structure.
Students routinely seek patterns or structures to model and solve problems. For instance, students recognize patterns that exist in ratio tables making connections between the constant of proportionality in a table with the slope of a graph. Students apply properties to generate equivalent expressions (i.e. 6 + 2x = 3 (2 + x) by distributive property) and solve equations (i.e. 2c + 3 = 15, 2c = 12 by subtraction property of equality), c = 6 by division property of equality). Students compose and decompose two- and three-dimensional figures to solve real world problems involving scale drawings, surface area, and volume. Students examine tree diagrams or systematic lists to determine the sample space for compound events and verify that they have listed all possibilities.
8. Look for and express regularity in repeated reasoning.
In grade 7, students use repeated reasoning to understand algorithms and make generalizations about patterns. During multiple opportunities to solve and model problems, they may notice that a/b ÷ c/d = ad/bc and construct other examples and models that confirm their generalization. They extend their thinking to include complex fractions and rational numbers. Students formally begin to make connections between covariance, rates, and representations showing the relationships between quantities. They create, explain, evaluate, and modify probability models to describe simple and compound events.
7th Grade Mathematics Unpacked Content Page 5
Grade 7 Critical Areas (from CCSS pg. 46) The Critical Areas are designed to bring focus to the standards at each grade by describing the big ideas that educators can use to build their curriculum and to guide instruction. The Critical Areas for seventh grade can be found on page 46 in the Common Core State Standards for Mathematics. 1. Developing understanding of and applying proportional relationships
Students extend their understanding of ratios and develop understanding of proportionality to solve single- and multi-step problems. Students use their understanding of ratios and proportionality to solve a wide variety of percent problems, including those involving discounts, interest, taxes, tips, and percent increase or decrease. Students solve problems about scale drawings by relating corresponding lengths between the objects or by using the fact that relationships of lengths within an object are preserved in similar objects. Students graph proportional relationships and understand the unit rate informally as a measure of the steepness of the related line, called the slope. They distinguish proportional relationships from other relationships.
2. Developing understanding of operations with rational numbers and working with expressions and linear equations
Students develop a unified understanding of number, recognizing fractions, decimals (that have a finite or a repeating decimal representation), and percents as different representations of rational numbers. Students extend addition, subtraction, multiplication, and division to all rational numbers, maintaining the properties of operations and the relationships between addition and subtraction, and multiplication and division. By applying these properties, and by viewing negative numbers in terms of everyday contexts (e.g., amounts owed or temperatures below zero), students explain and interpret the rules for adding, subtracting, multiplying, and dividing with negative numbers. They use the arithmetic of rational numbers as they formulate expressions and equations in one variable and use these equations to solve problems.
3. Solving problems involving scale drawings and informal geometric constructions, and working with two- and three-dimensional shapes to
solve problems involving area, surface area, and volume Students continue their work with area from Grade 6, solving problems involving the area and circumference of a circle and surface area of three-dimensional objects. In preparation for work on congruence and similarity in Grade 8 they reason about relationships among two-dimensional figures using scale drawings and informal geometric constructions, and they gain familiarity with the relationships between angles formed by intersecting lines. Students work with three-dimensional figures, relating them to two-dimensional figures by examining cross-sections. They solve real-world and mathematical problems involving area, surface area, and volume of two- and three-dimensional objects composed of triangles, quadrilaterals, polygons, cubes and right prisms.
4. Drawing inferences about populations based on samples
Students build on their previous work with single data distributions to compare two data distributions and address questions about differences between populations. They begin informal work with random sampling to generate data sets and learn about the importance of representative samples for drawing inferences.

7th Grade Mathematics Unpacked Content Page 6
Ratios and Proportional Relationships 7.RP Common Core Cluster Analyze proportional relationships and use them to solve real-world and mathematical problems. Mathematically proficient students communicate precisely by engaging in discussion about their reasoning using appropriate mathematical language. The terms students should learn to use with increasing precision with this cluster are: unit rates, ratios, proportional relationships, proportions, constant of proportionality, complex fractions A detailed progression of the Ratios and Proportional Relationships domain with examples can be found at http://commoncoretools.wordpress.com/
Common Core Standard Unpacking What does this standard mean that a student will know and be able to do?
7.RP.1 Compute unit rates associated with ratios of fractions, including ratios of lengths, areas and other quantities measured in like or different units. For example, if a person walks 1/2 mile in each 1/4 hour, compute the unit rate as the complex fraction 1/2/1/4 miles per hour, equivalently 2 miles per hour.
7.RP.1 Students continue to work with unit rates from 6th grade; however, the comparison now includes fractions compared to fractions. The comparison can be with like or different units. Fractions may be proper or improper. Example 1:
If gallon of paint covers of a wall, then how much paint is needed for the entire wall?
Solution:
gal / wall. 3 gallons per 1 wall
7.RP.2 Recognize and represent proportional relationships between quantities. a. Decide whether two quantities are in
a proportional relationship, e.g., by testing for equivalent ratios in a table or graphing on a coordinate plane and observing whether the graph is a straight line through the origin.
b. Identify the constant of proportionality (unit rate) in tables, graphs, equations, diagrams, and verbal descriptions of proportional relationships. Represent proportional relationships by equations. For example, if total
7.RP.2 Students’ understanding of the multiplicative reasoning used with proportions continues from 6th grade. Students determine if two quantities are in a proportional relationship from a table. Fractions and decimals could be used with this standard. Note: This standard focuses on the representations of proportions. Solving proportions is addressed in 7.SP.3. Example 1: The table below gives the price for different numbers of books. Do the numbers in the table represent a proportional relationship?
Number of Books Price
1 3 3 9 4 12 7 18
€
12
€
16
€
12
€
16
7th Grade Mathematics Unpacked Content Page 7
cost t is proportional to the number n of items purchased at a constant price p, the relationship between the total cost and the number of items can be expressed as t = pn.
c. Explain what a point (x, y) on the graph of a proportional relationship means in terms of the situation, with special attention to the points (0, 0) and (1, r) where r is the unit rate.
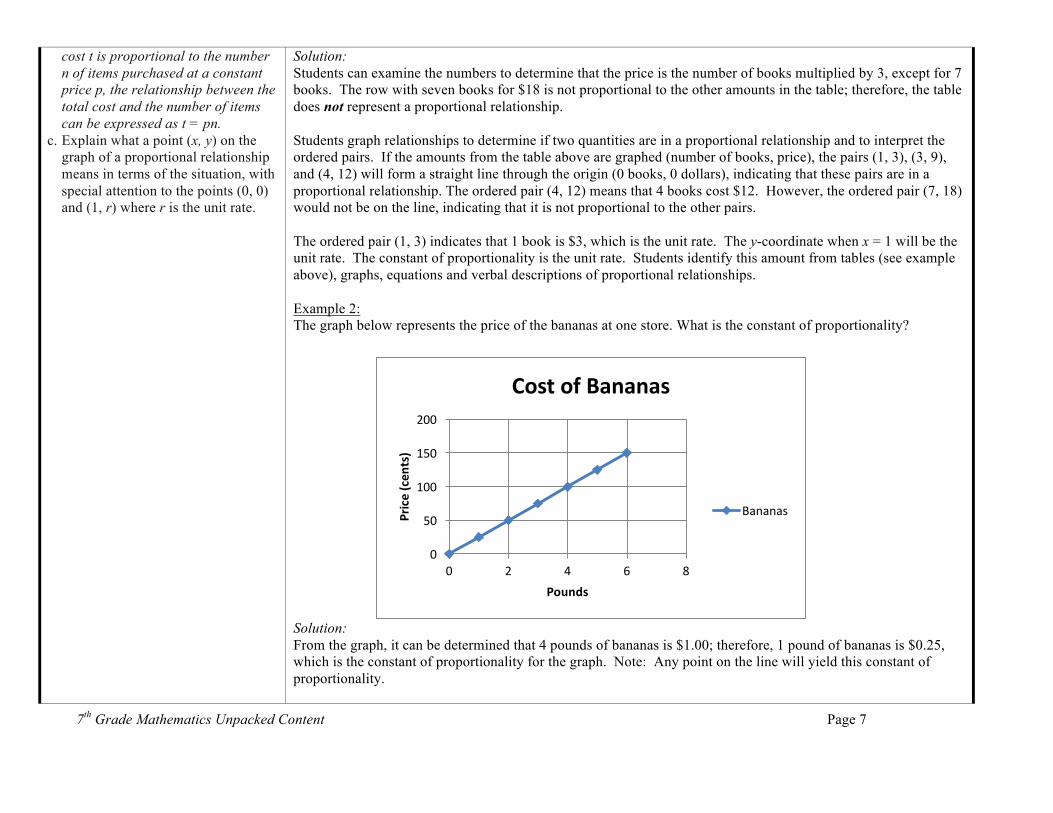
Solution: Students can examine the numbers to determine that the price is the number of books multiplied by 3, except for 7 books. The row with seven books for $18 is not proportional to the other amounts in the table; therefore, the table does not represent a proportional relationship. Students graph relationships to determine if two quantities are in a proportional relationship and to interpret the ordered pairs. If the amounts from the table above are graphed (number of books, price), the pairs (1, 3), (3, 9), and (4, 12) will form a straight line through the origin (0 books, 0 dollars), indicating that these pairs are in a proportional relationship. The ordered pair (4, 12) means that 4 books cost $12. However, the ordered pair (7, 18) would not be on the line, indicating that it is not proportional to the other pairs. The ordered pair (1, 3) indicates that 1 book is $3, which is the unit rate. The y-coordinate when x = 1 will be the unit rate. The constant of proportionality is the unit rate. Students identify this amount from tables (see example above), graphs, equations and verbal descriptions of proportional relationships. Example 2: The graph below represents the price of the bananas at one store. What is the constant of proportionality? Solution: From the graph, it can be determined that 4 pounds of bananas is $1.00; therefore, 1 pound of bananas is $0.25, which is the constant of proportionality for the graph. Note: Any point on the line will yield this constant of proportionality.
0
50
100
150
200
0 2 4 6 8
Price(cen
ts)
Pounds
CostofBananas
Bananas
7th Grade Mathematics Unpacked Content Page 8
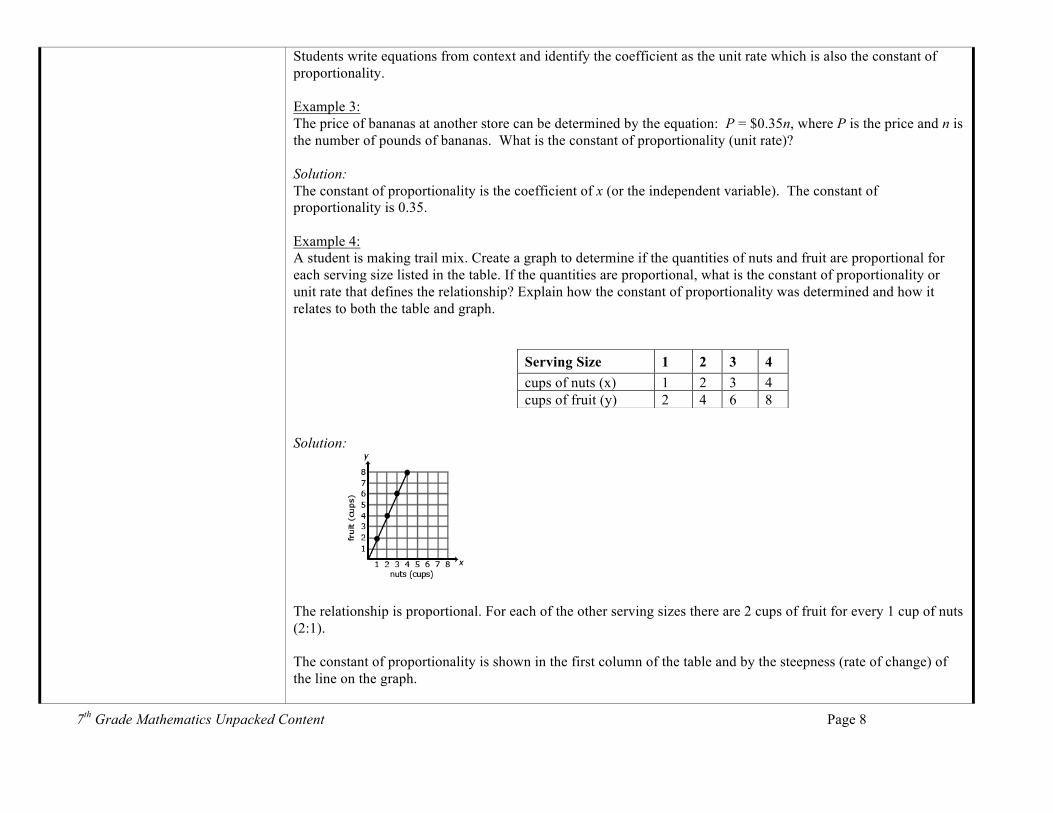
Students write equations from context and identify the coefficient as the unit rate which is also the constant of proportionality. Example 3: The price of bananas at another store can be determined by the equation: P = $0.35n, where P is the price and n is the number of pounds of bananas. What is the constant of proportionality (unit rate)? Solution: The constant of proportionality is the coefficient of x (or the independent variable). The constant of proportionality is 0.35. Example 4: A student is making trail mix. Create a graph to determine if the quantities of nuts and fruit are proportional for each serving size listed in the table. If the quantities are proportional, what is the constant of proportionality or unit rate that defines the relationship? Explain how the constant of proportionality was determined and how it relates to both the table and graph. Solution: The relationship is proportional. For each of the other serving sizes there are 2 cups of fruit for every 1 cup of nuts (2:1). The constant of proportionality is shown in the first column of the table and by the steepness (rate of change) of the line on the graph.
Serving Size 1 2 3 4 cups of nuts (x) 1 2 3 4 cups of fruit (y) 2 4 6 8
7th Grade Mathematics Unpacked Content Page 9
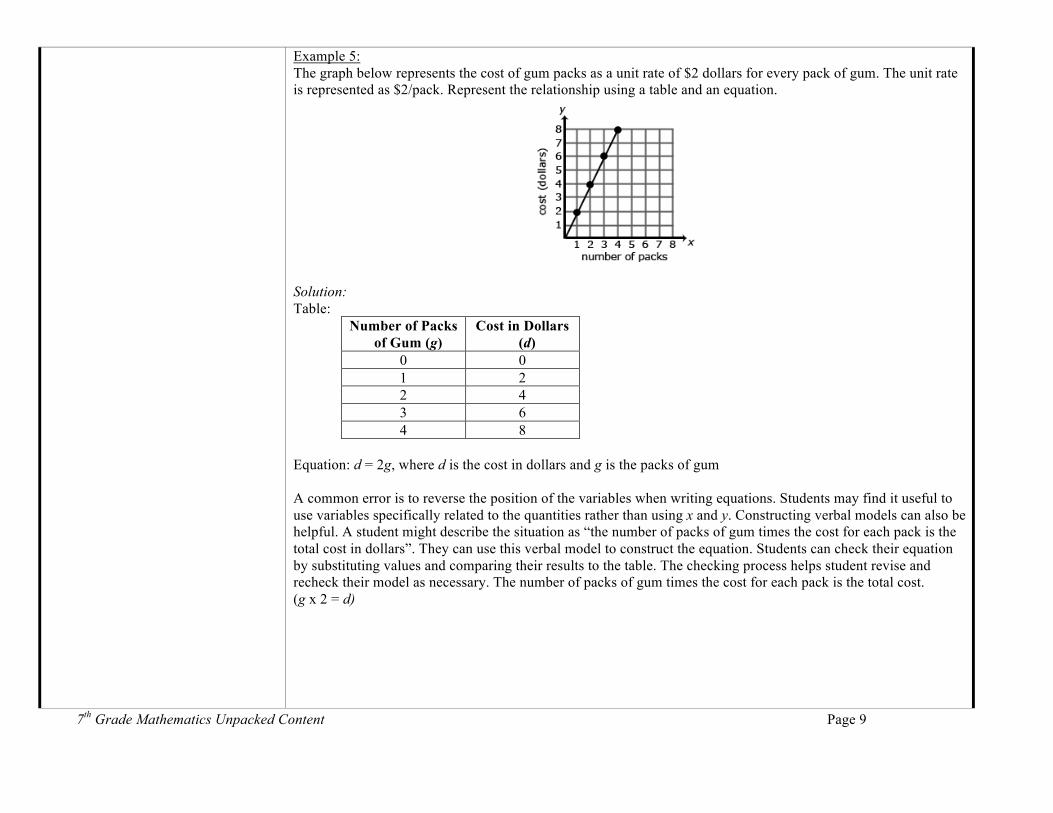
Example 5: The graph below represents the cost of gum packs as a unit rate of $2 dollars for every pack of gum. The unit rate is represented as $2/pack. Represent the relationship using a table and an equation.
Solution: Table:
Number of Packs of Gum (g)
Cost in Dollars (d)
0 0 1 2 2 4 3 6 4 8
Equation: d = 2g, where d is the cost in dollars and g is the packs of gum A common error is to reverse the position of the variables when writing equations. Students may find it useful to use variables specifically related to the quantities rather than using x and y. Constructing verbal models can also be helpful. A student might describe the situation as “the number of packs of gum times the cost for each pack is the total cost in dollars”. They can use this verbal model to construct the equation. Students can check their equation by substituting values and comparing their results to the table. The checking process helps student revise and recheck their model as necessary. The number of packs of gum times the cost for each pack is the total cost. (g x 2 = d)
7th Grade Mathematics Unpacked Content Page 10
Ratios and Proportional Relationships 7.RP Common Core Cluster Analyze proportional relationships and use them to solve real-world and mathematical problems. Mathematically proficient students communicate precisely by engaging in discussion about their reasoning using appropriate mathematical language. The terms students should learn to use with increasing precision with this cluster are: proportion, ratio, proportional relationships, percent, simple interest, rate, principal, tax, discount, markup, markdown, gratuity, commissions, fees, percent of error
Common Core Standard Unpacking What does this standard mean that a student will know and be able to do?
7.RP.3 Use proportional relationships to solve multistep ratio and percent problems. Examples: simple interest, tax, markups and markdowns, gratuities and commissions, fees, percent increase and decrease, percent error
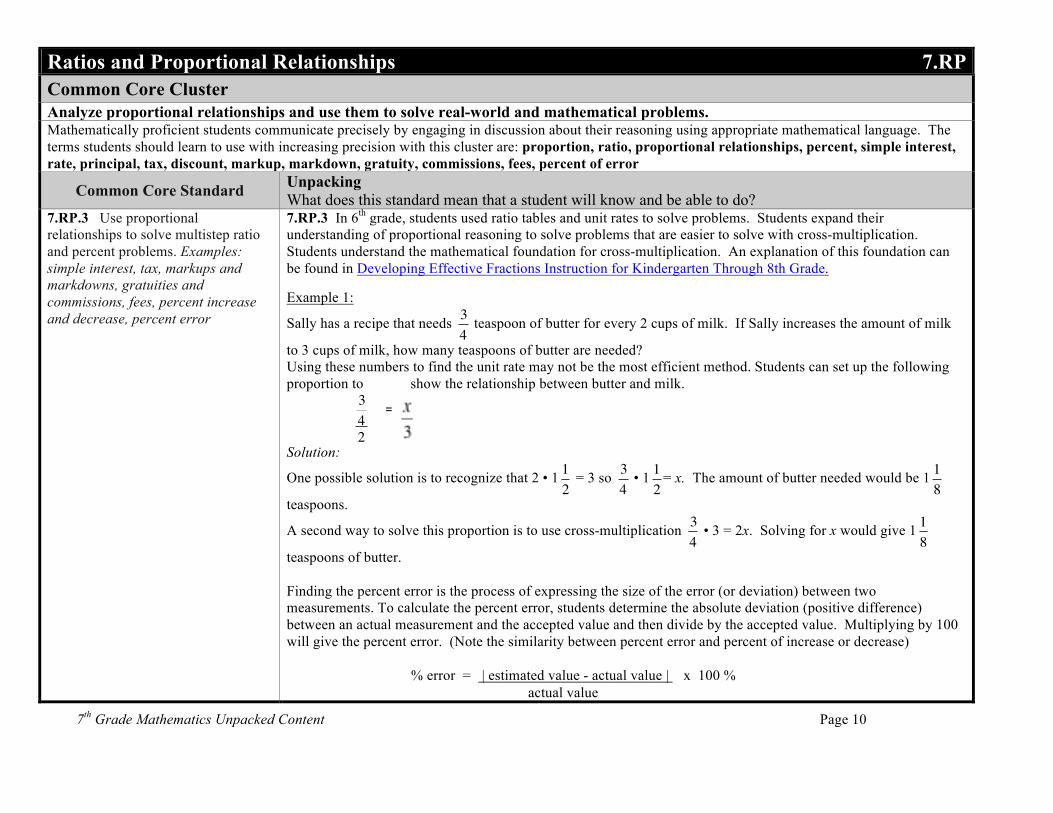
7.RP.3 In 6th grade, students used ratio tables and unit rates to solve problems. Students expand their understanding of proportional reasoning to solve problems that are easier to solve with cross-multiplication. Students understand the mathematical foundation for cross-multiplication. An explanation of this foundation can be found in Developing Effective Fractions Instruction for Kindergarten Through 8th Grade. Example 1:
Sally has a recipe that needs
€
34
teaspoon of butter for every 2 cups of milk. If Sally increases the amount of milk
to 3 cups of milk, how many teaspoons of butter are needed? Using these numbers to find the unit rate may not be the most efficient method. Students can set up the following proportion to show the relationship between butter and milk.
€
342
Solution:
One possible solution is to recognize that 2 • 1
€
12
= 3 so
€
34
• 1
€
12
= x. The amount of butter needed would be 1
€
18
teaspoons.
A second way to solve this proportion is to use cross-multiplication
€
34
• 3 = 2x. Solving for x would give 1
€
18
teaspoons of butter. Finding the percent error is the process of expressing the size of the error (or deviation) between two measurements. To calculate the percent error, students determine the absolute deviation (positive difference) between an actual measurement and the accepted value and then divide by the accepted value. Multiplying by 100 will give the percent error. (Note the similarity between percent error and percent of increase or decrease) % error = | estimated value - actual value | x 100 % actual value
=
7th Grade Mathematics Unpacked Content Page 11
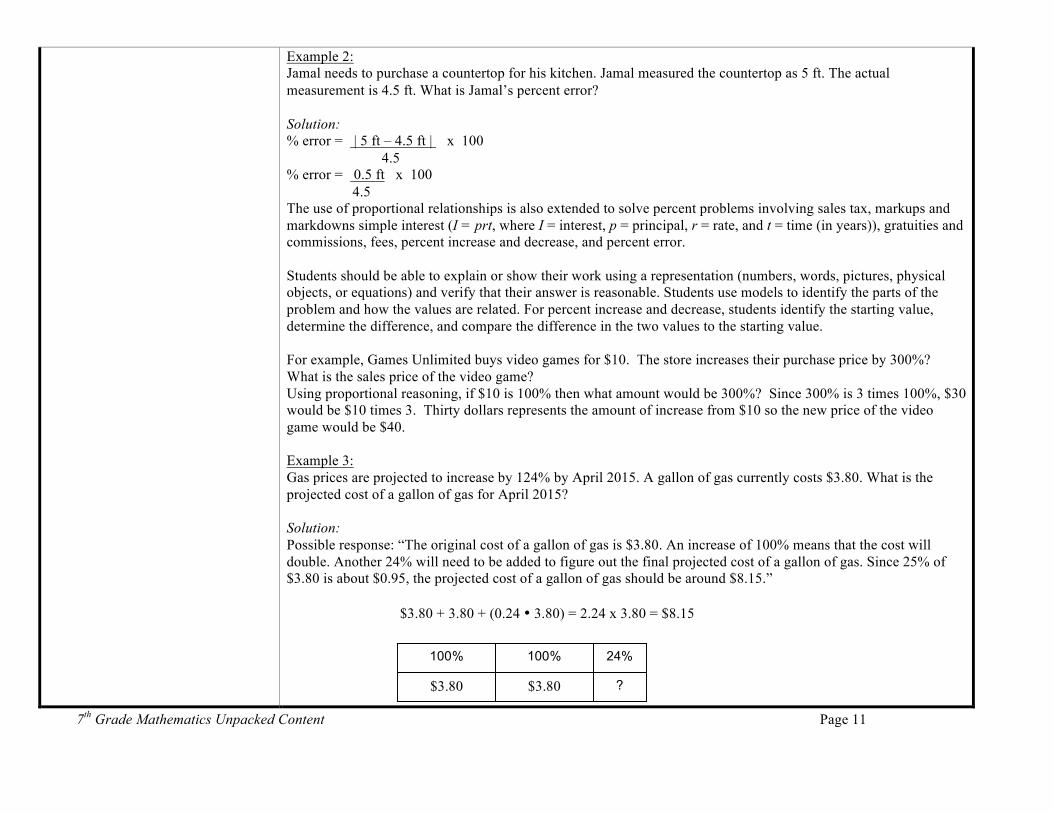
Example 2: Jamal needs to purchase a countertop for his kitchen. Jamal measured the countertop as 5 ft. The actual measurement is 4.5 ft. What is Jamal’s percent error? Solution: % error = | 5 ft – 4.5 ft | x 100 4.5 % error = 0.5 ft x 100 4.5 The use of proportional relationships is also extended to solve percent problems involving sales tax, markups and markdowns simple interest (I = prt, where I = interest, p = principal, r = rate, and t = time (in years)), gratuities and commissions, fees, percent increase and decrease, and percent error. Students should be able to explain or show their work using a representation (numbers, words, pictures, physical objects, or equations) and verify that their answer is reasonable. Students use models to identify the parts of the problem and how the values are related. For percent increase and decrease, students identify the starting value, determine the difference, and compare the difference in the two values to the starting value. For example, Games Unlimited buys video games for $10. The store increases their purchase price by 300%? What is the sales price of the video game? Using proportional reasoning, if $10 is 100% then what amount would be 300%? Since 300% is 3 times 100%, $30 would be $10 times 3. Thirty dollars represents the amount of increase from $10 so the new price of the video game would be $40. Example 3: Gas prices are projected to increase by 124% by April 2015. A gallon of gas currently costs $3.80. What is the projected cost of a gallon of gas for April 2015? Solution: Possible response: “The original cost of a gallon of gas is $3.80. An increase of 100% means that the cost will double. Another 24% will need to be added to figure out the final projected cost of a gallon of gas. Since 25% of $3.80 is about $0.95, the projected cost of a gallon of gas should be around $8.15.” $3.80 + 3.80 + (0.24 • 3.80) = 2.24 x 3.80 = $8.15
100%
$3.80
100%
$3.80
24%
?
7th Grade Mathematics Unpacked Content Page 12
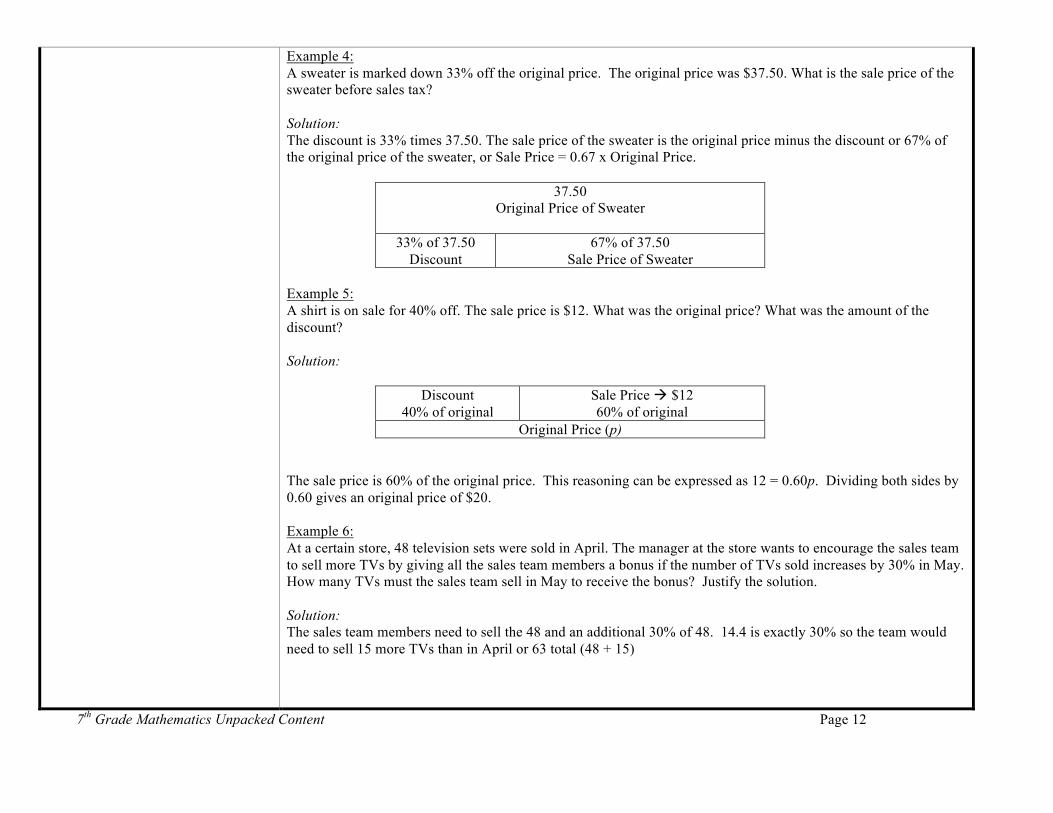
Example 4: A sweater is marked down 33% off the original price. The original price was $37.50. What is the sale price of the sweater before sales tax?
Solution: The discount is 33% times 37.50. The sale price of the sweater is the original price minus the discount or 67% of the original price of the sweater, or Sale Price = 0.67 x Original Price.
37.50 Original Price of Sweater
33% of 37.50
Discount 67% of 37.50
Sale Price of Sweater Example 5: A shirt is on sale for 40% off. The sale price is $12. What was the original price? What was the amount of the discount? Solution:
Discount 40% of original
Sale Price à $12 60% of original
Original Price (p)
The sale price is 60% of the original price. This reasoning can be expressed as 12 = 0.60p. Dividing both sides by 0.60 gives an original price of $20. Example 6: At a certain store, 48 television sets were sold in April. The manager at the store wants to encourage the sales team to sell more TVs by giving all the sales team members a bonus if the number of TVs sold increases by 30% in May. How many TVs must the sales team sell in May to receive the bonus? Justify the solution. Solution: The sales team members need to sell the 48 and an additional 30% of 48. 14.4 is exactly 30% so the team would need to sell 15 more TVs than in April or 63 total (48 + 15)
7th Grade Mathematics Unpacked Content Page 13
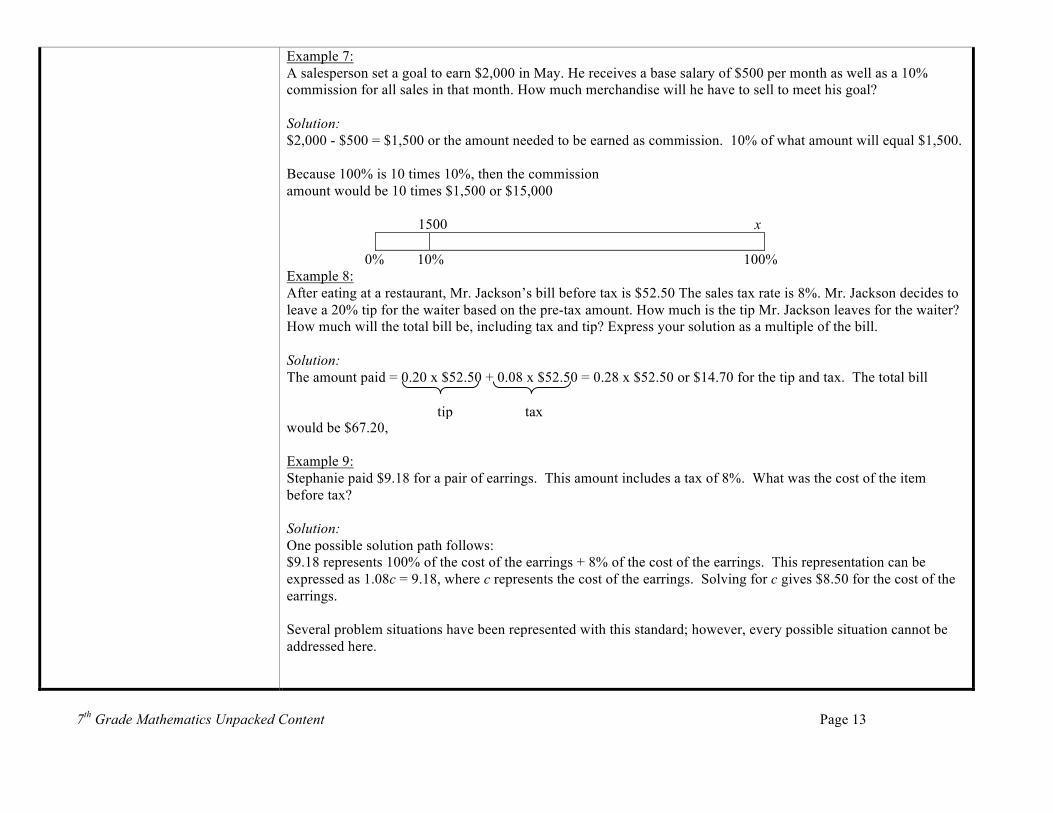
Example 7: A salesperson set a goal to earn $2,000 in May. He receives a base salary of $500 per month as well as a 10% commission for all sales in that month. How much merchandise will he have to sell to meet his goal? Solution: $2,000 - $500 = $1,500 or the amount needed to be earned as commission. 10% of what amount will equal $1,500. Because 100% is 10 times 10%, then the commission amount would be 10 times $1,500 or $15,000
1500 x
0% 10% 100% Example 8: After eating at a restaurant, Mr. Jackson’s bill before tax is $52.50 The sales tax rate is 8%. Mr. Jackson decides to leave a 20% tip for the waiter based on the pre-tax amount. How much is the tip Mr. Jackson leaves for the waiter? How much will the total bill be, including tax and tip? Express your solution as a multiple of the bill. Solution: The amount paid = 0.20 x $52.50 + 0.08 x $52.50 = 0.28 x $52.50 or $14.70 for the tip and tax. The total bill would be $67.20, Example 9: Stephanie paid $9.18 for a pair of earrings. This amount includes a tax of 8%. What was the cost of the item before tax? Solution: One possible solution path follows: $9.18 represents 100% of the cost of the earrings + 8% of the cost of the earrings. This representation can be expressed as 1.08c = 9.18, where c represents the cost of the earrings. Solving for c gives $8.50 for the cost of the earrings. Several problem situations have been represented with this standard; however, every possible situation cannot be addressed here.
tip tax
7th Grade Mathematics Unpacked Content Page 14
The Number System 7.NS Common Core Cluster Apply and extend previous understandings of operations with fractions to add, subtract, multiply, and divide rational numbers. Mathematically proficient students communicate precisely by engaging in discussion about their reasoning using appropriate mathematical language. The terms students should learn to use with increasing precision with this cluster are: rational numbers, integers, additive inverse
Common Core Standard Unpacking What does this standard mean that a student will know and be able to do?
7.NS.1 Apply and extend previous understandings of addition and subtraction to add and subtract rational numbers; represent addition and subtraction on a horizontal or vertical number line diagram. a. Describe situations in which opposite
quantities combine to make 0. For example, a hydrogen atom has 0 charge because its two constituents are oppositely charged.
b. Understand p + q as the number located a distance |q| from p, in the positive or negative direction depending on whether q is positive or negative. Show that a number and its opposite have a sum of 0 (are additive inverses). Interpret sums of rational numbers by describing real-world contexts.
c. Understand subtraction of rational numbers as adding the additive inverse, p – q = p + (–q). Show that the distance between two rational numbers on the number line is the absolute value of their difference, and apply this principle in real-world contexts.
d. Apply properties of operations as strategies to add and subtract rational numbers.
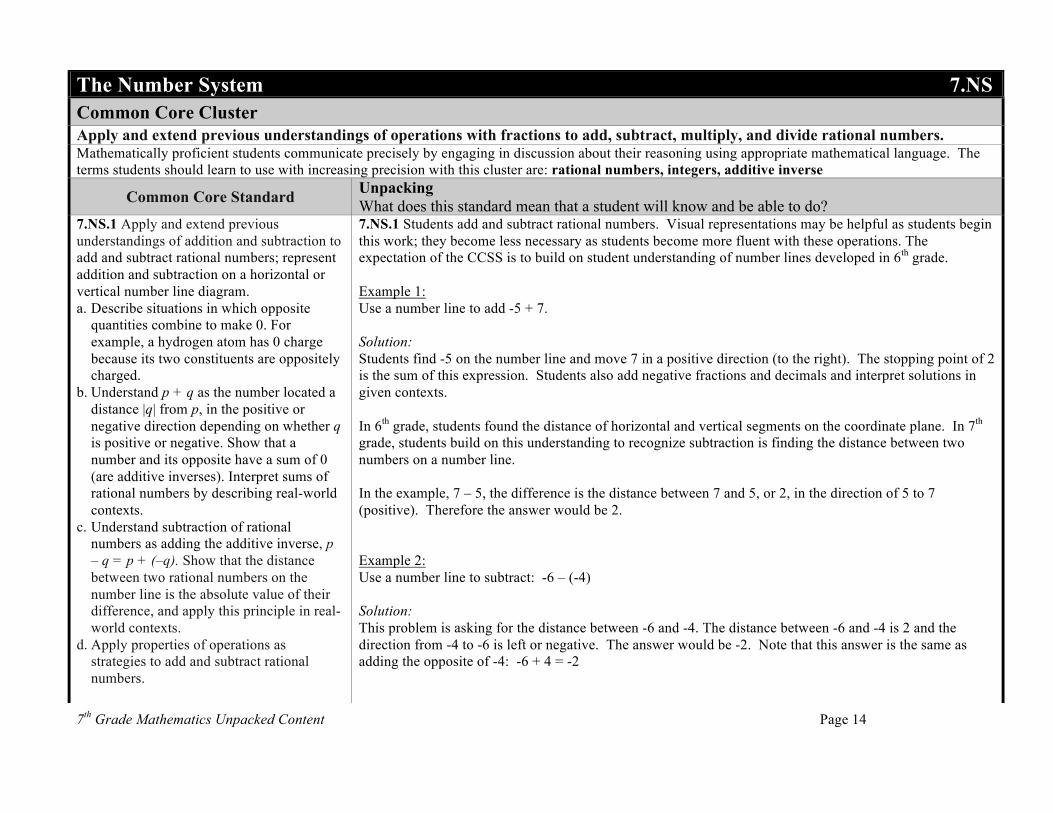
7.NS.1 Students add and subtract rational numbers. Visual representations may be helpful as students begin this work; they become less necessary as students become more fluent with these operations. The expectation of the CCSS is to build on student understanding of number lines developed in 6th grade. Example 1: Use a number line to add -5 + 7. Solution: Students find -5 on the number line and move 7 in a positive direction (to the right). The stopping point of 2 is the sum of this expression. Students also add negative fractions and decimals and interpret solutions in given contexts. In 6th grade, students found the distance of horizontal and vertical segments on the coordinate plane. In 7th grade, students build on this understanding to recognize subtraction is finding the distance between two numbers on a number line. In the example, 7 – 5, the difference is the distance between 7 and 5, or 2, in the direction of 5 to 7 (positive). Therefore the answer would be 2. Example 2: Use a number line to subtract: -6 – (-4) Solution: This problem is asking for the distance between -6 and -4. The distance between -6 and -4 is 2 and the direction from -4 to -6 is left or negative. The answer would be -2. Note that this answer is the same as adding the opposite of -4: -6 + 4 = -2
7th Grade Mathematics Unpacked Content Page 15
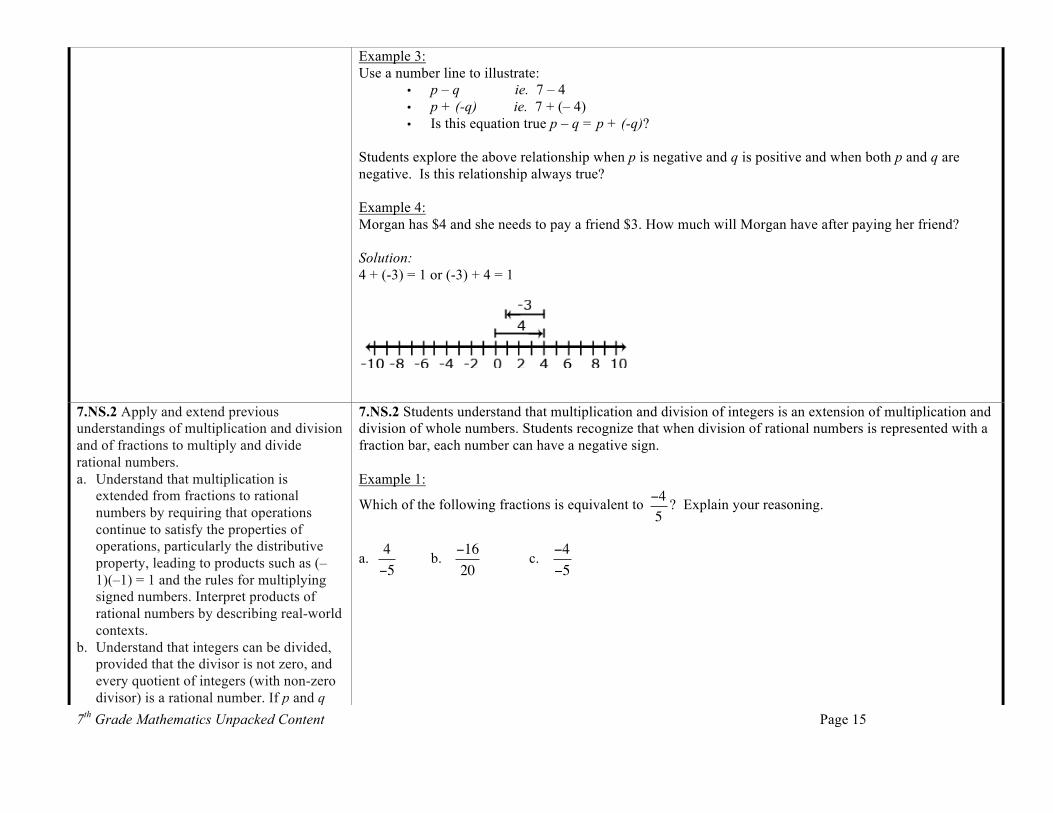
Example 3: Use a number line to illustrate:
• p – q ie. 7 – 4 • p + (-q) ie. 7 + (– 4) • Is this equation true p – q = p + (-q)?
Students explore the above relationship when p is negative and q is positive and when both p and q are negative. Is this relationship always true? Example 4: Morgan has $4 and she needs to pay a friend $3. How much will Morgan have after paying her friend? Solution: 4 + (-3) = 1 or (-3) + 4 = 1
7.NS.2 Apply and extend previous understandings of multiplication and division and of fractions to multiply and divide rational numbers. a. Understand that multiplication is
extended from fractions to rational numbers by requiring that operations continue to satisfy the properties of operations, particularly the distributive property, leading to products such as (–1)(–1) = 1 and the rules for multiplying signed numbers. Interpret products of rational numbers by describing real-world contexts.
b. Understand that integers can be divided, provided that the divisor is not zero, and every quotient of integers (with non-zero divisor) is a rational number. If p and q
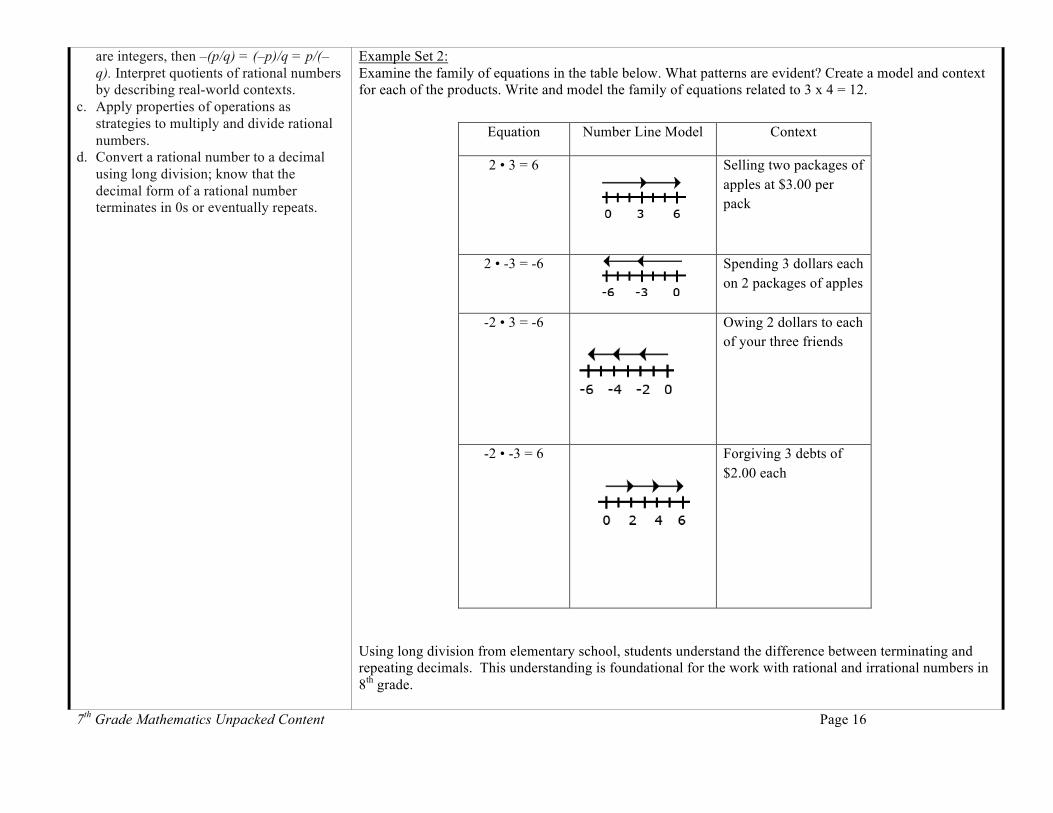
7.NS.2 Students understand that multiplication and division of integers is an extension of multiplication and division of whole numbers. Students recognize that when division of rational numbers is represented with a fraction bar, each number can have a negative sign. Example 1:
Which of the following fractions is equivalent to
€
−45
? Explain your reasoning.
a. b. c.
€
4−5
€
−1620
€
−4−5
7th Grade Mathematics Unpacked Content Page 16
are integers, then –(p/q) = (–p)/q = p/(–q). Interpret quotients of rational numbers by describing real-world contexts.
c. Apply properties of operations as strategies to multiply and divide rational numbers.
d. Convert a rational number to a decimal using long division; know that the decimal form of a rational number terminates in 0s or eventually repeats.
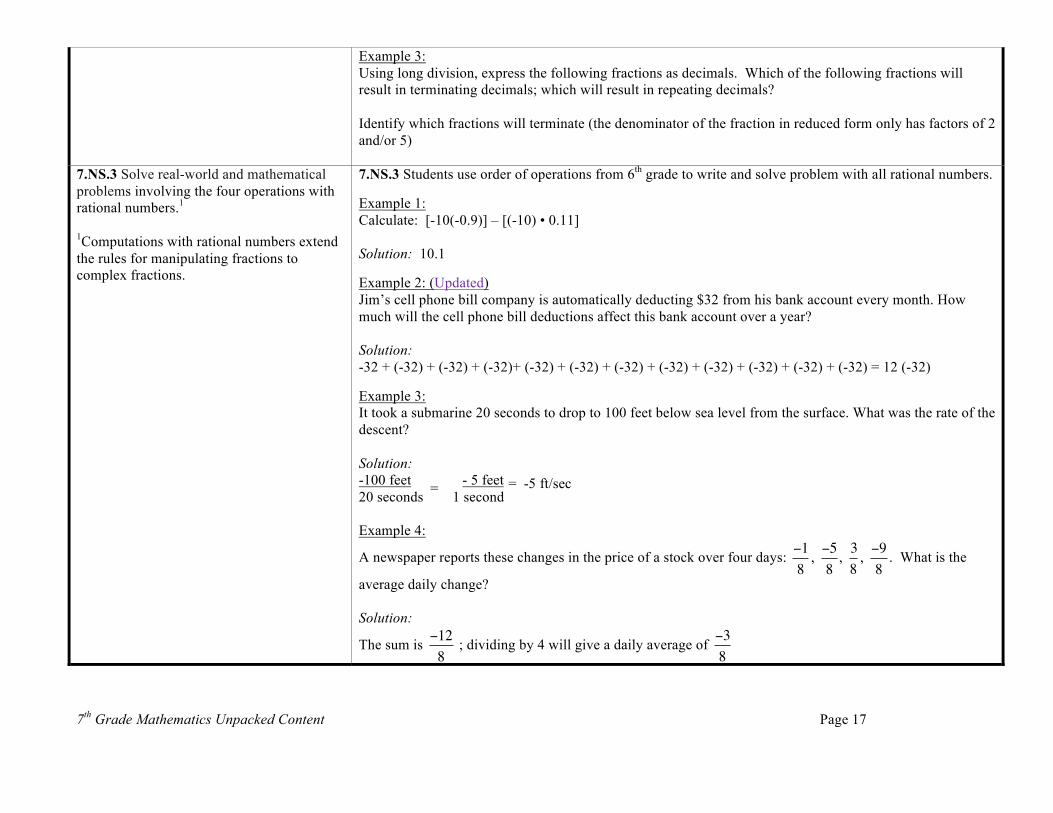
Example Set 2: Examine the family of equations in the table below. What patterns are evident? Create a model and context for each of the products. Write and model the family of equations related to 3 x 4 = 12.
Equation Number Line Model Context
2 • 3 = 6
Selling two packages of apples at $3.00 per pack
2 • -3 = -6
Spending 3 dollars each on 2 packages of apples
-2 • 3 = -6
Owing 2 dollars to each of your three friends
-2 • -3 = 6
Forgiving 3 debts of $2.00 each
Using long division from elementary school, students understand the difference between terminating and repeating decimals. This understanding is foundational for the work with rational and irrational numbers in 8th grade.
7th Grade Mathematics Unpacked Content Page 17
Example 3: Using long division, express the following fractions as decimals. Which of the following fractions will result in terminating decimals; which will result in repeating decimals? Identify which fractions will terminate (the denominator of the fraction in reduced form only has factors of 2 and/or 5)
7.NS.3 Solve real-world and mathematical problems involving the four operations with rational numbers.1 1Computations with rational numbers extend the rules for manipulating fractions to complex fractions.
7.NS.3 Students use order of operations from 6th grade to write and solve problem with all rational numbers. Example 1: Calculate: [-10(-0.9)] – [(-10) • 0.11] Solution: 10.1 Example 2: (Updated) Jim’s cell phone bill company is automatically deducting $32 from his bank account every month. How much will the cell phone bill deductions affect this bank account over a year?
Solution: -32 + (-32) + (-32) + (-32)+ (-32) + (-32) + (-32) + (-32) + (-32) + (-32) + (-32) + (-32) = 12 (-32)
Example 3: It took a submarine 20 seconds to drop to 100 feet below sea level from the surface. What was the rate of the descent? Solution: -100 feet - 5 feet 20 seconds 1 second Example 4:
A newspaper reports these changes in the price of a stock over four days: , , , . What is the
average daily change? Solution:
The sum is ; dividing by 4 will give a daily average of €
−18
€
−58
€
38
€
−98
€
−128
€
−38
= -5 ft/sec =
7th Grade Mathematics Unpacked Content Page 18
Expressions and Equations 7.EE Common Core Cluster Use properties of operations to generate equivalent expressions. Mathematically proficient students communicate precisely by engaging in discussion about their reasoning using appropriate mathematical language. The terms students should learn to use with increasing precision with this cluster are: coefficients, like terms, distributive property, factor
Common Core Standard Unpacking What does this standard mean that a student will know and be able to do?
7.EE.1 Apply properties of operations as strategies to add, subtract, factor, and expand linear expressions with rational coefficients.
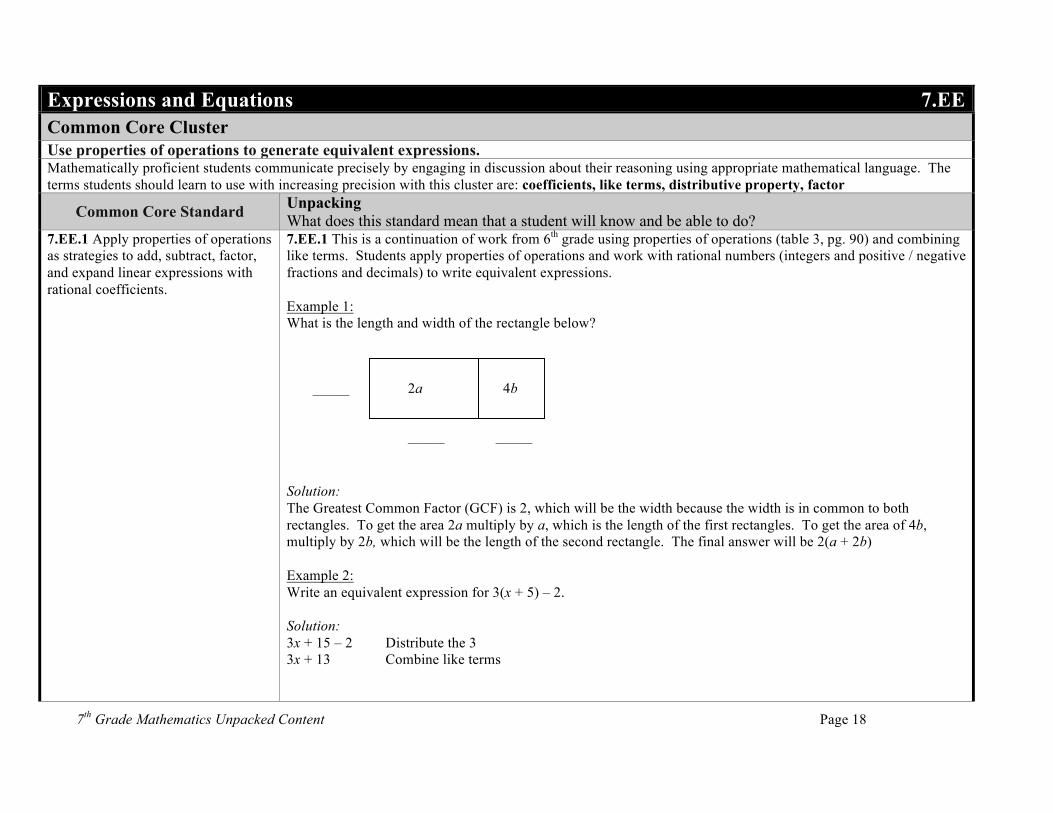
7.EE.1 This is a continuation of work from 6th grade using properties of operations (table 3, pg. 90) and combining like terms. Students apply properties of operations and work with rational numbers (integers and positive / negative fractions and decimals) to write equivalent expressions. Example 1: What is the length and width of the rectangle below? Solution: The Greatest Common Factor (GCF) is 2, which will be the width because the width is in common to both rectangles. To get the area 2a multiply by a, which is the length of the first rectangles. To get the area of 4b, multiply by 2b, which will be the length of the second rectangle. The final answer will be 2(a + 2b) Example 2: Write an equivalent expression for 3(x + 5) – 2. Solution: 3x + 15 – 2 Distribute the 3 3x + 13 Combine like terms
2a 4b _______
_____ _____
7th Grade Mathematics Unpacked Content Page 19
Example 3: Suzanne says the two expressions 2(3a – 2) + 4a and 10a – 2 are equivalent? Is she correct? Explain why or why not? Solution: The expressions are not equivalent. One way to prove this is to distribute and combine like terms in the first expression to get 10a – 4, which is not equivalent to the second expression. A second explanation is to substitute a value for the variable and perform the calculations. For example, if 2 is substituted for a then the value of the first expression is 16 while the value of the second expression is 18.
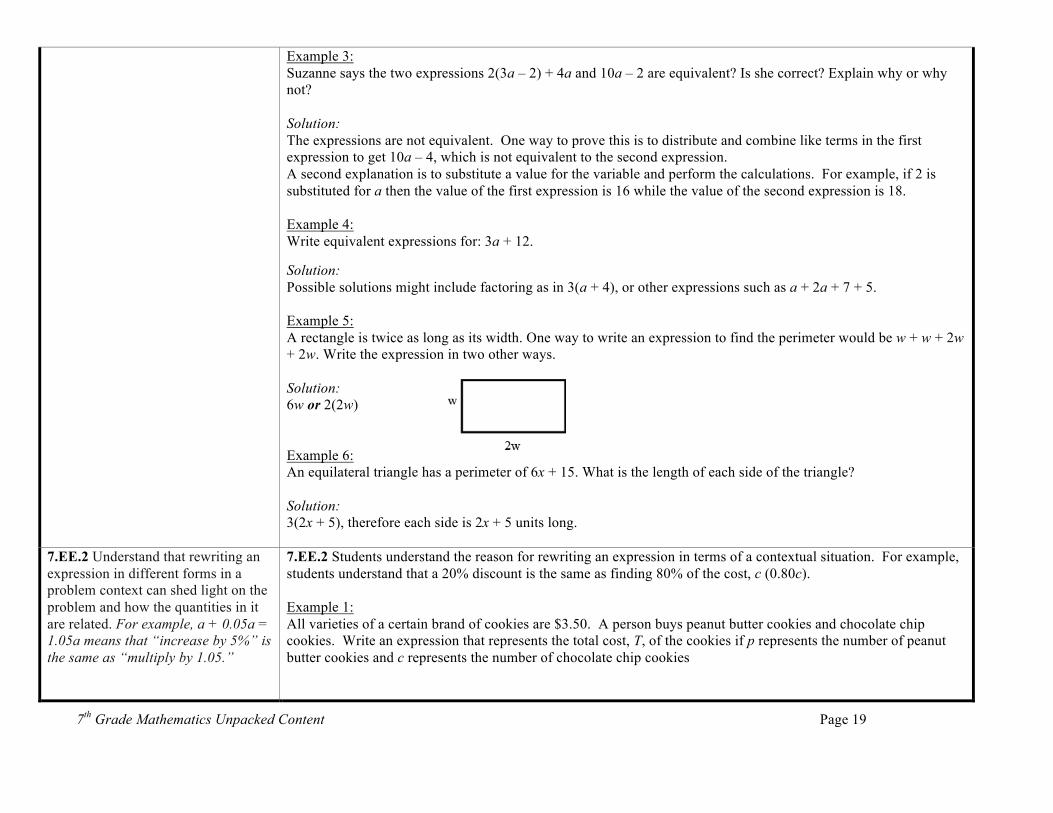
Example 4: Write equivalent expressions for: 3a + 12. Solution: Possible solutions might include factoring as in 3(a + 4), or other expressions such as a + 2a + 7 + 5. Example 5: A rectangle is twice as long as its width. One way to write an expression to find the perimeter would be w + w + 2w + 2w. Write the expression in two other ways.
Solution: 6w or 2(2w)
Example 6: An equilateral triangle has a perimeter of 6x + 15. What is the length of each side of the triangle? Solution: 3(2x + 5), therefore each side is 2x + 5 units long.
7.EE.2 Understand that rewriting an expression in different forms in a problem context can shed light on the problem and how the quantities in it are related. For example, a + 0.05a = 1.05a means that “increase by 5%” is the same as “multiply by 1.05.”
7.EE.2 Students understand the reason for rewriting an expression in terms of a contextual situation. For example, students understand that a 20% discount is the same as finding 80% of the cost, c (0.80c). Example 1: All varieties of a certain brand of cookies are $3.50. A person buys peanut butter cookies and chocolate chip cookies. Write an expression that represents the total cost, T, of the cookies if p represents the number of peanut butter cookies and c represents the number of chocolate chip cookies
7th Grade Mathematics Unpacked Content Page 20
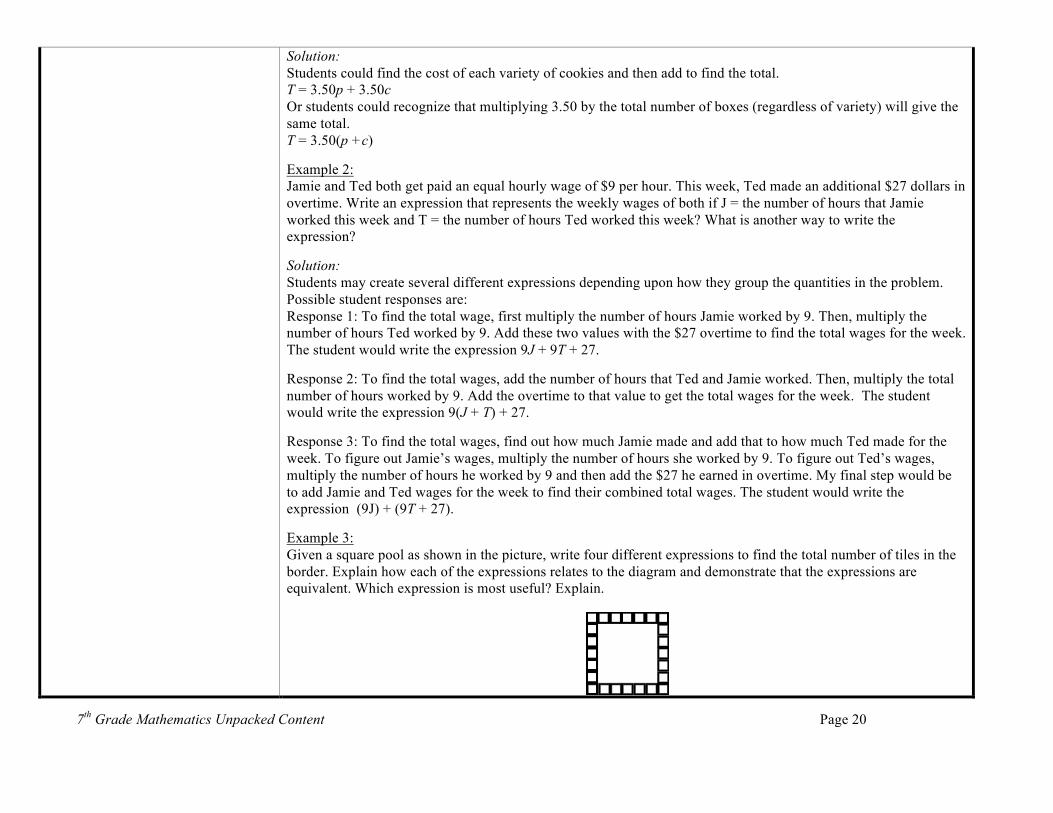
Solution: Students could find the cost of each variety of cookies and then add to find the total. T = 3.50p + 3.50c Or students could recognize that multiplying 3.50 by the total number of boxes (regardless of variety) will give the same total. T = 3.50(p +c) Example 2: Jamie and Ted both get paid an equal hourly wage of $9 per hour. This week, Ted made an additional $27 dollars in overtime. Write an expression that represents the weekly wages of both if J = the number of hours that Jamie worked this week and T = the number of hours Ted worked this week? What is another way to write the expression? Solution: Students may create several different expressions depending upon how they group the quantities in the problem. Possible student responses are: Response 1: To find the total wage, first multiply the number of hours Jamie worked by 9. Then, multiply the number of hours Ted worked by 9. Add these two values with the $27 overtime to find the total wages for the week. The student would write the expression 9J + 9T + 27. Response 2: To find the total wages, add the number of hours that Ted and Jamie worked. Then, multiply the total number of hours worked by 9. Add the overtime to that value to get the total wages for the week. The student would write the expression 9(J + T) + 27. Response 3: To find the total wages, find out how much Jamie made and add that to how much Ted made for the week. To figure out Jamie’s wages, multiply the number of hours she worked by 9. To figure out Ted’s wages, multiply the number of hours he worked by 9 and then add the $27 he earned in overtime. My final step would be to add Jamie and Ted wages for the week to find their combined total wages. The student would write the expression (9J) + (9T + 27). Example 3: Given a square pool as shown in the picture, write four different expressions to find the total number of tiles in the border. Explain how each of the expressions relates to the diagram and demonstrate that the expressions are equivalent. Which expression is most useful? Explain.
7th Grade Mathematics Unpacked Content Page 21
Expressions and Equations 7.EE Common Core Cluster Solve real-life and mathematical problems using numerical and algebraic expressions and equations. Mathematically proficient students communicate precisely by engaging in discussion about their reasoning using appropriate mathematical language. The terms students should learn to use with increasing precision with this cluster are: numeric expressions, algebraic expressions, maximum, minimum
Common Core Standard Unpacking What does this standard mean that a student will know and be able to do?
7.EE.3 Solve multi-step real-life and mathematical problems posed with positive and negative rational numbers in any form (whole numbers, fractions, and decimals), using tools strategically. Apply properties of operations to calculate with numbers in any form; convert between forms as appropriate; and assess the reasonableness of answers using mental computation and estimation strategies. For example: If a woman making $25 an hour gets a 10% raise, she will make an additional 1/10 of her salary an hour, or $2.50, for a new salary of $27.50. If you want to place a towel bar 9 3/4 inches long in the center of a door that is 27 1/2 inches wide, you will need to place the bar about 9 inches from each edge; this estimate can be used as a check on the exact computation.
7.EE.3 Students solve contextual problems and mathematical problems using rational numbers. Students convert between fractions, decimals, and percents as needed to solve the problem. Students use estimation to justify the reasonableness of answers. Example 1: Three students conduct the same survey about the number of hours people sleep at night. The results of the number of people who sleep 8 hours a nights are shown below. In which person’s survey did the most people sleep 8 hours?
• Susan reported that 18 of the 48 people she surveyed get 8 hours sleep a night • Kenneth reported that 36% of the people he surveyed get 8 hours sleep a night • Jamal reported that 0.365 of the people he surveyed get 8 hours sleep a night
Solution: In Susan’s survey, the number is 37.5%, which is the greatest percentage. Estimation strategies for calculations with fractions and decimals extend from students’ work with whole number operations. Estimation strategies include, but are not limited to:
• front-end estimation with adjusting (using the highest place value and estimating from the front end making adjustments to the estimate by taking into account the remaining amounts),
• clustering around an average (when the values are close together an average value is selected and multiplied by the number of values to determine an estimate),
• rounding and adjusting (students round down or round up and then adjust their estimate depending on how much the rounding affected the original values),
• using friendly or compatible numbers such as factors (students seek to fit numbers together - i.e., rounding to factors and grouping numbers together that have round sums like 100 or 1000), and
• using benchmark numbers that are easy to compute (students select close whole numbers for fractions or decimals to determine an estimate).
7th Grade Mathematics Unpacked Content Page 22
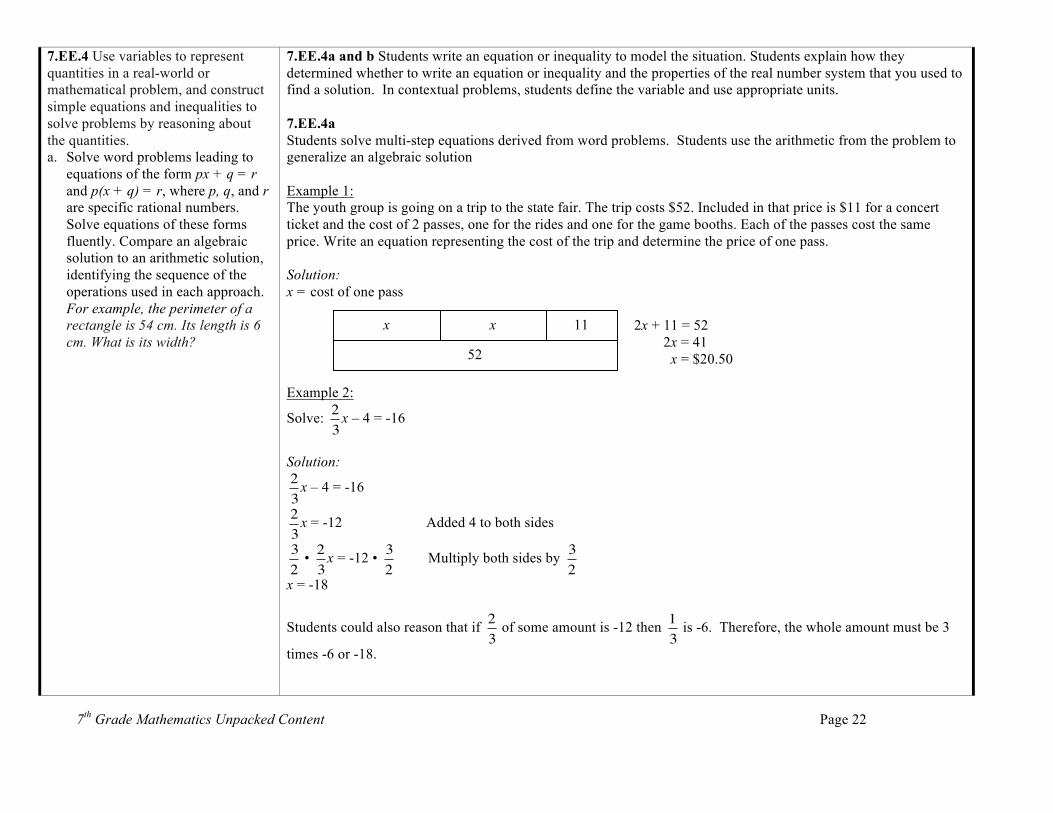
7.EE.4 Use variables to represent quantities in a real-world or mathematical problem, and construct simple equations and inequalities to solve problems by reasoning about the quantities. a. Solve word problems leading to
equations of the form px + q = r and p(x + q) = r, where p, q, and r are specific rational numbers. Solve equations of these forms fluently. Compare an algebraic solution to an arithmetic solution, identifying the sequence of the operations used in each approach. For example, the perimeter of a rectangle is 54 cm. Its length is 6 cm. What is its width?
7.EE.4a and b Students write an equation or inequality to model the situation. Students explain how they determined whether to write an equation or inequality and the properties of the real number system that you used to find a solution. In contextual problems, students define the variable and use appropriate units. 7.EE.4a Students solve multi-step equations derived from word problems. Students use the arithmetic from the problem to generalize an algebraic solution Example 1: The youth group is going on a trip to the state fair. The trip costs $52. Included in that price is $11 for a concert ticket and the cost of 2 passes, one for the rides and one for the game booths. Each of the passes cost the same price. Write an equation representing the cost of the trip and determine the price of one pass. Solution: x = cost of one pass 2x + 11 = 52 2x = 41 x = $20.50 Example 2:
Solve: x – 4 = -16
Solution:
x – 4 = -16
x = -12 Added 4 to both sides
• x = -12 • Multiply both sides by
x = -18
Students could also reason that if of some amount is -12 then is -6. Therefore, the whole amount must be 3
times -6 or -18.
€
23
€
23
€
23
€
32
€
23
€
32
€
32
€
23
€
13
x x 11
52
7th Grade Mathematics Unpacked Content Page 23
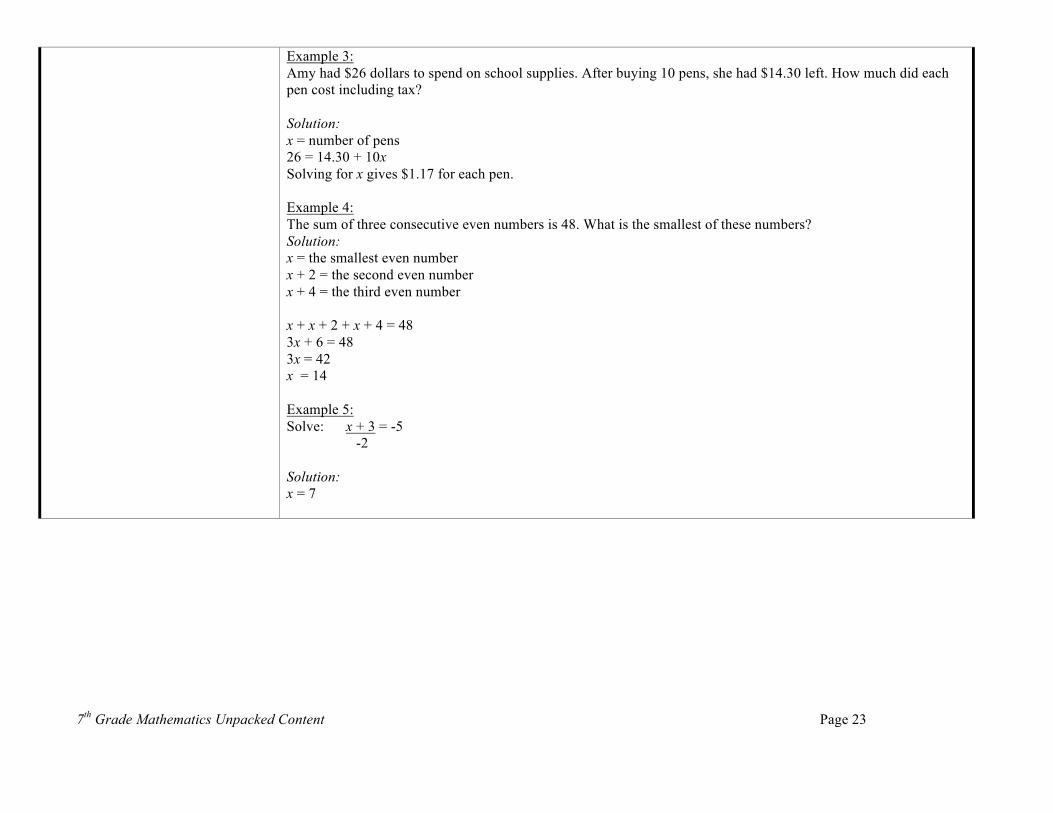
Example 3: Amy had $26 dollars to spend on school supplies. After buying 10 pens, she had $14.30 left. How much did each pen cost including tax? Solution: x = number of pens 26 = 14.30 + 10x Solving for x gives $1.17 for each pen. Example 4: The sum of three consecutive even numbers is 48. What is the smallest of these numbers? Solution: x = the smallest even number x + 2 = the second even number x + 4 = the third even number x + x + 2 + x + 4 = 48 3x + 6 = 48 3x = 42 x = 14 Example 5: Solve: x + 3 = -5 -2 Solution: x = 7
7th Grade Mathematics Unpacked Content Page 24
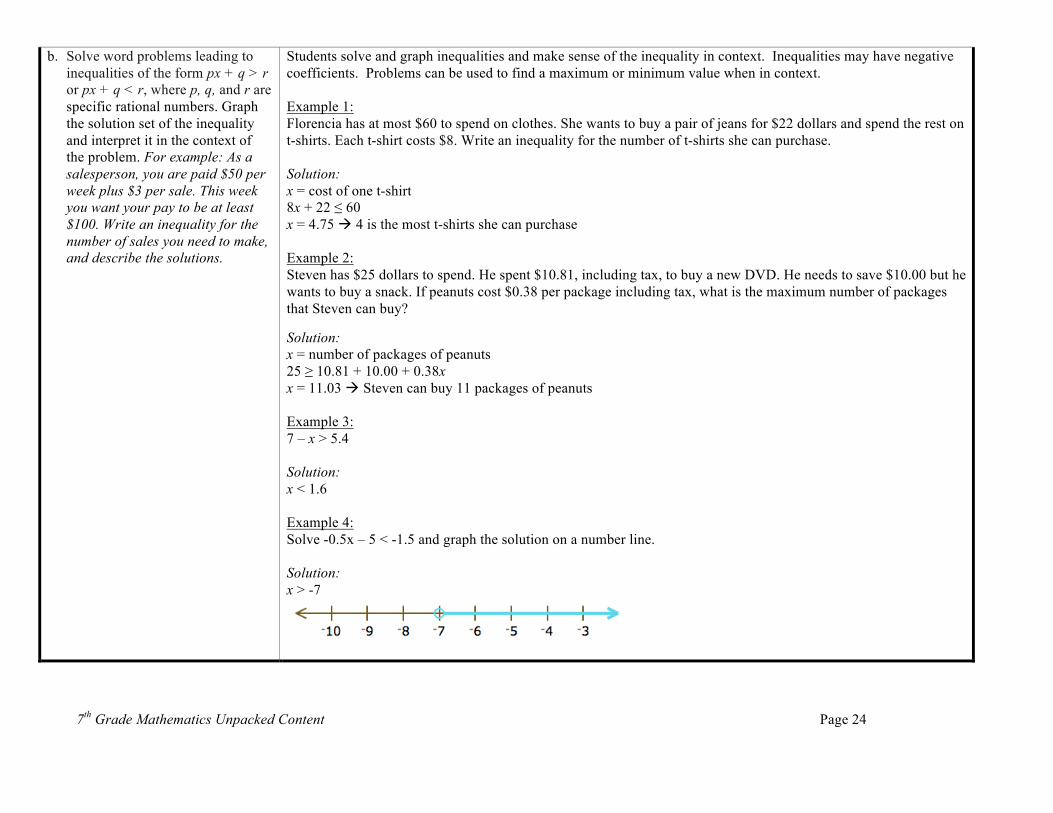
b. Solve word problems leading to inequalities of the form px + q > r or px + q < r, where p, q, and r are specific rational numbers. Graph the solution set of the inequality and interpret it in the context of the problem. For example: As a salesperson, you are paid $50 per week plus $3 per sale. This week you want your pay to be at least $100. Write an inequality for the number of sales you need to make, and describe the solutions.
Students solve and graph inequalities and make sense of the inequality in context. Inequalities may have negative coefficients. Problems can be used to find a maximum or minimum value when in context. Example 1: Florencia has at most $60 to spend on clothes. She wants to buy a pair of jeans for $22 dollars and spend the rest on t-shirts. Each t-shirt costs $8. Write an inequality for the number of t-shirts she can purchase. Solution: x = cost of one t-shirt 8x + 22 ≤ 60 x = 4.75 à 4 is the most t-shirts she can purchase Example 2: Steven has $25 dollars to spend. He spent $10.81, including tax, to buy a new DVD. He needs to save $10.00 but he wants to buy a snack. If peanuts cost $0.38 per package including tax, what is the maximum number of packages that Steven can buy? Solution: x = number of packages of peanuts 25 ≥ 10.81 + 10.00 + 0.38x x = 11.03 à Steven can buy 11 packages of peanuts Example 3: 7 – x > 5.4 Solution: x < 1.6 Example 4: Solve -0.5x – 5 < -1.5 and graph the solution on a number line. Solution: x > -7
7th Grade Mathematics Unpacked Content Page 25
Geometry 7.G Common Core Cluster Draw, construct, and describe geometrical figures and describe the relationships between them. Mathematically proficient students communicate precisely by engaging in discussion about their reasoning using appropriate mathematical language. The terms students should learn to use with increasing precision with this cluster are: scale drawing, dimensions, scale factor, plane sections, right rectangular prism, right rectangular pyramids, parallel, perpendicular, scalene triangle, obtuse triangle, equilateral triangle, right triangle
Common Core Standard Unpacking What does this standard mean that a student will know and be able to do?
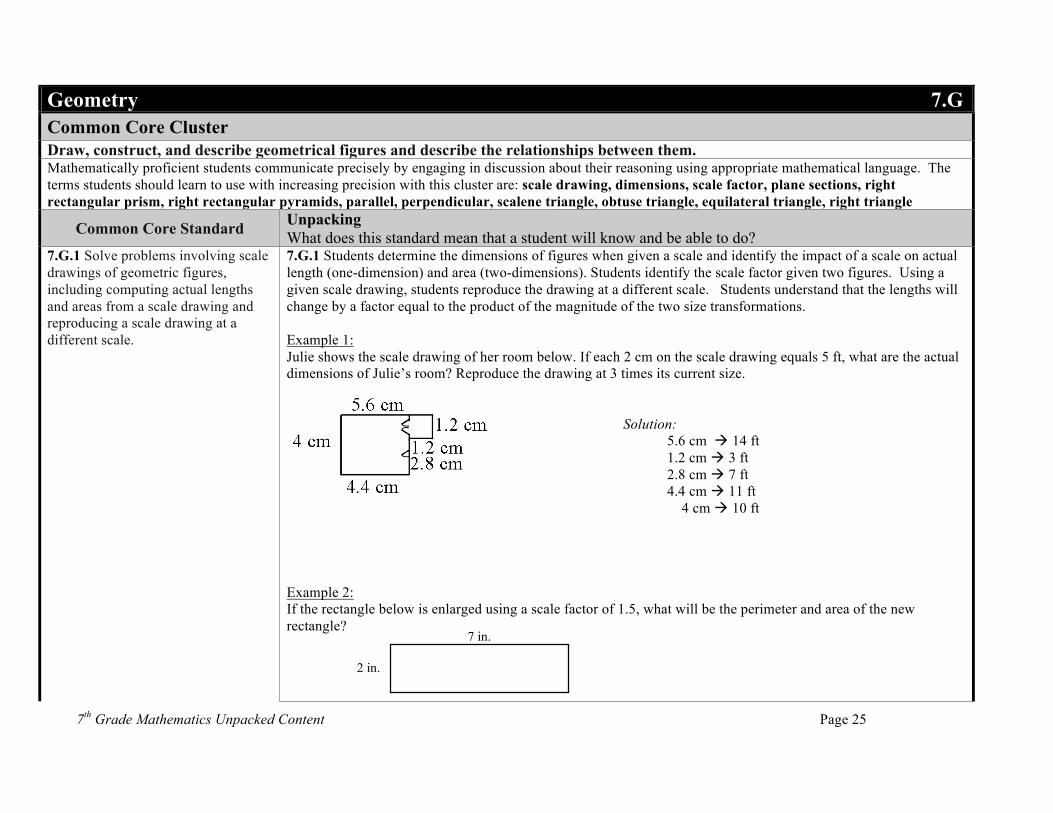
7.G.1 Solve problems involving scale drawings of geometric figures, including computing actual lengths and areas from a scale drawing and reproducing a scale drawing at a different scale.
7.G.1 Students determine the dimensions of figures when given a scale and identify the impact of a scale on actual length (one-dimension) and area (two-dimensions). Students identify the scale factor given two figures. Using a given scale drawing, students reproduce the drawing at a different scale. Students understand that the lengths will change by a factor equal to the product of the magnitude of the two size transformations. Example 1: Julie shows the scale drawing of her room below. If each 2 cm on the scale drawing equals 5 ft, what are the actual dimensions of Julie’s room? Reproduce the drawing at 3 times its current size.
Solution: 5.6 cm à 14 ft 1.2 cm à 3 ft 2.8 cm à 7 ft 4.4 cm à 11 ft
4 cm à 10 ft Example 2: If the rectangle below is enlarged using a scale factor of 1.5, what will be the perimeter and area of the new rectangle?
2 in.
7 in.
7th Grade Mathematics Unpacked Content Page 26
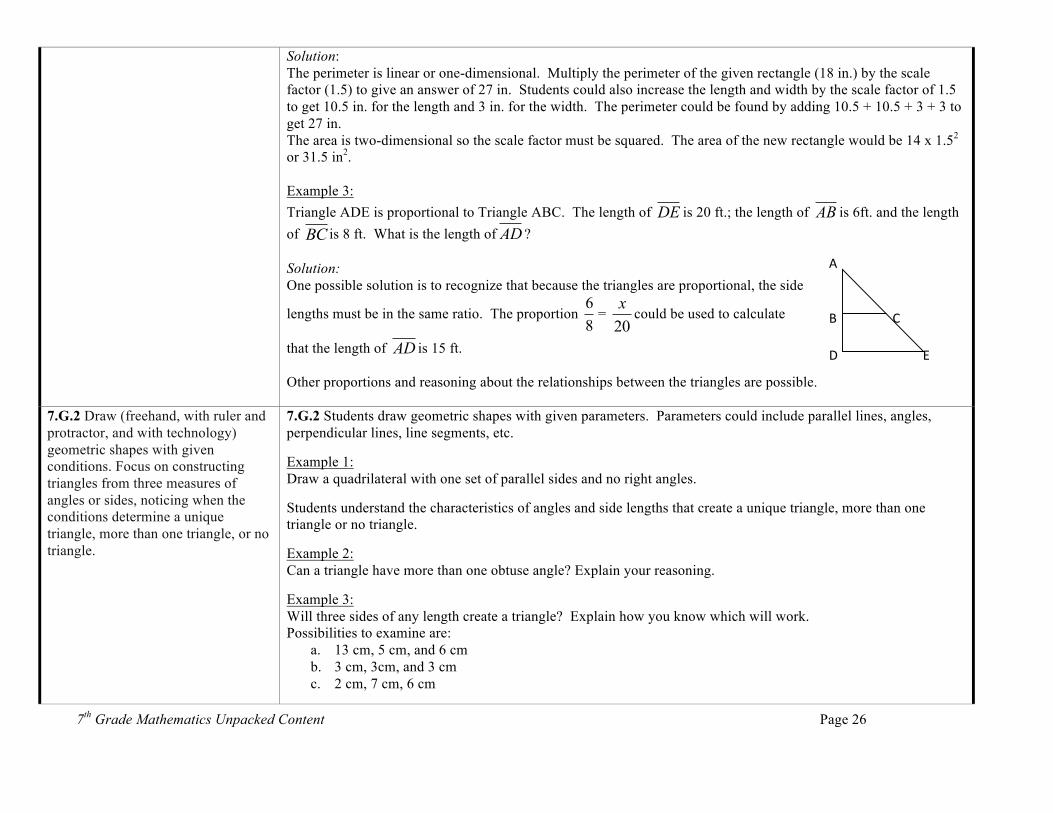
Solution: The perimeter is linear or one-dimensional. Multiply the perimeter of the given rectangle (18 in.) by the scale factor (1.5) to give an answer of 27 in. Students could also increase the length and width by the scale factor of 1.5 to get 10.5 in. for the length and 3 in. for the width. The perimeter could be found by adding 10.5 + 10.5 + 3 + 3 to get 27 in. The area is two-dimensional so the scale factor must be squared. The area of the new rectangle would be 14 x 1.52 or 31.5 in2. Example 3: Triangle ADE is proportional to Triangle ABC. The length of DE is 20 ft.; the length of AB is 6ft. and the length of BC is 8 ft. What is the length of AD ? Solution: One possible solution is to recognize that because the triangles are proportional, the side
lengths must be in the same ratio. The proportion 86
= 20x
could be used to calculate
that the length of AD is 15 ft. Other proportions and reasoning about the relationships between the triangles are possible.
7.G.2 Draw (freehand, with ruler and protractor, and with technology) geometric shapes with given conditions. Focus on constructing triangles from three measures of angles or sides, noticing when the conditions determine a unique triangle, more than one triangle, or no triangle.
7.G.2 Students draw geometric shapes with given parameters. Parameters could include parallel lines, angles, perpendicular lines, line segments, etc. Example 1: Draw a quadrilateral with one set of parallel sides and no right angles. Students understand the characteristics of angles and side lengths that create a unique triangle, more than one triangle or no triangle. Example 2: Can a triangle have more than one obtuse angle? Explain your reasoning. Example 3: Will three sides of any length create a triangle? Explain how you know which will work. Possibilities to examine are:
a. 13 cm, 5 cm, and 6 cm b. 3 cm, 3cm, and 3 cm c. 2 cm, 7 cm, 6 cm
E
C
A
B
D
7th Grade Mathematics Unpacked Content Page 27
Solution: “A” above will not work; “B” and “C” will work. Students recognize that the sum of the two smaller sides must be larger than the third side. Example 4: Is it possible to draw a triangle with a 90˚ angle and one leg that is 4 inches long and one leg that is 3 inches long? If so, draw one. Is there more than one such triangle? (NOTE: Pythagorean Theorem is NOT expected – this is an exploration activity only) Example 5: Draw a triangle with angles that are 60 degrees. Is this a unique triangle? Why or why not? Example 6: Draw an isosceles triangle with only one 80°angle. Is this the only possibility or can another triangle be drawn that will meet these conditions?
Through exploration, students recognize that the sum of the angles of any triangle will be 180° and the angles of any quadrilateral will sum to 360° Other explorations would include:
• Base angles of an isosceles triangle are equal • Angle and side length relationships between scalene, isosceles, and equilateral triangles • Angle and side length relationships between obtuse, acute and right triangles
7.G.3 Describe the two-dimensional figures that result from slicing three- dimensional figures, as in plane sections of right rectangular prisms and right rectangular pyramids.
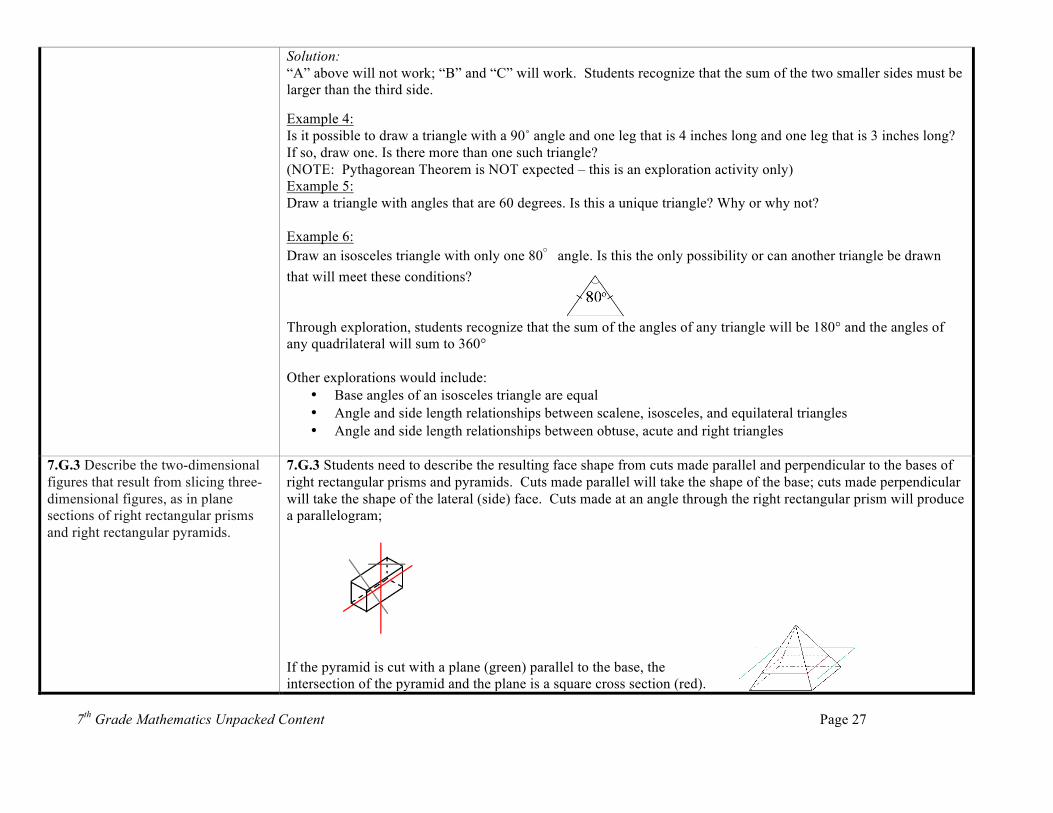
7.G.3 Students need to describe the resulting face shape from cuts made parallel and perpendicular to the bases of right rectangular prisms and pyramids. Cuts made parallel will take the shape of the base; cuts made perpendicular will take the shape of the lateral (side) face. Cuts made at an angle through the right rectangular prism will produce a parallelogram;
If the pyramid is cut with a plane (green) parallel to the base, the intersection of the pyramid and the plane is a square cross section (red).
7th Grade Mathematics Unpacked Content Page 28
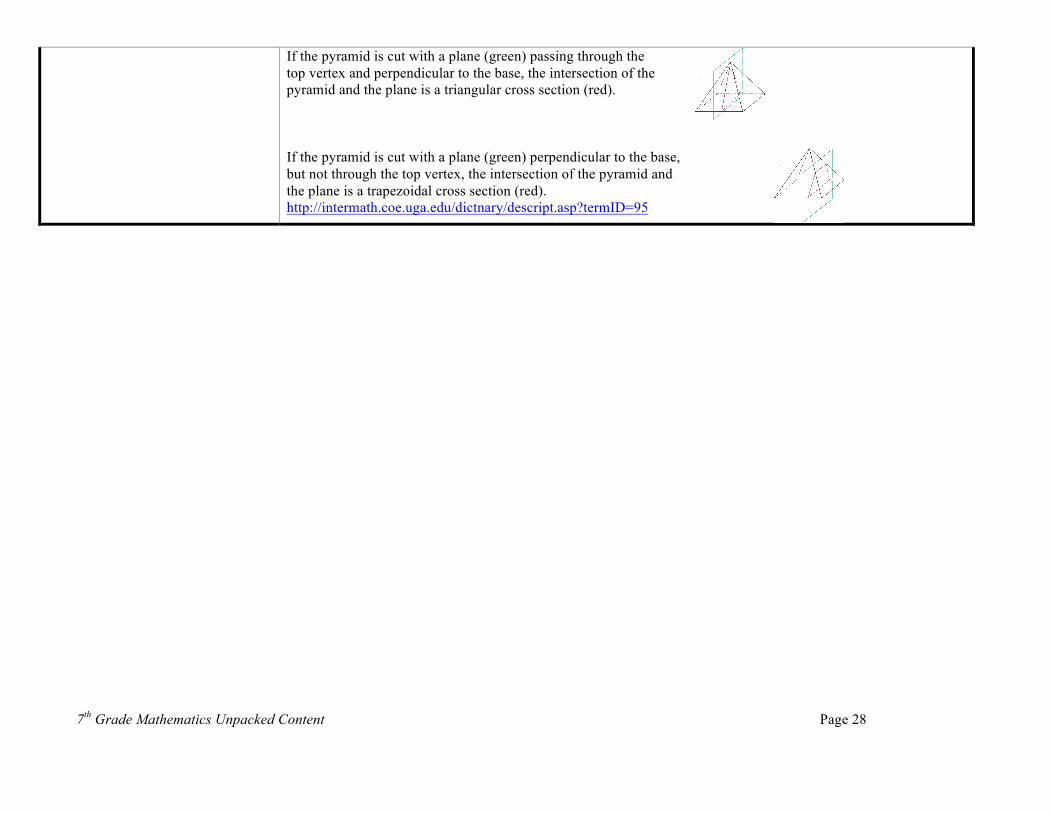
If the pyramid is cut with a plane (green) passing through the top vertex and perpendicular to the base, the intersection of the pyramid and the plane is a triangular cross section (red). If the pyramid is cut with a plane (green) perpendicular to the base, but not through the top vertex, the intersection of the pyramid and the plane is a trapezoidal cross section (red). http://intermath.coe.uga.edu/dictnary/descript.asp?termID=95
7th Grade Mathematics Unpacked Content Page 29
Geometry 7.G Common Core Cluster Solve real-life and mathematical problems involving angle measure, area, surface area, and volume. Mathematically proficient students communicate precisely by engaging in discussion about their reasoning using appropriate mathematical language. The terms students should learn to use with increasing precision with this cluster are: inscribed, circumference, radius, diameter, pi, ∏, supplementary, vertical, adjacent, complementary, pyramids, face, base
Common Core Standard Unpacking What does this standard mean that a student will know and be able to do?
7.G.4 Know the formulas for the area and circumference of a circle and use them to solve problems; give an informal derivation of the relationship between the circumference and area of a circle.
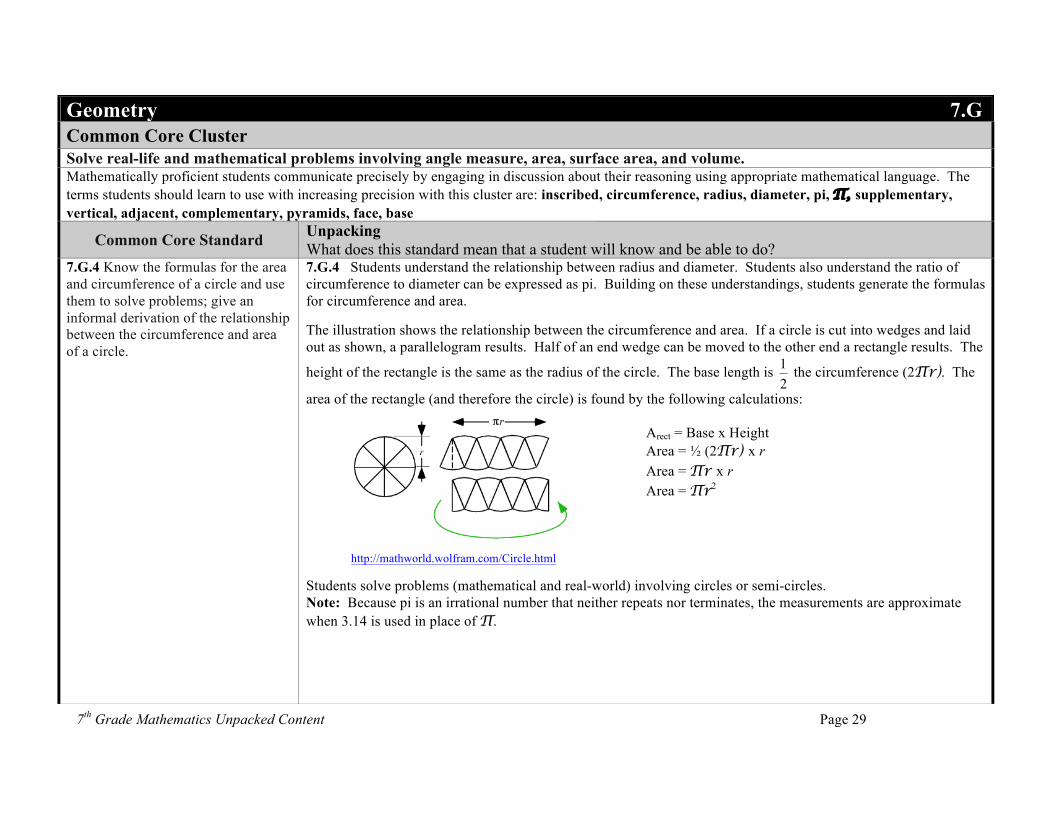
7.G.4 Students understand the relationship between radius and diameter. Students also understand the ratio of circumference to diameter can be expressed as pi. Building on these understandings, students generate the formulas for circumference and area. The illustration shows the relationship between the circumference and area. If a circle is cut into wedges and laid out as shown, a parallelogram results. Half of an end wedge can be moved to the other end a rectangle results. The
height of the rectangle is the same as the radius of the circle. The base length is the circumference (2∏r). The
area of the rectangle (and therefore the circle) is found by the following calculations: Arect = Base x Height
Area = ½ (2∏r) x r Area = ∏r x r Area = ∏r2
http://mathworld.wolfram.com/Circle.html Students solve problems (mathematical and real-world) involving circles or semi-circles. Note: Because pi is an irrational number that neither repeats nor terminates, the measurements are approximate when 3.14 is used in place of ∏.
€
12
7th Grade Mathematics Unpacked Content Page 30
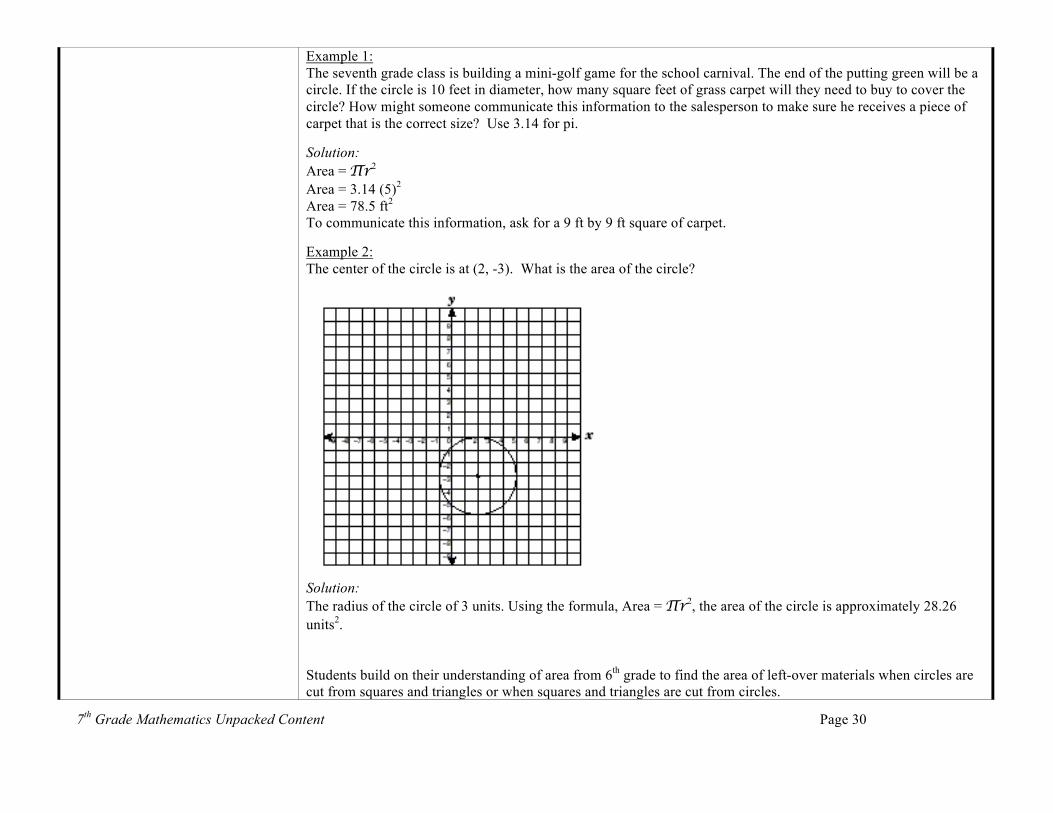
Example 1: The seventh grade class is building a mini-golf game for the school carnival. The end of the putting green will be a circle. If the circle is 10 feet in diameter, how many square feet of grass carpet will they need to buy to cover the circle? How might someone communicate this information to the salesperson to make sure he receives a piece of carpet that is the correct size? Use 3.14 for pi. Solution: Area = ∏r2 Area = 3.14 (5)2 Area = 78.5 ft2 To communicate this information, ask for a 9 ft by 9 ft square of carpet. Example 2: The center of the circle is at (2, -3). What is the area of the circle?
Solution: The radius of the circle of 3 units. Using the formula, Area = ∏r2, the area of the circle is approximately 28.26 units2. Students build on their understanding of area from 6th grade to find the area of left-over materials when circles are cut from squares and triangles or when squares and triangles are cut from circles.
7th Grade Mathematics Unpacked Content Page 31
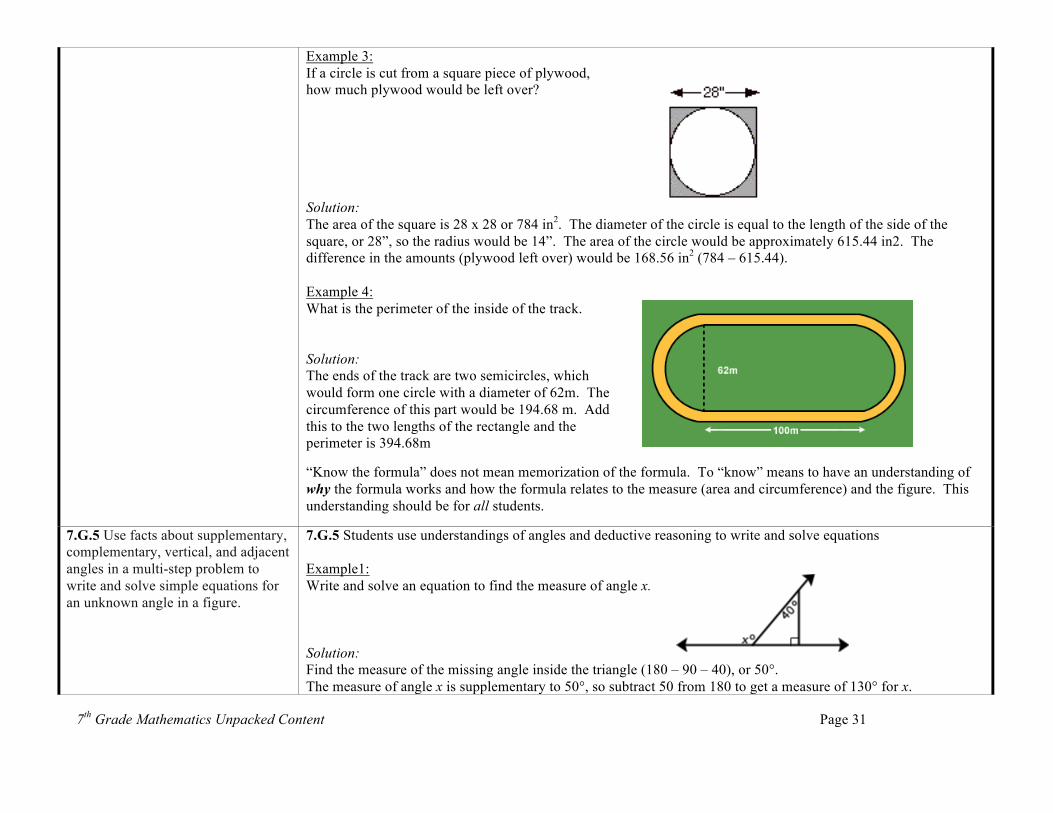
Example 3: If a circle is cut from a square piece of plywood, how much plywood would be left over? Solution: The area of the square is 28 x 28 or 784 in2. The diameter of the circle is equal to the length of the side of the square, or 28”, so the radius would be 14”. The area of the circle would be approximately 615.44 in2. The difference in the amounts (plywood left over) would be 168.56 in2 (784 – 615.44). Example 4: What is the perimeter of the inside of the track. Solution: The ends of the track are two semicircles, which would form one circle with a diameter of 62m. The circumference of this part would be 194.68 m. Add this to the two lengths of the rectangle and the perimeter is 394.68m “Know the formula” does not mean memorization of the formula. To “know” means to have an understanding of why the formula works and how the formula relates to the measure (area and circumference) and the figure. This understanding should be for all students.
7.G.5 Use facts about supplementary, complementary, vertical, and adjacent angles in a multi-step problem to write and solve simple equations for an unknown angle in a figure.
7.G.5 Students use understandings of angles and deductive reasoning to write and solve equations Example1: Write and solve an equation to find the measure of angle x.
Solution: Find the measure of the missing angle inside the triangle (180 – 90 – 40), or 50°. The measure of angle x is supplementary to 50°, so subtract 50 from 180 to get a measure of 130° for x.
7th Grade Mathematics Unpacked Content Page 32
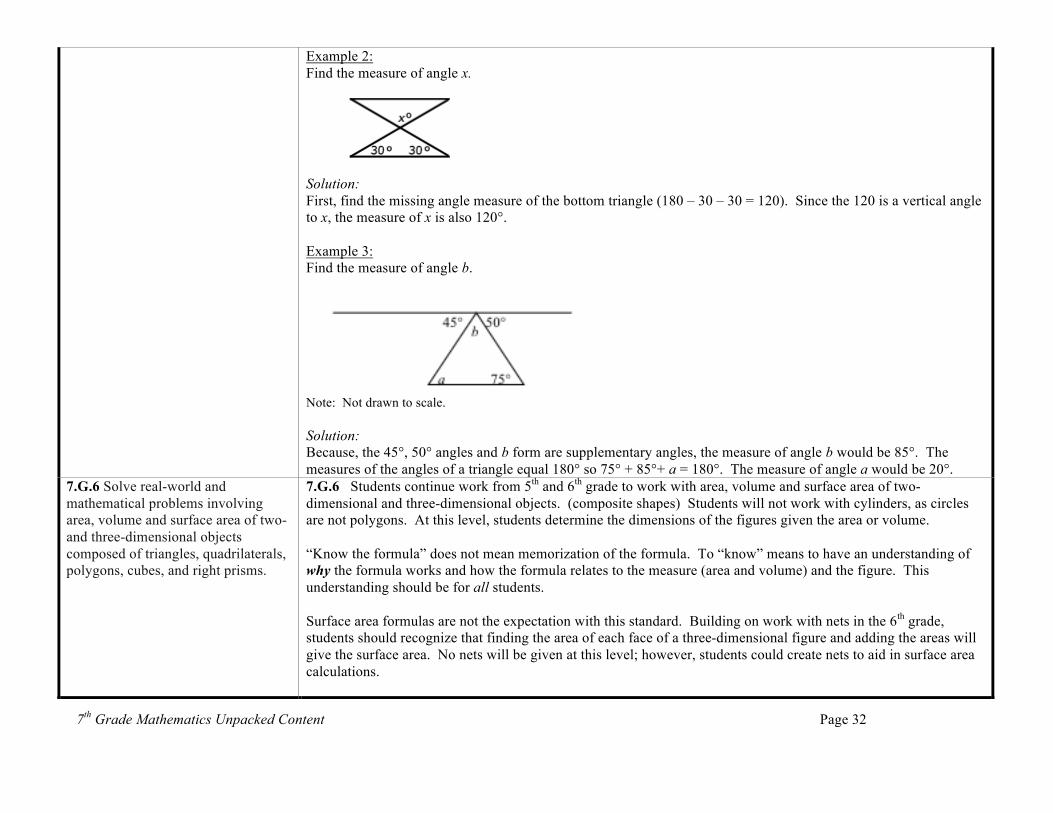
Example 2: Find the measure of angle x.
Solution: First, find the missing angle measure of the bottom triangle (180 – 30 – 30 = 120). Since the 120 is a vertical angle to x, the measure of x is also 120°. Example 3: Find the measure of angle b.
Note: Not drawn to scale. Solution: Because, the 45°, 50° angles and b form are supplementary angles, the measure of angle b would be 85°. The measures of the angles of a triangle equal 180° so 75° + 85°+ a = 180°. The measure of angle a would be 20°.
7.G.6 Solve real-world and mathematical problems involving area, volume and surface area of two- and three-dimensional objects composed of triangles, quadrilaterals, polygons, cubes, and right prisms.
7.G.6 Students continue work from 5th and 6th grade to work with area, volume and surface area of two-dimensional and three-dimensional objects. (composite shapes) Students will not work with cylinders, as circles are not polygons. At this level, students determine the dimensions of the figures given the area or volume. “Know the formula” does not mean memorization of the formula. To “know” means to have an understanding of why the formula works and how the formula relates to the measure (area and volume) and the figure. This understanding should be for all students. Surface area formulas are not the expectation with this standard. Building on work with nets in the 6th grade, students should recognize that finding the area of each face of a three-dimensional figure and adding the areas will give the surface area. No nets will be given at this level; however, students could create nets to aid in surface area calculations.
7th Grade Mathematics Unpacked Content Page 33
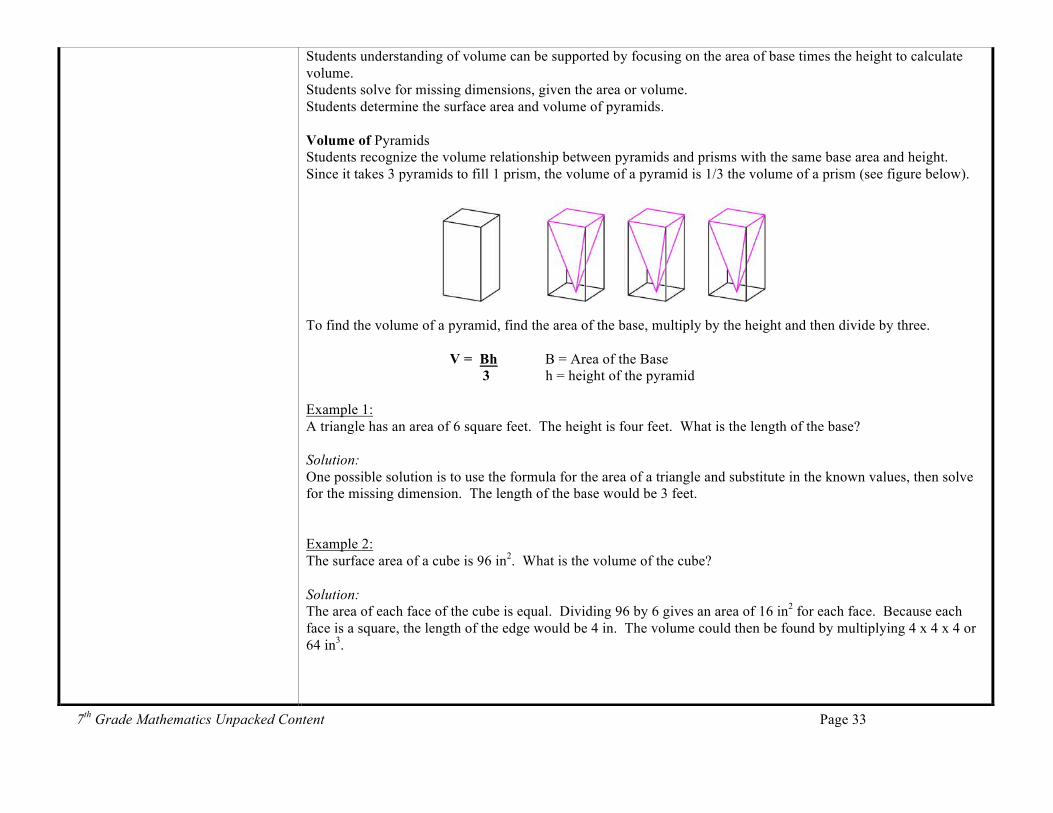
Students understanding of volume can be supported by focusing on the area of base times the height to calculate volume. Students solve for missing dimensions, given the area or volume. Students determine the surface area and volume of pyramids. Volume of Pyramids Students recognize the volume relationship between pyramids and prisms with the same base area and height. Since it takes 3 pyramids to fill 1 prism, the volume of a pyramid is 1/3 the volume of a prism (see figure below). To find the volume of a pyramid, find the area of the base, multiply by the height and then divide by three. V = Bh B = Area of the Base 3 h = height of the pyramid Example 1: A triangle has an area of 6 square feet. The height is four feet. What is the length of the base? Solution: One possible solution is to use the formula for the area of a triangle and substitute in the known values, then solve for the missing dimension. The length of the base would be 3 feet. Example 2: The surface area of a cube is 96 in2. What is the volume of the cube? Solution: The area of each face of the cube is equal. Dividing 96 by 6 gives an area of 16 in2 for each face. Because each face is a square, the length of the edge would be 4 in. The volume could then be found by multiplying 4 x 4 x 4 or 64 in3.
7th Grade Mathematics Unpacked Content Page 34
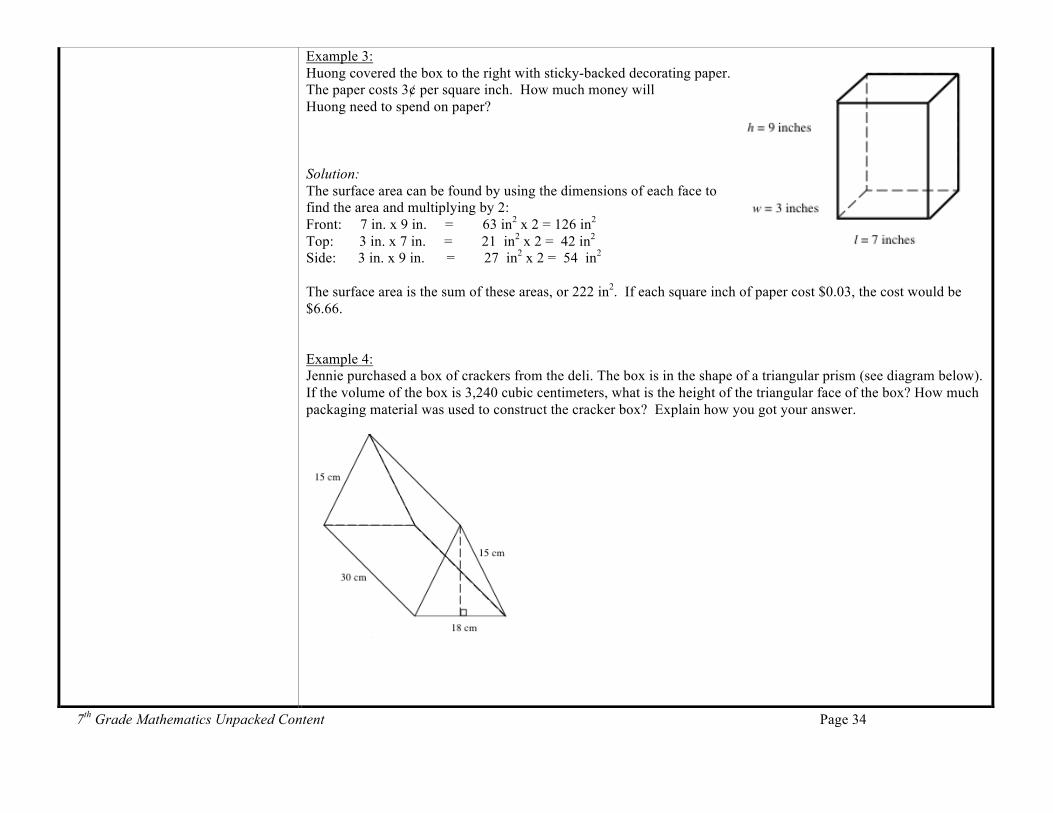
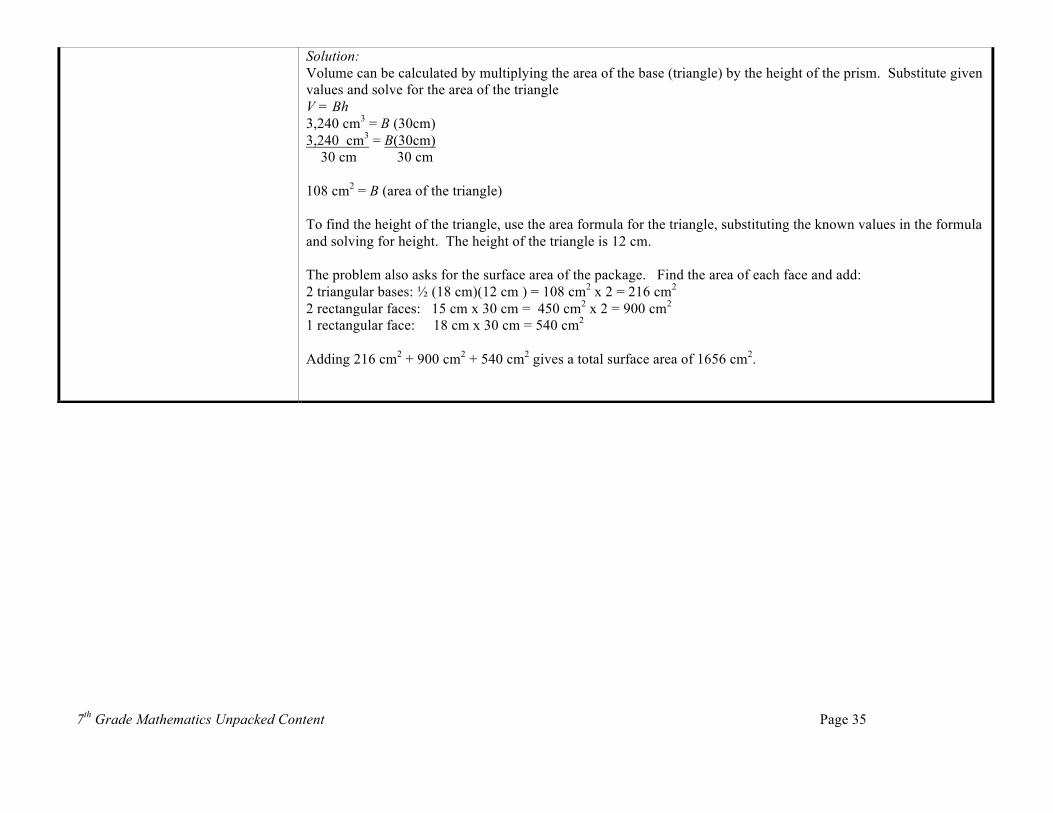
Example 3: Huong covered the box to the right with sticky-backed decorating paper. The paper costs 3¢ per square inch. How much money will Huong need to spend on paper? Solution: The surface area can be found by using the dimensions of each face to find the area and multiplying by 2: Front: 7 in. x 9 in. = 63 in2 x 2 = 126 in2 Top: 3 in. x 7 in. = 21 in2 x 2 = 42 in2 Side: 3 in. x 9 in. = 27 in2 x 2 = 54 in2 The surface area is the sum of these areas, or 222 in2. If each square inch of paper cost $0.03, the cost would be $6.66. Example 4: Jennie purchased a box of crackers from the deli. The box is in the shape of a triangular prism (see diagram below). If the volume of the box is 3,240 cubic centimeters, what is the height of the triangular face of the box? How much packaging material was used to construct the cracker box? Explain how you got your answer.
7th Grade Mathematics Unpacked Content Page 35
Solution: Volume can be calculated by multiplying the area of the base (triangle) by the height of the prism. Substitute given values and solve for the area of the triangle V = Bh 3,240 cm3 = B (30cm) 3,240 cm3 = B(30cm) 30 cm 30 cm 108 cm2 = B (area of the triangle) To find the height of the triangle, use the area formula for the triangle, substituting the known values in the formula and solving for height. The height of the triangle is 12 cm. The problem also asks for the surface area of the package. Find the area of each face and add: 2 triangular bases: ½ (18 cm)(12 cm ) = 108 cm2 x 2 = 216 cm2 2 rectangular faces: 15 cm x 30 cm = 450 cm2 x 2 = 900 cm2
1 rectangular face: 18 cm x 30 cm = 540 cm2 Adding 216 cm2 + 900 cm2 + 540 cm2 gives a total surface area of 1656 cm2.
7th Grade Mathematics Unpacked Content Page 36
Statistics and Probability 7.SP Common Core Cluster Use random sampling to draw inferences about a population. Mathematically proficient students communicate precisely by engaging in discussion about their reasoning using appropriate mathematical language. The terms students should learn to use with increasing precision with this cluster are: random sampling, population, representative sample, inferences
Common Core Standard Unpacking What does this standard mean that a student will know and be able to do?
7.SP.1 Understand that statistics can be used to gain information about a population by examining a sample of the population; generalizations about a population from a sample are valid only if the sample is representative of that population. Understand that random sampling tends to produce representative samples and support valid inferences.
7.SP.1 Students recognize that it is difficult to gather statistics on an entire population. Instead a random sample can be representative of the total population and will generate valid predictions. Students use this information to draw inferences from data. A random sample must be used in conjunction with the population to get accuracy. For example, a random sample of elementary students cannot be used to give a survey about the prom. Example 1: The school food service wants to increase the number of students who eat hot lunch in the cafeteria. The student council has been asked to conduct a survey of the student body to determine the students’ preferences for hot lunch. They have determined two ways to do the survey. The two methods are listed below. Determine if each survey option would produce a random sample. Which survey option should the student council use and why?
1. Write all of the students’ names on cards and pull them out in a draw to determine who will complete
the survey. 2. Survey the first 20 students that enter the lunchroom. 3. Survey every 3rd student who gets off a bus.
7.SP.2 Use data from a random sample to draw inferences about a population with an unknown characteristic of interest. Generate multiple samples (or simulated samples) of the same size to gauge the variation in estimates or predictions. For example, estimate the mean word length in a book by randomly sampling words from the book; predict the winner of a school election based on randomly sampled survey data. Gauge how far off the estimate or prediction might be.
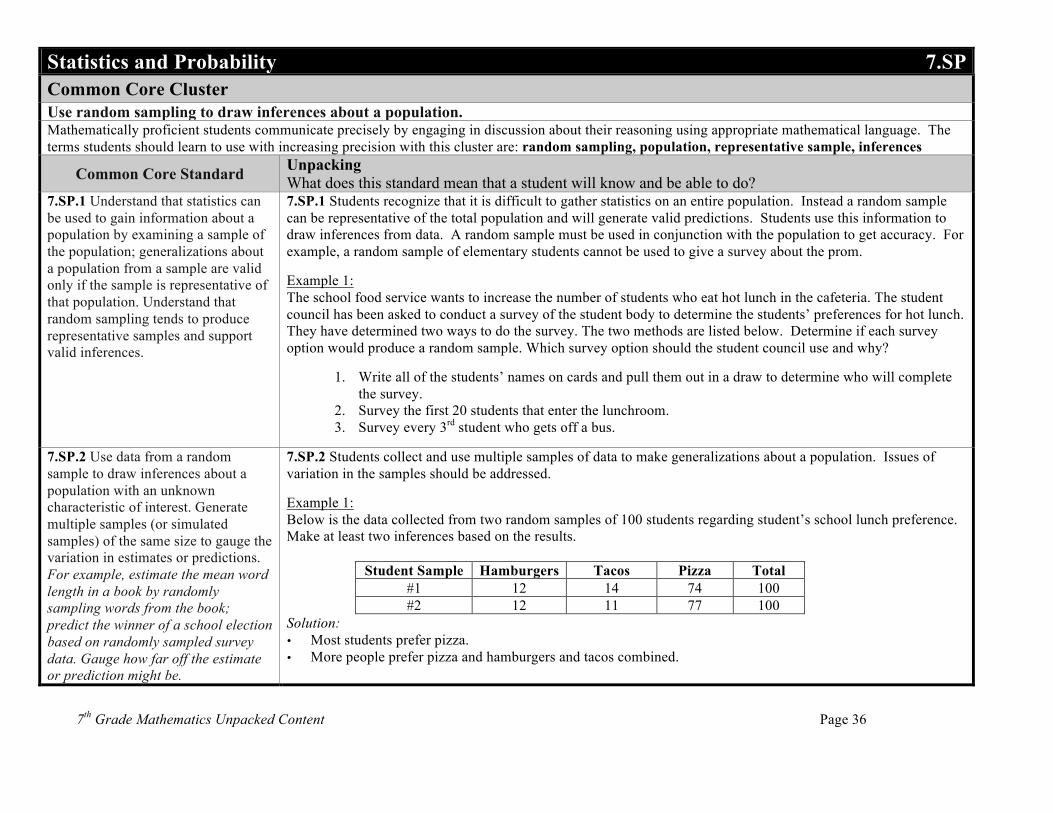
7.SP.2 Students collect and use multiple samples of data to make generalizations about a population. Issues of variation in the samples should be addressed. Example 1: Below is the data collected from two random samples of 100 students regarding student’s school lunch preference. Make at least two inferences based on the results.
Student Sample Hamburgers Tacos Pizza Total #1 12 14 74 100 #2 12 11 77 100
Solution: • Most students prefer pizza. • More people prefer pizza and hamburgers and tacos combined.
7th Grade Mathematics Unpacked Content Page 37
Statistics and Probability 7.SP Common Core Cluster Draw informal comparative inferences about two populations. Mathematically proficient students communicate precisely by engaging in discussion about their reasoning using appropriate mathematical language. The terms students should learn to use with increasing precision with this cluster are: variation/variability, distribution, measures of center, measures of variability
Common Core Standard Unpacking What does this standard mean that a student will know and be able to do?
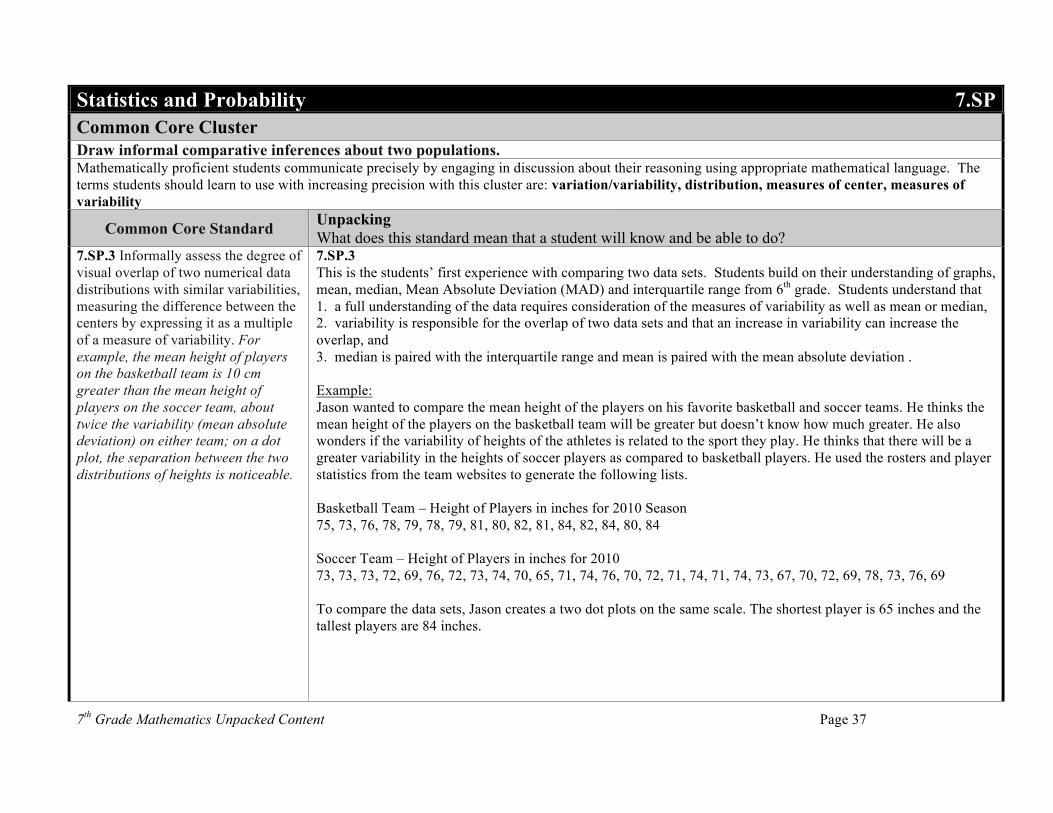
7.SP.3 Informally assess the degree of visual overlap of two numerical data distributions with similar variabilities, measuring the difference between the centers by expressing it as a multiple of a measure of variability. For example, the mean height of players on the basketball team is 10 cm greater than the mean height of players on the soccer team, about twice the variability (mean absolute deviation) on either team; on a dot plot, the separation between the two distributions of heights is noticeable.
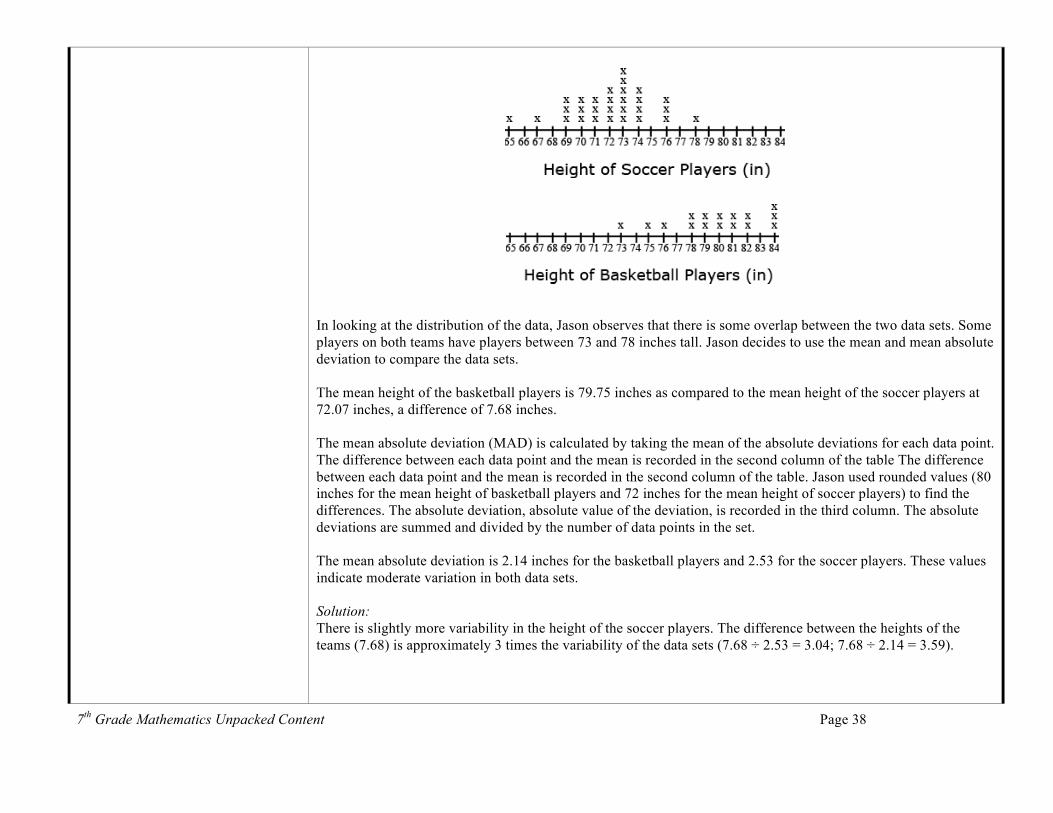
7.SP.3 This is the students’ first experience with comparing two data sets. Students build on their understanding of graphs, mean, median, Mean Absolute Deviation (MAD) and interquartile range from 6th grade. Students understand that 1. a full understanding of the data requires consideration of the measures of variability as well as mean or median, 2. variability is responsible for the overlap of two data sets and that an increase in variability can increase the overlap, and 3. median is paired with the interquartile range and mean is paired with the mean absolute deviation . Example: Jason wanted to compare the mean height of the players on his favorite basketball and soccer teams. He thinks the mean height of the players on the basketball team will be greater but doesn’t know how much greater. He also wonders if the variability of heights of the athletes is related to the sport they play. He thinks that there will be a greater variability in the heights of soccer players as compared to basketball players. He used the rosters and player statistics from the team websites to generate the following lists. Basketball Team – Height of Players in inches for 2010 Season 75, 73, 76, 78, 79, 78, 79, 81, 80, 82, 81, 84, 82, 84, 80, 84 Soccer Team – Height of Players in inches for 2010 73, 73, 73, 72, 69, 76, 72, 73, 74, 70, 65, 71, 74, 76, 70, 72, 71, 74, 71, 74, 73, 67, 70, 72, 69, 78, 73, 76, 69 To compare the data sets, Jason creates a two dot plots on the same scale. The shortest player is 65 inches and the tallest players are 84 inches.
7th Grade Mathematics Unpacked Content Page 38
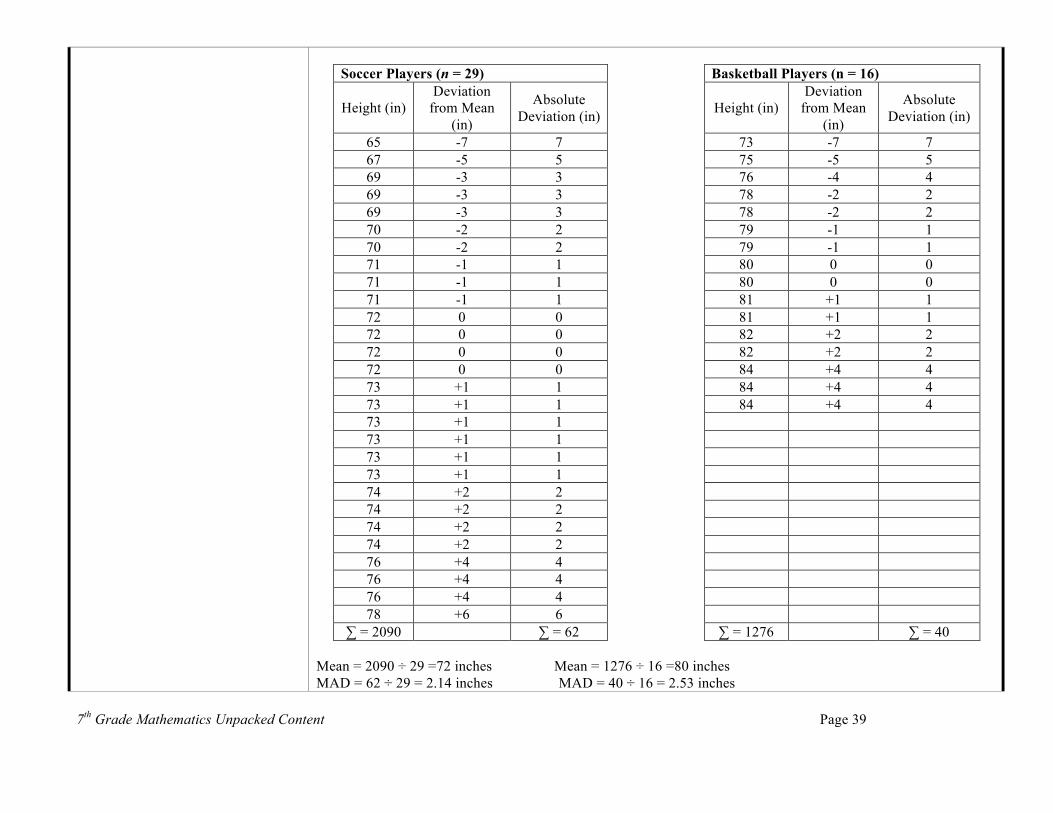
In looking at the distribution of the data, Jason observes that there is some overlap between the two data sets. Some players on both teams have players between 73 and 78 inches tall. Jason decides to use the mean and mean absolute deviation to compare the data sets. The mean height of the basketball players is 79.75 inches as compared to the mean height of the soccer players at 72.07 inches, a difference of 7.68 inches. The mean absolute deviation (MAD) is calculated by taking the mean of the absolute deviations for each data point. The difference between each data point and the mean is recorded in the second column of the table The difference between each data point and the mean is recorded in the second column of the table. Jason used rounded values (80 inches for the mean height of basketball players and 72 inches for the mean height of soccer players) to find the differences. The absolute deviation, absolute value of the deviation, is recorded in the third column. The absolute deviations are summed and divided by the number of data points in the set. The mean absolute deviation is 2.14 inches for the basketball players and 2.53 for the soccer players. These values indicate moderate variation in both data sets. Solution: There is slightly more variability in the height of the soccer players. The difference between the heights of the teams (7.68) is approximately 3 times the variability of the data sets (7.68 ÷ 2.53 = 3.04; 7.68 ÷ 2.14 = 3.59).
7th Grade Mathematics Unpacked Content Page 39
Soccer Players (n = 29) Basketball Players (n = 16)
Height (in) Deviation
from Mean (in)
Absolute Deviation (in)
Height (in)
Deviation from Mean
(in)
Absolute Deviation (in)
65 -7 7 73 -7 7 67 -5 5 75 -5 5 69 -3 3 76 -4 4 69 -3 3 78 -2 2 69 -3 3 78 -2 2 70 -2 2 79 -1 1 70 -2 2 79 -1 1 71 -1 1 80 0 0 71 -1 1 80 0 0 71 -1 1 81 +1 1 72 0 0 81 +1 1 72 0 0 82 +2 2 72 0 0 82 +2 2 72 0 0 84 +4 4 73 +1 1 84 +4 4 73 +1 1 84 +4 4 73 +1 1 73 +1 1 73 +1 1 73 +1 1 74 +2 2 74 +2 2 74 +2 2 74 +2 2 76 +4 4 76 +4 4 76 +4 4 78 +6 6
∑ = 2090 ∑ = 62 ∑ = 1276 ∑ = 40 Mean = 2090 ÷ 29 =72 inches Mean = 1276 ÷ 16 =80 inches MAD = 62 ÷ 29 = 2.14 inches MAD = 40 ÷ 16 = 2.53 inches
7th Grade Mathematics Unpacked Content Page 40
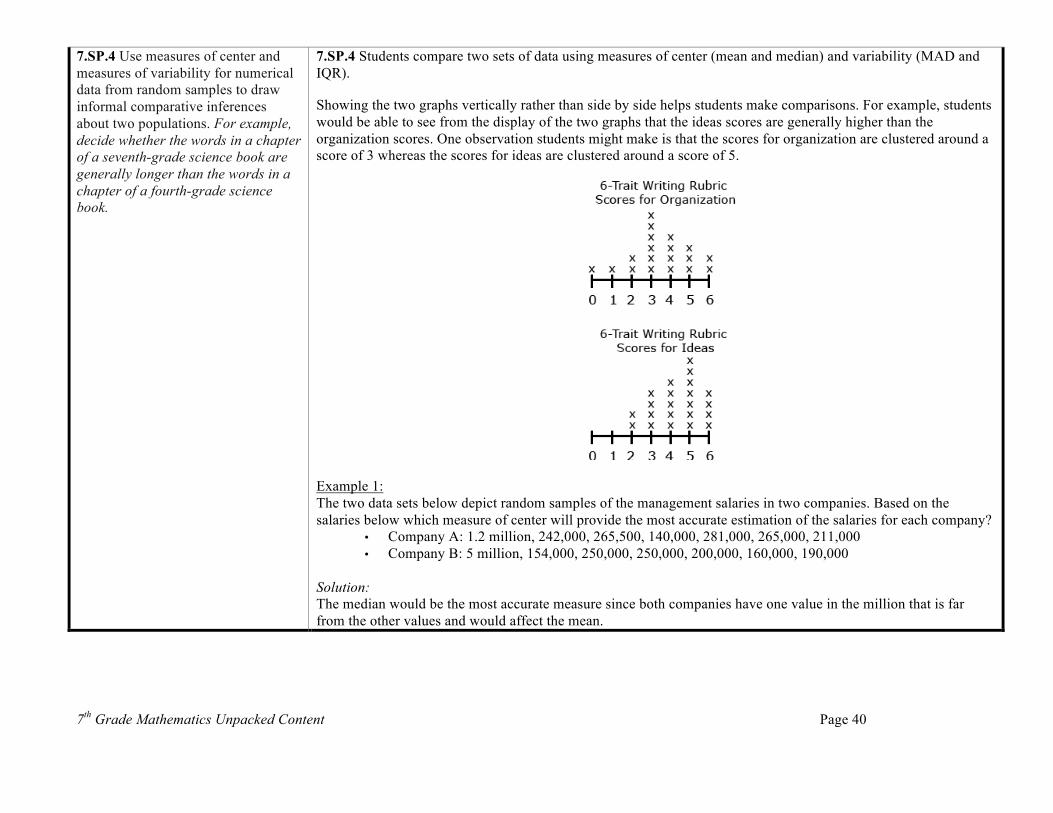
7.SP.4 Use measures of center and measures of variability for numerical data from random samples to draw informal comparative inferences about two populations. For example, decide whether the words in a chapter of a seventh-grade science book are generally longer than the words in a chapter of a fourth-grade science book.
7.SP.4 Students compare two sets of data using measures of center (mean and median) and variability (MAD and IQR). Showing the two graphs vertically rather than side by side helps students make comparisons. For example, students would be able to see from the display of the two graphs that the ideas scores are generally higher than the organization scores. One observation students might make is that the scores for organization are clustered around a score of 3 whereas the scores for ideas are clustered around a score of 5.
Example 1: The two data sets below depict random samples of the management salaries in two companies. Based on the salaries below which measure of center will provide the most accurate estimation of the salaries for each company?
• Company A: 1.2 million, 242,000, 265,500, 140,000, 281,000, 265,000, 211,000 • Company B: 5 million, 154,000, 250,000, 250,000, 200,000, 160,000, 190,000
Solution: The median would be the most accurate measure since both companies have one value in the million that is far from the other values and would affect the mean.
7th Grade Mathematics Unpacked Content Page 41
Statistics and Probability 7.SP Common Core Cluster Investigate chance processes and develop, use, and evaluate probability models. Mathematically proficient students communicate precisely by engaging in discussion about their reasoning using appropriate mathematical language. The terms students should learn to use with increasing precision with this cluster are: sample spaces See list from essential standards work.
Common Core Standard Unpacking What does this standard mean that a student will know and be able to do?
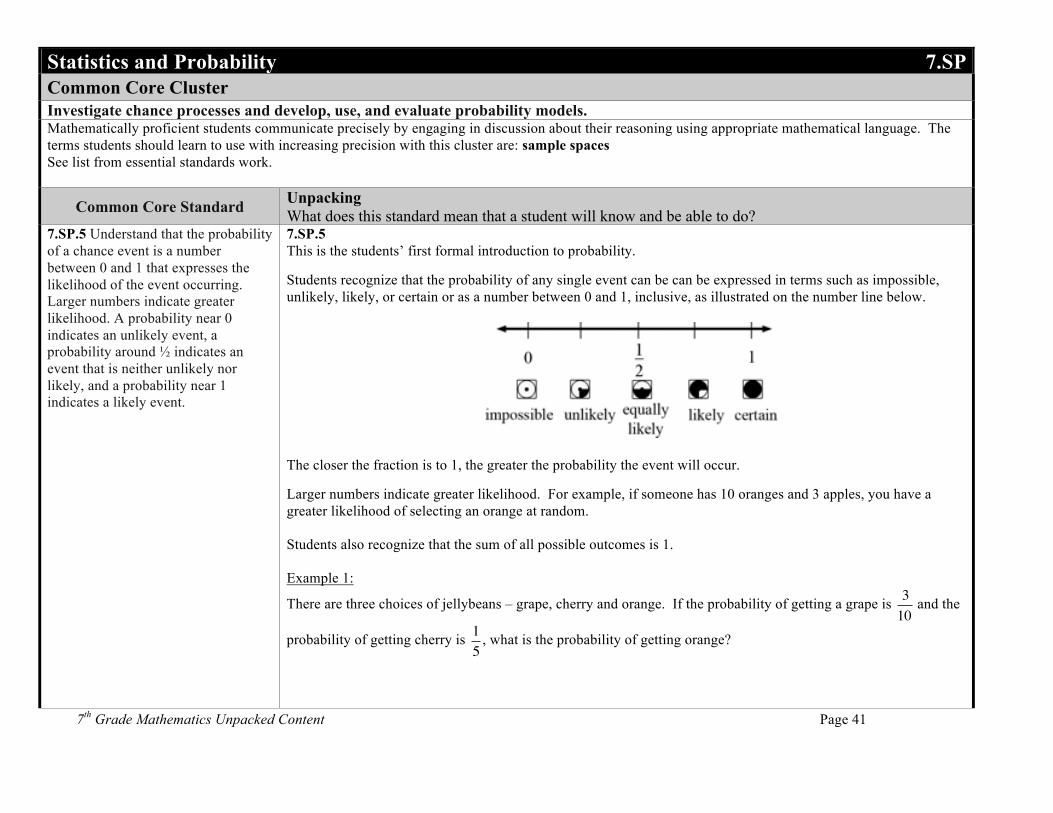
7.SP.5 Understand that the probability of a chance event is a number between 0 and 1 that expresses the likelihood of the event occurring. Larger numbers indicate greater likelihood. A probability near 0 indicates an unlikely event, a probability around ½ indicates an event that is neither unlikely nor likely, and a probability near 1 indicates a likely event.
7.SP.5 This is the students’ first formal introduction to probability. Students recognize that the probability of any single event can be can be expressed in terms such as impossible, unlikely, likely, or certain or as a number between 0 and 1, inclusive, as illustrated on the number line below. The closer the fraction is to 1, the greater the probability the event will occur. Larger numbers indicate greater likelihood. For example, if someone has 10 oranges and 3 apples, you have a greater likelihood of selecting an orange at random. Students also recognize that the sum of all possible outcomes is 1. Example 1:
There are three choices of jellybeans – grape, cherry and orange. If the probability of getting a grape is
€
310
and the
probability of getting cherry is
€
15
, what is the probability of getting orange?
7th Grade Mathematics Unpacked Content Page 42
Solution:
The combined probabilities must equal 1. The combined probability of grape and cherry is
€
510
. The probability of
orange must equal
€
510
to get a total of 1.
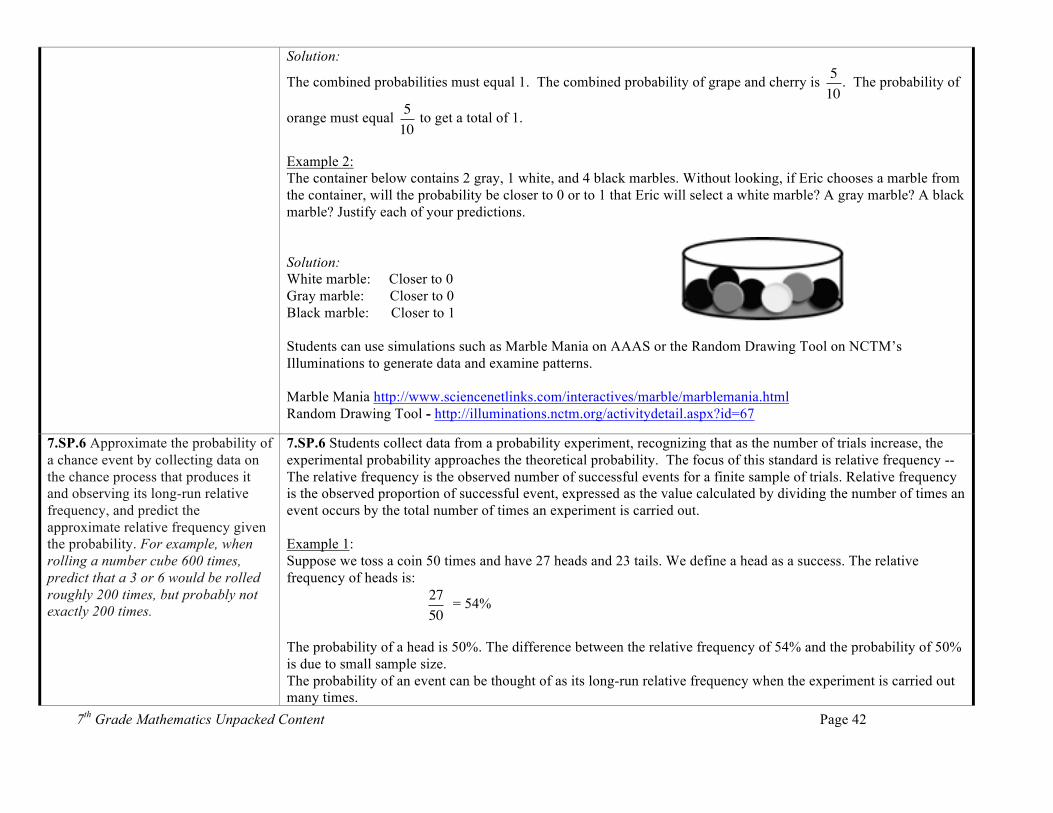
Example 2: The container below contains 2 gray, 1 white, and 4 black marbles. Without looking, if Eric chooses a marble from the container, will the probability be closer to 0 or to 1 that Eric will select a white marble? A gray marble? A black marble? Justify each of your predictions. Solution: White marble: Closer to 0 Gray marble: Closer to 0 Black marble: Closer to 1 Students can use simulations such as Marble Mania on AAAS or the Random Drawing Tool on NCTM’s Illuminations to generate data and examine patterns. Marble Mania http://www.sciencenetlinks.com/interactives/marble/marblemania.html Random Drawing Tool - http://illuminations.nctm.org/activitydetail.aspx?id=67
7.SP.6 Approximate the probability of a chance event by collecting data on the chance process that produces it and observing its long-run relative frequency, and predict the approximate relative frequency given the probability. For example, when rolling a number cube 600 times, predict that a 3 or 6 would be rolled roughly 200 times, but probably not exactly 200 times.
7.SP.6 Students collect data from a probability experiment, recognizing that as the number of trials increase, the experimental probability approaches the theoretical probability. The focus of this standard is relative frequency -- The relative frequency is the observed number of successful events for a finite sample of trials. Relative frequency is the observed proportion of successful event, expressed as the value calculated by dividing the number of times an event occurs by the total number of times an experiment is carried out. Example 1: Suppose we toss a coin 50 times and have 27 heads and 23 tails. We define a head as a success. The relative frequency of heads is:
€
2750
= 54%
The probability of a head is 50%. The difference between the relative frequency of 54% and the probability of 50% is due to small sample size. The probability of an event can be thought of as its long-run relative frequency when the experiment is carried out many times.
7th Grade Mathematics Unpacked Content Page 43
Students can collect data using physical objects or graphing calculator or web-based simulations. Students can perform experiments multiple times, pool data with other groups, or increase the number of trials in a simulation to look at the long-run relative frequencies. Example 2: Each group receives a bag that contains 4 green marbles, 6 red marbles, and 10 blue marbles. Each group performs 50 pulls, recording the color of marble drawn and replacing the marble into the bag before the next draw. Students compile their data as a group and then as a class. They summarize their data as experimental probabilities and make conjectures about theoretical probabilities (How many green draws would are expected if 1000 pulls are conducted? 10,000 pulls?). Students create another scenario with a different ratio of marbles in the bag and make a conjecture about the outcome of 50 marble pulls with replacement. (An example would be 3 green marbles, 6 blue marbles, 3 blue marbles.) Students try the experiment and compare their predictions to the experimental outcomes to continue to explore and refine conjectures about theoretical probability. Example 3: A bag contains 100 marbles, some red and some purple. Suppose a student, without looking, chooses a marble out of the bag, records the color, and then places that marble back in the bag. The student has recorded 9 red marbles and 11 purple marbles. Using these results, predict the number of red marbles in the bag. (Adapted from SREB publication Getting Students Ready for Algebra I: What Middle Grades Students Need to Know and Be Able to Do)
7.SP.7 Develop a probability model and use it to find probabilities of events. Compare probabilities from a model to observed frequencies; if the agreement is not good, explain possible sources of the discrepancy. a. Develop a uniform probability
model by assigning equal probability to all outcomes, and use the model to determine probabilities of events. For example, if a student is selected at random from a class, find the probability that Jane will be selected and the probability that a
7.SP.7 Probabilities are useful for predicting what will happen over the long run. Using theoretical probability, students predict frequencies of outcomes. Students recognize an appropriate design to conduct an experiment with simple probability events, understanding that the experimental data give realistic estimates of the probability of an event but are affected by sample size. Students need multiple opportunities to perform probability experiments and compare these results to theoretical probabilities. Critical components of the experiment process are making predictions about the outcomes by applying the principles of theoretical probability, comparing the predictions to the outcomes of the experiments, and replicating the experiment to compare results. Experiments can be replicated by the same group or by compiling class data. Experiments can be conducted using various random generation devices including, but not limited to, bag pulls, spinners, number cubes, coin toss, and colored chips. Students can collect data using physical objects or graphing calculator or web-based simulations. Students can also develop models for geometric probability (i.e. a target).
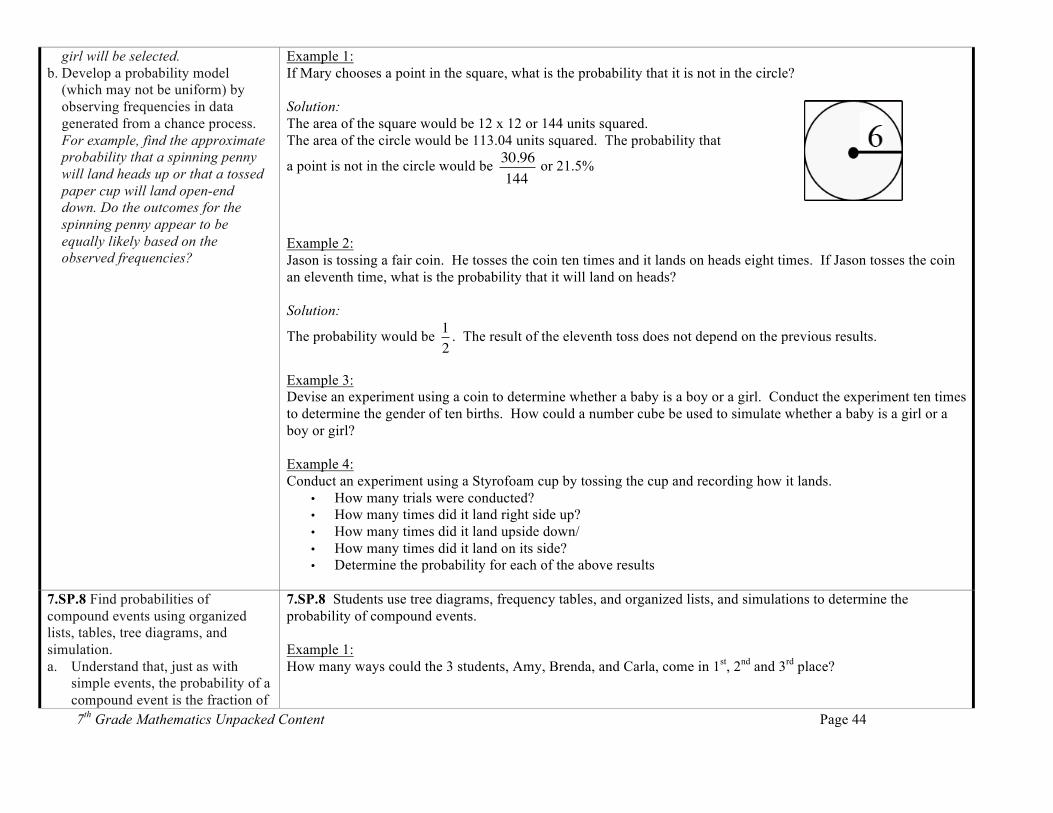
7th Grade Mathematics Unpacked Content Page 44
girl will be selected. b. Develop a probability model
(which may not be uniform) by observing frequencies in data generated from a chance process. For example, find the approximate probability that a spinning penny will land heads up or that a tossed paper cup will land open-end down. Do the outcomes for the spinning penny appear to be equally likely based on the observed frequencies?
Example 1: If Mary chooses a point in the square, what is the probability that it is not in the circle?
Solution: The area of the square would be 12 x 12 or 144 units squared. The area of the circle would be 113.04 units squared. The probability that
a point is not in the circle would be
€
30.96144
or 21.5%
Example 2: Jason is tossing a fair coin. He tosses the coin ten times and it lands on heads eight times. If Jason tosses the coin an eleventh time, what is the probability that it will land on heads? Solution:
The probability would be
€
12
. The result of the eleventh toss does not depend on the previous results.
Example 3: Devise an experiment using a coin to determine whether a baby is a boy or a girl. Conduct the experiment ten times to determine the gender of ten births. How could a number cube be used to simulate whether a baby is a girl or a boy or girl?
Example 4: Conduct an experiment using a Styrofoam cup by tossing the cup and recording how it lands.
• How many trials were conducted? • How many times did it land right side up? • How many times did it land upside down/ • How many times did it land on its side? • Determine the probability for each of the above results
7.SP.8 Find probabilities of compound events using organized lists, tables, tree diagrams, and simulation. a. Understand that, just as with
simple events, the probability of a compound event is the fraction of
7.SP.8 Students use tree diagrams, frequency tables, and organized lists, and simulations to determine the probability of compound events. Example 1: How many ways could the 3 students, Amy, Brenda, and Carla, come in 1st, 2nd and 3rd place?
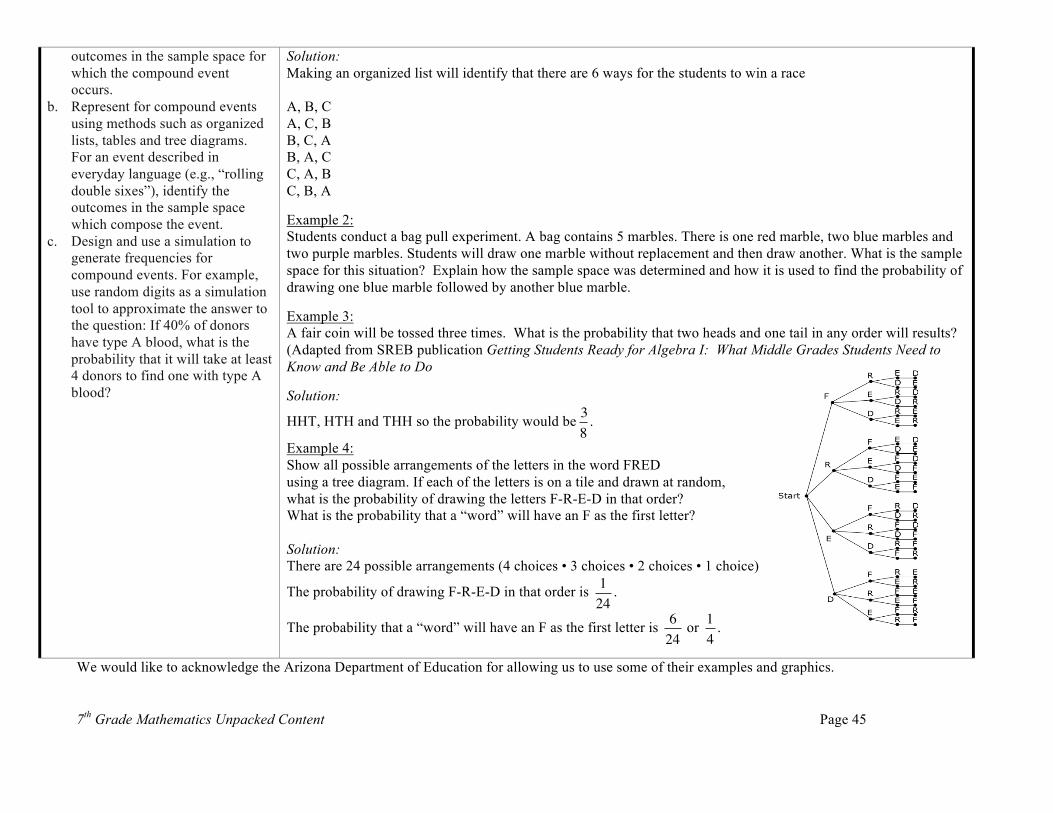
7th Grade Mathematics Unpacked Content Page 45
outcomes in the sample space for which the compound event occurs.
b. Represent for compound events using methods such as organized lists, tables and tree diagrams. For an event described in everyday language (e.g., “rolling double sixes”), identify the outcomes in the sample space which compose the event.
c. Design and use a simulation to generate frequencies for compound events. For example, use random digits as a simulation tool to approximate the answer to the question: If 40% of donors have type A blood, what is the probability that it will take at least 4 donors to find one with type A blood?
Solution: Making an organized list will identify that there are 6 ways for the students to win a race A, B, C A, C, B B, C, A B, A, C C, A, B C, B, A Example 2: Students conduct a bag pull experiment. A bag contains 5 marbles. There is one red marble, two blue marbles and two purple marbles. Students will draw one marble without replacement and then draw another. What is the sample space for this situation? Explain how the sample space was determined and how it is used to find the probability of drawing one blue marble followed by another blue marble. Example 3: A fair coin will be tossed three times. What is the probability that two heads and one tail in any order will results? (Adapted from SREB publication Getting Students Ready for Algebra I: What Middle Grades Students Need to Know and Be Able to Do Solution:
HHT, HTH and THH so the probability would be
€
38
.
Example 4: Show all possible arrangements of the letters in the word FRED using a tree diagram. If each of the letters is on a tile and drawn at random, what is the probability of drawing the letters F-R-E-D in that order? What is the probability that a “word” will have an F as the first letter? Solution: There are 24 possible arrangements (4 choices • 3 choices • 2 choices • 1 choice)
The probability of drawing F-R-E-D in that order is
€
124
.
The probability that a “word” will have an F as the first letter is
€
624
or
€
14
.
We would like to acknowledge the Arizona Department of Education for allowing us to use some of their examples and graphics.