7th Grade Common Core State Standards Flip...
69
1 7th Grade Common Core State Standards Flip Book This document is intended to show the connections to the Standards of Mathematical Practices and the content standards and to get detailed information at each level. Resources used: CCSS, Arizona DOE, Ohio DOE and North Carolina DOE. This “Flip Book” is intended to help teachers understand what each standard means in terms of what students must know and be able to do. It provides only a sample of instructional strategies and examples. The goal of every teacher should be to guide students in understanding & making sense of mathematics. Construction directions: Print on cardstock. Cut the tabs on each page starting with page 2. Cut the bottom off of this top cover to reveal the tabs for the subsequent pages. Staple or bind the top of all pages to complete your flip book. Compiled by Melisa Hancock (Send feedback to: [email protected])
Transcript of 7th Grade Common Core State Standards Flip...
1
7th Grade Common Core
State Standards
Flip Book
This document is intended to show the connections to the Standards of
Mathematical Practices and the content standards and to get detailed information at each level. Resources used: CCSS, Arizona DOE, Ohio DOE
and North Carolina DOE. This “Flip Book” is intended to help teachers
understand what each standard means in terms of what students must
know and be able to do. It provides only a sample of instructional strategies and examples. The goal of every teacher should be to guide
students in understanding & making sense of mathematics.
Construction directions:
Print on cardstock. Cut the tabs on each page starting with page 2. Cut the bottom off of this top cover to reveal the tabs for the subsequent pages. Staple or bind the
top of all pages to complete your flip book.
Compiled by Melisa Hancock (Send feedback to: [email protected])

2
1. Make sense of problems and persevere in solving them.
In grade 7, students solve problems involving ratios and rates and discuss how they solved them. Students solve real world problems through the application of algebraic and
geometric concepts. Students seek the meaning of a problem and look for efficient ways to
represent and solve it. They may check their thinking by asking themselves, “What is the
most efficient way to solve the problem?”, “Does this make sense?”, and “Can I solve the problem in a different way?”.
Reason abstractly and quantitatively.
2. In grade 7, students represent a wide variety of real world contexts through the use of real numbers and variables in mathematical expressions, equations, and inequalities. Students
contextualize to understand the meaning of the number or variable as related to the
problem and decontextualize to manipulate symbolic representations by applying properties of operations.
3. Construct viable arguments and critique the reasoning of others.
In grade 7, students construct arguments using verbal or written explanations accompanied
by expressions, equations, inequalities, models, and graphs, tables, and other data displays (i.e. box plots, dot plots, histograms, etc.). They further refine their mathematical
communication skills through mathematical discussions in which they critically evaluate
their own thinking and the thinking of other students. They pose questions like “How did you get that?”, “Why is that true?” “Does that always work?”. They explain their thinking to
others and respond to others’ thinking.
4. Model with mathematics. In grade 7, students model problem situations symbolically, graphically, tabularly, and
contextually. Students form expressions, equations, or inequalities from real world contexts
and connect symbolic and graphical representations. Students explore covariance and
represent two quantities simultaneously. They use measures of center and variability and data displays (i.e. box plots and histograms) to draw inferences, make comparisons and
formulate predictions. Students use experiments or simulations to generate data sets and
create probability models. Students need many opportunities to connect and explain the connections between the different representations. They should be able to use all of these
representations as appropriate to a problem context. 5. Use appropriate tools strategically.
Students consider available tools (including estimation and technology) when solving a
mathematical problem and decide when certain tools might be helpful. For instance,
students in grade 7 may decide to represent similar data sets using dot plots with the same
scale to visually compare the center and variability of the data. Students might use physical objects or applets to generate probability data and use graphing calculators or
spreadsheets to manage and represent data in different forms.
6. Attend to precision. In grade 7, students continue to refine their mathematical communication skills by using
clear and precise language in their discussions with others and in their own reasoning.
Students define variables, specify units of measure, and label axes accurately. Students
use appropriate terminology when referring to rates, ratios, probability models, geometric figures, data displays, and components of expressions, equations or inequalities.
Mathematical Practice Standards (MP) summary of each standard
3
7. Look for and make use of structure. (Deductive Reasoning)
Students routinely seek patterns or structures to model and solve problems. For instance,
students recognize patterns that exist in ratio tables making connections between the
constant of proportionality in a table with the slope of a graph. Students apply properties to generate equivalent expressions (i.e. 6 + 2x = 2 (3 + x) by distributive property) and solve
equations (i.e. 2c + 3 = 15, 2c = 12 by subtraction property of equality; c=6 by division
property of equality). Students compose and decompose two- and three-dimensional figures to solve real world problems involving scale drawings, surface area, and volume.
Students examine tree diagrams or systematic lists to determine the sample space for
compound events and verify that they have listed all possibilities. 8. Look for and express regularity in repeated reasoning. (Inductive Reasoning)
In grade 7, students use repeated reasoning to understand algorithms and make
generalizations about patterns. During multiple opportunities to solve and model problems,
they may notice that a/b ÷ c/d = ad/bc and construct other examples and models that confirm their generalization. They extend their thinking to include complex fractions and
rational numbers. Students formally begin to make connections between covariance, rates,
and representations showing the relationships between quantities. They create, explain, evaluate, and modify probability models to describe simple and compound events.
Mathematics Practice Standards

USD 259 Learning Services 2011
Summary of Standards for Mathematical Practice Questions to Develop Mathematical Thinking
1. Make sense of problems and persevere in solving them. Interpret and make meaning of the problem to find a starting point. Analyze what is given in order to explain to themselves themeaning of the problem.
Plan a solution pathway instead of jumping to a solution.
Monitor their progress and change the approach ifnecessary.
See relationships between various representations.
Relate current situations to concepts or skills previously learned and connect mathematical ideas to one another.
Continually ask themselves, “Does this make sense?” Can understand various approaches to solutions.
How would you describe the problem in your own words?How would you describe what you are trying to find?What do you notice about...?What information is given in the problem? Describe the relationship between the quantities.Describe what you have already tried. What might you change?Talk me through the steps you’ve used to this point.What steps in the process are you most confident about?What are some other strategies you might try?What are some other problems that are similar to this one?How might you use one of your previous problems to helpyou begin?
How else might you organize...represent... show...?
2. Reason abstractly and quantitatively. Make sense of quantities and their relationships.
Decontextualize (represent a situation symbolically andmanipulate the symbols) and contextualize (make meaningof the symbols in a problem) quantitative relationships.
Understand the meaning of quantities and are flexible in the use of operations and their properties.
Create a logical representation of the problem.
Attends to the meaning of quantities, not just how to compute them.
What do the numbers used in the problem represent?What is the relationship of the quantities?How is _______ related to ________?What is the relationship between ______and ______?What does_______mean to you? (e.g. symbol, quantity,
diagram)What properties might we use to find a solution?How did you decide in this task that you needed to use...? Could we have used another operation or property to
solve this task? Why or why not?
3. Construct viable arguments and critique the reasoning of others. Analyze problems and use stated mathematical assumptions, definitions, and established results in constructing arguments.
Justify conclusions with mathematical ideas.
Listen to the arguments of others and ask useful questions to determine if an argument makes sense.
Ask clarifying questions or suggest ideas to improve/revise the argument.
Compare two arguments and determine correct or flawed logic.
What mathematical evidence would support your solution?How can we be sure that...? / How could you prove that...?Will it still work if...?What were you considering when...?How did you decide to try that strategy?How did you test whether your approach worked?How did you decide what the problem was asking you to
find? (What was unknown?)Did you try a method that did not work? Why didn’t it
work? Would it ever work? Why or why not?What is the same and what is different about...?How could you demonstrate a counter-example?
4. Model with mathematics. Understand this is a way to reason quantitatively and abstractly (able to decontextualize and contextualize).
Apply the mathematics they know to solve everyday problems.
Are able to simplify a complex problem and identify important quantities to look at relationships.
Represent mathematics to describe a situation either with an equation or a diagram and interpret the results of a mathematical situation.
Reflect on whether the results make sense, possibly improving/revising the model.
Ask themselves, “How can I represent this mathematically?”
What number model could you construct to represent the problem?
What are some ways to represent the quantities?What is an equation or expression that matches the diagram,number line.., chart..., table..?Where did you see one of the quantities in the task in your
equation or expression? How would it help to create a diagram, graph, table...?What are some ways to visually represent...?What formula might apply in this situation?

USD 259 Learning Services 2011
Summary of Standards for Mathematical Practice Questions to Develop Mathematical Thinking
5. Use appropriate tools strategically. Use available tools recognizing the strengths and limitations of each.
Use estimation and other mathematical knowledge to detect possible errors.
Identify relevant external mathematical resources to pose and solve problems.
Use technological tools to deepen their understanding of mathematics.
What mathematical tools could we use to visualize and represent the situation?
What information do you have?What do you know that is not stated in the problem?What approach are you considering trying first?What estimate did you make for the solution?In this situation would it be helpful to use...a graph...,
number line..., ruler..., diagram..., calculator..., manipulative?Why was it helpful to use...?What can using a ______ show us that _____may not?In what situations might it be more informative or
helpful to use...?
6. Attend to precision. Communicate precisely with others and try to use clear mathematical language when discussing their reasoning.
Understand the meanings of symbols used in mathematicsand can label quantities appropriately.
Express numerical answers with a degree of precision appropriate for the problem context.
Calculate efficiently and accurately.
What mathematical terms apply in this situation?How did you know your solution was reasonable?Explain how you might show that your solution answers
the problem. What would be a more efficient strategy?
How are you showing the meaning of the quantities?What symbols or mathematical notations are important in
this problem?What mathematical language...,definitions..., properties can you use to explain...?
How could you test your solution to see if it answers the problem?
7. Look for and make use of structure. Apply general mathematical rules to specific situations.
Look for the overall structure and patterns in mathematics.
See complicated things as single objects or as being composed of several objects.
What observations do you make about...?What do you notice when...?What parts of the problem might you eliminate...,
simplify...?What patterns do you find in...?How do you know if something is a pattern?What ideas that we have learned before were useful in
solving this problem?What are some other problems that are similar to this one?How does this relate to...?In what ways does this problem connect to other
mathematical concepts?
8. Look for and express regularity in repeated reasoning. See repeated calculations and look for generalizations and shortcuts.
See the overall process of the problem and still attend to the details.
Understand the broader application of patterns and see the structure in similar situations.
Continually evaluate the reasonableness of their intermediate results
Explain how this strategy work in other situations?Is this always true, sometimes true or never true?How would we prove that...?What do you notice about...?What is happening in this situation?What would happen if...?Is there a mathematical rule for...?
What predictions or generalizations can this pattern support?What mathematical consistencies do you notice ?
4
In Grade 7, instructional time should focus on four critical areas: (1) developing understanding of and applying proportional relationships; (2) developing understanding of operations with rational numbers and working with expressions and linear equations; (3) solving problems involving scale drawings and informal geometric constructions, and working with two- and three-dimensional shapes to solve problems involving area, surface area, and volume; and (4) drawing inferences about populations based on samples. (1) Students extend their understanding of ratios and develop understanding of proportionality to solve single- and multi-step problems. Students use their understanding of ratios and proportionality to solve a wide variety of percent problems, including those involving discounts, interest, taxes, tips, and percent increase or decrease. Students solve problems about scale drawings by relating corresponding lengths between the objects or by using the fact that relationships of lengths within an object are preserved in similar objects. Students graph proportional relationships and understand the unit rate informally as a measure of the steepness of the related line, called the slope. They distinguish proportional relationships from other relationships. (2) Students develop a unified understanding of number, recognizing fractions, decimals (that have a finite or a repeating decimal representation), and percents as different representations of rational numbers. Students extend addition, subtraction, multiplication, and division to all rational numbers, maintaining the properties of operations and the relationships between addition and subtraction, and multiplication and division. By applying these properties, and by viewing negative numbers in terms of everyday contexts (e.g., amounts owed or temperatures below zero), students explain and interpret the rules for adding, subtracting, multiplying, and dividing with negative numbers. They use the arithmetic of rational numbers as they formulate expressions and equations in one variable and use these equations to solve problems. (3) Students continue their work with area from Grade 6, solving problems involving the area and circumference of a circle and surface area of three-dimensional objects. In preparation for work on congruence and similarity in Grade 8 they reason about relationships among two-dimensional figures using scale drawings and informal geometric constructions, and they gain familiarity with the relationships between angles formed by intersecting lines. Students work with three-dimensional figures, relating them to two-dimensional figures by examining cross-sections. They solve real-world and mathematical problems involving area, surface area, and volume of two- and three-dimensional objects composed of triangles, quadrilaterals, polygons, cubes and right prisms. (4) Students build on their previous work with single data distributions to compare two data distributions and address questions about differences between populations. They begin informal work with random sampling to generate data sets and learn about the importance of representative samples for drawing inferences.
Critical Areas for Mathematics in 7th Grade
Critical Areas

5
Domain: Ratios and Proportional Relationships (RP)
Cluster: Analyze proportional relationships and use them to solve real-world and mathematical
problems.
Standard: 7.RP.1. Compute unit rates associated with ratios of fractions, including ratios of
lengths, areas and other quantities measured in like or different units. For example, if a person
walks ½ mile in each ¼ hour, compute the unit rate as the complex fraction ½/¼ miles per hour,
equivalently 2 miles per hour.
Standards for Mathematical Practice (MP): MP.2. Reason abstractly and quantitatively. MP.6. Attend to precision
Connections: This cluster is connected to the Grade 7 Critical Area of Focus #1, Developing
understanding of and applying proportional relationships and Critical Area of Focus #2,
Developing understanding of operations with rational numbers and working with expressions and linear equations.
This cluster grows out of Ratio and Proportional Relationships (Grade 6) and the Number System
(Grade 6), and relates to Expressions and Equations (Grade 7). Cross Curricular connections - economics, personal finance, reading strategies.
Explanations and Examples
7.RP.1 Students continue to work with unit rates from 6th grade; however, the comparison now
includes fractions compared to fractions. For example, if 1/2 gallon of paint covers 1/6 of a wall, then the amount of paint needed for the entire wall can be computed by 1/2 gal divided by 1/6
wall. This calculation gives 3 gallons. This standard requires only the use of ratios as fractions.
Fractions may be proper or improper.
Instructional Strategies
Building from the development of rate and unit concepts in Grade 6, applications now need to
focus on solving unit-rate problems with more sophisticated numbers: fractions per fractions. Proportional relationships are further developed through the analysis of graphs, tables, equations
and diagrams. Ratio tables serve a valuable purpose in the solution of proportional problems. This
is the time to push for a deep understanding of what a representation of a proportional relationship looks like and what the characteristics are: a straight line through the origin on a
graph, a “rule” that applies for all ordered pairs, an equivalent ratio or an expression that
describes the situation, etc. This is not the time for students to learn to cross multiply to solve problems.
Because percents have been introduced as rates in Grade 6, the work with percents should
continue to follow the thinking involved with rates and proportions. Solutions to problems can be
found by using the same strategies for solving rates, such as looking for equivalent ratios or based upon understandings of decimals. Previously, percents have focused on “out of 100”; now
percents above 100 are encountered.
Providing opportunities to solve problems based within contexts that are relevant to seventh graders will connect meaning to rates, ratios and proportions. Examples include: researching
newspaper ads and constructing their own question(s), keeping a log of prices (particularly sales)
and determining savings by purchasing items on sale, timing students as they walk a lap on the track and figuring their rates, creating open-ended problem scenarios with and without numbers
to give students the opportunity to demonstrate mastery.
7.RP.1

6
Domain: Ratios of Proportional Relationships (RP)
Cluster: Analyze proportional relationships and use them to solve real-world and mathematical
problems.
Standard: 7.RP.2. Recognize and represent proportional relationships between quantities.
a. Decide whether two quantities are in a proportional relationship, e.g., by testing for equivalent
ratios in a table or graphing on a coordinate plane and observing whether the graph is a straight line through the origin.
b. Identify the constant of proportionality (unit rate) in tables, graphs, equations, diagrams, and
verbal descriptions of proportional relationships.
c. Represent proportional relationships by equations. For example, if total cost t is proportional to the number n of items purchased at a constant price p, the relationship between the total cost
and the number of items can be expressed as t = pn.
d. Explain what a point (x, y) on the graph of a proportional relationship means in terms of the situation, with special attention to the points (0, 0) and (1, r) where r is the unit rate.
Standards for Mathematical Practice (MP):
MP.1. Make sense of problems and persevere in solving them. MP.2. Reason abstractly and quantitatively. MP.3. Construct viable arguments and critique the reasoning of others. MP.4. Model with mathematics. MP.5. Use appropriate tools strategically. MP.6. Attend to precision. MP.7. Look for and make use of structure. MP.8. Look for and express regularity in repeated reasoning.
Connections:
This cluster is connected to the Grade 7 Critical Area of Focus #1, Developing understanding
of and applying proportional relationships and Critical Area of Focus #2, Developing understanding of operations with rational numbers and working with expressions and
linear equations.
This cluster grows out of Ratio and Proportional Relationships (Grade 6) and the Number System (Grade 6), and relates to Expressions and Equations (Grade 7).
Cross Curricular connections - economics, personal finance, reading strategies.
Explanations and Examples:
7.RP.2 Students’ understanding of the multiplicative reasoning used with proportions continues from 6th grade. Students determine if two quantities are in a proportional relationship from a table. For
example, the table below gives the price for different number of books. Do the numbers in the table represent a proportional relationship? Students can examine the numbers to see that 1 book at 3 dollars is equivalent to 4 books for 12 dollars since both sides of the tables can be multiplied by 4. However, the 7 and 18 are not proportional since 1 book times 7 and 3 dollars times 7 will not give 7 books for 18
dollars. Seven books for $18 are not proportional to the other amounts in the table; therefore, there is not a constant of proportionality. Students graph relationships to determine if two quantities are in a proportional relationship and interpret the ordered pairs. If the amounts from the table above are graphed (number of books, price), the pairs (1, 3), (3, 9), and (4, 12) will form a straight line through the origin (0 books cost 0
dollars), indicating that these pairs are in a proportional relationship. The ordered pair (4, 12) means that 4 books cost $12. However, the ordered pair (7, 18) would not be on the line, indicating that it is not proportional to the other pairs.
Number of Books
Price
1 3
3 9
4 12
7 18

7
The ordered pair (1, 3) indicates that 1 book is $3, which is the unit rate. The y-coordinate when x = 1 will be the unit rate. The constant of proportionality is the unit rate. Students identify this amount from tables (see
example above), graphs, equations and verbal descriptions of proportional relationships. The graph below represents the price of the bananas at one store. What is the constant of proportionality? From the graph, it can be determined that 4 pounds of bananas is $1.00; therefore, 1 pound of bananas is $0.25, which is the constant of proportionality for the graph. Note: Any point on the graph will yield this constant of proportionality.
The cost of bananas at another store can be determined by the equation: P = $0.35n, where P is the price and n is the number of pounds. What is the constant of proportionality (unit rate)? Students write equations from context and identify the coefficient as the unit rate which is also the constant of proportionality.
Note: This standard focuses on the representations of proportions. Solving proportions is addressed in 7.SP.3. Students may use a content web site and/or interactive white board to create tables and graphs of proportional or non-proportional relationships. Graphing proportional relationships represented in a table helps students recognize that the graph is a line through the origin (0,0) with a constant of
proportionality equal to the slope of the line.
Examples: A student is making trail mix. Create a graph to determine if the quantities of nuts and fruit are
proportional for each serving size listed in the table. If the quantities are proportional, what is the constant of proportionality or unit rate that defines the relationship? Explain how you
determined the constant of proportionality and how it relates to both the table and graph.
The relationship is proportional. For each of the other serving sizes there are 2 cups of fruit for
every 1 cup of nuts (2:1). The constant of proportionality is shown in the first column of the table and by the slope of the
line on the graph.
Serving Size 1 2 3 4
Cups of Nuts (x) 1 2 3 4
Cups of Fruit (y) 2 4 6 8

8
The graph below represents the cost of gum packs as a unit rate of $2 dollars for every
pack of gum. The unit rate is represented as $2/pack. Represent the relationship using a table and an equation.
Table:
Number of Packs of Gum (g) Cost in Dollars (d)
0 0
1 2
2 4
3 6
4 8
Equation: d = 2g, where d is the cost in dollars and g is the packs of gum
A common error is to reverse the position of the variables when writing equations. Students may
find it useful to use variables specifically related to the quantities rather than using x and y.
Constructing verbal models can also be helpful. A student might describe the situation as “the number of packs of gum times the cost for each pack is the total cost in dollars”. They can use
this verbal model to construct the equation. Students can check their equation by substituting
values and comparing their results to the table. The checking process helps student revise and
recheck their model as necessary. The number of packs of gum times the cost for each pack is the total cost
(g x 2 = d).
7.RP.2

9
Domain: Ratios and Proportional Relationships
Cluster: Analyze proportional relationships and use them to solve real-world and mathematical
problems.
Standard: 7.RP.3. Use proportional relationships to solve multistep ratio and percent problems.
Examples: simple interest, tax, markups and markdowns, gratuities and commissions, fees, percent increase and decrease, percent error.
Standards for Mathematical Practice (MP):
MP.1. Make sense of problems and persevere in solving them. MP.2. Reason abstractly and quantitatively. MP.3. Construct viable arguments and critique the reasoning of others. MP.4. Model with mathematics.
MP.5. Use appropriate tools strategically. MP.6. Attend to precision. MP.7. Look for and make use of structure. MP.8. Look for and express regularity in repeated reasoning.
Connections: This cluster is connected to the Grade 7 Critical Area of Focus #1, Developing understanding of
and applying proportional relationships and Critical Area of Focus #2, Developing
understanding of operations with rational numbers and working with expressions and linear equations.
This cluster grows out of Ratio and Proportional Relationships (Grade 6) and the Number System
(Grade 6), and relates to Expressions and Equations (Grade 7).
Cross Curricular connections - economics, personal finance, reading strategies.
Explanations and Examples:
7.RP.3 In 6th grade, students used ratio tables and unit rates to solve problems. Students expand their understanding of proportional reasoning to solve problems that are easier to solve
with cross-multiplication.
Students understand the mathematical foundation for cross-multiplication.
For example, a recipe calls for 3/4 teaspoon of butter for every 2 cups of milk. If you increase the recipe to use 3 cups of milk, how many teaspoons of butter are needed?
Using these numbers to find the unit rate may not be the most efficient method. Students can set
up the following proportion to show the relationship between butter and milk.
The use of proportional relationships is also extended to solve percent problems involving tax,
markups and markdowns simple interest (I = prt, I = interest, p = principal, r = rate, and t = time), gratuities and commissions, fees, percent increase and decrease, and percent error.
For example, Games Unlimited buys video games for $10. The store increases the price 300%?
What is the price of the video game? Using proportional reasoning, if $10 is 100% then what amount would be 300%? Since 300% is 3
times 100%, $30 would be $10 times 3. Thirty dollars represents the amount of increase from
$10 so the new price of the video game would be $40.
Continued next page

10
Finding the percent error is the process of expressing the size of the error (or deviation) between
two measurements. To calculate the percent error, students determine the absolute deviation (positive difference) between an actual measurement and the accepted value and then divide by
the accepted value. Multiplying by 100 will give the percent error.
% error = | your result - accepted value | x 100 % accepted value
For example, you need to purchase a countertop for your kitchen. You measured the countertop as
5 ft. The actual measurement is 4.5 ft. What is the percent error?
% error = | 5 ft. – 4.5 ft. | x 100
4.5
% error = 0.5 ft. x 100
4.5
Several problem situations have been represented with this standard; however, every possible
situation cannot be addressed here.
Students should be able to explain or show their work using a representation (numbers, words,
pictures, physical objects, or equations) and verify that their answer is reasonable. Models help
students to identify the parts of the problem and how the values are related. For percent increase and decrease, students identify the starting value, determine the difference, and compare the
difference in the two values to the starting value.
Examples:
Gas prices are projected to increase 124% by April 2015. A gallon of gas currently costs
$4.17. What is the projected cost of a gallon of gas for April 2015?
A student might say: “The original cost of a gallon of gas is $4.17. An increase of 100%
means that the cost will double. I will also need to add another 24% to figure out the final
projected cost of a gallon of gas. Since 25% of $4.17 is about $1.04, the projected cost of a gallon of gas should be around $9.40.”
$4.17 + 4.17 + (0.24 4.17) = 2.24 x 4.17
Continued next page
100%
$4.17
100%
$4.17
24%
?

11
A sweater is marked down 33%. Its original price was $37.50. What is the price of the
sweater before sales tax?
The discount is 33% times 37.50. The sale price of the sweater is the original price minus
the discount or 67% of the original price of the sweater, or Sale Price = 0.67 x Original
Price.
A shirt is on sale for 40% off. The sale price is $12. What was the original price? What was the amount of the discount?
At a certain store, 48 television sets were sold in April. The manager at the store wants to
encourage the sales team to sell more TVs and is going to give all the sales team members
a bonus if the number of TVs sold increases by 30% in May. How many TVs must the sales
team sell in May to receive the bonus? Justify your solution.
A salesperson set a goal to earn $2,000 in May. He receives a base salary of $500 as well as
a 10% commission for all sales. How much merchandise will he have to sell to meet his goal?
After eating at a restaurant, your bill before tax is $52.60 The sales tax rate is 8%. You decide to leave a 20% tip for the waiter based on the pre-tax amount. How much is the tip
you leave for the waiter? How much will the total bill be, including tax and tip? Express your
solution as a multiple of the bill.
The amount paid = 0.20 x $52.50 + 0.08 x $52.50 = 0.28 x $52.50
37.50 Original Price of Sweater
33% of 37.50
Discount
67% of 37.50 Sale price of sweater
Discount 40% of original price
Sale Price - $12 60% of original price
Original Price (p)
0.60p = 12
7.RP.3

12
Extended:
The Alternate Achievement Standards for Students With the Most Significant Cognitive Disabilities Non-Regulatory Guidance states, “…materials should show a clear link to the content standards for the grade in which the student is enrolled, although the grade-level content may be reduced in complexity or modified to reflect pre-requisite skills.” Throughout the Standards descriptors such as, describe, count, identify, etc, should be interpreted to mean that the students will be taught and tested according to their mode of communication.
EXTENDED 7.RP

13
Domain: The Number System (NS)
Cluster: Apply and extend previous understandings of operations with fractions to add, subtract,
multiply, and divide rational numbers.
Standard: 7.NS.1. Apply and extend previous understandings of addition and subtraction to add
and subtract rational numbers; represent addition and subtraction on a horizontal or vertical
number line diagram. a. Describe situations in which opposite quantities combine to make 0. For example, a hydrogen
atom has 0 charges because its two constituents are oppositely charged.
b. Understand p + q as the number located a distance |q| from p, in the positive or negative
direction depending on whether q is positive or negative. Show that a number and its opposite have a sum of 0 (are additive inverses). Interpret sums of rational numbers by describing real-
world contexts.
c. Understand subtraction of rational numbers as adding the additive inverse, p – q = p + (–q). Show that the distance between two rational numbers on the number line is the absolute value
of their difference, and apply this principle in real-world contexts.
d. Apply properties of operations as strategies to add and subtract rational numbers.
Standards for Mathematical Practice (MP): MP.2. Reason abstractly and quantitatively.
MP.4. Model with mathematics.
MP.7. Look for and make use of structure.
Connections:
This cluster is connected to the Grade 7 Critical Area of Focus #2, Developing understanding
of operations with rational numbers and working with expressions and linear equations.
Explanations and Examples:
7.NS.1 Students add and subtract rational numbers using a number line. For example, to add -5
+ 7, students would find -5 on the number line and move 7 in a positive direction (to the right).
The stopping point of 2 is the sum of this expression. Students also add negative fractions and decimals and interpret solutions in given contexts.
Visual representations may be helpful as students begin this work; they become less necessary as students become more fluent with the operations.
Examples: Use a number line to illustrate:
o p - q
o p + (- q)
o Is this equation true p – q = p + (-q)
-3 and 3 are shown to be opposites on the number line because they are equal distance
from zero and therefore have the same absolute value and the sum of the number and it’s opposite is zero.
Continued next page

14
You have $4 and you need to pay a friend $3. What will you have after paying your friend?
4 + (-3) = 1 or (-3) + 4 = 1
Instructional Strategies
This cluster builds upon the understandings of rational numbers in Grade 6:
• quantities can be shown using + or – as having opposite directions or values, • points on a number line show distance and direction,
• opposite signs of numbers indicate locations on opposite sides of 0 on the number line,
• the opposite of an opposite is the number itself, • the absolute value of a rational number is its distance from 0 on the number line,
• the absolute value is the magnitude for a positive or negative quantity, and
• locating and comparing locations on a coordinate grid by using negative and positive numbers.
Learning now moves to exploring and ultimately formalizing rules for operations (addition,
subtraction, multiplication and division) with integers.
Using both contextual and numerical problems, students should explore what happens when negatives and positives are combined. Number lines present a visual image for students to
explore and record addition and subtraction results. Two-color counters or colored chips can be
used as a physical and kinesthetic model for adding and subtracting integers. With one color designated to represent positives and a second color for negatives, addition/subtraction can be
represented by placing the appropriate numbers of chips for the addends and their signs on a
board. Using the notion of opposites, the board is simplified by removing pairs of opposite colored
chips. The answer is the total of the remaining chips with the sign representing the appropriate color. Repeated opportunities over time will allow students to compare the results of adding and
subtracting pairs of numbers, leading to the generalization of the rules. Fractional rational
numbers and whole numbers should be used in computations and explorations. Students should be able to give contextual examples of integer operations, write and solve equations for real-
world problems and explain how the properties of operations apply. Real-world situations could
include: profit/loss, money, weight, sea level, debit/credit, football yardage, etc. Using what students already know about positive and negative whole numbers and multiplication
with its relationship to division, students should generalize rules for multiplying and dividing
rational numbers. Multiply or divide the same as for positive numbers, then designate the sign
according to the number of negative factors. Students should analyze and solve problems leading
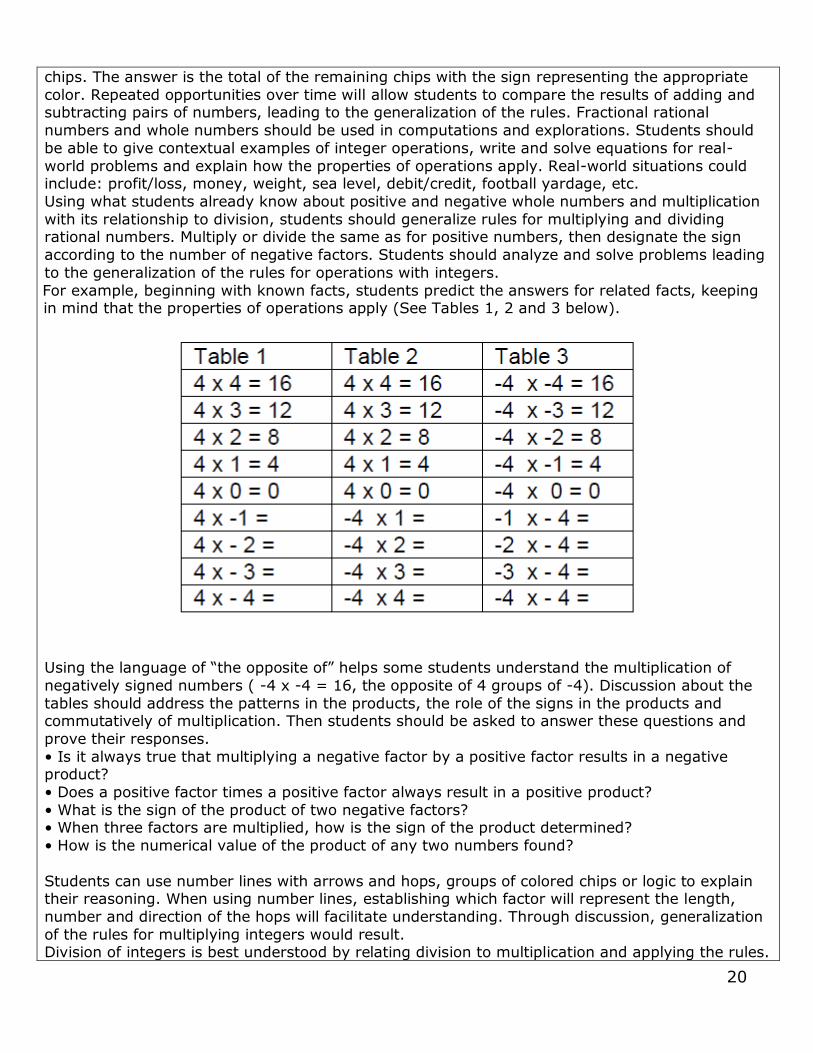
to the generalization of the rules for operations with integers. For example, beginning with
known facts, students predict the answers for related facts, keeping in mind that the
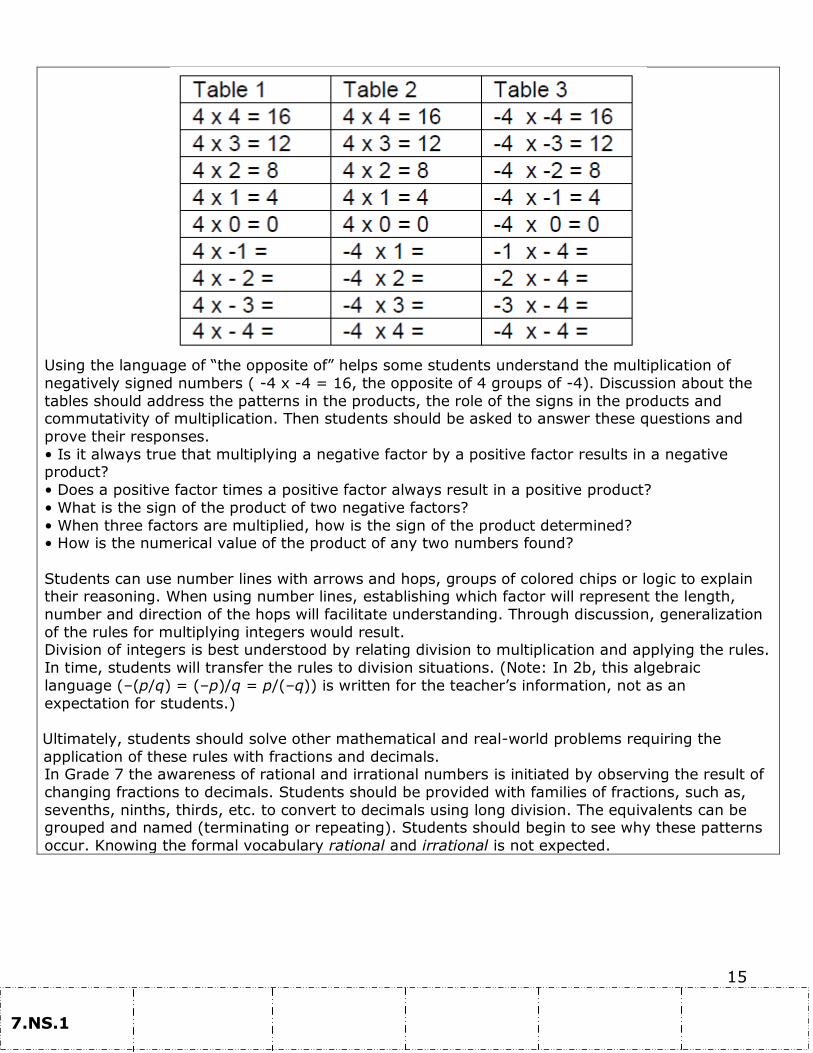
properties of operations apply (See Tables 1, 2 and 3 below).
15
Using the language of “the opposite of” helps some students understand the multiplication of
negatively signed numbers ( -4 x -4 = 16, the opposite of 4 groups of -4). Discussion about the
tables should address the patterns in the products, the role of the signs in the products and commutativity of multiplication. Then students should be asked to answer these questions and
prove their responses.
• Is it always true that multiplying a negative factor by a positive factor results in a negative product?
• Does a positive factor times a positive factor always result in a positive product?
• What is the sign of the product of two negative factors?
• When three factors are multiplied, how is the sign of the product determined? • How is the numerical value of the product of any two numbers found?
Students can use number lines with arrows and hops, groups of colored chips or logic to explain their reasoning. When using number lines, establishing which factor will represent the length,
number and direction of the hops will facilitate understanding. Through discussion, generalization
of the rules for multiplying integers would result. Division of integers is best understood by relating division to multiplication and applying the rules.
In time, students will transfer the rules to division situations. (Note: In 2b, this algebraic
language (–(p/q) = (–p)/q = p/(–q)) is written for the teacher’s information, not as an
expectation for students.)
Ultimately, students should solve other mathematical and real-world problems requiring the
application of these rules with fractions and decimals. In Grade 7 the awareness of rational and irrational numbers is initiated by observing the result of
changing fractions to decimals. Students should be provided with families of fractions, such as,
sevenths, ninths, thirds, etc. to convert to decimals using long division. The equivalents can be grouped and named (terminating or repeating). Students should begin to see why these patterns
occur. Knowing the formal vocabulary rational and irrational is not expected.
7.NS.1

16
Domain: The Number System
Cluster: Apply and extend previous understandings of operations with fractions to add, subtract,
multiply, and divide rational numbers.
Standard: 7.NS.2. Apply and extend previous understandings of multiplication and division and of
fractions to multiply and divide rational numbers.
a. Understand that multiplication is extended from fractions to rational numbers by requiring that operations continue to satisfy the properties of operations, particularly the distributive
property, leading to products such as (–1)(–1) = 1 and the rules for multiplying signed
numbers. Interpret products of rational numbers by describing real-world contexts.
b. Understand that integers can be divided, provided that the divisor is not zero, and every quotient of integers (with non-zero divisor) is a rational number. If p and q are integers, then
–(p/q) = (–p)/q = p/(–q). Interpret quotients of rational numbers by describing real-world
contexts.
c. Apply properties of operations as strategies to multiply and divide rational numbers.
d. Convert a rational number to a decimal using long division; know that the decimal form of a rational number terminates in 0s or eventually repeats.
Standards for Mathematical Practice (MP):
MP.2. Reason abstractly and quantitatively. MP.4. Model with mathematics.
MP.7. Look for and make use of structure
Connections:
This cluster is connected to the Grade 7 Critical Area of Focus #2, Developing understanding of operations with rational numbers and working with expressions and linear equations.
Explanations and Examples:
7.NS.2 Students recognize that when division of rational numbers is represented with a fraction bar, each number can have a negative sign.
Using long division from elementary school, students understand the difference between
terminating and repeating
decimals. This understanding is foundational for work with
rational and irrational numbers
in 8th grade. For example, identify which
fractions will terminate (the
denominator of the fraction in reduced form only has factors of
2 and/or 5)
Multiplication and division of integers is an extension of
multiplication and division of
whole numbers.
Examples: Examine the family of
equations. What patterns do you see? Create a model and context for each of the products.
Write and model the family of equations related to 3 x 4 = 12.
Equation Number Line Model Context
2 x 3 = 6
Selling two packages
of apples at $3.00
per pack
2 x -3 = -6
Spending 3 dollars
each on 2 packages
of apples
-2 x 3 = -6
Owing 2 dollars to
each of your three
friends
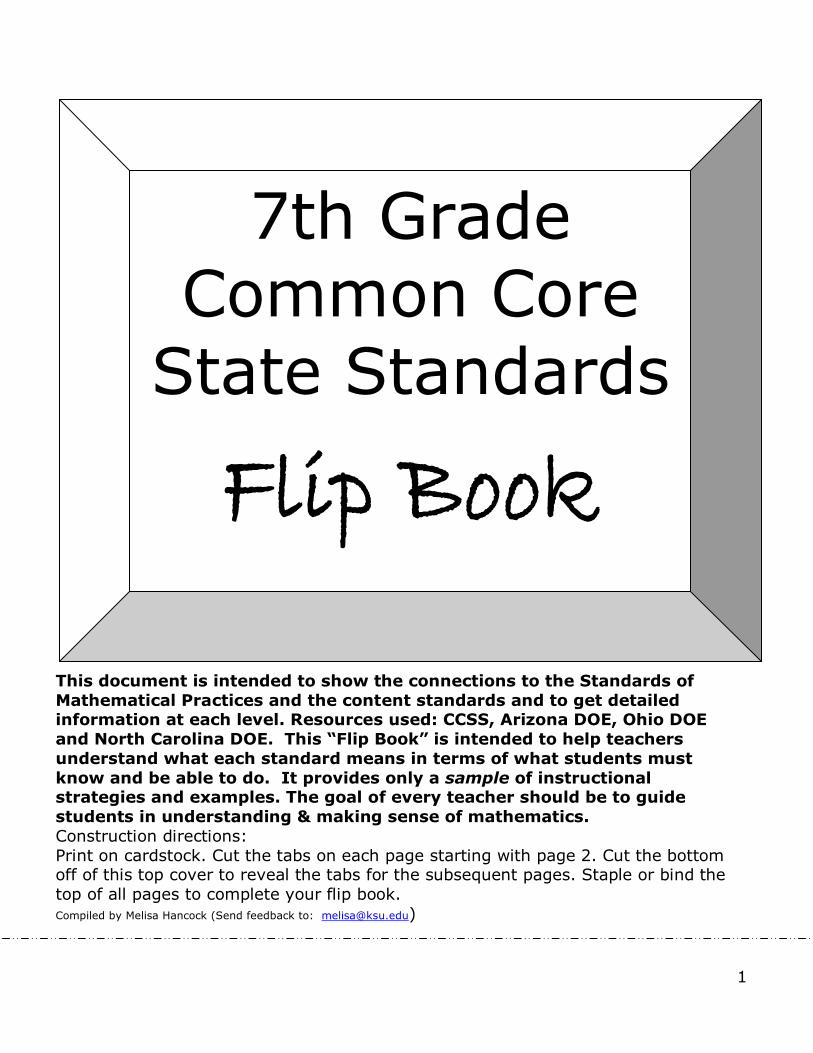
-2 x -3 = 6
Forgiving 3 debts of
$2.00 each

17
Instructional Strategies
This cluster builds upon the understandings of rational numbers in Grade 6: • quantities can be shown using + or – as having opposite directions or values,
• points on a number line show distance and direction,
• opposite signs of numbers indicate locations on opposite sides of 0 on the number line,
• the opposite of an opposite is the number itself, • the absolute value of a rational number is its distance from 0 on the number line,
• the absolute value is the magnitude for a positive or negative quantity, and
• locating and comparing locations on a coordinate grid by using negative and positive numbers.
Learning now moves to exploring and ultimately formalizing rules for operations (addition,
subtraction, multiplication and division) with integers.
Using both contextual and numerical problems, students should explore what happens when negatives and positives are combined. Number lines present a visual image for students to
explore and record addition and subtraction results. Two-color counters or colored chips can be
used as a physical and kinesthetic model for adding and subtracting integers. With one color designated to represent positives and a second color for negatives, addition/subtraction can be
represented by placing the appropriate numbers of chips for the addends and their signs on a
board. Using the notion of opposites, the board is simplified by removing pairs of opposite colored chips. The answer is the total of the remaining chips with the sign representing the appropriate
color. Repeated opportunities over time will allow students to compare the results of adding and
subtracting pairs of numbers, leading to the generalization of the rules. Fractional rational
numbers and whole numbers should be used in computations and explorations. Students should be able to give contextual examples of integer operations, write and solve equations for real-
world problems and explain how the properties of operations apply. Real-world situations could
include: profit/loss, money, weight, sea level, debit/credit, football yardage, etc. Using what students already know about positive and negative whole numbers and multiplication
with its relationship to division, students should generalize rules for multiplying and dividing
rational numbers. Multiply or divide the same as for positive numbers, then designate the sign according to the number of negative factors. Students should analyze and solve problems leading
to the generalization of the rules for operations with integers.
For example, beginning with known facts, students predict the answers for related facts, keeping
in mind that the properties of operations apply (See Tables 1, 2 and 3 below).
Continued next page

18
Using the language of “the opposite of” helps some students understand the multiplication of
negatively signed numbers ( -4 x -4 = 16, the opposite of 4 groups of -4). Discussion about the tables should address the patterns in the products, the role of the signs in the products and
commutativity of multiplication. Then students should be asked to answer these questions and
prove their responses.
• Is it always true that multiplying a negative factor by a positive factor results in a negative product?
• Does a positive factor times a positive factor always result in a positive product?
• What is the sign of the product of two negative factors? • When three factors are multiplied, how is the sign of the product determined?
• How is the numerical value of the product of any two numbers found?
Students can use number lines with arrows and hops, groups of colored chips or logic to explain their reasoning. When using number lines, establishing which factor will represent the length,
number and direction of the hops will facilitate understanding. Through discussion, generalization
of the rules for multiplying integers would result. Division of integers is best understood by relating division to multiplication and applying the rules.
In time, students will transfer the rules to division situations. (Note: In 2b, this algebraic
language (–(p/q) = (–p)/q = p/(–q)) is written for the teacher’s information, not as an expectation for students.)
Ultimately, students should solve other mathematical and real-world problems requiring the
application of these rules with fractions and decimals.
In Grade 7 the awareness of rational and irrational numbers is initiated by observing the result of changing fractions to decimals. Students should be provided with families of fractions, such as,
sevenths, ninths, thirds, etc. to convert to decimals using long division. The equivalents can be
grouped and named (terminating or repeating). Students should begin to see why these patterns occur. Knowing the formal vocabulary rational and irrational is not expected.
7.NS.2
19
Domain: The Number System
Cluster: Apply and extend previous understandings of operations with fractions to add, subtract,
multiply, and divide rational numbers.
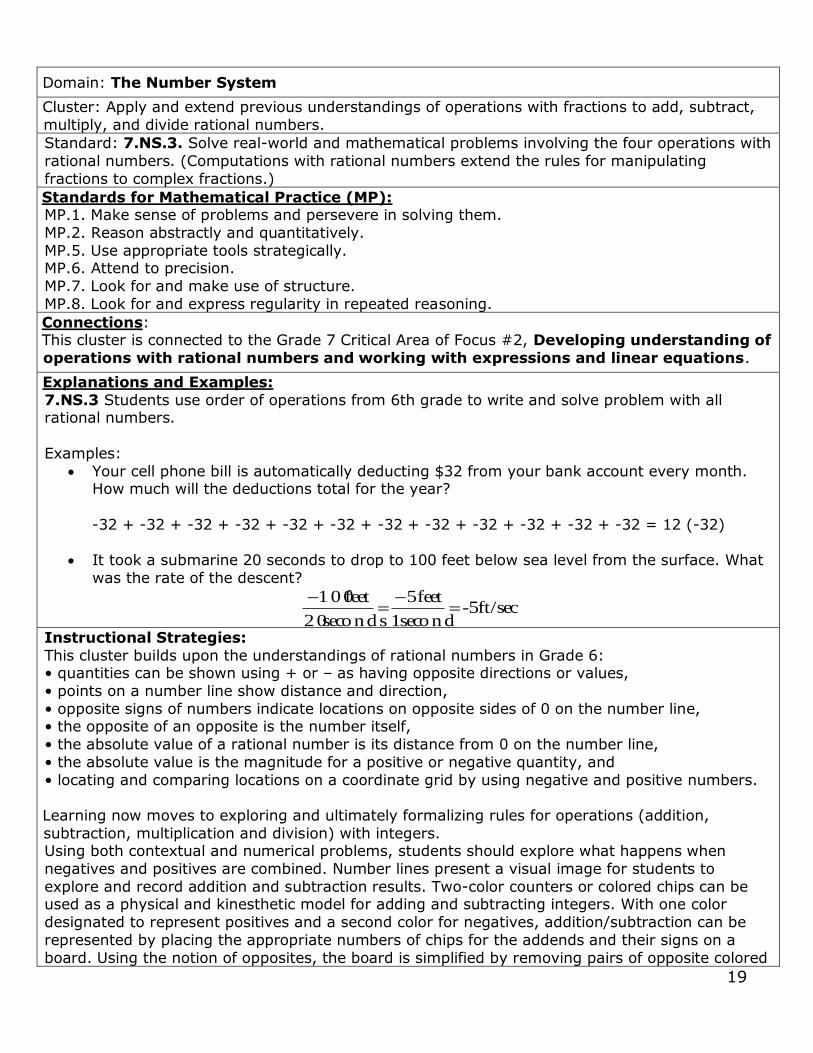
Standard: 7.NS.3. Solve real-world and mathematical problems involving the four operations with
rational numbers. (Computations with rational numbers extend the rules for manipulating
fractions to complex fractions.)
Standards for Mathematical Practice (MP): MP.1. Make sense of problems and persevere in solving them. MP.2. Reason abstractly and quantitatively. MP.5. Use appropriate tools strategically. MP.6. Attend to precision. MP.7. Look for and make use of structure. MP.8. Look for and express regularity in repeated reasoning.
Connections: This cluster is connected to the Grade 7 Critical Area of Focus #2, Developing understanding of
operations with rational numbers and working with expressions and linear equations.
Explanations and Examples:
7.NS.3 Students use order of operations from 6th grade to write and solve problem with all rational numbers.
Examples:
Your cell phone bill is automatically deducting $32 from your bank account every month. How much will the deductions total for the year?
-32 + -32 + -32 + -32 + -32 + -32 + -32 + -32 + -32 + -32 + -32 + -32 = 12 (-32)
It took a submarine 20 seconds to drop to 100 feet below sea level from the surface. What
was the rate of the descent?
ft/sec -5second 1
feet 5
seconds 20
feet 100
Instructional Strategies:
This cluster builds upon the understandings of rational numbers in Grade 6: • quantities can be shown using + or – as having opposite directions or values,
• points on a number line show distance and direction,
• opposite signs of numbers indicate locations on opposite sides of 0 on the number line, • the opposite of an opposite is the number itself,
• the absolute value of a rational number is its distance from 0 on the number line,
• the absolute value is the magnitude for a positive or negative quantity, and
• locating and comparing locations on a coordinate grid by using negative and positive numbers.
Learning now moves to exploring and ultimately formalizing rules for operations (addition,
subtraction, multiplication and division) with integers. Using both contextual and numerical problems, students should explore what happens when
negatives and positives are combined. Number lines present a visual image for students to
explore and record addition and subtraction results. Two-color counters or colored chips can be used as a physical and kinesthetic model for adding and subtracting integers. With one color
designated to represent positives and a second color for negatives, addition/subtraction can be
represented by placing the appropriate numbers of chips for the addends and their signs on a
board. Using the notion of opposites, the board is simplified by removing pairs of opposite colored
20
chips. The answer is the total of the remaining chips with the sign representing the appropriate
color. Repeated opportunities over time will allow students to compare the results of adding and subtracting pairs of numbers, leading to the generalization of the rules. Fractional rational
numbers and whole numbers should be used in computations and explorations. Students should
be able to give contextual examples of integer operations, write and solve equations for real-
world problems and explain how the properties of operations apply. Real-world situations could include: profit/loss, money, weight, sea level, debit/credit, football yardage, etc.
Using what students already know about positive and negative whole numbers and multiplication
with its relationship to division, students should generalize rules for multiplying and dividing rational numbers. Multiply or divide the same as for positive numbers, then designate the sign
according to the number of negative factors. Students should analyze and solve problems leading
to the generalization of the rules for operations with integers.
For example, beginning with known facts, students predict the answers for related facts, keeping in mind that the properties of operations apply (See Tables 1, 2 and 3 below).
Using the language of “the opposite of” helps some students understand the multiplication of
negatively signed numbers ( -4 x -4 = 16, the opposite of 4 groups of -4). Discussion about the
tables should address the patterns in the products, the role of the signs in the products and commutatively of multiplication. Then students should be asked to answer these questions and
prove their responses.
• Is it always true that multiplying a negative factor by a positive factor results in a negative product?
• Does a positive factor times a positive factor always result in a positive product?
• What is the sign of the product of two negative factors? • When three factors are multiplied, how is the sign of the product determined?
• How is the numerical value of the product of any two numbers found?
Students can use number lines with arrows and hops, groups of colored chips or logic to explain their reasoning. When using number lines, establishing which factor will represent the length,
number and direction of the hops will facilitate understanding. Through discussion, generalization
of the rules for multiplying integers would result. Division of integers is best understood by relating division to multiplication and applying the rules.

21
In time, students will transfer the rules to division situations. (Note: In 2b, this algebraic
language (–(p/q) = (–p)/q = p/(–q)) is written for the teacher’s information, not as an expectation for students.)
Ultimately, students should solve other mathematical and real-world problems requiring the
application of these rules with fractions and decimals.
In Grade 7 the awareness of rational and irrational numbers is initiated by observing the result of changing fractions to decimals. Students should be provided with families of fractions, such as,
sevenths, ninths, thirds, etc. to convert to decimals using long division. The equivalents can be
grouped and named (terminating or repeating). Students should begin to see why these patterns occur. Knowing the formal vocabulary rational and irrational is not expected.
7.NS.3

22
Extended: The Alternate Achievement Standards for Students With the Most Significant Cognitive Disabilities Non-Regulatory
Guidance states, “…materials should show a clear link to the content standards for the grade in which the student is enrolled, although the grade-level content may be reduced in complexity or modified to reflect pre-requisite skills.” Throughout the Standards descriptors such as, describe, count, identify, etc, should be interpreted to mean that the
students will be taught and tested according to their mode of communication. North Carolina DOE
EXTENDED
7.NS

23
Domain: Expressions and Equations (EE)
Cluster: Use properties of operations to generate equivalent expressions.
Standard: 7.EE.1. Apply properties of operations as strategies to add, subtract, factor, and expand linear expressions with rational coefficients.
Standards for Mathematical Practice (MP): MP.2. Reason abstractly and quantitatively. MP.6. Attend to precision. MP.7. Look for and make use of structure.
Connections: This cluster is connected to the Grade 7 Critical Area of Focus #2, Developing understanding
of operations with rational numbers and working with expressions and linear equations.
The concepts in this cluster build from Operations and Algebraic Thinking Write and interpret numerical expressions 1&2 (Grade 5).
Provides foundation for beginning equation work (Grade 8).
Provides foundation for writing equivalent non-linear expressions in the High School Conceptual
Category Algebra.
Instructional Strategies
Have students build on their understanding of order of operations and use the properties of
operations to rewrite equivalent numerical expressions that were developed in Grade 6. Students continue to use properties that were initially used with whole numbers and now develop the
understanding that properties hold for integers, rational and real numbers.
Provide opportunities to build upon this experience of writing expressions using variables to
represent situations and use the properties of operations to generate equivalent expressions. These expressions may look different and use different numbers, but the values of the
expressions are the same.
Provide opportunities for students to experience expressions for amounts of increase and decrease. In Standard 2, the expression is rewritten and the variable has a different coefficient. In
context, the coefficient aids in the understanding of the situation. Another example is this
situation which represents a 10% decrease: b - 0.10b = 1.00b - 0.10b which equals 0.90b or
90% of the amount. One method that students can use to become convinced that expressions are equivalent is by
substituting a numerical value for the variable and evaluating the expression. For example 5(3 +
2x) is equal to 5 ●3 + 5 ● 2x Let x = 6 and substitute 6 for x in both equations.
Provide opportunities for students to use and understand the properties of operations. These include: the commutative, associative, identity, and inverse properties of addition and of
multiplication, and the zero property of multiplication. Another method students can use to
become convinced that expressions are equivalent is to justify each step of simplification of an expression with an operation property.

24
Explanations and Examples:
7.EE.1 This is a continuation of work from 6th grade using properties of operations (table 3, pg. 90) and combining like terms. Students apply properties of operations and work with rational
numbers (integers and positive / negative fractions and decimals) to write equivalent expressions.
Examples:
Write an equivalent expression for 253 x .
Suzanne thinks the two expressions aa 4232 and 210 a is equivalent? Is she correct?
Explain why or why not?
Write equivalent expressions for: 123 a .
Possible solutions might include factoring as in )4(3 a , or other expressions such as
572 aa .
A rectangle is twice as long as wide. One way to write an expression to find the perimeter would be wwww 22 . Write the expression in two other ways.
Solution: w6 OR )2(2)(2 ww .
An equilateral triangle has a perimeter of 156 x . What is the length of each of the sides of
the triangle?
Solution: )52(3 x , therefore each side is 52 x units long.
Common Misconceptions: As students begin to build and work with expressions containing more than two operations,
students tend to set aside the order of operations. For example having a student simplify an
expression like 8 + 4(2x - 5) + 3x can bring to light several misconceptions. Do the students
immediately add the 8 and 4 before distributing the 4? Do they only multiply the 4 and the 2x and not distribute the 4 to both terms in the parenthesis? Do they collect all like terms
8 + 4 – 5, and 2x + 3x? Each of these show gaps in students’ understanding of how to simplify
numerical expressions with multiple operations.
7.EE.1

25
Domain: Expressions and Equations
Cluster: Use properties of operations to generate equivalent expressions.
Standard: 7.EE.2 Understand that rewriting an expression in different forms in a problem context can shed light on the problem and how the quantities in it are related. For example, a + 0.05a =
1.05a means that “increase by 5%” is the same as “multiply by 1.05.”
Standards for Mathematical Practice (MP):
MP.2. Reason abstractly and quantitatively. MP.6. Attend to precision. MP.7. Look for and make use of structure. MP.8. Look for and express regularity in repeated reasoning.
Connections:
This cluster is connected to the Grade 7 Critical Area of Focus #2, Developing understanding of operations with rational numbers and working with expressions and linear equations.
The concepts in this cluster build from Operations and Algebraic Thinking Write and interpret
numerical expressions 1&2 (Grade 5).
Provides foundation for beginning equation work (Grade 8). Provides foundation for writing equivalent non-linear expressions in the High School Conceptual
Category Algebra.
Instructional Strategies Have students build on their understanding of order of operations and use the properties of
operations to rewrite equivalent numerical expressions that were developed in Grade 6. Students
continue to use properties that were initially used with whole numbers and now develop the
understanding that properties hold for integers, rational and real numbers. Provide opportunities to build upon this experience of writing expressions using variables to
represent situations and use the properties of operations to generate equivalent expressions.
These expressions may look different and use different numbers, but the values of the expressions are the same.
Provide opportunities for students to experience expressions for amounts of increase and
decrease. In Standard 2, the expression is rewritten and the variable has a different coefficient. In
context, the coefficient aids in the understanding of the situation. Another example is this situation which represents a 10% decrease: b - 0.10b = 1.00b - 0.10b which equals 0.90b or 90% of the
amount.
One method that students can use to become convinced that expressions are equivalent is by substituting a numerical value for the variable and evaluating the expression. For example 5(3 +
2x) is equal to 5 ●3 + 5 ● 2x Let x = 6 and substitute 6 for x in both equations.
Provide opportunities for students to use and understand the properties of operations. These
include: the commutative, associative, identity, and inverse properties of addition and of
multiplication, and the zero property of multiplication. Another method students can use to become convinced that expressions are equivalent is to justify each step of simplification of an
expression with an operation property.

26
Explanations and Examples:
7.EE.2 Students understand the reason for rewriting an expression in terms of a contextual situation. For example, students understand that a 20% discount is the same as finding 80% of
the cost (.80c). All varieties of a brand of cookies are $3.50. A person buys 2 peanut butter, 3
sugar and 1 chocolate. Instead of multiplying 2 x $3.50 to get the cost of the peanut butter
cookies, 3 x $3.50 to get the cost of the sugar cookies and 1 x $3.50 for the chocolate cookies and then adding those totals together, student recognize that
multiplying $3.50 times 6 will give the same total.
Examples
Jamie and Ted both get paid an equal hourly wage of $9 per hour. This week, Ted made an
additional $27 dollars in overtime. Write an expression that represents the weekly wages of
both if J = the number of hours that Jamie worked this week and T = the number of hours Ted worked this week? Can you write the expression in another way?
Students may create several different expressions depending upon how they group the quantities in the problem.
One student might say: To find the total wage, I would first multiply the number of hours Jamie worked by 9. Then I would multiply the number of hours Ted worked by 9. I would add these two
values with the $27 overtime to find the total wages for the week. The student would write the expression 2 799 TJ .
Another student might say: To find the total wages, I would add the number of hours that Ted and
Jamie worked. I would multiply the total number of hours worked by 9. I would then add the
overtime to that value to get the total wages for the week. The student would write the expression 27)(9 TJ
A third student might say: To find the total wages, I would need to figure out how much Jamie
made and add that to how much Ted made for the week. To figure out Jamie’s wages, I would
multiply the number of hours she worked by 9. To figure out Ted’s wages, I would multiply the number of hours he worked by 9 and then add the $27 he earned in overtime. My final step would
be to add Jamie and Ted wages for the week to find their combined total wages. The student
would write the expression )279()9( TJ
Given a square pool as shown in the picture, write four different
expressions to find the total number of tiles in the border. Explain how each of the expressions relates to the diagram and demonstrate that the
expressions are equivalent. Which expression do you think is most
useful? Explain your thinking.

27
Common Misconceptions:
As students begin to build and work with expressions containing more than two operations, students tend to set aside the order of operations. For example having a student simplify an
expression like 8 + 4(2x - 5) + 3x can bring to light several misconceptions. Do the students
immediately add the 8 and 4 before distributing the 4? Do they only multiply the 4 and the 2x and
not distribute the 4 to both terms in the parenthesis? Do they collect all like terms 8 + 4 – 5, and 2x + 3x? Each of these show gaps in students’ understanding of how to simplify
numerical expressions with multiple operations.
7.EE.2

28
Domain: Expressions and Equations
Cluster: Use properties of operations to generate equivalent expressions.
Standard: 7.EE.3. Solve multi-step real-life and mathematical problems posed with positive and
negative rational numbers in any form (whole numbers, fractions, and decimals), using tools
strategically. Apply properties of operations to calculate with numbers in any form; convert between forms as appropriate; and assess the reasonableness of answers using mental
computation and estimation strategies. For example: If a woman making $25 an hour gets a 10%
raise, she will make an additional 1/10 of her salary an hour, or $2.50, for a new salary of
$27.50. If you want to place a towel bar 9 3/4 inches long in the center of a door that is 27 1/2
inches wide, you will need to place the bar about 9 inches from each edge; this estimate can be
used as a check on the exact computation.
Standards for Mathematical Practice (MP):
MP.1. Make sense of problems and persevere in solving them. MP.2. Reason abstractly and quantitatively. MP.3. Construct viable arguments and critique the reasoning of others. MP.4. Model with mathematics.
MP.5. Use appropriate tools strategically. MP.6. Attend to precision. MP.7. Look for and make use of structure. MP.8. Look for and express regularity in repeated reasoning.
Connections:
This cluster is connected to the Grade 7 Critical Area of Focus #2, Developing understanding of operations with rational numbers and working with expressions and linear equations,
and to Critical Area of Focus #3, Solving problems involving scale drawings and informal
geometric constructions, and working with two- and three-dimensional shapes to solve problems involving area, surface area, and volume.
Instructional Strategies To assist students’ assessment of the reasonableness of answers, especially problem situations involving fractional or decimal numbers, use whole-number approximations for the computation and then compare to the actual computation. Connections between performing the inverse operation and undoing the operations are appropriate here. It is appropriate to expect students to show the steps in their work. Students should be able to explain their thinking using the correct terminology for the properties and operations. Continue to build on students’ understanding and application of writing and solving one-step equations from
a problem situation to multi-step problem situations. This is also the context for students to practice using rational numbers including: integers, and positive and negative fractions and decimals. As students analyze a situation, they need to identify what operation should be completed first, then the values for that computation. Each set of the needed operation and values is determined in order. Finally an equation matching the order of operations is written. For example, Bonnie goes out to eat and buys a meal that costs $12.50 that includes a tax of $.75. She only wants to leave a tip based on the cost of the food. In this situation, students need to realize that the tax must be subtracted from the total cost before being multiplied by the percent of tip and then added back to obtain the final cost. C = (12.50 - .75)(1 + T) + .75 = 11.75(1 +T) + .75 where C = cost and T = tip. Provide multiple opportunities for students to work with multi-step problem situations that have multiple solutions and therefore can be represented by an inequality. Students need to be aware that values can satisfy an inequality but not be appropriate for the situation, therefore limiting the solutions for that particular problem.
29
Explanations and Examples:
7.EE.3 Students solve contextual problems using rational numbers. Students convert between fractions, decimals, and percents as needed to solve the problem. Students use estimation to
justify the reasonableness of answers.
Estimation strategies for calculations with fractions and decimals extend from students’ work with whole number operations. Estimation strategies include, but are not limited to:
front-end estimation with adjusting (using the highest place value and estimating from the
front end making adjustments to the estimate by taking into account the remaining amounts),
clustering around an average (when the values are close together an average value is
selected and multiplied by the number of values to determine an estimate),
rounding and adjusting (students round down or round up and then adjust their estimate depending on how much the rounding affected the original values),
using friendly or compatible numbers such as factors (students seek to fit numbers
together - i.e., rounding to factors and grouping numbers together that have round sums like 100 or 1000), and
using benchmark numbers that are easy to compute (student’s select close whole numbers
for fractions or decimals to determine an estimate).
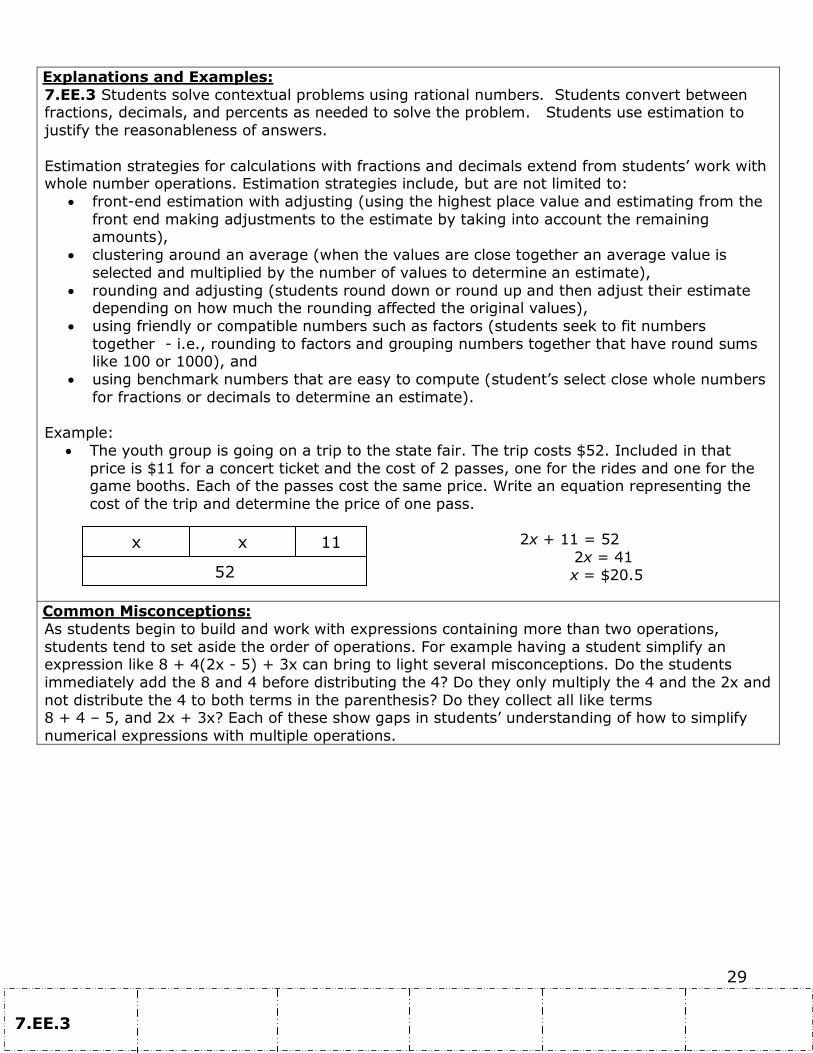
Example:
The youth group is going on a trip to the state fair. The trip costs $52. Included in that
price is $11 for a concert ticket and the cost of 2 passes, one for the rides and one for the game booths. Each of the passes cost the same price. Write an equation representing the
cost of the trip and determine the price of one pass.
2x + 11 = 52
2x = 41
x = $20.5
Common Misconceptions:
As students begin to build and work with expressions containing more than two operations,
students tend to set aside the order of operations. For example having a student simplify an expression like 8 + 4(2x - 5) + 3x can bring to light several misconceptions. Do the students
immediately add the 8 and 4 before distributing the 4? Do they only multiply the 4 and the 2x and
not distribute the 4 to both terms in the parenthesis? Do they collect all like terms 8 + 4 – 5, and 2x + 3x? Each of these show gaps in students’ understanding of how to simplify
numerical expressions with multiple operations.
x x 11
52
7.EE.3

30
Domain: Expressions and Equations
Cluster: Solve real-life and mathematical problems using numerical and algebraic expressions and
equations.
Standard: 7.EE.4. Use variables to represent quantities in a real-world or mathematical problem, and
construct simple equations and inequalities to solve problems by reasoning about the quantities. a. Solve word problems leading to equations of the form px+q=r and p(x+q)=r, where p, q, and r are
specific rational numbers. Solve equations of these forms fluently. Compare an algebraic solution to an arithmetic solution, identifying the sequence of the operations used in each approach. For
example, the perimeter of a rectangle is 54 cm. Its length is 6 cm. What is its width?
b. Solve word problems leading to inequalities of the form px+q>r or px+q < r, where p, q, and r are specific rational numbers. Graph the solution set of the inequality and interpret it in the context of the problem. For example: As a salesperson, you are paid $50 per week plus $3 per sale. This week you want your pay to be at least $100. Write an inequality for the number of sales you need
to make, and describe the solutions.
Standards for Mathematical Practice (MP): MP.1. Make sense of problems and persevere in solving them.
MP.2. Reason abstractly and quantitatively. MP.3. Construct viable arguments and critique the reasoning of others. MP.4. Model with mathematics. MP.5. Use appropriate tools strategically. MP.6. Attend to precision.
MP.7. Look for and make use of structure. MP.8. Look for and express regularity in repeated reasoning.
Connections: This cluster is connected to the Grade 7 Critical Area of Focus #2, Developing understanding of operations with rational numbers and working with expressions and linear equations, and to Critical Area of Focus #3, Solving problems involving scale drawings and informal geometric constructions, and working with two- and three-dimensional shapes to solve problems involving area, surface area, and volume.
Instructional Strategies To assist students’ assessment of the reasonableness of answers, especially problem situations involving fractional or decimal numbers, use whole-number approximations for the computation and then compare to the actual computation. Connections between performing the inverse operation and undoing the operations are appropriate here. It is appropriate to expect students to show the steps in their work. Students should be able to explain their thinking using the correct terminology for the properties and operations. Continue to build on students’ understanding and application of writing and solving one-step equations from a problem situation to multi-step problem situations. This is also the context for students to practice using rational numbers including: integers, and positive and negative fractions and decimals. As students analyze a situation, they need to identify what operation should be completed first, then the values for that computation. Each set of the needed operation and values is determined in order. Finally an equation matching the order of operations is written. For example, Bonnie goes out to eat and buys a meal that costs $12.50 that includes a tax of $.75. She only wants to leave a tip based on the cost of the food. In this situation, students need to realize that the tax must be subtracted from the total cost before being
multiplied by the percent of tip and then added back to obtain the final cost. C = (12.50 - .75)(1 + T) + .75 = 11.75(1 +T) + .75 where C = cost and T = tip. Provide multiple opportunities for students to work with multi-step problem situations that have multiple solutions and therefore can be represented by an inequality. Students need to be aware that values can satisfy an inequality but not be appropriate for the situation, therefore limiting the solutions for that particular problem.
31
Explanations and Examples:
7.EE.4 Students solve multi-step equations and inequalities derived from word problems. Students use the arithmetic from the problem to generalize an algebraic solution
Students graph inequalities and make sense of the inequality in context. Inequalities may have
negative coefficients. Problems can be used to find a maximum or minimum value when in context.
Examples:
Amie had $26 dollars to spend on school supplies. After buying 10 pens, she had $14.30
left. How much did each pen cost?
The sum of three consecutive even numbers is 48. What is the smallest of these numbers?
Solve: 2054
5n
Florencia has at most $60 to spend on clothes. She wants to buy a pair of jeans for $22
dollars and spend the rest on t-shirts. Each t-shirt costs $8. Write an inequality for the number of t-shirts she can purchase.
Steven has $25 dollars. He spent $10.81, including tax, to buy a new DVD. He needs to set
aside $10.00 to pay for his lunch next week. If peanuts cost $0.38 per package including tax, what is the maximum number of packages that Steven can buy?
Write an equation or inequality to model the situation. Explain how you determined whether to write an equation or inequality and the properties of the real number system that you
used to find a solution.
Solve 232
1x and graph your solution on a number line.
7.EE.4

32
Extended Standards: The Alternate Achievement Standards for Students With the Most Significant Cognitive Disabilities Non-Regulatory
Guidance states, “…materials should show a clear link to the content standards for the grade in which the student is enrolled, although the grade-level content may be reduced in complexity or modified to reflect pre-requisite skills.” Throughout the Standards descriptors such as, describe, count, identify, etc, should be interpreted to mean that the
students will be taught and tested according to their mode of communication. (North Carolina DOE)
EXTENDED 7.EE

33
Domain: Geometry (G)
Cluster: Draw, constructs, and describes geometrical figures and describes the relationships between them.
Standard: 7.G.1. Solve problems involving scale drawings of geometric figures, such as
computing actual lengths and areas from a scale drawing and reproducing a scale drawing at a different scale.
Standards for Mathematical Practice (MP):
MP.1. Make sense of problems and persevere in solving them. MP.2. Reason abstractly and quantitatively. MP.3. Construct viable arguments and critique the reasoning of others. MP.4. Model with mathematics.
MP.5. Use appropriate tools strategically. MP.6. Attend to precision. MP.7. Look for and make use of structure. MP.8. Look for and express regularity in repeated reasoning.
Connections: This cluster is connected to the Grade 7 Critical Area of Focus #3, Solving problems involving
scale drawings and informal geometric constructions, and working with two- and three-
dimensional shapes to solve problems involving area, surface area, and volume. Connections should be made between this cluster and the Grade 7 Geometry Solve real-life and
mathematical problems involving angle measure, area, surface area, and volume. (7.G.4-6).
Grades 6 and 7: Ratios and Proportional Relationships
This cluster leads to the development of the triangle congruence criteria in Grade 8.
Instructional Strategies
This cluster focuses on the importance of visualization in the understanding of Geometry. Being
able to visualize and then represent geometric figures on paper is essential to solving geometric problems.
Scale drawings of geometric figures connect understandings of proportionality to geometry and
lead to future work in similarity and congruence. As an introduction to scale drawings in
geometry, students should be given the opportunity to explore scale factor as the number of time you multiple the measure of one object to obtain the measure of a similar object. It is important
that students first experience this concept concretely progressing to abstract contextual
situations. Pattern blocks (not the hexagon) provide a convenient means of developing the foundation of scale. Choosing one of the pattern blocks as an original shape, students can then
create the next-size shape using only those same-shaped blocks. Questions about the relationship
of the original block to the created shape should be asked and recorded. A sample of a recording sheet is shown.
This can be repeated for multiple iterations of each shape by comparing each side length to the
original’s side length. An extension would be for students to compare the later iterations to the
previous. Students should also be expected to use side lengths equal to fractional and decimal parts. In other words, if the original side can be stated to represent 2.5 inches, what would be the

34
new lengths and what would be the scale?
Provide opportunities for students to use scale drawings of geometric figures with a given scale that requires them to draw and label the dimensions of the new shape. Initially, measurements
should be in whole numbers, progressing to measurements expressed with rational numbers. This
will challenge students to apply their understanding of fractions and decimals.
After students have explored multiple iterations with a couple of shapes, ask them to choose and replicate a shape with given scales to find the new side lengths, as well as both the perimeters
and areas. Starting with simple shapes and whole-number side lengths allows all students access
to discover and understand the relationships. An interesting discovery is the relationship of the scale of the side lengths to the scale of the respective perimeters (same scale) and areas (scale
squared). A sample recording sheet is shown.
Students should move on to drawing scaled figures on grid paper with proper figure labels, scale
and dimensions. Provide word problems that require finding missing side lengths, perimeters or
areas. For example, if a 4 by 4.5 cm rectangle is enlarged by a scale of 3, what will be the new perimeter? What is the new area? or If the scale is 6, what will the new side length look like? or
Suppose the area of one triangle is 16 sq units and the scale factor between this triangle and a
new triangle is 2.5. What is the area of the new triangle?
Reading scales on maps and determining the actual distance (length) is an appropriate contextual situation.
Constructions facilitate understanding of geometry. Provide opportunities for students to
physically construct triangles with straws, sticks, or geometry apps prior to using rulers and protractors to discover and justify the side and angle conditions that will form triangles.
Explorations should involve giving students: three side measures, three angle measures, two side
measures and an included angle measure, and two angles and an included side measure to determine if a unique triangle, no triangle or an infinite set of triangles results. Through
discussion of their exploration results, students should conclude that triangles cannot be formed
by any three arbitrary side or angle measures. They may realize that for a triangle to result the
sum of any two side lengths must be greater than the third side length, or the sum of the three angles must equal 180 degrees. Students should be able to transfer from these explorations to
reviewing measures of three side lengths or three angle measures and determining if they are
from a triangle justifying their conclusions with both sketches and reasoning. This cluster is related to the following Grade 7 cluster “Solve real-life and mathematical problems
involving angle measure, area, surface area, and volume.” Further construction work can be
replicated with quadrilaterals, determining the angle sum, noticing the variety of polygons that can be created with the same side lengths but different angle measures, and ultimately
generalizing a method for finding the angle sums for regular polygons and the measures of
individual angles. For example, subdividing a polygon into triangles using a vertex (N-2)180° or

35
subdividing a polygons into triangles using an interior point 180°N - 360° where N = the number
of sides in the polygon. An extension would be to realize that the two equations are equal. Slicing three-dimensional figures helps develop three-dimensional visualization skills. Students
should have the opportunity to physically create some of the three-dimensional figures, slice them
in different ways, and describe in pictures and words what has been found. For example, use clay
to form a cube, then pull string through it in different angles and record the shape of the slices found. Challenges can also be given: “See how many different two-dimensional figures can be
found by slicing a cube” or “What three-dimensional figure can produce a hexagon slice?” This can
be repeated with other three-dimensional figures using a chart to record and sketch the figure, slices and resulting two-dimensional figures.
Instructional Resources/Tools
Straws, clay, angle rulers, protractors, rulers, grid paper
Road Maps - convert to actual miles Dynamic computer software - Geometer's SketchPad. This cluster lends itself to using dynamic software. Students sometimes can manipulate the software
more quickly than do the work manually. However, being able to use a protractor and a straight
edge are desirable skills.
Explanations and Examples:
7.G.1 Students determine the dimensions of figures when given a scale and identify the impact of
a scale on actual length (one-dimension) and area (two-dimensions). Students identify the scale
factor given two figures. Using a given scale drawing, students reproduce the drawing at a different scale. Students understand that the lengths will change by a factor equal to the product
of the magnitude of the two size transformations.
Example:
Julie showed you the scale drawing of her room. If each 2 cm on the scale drawing equals 5
ft, what are the actual dimensions of Julie’s room? Reproduce the drawing at 3 times its current size.
Common Misconceptions: Student’s may have misconceptions about correctly setting up proportions, how to read a ruler,
doubling side measures, and does not double perimeter.
7.G.1

36
Domain: Geometry
Cluster: Draw, constructs, and describes geometrical figures and describes the relationships
between them.
Standard: 7.G.2. Draw (freehand, with ruler and protractor, and with technology) geometric
shapes with given conditions. Focus on constructing triangles from three measures of angles or
sides, noticing when the conditions determine a unique triangle, more than one triangle, or no triangle.
Standards for Mathematical Practice (MP):
MP.4. Model with mathematics. MP.5. Use appropriate tools strategically. MP.6. Attend to precision. MP.7. Look for and make use of structure. MP.8. Look for and express regularity in repeated reasoning.
Connections:
This cluster is connected to the Grade 7 Critical Area of Focus #3, Solving problems involving
scale drawings and informal geometric constructions, and working with two- and three-dimensional shapes to solve problems involving area, surface area, and volume.
Connections should be made between this cluster and the Grade 7 Geometry Solve real-life and
mathematical problems involving angle measure, area, surface area, and volume. (7.G.4-6). Grades 6 and 7: Ratios and Proportional Relationships.
This cluster leads to the development of the triangle congruence criteria in Grade 8.
Instructional Strategies
This cluster focuses on the importance of visualization in the understanding of Geometry. Being able to visualize and then represent geometric figures on paper is essential to solving geometric
problems.
Scale drawings of geometric figures connect understandings of proportionality to geometry and lead to future work in similarity and congruence. As an introduction to scale drawings in
geometry, students should be given the opportunity to explore scale factor as the number of time
you multiple the measure of one object to obtain the measure of a similar object. It is important
that students first experience this concept concretely progressing to abstract contextual situations. Pattern blocks (not the hexagon) provide a convenient means of developing the
foundation of scale. Choosing one of the pattern blocks as an original shape, students can then
create the next-size shape using only those same-shaped blocks. Questions about the relationship of the original block to the created shape should be asked and recorded. A sample of a recording
sheet is shown.
This can be repeated for multiple iterations of each shape by comparing each side length to the original’s side length. An extension would be for students to compare the later iterations to the
previous. Students should also be expected to use side lengths equal to fractional and decimal
parts. In other words, if the original side can be stated to represent 2.5 inches, what would be the
new lengths and what would be the scale?

37
Provide opportunities for students to use scale drawings of geometric figures with a given scale
that requires them to draw and label the dimensions of the new shape. Initially, measurements should be in whole numbers, progressing to measurements expressed with rational numbers. This
will challenge students to apply their understanding of fractions and decimals.
After students have explored multiple iterations with a couple of shapes, ask them to choose and
replicate a shape with given scales to find the new side lengths, as well as both the perimeters and areas. Starting with simple shapes and whole-number side lengths allows all students access
to discover and understand the relationships. An interesting discovery is the relationship of the
scale of the side lengths to the scale of the respective perimeters (same scale) and areas (scale squared). A sample recording sheet is shown.
Students should move on to drawing scaled figures on grid paper with proper figure labels, scale and dimensions. Provide word problems that require finding missing side lengths, perimeters or
areas. For example, if a 4 by 4.5 cm rectangle is enlarged by a scale of 3, what will be the new
perimeter? What is the new area? or If the scale is 6, what will the new side length look like? or Suppose the area of one triangle is 16 sq units and the scale factor between this triangle and a
new triangle is 2.5. What is the area of the new triangle?
Reading scales on maps and determining the actual distance (length) is an appropriate contextual
situation. Constructions facilitate understanding of geometry. Provide opportunities for students to
physically construct triangles with straws, sticks, or geometry apps prior to using rulers and
protractors to discover and justify the side and angle conditions that will form triangles. Explorations should involve giving students: three side measures, three angle measures, two side
measures and an included angle measure, and two angles and an included side measure to
determine if a unique triangle, no triangle or an infinite set of triangles results. Through discussion of their exploration results, students should conclude that triangles cannot be formed
by any three arbitrary side or angle measures. They may realize that for a triangle to result the
sum of any two side lengths must be greater than the third side length, or the sum of the three
angles must equal 180 degrees. Students should be able to transfer from these explorations to reviewing measures of three side lengths or three angle measures and determining if they are
from a triangle justifying their conclusions with both sketches and reasoning.
This cluster is related to the following Grade 7 cluster “Solve real-life and mathematical problems involving angle measure, area, surface area, and volume.” Further construction work can be
replicated with quadrilaterals, determining the angle sum, noticing the variety of polygons that
can be created with the same side lengths but different angle measures, and ultimately generalizing a method for finding the angle sums for regular polygons and the measures of
individual angles. For example, subdividing a polygon into triangles using a vertex (N-2)180° or
subdividing a polygons into triangles using an interior point 180°N - 360° where N = the number
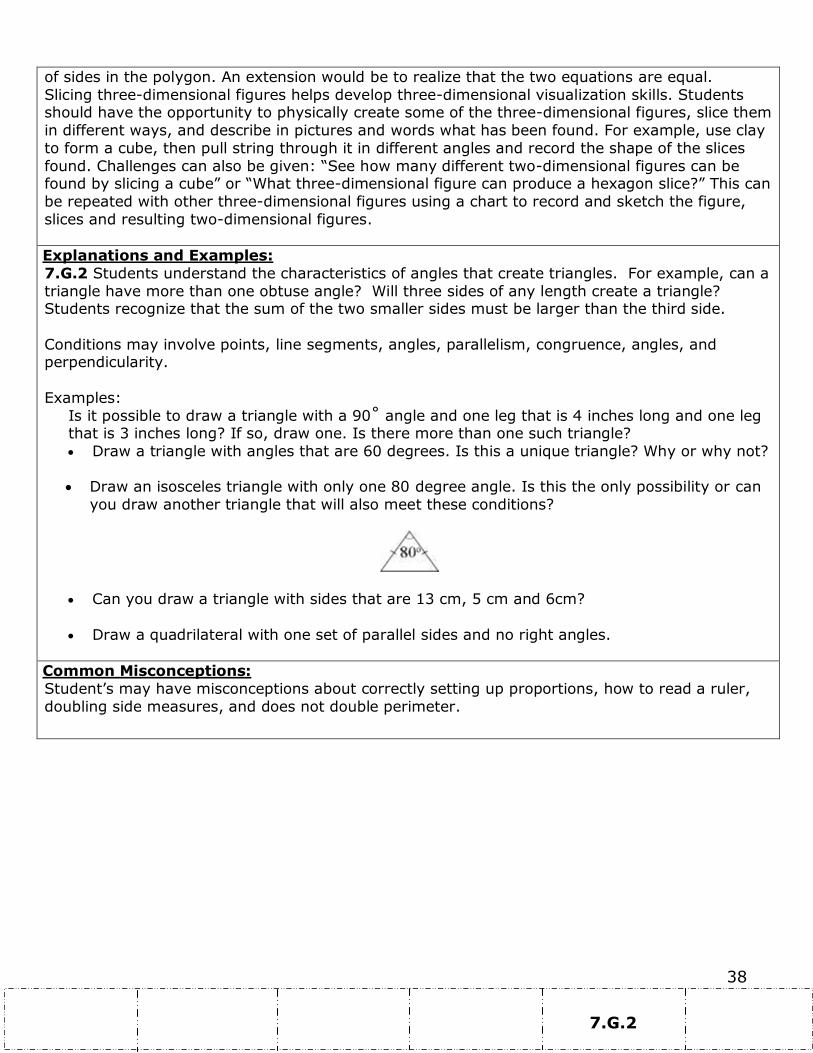
38
of sides in the polygon. An extension would be to realize that the two equations are equal.
Slicing three-dimensional figures helps develop three-dimensional visualization skills. Students should have the opportunity to physically create some of the three-dimensional figures, slice them
in different ways, and describe in pictures and words what has been found. For example, use clay
to form a cube, then pull string through it in different angles and record the shape of the slices
found. Challenges can also be given: “See how many different two-dimensional figures can be found by slicing a cube” or “What three-dimensional figure can produce a hexagon slice?” This can
be repeated with other three-dimensional figures using a chart to record and sketch the figure,
slices and resulting two-dimensional figures.
Explanations and Examples:
7.G.2 Students understand the characteristics of angles that create triangles. For example, can a
triangle have more than one obtuse angle? Will three sides of any length create a triangle? Students recognize that the sum of the two smaller sides must be larger than the third side.
Conditions may involve points, line segments, angles, parallelism, congruence, angles, and perpendicularity.
Examples:
Is it possible to draw a triangle with a 90˚ angle and one leg that is 4 inches long and one leg that is 3 inches long? If so, draw one. Is there more than one such triangle?
Draw a triangle with angles that are 60 degrees. Is this a unique triangle? Why or why not?
Draw an isosceles triangle with only one 80 degree angle. Is this the only possibility or can
you draw another triangle that will also meet these conditions?
Can you draw a triangle with sides that are 13 cm, 5 cm and 6cm?
Draw a quadrilateral with one set of parallel sides and no right angles.
Common Misconceptions:
Student’s may have misconceptions about correctly setting up proportions, how to read a ruler,
doubling side measures, and does not double perimeter.
7.G.2

39
Domain: Geometry
Cluster: Draw, construct, and describe geometrical figures and describe the relationships between them. Mathematically proficient students communicate precisely by engaging in discussion about their reasoning using
appropriate mathematical language. The terms students should learn to use with increasing precision with this cluster are:
scale drawing, dimensions, scale factor, plane sections, right
rectangular prism, right rectangular pyramids, parallel, perpendicular
Standard: 7.G.3. Describe the two-dimensional figures that result from slicing three dimensional figures, as in plane
sections of right rectangular prisms and right rectangular pyramids
Standards for Mathematical Practice (MP):
MP.1. Make sense of problems and persevere in solving them. MP.2. Reason abstractly and quantitatively. MP.3. Construct viable arguments and critique the reasoning of others. MP.4. Model with mathematics. MP.5. Use appropriate tools strategically. MP.6. Attend to precision. MP.7. Look for and make use of structure. MP.8. Look for and express regularity in repeated reasoning.
Connections: Connections should be made between this cluster and the Grade 7 Geometry Solve real-life and mathematical problems involving angle measure, area, surface area, and volume. (7.G.4-6). Grades 6 and 7: Ratios and Proportional Relationships This cluster leads to the development of the triangle congruence criteria in Grade 8.
Explanations and Examples: Instructional Strategies 7.G.3 Students need to describe the resulting face shape from cuts made parallel and perpendicular to the bases of right
rectangular prisms and pyramids. Cuts made parallel will take the shape of the base; cuts made perpendicular will take the shape of the lateral (side) face. Cuts made at an angle through the right rectangular prism will produce a parallelogram;
If the pyramid is cut with a plane (green) parallel to the base, the intersection of the pyramid and the plane is a square cross section (red).
If the pyramid is cut with a plane (green) passing through the op vertex and perpendicular to the base, the intersection of the
pyramid and the plane is a triangular cross section (red).
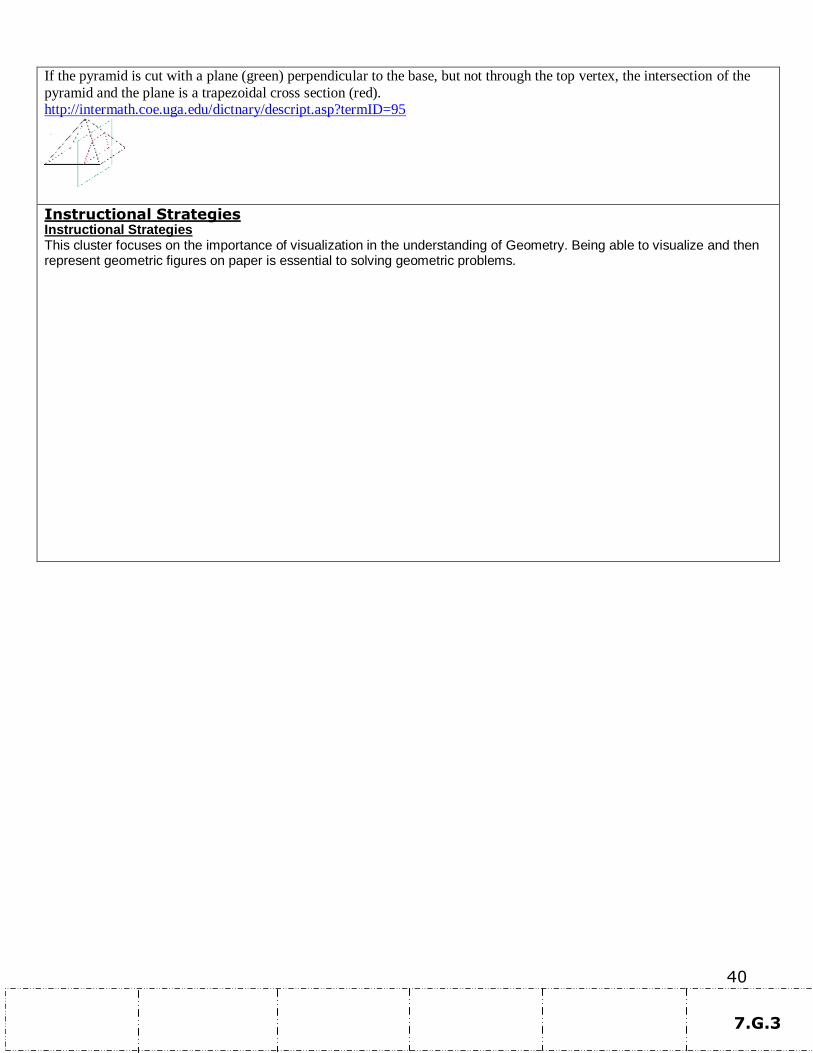
40
If the pyramid is cut with a plane (green) perpendicular to the base, but not through the top vertex, the intersection of the
pyramid and the plane is a trapezoidal cross section (red). http://intermath.coe.uga.edu/dictnary/descript.asp?termID=95
Instructional Strategies Instructional Strategies This cluster focuses on the importance of visualization in the understanding of Geometry. Being able to visualize and then represent geometric figures on paper is essential to solving geometric problems.
7.G.3

41
Domain: Geometry
Cluster: Solve real-life and mathematical problems involving angle measure, area, surface area,
and volume.
Standard: 7.G.4. Know the formulas for the area and circumference of a circle and solve
problems; give an informal derivation of the relationship between the circumference and area of a
circle.
Standards for Mathematical Practice (MP): MP.1. Make sense of problems and persevere in solving them. MP.2. Reason abstractly and quantitatively. MP.3. Construct viable arguments and critique the reasoning of others. MP.4. Model with mathematics.
MP.5. Use appropriate tools strategically. MP.6. Attend to precision. MP.7. Look for and make use of structure. MP.8. Look for and express regularity in repeated reasoning.
Connections:
This cluster is connected to the Grade 7 Critical Area of Focus #3, Solving problems involving scale drawings and informal geometric constructions, and working with two- and three-
dimensional shapes to solve problems involving area, surface area, and volume. This
cluster builds from understandings of Geometry and in Measurement and Data Grades 3-6. It also utilizes the scope of the number system experienced thus far and begins the formal use of
equations, formulas and variables in representing and solving mathematical situations.
Instructional Strategies This is the students’ initial work with circles. Knowing that a circle is created by connecting all the points equidistant from a point (center) is essential to understanding the relationships between radius, diameter, circumference, pi and area. Students can observe this by folding a paper plate several times, finding the center at the intersection, then measuring the lengths between the center and several points on the circle, the radius. Measuring the folds through the center, or diameters leads to the realization that a diameter is two times a radius. Given multiple-size circles, students should then explore the relationship between the radius and the length measure of the circle (circumference) finding an approximation of pi and ultimately
deriving a formula for circumference. String or yarn laid over the circle and compared to a ruler is an adequate estimate of the circumference. This same process can be followed in finding the relationship between the diameter and the area of a circle by using grid paper to estimate the area. Another visual for understanding the area of a circle can be modeled by cutting up a paper plate into 16 pieces along diameters and reshaping the pieces into a parallelogram. In figuring area of a circle, the squaring of the radius can also be explained by showing a circle inside a square. Again, the formula is derived and then learned. After explorations, students should then solve problems, set in relevant contexts,
using the formulas for area and circumference. In previous grades, students have studied angles by type according to size: acute, obtuse and right, and their role as an attribute in polygons. Now angles are considered based upon the special relationships that exist among them: supplementary, complementary, vertical and adjacent angles. Provide students the opportunities to explore these relationships first through measuring and finding the patterns among the angles of intersecting lines or within polygons, then utilize the relationships to write and solve equations for multi-step problems.
Real-world and mathematical multi-step problems that require finding area, perimeter, volume, surface area of figures composed of triangles, quadrilaterals, polygons, cubes and right prisms should reflect situations relevant to seventh graders. The computations should make use of formulas and involve whole numbers, fractions, decimals, ratios and various units of measure with same system conversions.

42
Instructional Resources/Tools
circular objects of several different sizes string or yarn
tape measures, rulers
grid paper
paper plates NCTM Illuminations
Explanations and Examples:
7.G.4 Students understand the relationship between radius and diameter. Students also understand the ratio of circumference to diameter can be expressed as Pi. Building on these
understandings, students generate the formulas for circumference and area.
The illustration shows the relationship between the circumference and area. If a circle is cut into wedges and laid out as shown, a parallelogram results. Half of an end wedge can be moved to
the other end a rectangle results. The height of the rectangle is the same as the radius of the
circle. The base length is 1 2 the circumference (2∏r). The area of the rectangle (and therefore the circle) is found by the
following calculations:
Area= Base x Height Area = ½ (2∏r) x r
Area = ∏r x r
Area = ∏r2
http://mathworld.wolfram.com/Circle.html
Students solve problems (mathematical and real-world) including finding the area of left-over
materials when circles are cut from squares and triangles or from cutting squares and triangles
from circles. “Know the formula” does not mean memorization of the formula. To “know” means to have an
understanding of why the formula works and how the formula relates to the measure (area and
circumference) and the figure. This understanding should be for all students.
Examples:
The seventh grade class is building a mini golf game for the school carnival. The end of the putting green will be a circle. If the circle is 10 feet in diameter, how many square feet of
grass carpet will they need to buy to cover the circle? How might you communicate this
information to the salesperson to make sure you receive a piece of carpet that is the
correct size?
Students measure the circumference and diameter of several circular objects in the room
(clock, trash can, door knob, wheel, etc.). Students organize their information and discover the relationship between circumference and diameter by noticing the pattern in the ratio of
the measures. Students write an expression that could be used to find the circumference of
a circle with any diameter and check their expression on other circles.
Students will use a circle as a model to make several equal parts as you would in a pie
model. The greater number the cuts, the better. The pie pieces are laid out to form a shape
similar to a parallelogram. Students will then write an expression for the area of the

43
parallelogram related to the radius (note: the length of the base of the parallelogram is half
the circumference, or πr, and the height is r, resulting in an area of πr2. Extension: If
students are given the circumference of a
circle, could they write a formula to determine
the circle’s area or given the area of a circle, could they write the formula for the
circumference?
Common Misconceptions:
Students may believe: Pi is an exact number rather than understanding that 3.14 is just an approximation of pi.
Many students are confused when dealing with circumference (linear measurement) and area.
This confusion is about an attribute that is measured using linear units (surrounding) vs. an attribute that is measured using area units (covering).
7.G.4

44
Domain: Geometry
Cluster: Solve real-life and mathematical problems involving angle measure, area, surface area,
and volume.
Standard: 7.G.5. Use facts about supplementary, complementary, vertical, and adjacent angles in
a multi-step problem to write and solve simple equations for an unknown angle in a figure.
Standards for Mathematical Practice (MP): MP.3. Construct viable arguments and critique the reasoning of others. MP.4. Model with mathematics.
MP.5. Use appropriate tools strategically. MP.6. Attend to precision. MP.7. Look for and make use of structure.
Connections:
This cluster is connected to the Grade 7 Critical Area of Focus #3, Solving problems involving scale drawings and informal geometric constructions, and working with two- and three-
dimensional shapes to solve problems involving area, surface area, and volume. This
cluster builds from understandings of Geometry and in Measurement and Data Grades 3-6. It also
utilizes the scope of the number system experienced thus far and begins the formal use of equations, formulas and variables in representing and solving mathematical situations.
Instructional Strategies
This is the students’ initial work with circles. Knowing that a circle is created by connecting all the points equidistant from a point (center) is essential to understanding the relationships between
radius, diameter, circumference, pi and area. Students can observe this by folding a paper plate
several times, finding the center at the intersection, then measuring the lengths between the
center and several points on the circle, the radius. Measuring the folds through the center, or diameters leads to the realization that a diameter is two times a radius. Given multiple-size
circles, students should then explore the relationship between the radius and the length measure
of the circle (circumference) finding an approximation of pi and ultimately deriving a formula for circumference. String or yarn laid over the circle and compared to a ruler is an adequate estimate
of the circumference. This same process can be followed in finding the relationship between the
diameter and the area of a circle by using grid paper to estimate the area. Another visual for understanding the area of a circle can be modeled by cutting up a paper plate
into 16 pieces along diameters and reshaping the pieces into a parallelogram. In figuring area of a
circle, the squaring of the radius can also be explained by showing a circle inside a square. Again,
the formula is derived and then learned. After explorations, students should then solve problems, set in relevant contexts, using the formulas for area and circumference.
In previous grades, students have studied angles by type according to size: acute, obtuse and
right, and their role as an attribute in polygons. Now angles are considered based upon the special relationships that exist among them: supplementary, complementary, vertical and
adjacent angles. Provide students the opportunities to explore these relationships first through
measuring and finding the patterns among the angles of intersecting lines or within polygons, then utilize the relationships to write and solve equations for multi-step problems.
Real-world and mathematical multi-step problems that require finding area, perimeter, volume,
surface area of figures composed of triangles, quadrilaterals, polygons, cubes and right prisms
should reflect situations relevant to seventh graders. The computations should make use of formulas and involve whole numbers, fractions, decimals, ratios and various units of measure with
same system conversions.

45
Instructional Resources/Tools
circular objects of several different sizes string or yarn
tape measures, rulers
grid paper
paper plates NCTM Illuminations
Explanations and Examples:
7.G.5 Students use understandings of angles to write and solve equations.
Angle relationships that can be explored include but are not limited to: Same-side (consecutive) interior and same-side (consecutive) exterior angles are
supplementary.
Examples:
Write and solve an equation to find the measure of angle x.
Write and solve an equation to find the measure of angle x.
Common Misconceptions: Students may believe:
Pi is an exact number rather than understanding that 3.14 is just an approximation of pi.
Many students are confused when dealing with circumference (linear measurement) and area.
This confusion is about an attribute that is measured using linear units (surrounding) vs. an attribute that is measured using area units (covering).
7.G.5

46
Domain: Geometry
Cluster: Solve real-life and mathematical problems involving angle measure, area, surface area, and volume.
Standard: 7.G.6. Solve real-world and mathematical problems involving area, volume and surface
area of two- and three-dimensional objects composed of triangles, quadrilaterals, polygons, cubes, and right prisms.
Standards for Mathematical Practice (MP): MP.1. Make sense of problems and persevere in solving them. MP.2. Reason abstractly and quantitatively.
MP.3. Construct viable arguments and critique the reasoning of others. MP.4. Model with mathematics. MP.5. Use appropriate tools strategically. MP.6. Attend to precision. MP.7. Look for and make use of structure.
MP.8. Look for and express regularity in repeated reasoning.
Connections: This cluster is connected to the Grade 7 Critical Area of Focus #3, Solving problems involving scale
drawings and informal geometric constructions, and working with two- and three-dimensional shapes to solve problems involving area, surface area, and volume. This cluster builds from understandings of Geometry and in Measurement and Data Grades 3-6. It also utilizes the scope of the number system experienced thus far and begins the formal use of equations, formulas and variables in representing and solving mathematical situations.
Instructional Strategies This is the students’ initial work with circles. Knowing that a circle is created by connecting all the points equidistant from a point (center) is essential to understanding the relationships between radius, diameter, circumference, pi and area. Students can observe this by folding a paper plate several times, finding the center at the intersection, then measuring the lengths between the center and several points on the circle, the radius. Measuring the folds through the center, or diameters leads to the realization that a diameter is two times a radius. Given multiple-size circles, students should then explore the relationship between the radius and the length measure of the circle (circumference) finding an approximation of pi and ultimately
deriving a formula for circumference. String or yarn laid over the circle and compared to a ruler is an adequate estimate of the circumference. This same process can be followed in finding the relationship between the diameter and the area of a circle by using grid paper to estimate the area. Another visual for understanding the area of a circle can be modeled by cutting up a paper plate into 16 pieces along diameters and reshaping the pieces into a parallelogram. In figuring area of a circle, the squaring of the radius can also be explained by showing a circle inside a square. Again, the formula is derived and then learned. After explorations, students should then solve problems, set in relevant contexts, using the formulas for area and circumference. In previous grades, students have studied angles by type according to size: acute, obtuse and right, and their role as an attribute in polygons. Now angles are considered based upon the special relationships that exist among them: supplementary, complementary, vertical and adjacent angles. Provide students the opportunities to explore these relationships first through measuring and finding the patterns among the angles of intersecting lines or within polygons, then utilize the relationships to write and solve equations for
multi-step problems. Real-world and mathematical multi-step problems that require finding area, perimeter, volume, surface area of figures composed of triangles, quadrilaterals, polygons, cubes and right prisms should reflect situations relevant to seventh graders. The computations should make use of formulas and involve whole numbers, fractions, decimals, ratios and various units of measure with same system conversions.
Instructional Resources/Tools circular objects of several different sizes
string or yarn tape measures, rulers

47
grid paper paper plates NCTM Illuminations
Explanations and Examples:
7.G.6 Students continue work from 5th and 6th grade to work with area, volume and surface area of
two- dimensional and three-dimensional objects. (composite shapes) Students will not work with cylinders, as circles are not polygons. “Know the formula” does not mean memorization of the formula. To “know” means to have an understanding of why the formula works and how the formula relates to the measure (area and volume) and the figure. This understanding should be for all students.
Surface area formulas are not the expectation with this standard. Building on work with nets in the 6th grade, students should recognize that finding the area of each face of a three-dimensional figure and adding the areas will give the surface area. No nets will be given at this level. Students understanding of volume can be supported by focusing on the area of base times the height to calculate volume. Students understanding of surface area can be supported by focusing on the sum of the area of the faces. Nets can be used to evaluate surface area calculations. Examples:
Choose one of the figures shown below and write a step by step procedure for determining the area. Find another person that chose the same figure as you did. How are your procedures the same and different? Do they yield the same result?
A cereal box is a rectangular prism. What is the volume of the cereal box? What is the surface area of the cereal box? (Hint: Create a net of the cereal box and use the net to calculate the surface area.) Make a poster explaining your work to share with the class.
Find the area of a triangle with a base length of three units and a height of four units. Find the area of the trapezoid shown below using the formulas for rectangles and triangles.
Common Misconceptions: Students may believe: Pi is an exact number rather than understanding that 3.14 is just an approximation of pi. Many students are confused when dealing with circumference (linear measurement) and area. This confusion is about an attribute that is measured using linear units (surrounding) vs. an attribute that is measured using area units (covering).
12
7
3
7.G.6

48
Extended Standards: The Alternate Achievement Standards for Students With the Most Significant Cognitive Disabilities Non-Regulatory
Guidance states, “…materials should show a clear link to the content standards for the grade in which the student is enrolled, although the grade-level content may be reduced in complexity or modified to reflect pre-requisite skills.” Throughout the Standards descriptors such as, describe, count, identify, etc, should be interpreted to mean that the
students will be taught and tested according to their mode of communication. (NC DOE)
EXTENDED 7.G

49
Domain: Statistics and Probability (SP)
Cluster: Use random sampling to draw inferences about a population.
Standard: 7.SP.1. Understand that statistics can be used to gain information about a population by examining a sample of the population; generalizations about a population from a sample are valid only if
the sample is representative of that population. Understand that random sampling tends to produce representative samples and support valid inferences.
Standards for Mathematical Practice (MP): MP.3. Construct viable arguments and critique the reasoning of others. MP.6. Attend to precision.
Connections: This cluster is connected to the Grade 7 Critical Area of Focus #4, Drawing inferences about populations based on samples. Initial understanding of statistics, specifically variability and the measures of center and spread begins in Grade 6.
Instructional Strategies In Grade 6, students used measures of center and variability to describe data. Students continue to use this knowledge in Grade 7 as they use random samples to make predictions about an entire population and judge the possible discrepancies of the predictions. Providing opportunities for students to use real-life situations from science and social studies shows the purpose for using random sampling to make inferences about a population. Make available to students the tools needed to develop the skills and understandings required to produce a representative sample of the general population. One key element of a representative sample is understanding that a random sampling guarantees that each element of the population has an equal opportunity to be selected in the sample. Have students compare the random sample to population, asking questions like “Are all the elements of the entire population represented in the sample?” and “Are the
elements represented proportionally?” Students can then continue the process of analysis by determining the measures of center and variability to make inferences about the general population based on the analysis. Provide students with random samples from a population, including the statistical measures. Ask students guiding questions to help them make inferences from the sample.
Explanations and Examples:
7.SP.1 Students recognize that it is difficult to gather statistics on an entire population. Instead a random
sample can be representative of the total population and will generate valid results. Students use this information to draw inferences from data. A random sample must be used in conjunction with the population to get accuracy. For example, a random sample of elementary students cannot be used to give a survey about the prom. Example:
The school food service wants to increase the number of students who eat hot lunch in the cafeteria. The student council has been asked to conduct a survey of the student body to determine the students’ preferences for hot lunch. They have determined two ways to do the survey. The two methods are listed below. Identify the type of sampling used in each survey option. Which survey option should the student council use and why? 1. Write all of the students’ names on cards and pull them out in a draw to determine who will
complete the survey.
2. Survey the first 20 students that enter the lunch room.
Common Misconceptions: Students may believe: One random sample is not representative of the entire population. Many samples must be taken in order to make an inference that is valid. By comparing the results of one random sample with the results of multiple random samples, students can correct this misconception.
7.SP.1

50
Domain: Statistics and Probability
Cluster: Use random sampling to draw inferences about a population.
Standard: 7.SP.2. Use data from a random sample to draw inferences about a population with an unknown characteristic of interest. Generate multiple samples (or simulated samples) of the
same size to gauge the variation in estimates or predictions. For example, estimate the mean
word length in a book by randomly sampling words from the book; predict the winner of a school election based on randomly sampled survey data. Gauge how far off the estimate or prediction
might be.
Standards for Mathematical Practice (MP): MP.1. Make sense of problems and persevere in solving them. MP.2. Reason abstractly and quantitatively. MP.3. Construct viable arguments and critique the reasoning of others. MP.5. Use appropriate tools strategically. MP.6. Attend to precision. MP.7. Look for and make use of structure.
Connections: This cluster is connected to the Grade 7 Critical Area of Focus #4, Drawing inferences about
populations based on samples. Initial understanding of statistics, specifically variability and
the measures of center and spread begins in Grade 6.
Instructional Strategies
In Grade 6, students used measures of center and variability to describe data. Students continue
to use this knowledge in Grade 7 as they use random samples to make predictions about an
entire population and judge the possible discrepancies of the predictions. Providing opportunities for students to use real-life situations from science and social studies shows the purpose for using
random sampling to make inferences about a population.
Make available to students the tools needed to develop the skills and understandings required to produce a representative sample of the general population. One key element of a representative
sample is understanding that a random sampling guarantees that each element of the population
has an equal opportunity to be selected in the sample. Have students compare the random sample to population, asking questions like “Are all the elements of the entire population
represented in the sample?” and “Are the elements represented proportionally?” Students can
then continue the process of analysis by determining the measures of center and variability to
make inferences about the general population based on the analysis. Provide students with random samples from a population, including the statistical measures. Ask
students guiding questions to help them make inferences from the sample.
Explanations and Examples: 7.SP.2 Students collect and use multiple samples of data to answer question(s) about a population.
Issues of variation in the samples should be addressed. Example:
Below is the data collected from two random samples of 100 students regarding student’s school lunch preference. Make at least two inferences based on the results.
51
Common Misconceptions: Students may believe: One random sample is not representative of the entire population. Many samples must be taken in order to make an inference that is valid. By comparing the results of one random sample with the results of multiple random samples, students can correct this misconception.
7.SP.2

52
Domain: Statistics and Probability
Cluster: Use random sampling to draw inferences about a population.
Standard: 7.SP.3. Informally assess the degree of visual overlap of two numerical data
distributions with similar variabilities, measuring the difference between the centers by expressing
it as a multiple of a measure of variability. For example, the mean height of players on the basketball team is 10 cm greater than the mean height of players on the soccer team, about twice
the variability (mean absolute deviation) on either team; on a dot plot, the separation between
the two distributions of heights is noticeable.
Standards for Mathematical Practice (MP): MP.1. Make sense of problems and persevere in solving them. MP.2. Reason abstractly and quantitatively. MP.3. Construct viable arguments and critique the reasoning of others. MP.4. Model with mathematics.
MP.5. Use appropriate tools strategically. MP.6. Attend to precision. MP.7. Look for and make use of structure.
Connections:
This Cluster is connected to the Grade 7 Critical Area of Focus #4, Drawing inferences about
populations based on samples. Measures of center and variability are developed in Statistics and Probability Grade 6. This cluster expands standards 1 and 2 in Grade 7 to make inferences
between populations.
Instructional Strategies In Grade 6, students used measures of center and variability to describe sets of data. In the cluster “Use random sampling to draw inferences about a population” of Statistics and Probability in Grade 7, students learn to draw inferences about one population from a random sampling of that population. Students continue using these skills to draw informal comparative inferences about two populations. Provide opportunities for students to deal with small populations, determining measures of center and variability for each population. Then have students compare those measures and make inferences. The
use of graphical representations of the same data (Grade 6) provides another method for making comparisons. Students begin to develop understanding of the benefits of each method by analyzing data with both methods. When students study large populations, random sampling is used as a basis for the population inference. This build on the skill developed in the Grade 7 cluster “Use random sampling to draw inferences about a population” of Statistics and Probability. Measures of center and variability are used
to make inferences on each of the general populations. Then the students have make comparisons for the two populations based on those inferences. This is a great opportunity to have students examine how different inferences can be made based on the same two sets of data. Have students investigate how advertising agencies uses data to persuade customers to use their products. Additionally, provide students with two populations and have them use the data to persuade both sides of an argument.
Explanations and Examples: Students can readily find data as described in the example on sports team or college websites. Other
sources for data include American Fact Finder (Census Bureau), Fed Stats, Ecology Explorers, USGS, or CIA World Factbook. Researching data sets provides opportunities to connect mathematics to their interests and other academic subjects. Students can utilize statistic functions in graphing calculators or spreadsheets for calculations with larger data sets or to check their computations. Students calculate mean absolute deviations in preparation for later work with standard deviations.

53
Example: Jason wanted to compare the mean height of the players on his favorite basketball and soccer teams. He thinks the mean height of the players on the basketball team will be greater but doesn’t know how much greater. He also wonders if the variability of heights of the athletes is related to the sport they play. He thinks that there will be a greater variability in the heights of soccer players as compared to basketball players. He used the rosters and player statistics from the team websites to generate the
following lists. Basketball Team – Height of Players in inches for 2010-2011 Season 75, 73, 76, 78, 79, 78, 79, 81, 80, 82, 81, 84, 82, 84, 80, 84 Soccer Team – Height of Players in inches for 2010
73, 73, 73, 72, 69, 76, 72, 73, 74, 70, 65, 71, 74, 76, 70, 72, 71, 74, 71, 74, 73, 67, 70, 72, 69, 78, 73, 76, 69 To compare the data sets, Jason creates a two dot plots on the same scale. The shortest player is 65 inches and the tallest players are 84 inches.
In looking at the distribution of the data, Jason observes that there is some overlap between the two data sets. Some players on both teams have players between 73 and 78 inches tall. Jason decides to
use the mean and mean absolute deviation to compare the data sets. Jason sets up a table for each data set to help him with the calculations. The mean height of the basketball players is 79.75 inches as compared to the mean height of the soccer players at 72.07 inches, a difference of 7.68 inches.
The mean absolute deviation (MAD) is calculated by taking the mean of the absolute deviations for each data point. The difference between each data point and the mean is recorded in the second column of the table. Jason used rounded values (80 inches for the mean height of basketball players and 72 inches for the mean height of soccer players) to find the differences. The absolute deviation, absolute value of the deviation, is recorded in the third column. The absolute deviations are summed and divided by the number of data points in the set.
The mean absolute deviation is 2.14 inches for the basketball players and 2.53 for the soccer players. These values indicate moderate variation in both data sets. There is slightly more variability in the height of the soccer players. The difference between the heights of the teams is approximately 3 times the variability of the data sets (7.68 ÷ 2.53 = 3.04).

54
Soccer Players (n = 29) Basketball Players (n = 16)
Height (in) Deviation from Mean (in)
Absolute Deviation
(in)
Height (in) Deviation from Mean (in)
Absolute Deviation (in)
65 -7 7 73 -7 7
67 -5 5 75 -5 5
69 -3 3 76 -4 4
69 -3 3 78 -2 2
69 -3 3 78 -2 2
70 -2 2 79 -1 1
70 -2 2 79 -1 1
70 -2 2 80 0 0
71 -1 1 80 0 0
71 -1 1 81 1 1
71 -1 1 81 1 1
72 0 0 82 2 2
72 0 0 82 2 2
72 0 0 84 4 4
72 0 0 84 4 4
73 +1 1 84 4 4
73 +1 1
73 +1 1
73 +1 1
73 +1 1
73 +1 1
74 +2 2
74 +2 2
74 +2 2
74 +2 2
76 +4 4
76 +4 4
76 +4 4
78 +6 6
Σ = 2090 Σ = 62 Σ = 1276 Σ = 40
Mean = 2090 ÷ 29 =72 inches Mean = 1276 ÷ 16 =80 inches
MAD = 62 ÷ 29 = 2.13 inches MAD = 40 ÷ 16 = 2.5 inches
Common Misconceptions: Arizona, Ohio & NC DOE
7.SP.3

55
Domain: Statistics and Probability
Cluster: Draw informal comparative inferences about two populations.
Standard: 7.SP.4. Use measures of center and measures of variability for numerical data from
random samples to draw informal comparative inferences about two populations. For example,
decide whether the words in a chapter of a seventh-grade science book are generally longer than the words in a chapter of a fourth-grade science book.
Standards for Mathematical Practice (MP):
MP.1. Make sense of problems and persevere in solving them. MP.2. Reason abstractly and quantitatively. MP.3. Construct viable arguments and critique the reasoning of others. MP.4. Model with mathematics.
MP.5. Use appropriate tools strategically. MP.6. Attend to precision. MP.7. Look for and make use of structure.
Connections:
This Cluster is connected to the Grade 7 Critical Area of Focus #4, Drawing inferences about populations based on samples. Measures of center and variability are developed in Statistics
and Probability Grade 6. This cluster expands standards 1 and 2 in Grade 7 to make inferences
between populations.
Instructional Strategies
In Grade 6, students used measures of center and variability to describe sets of data. In the cluster “Use random sampling to draw inferences about a population” of Statistics and Probability
in Grade 7, students learn to draw inferences about one population from a random sampling of
that population. Students continue using these skills to draw informal comparative inferences about two populations.
Provide opportunities for students to deal with small populations, determining measures of center
and variability for each population. Then have students compare those measures and make
inferences. The use of graphical representations of the same data (Grade 6) provides another method for making comparisons. Students begin to develop understanding of the benefits of each
method by analyzing data with both methods.
When students study large populations, random sampling is used as a basis for the population inference. This build on the skill developed in the Grade 7 cluster “Use random sampling to draw
inferences about a population” of Statistics and Probability. Measures of center and variability are
used to make inferences on each of the general populations. Then the students have make comparisons for the two populations based on those inferences.
This is a great opportunity to have students examine how different inferences can be made based
on the same two sets of data. Have students investigate how advertising agencies uses data to
persuade customers to use their products. Additionally, provide students with two populations and have them use the data to persuade both sides of an argument.

56
Explanations and Examples:
7.SP.4 Students are expected to compare two sets of data using measures of center and variability.
Measures of center include mean, median, and mode. The measures of variability include range,
mean absolute deviation, and interquartile range.
Example:
The two data sets below depict random samples of the housing prices sold in the King River
and Toby Ranch areas of Arizona. Based on the prices below which measure of center will provide the most accurate estimation of housing prices in Arizona? Explain your reasoning.
o King River area {1.2 million, 242000, 265500, 140000, 281000, 265000, 211000}
o Toby Ranch homes {5million, 154000, 250000, 250000, 200000, 160000, 190000}
7.SP.4

57
Domain: Statistics and Probability
Cluster: Investigate chance processes and develop, use, and evaluate probability models.
Standard: 7.SP.5. Understand that the probability of a chance event is a number between 0 and
1 that expresses the likelihood of the event occurring. Larger numbers indicate greater likelihood.
A probability near 0 indicates an unlikely event, a probability around ½ indicates an event that is neither unlikely nor likely, and a probability near 1 indicates a likely event.
Standards for Mathematical Practice (MP):
MP.4. Model with mathematics.
MP.5. Use appropriate tools strategically. MP.6. Attend to precision. MP.7. Look for and make use of structure.
Connections: This cluster goes beyond the Grade 7 Critical Areas of Focus to address Investigating chance.
Ratio and Proportional Relationships in Grade 6 is the development of fractions as ratios and
percents as ratios. In Grade 7, students write the same number represented as a fraction,
decimal or percent. Random sampling and simulation are closely connected in Grade 7.SP. Random sampling and
simulation is used to determine the experimental probability of event occurring in a population or
to describe a population.
Instructional Strategies
Grade 7 is the introduction to the formal study of probability. Through multiple experiences,
students begin to understand the probability of chance (simple and compound), develop and use
sample spaces, compare experimental and theoretical probabilities, develop and use graphical organizers, and use information from simulations for predictions.
Help students understand the probability of chance is using the benchmarks of probability: 0, 1
and ½. Provide students with situations that have clearly defined probability of never happening as zero, always happening as 1 or equally likely to happen as to not happen as 1/2. Then advance
to situations in which the probability is somewhere between any two of these benchmark values.
This builds to the concept of expressing the probability as a number between 0 and 1. Use this to
build the understanding that the closer the probability is to 0, the more likely it will not happen, and the closer to 1, the more likely it will happen. Students learn to make predictions about the
relative frequency of an event by using simulations to collect, record, organize and analyze data.
Students also develop the understanding that the more the simulation for an event is repeated, the closer the experimental probability approaches the theoretical probability.
Have students develop probability models to be used to find the probability of events. Provide
students with models of equal outcomes and models of not equal outcomes are developed to be used in determining the probabilities of events.
Students should begin to expand the knowledge and understanding of the probability of simple
events, to find the probabilities of compound events by creating organized lists, tables and tree
diagrams. This helps students create a visual representation of the data; i.e., a sample space of the compound event. From each sample space, students determine the probability or fraction of
each possible outcome. Students continue to build on the use of simulations for simple
probabilities and now expand the simulation of compound probability. Providing opportunities for students to match situations and sample spaces assists students in
visualizing the sample spaces for situations.
Continued next page

58
Students often struggle making organized lists or trees for a situation in order to determine the
theoretical probability. Having students start with simpler situations that have fewer elements enables them to have successful experiences with organizing lists and trees diagrams. Ask guiding
questions to help students create methods for creating organized lists and trees for situations with
more elements.
Students often see skills of creating organized lists, tree diagrams, etc. as the end product. Provide students with experiences that require the use of these graphic organizers to determine
the theoretical probabilities. Have them practice making the connections between the process of
creating lists, tree diagrams, etc. and the interpretation of those models. Additionally, students often struggle when converting forms of probability from fractions to
percents and vice versa. To help students with the discussion of probability, don’t allow the
symbol manipulation/conversions to detract from the conversations. By having students use
technology such as a graphing calculator or computer software to simulate a situation and graph the results, the focus is on the interpretation of the data. Students then make predictions about
the general population based on these probabilities.
Explanations and Examples: 7.SP.5 This is students’ first formal introduction to probability. Students recognize that all
probabilities are between 0 and 1, inclusive, the sum of all possible outcomes is 1. For example,
there are three choices of jellybeans – grape, cherry and orange. If the probability of getting a
grape is 3 10 and the probability of getting cherry is 1 5, what is the probability of getting oranges? The probability of any single event can be recognized as a fraction. The closer the
fraction is to 1, the greater the probability the event will occur. Larger numbers indicate greater
likelihood. For example, if you have 10 oranges and 3 apples, you have a greater likelihood of getting an orange.
Probability can be expressed in terms such as impossible, unlikely, likely, or certain or as a number between 0 and 1 as illustrated on the number line. Students can use simulations such as
Marble Mania on AAAS or the Random Drawing Tool on NCTM’s Illuminations to generate data and
examine patterns.
Marble Mania http://www.sciencenetlinks.com/interactives/marble/marblemania.html
Random Drawing Tool - http://illuminations.nctm.org/activitydetail.aspx?id=67
Example:
A container contains 2 gray, 1 white, and 4 black marbles. Without looking, if you choose a
marble from the container, will the probability be closer to 0 or to 1 that you will select a white marble? A gray marble? A black marble? Justify each of your predictions.
Common Misconceptions:
Students often expect the theoretical and experimental probabilities of the same data to match. By providing multiple opportunities for students to experience simulations of situations in order to
find and compare the experimental probability to the theoretical probability, students discover
that rarely are those probabilities the same. Students often expect that simulations will result in all of the possibilities. All possibilities may
occur in a simulation, but
not necessarily. Theoretical probability does use all possibilities. Note examples in simulations
when some possibilities are not shown.
7.SP.5
59
Domain: Statistics and Probability
Cluster: Investigate chance processes and develop, use, and evaluate probability models.
Standard: 7.SP.6. Approximate the probability of a chance event by collecting data on the chance
process that produces it and observing its long-run relative frequency, and predict the
approximate relative frequency given the probability. For example, when rolling a number cube 600 times, predict that a 3 or 6 would be rolled roughly 200 times, but probably not exactly 200
times.
Standards for Mathematical Practice (MP):
MP.1. Make sense of problems and persevere in solving them. MP.2. Reason abstractly and quantitatively. MP.3. Construct viable arguments and critique the reasoning of others. MP.4. Model with mathematics. MP.5. Use appropriate tools strategically.
Connections: This cluster goes beyond the Grade 7 Critical Areas of Focus to address Investigating chance. Ratio and Proportional Relationships in Grade 6 is the development of fractions as ratios and percents as ratios. In Grade 7, students write the same number represented as a fraction, decimal or percent. Random sampling and simulation are closely connected in Grade 7.SP. Random sampling and
simulations are used to determine the experimental probability of event occurring in a population or to describe a population.
Instructional Strategies Grade 7 is the introduction to the formal study of probability. Through multiple experiences, students begin to understand the probability of chance (simple and compound), develop and use sample spaces, compare experimental and theoretical probabilities, develop and use graphical organizers, and use information from simulations for predictions. Help students understand the probability of chance is using the benchmarks of probability: 0, 1 and ½.
Provide students with situations that have clearly defined probability of never happening as zero, always happening as 1 or equally likely to happen as to not happen as 1/2. Then advance to situations in which the probability is somewhere between any two of these benchmark values. This builds to the concept of expressing the probability as a number between 0 and 1. Use this to build the understanding that the closer the probability is to 0, the more likely it will not happen, and the closer to 1, the more likely it will happen. Students learn to make predictions about the relative frequency of
an event by using simulations to collect, record, organize and analyze data. Students also develop the understanding that the more the simulation for an event is repeated, the closer the experimental probability approaches the theoretical probability. Have students develop probability models to be used to find the probability of events. Provide students with models of equal outcomes and models of not equal outcomes are developed to be used in determining the probabilities of events.
Students should begin to expand the knowledge and understanding of the probability of simple events, to find the probabilities of compound events by creating organized lists, tables and tree diagrams. This helps students create a visual representation of the data; i.e., a sample space of the compound event. From each sample space, students determine the probability or fraction of each possible outcome. Students continue to build on the use of simulations for simple probabilities and now expand the simulation of compound probability.
60
Providing opportunities for students to match situations and sample spaces assists students in visualizing the sample spaces for situations. Students often struggle making organized lists or trees for a situation in order to determine the
theoretical probability. Having students start with simpler situations that have fewer elements enables them to have successful experiences with organizing lists and trees diagrams. Ask guiding questions to help students create methods for creating organized lists and trees for situations with more elements. Students often see skills of creating organized lists, tree diagrams, etc. as the end product. Provide students with experiences that require the use of these graphic organizers to determine the theoretical probabilities. Have them practice making the connections between the process of creating lists, tree
diagrams, etc. and the interpretation of those models. Additionally, students often struggle when converting forms of probability from fractions to percents and vice versa. To help students with the discussion of probability, don’t allow the symbol manipulation/conversions to detract from the conversations. By having students use technology such as a graphing calculator or computer software to simulate a situation and graph the results, the focus is on the interpretation of the data. Students then make predictions about the general population
based on these probabilities.
Explanations and Examples:
7.SP.6 Students collect data from a probability experiment, recognizing that as the number of trials increase, the experimental probability approaches the theoretical probability. The focus of this standard is relative frequency --
The relative frequency is the observed number of successful events for a finite sample of trials. Relative frequency is the observed proportion of successful events. Students can collect data using physical objects or graphing calculator or web-based simulations. Students can perform experiments multiple times, pool data with other groups, or increase the number of trials in a simulation to look at the long-run relative frequencies.
Example: Each group receives a bag that contains 4 green marbles, 6 red marbles, and 10 blue marbles. Each group performs 50 pulls, recording the color of marble drawn and replacing the marble into the bag before the next draw. Students compile their data as a group and then as a class. They summarize their data as experimental probabilities and make conjectures about theoretical probabilities (How
many green draws would you expect if you were to conduct 1000 pulls? 10,000 pulls?). Students create another scenario with a different ratio of marbles in the bag and make a conjecture about the outcome of 50 marble pulls with replacement. (An example would be 3 green marbles, 6 blue marbles, and 3 blue marbles.)
Students try the experiment and compare their predictions to the experimental outcomes to continue to explore and refine conjectures about theoretical probability.
Common Misconceptions:
Students often expect the theoretical and experimental probabilities of the same data to match. By providing multiple opportunities for students to experience simulations of situations in order to
find and compare the experimental probability to the theoretical probability, students discover
that rarely are those probabilities the same. Students often expect that simulations will result in all of the possibilities. All possibilities may
occur in a simulation, but not necessarily. Theoretical probability does use all possibilities. Note
examples in simulations when some possibilities are not shown.
7.SP.6

61
Domain: Statistics and Probability
Cluster: Investigate chance processes and develop, use, and evaluate probability models.
Standard: 7.SP.7. Develop a probability model and use it to find probabilities of events. Compare probabilities from a model to observed frequencies; if the agreement is not good, explain possible sources of the discrepancy.
a. Develop a uniform probability model by assigning equal probability to all outcomes, and use the model to determine probabilities of events. For example, if a student is selected at random from a class, find the probability that Jane will be selected and the probability that a girl will be selected.
b. Develop a probability model (which may not be uniform) by observing frequencies in data generated from a chance process. For example, find the approximate probability that a spinning
penny will land heads up or that a tossed paper cup will land open-end down. Do the outcomes for the spinning penny appear to be equally likely based on the observed frequencies?
Standards for Mathematical Practice (MP): MP.1. Make sense of problems and persevere in solving them. MP.2. Reason abstractly and quantitatively. MP.3. Construct viable arguments and critique the reasoning of others. MP.4. Model with mathematics. MP.5. Use appropriate tools strategically.
MP.6. Attend to precision. MP.7. Look for and make use of structure. MP.8. Look for and express regularity in repeated reasoning.
Connections:
This cluster goes beyond the Grade 7 Critical Areas of Focus to address Investigating chance.
Ratio and Proportional Relationships in Grade 6 is the development of fractions as ratios and percents as ratios. In Grade 7, students write the same number represented as a fraction,
decimal or percent.
Random sampling and simulation are closely connected in Grade 7.SP. Random sampling and simulations are used to determine the experimental probability of event occurring in a population
or to describe a population.
Instructional Strategies Grade 7 is the introduction to the formal study of probability. Through multiple experiences, students begin to understand the probability of chance (simple and compound), develop and use sample spaces, compare experimental and theoretical probabilities, develop and use graphical organizers, and use information from simulations for predictions. Help students understand the probability of chance is using the benchmarks of probability: 0, 1 and ½. Provide students with situations that have clearly defined probability of never happening as zero,
always happening as 1 or equally likely to happen as to not happen as 1/2. Then advance to situations in which the probability is somewhere between any two of these benchmark values. This builds to the concept of expressing the probability as a number between 0 and 1. Use this to build the understanding that the closer the probability is to 0, the more likely it will not happen, and the closer to 1, the more likely it will happen. Students learn to make predictions about the relative frequency of an event by using simulations to collect, record, organize and analyze data. Students also develop the
understanding that the more the simulation for an event is repeated, the closer the experimental probability approaches the theoretical probability. Have students develop probability models to be used to find the probability of events. Provide students with models of equal outcomes and models of not equal outcomes are developed to be used in determining the probabilities of events. Students should begin to expand the knowledge and understanding of the probability of simple events,
to find the probabilities of compound events by creating organized lists, tables and tree diagrams. This helps students create a visual representation of the data; i.e., a sample space of the compound event.

62
From each sample space, students determine the probability or fraction of each possible outcome. Students continue to build on the use of simulations for simple probabilities and now expand the simulation of compound probability.
Providing opportunities for students to match situations and sample spaces assists students in visualizing the sample spaces for situations. Students often struggle making organized lists or trees for a situation in order to determine the theoretical probability. Having students start with simpler situations that have fewer elements enables them to have successful experiences with organizing lists and trees diagrams. Ask guiding questions to help students create methods for creating organized lists and trees for situations with more elements.
Students often see skills of creating organized lists, tree diagrams, etc. as the end product. Provide students with experiences that require the use of these graphic organizers to determine the theoretical probabilities. Have them practice making the connections between the process of creating lists, tree diagrams, etc. and the interpretation of those models. Additionally, students often struggle when converting forms of probability from fractions to percents and vice versa. To help students with the discussion of probability, don’t allow the symbol
manipulation/conversions to detract from the conversations. By having students use technology such as a graphing calculator or computer software to simulate a situation and graph the results, the focus is on the interpretation of the data. Students then make predictions about the general population based on these probabilities.
Explanations and Examples:
7.SP.7 Probabilities are useful for predicting what will happen over the long run. Using theoretical
probability, students predict frequencies of outcomes. Students recognize an appropriate design to conduct an experiment with simple probability events, understanding that the experimental data give realistic estimates of the probability of an event but are affected by sample size. Students need multiple opportunities to perform probability experiments and compare these results to theoretical probabilities. Critical components of the experiment process are making predictions about
the outcomes by applying the principles of theoretical probability, comparing the predictions to the outcomes of the experiments, and replicating the experiment to compare results. Experiments can be replicated by the same group or by compiling class data. Experiments can be conducted using various random generation devices including, but not limited to, bag pulls, spinners, number cubes, coin toss, and colored chips. Students can collect data using physical objects or graphing calculator or web-
based simulations. Students can also develop models for geometric probability (i.e. a target). Example:
If you choose a point in the square, what is the probability that it is not in the circle?
Common Misconceptions: Students often expect the theoretical and experimental probabilities of the same data to match. By providing multiple opportunities for students to experience simulations of situations in order to find and compare the experimental probability to the theoretical probability, students discover that rarely
are those probabilities the same. Students often expect that simulations will result in all of the possibilities. All possibilities may occur in a simulation, but not necessarily. Theoretical probability does use all possibilities. Note examples in simulations when some possibilities are not shown.
7.SP.7

63
Domain: Statistics and Probability
Cluster: Investigate chance processes and develop, use, and evaluate probability models.
Standard: 7.SP.8. Find probabilities of compound events using organized lists, tables, tree
diagrams, and simulation.
a. Understand that, just as with simple events, the probability of a compound event is the fraction of outcomes in the sample space for which the compound event occurs.
b. Represent sample spaces for compound events using methods such as organized lists, tables
and tree diagrams. For an event described in everyday language (e.g., “rolling double sixes”),
identify the outcomes in the sample space which compose the event. c. Design and use a simulation to generate frequencies for compound events. For example, use
random digits as a simulation tool to approximate the answer to the question: If 40% of
donors have type A blood, what is the probability that it will take at least 4 donors to find one with type A blood?
Standards for Mathematical Practice (MP): MP.1. Make sense of problems and persevere in solving them. MP.2. Reason abstractly and quantitatively. MP.4. Model with mathematics. MP.5. Use appropriate tools strategically. MP.7. Look for and make use of structure. MP.8. Look for and express regularity in repeated reasoning.
Connections: This cluster goes beyond the Grade 7 Critical Areas of Focus to address Investigating chance.
Ratio and Proportional Relationships in Grade 6 is the development of fractions as ratios and
percents as ratios. In Grade 7, students write the same number represented as a fraction, decimal or percent.
Random sampling and simulation are closely connected in Grade 7.SP. Random sampling and
simulations are used to determine the experimental probability of event occurring in a population
or to describe a population.
Instructional Strategies Grade 7 is the introduction to the formal study of probability. Through multiple experiences, students begin to understand the probability of chance (simple and compound), develop and use sample spaces, compare experimental and theoretical probabilities, develop and use graphical organizers, and
use information from simulations for predictions. Help students understand the probability of chance is using the benchmarks of probability: 0, 1 and ½. Provide students with situations that have clearly defined probability of never happening as zero, always happening as 1 or equally likely to happen as to not happen as 1/2. Then advance to situations in which the probability is somewhere between any two of these benchmark values. This builds to the concept of expressing the probability as a number between 0 and 1. Use this to build the
understanding that the closer the probability is to 0, the more likely it will not happen, and the closer to 1, the more likely it will happen. Students learn to make predictions about the relative frequency of an event by using simulations to collect, record, organize and analyze data. Students also develop the understanding that the more the simulation for an event is repeated, the closer the experimental probability approaches the theoretical probability. Have students develop probability models to be used to find the probability of events. Provide students
with models of equal outcomes and models of not equal outcomes are developed to be used in determining the probabilities of events. Students should begin to expand the knowledge and understanding of the probability of simple events, to find the probabilities of compound events by creating organized lists, tables and tree diagrams. This

64
helps students create a visual representation of the data; i.e., a sample space of the compound event. From each sample space, students determine the probability or fraction of each possible outcome. Students continue to build on the use of simulations for simple probabilities and now expand the
simulation of compound probability. Providing opportunities for students to match situations and sample spaces assists students in visualizing the sample spaces for situations. Students often struggle making organized lists or trees for a situation in order to determine the theoretical probability. Having students start with simpler situations that have fewer elements enables them to have successful experiences with organizing lists and trees diagrams. Ask guiding questions to
help students create methods for creating organized lists and trees for situations with more elements. Students often see skills of creating organized lists, tree diagrams, etc. as the end product. Provide students with experiences that require the use of these graphic organizers to determine the theoretical probabilities. Have them practice making the connections between the process of creating lists, tree diagrams, etc. and the interpretation of those models. Additionally, students often struggle when converting forms of probability from fractions to percents
and vice versa. To help students with the discussion of probability, don’t allow the symbol manipulation/conversions to detract from the conversations. By having students use technology such as a graphing calculator or computer software to simulate a situation and graph the results, the focus is on the interpretation of the data. Students then make predictions about the general population based on these probabilities.
Explanations and Examples: 7.SP.8 Students use tree diagrams, frequency tables, and organized lists, and simulations to
determine the probability of compound events. Probabilities are useful for predicting what will happen over the long run. Using theoretical probability, students predict frequencies of outcomes. Students recognize an appropriate design to conduct an
experiment with simple probability events, understanding that the experimental data give realistic estimates of the probability of an event but are affected by sample size. Examples:
Students conduct a bag pull experiment. A bag contains 5 marbles. There is one red marble,
two blue marbles and two purple marbles. Students will draw one marble without replacement and then draw another. What is the sample space for this situation? Explain how you determined the sample space and how you will use it to find the probability of drawing one blue marble followed by another blue marble.
Show all possible arrangements of the letters in the word FRED using a tree diagram. If each of
the letters is on a tile and drawn at random, what is the probability that you will draw the letters F-R-E-D in that order? What is the probability that your “word” will have an F as the first letter?

65
Common Misconceptions:
Students often expect the theoretical and experimental probabilities of the same data to match.
By providing multiple opportunities for students to experience simulations of situations in order to
find and compare the experimental probability to the theoretical probability, students discover that rarely are those probabilities the same.
Students often expect that simulations will result in all of the possibilities. All possibilities may
occur in a simulation, but not necessarily. Theoretical probability does use all possibilities. Note examples in simulations when some possibilities are not shown.
7.SP.8

66
Extended Standards: The Alternate Achievement Standards for Students With the Most Significant Cognitive Disabilities Non-Regulatory Guidance states, “…materials should show a clear link to the content standards for the grade in which the student is enrolled, although the grade-level content may be reduced in complexity or modified to reflect pre-requisite skills.” Throughout the Standards descriptors such as, describe, count, identify, etc, should be interpreted to mean that the students will be taught and tested according to their mode of communication.

67
EXTENDED 7.SP