7900 Gene Expression Workshop August09 - Garvan … · 2014-06-16 · Gene Expression Analysis...
19
Gene Expression Analysis using the Applied Biosystems 7900HT Fast Real-Time PCR System Lara Cullen PhD Scientific Applications Specialist Applied Biosystems Australia and New Zealand 2 August, 2009 © 2007 Applied Biosystems Gene Expression 7900HT 7900 Gene Expression Analysis Workshop Schedule: 2:00pm – 3:00pm Introduction to Real Time PCR TaqMan vs SYBR Green Absolute Quantitation vs Relative Quantitation - Measuring Reaction Efficiency - Choosing an Endogenous Control 3:00pm – 3:30pm Afternoon Tea Break 3:30pm – 4:30pm Software Training - SDS2.3 Software - RQ Manager 1.2 Software Data Analysis and Troubleshooting
Transcript of 7900 Gene Expression Workshop August09 - Garvan … · 2014-06-16 · Gene Expression Analysis...

Gene Expression Analysis using the Applied Biosystems 7900HT Fast Real-Time PCR System Lara Cullen PhD Scientific Applications SpecialistApplied Biosystems Australia and New Zealand
2 August, 2009 © 2007 Applied Biosystems Gene Expression 7900HT
7900 Gene Expression Analysis WorkshopSchedule:
2:00pm – 3:00pm Introduction to Real Time PCRTaqMan vs SYBR GreenAbsolute Quantitation vs Relative Quantitation
- Measuring Reaction Efficiency- Choosing an Endogenous Control
3:00pm – 3:30pm Afternoon Tea Break
3:30pm – 4:30pm Software Training - SDS2.3 Software- RQ Manager 1.2 Software
Data Analysis and Troubleshooting

3 August, 2009 © 2007 Applied Biosystems Gene Expression 7900HT
3 Phases of PCRExponential:• Exact doubling of product• Reaction is very precise
and specific
Linear:• The reaction components
are becoming limited• The reaction efficiency is
dropping
Plateau:• The reaction has stopped• No more products are
being made
High precision during exponential phase
Variable plateau phase
Somewhat variable linear phase
4 August, 2009 © 2007 Applied Biosystems Gene Expression 7900HT
● Automatic detection of PCR product as it is produced● Progress of the PCR is monitored in “real time”● Increase in fluorescent signal is proportional to the
amplification of the PCR product in the tube
What is Real-Time PCR?
Amplification plot is generated as PCR
reaction progresses and fluorescent signal
increases
5 August, 2009 © 2007 Applied Biosystems Gene Expression 7900HT
What is Real-Time PCR?● Reactions can be characterised by the point in time that
the PCR product is first detected● Cycle at which the reporter fluorescence reaches the
“Threshold” (Ct) used to compare samples
Rn
cycles
Threshhold
6 August, 2009 © 2007 Applied Biosystems Gene Expression 7900HT
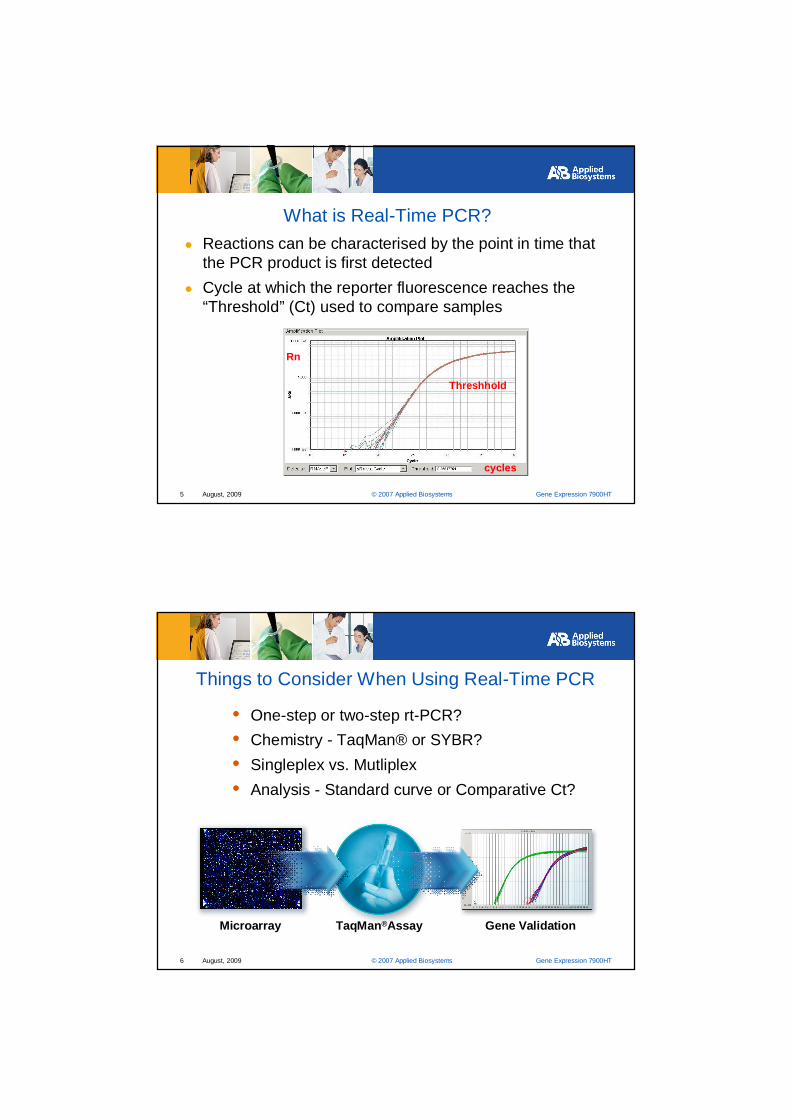
Gene ValidationTaqMan®AssayMicroarray
Things to Consider When Using Real-Time PCR
• One-step or two-step rt-PCR? • Chemistry - TaqMan® or SYBR?• Singleplex vs. Mutliplex• Analysis - Standard curve or Comparative Ct?

7 August, 2009 © 2007 Applied Biosystems Gene Expression 7900HT
Real Time PCR Chemistries
Intercalating dye chemistries
SYBR® Green I dye
5’-Nuclease AssaysTaqMan®
There are two commonly used but different approaches to generating a fluorescent signal during the PCR process
8 August, 2009 © 2007 Applied Biosystems Gene Expression 7900HT
• SYBR® Green I dye binds to the minor groove of ds DNA
• Detects both specific and non-specific PCR products
Signal Generation with SYBR® Green I dye

9 August, 2009 © 2007 Applied Biosystems Gene Expression 7900HT
SYBR® Green I Dye
Double Stranded DNA:Dye will fluoresce when bound to minor grove
Single Stranded DNA:No Signal
• SYBR green signal reports the accumulation of dsDNA in the PCR reaction• Cost effective for screening large numbers of genes• BUT will detect ANY dsDNA so target specificamplification needs to be verified by other means
10 August, 2009 © 2007 Applied Biosystems Gene Expression 7900HT
• Gel electrophoresis to determine PCR product sizeand ensure single band
• Melt Analysis to determine PCR product Tm (performed on the Real-Time PCR instrument).
Post PCR Specificity checkSYBR® Green I dye
178bpTm=77ºC

11 August, 2009 © 2007 Applied Biosystems Gene Expression 7900HT
Signal Generation with a TaqMan® Probe
The 5-Nuclease Assay
This method uses 2 principles:
1. FRET Technology2. 5- Nuclease Activity of Taq Polymerase
12 August, 2009 © 2007 Applied Biosystems Gene Expression 7900HT
Fluorescence Resonance Energy Transfer (FRET)
● Intact TaqMan probe does not fluoresce● FRET occurs as a result of proximity of 5’
Reporter and 3’ Quencher
R Q
5 Fluorescent Reporter Dye
3 Quencher
● Probe is cleaved by 5’ nuclease activity of Taq polymerase during amplification leading to increase in fluorescent signal

13 August, 2009 © 2007 Applied Biosystems Gene Expression 7900HT
TaqMan® (5’ nuclease) Assay
1. Polymerisation
R Qforward primer
reverse primer
3'
3'5'
5'3'5'
5'probe
R = ReporterQ = Quencher
RQ
3'
3'5'
5'3'5'
5'
2. Strand displacement
Q3'
3'5'
5'3'5'
5'
3. Cleavage
R
3'5'
5'3'5'
5'
4. Polymerisation completed
QR
3'
3'
14 August, 2009 © 2007 Applied Biosystems Gene Expression 7900HT
● Conventional TaqMan® probes– 5’ Fluorescent Reporter– 3’ TAMRA™ dye as quencher– Average length for Tm of 69ºC = 24 nucleotides
● TaqMan® MGB probes– MGB = minor groove-binder – Non fluorescent quencher (NFQ) – Average length for Tm of 69ºC = 16 nucleotides
Types of TaqMan® probes
R Q
MGBNFQR

15 August, 2009 © 2007 Applied Biosystems Gene Expression 7900HT
TaqMan® MGB Probes
● Minor Groove Binder increases the melting temperature of the probe resulting in shorter and more specific probes– Shorter probes provide increased specificity because even a single
base pair mismatch can impair probe binding– TaqMan® MGB probes provide excellent specificity even with A/T
rich sequences
MGBNFQR
: Fluorescent Reporter Dye
: Non-Fluorescent Quencher
: Minor Groove Binder (Tm Enhancer)
R
NFQ
MGB
16 August, 2009 © 2007 Applied Biosystems Gene Expression 7900HT
TaqMan assays – Available dyes enable multiplexing
TNF-, TGF-, TNF-and lymphotoxin-
amplifications (FAM™)in replicates of 5
18S ribosomal RNA endogenous control amplifications (VIC™) showing all 20 sample wells

17 August, 2009 © 2007 Applied Biosystems Gene Expression 7900HT
● Pre-optimised and guaranteed “Inventoried”and “Made to Order” Assays for:– Human (>197 000)– Mouse (>175 000) – Rat (>150 000) – Canine (>54 000) – Rhesus (>14 000) – Arabidopsis (>97 000) – C.elegans (>92 000)– Drosophila (>41 000)– Also now available for Horse, Cow, Chicken, Pig,
Rabbit, Zebrafish, Rice
TaqMan Gene Expression Assays (>1 Million Available)
18 August, 2009 © 2007 Applied Biosystems Gene Expression 7900HT
Hs = Homo sapiensRn = Rattus norvegicusMm = Mus musculusRh = Macaca mulatta (Rhesus monkey)At = Arabidopsis thalianaDm = Drosophila melanogasterCe = Caenorhabditis elegansCf = Canis lupus familiaris (dog)
Hs00373474_m1Prefix of the assay name indicates the species
Naming conventions for Available TaqMan Gene Expression Assays

19 August, 2009 © 2007 Applied Biosystems Gene Expression 7900HT
_gH
_sH
The assay was designed to a transcript belonging to a gene family with high sequence homology. The assay provides between 10 CT and 15 CT difference between the target gene and the gene with the closest sequence homology. This means that the assay will detect the target transcript with 1000 to 3000 fold greater discrimination (sensitivity) than the closest homologous transcript, if they are present at the same copy number in a sample.
_mH
The assay may detect genomic DNA._g
The assay’s primers and probe are designed within a single exon and will detect genomic DNA._s
The assay’s probe spans an exon junction and will not detect genomic DNA._m
DescriptionSuffix
Suffix of the assay name indicates the assay placementHs00373474_m1
Naming conventions for Available TaqMan Gene Expression Assays
20 August, 2009 © 2007 Applied Biosystems Gene Expression 7900HT
Absolute Quantitation
Relative Quantitation
Plus/minus Assays
Allelic DiscriminationEnd point
Quantitative “Real-Time”
Applications
--++++ ++

21 August, 2009 © 2007 Applied Biosystems Gene Expression 7900HT
Absolute Quantitation
● Real-Time Detection– Absolute Quantitation using standard curve – used to
determine the actual number of copies of a target nucleic acid within a sample with statistical confidence.
– Uses an External standard to provide quantitative measurement of the amount of a nucleic acid target• e.g. Detecting the amount of a virus or bacteria• e.g. Detecting human gDNA amounts for forensics purposes• Requires standards of known quantity e.g. ug, ng, pg, copy
number, cfu, pfu
22 August, 2009 © 2007 Applied Biosystems Gene Expression 7900HT
What is a Standard Curve?A dilution series of known amounts of material. Experimental samples are compared to the known standards for quantitation.
CtUnknown Ct=25.5
Amount in unknown
calculated by comparing to the standards
Quantity

23 August, 2009 © 2007 Applied Biosystems Gene Expression 7900HT
Absolute Quantitation using Standard Curve
● Can give accurate quantitation of unknown samples● No endogenous control assay required● Can compare results from different runs if the same
standards are used● Developing a appropriate standard and ensuring
consistency between runs can be difficult
24 August, 2009 © 2007 Applied Biosystems Gene Expression 7900HT
Relative Quantitation
● Real-Time Detection– Relative Quantitation – used to determine the fold
differences of a target nucleic acid in different samples with statistical confidence.
– Provides accurate discrimination between relative amounts of starting material
– e.g. Comparing expression levels of mRNA or microRNA targets across different tissues or between different biological conditions or treatment conditions
– e.g. validating gene knockdown using siRNA

25 August, 2009 © 2007 Applied Biosystems Gene Expression 7900HT
Relative Quantitation using Standard Curve• Requires an endogenous control gene that is expressed at a constant level in all samples
• Results generated are expressed relative to a calibrator sample as with Ct method
• Requires less validation and optimisation than Ct method• Different reaction efficiencies for different assays are OK since each assay has it’s own standard curve
• Standard curve must be created for each gene (can take up a lot of space on the plate)
26 August, 2009 © 2007 Applied Biosystems Gene Expression 7900HT
A control sample is diluted to generate a relative standard curve
for both target assay and endogenous control assay
Absolute quantity of the gene of interest or endogenous control gene in the control
sample is NOT known

27 August, 2009 © 2007 Applied Biosystems Gene Expression 7900HT
Relative Quantitation using Standard Curve
Results generated are expressed as fold change
with reference to a calibrator sample
28 August, 2009 © 2007 Applied Biosystems Gene Expression 7900HT
Relative Quantification – Ct Method• No standard curves required – makes the assumption that reaction efficiencies are similar and uses the Ct values directly for comparison
• Requires an endogenous control gene that is expressed at a constant level in all samples
• For accurate quantitation it’s important that the Reaction efficiencies of endogenous control and target assays are similar (+/- 10%)
• Requires more validation than relative quantitation using a standard curve

29 August, 2009 © 2007 Applied Biosystems Gene Expression 7900HT
Relative Quantification (Ct) What is Reaction Efficiency?
In theory during the exponential phase of a PCR each cycle leads to a doubling of the amount of target present
This is only true if the reaction is 100% efficient
A 100% efficient reaction will amplify a target 10-fold in 3.32 cycles
(ie. 2 3.32 = 10 = 100%)
If the reaction efficiency is less than 100% the amount of target will not double with each cycle
30 August, 2009 © 2007 Applied Biosystems Gene Expression 7900HT
Relative Quantification (Ct) Why is Reaction Efficiency Important?
If comparing between assays where reaction efficiency is significantly different, error increases with each cycle
making results inaccurate.
If you are using the Ct Method the Reaction efficiencies of target and endogenous control assays
should be +/- 10% of each otherIf not the relative standard curve method should be
used or the assays should be re-designed

31 August, 2009 © 2007 Applied Biosystems Gene Expression 7900HT
The reaction efficiency can be calculated from the slope of the standard curve:
(Reaction Efficiency) E = [10(-1/slope) –1] x 100So a slope of -3.32 indicates a 100% efficient reaction
Note: Standard curve should be over at least 5 logs to ensure accuracy and
reproducibility
32 August, 2009 © 2007 Applied Biosystems Gene Expression 7900HT
Calibrator = The sample used as the basis for comparative results
t =0 t=1 t=6 t=24time
Convert purified total RNA to cDNA
[GOI] [GOI][GOI][GOI][ENDO] [ENDO] [ENDO] [ENDO]
Control for sample variability
Relative Quantification – Ct Method

33 August, 2009 © 2007 Applied Biosystems Gene Expression 7900HT
IL-2 18S Ct Ct 2-Ct
T=0 (calibrator) 24 9 15 0 1.0T=1hr 24 10 14 -1 2.0T=6hr 23 11 12 -3 8.0T=24hr 28 10 18 3 0.125
ΔΔCt Calculations (Comparative Ct)
0
2
4
6
8
10
Rel
ativ
e Q
uant
ityof
Exp
ress
ion
2.0
8.0
1
t = 0t = 1 ht = 6 ht = 24 h0.125
34 August, 2009 © 2007 Applied Biosystems Gene Expression 7900HT
Standards vs. Comparative Ct
● Standard curve analysis allows for...√ ...a method to account for efficiency differences between assays√ ...a method to account for differences in analysis between platesX ...but it can take up excess room on the plate
● Comparative Ct analysis allows √ ...you to eliminate the need to run standard curves and saves
room on the plate to run more efficientlyX ...but it can suffer from variability due to efficiency and plate to
plate differences

35 August, 2009 © 2007 Applied Biosystems Gene Expression 7900HT
Endogenous Controls
All Relative quantitation (Ct and Std curve) requires an endogenous control or “housekeeping”gene to normalise for:
● The amount of RNA in the sample● The amount of cDNA made● Pipetting inaccuracy
Endogenous control should be:1. Present in all samples 2. Expressed at a constant level
36 August, 2009 © 2007 Applied Biosystems Gene Expression 7900HT
Commonly Used Endogenous Control genes:• 18S rRNA• GAPDH• B-actin• PGK• B2M etc……
Choosing an Endogenous Control Gene

37 August, 2009 © 2007 Applied Biosystems Gene Expression 7900HT
Choosing an Endogenous Control Gene
● Choose a gene that is expressed at a constant level in the starting material YOU will be using– THIS NEEDS TO BE VALIDATED
● Literature search● Determine experimentally● TaqMan® Endogenous Control Reagents
– Pre-optimized for immediate use
38 August, 2009 © 2007 Applied Biosystems Gene Expression 7900HT
Additional Reading and ResourcesReal Time PCR Systems Chemistry Guide
7900HT Fast Getting Started Guides• Absolute Quantitation using Standard Curve• Relative Quantification• Allelic Discrimination• Plus/Minus Assays• TaqMan® Array Micro Fluidic Cards User Guide• Maintenance and Troubleshooting Guide
www.appliedbiosystems.com.au
1800 636 327 (Aus) / 0800 636 327 (NZ)