70% to Zero What’s it going to take? Ruth C. Abbe HDR Engineering, Inc. October 19 th, 2009.
12
70% to Zero What’s it going to take? Ruth C. Abbe HDR Engineering, Inc. October 19 th , 2009
-
Upload
jayson-boone -
Category
Documents
-
view
213 -
download
0
Transcript of 70% to Zero What’s it going to take? Ruth C. Abbe HDR Engineering, Inc. October 19 th, 2009.

70% to Zero What’s it going to take?
Ruth C. AbbeHDR Engineering, Inc.
October 19th, 2009

What is “waste”?What is “waste”?
ProblemMaterials
23%
Recyclable Paperand Cardboard
18%
OtherRecyclableMaterials
21%
PotentiallyRecyclableMaterials
4%
CompostableMaterials
34%
Figures derived from Characterization of Municipal Solid Waste for the City of Los Angeles, Los Angeles Bureau of Sanitation, 2001
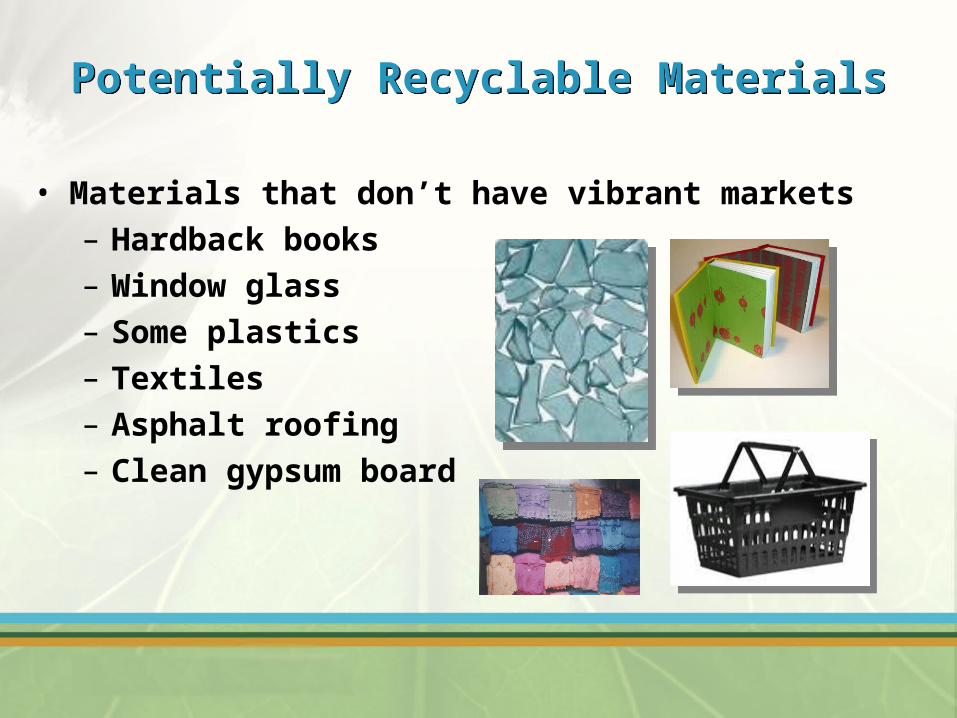
Potentially Recyclable MaterialsPotentially Recyclable Materials
• Materials that don’t have vibrant markets– Hardback books– Window glass– Some plastics– Textiles– Asphalt roofing– Clean gypsum board

Problem MaterialsProblem Materials
• Materials that don’t have markets– Composite materials (things stuck to other things)– Treated wood– Some plastics– Diapers– Hazardous materials and some electronics– Some plastic bags + films

What is Zero Waste?What is Zero Waste?
• Zero Waste
– Recognizes that “waste” is not inevitable
– Discarded materials are potentially valuable resources
– Goes beyond “end of pipe” strategies
– Maximizes recycling and composting
– Reduces consumption
– Designs “waste” out of the system

Zero WasteZero Waste
• Zero waste is a design framework for reducing generation of waste and maximizing diversion, not a strict tonnage goal.
• Zero waste is not a literal goal like “100 percent recycling”; we may always have some materials that cannot be recycled and cannot be designed out of the system.
• The vision of Zero waste is to strive for sustainability.

Pieces of ZeroPieces of Zero• Comprehensive recycling programs
– Multi-material– As convenient as trash– Available to all generators
• Organics diversion– Yard trimmings– Food scraps– Compostable paper
• C&D diversion– Generator-based– Hauler-based– Facility-based
• Zero Waste Policies– “New rules”– Disposal bans– Mandatory recycling– Product stewardship– Comprehensive outreach
and technical assistance• Zero Waste Infrastructure
– Neighborhood scale– Reuse and recycling– Materials recovery– C&D processing– Organics processing
• Residual Waste Management– New technologies– Residual waste processing

Upstream = 71 x Municipal Solid Waste
Upstream = 71 x Municipal Solid Waste

DownstreamDownstream
• Ensure the highest and best use of products and packaging at the end of their useful lives
• Reuse products and packaging, retaining their original form and function
• Recycle or compost materials that are not reduced or reused
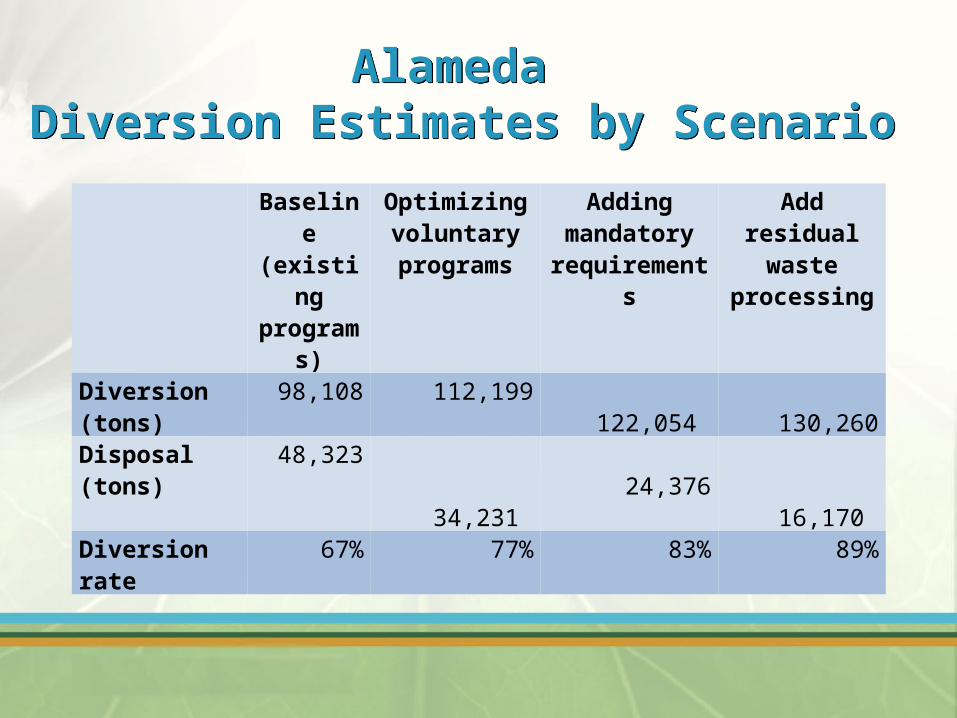
Alameda Diversion Estimates by Scenario
Alameda Diversion Estimates by Scenario
Baseline (existing
programs)
Optimizing voluntary programs
Adding mandatory
requirements
Add residual waste
processingDiversion (tons) 98,108 112,199 122,054 130,260
Disposal (tons) 48,323 34,231 24,376 16,170
Diversion rate 67% 77% 83% 89%

Palo Alto Zero Waste Operational Plan
Palo Alto Zero Waste Operational Plan
Year/Term 2004 2008Short Term
2011Mid Term
2021Long Term
Diversion Rate 62% 68% 77% 78 to 90%
Major additional programs and facilities
NA -Additional C&D debris diversion-Additional staff
resources
-New collection contract
-Universal roll-out
-Regional organics
processing-Regional C&D
debris processing
-Use of emerging technology or
other innovative approaches to
materials management
Estimated additional costs
NA $615,0001 $3,991,0002 not available
Approximate rate impact
NA 3%3 20%3 not available
1 Includes new staff at $450,000 and annual program costs of $165,0002 Assumes Net Compost Facility ,C&D Debris Facility and Recycling Drop-Off Center with HHW Facility costs projected to 2011 tonnage levels plus annual cost for new staff and programs 3Estimate based on Refuse Fund Customer Sales revenues of $20,641,339.50 for fiscal year 2005-2006

LA Policy, Program and Facility Phasing
LA Policy, Program and Facility Phasing
2013 2020 2025 2030
Initial
Voluntary Programs
Additional Voluntary plus
Mandatory Programs
Continue voluntary and mandatory programs
Continue voluntary and mandatory programs
Upstream Advocacy Resource Recovery Center
Continue upstream advocacy
Continue upstream advocacy
Compost facilities (residential)
Compost facilities (commercial)
-- --
1st black bin processing facility (residential)
2 more black bin processing facilities (residential and commercial)
2 more black bin processing facilities for commercial
2 more black bin processing facilities for commercial
70% 87% 90% 93%