Cross-Disciplinary Sciences at Gettysburg College: Second ...

97
7. Cross-disciplinary Issues
7.1 Internalization of External Diseconomy in Environmental Preservation
[Points]
• An economic approach for internalization of external diseconomy would help establish en-
vironmental preservation policies based on the market mechanism. OECD classifies these
measures into taxes and penalties, subsidies, emission trading, and deposit systems.
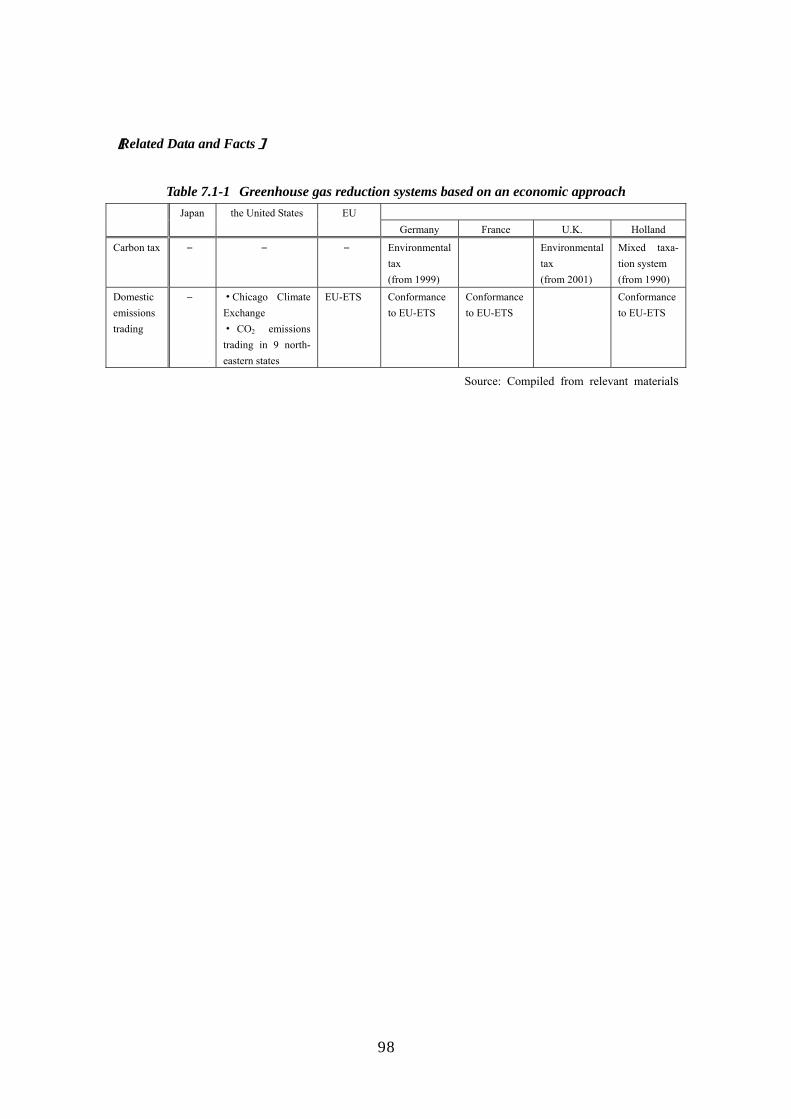
• Many European countries have introduced environmental tax (Table 7.1-1). Some estimates
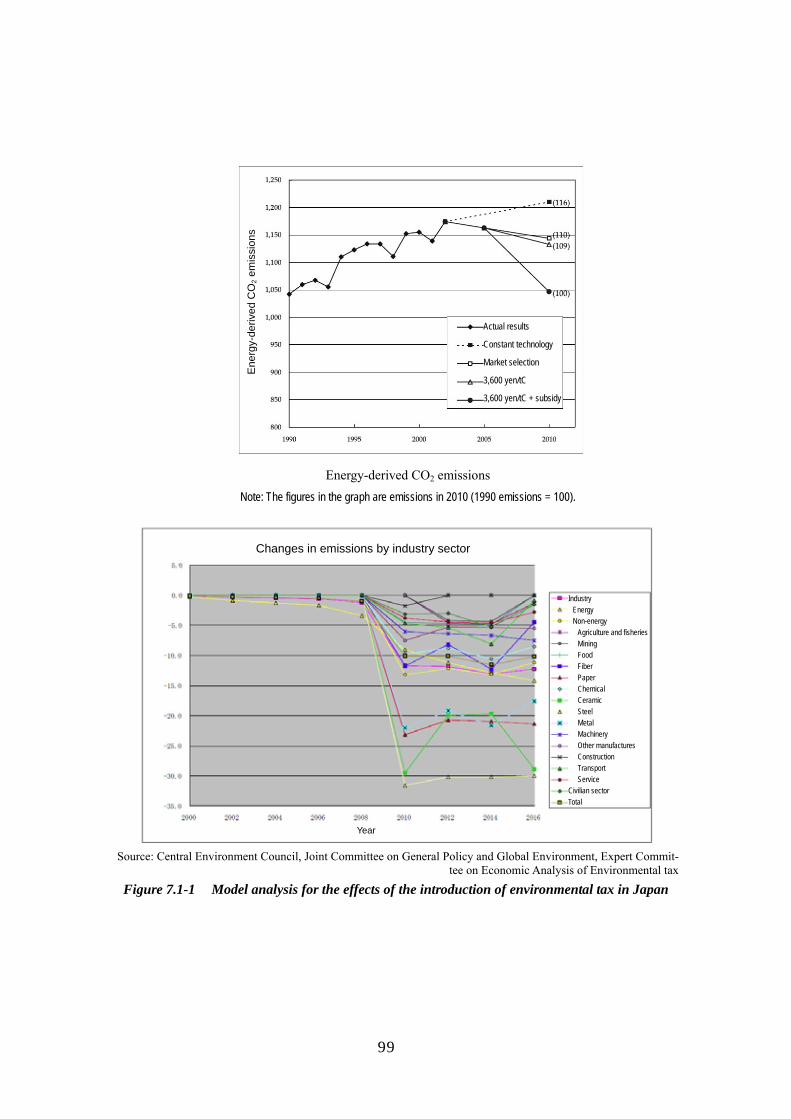
indicate that greenhouse gas reduction effects would be achieved at lower costs by spending
tax revenues on global warming measures (Figure 7.1-1). In Japan, however, there is strong
opposition in the industry to the introduction of environmental tax because manufactures
are already making all-out efforts toward the achievement of energy saving and greenhouse
gas emission reduction. Some studies conducted in Europe concerning environmental taxa-
tion policies point out that the environmental tax has only limited effects, as conventional
energy taxes have already declined price elasticity of energy and introduced environmental
taxes give favorable treatment to certain industry sectors (Table 7.1-2).
• Domestic emissions trading systems have been introduced into European countries and
some states of the United States (Table 7.1-1) and suggest greenhouse gas reductions
through effective market consolidation. At the same time, however, experts point out that
equitable burden allocation is hampered because emission rights were initially allocated in
an arbitrary manner (Table 7.1-3).
• While it is important to pay attention to the concept of internalization of external disecon-
omy, we should work out a system most suitable for each country by taking into account
such factors as the existing taxation system, the willingness of the people to accept a new
system, and movements in the industry.
98
[Related Data and Facts]
Table 7.1-1 Greenhouse gas reduction systems based on an economic approach Japan the United States EU
Germany France U.K. Holland
Carbon tax ― ― ― Environmental tax (from 1999)
Environmental tax (from 2001)
Mixed taxa-tion system (from 1990)
Domestic emissions trading
― ・ Chicago Climate Exchange ・ CO2 emissions trading in 9 north-eastern states
EU-ETS Conformance to EU-ETS
Conformance to EU-ETS
Conformance to EU-ETS
Source: Compiled from relevant materials
99
Source: Central Environment Council, Joint Committee on General Policy and Global Environment, Expert Commit-
tee on Economic Analysis of Environmental tax Figure 7.1-1 Model analysis for the effects of the introduction of environmental tax in Japan
Changes in emissions by industry sector
Industry Energy Non-energy
Agriculture and fisheries Mining Food Fiber Paper Chemical Ceramic Steel Metal Machinery Other manufactures Construction Transport Service
Civilian sector Total
Year
Ene
rgy-
deriv
ed C
O2 e
mis
sion
s
Actual results
Constant technology
Market selection
3,600 yen/tC
3,600 yen/tC + subsidy
Energy-derived CO2 emissions Note: The figures in the graph are emissions in 2010 (1990 emissions = 100).

100
Table 7.1-2 Posterior evaluation of the introduction of environmental tax in Sweden AUTHOR METHOD SECTOR MAIN CONCLUSION SOU 1989 Ex ante model simulations
using ENMARK and MARKAL.
All
CO2 taxes of SEK 250/ton along with amongst other things a sulfur tax lead to 10-20% lower CO2 emissions in the energy sector.
SOU 1991 Ex post/ex ante effect on production, production volume and regional em-ployment.
Industry A more uniform tax between coun-tries would be appropriate. Lowering Swedish industry's taxes would have a (global) environmental benefit. Removal of the tax on indus-try would generate 10,000 jobs.
The Swedish Environmental Protection Agency 1992
Ex ante model simulations using ENMARK and MARKAL.
All Limiting CO2 emissions in Sweden will be very expensive when nuclear power is phased out. Electricity im-ports can, however, reduce costs considerably.
NUTEK 1994 Ex post 1990-94 using the MARKAL model. Ex-ante 1994-2014.
All 3-5% lower emissions in 1994 com-pared to a situation using the 1990 instruments. In 2005, the emissions are 20% lower than with the 1994 instruments. Demand for new instruments after 2005.
Ministry of the Environment 1994
Ex post. Including inter-views with 50 district heating plants.
All
The tax has brought about a fuel change in the district heating sector. Administration costs have generally been low (SEK 3 million /year).
The Swedish Environmental Protection Agency 1995
Ex post. In-depth inter-views, telephone surveys and engineering calcula-tions.
The district heating, industry, service and household sectors.
1987-94, emissions in the sectors fell by 19%. 10% of this can be attributed to the CO2 tax.
Source: Part of the Table taken from Andersen, M.S. Dengsoe, N. and Pedersen, A.B. “An Assessment of the Impact of Green Taxes in the Nordic Countries”, 2000

101
Table 7.1-3 NAP for the 1st period in main EU countries
Country Determination of total allocable emissions Allocation among sectors Special allocation rule
U.K. ETS reduction effects com-bined with CCP*1 estimates
Calculated on the basis of the 2002 emissions and the CCP target, with residual emissions allocated to the power sector
CHP reserve quota imposed on new facilities
Germany Based on trends toward the Kyoto Protocol targets (*not linear trends)
Based on the 2000-2002 emis-sions. Allocated directly to equipment.
Equipment replacement during the applicable period is regarded as diversion, not abolition and new allocation. Posterior adjustment program established*2 No reduction requirement imposed on process emission Bonus emission quota for early action and cogeneration
France Specific emissions in 1998-2001 x the improvement rate x pro-duction volume *Low per capita emissions and low reducible emissions claimed
No reduction requirement imposed on process and waste-derived emissions Allocation to steelmaking facilities based on proposals from the industry
Italy Based on National Action Plan (PNR) *Emissions in 2010 failing to meet the Kyoto Protocol target
Based on the 2000 emissions. Future growth taken into ac-count.
Emission reserve quota for new facilities*3 set up by sector Allocation to the power industry determined in accordance with a plan
Netherland Middle value between the agreed-upon benchmark and an estimate by a research organization
Based on the 2000-2002 emis-sions. Future growth by sector taken into account. The reduc-tion rate depends on the exis-tence of any agreement. Allo-cated directly to equipment.
Allocation to the power industry based on a separate formula
Poland Based on the Kyoto Protocol target
Based on the 1999-2002 emis-sions (except for the year when the lowest emissions are re-corded). Future growth and future improvement in specific emissions taken into account.
Allocation to the power and cement industries based on a separate formula Bonus emission quota for early action and cogeneration
Slovakia Estimated national emissions multiplied by the ratio of the target equipment
Small equipment based on the 1998-2002 emissions. Future growth taken into account.
Allocation to large facilities determined case by case through negotiation
*1. CCP: Climate Change Program *2. The EU Committee has issued an order for modification. *3. Emission reserve quota for new facilities: Emission quota reserves for facilities that start operations
during the implementation period. *4. BAT: Best Available Technique
Source: The Institute of Energy Economics, Japan, “2004 Survey Report on Data, etc. Related to Global Warming Measures”

102
7.2 Introduction of Energy Technology Compatible with National Characteristics
[Points]
• Generally, development and introduction of new energy technology and system should be
based on the regional characteristics (e.g. percentage of heat demand, load factor, energy
trading with neighboring countries) and the regional needs. It should be noted that the
global introduction of uniform technologies or systems can cause inefficiency.
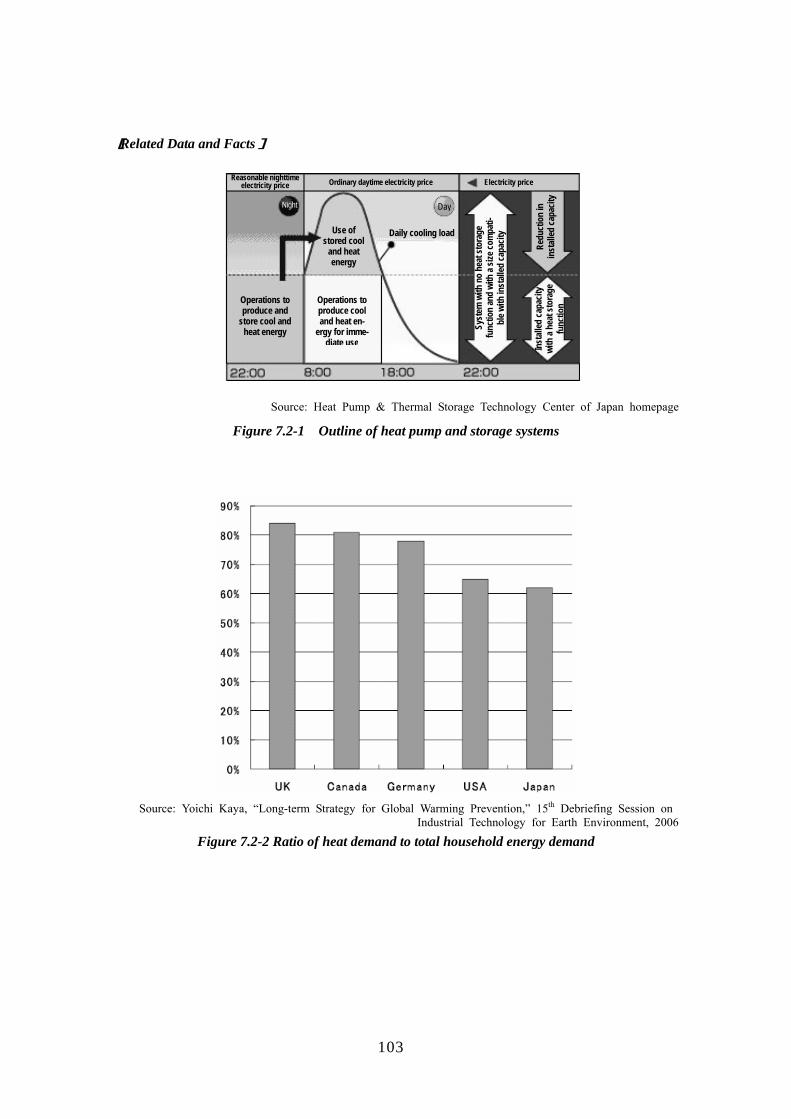
(Case 1) Heat pumps and storage system
In countries, like Japan, where large share of nuclear power exists for base load and
sharp demand appears during the daytime, significant CO2 reduction can be achieved
by introducing heat pump and storage systems which stores cooled water/ice using nu-
clear electricity during the night and consume it during peak hours (Figure 7.2-1).
However, heat pump and storage systems will not be so beneficial in countries where
there are less share of nuclear power and more moderate peak demand.
(Case 2) Cogeneration and district heating in cold regions
In regions where strong heat demand constantly prevails throughout the year (Figure
7.2-2), energy systems based on cogeneration and district heating can provide higher
energy efficiency. But these systems are not efficient in regions where there is less de-
mand for heating or hot water.
(Case 3) Geothermal heat utilization
If used in heat pump, geothermal energy is attractive because the use of ground heat
can reduce the release of waste heat into the air, thereby alleviating the heat island
phenomenon. However, ground heat is impractical in regions where the bedrock is too
weak for drilling heat holes or in residential areas which require excessively compli-
cated construction work. For these reasons, such the system should be applied to re-
gions where bedrocks are stable and construction work is relatively easy.
• Therefore, technology transfer to developing countries also should take their regional char-
acteristics and needs into account.
(Case 4) Introduction of distributed generation to unelectrified regions
The introduction of distributed generation to unelectrified regions would help improve
the public welfare of the community (Figure 7.2-3).
(Case 5) Introduction of conventional high-efficiency products to developing countries.
In developing countries, the mere replacement of incandescent lamps with fluorescent
lamps which are widely used in developed countries would have significant energy
saving effects (Table 7.2-1).
103
[Related Data and Facts]
Source: Heat Pump & Thermal Storage Technology Center of Japan homepage
Figure 7.2-1 Outline of heat pump and storage systems
Source: Yoichi Kaya, “Long-term Strategy for Global Warming Prevention,” 15th Debriefing Session on
Industrial Technology for Earth Environment, 2006
Figure 7.2-2 Ratio of heat demand to total household energy demand
Reasonable nighttimeelectricity price Ordinary daytime electricity price
Night
Operations to produce and
store cool and heat energy
Use of stored cool
and heat energy
Operations to produce cool and heat en-
ergy for imme-diate use
Day
Daily cooling load
Electricity price
Syst
em w
ith n
o he
at st
orag
e fu
nctio
n an
d wi
th a
size c
ompa
ti-bl
e with
inst
alled
capa
city
Redu
ctio
n in
in
stall
ed ca
pacit
y In
stall
ed ca
pacit
y wi
th a
heat
stor
age
func
tion

104
Source: NEDO
Figure 7.2-3 Community electrification project in Vietnam using solar power and small hydro-
power generation systems
Table 7.2-1 Energy-saving projects in developing countries <The Jakarta’s Hotel Energy Efficiency Project> Responsible organi-zation
Pelangi (non-government research organizations engaged in environmental issues). The project started in September 2005 under financial and technical aids from USAID.
Project details 1. Seminars targeted at equipment personnel from non-star hotels in the Jakarta regions 2. Energy-efficiency diagnosis of facilities by Indonesian consultants on a commission
basis 3. Seminars targeted at private businesses other than hotels (Device replacement may not be part of the project.)
<The Fluorescent Lamp Replacement Project> Responsible organi-zation
JBIC assistance is given to the Chinese government.
Project details 1. Incandescent lamps are replaced with more expensive but more energy-efficient fluores-cent lamps.
2. JBIC extends loans to the Chinese government to cover replacement costs. The govern-ment provides the proceeds for the project throughout its implementation period.
3. Buyers of fluorescent lamps receive a subsidy from government offices by showing them the purchase certificate.
4. Emission rights generated in the project will be purchased by Japanese businesses.
Source: Pelangi homepage, Nihon Keizai Shimbun
Contribution to community electrification in Vietnam and development of hybrid power generation technology using solar power and small hydropower generation systems
Background Community electrification in Vietnam
Japan’s problems with solar power generation
There are many unelectrified villages in Vietnam. The government is promoting the electrification of these communities.
The Vietnamese government employs small hydropower generation sys-tems using rich water resources widely available in the country. In the dry season, however, water levels decrease to obstruct the performance of these systems.
To enhance the electrification rate for small communities, the government needs to introduce new power generation systems compatible with the natural conditions of the country.
While having a promising future, solar power and small hydropower gen-eration systems are highly subject to weather conditions.
To solve this disadvantage, Japan needs to develop a hybrid method combining the solar and hydropower systems.
PPuurrppoossee Construction of a community electrifica-tion system in Vietnam
Vietnam is yet to utilize its abundant water resources for small hydropower generation.
Because the country is also rich in sunlight, it should develop a hybrid of solar power and small hydropower generation systems to compensate the disadvantages in each system.
To promote the introduction of renewable energy, we need to develop a stable hybrid of a solar power system and a small water hydrogenation system to offset the disadvantages of each system.
This project aims to establish an optimal operation control method for such a system.
This project aims to establish an optimal operation control process for the
hybrid system.
Introduction of a solar and small hydropower system
Vietnam has introduced a stand-alone hybrid of a solar power system (99.5 kW) and a small hydropower generation system using an induction generator. The hybrid system is connected to a newly built distribution line.
This system enables an economic and highly reliable system configura-tion and operation process, while achieving the following: • Economic efficiency: the optimization of accumulators and the meas-
urement of solar-hydro capacity balance. • Improved electric quality: the development of a voltage control system
and an inverter that operates interactively to control disruptions caused by an incoming current from the small hydropower system
Project outline • Counterparty
Vietnam Electricity Agency (EVN)
• Project site Gia Lai Province
• Project period 1997-2001
This project aims to simultaneously satisfy the needs of Vietnam and Japan for system development
Fulfillment of the Vietnamese needs
• The development of this demonstrative system using renewable energy will promote community electrification in Vietnam.
• The promotion of the use of renewable energy will encourage the implementa-tion of Vietnam’s environmental policy.
Fulfillment of the Japa-nese needs
• The deployment of this hybrid system in islands and other isolated commu-nities will accelerate the utilization of diversified power supplies and pro-mote the dissemination of solar energy generation systems.
Solution to Japan’s technological problems
Description
Outcome

105
7.3 Promotion of Energy Environment Education and Establishment of New Aca-demic Field and Academic Systems
[Points]
• Because energy and global warming issues involve several generations and thus require
mid- and long-term efforts, the education of younger generations in these issues is ex-
tremely important (Table 7.3-1). While such education is given in Japan as part of school
education and through NPO and other activities, there are yet few systematic programs ap-
plied in primary and secondary education concerning energy and global warming.
• Objective and well evidenced information and data should be disclosed and disseminated
widely to the whole nation through publicity activities to have people recognize the signifi-
cance of understanding and tackling energy and global warming issues. At the same time, it
is important to analyze current publicity activities and set up an effective publicity strategy.
• Energy and global warming problems require not only scientific and technical knowledge
but also studies on human aspects, including cultures and lifestyles. Because conventional
academic fields are unable to fully cope with these issues, we are urged to develop new
academic field and academic systems.
• In this respect, a report titled “Toward the Establishment of the Science of Energy,” released
in June 2000 by the Science Council of Japan’s Liaison Committee on Society, Industry and
Energy, stressed the importance of establishing the “Science of Energy,” a new academic
field to specialize in energy issues, reorganizing conventional concepts, and defining objec-
tives and academic principles. Meanwhile, the International Council for Science (ICSU) has
advocated the establishment of an energy research program that integrates human science,
social science, and natural science (Figure 7.3-1).
106
[Related Data and Facts]
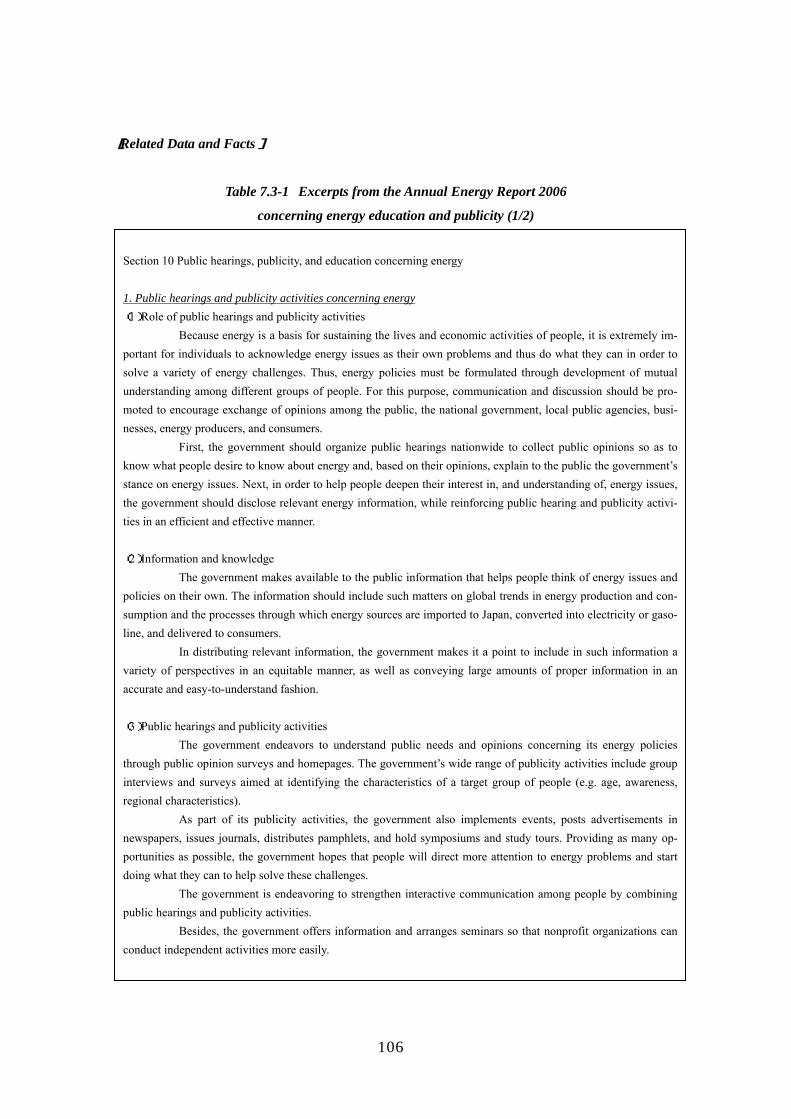
Table 7.3-1 Excerpts from the Annual Energy Report 2006
concerning energy education and publicity (1/2)
Section 10 Public hearings, publicity, and education concerning energy 1. Public hearings and publicity activities concerning energy (1)Role of public hearings and publicity activities
Because energy is a basis for sustaining the lives and economic activities of people, it is extremely im-portant for individuals to acknowledge energy issues as their own problems and thus do what they can in order to solve a variety of energy challenges. Thus, energy policies must be formulated through development of mutual understanding among different groups of people. For this purpose, communication and discussion should be pro-moted to encourage exchange of opinions among the public, the national government, local public agencies, busi-nesses, energy producers, and consumers.
First, the government should organize public hearings nationwide to collect public opinions so as to know what people desire to know about energy and, based on their opinions, explain to the public the government’s stance on energy issues. Next, in order to help people deepen their interest in, and understanding of, energy issues, the government should disclose relevant energy information, while reinforcing public hearing and publicity activi-ties in an efficient and effective manner. (2)Information and knowledge The government makes available to the public information that helps people think of energy issues and policies on their own. The information should include such matters on global trends in energy production and con-sumption and the processes through which energy sources are imported to Japan, converted into electricity or gaso-line, and delivered to consumers. In distributing relevant information, the government makes it a point to include in such information a variety of perspectives in an equitable manner, as well as conveying large amounts of proper information in an accurate and easy-to-understand fashion. (3)Public hearings and publicity activities The government endeavors to understand public needs and opinions concerning its energy policies through public opinion surveys and homepages. The government’s wide range of publicity activities include group interviews and surveys aimed at identifying the characteristics of a target group of people (e.g. age, awareness, regional characteristics). As part of its publicity activities, the government also implements events, posts advertisements in newspapers, issues journals, distributes pamphlets, and hold symposiums and study tours. Providing as many op-portunities as possible, the government hopes that people will direct more attention to energy problems and start doing what they can to help solve these challenges. The government is endeavoring to strengthen interactive communication among people by combining public hearings and publicity activities.
Besides, the government offers information and arranges seminars so that nonprofit organizations can conduct independent activities more easily.

107
Table 7.3-1 Excerpts from the Annual Energy Report 2006
concerning energy education and publicity (2/2)
Source: Ministry of Economy, Trade and Industry, Annual Energy Report 2006
Source: International Council for Science (ICSU) materials
Figure 7.3-1 Research program framework proposed by ICSU
Humanities
Social science
Natural science
Social Economic system
Energy tech-nology
Energy system
Energy and Culture
2. Energy education Today’s children and young students are entrusted with a significant mission of choosing suitable energy
sources, utilizing energy, and developing energy technology. In Japan, which lack in energy resources, it is our great challenge to help children acquire accurate scientific knowledge and deepen perspectives concerning situations revolving around energy issues. Even after school education, young people are desired to engage in energy-related activities as part of their lifelong learning. In primary and secondary school education, energy issues have been addressed at each grade in social studies and science classes. In new curriculums introduced into primary and junior high schools in 2002 and into senior high schools in 2003, improved content is given for social studies and science concerning energy. In “com-prehensive learning hours” introduced under the curriculum, students are expected to deepen their multidisciplinary understanding and learn problem-solving techniques with respect to energy and environmental problems specific to their community through practical experience and mission-oriented programs. In order to develop an environment in which children and students can receive energy education on their own initiative in and out of school activities, the government provides support programs for teaching staff and stu-dents, as well as for schools. In an effort to promote energy education, government agencies, educational organizations, and the in-dustry are jointly carrying out a wide range of activities, including the compilation of energy-related teaching mate-rials and the organization of energy facility tours.

108
7.4 Development of Energy Statistics
[Points]
• Energy and environmental policy planning requires accurate statistics of energy consump-
tion. Energy statistics provided to IEA from developed countries are now made available for
international comparison.
• In developing countries, relevant energy consumption figures are still to be developed
(Table 7.4-1), while available data are less reliable. Developed countries are prompted to
help developing countries enhance their technical abilities, including the development of
statistical specialists and sharing research know-how. IEA is building a database for energy
efficiency indexes and it is hoped that an effective statistical system will be formed to en-
able international comparison of data for the establishment of energy and environmental
policies in each country.
• For more effective comparison of data from different countries, the international community
is required to standardize the primary-energy conversion of hydro and nuclear generation
and the definitions of the lower and higher heating values and other parameters.

109
[Related Data and Facts]
Table 7.4-1 Original data for “Energy balances of non-OECD countries” Country Statistics China -Energy Balances of China, provided to the Secretariat by the State Statistical Bureau for 1990 to 2003.
India -Direct communication to the Secretariat from the Coal Controller’s Organisation of the Ministry of Coal-Energy Statistics 2000-2001 to 2003-2004, Central Statistical Organisation, Ministry of Statistics and Programme Implementation, 2002 to 2005. -Coal Directory of India, 1992-1993 to 2003-2004, Coal Controller's Organization, Ministry of Coal, Kolkata, 1994 to 2005. -Indian Petroleum and Natural Gas Statistics 2000-01 to 2003-04, Ministry of Petroleum and Natural Gas, New Delhi, 2002 to 2005. -Basic Statistics on Indian Petroleum and Natural Gas Statistics 2003-04, Ministry of Petroleum and Natural Gas, New Delhi, 2004. -All India Electricity Statistics General Review 1998-99, 2000-01 to 2003-04, Central Electricity Author-ity, Ministry of Power, New Delhi, 2000, 2002 to 2005. -Annual Review of Coal Statistics, various issues from 1993-1994 to 1998-1999, Coal Controller's Or-ganization, Ministry of Coal, Kolkata, 1995-2000. -Energy Data Directory, Yearbook "TEDDY", and Annual Report, Tata Energy Research Institute "TERI", New Delhi, 1986-1988, 1990, 1994-2000. -General Review, Public Electricity Supply, India Statistics, Central Electricity Authority, New Delhi, 1982 to 1985, 1995-1998, 2000-2004. -Monthly Abstract of Statistics, Ministry of Planning, Central Statistics Organisation, Department of Statistics, New Delhi, various editions from 1984 to March 1998, 1998-2000. Annual Report 1994-1996, 1998-1999, Ministry of Energy, Department of Non-Conventional Energy, New Delhi, 1996 and 1999. -Annual Report 1993-1994, 1998-1999, Ministry of Petroleum and Natural Gas, New Delhi, 1995, 2000.-General Review, Public Electricity Supply, India Statistics, Central Electricity Authority, New Delhi, 1982 to 1985, 1995-1998. -India’s Energy Sector, July 1995, Center for Monitoring Indian Economy PVT Ltd., Bombay, 1995. -Monthly Review of the Indian Economy, Center for Monitoring Indian Economy PVT Ltd., New Delhi, various issues from 1994 to June 1999.
Brazil Direct communication to the Secretariat from Ministério de Minas e Energia, Brasilia. Russia -UN ECE Questionnaire on Coal, 1992 to 2003.
-UN ECE Questionnaire on Natural Gas, 1991 to 2003. -UN ECE Questionnaire on Electricity and Heat, 1991 to 2003. -UN ECE Questionnaires on Oil, 1991 to 2003. -UN ECE Questionnaires on Renewable and Waste, 1991 to 2003. -Energy trade: Direct communication to the Secretariat from the State Committee of Statistics of Russia, July 1994. -Statistical Yearbook of Russia 1994. The State Committee of Statistics, Moscow, 1994. -The Russian Federation in 1992, Statistical Yearbook, The State Committee of Statistics of Russia, Moscow, 1993. -Russian Federation External Trade, annual and quarterly various editions, the State Committee of Statis-tics of Russia, Moscow. -Statistical Bulletin, various editions, The State Committee of Statistics of the CIS, Moscow, 1993, 1994.-Statistical Bulletin n° 3, The State Committee of Statistics of Russia, Moscow, 1992. -Fuel and Energy Balance of Russia 1990, The State Committee of Statistics of Russia, Moscow, 1991. -Energetika, Energo-Atomisdat, Moscow, 1981 to 1987.
Source: IEA “ENERGY BALANCES OF NON-OECD COUNTRIES 2002-2003”

110
7.5 Reinforcement of Climate Prediction and Observation Technology Systems
[Points]
• To mitigate the impact of climate change, it is indispensable to collect and distribute infor-
mation obtained by global observation, as the 2nd and 3rd IPCC assessment reports empha-
sized the importance of monitoring and analyzing abnormal climatic phenomena. In this
respect, Japan has contributed to earth observation in a various ways (Figure 7.5-1).
• The Evian G8 Summit leaders stressed the significance of earth observation aimed at both
environmental conservation and economic development. In response to the Summit state-
ment, the countries agreed to hold a global observation summit to discuss the establishment
of a global observation system by stepping up international cooperation.
• A related project is already in progress under the initiative of Asia-Pacific Network for
Global Change Research (APN) to improve monitoring and analytic techniques for climatic
data collected from developing countries, as well as from developed countries. Acid Depo-
sition Monitoring Network in East Asia (EANET), a Japan-led project, aims to tackle acid
rain problems in the East Asia regions (Figure 7.5-2).
• The international community is required to strengthen its efforts to improve the climatic
prediction and monitoring systems.
[Related Data and Facts]
Source: the 36th session of Council for Science and Technology Policy
Figure 7.5-1 Japan’s contribution to earth observation activities
• Reinforcing monitoring activities in Asia, Oceania, and other regions
• Reinforcing the monitoring of cli-mate changes and water cycles, such as heavy rainfalls and droughts in Asian monsoon regions
• Using artificial satellites, ships, buoys, and other means in an integrated manner
• Improving prediction systems using the advanced computer system “Earth Simu-lator”
• Building and reinforcing monitoring networks for earthquakes and vol-canic activities in Asia and West Pa-cific regions
Marine monitoring ship Mirai
Japanese Antarctic expedi-tion ship Shirase Earth Simulator
Advanced land observing satellite
Monitoring global warming and carbon cycles Clarifying the climate change and water circulation mechanism
Monitoring earthquakes, tsunami, volcanic activities, etc.

111
Source: http: //www.eanet.cc/jpn/
Figure 7.5-2 Organization of EANET
(Member country)
Intergovernmental meeting
Dry Depositin Monitoring Task Force
Soil and Vegetation Monitoring Task Force
Soil and Vegetation Experts Network
Science Advisory Board
EANET Bureau (UN Environmental Program, Regional Resource
Center in Asia and the Pacific)
EANET Network Center (Acid Deposition and Oxidant Research
Center)
Network QA/QC manager
Domestic center
National QA/QC manager
National focal point
112
7.6 Deepening of Discussion on the Establishment of Post-Kyoto Protocol Objec-tives
[Points]
• In compilation of the United Nations Framework Convention on Climate Change, European
countries insisted that the members should pledge to stabilize greenhouse gas emissions at
the 1990 level by the end of 2000. The proposal was rejected by the United States, which
countered that the stabilization efforts would require enormous amounts of money while
sufficient amounts of scientific evidence were not available. Proposing the “Pledge and Re-
view” method, Japan recommended that the stabilization should be a nonbinding target in-
stead of an obligation.
• It was agreed that member countries should “reduce” their greenhouse gas emissions to
their 1990 levels, instead of “stabilizing” the emissions at these levels, while obliging them
to “implement necessary policies and actions,” not to “achieve their targets.”
• Upon the adoption of the Kyoto Protocol, discussion was started on greenhouse gas reduc-
tions after 2000, which was not addressed in the UNFCCC. Amid concerns over the poten-
tial failure to achieve their 2000 reduction targets, momentum grew for the establishment of
a new protocol. This resulted in the adoption of the Berlin Mandate, under which “quantities
targets” were imposed on developed countries alone, with developing countries free from
any new obligations.
• In the assignment of quantitative targets, several methodologies were proposed including
the following: the use of basic units such as per GDP or per-capita emissions, the commit-
ment by each country to a reduction rate and successive reductions, allocation based on total
permissible emissions, and application of a reduction rate lowered from the standard reduc-
tion rate by using an index. Finally, the member countries agreed to make a list of the re-
sults of negotiations on the respective targets for countries.
• The 2005 COP/MOP1 meeting started discussion on the post-Kyoto Protocol, aiming to es-
tablish an international framework for 2013 and later years. This discussion should address
the way to simultaneously ensure both environmental conservation and economic develop-
ment.
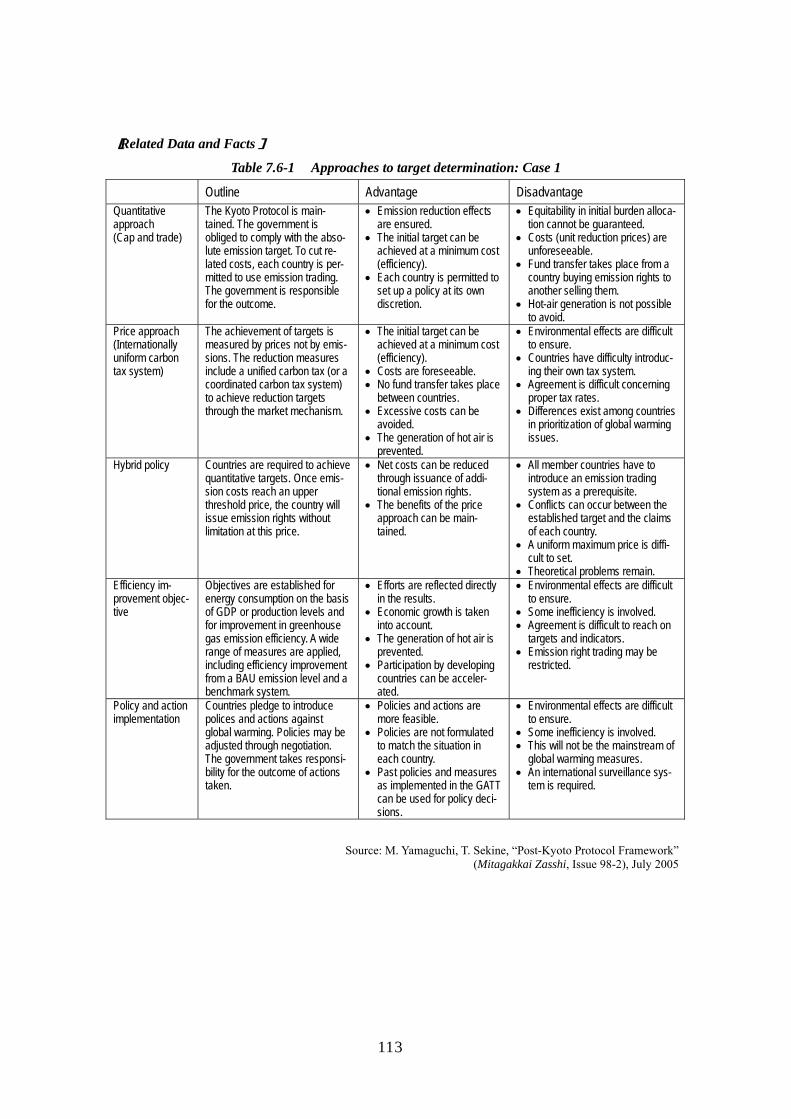
• There are multiple options for emission targets (Table 7.6-1). Some of them have been pre-
sented for deliberation in the post-Kyoto Protocol meetings (Table 7.6-2, Table 7.6-3).
Among them, we should select the most effective and practicable proposal.
• To reflect equitability in the establishment of targets, it should be noted that equitability
must be based on three aspects: (1) equitability based on the allocation of total global emis-
sions, (2) equitability based on the results of implementation of the system, and (3) equita-
bility in the process of determining allocations of total global emissions.
113
[Related Data and Facts]
Table 7.6-1 Approaches to target determination: Case 1
Outline Advantage Disadvantage Quantitative approach (Cap and trade)
The Kyoto Protocol is main-tained. The government is obliged to comply with the abso-lute emission target. To cut re-lated costs, each country is per-mitted to use emission trading. The government is responsible for the outcome.
• Emission reduction effects are ensured.
• The initial target can be achieved at a minimum cost (efficiency).
• Each country is permitted to set up a policy at its own discretion.
• Equitability in initial burden alloca-tion cannot be guaranteed.
• Costs (unit reduction prices) are unforeseeable.
• Fund transfer takes place from a country buying emission rights to another selling them.
• Hot-air generation is not possible to avoid.
Price approach (Internationally uniform carbon tax system)
The achievement of targets is measured by prices not by emis-sions. The reduction measures include a unified carbon tax (or a coordinated carbon tax system) to achieve reduction targets through the market mechanism.
• The initial target can be achieved at a minimum cost (efficiency).
• Costs are foreseeable. • No fund transfer takes place
between countries. • Excessive costs can be
avoided. • The generation of hot air is
prevented.
• Environmental effects are difficult to ensure.
• Countries have difficulty introduc-ing their own tax system.
• Agreement is difficult concerning proper tax rates.
• Differences exist among countries in prioritization of global warming issues.
Hybrid policy Countries are required to achieve quantitative targets. Once emis-sion costs reach an upper threshold price, the country will issue emission rights without limitation at this price.
• Net costs can be reduced through issuance of addi-tional emission rights.
• The benefits of the price approach can be main-tained.
• All member countries have to introduce an emission trading system as a prerequisite.
• Conflicts can occur between the established target and the claims of each country.
• A uniform maximum price is diffi-cult to set.
• Theoretical problems remain. Efficiency im-provement objec-tive
Objectives are established for energy consumption on the basis of GDP or production levels and for improvement in greenhouse gas emission efficiency. A wide range of measures are applied, including efficiency improvement from a BAU emission level and a benchmark system.
• Efforts are reflected directly in the results.
• Economic growth is taken into account.
• The generation of hot air is prevented.
• Participation by developing countries can be acceler-ated.
• Environmental effects are difficult to ensure.
• Some inefficiency is involved. • Agreement is difficult to reach on
targets and indicators. • Emission right trading may be
restricted.
Policy and action implementation
Countries pledge to introduce polices and actions against global warming. Policies may be adjusted through negotiation. The government takes responsi-bility for the outcome of actions taken.
• Policies and actions are more feasible.
• Policies are not formulated to match the situation in each country.
• Past policies and measures as implemented in the GATT can be used for policy deci-sions.
• Environmental effects are difficult to ensure.
• Some inefficiency is involved. • This will not be the mainstream of
global warming measures. • An international surveillance sys-
tem is required.
Source: M. Yamaguchi, T. Sekine, “Post-Kyoto Protocol Framework”
(Mitagakkai Zasshi, Issue 98-2), July 2005

114
Table 7.6-2 Approaches to target determination: Case 2 Proposal for systems Outline
Multistage approach • Maximum permissible absolute emissions should be imposed on more countries, with more stringent reduction obligations being incrementally applied in the future.
Sector-specific CDM • Developing countries should be obliged to introduce CDM projects aimed to achieve a target specified for each sector.
Sustainable develop-ment policy and action
• As with sector-specific CDM projects, developing countries should be obliged to in-corporate into their economic plans a greenhouse gas emission reduction policy (“de-velopment priority proposal”).
Brazil’s proposal • As a means of burden allocation, an emission reduction target should be imposed on each country based on the impact of its past emissions on temperature rises. This rule is based on the polluter-pays principle to allocate common but differing responsibilities.
Triple-take approach / multi-sector conver-gence approach
• Under the triple-take approach, a country is divided into three sectors: (1) civilian and other sectors, (2) energy-intensive manufacturing sector, and (3) power generation sec-tor. Emissions are calculated by sector. A country’s emissions are calculated by totaling the emissions in the three sectors. Reduction targets are set by taking into consideration the country’s fuel composition, economic structure, living standards, and other domestic factors.
• Although similar to the triple-take approach, the multiple-sector convergence approach reflects domestic factors more flexibly and accurately in that, under convergence ap-proach, a country is divided into seven sectors (power generation, household, transport, industry, service, agriculture, and waste).
Convergence approach • Global Common Institute, a British NGO, has proposed that reduction targets should be applied in such a way that countries will have the same per-capita greenhouse gas emis-sions on mid- and long-term basis.
Safety valve approach • Countries should be permitted to trade emission quotas at a fixed price after a maximum allowable price is set for an emission quota. This approach is a hybrid of emissions trading and a carbon tax because an emission quota traded at a fixed price can be con-sidered as a carbon tax.
Carbon-intensity target • No absolute emission cap should be imposed. A target should be set in such a way that it can be adjusted on the basis of GDP, population, and other factors.
Coordination for stan-dardization (emissions, fuel efficiency, tech-nology, etc.)
• Countries should be obliged to apply a greenhouse gas emission standard and an en-ergy-efficiency standard to each technology or product. This concept is called “sector approach” or “bottom-up approach.”
International carbon tax • A consensus should be formed to oblige each country to introduce a common or ad-justed carbon tax agreed upon internationally. As a tax is imposed on carbon emissions, fossil fuel prices are expected to increase in accordance with the carbon content, en-couraging fuel conversion and energy savings.
Double-track approach • Countries should be permitted to choose at their discretion from multiple obligations set within a single framework.
• For example, in the first track, countries are given legally binding targets and are per-mitted to use the Kyoto mechanism in order to achieve their targets. In the second track, countries are legally mandated to establish and implement a plan against climate change by selecting non-binding targets and incorporating into their plan necessary policies and actions against climate change.
Technology fund • Countries should agree to set up an international fund for research and development of anti-warming technologies.
Regional responses • The multinational process should be replaced with, or complemented by, an in-ter-regional process, because the latter can facilitate regional agreement and implemen-tation of individual policies.
Source: Edited by Y. Takamura, Y. Kameyama from “Future Course of Global Warming Negotiation,” (Daigaku Tosho), 2005.

115
Table 7.6-3 Approaches to target determination: Case 3
Approach Major
Advantages Disadvantages/
Challenges The Kyoto Protocol-Style Tar-gets Extending fixed targets to developing countries with links to flexibility and accountability mechanisms
• Familiarity and simplicity • Advance knowledge of environmental
benefits • Flexibility in implementation • Respects national circumstances
• Limited political acceptability • Data requirements • Incentives to establish weak
targets
Sustainable Development Policies and Measures (SD-PAMs) Voluntary action oriented around sustainable development
• Builds on national sustainable devel-opment priorities
• Respects national circumstances • Easily integrated into The Kyoto Pro-
tocol • No emissions cap
• Ensuring action and account-ability
• Measuring climate benefits • Financing
Sector-Clean Development Mechanism (Sector-CDM) Sector-wide market mechanism
• Familiarity and compatibility with the Protocol
• Development benefits • Rests on the polluter pays principle • Gradual capacity building • Cost-effectiveness • No emissions cap
• Relies on Annex I investment • Technical requirements and
capacity • National coordination effort • Political opposition
Dual-Intensity Targets Two dynamic targets with links to flexibility and accountability mechanisms
• Reduced economic uncertainty in es-tablishing targets
• Reduces risk of hot air targets • Potentially easier to agree on dual tar-
gets
• Data requirements • Complexity • Interactions with international
emissions trading • Lack of environmental certainty
Adaptation of Brazilian Recommendations, as suggested in Chapter 7 Fixed target, global allocation scheme with links to flexibility and accountability mechanisms
• Procedural fairness and simplicity • Science-driven • Rests on established principles • Compatibility with The Kyoto Protocol
mechanisms • Rewards of early developing country
action
• Data requirements • Limited global acceptability • Limited flexibility for varying
country circumstances
Per Capita-Based Entitlements Fixed targets, global allocation scheme with links to flexibility and accountability mechanisms
• Procedural fairness and simplicity • Strong ethical basis • Enhances cost-effectiveness through
global trading • Incentives for developing country par-
ticipation • Amalgamates well with the Kyoto
architecture
• Limited global acceptability • Limited flexibility for varying
country circumstances • High dependence on trading for
success
Source: “Building on the Kyoto Protocol, Options for Protecting the Climate”, World Resources Institute, 2002
116
7.7 Appropriate Allocation of Research and Development Budget for Energy-related Technology
[Points]
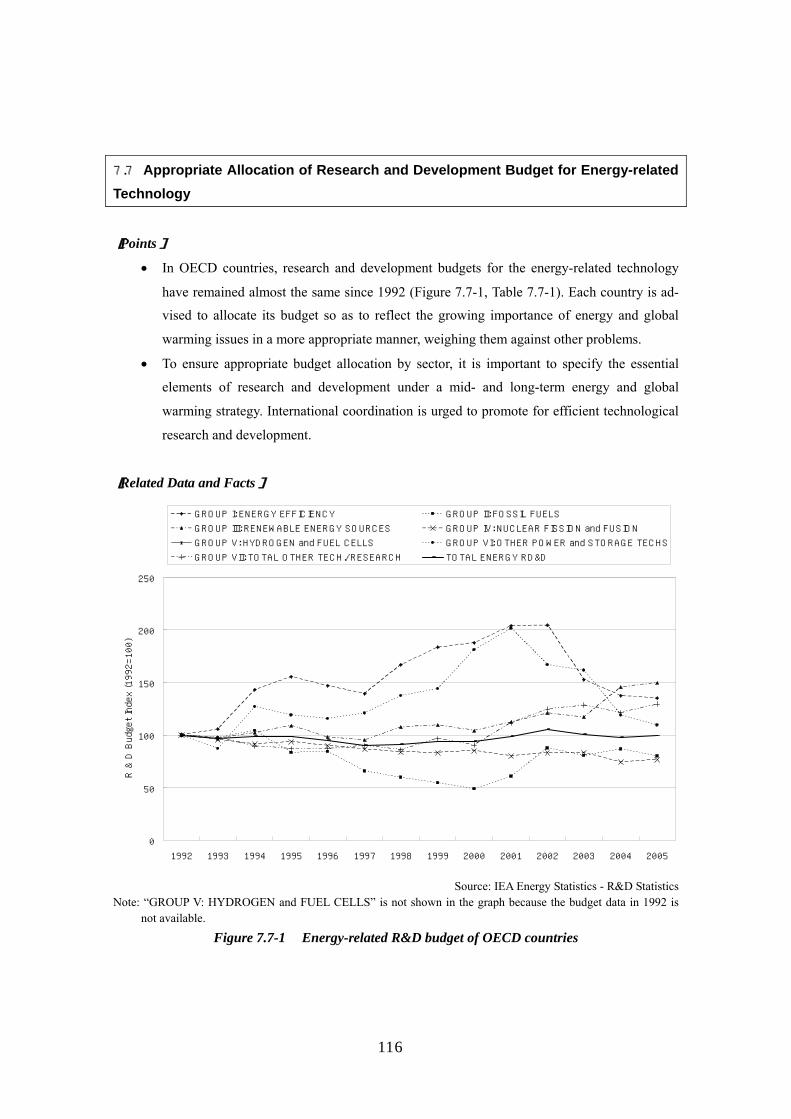
• In OECD countries, research and development budgets for the energy-related technology
have remained almost the same since 1992 (Figure 7.7-1, Table 7.7-1). Each country is ad-
vised to allocate its budget so as to reflect the growing importance of energy and global
warming issues in a more appropriate manner, weighing them against other problems.
• To ensure appropriate budget allocation by sector, it is important to specify the essential
elements of research and development under a mid- and long-term energy and global
warming strategy. International coordination is urged to promote for efficient technological
research and development.
[Related Data and Facts]
0
50
100
150
200
250
1992 1993 1994 1995 1996 1997 1998 1999 2000 2001 2002 2003 2004 2005
R & D Budget Index (1992=100)
GROUP I: ENERGY EFFICIENCY GROUP II: FOSSIL FUELS
GROUP III: RENEWABLE ENERGY SOURCES GROUP IV: NUCLEAR FISSION and FUSION
GROUP V: HYDROGEN and FUEL CELLS GROUP VI: OTHER POWER and STORAGE TECHS
GROUP VII: TOTAL OTHER TECH./RESEARCH TOTAL ENERGY RD&D
Source: IEA Energy Statistics - R&D Statistics
Note: “GROUP V: HYDROGEN and FUEL CELLS” is not shown in the graph because the budget data in 1992 is not available.
Figure 7.7-1 Energy-related R&D budget of OECD countries

117
Table 7.7-1 Energy- related R&D budget of OECD countries
million USD share million USD shareGROUP 1: ENERGY EFFICIENCY 1239.681 13.1% 1075.015 11.2% 0.87I.1 Industry 428.821 4.5% 150.069 1.6% 0.35I.2 Residential Commercial 328.834 3.5% 157.159 1.6% 0.48I.3 Transportation 405.042 4.3% 216.977 2.3% 0.54I.4 Other Conservation 76.955 0.8% 550.808 5.7% 7.16GROUP II: FOSSIL FUELS 1050.234 11.1% 1006.86 10.5% 0.96II.1 Total Oil & Gas 490.444 5.2% 506.23 5.3% 1.03II.1.1 Enhanced Oil & Gas Production 165.78 1.7% 88.747 0.9% 0.54II.1.2 Refining Transp. & Stor. of Oil and Gas .. .. .. .. ..II.1.3 Non-Conventional Oil and Gas Production 18.93 0.2% 24.075 0.3% 1.27II.1.4 Oil and Gas Combustion .. .. .. .. ..II.1.5 Oil and Gas Conversion .. .. .. .. ..II.1.6 Other Oil & Gas 305.734 3.2% 393.408 4.1% 1.29II.2 Total Coal 559.793 5.9% 430.098 4.5% 0.77II.2.1 Coal Prod. Prep. & Trans. .. .. .. .. ..II.2.2 Coal Combustion 264.53 2.8% 286.522 3.0% 1.08II.2.3 Coal Conversion (excl. IGCC) 180.059 1.9% 66.833 0.7% 0.37II.2.4 Other Coal 115.204 1.2% 76.744 0.8% 0.67II.3 Total CO2 Capture and Storage .. .. 70.532 0.7% ..II.3.1 CO2 Capture/Separation .. .. 62.661 0.7% ..II.3.2 CO2 Transport .. .. 0.044 0.0% ..II.3.3 CO2 Storage .. .. 7.827 0.1% ..GROUP III: RENEWABLE ENERGY SOURCES 808.596 8.5% 1113.208 11.6% 1.38III.1 Total Solar Energy 399.408 4.2% 500.714 5.2% 1.25III.1.1 Solar Heating & Cooling (incl. Daylighting) 59.923 0.6% 60.375 0.6% 1.01III.1.2 Photovoltaics 279.231 2.9% 362.662 3.8% 1.30III.1.3 Solar Thermal Power and High Temp. Apps 60.254 0.6% 77.678 0.8% 1.29III.2 Wind Energy 134.529 1.4% 161.385 1.7% 1.20III.3 Ocean Energy 2.719 0.0% 4.74 0.0% 1.74III.4 Total Bio-Energy 167.64 1.8% 300.284 3.1% 1.79III.4.1 Prod. of Transport Biofuels incl. from Wastes .. .. 23.562 0.2% ..III.4.2 Prod Other Biomass-Derived Fuels incl Wastes .. .. 83.749 0.9% ..III.4.3 Applications for Heat and Electricity .. .. 27.129 0.3% ..III.4.4 Other bio-energy .. .. 22.593 0.2% ..III.5 Geothermal Energy 86.65 0.9% 54.47 0.6% 0.63III.6 Total Hydropower 17.646 0.2% 31.444 0.3% 1.78III.6.1 Large Hydropower (capacity >10 MW) 15.34 0.2% 10.556 0.1% 0.69III.6.2 Small Hydropower (capacity <10 MW) 2.306 0.0% 20.888 0.2% 9.06III.7 Other Renewables .. .. 60.172 0.6% ..GROUP IV: NUCLEAR FISSION and FUSION 4736.705 50.0% 3883.237 40.5% 0.82IV.1 Total Nuclear Fission 3616.384 38.1% 3168.059 33.0% 0.88IV.1.1 Light-Water Reactors (LWRs) 449.173 4.7% 130.834 1.4% 0.29IV.1.2 Other Converter Reactors 304.575 3.2% 145.632 1.5% 0.48IV.1.3 Fuel Cycle 1239.261 13.1% 1008.982 10.5% 0.81IV.1.4 Nuclear Supporting Technology 1256.759 13.3% 1712.047 17.9% 1.36IV.1.5 Nuclear Breeder 366.613 3.9% 150.231 1.6% 0.41IV.1.6 Other Nuclear Fission .. .. 20.334 0.2% ..IV.2 Nuclear Fusion 1120.321 11.8% 715.178 7.5% 0.64GROUP V: HYDROGEN and FUEL CELLS .. .. 281.048 2.9% ..V.1 Total Hydrogen .. .. 127.949 1.3% ..V.1.1 Hydrogen production .. .. .. .. ..V.1.2 Hydrogen storage .. .. .. .. ..V.1.3 Hydrogen transport and distribution .. .. .. .. ..V.1.4 Other infrastructure and systems R&D .. .. .. .. ..V.1.5 Hydrogen end uses incl.comb; excl.fuel cells .. .. .. .. ..V.2 Total Fuel Cells .. .. 153.1 1.6% ..V.2.1 Stationary applications .. .. .. .. ..V.2.2 Mobile applications .. .. .. .. ..V.2.3 Other applications .. .. .. .. ..GROUP VI: OTHER POWER and STORAGE TECHS 373.465 3.9% 343.236 3.6% 0.92VI.1 Electric Power Conversion 209.718 2.2% 179.026 1.9% 0.85VI.2 Electricity Transm. & Distr. 108.869 1.1% 129.024 1.3% 1.19VI.3 Energy Storage 54.876 0.6% 35.189 0.4% 0.64GROUP VII: TOTAL OTHER TECH./RESEARCH 1274.2 13.4% 1883.715 19.7% 1.48VII.1 Energy System Analysis .. .. .. .. ..VII.2 Other .. .. .. .. ..TOTAL ENERGY RD&D 9482.881 100.0% 9586.32 100.0% 1.01
1995 2005 2005/1995TIME
Source: IEA Energy Statistics - R&D Statistics
Note: The figures refer only to R&D budgets of national governments.