7. Big 127-174 Final new
169
1
Transcript of 7. Big 127-174 Final new

1

2
INDEX
Category Description Page NoFund Name
Economic Overview and Market Outlook 5-15
Equity Schemes
Hybrid Schemes
ICICI Prudential Equity & Debt Fund Aggressive An open ended hybrid scheme investing predominantly in equity and equity 43-44
Hybrid Fund related instruments
ICICI Prudential Equity Arbitrage Fund Arbitrage Fund An open ended scheme investing in arbitrage opportunities 45-46
ICICI Prudential Balanced Advantage Fund Dynamic Asset An open ended dynamic asset allocation fund 47-48
Allocation/Balanced
Advantage Fund
ICICI Prudential Equity Savings Fund Equity Savings An open ended scheme investing in equity, arbitrage and debt 49-50
Fund
ICICI Prudential Regular Savings Fund Conservative An open ended hybrid scheme investing predominantly in debt instruments 51-52
Hybrid Fund
ICICI Prudential Multi-Asset Fund Multi Asset An open ended scheme investing in multi assets 53-54
Allocation
ICICI Prudential Bluechip Fund Large Cap Fund An open ended equity scheme predominantly investing in large cap stocks 16
ICICI Prudential Flexicap Fund Flexi Cap An open ended dynamic equity scheme investing across large cap, mid cap & 17
small cap stocks
ICICI Prudential Large & Mid Cap Fund Large & Mid Cap An open ended equity scheme investing in both large cap and mid cap stocks 18
Fund
ICICI Prudential Multicap Fund Multicap Fund An open ended equity scheme investing across large cap, mid cap, small cap stocks 19-20
ICICI Prudential India Opportunities Fund Thematic An open ended equity scheme following special situations theme 21
ICICI Prudential Value Discovery Fund Value Fund An open ended equity scheme following a value investment strategy 22
ICICI Prudential Long Term Equity Fund Equity Linked An open Ended Equity Scheme with Tax Saving advantage 23
(Tax Saving) Savings Scheme
(ELSS) ICICI Prudential Focused Equity Fund Focused Fund An open ended equity scheme investing in maximum 30 stocks 24
ICICI Prudential Dividend Yield Equity Fund Dividend Yield An open ended equity scheme predominantly investing in dividend yielding stocks 25
Fund
ICICI Prudential Midcap Fund Mid Cap Fund An open ended equity scheme predominantly investing in mid cap stocks 26-27
ICICI Prudential Smallcap Fund Small Cap Fund An open ended equity scheme predominantly investing in small cap stocks 28
ICICI Prudential Banking & Financial
Services Fund Sectoral An open ended equity scheme investing in banking & financial services sector 29
ICICI Prudential FMCG Fund Sectoral An open ended equity scheme investing in FMCG sector 30
ICICI Prudential Technology Fund Sectoral An open ended equity scheme investing in technology and related sectors 31
ICICI Prudential Business Cycle Fund Thematic An open ended equity scheme following business cycles based investing theme 32
ICICI Prudential ESG Fund Thematic (An open ended equity scheme investing in companies identified based on the 33
Environmental, Social and Governance (ESG) theme)
ICICI Prudential Pharma Healthcare and Thematic An Open Ended Equity Scheme following Pharma, Healthcare, Diagnostic and
Diagnostics (P.H.D) Fund allied Theme. 34
ICICI Prudential Exports and Services Fund Thematic An open ended equity scheme following exports and services theme 35
ICICI Prudential Infrastructure Fund Thematic An open ended equity scheme following infrastructure theme 36
ICICI Prudential Manufacture in India Fund Thematic An Open Ended Equity Scheme following manufacturing theme 37
ICICI Prudential MNC Fund Thematic An open ended Equity Scheme following MNC theme 38
ICICI Prudential Bharat Consumption Fund Thematic An open ended scheme investing in companies engaged in consumption and 39
consumption related activities.
ICICI Prudential Commodities Fund Thematic An open ended equity scheme investing primarily in commodities and commodity 40
related sectors.
ICICI Prudential US Bluechip Equity Fund Thematic An open ended equity scheme following bluechip companies listed in US 41
ICICI Prudential Quant Fund Thematic An open ended equity scheme following Quant based investing theme 42
3
Category Description Page NoFund Name
INDEX
Fund Of Funds Schemes
Debt Schemes
ICICI Prudential Overnight Fund Overnight Fund An open ended debt scheme investing in overnight securities. 66
ICICI Prudential Liquid Fund Liquid Fund Investment in Debt and money market securities with maturity of upto 91 days only 67
ICICI Prudential Money Market Fund Money Market An open ended debt scheme investing in money market instruments 68
Fund
ICICI Prudential Ultra Short Term Fund Ultra Short An open ended debt scheme with Macaulay Duration between 3-6 months 69-70
Duration Fund
ICICI Prudential Savings Fund Low Duration Fund An open ended debt scheme with Macaulay Duration between 6 - 12 months 71-72
ICICI Prudential Floating Interest Fund Floater Fund An open ended debt scheme predominantly investing in floating rate instruments 73-74
ICICI Prudential Short Term Fund Short Duration An open ended debt scheme with Macaulay Duration between 1 – 3 years 75-76
Fund
ICICI Prudential Bond Fund Medium to Long An open ended debt scheme with Macaulay Duration between 4 – 7 years 77
Duration Fund
ICICI Prudential Corporate Bond Fund Corporate Bond An open ended debt scheme predominantly investing in AA+ or above rated 78-79 Fund securities.
ICICI Prudential Banking & PSU Debt Fund Banking & PSU An open ended debt scheme predominantly investing in Debt instruments of banks, 80-81
Fund Public Sector Undertakings, Public Financial Institutions
ICICI Prudential Credit Risk Fund Credit Risk Fund An open ended debt scheme predominantly investing in AA and below rated
corporate bonds. 82-83
ICICI Prudential Medium Term Bond Fund Medium Duration An open ended debt scheme with Macaulay Duration between 3 – 4 years 84-85
Fund
ICICI Prudential Long Term Bond Fund Long Duration An open ended debt scheme with Macaulay duration greater than 7 years 86
Fund
ICICI Prudential All Seasons Bond Fund Dynamic Bond An open ended dynamic debt scheme investing across duration 87-88
ICICI Prudential Gilt Fund Gilt Fund An open ended debt scheme investing in government securities across maturity 89
ICICI Prudential Constant Maturity Gilt Fund Gilt Fund with An open ended debt scheme having minimum investment in Gsecs- 80% and 90
10-year Constant Macaulay duration of 10 years
Duration
Solution Oriented Scheme s
ICICI Prudential Child Care Fund (Gift Plan) Solution oriented Diversified Long Term Child Benefit Oriented Plan 91 scheme
ICICI Prudential Retirement Fund Solution Oriented An open ended Retirement Solution Oriented Scheme 92-95
Scheme
ICICI Prudential Thematic Advantage Fund (FOF) Other Scheme An open ended fund of funds scheme investing predominantly in Sectoral/ 55
Thematic schemes.
ICICI Prudential Passive Strategy Fund (FOF) Other Scheme An open ended fund of funds scheme investing predominantly in Exchange 56
Traded Funds
ICICI Prudential India Equity FOF Other Scheme An Open ended Fund of Funds investing in units of equity oriented schemes. 57
ICICI Prudential BHARAT 22 FOF Other Scheme An open ended fund of funds scheme investing in BHARAT 22 ETF 58
ICICI Prudential Global Advantage Fund (FOF) Other Scheme An open ended Fund of Funds scheme predominantly investing in mutual fund 59
schemes / ETFs that invest in international markets.)
ICICI Prudential Global Stable Equity Other Scheme Open ended Fund of Funds Scheme investing in overseas mutual fund schemes which 60
Fund (FOF) invest in stable companies globally
ICICI Prudential Asset Allocator Fund (FOF) Other Scheme An open ended fund of funds scheme investing in equity oriented schemes, 61
debt oriented schemes and gold ETFs/schemes.
ICICI Prudential Income Optimizer Fund (FOF) Other Scheme An open ended fund of funds scheme predominantly investing in debt oriented 62
schemes and may also invest in equity & hybrid schemes
ICICI Prudential Debt Management Fund (FOF) Other Scheme An open ended fund of funds scheme investing predominantly in debt oriented schemes. 63
ICICI Prudential Regular Gold Savings Fund (FOF) Other Scheme An Open Ended Fund of Funds scheme investing in ICICI Prudential Gold ETF 64
ICICI Prudential Nifty Low Vol 30 ETF FOF Other Scheme An open ended fund of funds scheme investing in ICICI Prudential Nifty Low Vol 30 ETF 65
4
Category Description Page NoFund Name
INDEX
Closed Ended Equity Schemes
Other Details
Fund Details Annexure 123-131
Annexure for Returns of all the Schemes 132-146
Systematic Investment Plan (SIP) of Select Schemes 147-150
Performance of Select Schemes
Annexure - I 151
Annexure - II 152
IDCW History for all Schemes 152-159
Investment Objective of all the schemes 160-163
Schedule 1: One Liner Definitions 164
Schedule 2: How To Read Factsheet 165-167
Statutory Details & Risk Factors 168
Index and ETFs Schemes
ICICI Prudential Bharat Consumption
Fund - Series 1 Closed Ended Equity scheme following Consumption Theme 117
ICICI Prudential Bharat Consumption
Fund - Series 2 Closed Ended Equity scheme following Consumption Theme 118
ICICI Prudential Bharat Consumption
Fund - Series 3 Closed Ended Equity scheme following Consumption Theme 119
ICICI Prudential Bharat Consumption
Fund - Series 4 Closed Ended Equity scheme following Consumption Theme 120
ICICI Prudential Bharat Consumption
Fund - Series 5 Closed Ended Equity scheme following Consumption Theme 121
ICICI Prudential Long Term Wealth
Enhancement Fund Closed Ended Equity Linked Savings Scheme (ELSS) with a statutory lock in of 3 years and tax benefit 122
ICICI Prudential Nifty 100 ETF Other Schemes (ETF) An open ended exchange traded fund tracking Nifty 100 Index 96
ICICI Prudential Nifty Index Fund Other Schemes (Index Fund) Nifty Index Fund 97
ICICI Prudential Nifty ETF Other Schemes (ETF) An open ended exchange traded fund tracking Nifty 50 Index 98
ICICI Prudential Nifty Low Vol 30 ETF Other Schemes (ETF) An open ended exchange traded fund tracking Nifty 100 Low Volatility 30 Index 99
ICICI Prudential Alpha Low Vol 30 ETF Other Schemes (ETF) An open-ended Index Exchange Traded Fund tracking Nifty Alpha Low-Volatility 30 Index 100
ICICI Prudential Nifty Next 50 Index Fund Other Schemes (Index Fund) An open ended Index scheme replicating Nifty Next 50 Index 101
ICICI Prudential Sensex Index Fund Other Schemes (Index Fund) An open ended Index scheme replicating S&P BSE SENSEX Index 102
ICICI Prudential NV20 ETF Other Schemes (ETF) An open ended exchange traded fund tracking Nifty50 Value 20 Index 103
ICICI Prudential Sensex ETF Other Schemes (ETF) An open ended Exchange Traded Fund tracking S&P BSE SENSEX Index 104
ICICI Prudential Midcap Select ETF Other Schemes (ETF) An open ended exchange traded fund tracking S&P BSE Midcap Select Index 105
ICICI Prudential Midcap 150 ETF Other Schemes (ETF) An open ended Index Exchange Traded Fund tracking Nifty Midcap 150 Index 106-107
BHARAT 22 ETF Other Schemes (ETF) An open-ended Exchange Traded Fund investing in S&P BSE Bharat 22 Index 108
ICICI Prudential S&P BSE 500 ETF Other Schemes (ETF) An Open-ended Exchange Traded Fund replicating/tracking S&P BSE 500 Index 109
ICICI Prudential Nifty Next 50 ETF Other Schemes (ETF) An open-ended Exchange Traded Fund replicating/ tracking NIFTY Next 50 Index 110
ICICI Prudential Bank ETF Other Schemes (ETF) An open-ended Exchange Traded Fund tracking NIFTY Bank Index. 111
ICICI Prudential Private Banks ETF Other Schemes (ETF) An open-ended Exchange Traded Fund replicating / tracking NIFTY Private Bank Index 112
ICICI Prudential IT ETF Other Schemes (ETF) An open-ended Exchange Traded Fund tracking Nifty IT Index 113
ICICI Prudential Liquid ETF Other Schemes (ETF) An open-ended Exchange Traded Fund tracking S&P BSE Liquid Rate Index 114
ICICI Prudential Healthcare ETF Other Schemes (ETF) An open-ended Index Exchange Traded Fund tracking Nifty Healthcare Index 115
Gold Funds & ETFs
ICICI Prudential Gold ETF Other Schemes (ETF) An open ended exchange traded fund replicating domestic prices of gold 116
5
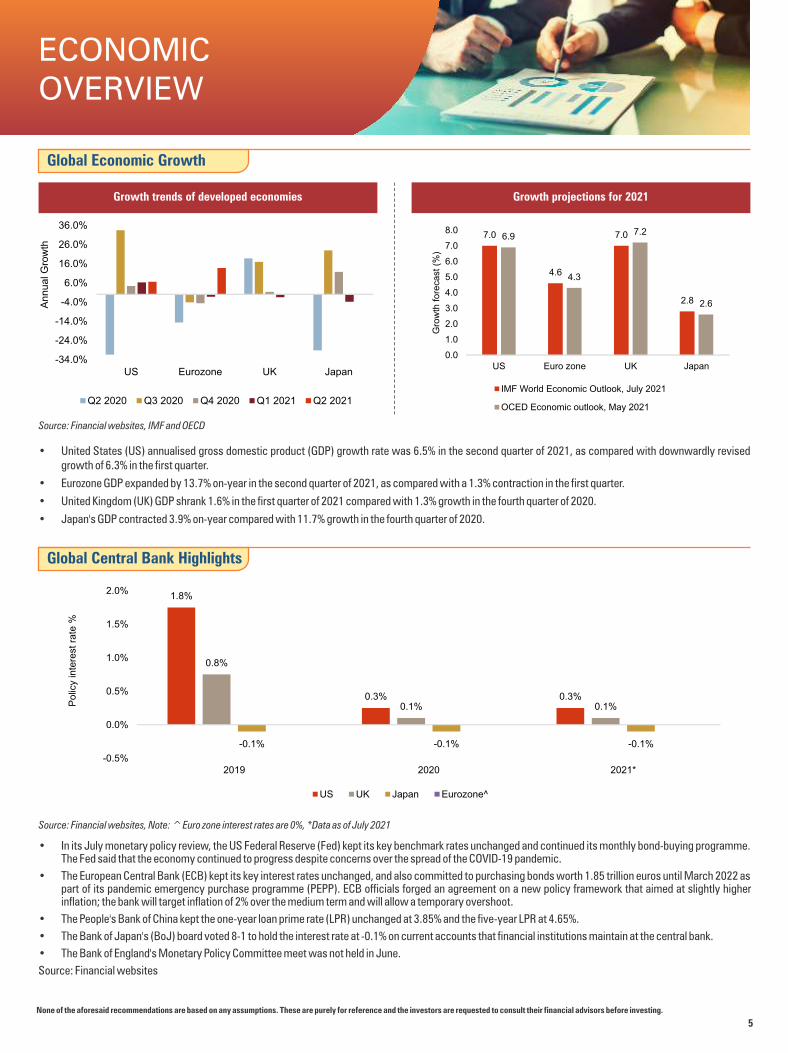
• United States (US) annualised gross domestic product (GDP) growth rate was 6.5% in the second quarter of 2021, as compared with downwardly revised growth of 6.3% in the first quarter.
• Eurozone GDP expanded by 13.7% on-year in the second quarter of 2021, as compared with a 1.3% contraction in the first quarter.
• United Kingdom (UK) GDP shrank 1.6% in the first quarter of 2021 compared with 1.3% growth in the fourth quarter of 2020.
• Japan's GDP contracted 3.9% on-year compared with 11.7% growth in the fourth quarter of 2020.
None of the aforesaid recommendations are based on any assumptions. These are purely for reference and the investors are requested to consult their financial advisors before investing.
ECONOMIC OVERVIEW
Growth trends of developed economies Growth projections for 2021
Source: Financial websites, IMF and OECD
Global Economic Growth
Global Central Bank Highlights
• In its July monetary policy review, the US Federal Reserve (Fed) kept its key benchmark rates unchanged and continued its monthly bond-buying programme. The Fed said that the economy continued to progress despite concerns over the spread of the COVID-19 pandemic.
• The European Central Bank (ECB) kept its key interest rates unchanged, and also committed to purchasing bonds worth 1.85 trillion euros until March 2022 as part of its pandemic emergency purchase programme (PEPP). ECB officials forged an agreement on a new policy framework that aimed at slightly higher inflation; the bank will target inflation of 2% over the medium term and will allow a temporary overshoot.
• The People's Bank of China kept the one-year loan prime rate (LPR) unchanged at 3.85% and the five-year LPR at 4.65%.
• The Bank of Japan's (BoJ) board voted 8-1 to hold the interest rate at -0.1% on current accounts that financial institutions maintain at the central bank.
• The Bank of England's Monetary Policy Committee meet was not held in June.
Source: Financial websites
Source: Financial websites, Note: ̂ Euro zone interest rates are 0%, *Data as of July 2021
-34.0%
-24.0%
-14.0%
-4.0%
6.0%
16.0%
26.0%
36.0%
US Eurozone UK Japan
An
nu
al G
row
th
Q2 2020 Q3 2020 Q4 2020 Q1 2021 Q2 2021
7.0
4.6
7.0
2.8
6.9
4.3
7.2
2.6
0.0
1.0
2.0
3.0
4.0
5.0
6.0
7.0
8.0
US Euro zone UK Japan
Gro
wth
fore
cast
(%
)
IMF World Economic Outlook, July 2021
OCED Economic outlook, May 2021
1.8%
0.3% 0.3%
0.8%
0.1% 0.1%
-0.1% -0.1% -0.1%
-0.5%
0.0%
0.5%
1.0%
1.5%
2.0%
2019 2020 2021*
Po
licy
inte
rest
ra
te %
US UK Japan Eurozone^
6
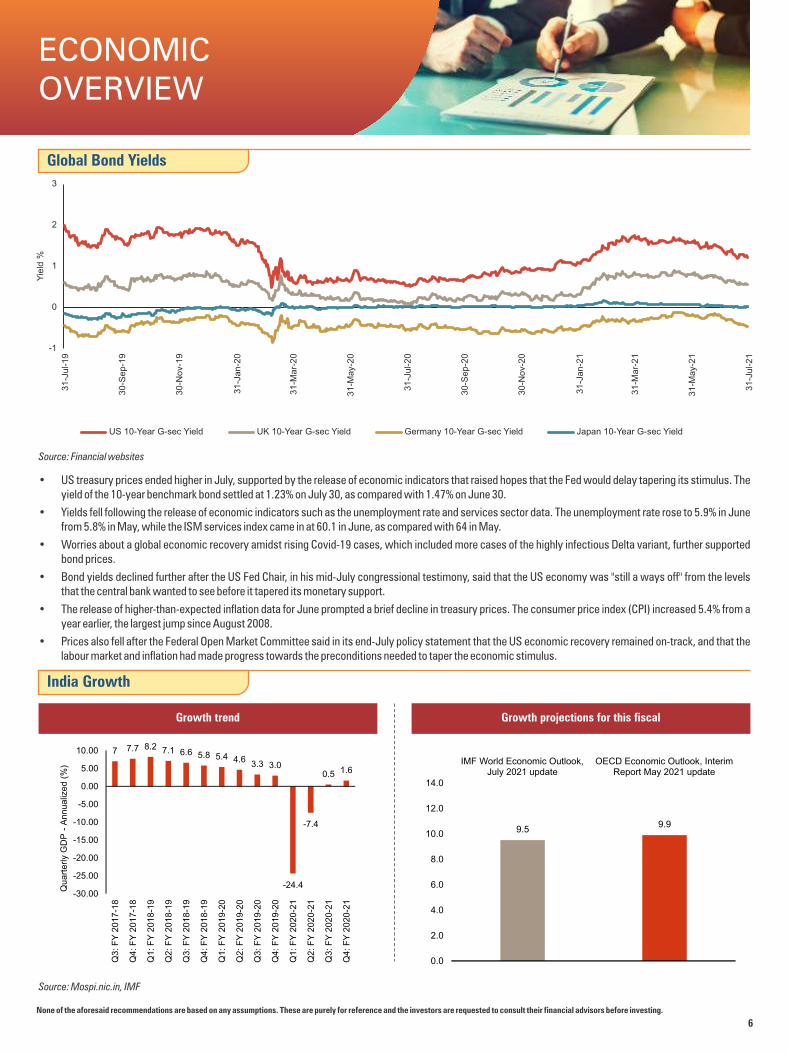
• US treasury prices ended higher in July, supported by the release of economic indicators that raised hopes that the Fed would delay tapering its stimulus. The yield of the 10-year benchmark bond settled at 1.23% on July 30, as compared with 1.47% on June 30.
• Yields fell following the release of economic indicators such as the unemployment rate and services sector data. The unemployment rate rose to 5.9% in June from 5.8% in May, while the ISM services index came in at 60.1 in June, as compared with 64 in May.
• Worries about a global economic recovery amidst rising Covid-19 cases, which included more cases of the highly infectious Delta variant, further supported bond prices.
• Bond yields declined further after the US Fed Chair, in his mid-July congressional testimony, said that the US economy was "still a ways off" from the levels that the central bank wanted to see before it tapered its monetary support.
• The release of higher-than-expected inflation data for June prompted a brief decline in treasury prices. The consumer price index (CPI) increased 5.4% from a year earlier, the largest jump since August 2008.
• Prices also fell after the Federal Open Market Committee said in its end-July policy statement that the US economic recovery remained on-track, and that the labour market and inflation had made progress towards the preconditions needed to taper the economic stimulus.
None of the aforesaid recommendations are based on any assumptions. These are purely for reference and the investors are requested to consult their financial advisors before investing.
ECONOMIC OVERVIEW
Source: Financial websites
Global Bond Yields
India Growth
Growth trend Growth projections for this fiscal
Source: Mospi.nic.in, IMF
-1
0
1
2
3
31
-Jul-1
9
30
-Se
p-1
9
30
-No
v-19
31
-Jan-2
0
31
-Mar-
20
31
-May-2
0
31
-Jul-2
0
30
-Se
p-2
0
30
-No
v-20
31
-Jan-2
1
31
-Mar-
21
31
-May-2
1
31
-Jul-2
1
Yie
ld %
US 10-Year G-sec Yield UK 10-Year G-sec Yield Germany 10-Year G-sec Yield Japan 10-Year G-sec Yield
7 7.7 8.2 7.1 6.6 5.8 5.4 4.63.3 3.0
-24.4
-7.4
0.5 1.6
-30.00
-25.00
-20.00
-15.00
-10.00
-5.00
0.00
5.00
10.00
Q3: F
Y 2
017-1
8
Q4: F
Y 2
017-1
8
Q1: F
Y 2
018-1
9
Q2: F
Y 2
018-1
9
Q3: F
Y 2
018-1
9
Q4: F
Y 2
018-1
9
Q1: F
Y 2
019-2
0
Q2: F
Y 2
019-2
0
Q3: F
Y 2
019-2
0
Q4: F
Y 2
019-2
0
Q1: F
Y 2
020-2
1
Q2: F
Y 2
020-2
1
Q3: F
Y 2
020-2
1
Q4: F
Y 2
020-2
1
Quart
erly
GD
P -
Annualiz
ed (
%)
9.59.9
0.0
2.0
4.0
6.0
8.0
10.0
12.0
14.0
IMF World Economic Outlook,July 2021 update
OECD Economic Outlook, InterimReport May 2021 update
7
• India's GDP continued to grow marginally for the second straight quarter to 1.6% in the March quarter (fourth quarter of fiscal 2021) compared with a growth of 0.5% in the December quarter (third quarter).
• In gross value-added (GVA) terms, the Indian economy grew 3.7% in the fourth quarter compared with a growth of 1% in the third quarter.
• The agriculture sector grew 3.1% in the fourth quarter compared with 4.5% in the third quarter.
• Manufacturing grew 6.9% in the fourth quarter, against a 1.7% growth in the preceding quarter. Mining contracted 5.7% in the fourth quarter compared with a decline of 4.4% in the third quarter.
• The construction sector grew 14.5% in the fourth quarter compared with the 6.5% growth in the third quarter. Electricity and other public utilities grew 9.1% in the fourth quarter against 7.3% growth in the third quarter.
• CRISIL lowered its real GDP growth forecast to 9.5% for this fiscal from 11% earlier owing to the more virulent nature of the second wave and possibility of a third one and consequent apprehensions of a lockdown.
None of the aforesaid recommendations are based on any assumptions. These are purely for reference and the investors are requested to consult their financial advisors before investing.
ECONOMIC OVERVIEW
Other Major Indicators
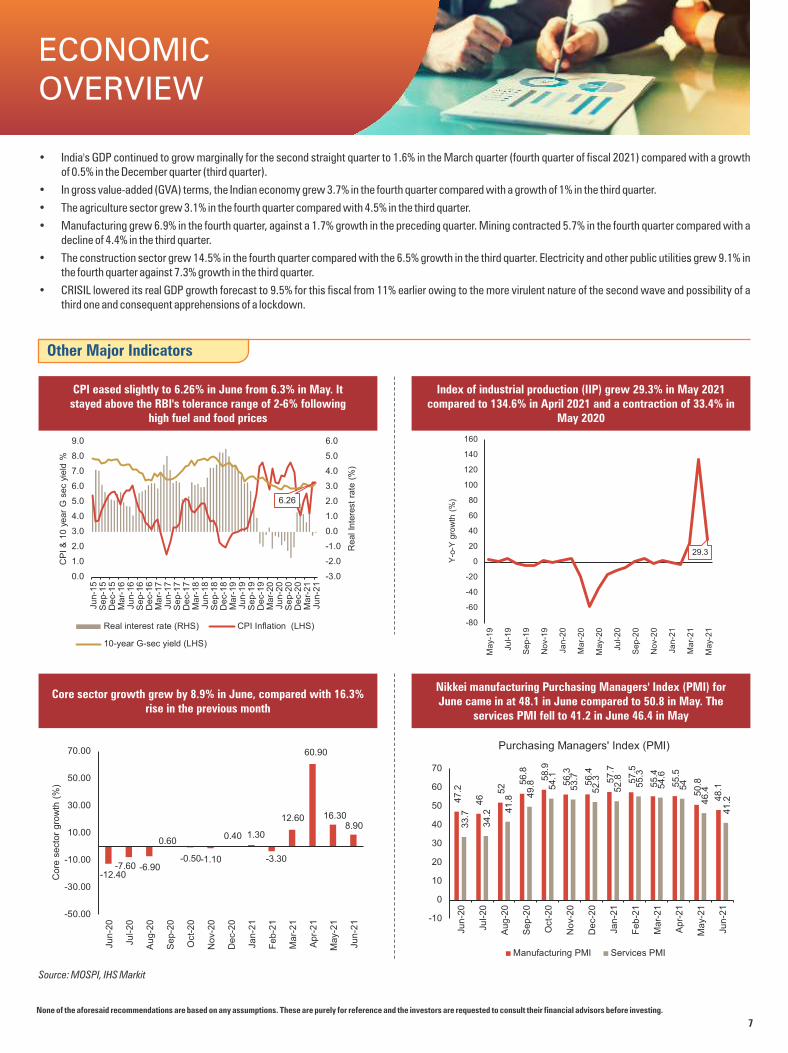
CPI eased slightly to 6.26% in June from 6.3% in May. It stayed above the RBI's tolerance range of 2-6% following
high fuel and food prices
Index of industrial production (IIP) grew 29.3% in May 2021 compared to 134.6% in April 2021 and a contraction of 33.4% in
May 2020
Core sector growth grew by 8.9% in June, compared with 16.3% rise in the previous month
Nikkei manufacturing Purchasing Managers' Index (PMI) for June came in at 48.1 in June compared to 50.8 in May. The
services PMI fell to 41.2 in June 46.4 in May
Source: MOSPI, IHS Markit
6.26
-3.0
-2.0
-1.0
0.0
1.0
2.0
3.0
4.0
5.0
6.0
0.0
1.0
2.0
3.0
4.0
5.0
6.0
7.0
8.0
9.0
Jun
-15
Se
p-1
5D
ec-
15
Ma
r-1
6Ju
n-1
6S
ep
-16
De
c-1
6M
ar-
17
Jun
-17
Se
p-1
7D
ec-
17
Ma
r-1
8Ju
n-1
8S
ep
-18
De
c-1
8M
ar-
19
Jun
-19
Se
p-1
9D
ec-
19
Ma
r-2
0Ju
n-2
0S
ep
-20
De
c-2
0M
ar-
21
Jun
-21
Re
al In
tere
st r
ate
(%
)
CP
I &
10 y
ea
r G
sec
yie
ld %
Real interest rate (RHS) CPI Inflation (LHS)
10-year G-sec yield (LHS)
29.3
-80
-60
-40
-20
0
20
40
60
80
100
120
140
160
May-
19
Jul-19
Sep-1
9
No
v-1
9
Jan-2
0
Mar-
20
May-
20
Jul-20
Sep-2
0
No
v-2
0
Jan-2
1
Mar-
21
May-
21
Y-o
-Y g
row
th (
%)
-12.40-7.60 -6.90
0.60
-0.50-1.10
0.40 1.30
-3.30
12.60
60.90
16.308.90
-50.00
-30.00
-10.00
10.00
30.00
50.00
70.00
Jun-2
0
Ju
l-20
Aug-2
0
Sep-2
0
Oct-
20
No
v-2
0
De
c-2
0
Jan-2
1
Feb
-21
Mar-
21
Apr-
21
May-2
1
Jun-2
1
Core
sect
or
gro
wth
(%
)
47.2
46
52 5
6.8
58.9
56.3
56.4
57.7
57.5
55.4
55.5
50.8
48.1
33.7
34.2 4
1.8
49.8 54.1
53.7
52.3
52.8
55.3
54.6
54
46.4
41.2
-10
0
10
20
30
40
50
60
70
Jun-2
0
Ju
l-20
Aug-2
0
Sep-2
0
Oct-
20
No
v-2
0
De
c-2
0
Jan-2
1
Feb
-21
Mar-
21
Apr-
21
May-2
1
Jun-2
1
Purchasing Managers' Index (PMI)
Manufacturing PMI Services PMI
8
None of the aforesaid recommendations are based on any assumptions. These are purely for reference and the investors are requested to consult their financial advisors before investing.
ECONOMIC OVERVIEW
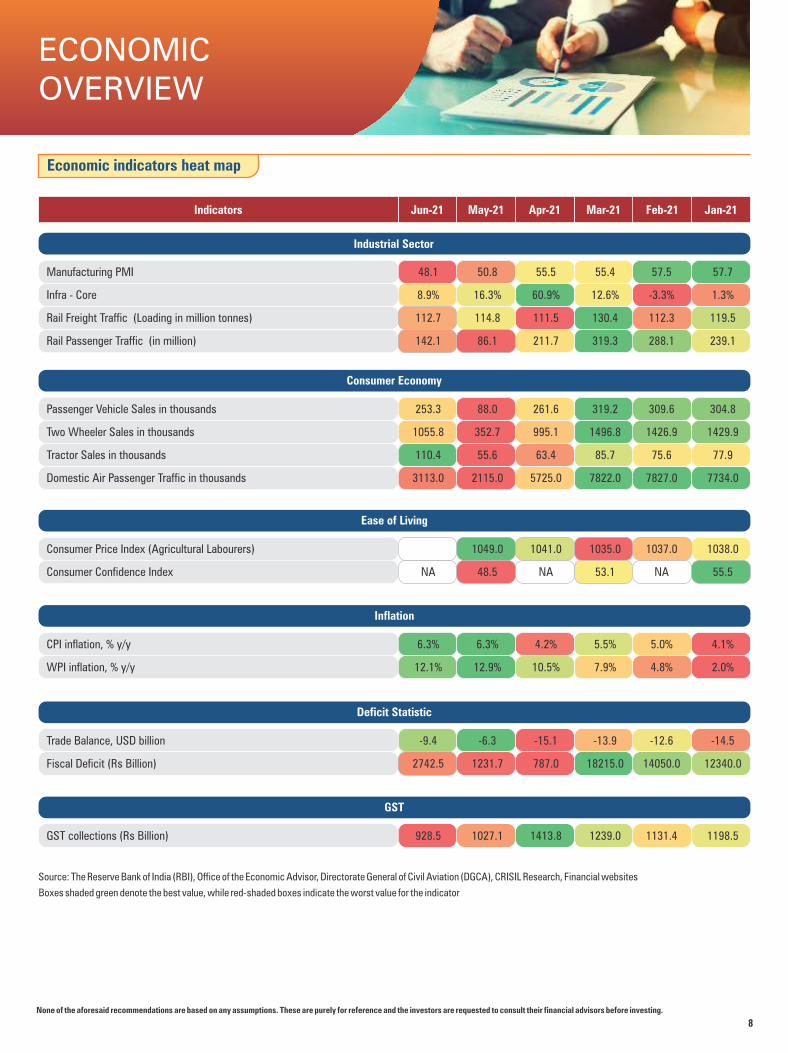
Indicators Jun-21 May-21 Apr-21 Mar-21 Feb-21 Jan-21
Source: The Reserve Bank of India (RBI), Office of the Economic Advisor, Directorate General of Civil Aviation (DGCA), CRISIL Research, Financial websites
Boxes shaded green denote the best value, while red-shaded boxes indicate the worst value for the indicator
Economic indicators heat map
Industrial Sector
Consumer Economy
Ease of Living
Inflation
Deficit Statistic
GST
Manufacturing PMI 48.1 50.8 55.5 55.4 57.5 57.7
Infra - Core 8.9% 16.3% 60.9% 12.6% -3.3% 1.3%
Rail Freight Traffic (Loading in million tonnes) 112.7 114.8 111.5 130.4 112.3 119.5
Rail Passenger Traffic (in million) 142.1 86.1 211.7 319.3 288.1 239.1
Passenger Vehicle Sales in thousands 253.3 88.0 261.6 319.2 309.6 304.8
Two Wheeler Sales in thousands 1055.8 352.7 995.1 1496.8 1426.9 1429.9
Tractor Sales in thousands 110.4 55.6 63.4 85.7 75.6 77.9
Domestic Air Passenger Traffic in thousands 3113.0 2115.0 5725.0 7822.0 7827.0 7734.0
Consumer Price Index (Agricultural Labourers) 1049.0 1041.0 1035.0 1037.0 1038.0
Consumer Confidence Index NA 48.5 NA 53.1 NA 55.5
CPI inflation, % y/y 6.3% 6.3% 4.2% 5.5% 5.0% 4.1%
WPI inflation, % y/y 12.1% 12.9% 10.5% 7.9% 4.8% 2.0%
Trade Balance, USD billion -9.4 -6.3 -15.1 -13.9 -12.6 -14.5
Fiscal Deficit (Rs Billion) 2742.5 1231.7 787.0 18215.0 14050.0 12340.0
GST collections (Rs Billion) 928.5 1027.1 1413.8 1239.0 1131.4 1198.5
9
None of the aforesaid recommendations are based on any assumptions. These are purely for reference and the investors are requested to consult their financial advisors before investing.
ECONOMIC OVERVIEW
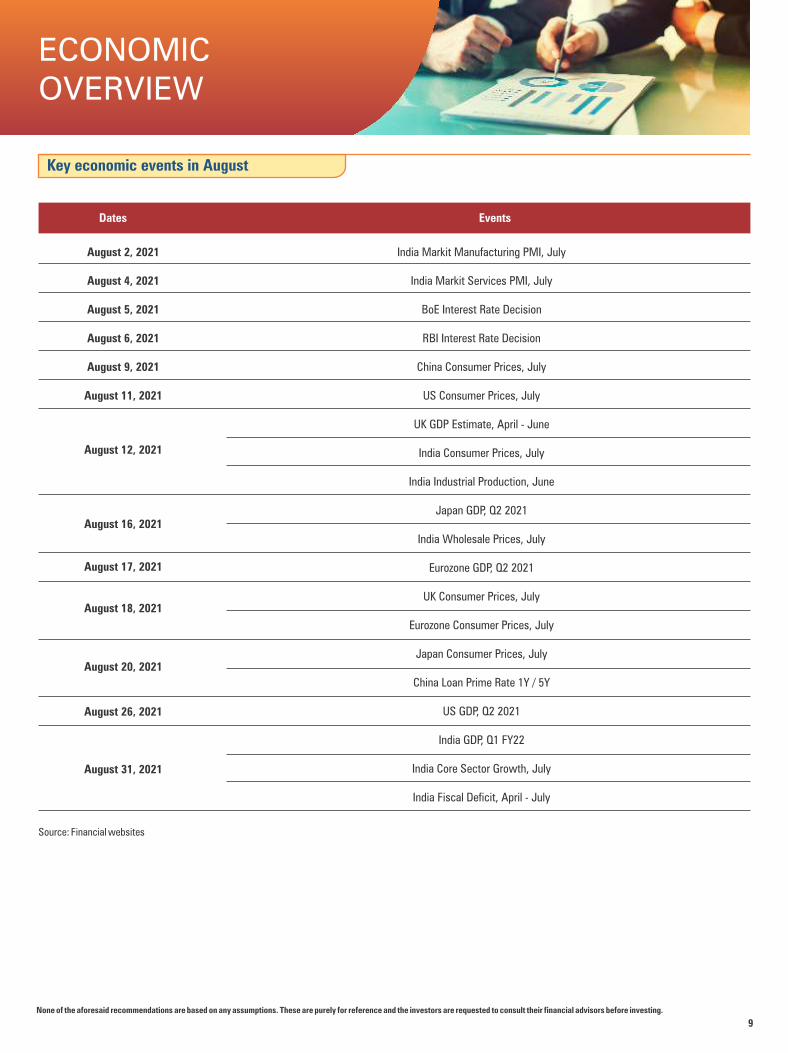
Dates Events
Source: Financial websites
August 2, 2021
August 4, 2021
August 5, 2021
August 6, 2021
August 9, 2021
August 11, 2021
Key economic events in August
India Markit Manufacturing PMI, July
India Markit Services PMI, July
BoE Interest Rate Decision
RBI Interest Rate Decision
China Consumer Prices, July
US Consumer Prices, July
UK GDP Estimate, April - June
India Consumer Prices, July
India Industrial Production, June
Japan GDP, Q2 2021
India Wholesale Prices, July
Eurozone GDP, Q2 2021
UK Consumer Prices, July
Eurozone Consumer Prices, July
Japan Consumer Prices, July
China Loan Prime Rate 1Y / 5Y
US GDP, Q2 2021
India GDP, Q1 FY22
India Core Sector Growth, July
India Fiscal Deficit, April - July
August 20, 2021
August 31, 2021
August 12, 2021
August 16, 2021
August 17, 2021
August 18, 2021
August 26, 2021
10
MARKET REVIEW
None of the aforesaid recommendations are based on any assumptions. These are purely for reference and the investors are requested to consult their financial advisors before investing.
India Equity Market Performance
Index performance Institutional flows
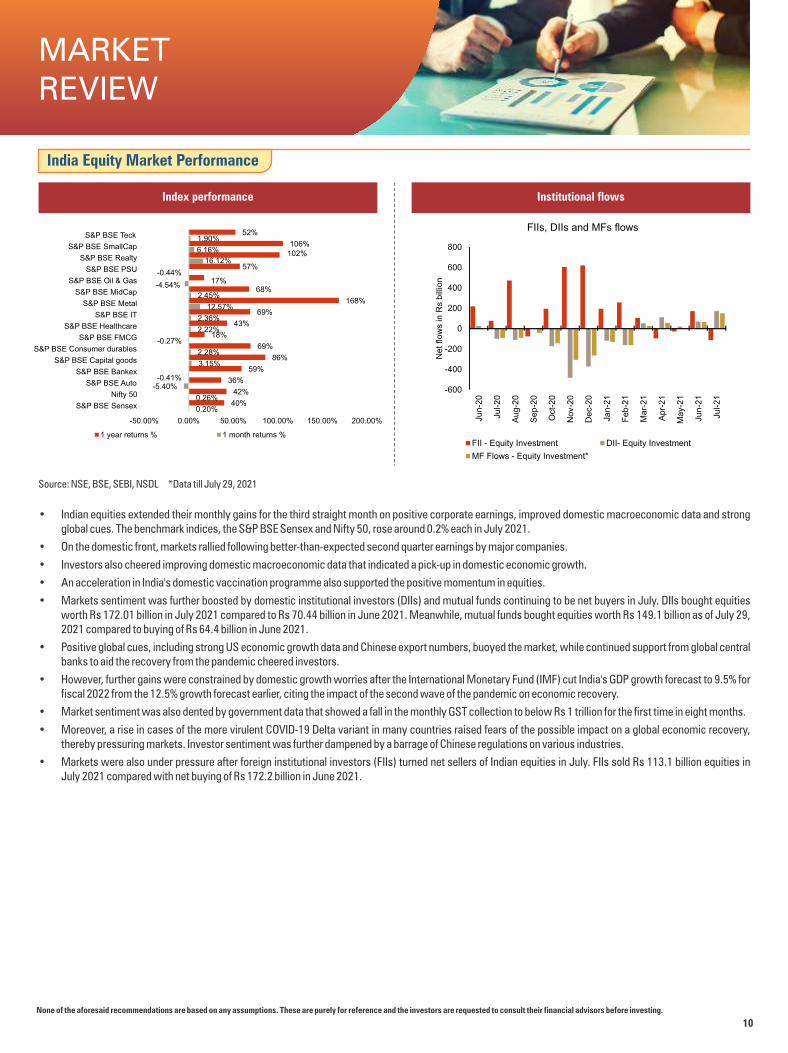
Source: NSE, BSE, SEBI, NSDL *Data till July 29, 2021
• Indian equities extended their monthly gains for the third straight month on positive corporate earnings, improved domestic macroeconomic data and strong global cues. The benchmark indices, the S&P BSE Sensex and Nifty 50, rose around 0.2% each in July 2021.
• On the domestic front, markets rallied following better-than-expected second quarter earnings by major companies.
• Investors also cheered improving domestic macroeconomic data that indicated a pick-up in domestic economic growth.
• An acceleration in India's domestic vaccination programme also supported the positive momentum in equities.
• Markets sentiment was further boosted by domestic institutional investors (DIIs) and mutual funds continuing to be net buyers in July. DIIs bought equities worth Rs 172.01 billion in July 2021 compared to Rs 70.44 billion in June 2021. Meanwhile, mutual funds bought equities worth Rs 149.1 billion as of July 29, 2021 compared to buying of Rs 64.4 billion in June 2021.
• Positive global cues, including strong US economic growth data and Chinese export numbers, buoyed the market, while continued support from global central banks to aid the recovery from the pandemic cheered investors.
• However, further gains were constrained by domestic growth worries after the International Monetary Fund (IMF) cut India's GDP growth forecast to 9.5% for fiscal 2022 from the 12.5% growth forecast earlier, citing the impact of the second wave of the pandemic on economic recovery.
• Market sentiment was also dented by government data that showed a fall in the monthly GST collection to below Rs 1 trillion for the first time in eight months.
• Moreover, a rise in cases of the more virulent COVID-19 Delta variant in many countries raised fears of the possible impact on a global economic recovery, thereby pressuring markets. Investor sentiment was further dampened by a barrage of Chinese regulations on various industries.
• Markets were also under pressure after foreign institutional investors (FIIs) turned net sellers of Indian equities in July. FIIs sold Rs 113.1 billion equities in July 2021 compared with net buying of Rs 172.2 billion in June 2021.
0.20%
0.26%
-5.40%-0.41%
3.15%
2.28%
-0.27%
2.22%
2.36%
12.57%
2.45%
-4.54%
-0.44%
16.12%
6.16%
1.90%
40%
42%
36%
59%
86%
69%
18%
43%
69%
168%
68%17%
57%
102%106%
52%
-50.00% 0.00% 50.00% 100.00% 150.00% 200.00%
S&P BSE Sensex
Nifty 50
S&P BSE Auto
S&P BSE Bankex
S&P BSE Capital goods
S&P BSE Consumer durables
S&P BSE FMCG
S&P BSE Healthcare
S&P BSE IT
S&P BSE Metal
S&P BSE MidCap
S&P BSE Oil & Gas
S&P BSE PSU
S&P BSE Realty
S&P BSE SmallCap
S&P BSE Teck
1 year returns % 1 month returns %
-600
-400
-200
0
200
400
600
800
Jun-2
0
Jul-20
Aug-2
0
Sep-2
0
Oct
-20
Nov-
20
Dec-
20
Jan-2
1
Feb-2
1
Mar-
21
Apr-
21
May-
21
Jun-2
1
Jul-21
Net flo
ws
in R
s bill
ion
FIIs, DIIs and MFs flows
FII - Equity Investment DII- Equity Investment
MF Flows - Equity Investment*
11
July was a mixed month for global indices, US led the pack with more than 2% returns and China and Hongkong struggled with more than negative 5% returns. Indian Equity Markets (Nifty 50 Index) gained by 0.3% during the month while midcap and smallcap rose by 3.1% and 8.1% respectively, due to decline in COVID-19 cases, pick-up in vaccination drive and ease of lockdown like restrictions in some states. (Source: Kotak Research)
Globally, Developed Market (DM) rally was led by US with a significant rise in demand especially pent-up household demand post COVID second wave. The US Fed kept policy rates and asset purchase program unchanged in its July meeting as the economy continued to recover. Rise in inflation was viewed as being influenced largely by transitory factors. The statements indicated that the Fed will be assessing its size of asset purchases in the coming meetings. Fed Chair Powell reiterated that the accommodative stance would continue until substantial progress has been made towards achieving price stability and maximum employment and he would want to see some strong jobs numbers. China markets corrected sharply led by technology and educations stocks on the back of regulatory-reset.
Indian Markets posted strong outperformance compared to emerging markets (MSCI EM declined by 7%). Investor's sentiments remained positive due to moderation in COVID-19 cases, good earnings season and lifting up of restrictions in some states. Domestic Institutional Investors (DIIs) remained net buyers of Indian equities (bought US$2.1 Bn) and Foreign Portfolio Investors (FPIs) were net sellers of Indian equities (sold US$1.3 Bn). The key triggers for Indian markets going forward can be 1) any policy measures, 2) the pace and quality of vaccination drives, 3) further lockdowns in certain parts restricting mobility and economic activities and 4) pace of implementation of Govt. reforms measures mentioned in the budget to revive economy. (Source : Kotak Research)
In sectoral trends, Realty and Metals were key contributors, due to increased demand and expectations of uptick in economic cycle, while Auto and energy were key laggards. (Source: NSE)
We believe, economic recovery though delayed continues to remain on track as the domestically, Govt. and RBI are taking active measures to spur growth through structural reforms and globally, economies continue to support Growth with various fiscal & monetary stimulus measures. With developed economies reporting strong set of activity numbers, demand recovery is expected which may benefit Indian exports. Based on our 'VCTS' Framework (Valuations, Cycle, Trigger and Sentiments), we can comprehend that Valuations are not cheap, Business Cycle remains in the nascent stage, future market triggers would be: COVID-19 situation how it evolves with new Delta variant cases getting reported, pace & quality of vaccination drive, impact of stop/start regime on COVID related restrictions, a stickier inflation profile on the back of rise in crude prices and US Fed trajectory on taper. Sentiments are not euphoric, but appear high in certain pockets. Hence, we remain neither too aggressive nor to negative on equities and would recommend schemes which provides flexibility and nimbleness to navigate current market conditions. We believe, the current macro-economic scenario is much more conducive for a Business Cycle Recovery due to Global and domestic policy response and sentiments too are not euphoric. We continue to remain positive on sectors which are closely linked to the economy like Banks, Capital Goods, Infrastructure, Metals & Mining, etc. We believe Indian markets may recover and do well until the following triggers play out - US acknowledging inflation & in conclusion pausing stimulus and US Treasury Yields reaching 2%.
Hence, to summarize, we believe this phase may require investment portfolios to be highly nimble while giving due importance to overall asset allocation. Therefore, we recommend adapting the 'ABCD' investment framework with an aim to benefit from fast changing macros and to manage volatility. A - ICICI Prudential Asset Allocation Strategies (ICICI Prudential Asset Allocator Fund (FOF) & Multi-Asset Strategy-ICICI Prudential Multi-Asset Fund), B - ICICI Prudential Balanced Advantage Fund, C - ICICI Prudential Business Cycle Fund, D - Strategies which are available at Discount to broader markets - ICICI Prudential Focused Equity Fund, ICICI Prudential Value Discovery Fund, ICICI Prudential India Opportunities Fund, ICICI Prudential Dividend Yield Equity Fund and ICICI Prudential Infrastructure Fund. Investing in these schemes over long term may provide a thrust to your wealth creation journey
None of the aforesaid recommendations are based on any assumptions. These are purely for reference and the investors are requested to consult their financial advisors before investing.
EQUITYMARKETOUTLOOK
MARKET OUTLOOK
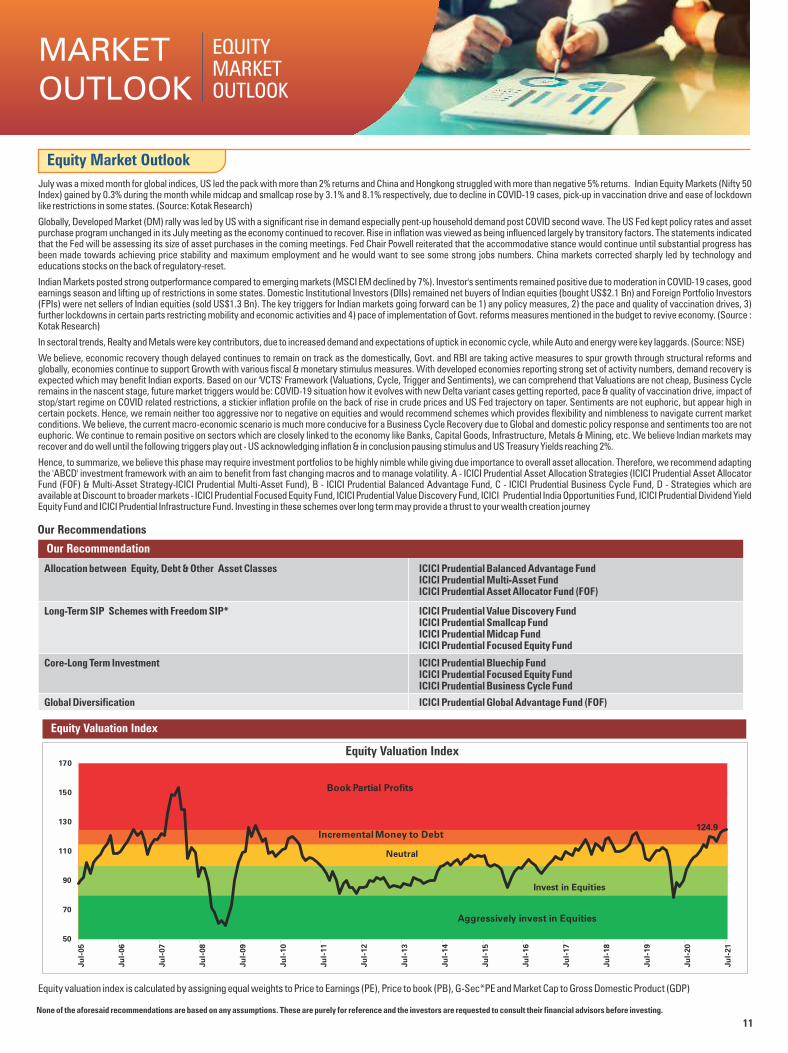
Equity Market Outlook
Our Recommendation
Allocation between Equity, Debt & Other Asset Classes ICICI Prudential Balanced Advantage Fund ICICI Prudential Multi-Asset FundICICI Prudential Asset Allocator Fund (FOF)
Our Recommendations
Long-Term SIP Schemes with Freedom SIP* ICICI Prudential Value Discovery Fund ICICI Prudential Smallcap FundICICI Prudential Midcap FundICICI Prudential Focused Equity Fund
Core-Long Term Investment ICICI Prudential Bluechip FundICICI Prudential Focused Equity Fund ICICI Prudential Business Cycle Fund
Global Diversification ICICI Prudential Global Advantage Fund (FOF)
Equity Valuation Index
Equity Valuation Index
Equity valuation index is calculated by assigning equal weights to Price to Earnings (PE), Price to book (PB), G-Sec*PE and Market Cap to Gross Domestic Product (GDP)
50
70
90
110
130
150
170
Ju
l-05
Ju
l-06
Ju
l-07
Ju
l-08
Ju
l-09
Ju
l-10
Ju
l-11
Ju
l-12
Ju
l-13
Ju
l-14
Ju
l-15
Ju
l-16
Ju
l-17
Ju
l-18
Ju
l-19
Ju
l-20
Ju
l-21
Aggressively invest in Equities
Neutral
Incremental Money to Debt
Book Partial Profits
124.9
Invest in Equities
12
MARKET REVIEW
None of the aforesaid recommendations are based on any assumptions. These are purely for reference and the investors are requested to consult their financial advisors before investing.
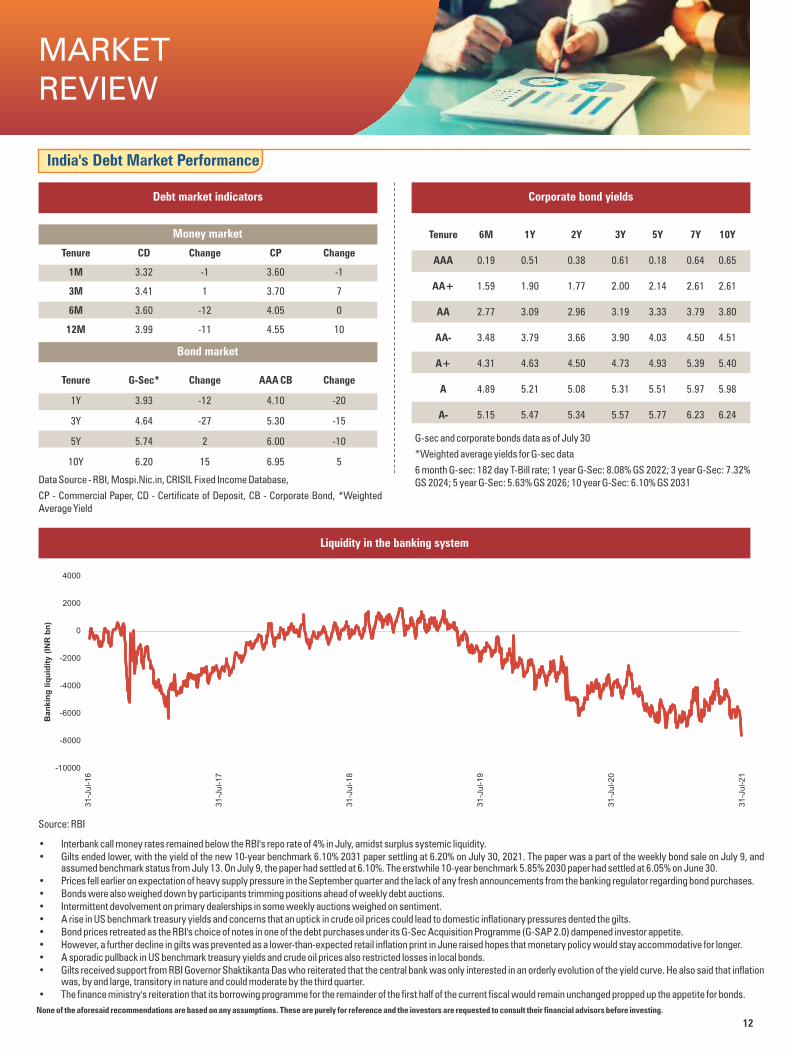
India's Debt Market Performance
Debt market indicators Corporate bond yields
Data Source - RBI, Mospi.Nic.in, CRISIL Fixed Income Database,
CP - Commercial Paper, CD - Certificate of Deposit, CB - Corporate Bond, *Weighted Average Yield
Money market
Tenure CD Change CP Change
1M 3.32 -1 3.60 -1
3M 3.41 1 3.70 7
6M 3.60 -12 4.05 0
12M 3.99 -11 4.55 10
Bond market
Tenure G-Sec* Change AAA CB Change
1Y 3.93 -12 4.10 -20
3Y 4.64 -27 5.30 -15
5Y 5.74 2 6.00 -10
10Y 6.20 15 6.95 5
G-sec and corporate bonds data as of July 30
*Weighted average yields for G-sec data
6 month G-sec: 182 day T-Bill rate; 1 year G-Sec: 8.08% GS 2022; 3 year G-Sec: 7.32% GS 2024; 5 year G-Sec: 5.63% GS 2026; 10 year G-Sec: 6.10% GS 2031
Liquidity in the banking system
Source: RBI
• Interbank call money rates remained below the RBI's repo rate of 4% in July, amidst surplus systemic liquidity.• Gilts ended lower, with the yield of the new 10-year benchmark 6.10% 2031 paper settling at 6.20% on July 30, 2021. The paper was a part of the weekly bond sale on July 9, and
assumed benchmark status from July 13. On July 9, the paper had settled at 6.10%. The erstwhile 10-year benchmark 5.85% 2030 paper had settled at 6.05% on June 30.• Prices fell earlier on expectation of heavy supply pressure in the September quarter and the lack of any fresh announcements from the banking regulator regarding bond purchases.• Bonds were also weighed down by participants trimming positions ahead of weekly debt auctions.• Intermittent devolvement on primary dealerships in some weekly auctions weighed on sentiment.• A rise in US benchmark treasury yields and concerns that an uptick in crude oil prices could lead to domestic inflationary pressures dented the gilts.• Bond prices retreated as the RBI's choice of notes in one of the debt purchases under its G-Sec Acquisition Programme (G-SAP 2.0) dampened investor appetite.• However, a further decline in gilts was prevented as a lower-than-expected retail inflation print in June raised hopes that monetary policy would stay accommodative for longer.• A sporadic pullback in US benchmark treasury yields and crude oil prices also restricted losses in local bonds.• Gilts received support from RBI Governor Shaktikanta Das who reiterated that the central bank was only interested in an orderly evolution of the yield curve. He also said that inflation
was, by and large, transitory in nature and could moderate by the third quarter.• The finance ministry's reiteration that its borrowing programme for the remainder of the first half of the current fiscal would remain unchanged propped up the appetite for bonds.
Tenure 6M 1Y 2Y 3Y 5Y 7Y 10Y
AAA 0.19 0.51 0.38 0.61 0.18 0.64 0.65
AA+ 1.59 1.90 1.77 2.00 2.14 2.61 2.61
AA 2.77 3.09 2.96 3.19 3.33 3.79 3.80
AA- 3.48 3.79 3.66 3.90 4.03 4.50 4.51
A+ 4.31 4.63 4.50 4.73 4.93 5.39 5.40
A 4.89 5.21 5.08 5.31 5.51 5.97 5.98
A- 5.15 5.47 5.34 5.57 5.77 6.23 6.24
-10000
-8000
-6000
-4000
-2000
0
2000
4000
31
-Jul-1
6
31
-Jul-1
7
31
-Jul-1
8
31
-Jul-1
9
31
-Jul-2
0
31
-Jul-2
1
Ban
kin
g l
iqu
idit
y (
INR
bn
)
13
Gilts prices ended slightly lower with the yield on the 10-year benchmark 5.85% 2030 paper settling at 6.20% on July 31, 2021, compared with 6.05% on June 30.(Source:CRISIL)
Yields rose with the firming up of inflation and the central government announcing pandemic relief measures implying an increase to the already high scheduled market borrowing.
Retail inflation eased to 6.26% in Jun'21, from 6.30% in May'21, staying above RBI Monetary Policy Committee's (MPC) upper range of 6%, for the 2nd consecutive month. While inflation eased compared to last month, higher fuel prices and sticky core inflation pushed CPI to its highest in 2021 in real terms.
With inflation numbers easing below May'21 levels, RBI will have more leeway to focus on stimulating growth and keeping borrowing costs low in the upcoming monetary policy meeting in August.
The Finance Minister announced several relief measures to the tune of Rs 6.29 lakh crs which includes a mix of direct fiscal cost to the government as well as additional contingent liabilities in the form of credit guarantees to various sectors.
On the economy front, following a dip in the new Covid 19 cases over the last few weeks, many states have commenced a phased unlocking over the month of June 2021. The early high frequency indicators confirm a sequential improvement in June 2021. Concerns over a third wave and impact of a new Delta plus variant are, however, under watch.
Going forward, RBI may have to do a fine balancing act. On one hand, there is a possibility of further downside risk to the growth recovery, which in normal conditions would have warranted for easing of monetary condition and on the other hand RBI would need to keep an eye on upside risk to inflation.
Hence, we believe the above evolving conditions points towards a more nimble and active duration management strategy which may help in navigating higher interest rate sensitive period. Also, as communicated earlier, we believe that we are at the fag-end of interest rate cycle and the above mentioned strategy would provide better accrual (active strategy which may take advantage of higher term premium) and would help in mitigating mark-to-market impact (active strategy of having adequate short duration instruments). It may be an opportune time to invest in floating rate bond in this interest rate scenario with expected volatility.
In the coming years, we recommend following strategies: Accrual Strategy and Active Duration strategy. Accrual strategy due to high spread premium which is still prevalent between the spread assets and AAA & MMI instruments, as going forward capital appreciation strategy may take a back seat due to limited rate cuts. Term premiums (spread between longer and shorter end of the yield curve) remains one of the highest seen historically, because of which active duration strategy is recommended to benefit from the high term premium. In our portfolios, we may follow barbell strategy i.e having high exposure to extreme short-end instruments with an aim to protect the portfolio from interest rate movements and high exposure to long-end instruments with an aim to benefit from higher carry.
None of the aforesaid recommendations are based on any assumptions. These are purely for reference and the investors are requested to consult their financial advisors before investing.
Fixed Income Outlook
MARKET OUTLOOK
Fixed Income Outlook
Approach
Arbitrage ICICI Prudential Equity Arbitrage Fund Invest with 3 Months & above horizon
Fixed Income Recommendations
Scheme Name Call to Action Rationale
Spreads at reasonable levels
Short Duration ICICI Prudential Savings Fund ICICI Prudential Ultra Short Term Fund ICICI Prudential Floating Interest Fund
Invest for parking surplus funds Accrual + Moderate Volatility
Accrual Schemes ICICI Prudential Credit Risk Fund ICICI Prudential Medium Term Bond Fund
Core Portfolio with >1 Yr investment horizon Better Accrual
Dynamic Duration ICICI Prudential All Seasons Bond Fund Long Term Approach with >3 Yrs investment horizon Active Duration and Better Accrual
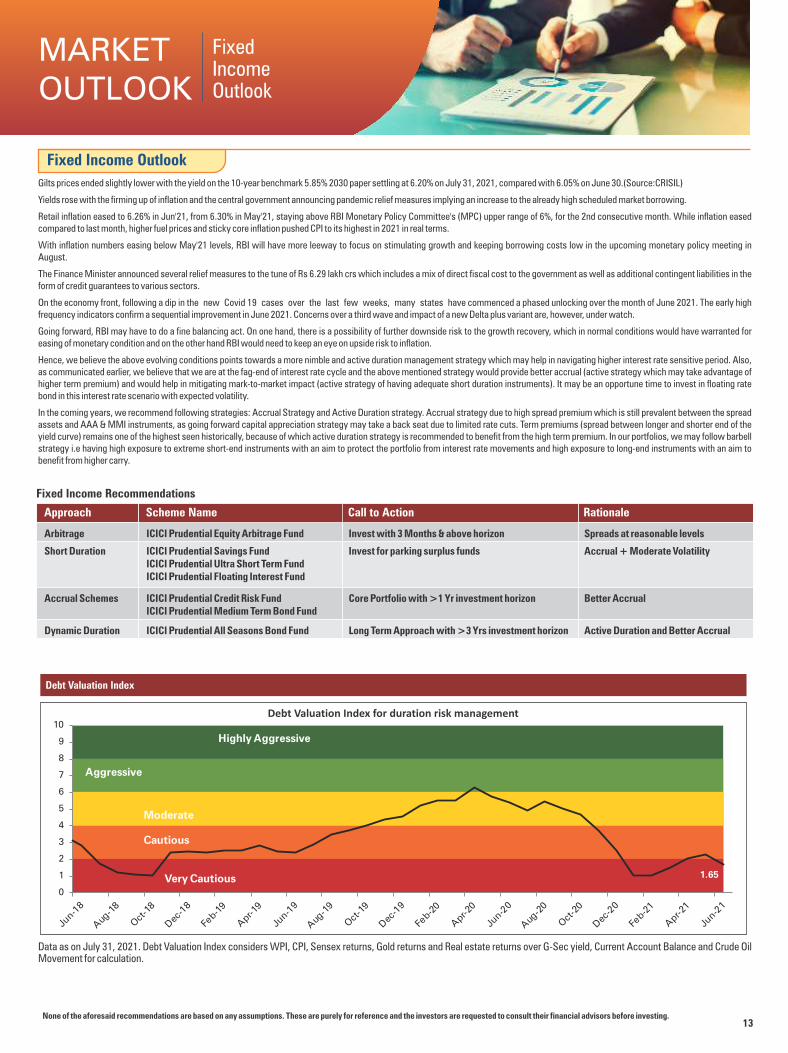
Debt Valuation Index
Debt Valuation Index for duration risk management
Data as on July 31, 2021. Debt Valuation Index considers WPI, CPI, Sensex returns, Gold returns and Real estate returns over G-Sec yield, Current Account Balance and Crude Oil Movement for calculation.
1.65
0
1
2
3
4
5
6
7
8
9
10
Very Cautious
Cautious
Moderate
Aggressive
Highly Aggressive
14
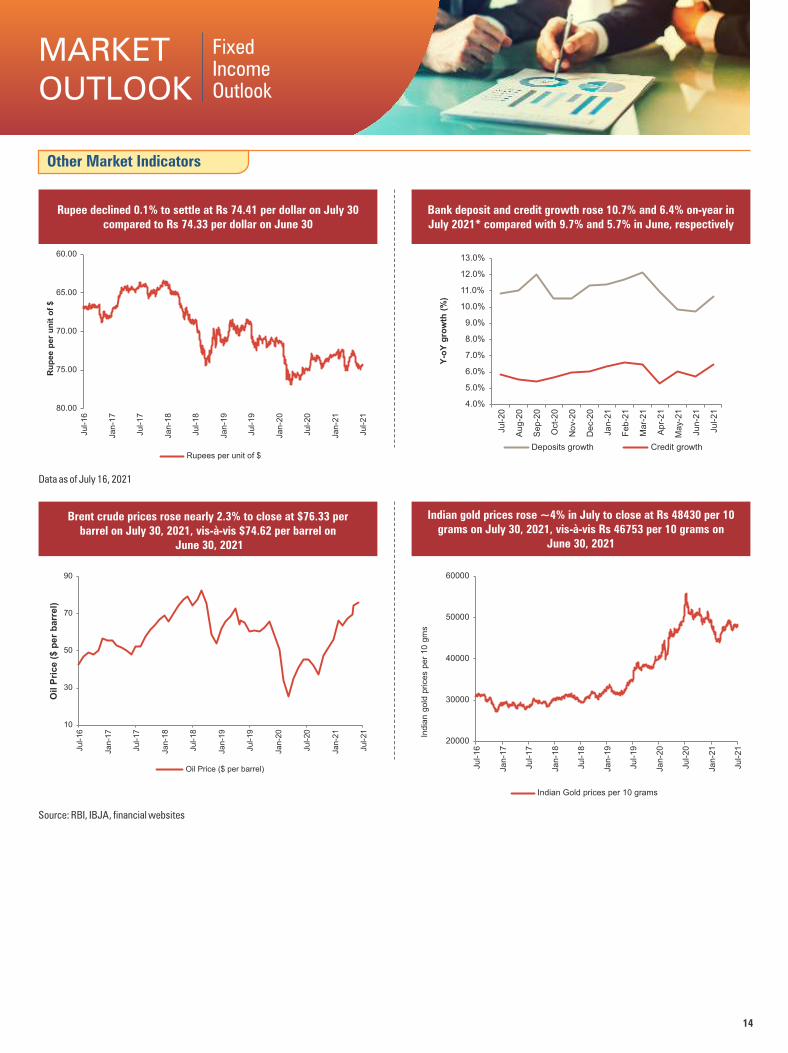
Rupee declined 0.1% to settle at Rs 74.41 per dollar on July 30 compared to Rs 74.33 per dollar on June 30
Bank deposit and credit growth rose 10.7% and 6.4% on-year in July 2021* compared with 9.7% and 5.7% in June, respectively
Brent crude prices rose nearly 2.3% to close at $76.33 per barrel on July 30, 2021, vis-à-vis $74.62 per barrel on
June 30, 2021
Indian gold prices rose ~4% in July to close at Rs 48430 per 10 grams on July 30, 2021, vis-à-vis Rs 46753 per 10 grams on
June 30, 2021
Other Market Indicators
Source: RBI, IBJA, financial websites
Data as of July 16, 2021
Fixed Income Outlook
MARKET OUTLOOK
60.00
65.00
70.00
75.00
80.00
Jul-16
Jan-1
7
Jul-17
Jan-1
8
Jul-18
Jan-1
9
Jul-19
Jan-2
0
Jul-20
Jan-2
1
Jul-21
Rupees per unit of $
Ru
pee p
er
un
it o
f $
4.0%
5.0%
6.0%
7.0%
8.0%
9.0%
10.0%
11.0%
12.0%
13.0%
Jul-20
Aug-2
0
Sep-2
0
Oct-
20
No
v-2
0
De
c-2
0
Jan-2
1
Feb
-21
Mar-
21
Apr-
21
May-
21
Jun-2
1
Jul-21
Y-o
Y g
row
th (
%)
Deposits growth Credit growth
10
30
50
70
90
Jul-
16
Jan
-17
Jul-
17
Jan
-18
Jul-
18
Jan
-19
Jul-
19
Jan
-20
Jul-
20
Jan
-21
Jul-
21
Oil P
rice (
$ p
er
barr
el)
Oil Price ($ per barrel)
20000
30000
40000
50000
60000
Ju
l-16
Ja
n-1
7
Ju
l-17
Ja
n-1
8
Ju
l-18
Ja
n-1
9
Ju
l-19
Ja
n-2
0
Ju
l-20
Ja
n-2
1
Ju
l-21
India
n g
old
prices
per
10 g
ms
Indian Gold prices per 10 grams
15
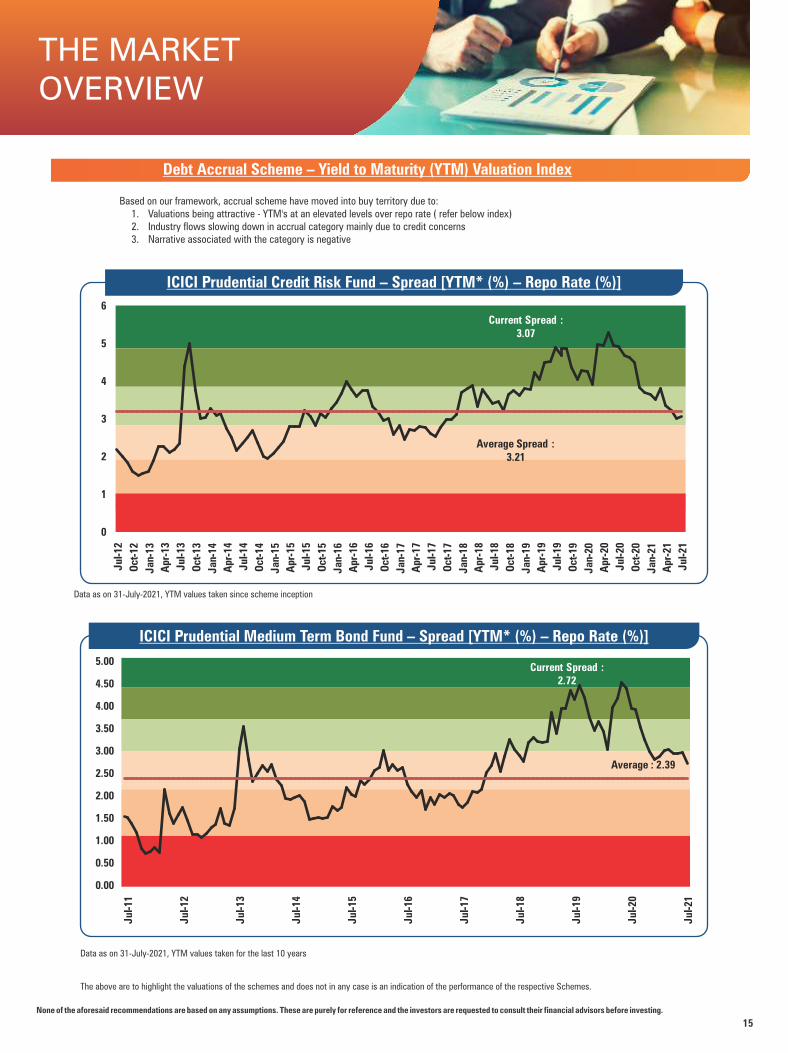
Average : 2.39
Current Spread : 2.72
0.00
0.50
1.00
1.50
2.00
2.50
3.00
3.50
4.00
4.50
5.00
Jul
-11
Jul
-12
Jul
-13
Jul
-14
Jul
-15
Jul
-16
Jul
-17
Jul
-18
Jul
-19
Jul
-20
Jul
-21
Average Spread : 3.21
Current Spread : 3.07
0
1
2
3
4
5
6
Jul
-12
Oct
-12
Jan
-13
Apr
-13
Jul
-13
Oct
-13
Jan
-14
Apr
-14
Jul
-14
Oct
-14
Jan
-15
Apr
-15
Jul
-15
Oct
-15
Jan
-16
Apr
-16
Jul
-16
Oct
-16
Jan
-17
Apr
-17
Jul
-17
Oct
-17
Jan
-18
Apr
-18
Jul
-18
Oct
-18
Jan
-19
Apr
-19
Jul
-19
Oct
-19
Jan
-20
Apr
-20
Jul
-20
Oct
-20
Jan
-21
Apr
-21
Jul
-21
Based on our framework, accrual scheme have moved into buy territory due to: 1. Valuations being attractive - YTM's at an elevated levels over repo rate ( refer below index) 2. Industry flows slowing down in accrual category mainly due to credit concerns 3. Narrative associated with the category is negative
Data as on 31-July-2021, YTM values taken since scheme inception
Data as on 31-July-2021, YTM values taken for the last 10 years
Debt Accrual Scheme – Yield to Maturity (YTM) Valuation Index
The above are to highlight the valuations of the schemes and does not in any case is an indication of the performance of the respective Schemes.
THE MARKETOVERVIEW
ICICI Prudential Credit Risk Fund – Spread [YTM* (%) – Repo Rate (%)]
ICICI Prudential Medium Term Bond Fund – Spread [YTM* (%) – Repo Rate (%)]
None of the aforesaid recommendations are based on any assumptions. These are purely for reference and the investors are requested to consult their financial advisors before investing.

16
Style Box
Notes:1. Different plans shall have different expense structure. The performance details provided herein are of ICICI Prudential Bluechip Fund.2. The scheme is currently managed by Anish Tawakley, Rajat Chandak and Vaibhav Dusad. Mr. Anish Tawakley has been managing this fund since Sep 2018. Total Schemes managed by the Fund Manager is 7 (6
are jointly managed). Mr. Rajat Chandak has been managing this fund since Jul 2017. Total Schemes managed by the Fund Manager is 5 (5 are jointly managed). Mr. Vaibhav Dusad has been managing this fund since Jan 2021. Total Schemes managed by the Fund Manager is 3 (3 are jointly managed). Refer annexure from page no. 132 for performance of other schemes
currently managed by Anish Tawakley, Rajat Chandak and Vaibhav Dusad.3. Date of inception:23-May-08.4. Past performance may or may not be sustained in future and the same may not necessarily provide the basis for comparison with other investment.5. Load is not considered for computation of returns.6. In case, the start/end date of the concerned period is a nonbusiness date (NBD), the NAV of the previous date is considered for computation of returns. The NAV per unit shown in the table is as on the start date of
the said period7. The performance of the scheme is benchmarked to the Total Return variant of the Index. The benchmark of the scheme has been revised from Nifty 50 TRI to Nifty 100 TRI w.e.f. May 28, 2018.
Returns of ICICI Prudential Bluechip Fund - Growth Option as on July 31, 2021
1 Year 3 Years 5 Years Since inceptionParticulars
40.39 41.69
Scheme
Nifty 100 TRI (Benchmark)
Nifty 50 TRI (Additional Benchmark)
NAV (Rs.) Per Unit (as on July 30,2021 : 59.02)
CAGR (%)
Current Value of
Investment of Rs. 10000
CAGR (%)
Current Value of
Investment of Rs. 10000
CAGR (%)
Current Value of
Investment of Rs. 10000
31.71
CAGR (%)
Current Value of
Investment of Rs. 10000
10.00
Portfolio as on July 31, 2021
Fund Details
Monthly AAUM as on 31-Jul-21 : Rs. 28,078.48 crores
Closing AUM as on 31-Jul-21 : Rs. 28,287.57 crores `
Fund Managers** :Anish Tawakley (Managing this fund since Sep, 2018 & Overall 26 years of experience)
Rajat Chandak (Managing this fund since Jul, 2017 & Overall 11 years of experience)
Mr. Vaibhav Dusad (Managing this fund since Jan, 2021 & Overall 9 years of experience)
Indicative Investment Horizon: 5 years & above
Inception/Allotment date: 23-May-08 Exit load for Redemption / Switchout :- Lumpsum & SIP / STP / SWP OptionUpto 1 Year from allotment - 1% of applicable NAV, more than 1 Year - Nil
Total Expense Ratio @@ :Other : 1.70% p. a.Direct : 1.10% p. a.
46.28 14612.53 12.29 14156.87 13.21 18612.43 14.40 59020.00
44.76 14461.45 12.61 14280.57 14.06 19315.71 11.07 39976.53
44.30 14415.96 12.90 14391.01 14.18 19418.55 10.52 37431.78
The figures are not netted for derivative transactions.Risk-free rate based on the last Overnight MIBOR cut-off of 3.40%**In addition to the fund manager managing this fund, overseas investment is managed by Ms. Priyanka Khandelwal.@@ Total Expense Ratio is as on the last business day of the month.Refer page no 123 to 131 for details on option, entry load, SWP, STP/Flex STP/Value STP & minimum redemption amount pertaining to the scheme.For IDCW History : Refer page no. from 152 to 159, For SIP Returns : Refer page no. from 147 to 150, For Investment Objective : Refer page no. from 160 to 163
Quantitative Indicators
ICICI Prudential Bluechip Fund(An open ended equity scheme predominantly investing in large cap stocks.)
Value Blend Growth
Large
Mid
Small
Diversified
Style
Size
Large Cap Fund
Category
Application Amount for fresh Subscription :Rs.100 (plus in multiples of Re.1)
Min.Addl.Investment :Rs.100 (plus in multiples of Re.1)
NAV (As on 30-Jul-21): Growth Option : 59.02 IDCW Option : 24.60 Direct Plan Growth Option : 63.31 Direct Plan IDCW Option : 40.60 `̀ `̀` `
`
Average P/E :
34.01Average P/B :
5.07
Average Dividend Yield :
1.13
Std Dev (Annualised) :
20.98%
Sharpe Ratio :
0.50Portfolio Beta :
0.95
Annual Portfolio Turnover Ratio : Equity - 0.19 times
Top 10 Sectors
Riskometer
This Product is suitable for investors who are seeking*:
• Long Term Wealth Creation
• An open ended equity scheme predominantly investing in large cap stocks.
*Investors should consult their financial advisers if in doubt about whether theproduct is suitable for them.
Investors understand that their principal will be at Very High risk
Company/Issuer Rating % to % to NAV NAV Derivatives
Company/Issuer Rating % to % to NAV NAV Derivatives
• Top Ten HoldingsSecurities and the corresponding derivative exposure with less than 1% to NAV, have been clubbed together with a consolidated limit of 10%.Derivatives are considered at exposure value.
Equity Shares 95.95% -1.82% Auto 4.42% Maruti Suzuki India Ltd. 2.22% TVS Motor Company Ltd. 2.19% Banks 25.39% • ICICI Bank Ltd. 9.60% • HDFC Bank Ltd. 8.10% • Axis Bank Ltd. 5.60% Kotak Mahindra Bank Ltd. 1.15% State Bank Of India 0.94% Cement & Cement Products 2.12% Grasim Industries Ltd. 1.30% Ultratech Cement Ltd. 0.81% Construction Project 5.24% • Larsen & Toubro Ltd. 5.24% Consumer Non Durables 2.96% ITC Ltd. 1.66% United Breweries Ltd. 1.30% Ferrous Metals 1.67% Tata Steel Ltd. 1.67% Finance 4.36% • HDFC Ltd. 4.36% Insurance 2.72% • SBI Life Insurance Company Ltd. 2.72% Non - Ferrous Metals 2.11% Hindalco Industries Ltd. 2.11% Oil 1.26% Oil & Natural Gas Corporation Ltd. 1.26% Petroleum Products 7.26% • Reliance Industries Ltd. 5.64% Bharat Petroleum Corporation Ltd. 1.61% Pharmaceuticals 3.09% Sun Pharmaceutical Industries Ltd. 1.87% Cipla Ltd. 1.22% Power 1.66% NTPC Ltd. 1.66% Retailing 2.57% Avenue Supermarts Ltd. (D-Mart) 2.57% Software 13.59% • Infosys Ltd. 8.69%
• HCL Technologies Ltd. 2.60% Tech Mahindra Ltd. 2.30% Telecom - Services 5.69% • Bharti Airtel Ltd. 5.69% Index Futures/Options -1.82% Nifty 50 Index - Futures -1.82% Treasury Bills 0.14% 91 Days Treasury Bill 2021 SOV 0.14% Equity less than 1% of corpus 9.84% Short Term Debt and net current assets 5.73% Total Net Assets 100.00%
25.83%
14.38%
7.57%
5.79%
5.55%
5.24%
5.14%
4.38%
4.10%
3.24%
Banks
Software
Petroleum Products
Telecom - Services
Auto
Construction Project
Finance
Consumer Non Durables
Pharmaceuticals
Insurance
17
• Top Ten Holdings
Securities and the corresponding derivative exposure with less than 1% to NAV, have been clubbed together with a consolidated limit of 10%.
Derivatives are considered at exposure value.
Portfolio as on July 31, 2021
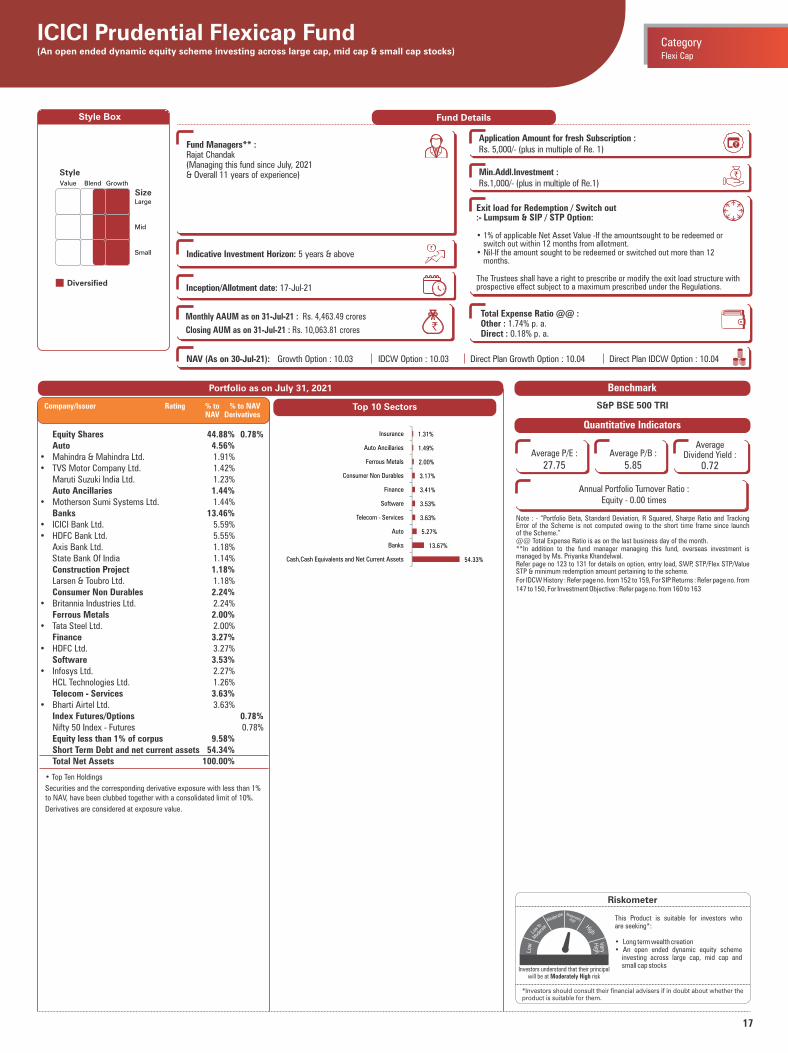
ICICI Prudential Flexicap Fund (An open ended dynamic equity scheme investing across large cap, mid cap & small cap stocks) Flexi Cap
Category
Note : - “Portfolio Beta, Standard Deviation, R Squared, Sharpe Ratio and Tracking Error of the Scheme is not computed owing to the short time frame since launch of the Scheme.”@@ Total Expense Ratio is as on the last business day of the month.**In addition to the fund manager managing this fund, overseas investment is managed by Ms. Priyanka Khandelwal.Refer page no 123 to 131 for details on option, entry load, SWP, STP/Flex STP/Value STP & minimum redemption amount pertaining to the scheme.For IDCW History : Refer page no. from 152 to 159, For SIP Returns : Refer page no. from 147 to 150, For Investment Objective : Refer page no. from 160 to 163
Quantitative Indicators
Benchmark
S&P BSE 500 TRI
Average P/E :
27.75Average P/B :
5.85
Average Dividend Yield :
0.72
Style Box
Value Blend Growth
Large
Mid
Small
Diversified
Style
Size
Fund Details
Fund Managers** :Rajat Chandak (Managing this fund since July, 2021& Overall 11 years of experience)
Indicative Investment Horizon: 5 years & above
Inception/Allotment date: 17-Jul-21
Monthly AAUM as on 31-Jul-21 : Rs. 4,463.49 crores
Closing AUM as on 31-Jul-21 : Rs. 10,063.81 crores `
NAV (As on 30-Jul-21): Growth Option : 10.03 IDCW Option : 10.03 Direct Plan Growth Option : 10.04 Direct Plan IDCW Option : 10.04
Application Amount for fresh Subscription :Rs. 5,000/- (plus in multiple of Re. 1)
Min.Addl.Investment :Rs.1,000/- (plus in multiple of Re.1)
Exit load for Redemption / Switch out:- Lumpsum & SIP / STP Option:
• 1% of applicable Net Asset Value -If the amountsought to be redeemed or switch out within 12 months from allotment.
• Nil-If the amount sought to be redeemed or switched out more than 12 months.
The Trustees shall have a right to prescribe or modify the exit load structure with prospective effect subject to a maximum prescribed under the Regulations.
Total Expense Ratio @@ :Other : 1.74% p. a.Direct : 0.18% p. a.
`̀ `̀` `
`
Riskometer
This Product is suitable for investors who are seeking*:
• Long term wealth creation• An open ended dynamic equity scheme
investing across large cap, mid cap and small cap stocks
*Investors should consult their financial advisers if in doubt about whether theproduct is suitable for them.
Investors understand that their principal will be at Moderately High risk
Top 10 Sectors
Equity Shares 44.88% 0.78% Auto 4.56% • Mahindra & Mahindra Ltd. 1.91% • TVS Motor Company Ltd. 1.42% Maruti Suzuki India Ltd. 1.23% Auto Ancillaries 1.44% • Motherson Sumi Systems Ltd. 1.44% Banks 13.46% • ICICI Bank Ltd. 5.59% • HDFC Bank Ltd. 5.55% Axis Bank Ltd. 1.18% State Bank Of India 1.14% Construction Project 1.18% Larsen & Toubro Ltd. 1.18% Consumer Non Durables 2.24% • Britannia Industries Ltd. 2.24% Ferrous Metals 2.00% • Tata Steel Ltd. 2.00% Finance 3.27% • HDFC Ltd. 3.27% Software 3.53% • Infosys Ltd. 2.27% HCL Technologies Ltd. 1.26% Telecom - Services 3.63% • Bharti Airtel Ltd. 3.63% Index Futures/Options 0.78% Nifty 50 Index - Futures 0.78% Equity less than 1% of corpus 9.58% Short Term Debt and net current assets 54.34% Total Net Assets 100.00%
Company/Issuer Rating % to % to NAV NAV Derivatives
54.33%
13.67%
5.27%
3.63%
3.53%
3.41%
3.17%
2.00%
1.49%
1.31%
Cash,Cash Equivalents and Net Current Assets
Banks
Auto
Telecom - Services
Software
Finance
Consumer Non Durables
Ferrous Metals
Auto Ancillaries
Insurance
Annual Portfolio Turnover Ratio : Equity - 0.00 times
18
Style Box
Notes:1. Different plans shall have different expense structure. The performance details provided herein are of ICICI Prudential Large & Mid Cap Fund.2. The scheme is currently managed by Sankaran Naren and Parag Thakkar. Mr. Sankaran Naren has been managing this fund since Feb 2012. Total Schemes managed by the Fund Manager is 20 (20 are jointly
managed). Mr. Parag Thakkar has been managing this fund since June 2021. Total Schemes managed by the Fund Manager is 3 (2 are jointly managed). Refer annexure from page no. 132 for performance of other schemes
currently managed by Sankaran Naren and Parag Thakkar.3. Date of inception:09-Jul-98.4. Past performance may or may not be sustained in future and the same may not necessarily provide the basis for comparison with other investment.5. Load is not considered for computation of returns.6. In case, the start/end date of the concerned period is a nonbusiness date (NBD), the NAV of the previous date is considered for computation of returns. The NAV per unit shown in the table is as on the start date of
the said period7. The performance of the scheme is benchmarked to the Total Return variant of the Index. The benchmark of the scheme has been revised from Nifty 50 TRI to Nifty LargeMidcap 250 TRI w.e.f. May 28, 2018. As
TRI data for the earlier benchmark is not available since inception of the scheme, benchmark performance is calculated using composite CAGR of Nifty 50 PRI values from 09-Jul-98 to 30-Jun-99 and TRI values from 30-Jun-99 . For benchmark performance, values of earlier benchmark has been used till 27th May 2018 and revised benchmark values have been considered thereafter.
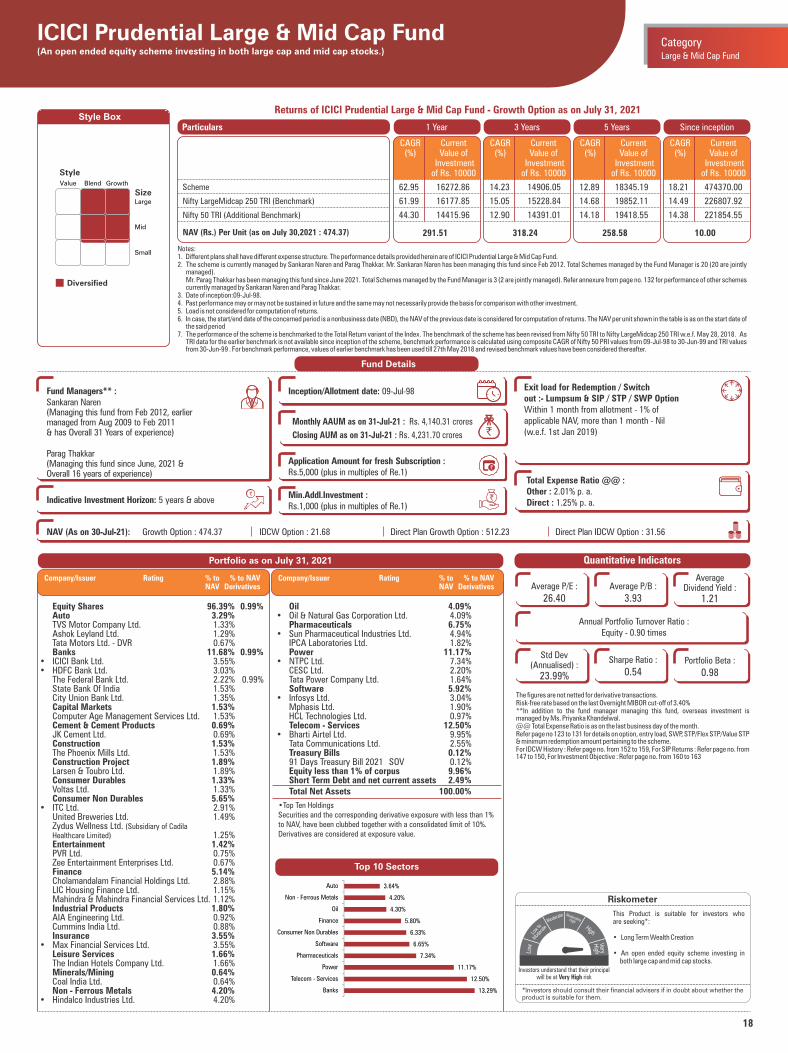
Returns of ICICI Prudential Large & Mid Cap Fund - Growth Option as on July 31, 2021
1 Year 3 Years 5 Years Since inceptionParticulars
291.51 318.24
Scheme
Nifty LargeMidcap 250 TRI (Benchmark)
Nifty 50 TRI (Additional Benchmark)
NAV (Rs.) Per Unit (as on July 30,2021 : 474.37)
CAGR (%)
Current Value of
Investment of Rs. 10000
CAGR (%)
Current Value of
Investment of Rs. 10000
CAGR (%)
Current Value of
Investment of Rs. 10000
258.58
CAGR (%)
Current Value of
Investment of Rs. 10000
10.00
Portfolio as on July 31, 2021
Fund Details
Monthly AAUM as on 31-Jul-21 : Rs. 4,140.31 crores
Closing AUM as on 31-Jul-21 : Rs. 4,231.70 crores `
Fund Managers** :Sankaran Naren (Managing this fund from Feb 2012, earlier managed from Aug 2009 to Feb 2011 & has Overall 31 Years of experience)
Parag Thakkar(Managing this fund since June, 2021 & Overall 16 years of experience)
Indicative Investment Horizon: 5 years & above
Inception/Allotment date: 09-Jul-98 Exit load for Redemption / Switchout :- Lumpsum & SIP / STP / SWP OptionWithin 1 month from allotment - 1% ofapplicable NAV, more than 1 month - Nil(w.e.f. 1st Jan 2019)
Total Expense Ratio @@ :Other : 2.01% p. a.Direct : 1.25% p. a.
62.95 16272.86 14.23 14906.05 12.89 18345.19 18.21 474370.00
61.99 16177.85 15.05 15228.84 14.68 19852.11 14.49 226807.92
44.30 14415.96 12.90 14391.01 14.18 19418.55 14.38 221854.55
The figures are not netted for derivative transactions.Risk-free rate based on the last Overnight MIBOR cut-off of 3.40%**In addition to the fund manager managing this fund, overseas investment is managed by Ms. Priyanka Khandelwal.@@ Total Expense Ratio is as on the last business day of the month.Refer page no 123 to 131 for details on option, entry load, SWP, STP/Flex STP/Value STP & minimum redemption amount pertaining to the scheme.For IDCW History : Refer page no. from 152 to 159, For SIP Returns : Refer page no. from 147 to 150, For Investment Objective : Refer page no. from 160 to 163
Quantitative Indicators
ICICI Prudential Large & Mid Cap Fund(An open ended equity scheme investing in both large cap and mid cap stocks.)
Value Blend Growth
Large
Mid
Small
Diversified
Style
Size
Large & Mid Cap Fund
Category
Application Amount for fresh Subscription :Rs.5,000 (plus in multiples of Re.1)
Min.Addl.Investment :Rs.1,000 (plus in multiples of Re.1)
NAV (As on 30-Jul-21): Growth Option : 474.37 IDCW Option : 21.68 Direct Plan Growth Option : 512.23 Direct Plan IDCW Option : 31.56 `̀ `̀` `
`
Average P/E :
26.40Average P/B :
3.93
Average Dividend Yield :
1.21
Std Dev (Annualised) :
23.99%
Sharpe Ratio :
0.54Portfolio Beta :
0.98
Annual Portfolio Turnover Ratio : Equity - 0.90 times
• Top Ten HoldingsSecurities and the corresponding derivative exposure with less than 1% to NAV, have been clubbed together with a consolidated limit of 10%.Derivatives are considered at exposure value.
Top 10 Sectors
Riskometer
This Product is suitable for investors who are seeking*:
• Long Term Wealth Creation
• An open ended equity scheme investing in both large cap and mid cap stocks.
*Investors should consult their financial advisers if in doubt about whether theproduct is suitable for them.
Investors understand that their principal will be at Very High risk
Company/Issuer Rating % to % to NAV NAV Derivatives
Company/Issuer Rating % to % to NAV NAV Derivatives
Equity Shares 96.39% 0.99% Auto 3.29% TVS Motor Company Ltd. 1.33% Ashok Leyland Ltd. 1.29% Tata Motors Ltd. - DVR 0.67% Banks 11.68% 0.99%• ICICI Bank Ltd. 3.55% • HDFC Bank Ltd. 3.03% The Federal Bank Ltd. 2.22% 0.99% State Bank Of India 1.53% City Union Bank Ltd. 1.35% Capital Markets 1.53% Computer Age Management Services Ltd. 1.53% Cement & Cement Products 0.69% JK Cement Ltd. 0.69% Construction 1.53% The Phoenix Mills Ltd. 1.53% Construction Project 1.89% Larsen & Toubro Ltd. 1.89% Consumer Durables 1.33% Voltas Ltd. 1.33% Consumer Non Durables 5.65% • ITC Ltd. 2.91% United Breweries Ltd. 1.49% Zydus Wellness Ltd. (Subsidiary of Cadila Healthcare Limited) 1.25% Entertainment 1.42% PVR Ltd. 0.75% Zee Entertainment Enterprises Ltd. 0.67% Finance 5.14% Cholamandalam Financial Holdings Ltd. 2.88% LIC Housing Finance Ltd. 1.15% Mahindra & Mahindra Financial Services Ltd. 1.12% Industrial Products 1.80% AIA Engineering Ltd. 0.92% Cummins India Ltd. 0.88% Insurance 3.55% • Max Financial Services Ltd. 3.55% Leisure Services 1.66% The Indian Hotels Company Ltd. 1.66% Minerals/Mining 0.64% Coal India Ltd. 0.64% Non - Ferrous Metals 4.20% • Hindalco Industries Ltd. 4.20%
Oil 4.09% • Oil & Natural Gas Corporation Ltd. 4.09% Pharmaceuticals 6.75% • Sun Pharmaceutical Industries Ltd. 4.94% IPCA Laboratories Ltd. 1.82% Power 11.17% • NTPC Ltd. 7.34% CESC Ltd. 2.20% Tata Power Company Ltd. 1.64% Software 5.92% • Infosys Ltd. 3.04% Mphasis Ltd. 1.90% HCL Technologies Ltd. 0.97% Telecom - Services 12.50% • Bharti Airtel Ltd. 9.95% Tata Communications Ltd. 2.55% Treasury Bills 0.12% 91 Days Treasury Bill 2021 SOV 0.12% Equity less than 1% of corpus 9.96% Short Term Debt and net current assets 2.49% Total Net Assets 100.00%
13.29%
12.50%
11.17%
7.34%
6.65%
6.33%
5.80%
4.30%
4.20%
3.64%
Banks
Telecom - Services
Power
Pharmaceuticals
Software
Consumer Non Durables
Finance
Oil
Non - Ferrous Metals
Auto
19
Style Box
Notes:1. Different plans shall have different expense structure. The performance details provided herein are of ICICI Prudential Multicap Fund.2. The scheme is currently managed by Prakash Gaurav Goel. Mr. Prakash Gaurav Goel has been managing this fund since July 2021. Total Schemes managed by the Fund Manager is 3 (1 are jointly managed).
Refer annexure from page no. 132 for performance of other schemes currently managed by Prakash Gaurav Goel.3. Date of inception:01-Oct-944. Past performance may or may not be sustained in future and the same may not necessarily provide the basis for comparison with other investment.5. Load is not considered for computation of returns.6. In case, the start/end date of the concerned period is a nonbusiness date (NBD), the NAV of the previous date is considered for computation of returns. The NAV per unit shown in the table is as on the start date of
the said period7. As the scheme was launched before the launch of the benchmark index, benchmark index figures since inception or the required period are not available.8. The performance of the scheme is benchmarked to the Total Return variant of the Index. As TRI data is not available since inception of the scheme, the additional benchmark performance is calculated using
composite CAGR of Nifty 50 PRI values from 01-Oct-94 to 30-Jun-99 and TRI values since 30-Jun-99. The benchmark of the scheme has been revised from S&P BSE 500 TRI to Nifty500 Multicap 50:25:25 TRI w.e.f. Jan 29, 2021. For benchmark performance, values of earlier benchmark has been used till 28th January 2021 and revised benchmark values have been considered thereafter.
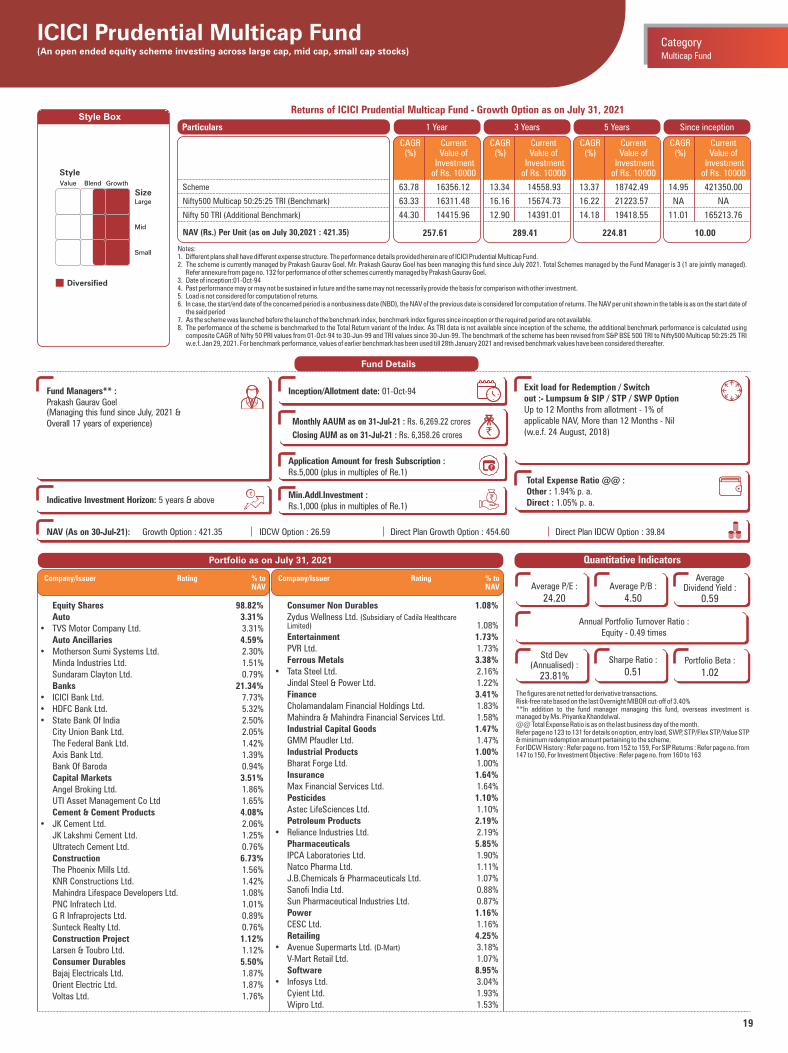
Returns of ICICI Prudential Multicap Fund - Growth Option as on July 31, 2021
1 Year 3 Years 5 Years Since inceptionParticulars
257.61 289.41
Scheme
Nifty500 Multicap 50:25:25 TRI (Benchmark)
Nifty 50 TRI (Additional Benchmark)
NAV (Rs.) Per Unit (as on July 30,2021 : 421.35)
CAGR (%)
Current Value of
Investment of Rs. 10000
CAGR (%)
Current Value of
Investment of Rs. 10000
CAGR (%)
Current Value of
Investment of Rs. 10000
224.81
CAGR (%)
Current Value of
Investment of Rs. 10000
10.00
Portfolio as on July 31, 2021
Fund Details
Monthly AAUM as on 31-Jul-21 : Rs. 6,269.22 crores
Closing AUM as on 31-Jul-21 : Rs. 6,358.26 crores `
Fund Managers** :Prakash Gaurav Goel (Managing this fund since July, 2021 &Overall 17 years of experience)
Indicative Investment Horizon: 5 years & above
Inception/Allotment date: 01-Oct-94 Exit load for Redemption / Switchout :- Lumpsum & SIP / STP / SWP OptionUp to 12 Months from allotment - 1% of applicable NAV, More than 12 Months - Nil(w.e.f. 24 August, 2018)
Total Expense Ratio @@ :Other : 1.94% p. a.Direct : 1.05% p. a.
63.78 16356.12 13.34 14558.93 13.37 18742.49 14.95 421350.00
63.33 16311.48 16.16 15674.73 16.22 21223.57 NA NA
44.30 14415.96 12.90 14391.01 14.18 19418.55 11.01 165213.76
The figures are not netted for derivative transactions.Risk-free rate based on the last Overnight MIBOR cut-off of 3.40%**In addition to the fund manager managing this fund, overseas investment is managed by Ms. Priyanka Khandelwal.@@ Total Expense Ratio is as on the last business day of the month.Refer page no 123 to 131 for details on option, entry load, SWP, STP/Flex STP/Value STP & minimum redemption amount pertaining to the scheme.For IDCW History : Refer page no. from 152 to 159, For SIP Returns : Refer page no. from 147 to 150, For Investment Objective : Refer page no. from 160 to 163
Quantitative Indicators
ICICI Prudential Multicap Fund(An open ended equity scheme investing across large cap, mid cap, small cap stocks)
Value Blend Growth
Large
Mid
Small
Diversified
Style
Size
Multicap Fund
Category
NAV (As on 30-Jul-21): Growth Option : 421.35 IDCW Option : 26.59 Direct Plan Growth Option : 454.60 Direct Plan IDCW Option : 39.84 `̀ `̀` `
`
Application Amount for fresh Subscription :Rs.5,000 (plus in multiples of Re.1)
Min.Addl.Investment :Rs.1,000 (plus in multiples of Re.1)
Average P/E :
24.20Average P/B :
4.50
Average Dividend Yield :
0.59
Std Dev (Annualised) :
23.81%
Sharpe Ratio :
0.51Portfolio Beta :
1.02
Annual Portfolio Turnover Ratio : Equity - 0.49 times
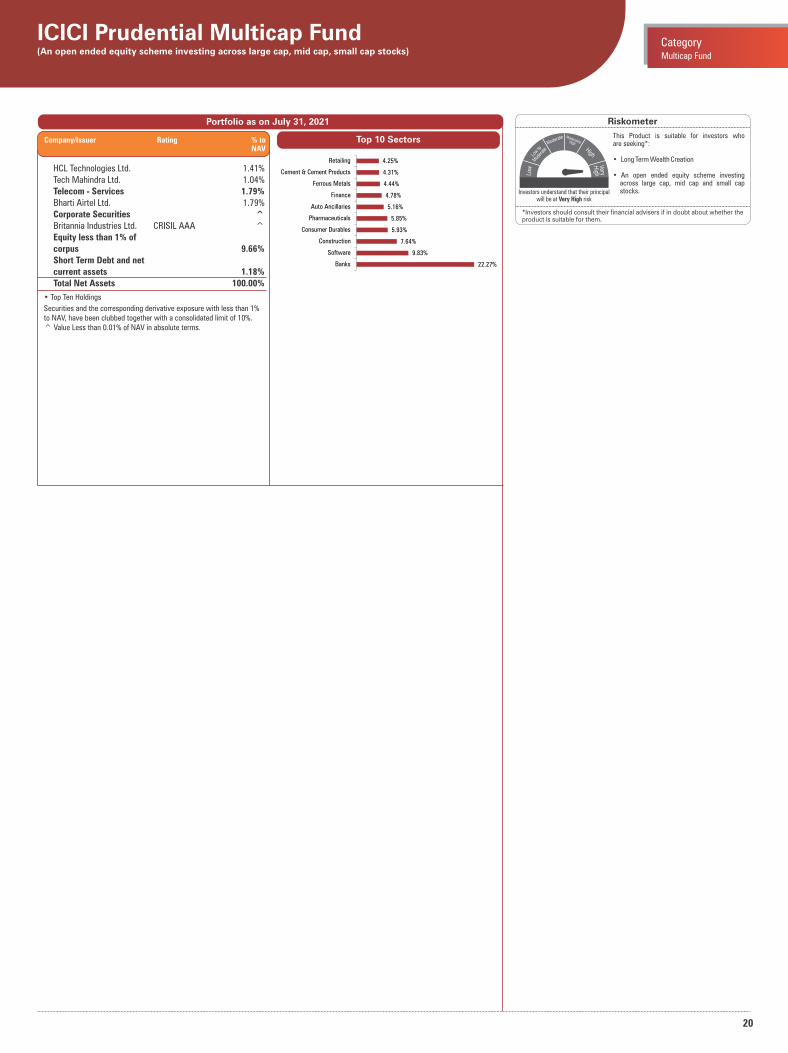
Equity Shares 98.82% Auto 3.31%• TVS Motor Company Ltd. 3.31% Auto Ancillaries 4.59%• Motherson Sumi Systems Ltd. 2.30% Minda Industries Ltd. 1.51% Sundaram Clayton Ltd. 0.79% Banks 21.34%• ICICI Bank Ltd. 7.73%• HDFC Bank Ltd. 5.32%• State Bank Of India 2.50% City Union Bank Ltd. 2.05% The Federal Bank Ltd. 1.42% Axis Bank Ltd. 1.39% Bank Of Baroda 0.94% Capital Markets 3.51% Angel Broking Ltd. 1.86% UTI Asset Management Co Ltd 1.65% Cement & Cement Products 4.08%• JK Cement Ltd. 2.06% JK Lakshmi Cement Ltd. 1.25% Ultratech Cement Ltd. 0.76% Construction 6.73% The Phoenix Mills Ltd. 1.56% KNR Constructions Ltd. 1.42% Mahindra Lifespace Developers Ltd. 1.08% PNC Infratech Ltd. 1.01% G R Infraprojects Ltd. 0.89% Sunteck Realty Ltd. 0.76% Construction Project 1.12% Larsen & Toubro Ltd. 1.12% Consumer Durables 5.50% Bajaj Electricals Ltd. 1.87% Orient Electric Ltd. 1.87% Voltas Ltd. 1.76%
Consumer Non Durables 1.08% Zydus Wellness Ltd. (Subsidiary of Cadila Healthcare Limited) 1.08% Entertainment 1.73% PVR Ltd. 1.73% Ferrous Metals 3.38%• Tata Steel Ltd. 2.16% Jindal Steel & Power Ltd. 1.22% Finance 3.41% Cholamandalam Financial Holdings Ltd. 1.83% Mahindra & Mahindra Financial Services Ltd. 1.58% Industrial Capital Goods 1.47% GMM Pfaudler Ltd. 1.47% Industrial Products 1.00% Bharat Forge Ltd. 1.00% Insurance 1.64% Max Financial Services Ltd. 1.64% Pesticides 1.10% Astec LifeSciences Ltd. 1.10% Petroleum Products 2.19%• Reliance Industries Ltd. 2.19% Pharmaceuticals 5.85% IPCA Laboratories Ltd. 1.90% Natco Pharma Ltd. 1.11% J.B.Chemicals & Pharmaceuticals Ltd. 1.07% Sanofi India Ltd. 0.88% Sun Pharmaceutical Industries Ltd. 0.87% Power 1.16% CESC Ltd. 1.16% Retailing 4.25%• Avenue Supermarts Ltd. (D-Mart) 3.18% V-Mart Retail Ltd. 1.07% Software 8.95%• Infosys Ltd. 3.04% Cyient Ltd. 1.93% Wipro Ltd. 1.53%
Company/Issuer Rating % to NAV
Company/Issuer Rating % to NAV
20
• Top Ten Holdings
Securities and the corresponding derivative exposure with less than 1% to NAV, have been clubbed together with a consolidated limit of 10%.^ Value Less than 0.01% of NAV in absolute terms.
Portfolio as on July 31, 2021
HCL Technologies Ltd. 1.41% Tech Mahindra Ltd. 1.04% Telecom - Services 1.79% Bharti Airtel Ltd. 1.79% Corporate Securities ^ Britannia Industries Ltd. CRISIL AAA ^ Equity less than 1% of corpus 9.66% Short Term Debt and net current assets 1.18% Total Net Assets 100.00%
ICICI Prudential Multicap Fund(An open ended equity scheme investing across large cap, mid cap, small cap stocks) Multicap Fund
Category
Top 10 SectorsCompany/Issuer Rating % to NAV
Riskometer
This Product is suitable for investors who are seeking*:
• Long Term Wealth Creation
• An open ended equity scheme investing across large cap, mid cap and small cap stocks.
*Investors should consult their financial advisers if in doubt about whether theproduct is suitable for them.
Investors understand that their principal will be at Very High risk
22.27%
9.83%
7.64%
5.93%
5.85%
5.16%
4.78%
4.44%
4.31%
4.25%
Banks
Software
Construction
Consumer Durables
Pharmaceuticals
Auto Ancillaries
Finance
Ferrous Metals
Cement & Cement Products
Retailing
21
Style Box
Notes:1. Different plans shall have different expense structure. The performance details provided herein are of ICICI Prudential India Opportunities Fund .2. The scheme is currently managed by Sankaran Naren & Roshan Chutkey. Mr. Sankaran Naren has been managing this fund since Jan 2019. Total Schemes managed by the Fund Manager is 20 (20 are jointly
managed). Mr. Roshan Chutkey has been managing this fund since Jan 2019. Total Schemes managed by the Fund Manager is 6 (3 are jointly managed). Refer annexure from page no. 132 for performance of other schemes
currently managed by Sankaran Naren & Roshan Chutkey.3. Date of inception: 15-Jan-19.4. As the Scheme has completed more than 1 year but less than 3 years, the performance details of only since inception and 1 year are provided herein.5. Past performance may or may not be sustained in future and the same may not necessarily provide the basis for comparison with other investment.6. Load is not considered for computation of returns.7. In case, the start/end date of the concerned period is a nonbusiness date (NBD), the NAV of the previous date is considered for computation of returns. The NAV per unit shown in the table is as on the start date of
the said period
Returns of ICICI Prudential India Opportunities Fund - Growth Option as on July 31, 2021
1 Year 3 Years 5 Years Since inceptionParticulars
9.16 -
Scheme
Nifty 500 TRI (Benchmark)
Nifty 50 TRI (Additional Benchmark)
NAV (Rs.) Per Unit (as on July 30,2021 : 15.40)
CAGR (%)
Current Value of
Investment of Rs. 10000
CAGR (%)
Current Value of
Investment of Rs. 10000
CAGR (%)
Current Value of
Investment of Rs. 10000
-
CAGR (%)
Current Value of
Investment of Rs. 10000
10.00
Top 10 Sectors
• Top Ten Holdings
Securities and the corresponding derivative exposure with less than 1% to NAV, have been clubbed together with a consolidated limit of 10%.
Derivatives are considered at exposure value.
Portfolio as on July 31, 2021
Riskometer
This Product is suitable for investors who are seeking*:
• Long Term Wealth Creation
• An equity scheme that invests in stocks based on special situations theme.
*Investors should consult their financial advisers if in doubt about whether theproduct is suitable for them.
Fund Details
Monthly AAUM as on 31-Jul-21 : Rs. 3,987.02 crores
Closing AUM as on 31-Jul-21 : Rs. 4,049.08 crores `
Fund Managers** :Mr. Sankaran Naren (Managing this fund since Jan 2019 & Overall 31 years of experience)
Mr. Roshan Chutkey (Managing this fund since Jan 2019 & Overall 14 years of experience)
Indicative Investment Horizon: 5 years & above
Inception/Allotment date: 15-Jan-19 Exit load for Redemption / Switch out:- Lumpsum & SIP / STP Option:1% of applicable NAV if the amount, sought to be redeemed/ switch out in invested for a period of upto 12 months from the date of allotment. Nil - if the amount, sought to be redeemed/switch out in invested for a period of more than 12 months from the date of allotment.
Total Expense Ratio @@ :Other : 2.03% p. a.Direct : 0.69% p. a.
68.36 16812.23 - - - - 18.53 15400.00
53.07 15288.85 - - - - 18.45 15373.04
44.30 14415.96 - - - - 17.17 14953.84
ICICI Prudential India Opportunities Fund (An open ended equity scheme following special situations theme)
Value Blend Growth
Large
Mid
Small
Concentrated
Style
Size
Thematic
Category
Note : - “Portfolio Beta, Standard Deviation, R Squared, Sharpe Ratio and Tracking Error of the Scheme is not computed owing to the short time frame since launch of the Scheme.”@@ Total Expense Ratio is as on the last business day of the month.**In addition to the fund manager managing this fund, overseas investment is managed by Ms. Priyanka Khandelwal.Refer page no 123 to 131 for details on option, entry load, SWP, STP/Flex STP/Value STP & minimum redemption amount pertaining to the scheme.For IDCW History : Refer page no. from 152 to 159, For SIP Returns : Refer page no. from 147 to 150, For Investment Objective : Refer page no. from 160 to 163
Quantitative Indicators
Benchmark
Nifty 500 TRI
NAV (As on 30-Jul-21): Growth Option : Rs. 15.40 IDCW Option : 14.63 Direct Plan Growth Option : Rs. 16.03 Direct Plan IDCW Option : 15.26 `̀ `̀` `
`
Application Amount for fresh Subscription :Rs.5,000 (plus in multiples of Re.1)
Min.Addl.Investment :Rs.1,000 (plus in multiples of Re.1)
Average P/E :
23.52Average P/B :
3.26
Average Dividend Yield :
1.73
Annual Portfolio Turnover Ratio : Equity - 0.56 times
Investors understand that their principal will be at Very High risk
Equity Shares 95.98% 1.36% Auto 4.47% Tata Motors Ltd. - DVR 2.45% TVS Motor Company Ltd. 2.01% Banks 15.59% • Axis Bank Ltd. 6.99% • State Bank Of India 3.40% HDFC Bank Ltd. 2.49% ICICI Bank Ltd. 1.69% Bank Of Baroda 1.02% Consumer Non Durables 4.47% • United Spirits Ltd. 2.65% ITC Ltd. 1.82% Ferrous Metals 2.21% Tata Steel Ltd. 2.21% Gas 5.34% • GAIL (India) Ltd. 5.34% Healthcare Services 2.14% Aster DM Healthcare Ltd. 2.14% Insurance 1.96% Max Financial Services Ltd. 1.96% Minerals/Mining 2.48% Coal India Ltd. 2.48% Non - Ferrous Metals 2.20% Hindalco Industries Ltd. 2.20% Oil 3.37% • Oil & Natural Gas Corporation Ltd. 3.37% Pesticides 1.02% UPL Ltd. 1.02% Petroleum Products 1.77% Indian Oil Corporation Ltd. 1.77% Pharmaceuticals 9.85% • Sun Pharmaceutical Industries Ltd. 9.85% Power 16.30% • NTPC Ltd. 10.00% • CESC Ltd. 4.19%
Kalpataru Power Transmission Ltd. 2.11% Software 3.72% • HCL Technologies Ltd. 2.63% Cyient Ltd. 1.10% Telecom - Services 10.26% • Bharti Airtel Ltd. 10.26% Treasury Bills 0.49% 91 Days Treasury Bill 2021 SOV 0.49% Equity less than 1% of corpus 8.82% 1.36% Short Term Debt and net current assets 2.17% Total Net Assets 100.00%
Company/Issuer % to % to NAV NAV Derivatives
Company/Issuer % to % to NAV NAV Derivatives
18.03%
16.30%
10.26%
10.14%
6.02%
5.12%
4.47%
4.28%
3.72%
2.99%
Banks
Power
Telecom - Services
Pharmaceuticals
Gas
Consumer Non Durables
Auto
Oil
Software
Petroleum Products
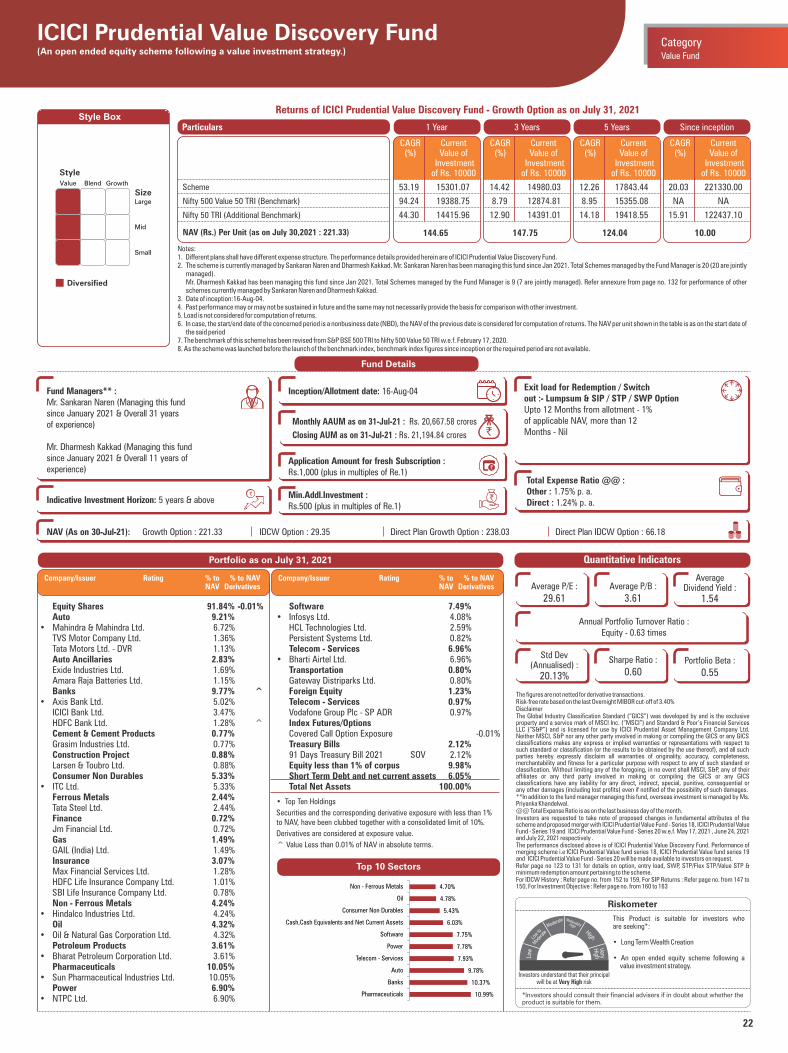
22
Style Box
Notes:1. Different plans shall have different expense structure. The performance details provided herein are of ICICI Prudential Value Discovery Fund.2. The scheme is currently managed by Sankaran Naren and Dharmesh Kakkad. Mr. Sankaran Naren has been managing this fund since Jan 2021. Total Schemes managed by the Fund Manager is 20 (20 are jointly
managed). Mr. Dharmesh Kakkad has been managing this fund since Jan 2021. Total Schemes managed by the Fund Manager is 9 (7 are jointly managed). Refer annexure from page no. 132 for performance of other
schemes currently managed by Sankaran Naren and Dharmesh Kakkad.3. Date of inception:16-Aug-04.4. Past performance may or may not be sustained in future and the same may not necessarily provide the basis for comparison with other investment.5. Load is not considered for computation of returns.6. In case, the start/end date of the concerned period is a nonbusiness date (NBD), the NAV of the previous date is considered for computation of returns. The NAV per unit shown in the table is as on the start date of
the said period7. The benchmark of this scheme has been revised from S&P BSE 500 TRI to Nifty 500 Value 50 TRI w.e.f. February 17, 2020.8. As the scheme was launched before the launch of the benchmark index, benchmark index figures since inception or the required period are not available.
Returns of ICICI Prudential Value Discovery Fund - Growth Option as on July 31, 2021
1 Year 3 Years 5 Years Since inceptionParticulars
144.65 147.75
Scheme
Nifty 500 Value 50 TRI (Benchmark)
Nifty 50 TRI (Additional Benchmark)
NAV (Rs.) Per Unit (as on July 30,2021 : 221.33)
CAGR (%)
Current Value of
Investment of Rs. 10000
CAGR (%)
Current Value of
Investment of Rs. 10000
CAGR (%)
Current Value of
Investment of Rs. 10000
124.04
CAGR (%)
Current Value of
Investment of Rs. 10000
10.00
Portfolio as on July 31, 2021
Riskometer
This Product is suitable for investors who are seeking*:
• Long Term Wealth Creation
• An open ended equity scheme following a value investment strategy.
*Investors should consult their financial advisers if in doubt about whether theproduct is suitable for them.
Fund Details
Monthly AAUM as on 31-Jul-21 : Rs. 20,667.58 crores
Closing AUM as on 31-Jul-21 : Rs. 21,194.84 crores `
Fund Managers** :Mr. Sankaran Naren (Managing this fundsince January 2021 & Overall 31 yearsof experience)
Mr. Dharmesh Kakkad (Managing this fundsince January 2021 & Overall 11 years ofexperience)
Indicative Investment Horizon: 5 years & above
Inception/Allotment date: 16-Aug-04 Exit load for Redemption / Switchout :- Lumpsum & SIP / STP / SWP OptionUpto 12 Months from allotment - 1%of applicable NAV, more than 12Months - Nil
Total Expense Ratio @@ :Other : 1.75% p. a.Direct : 1.24% p. a.
53.19 15301.07 14.42 14980.03 12.26 17843.44 20.03 221330.00
94.24 19388.75 8.79 12874.81 8.95 15355.08 NA NA
44.30 14415.96 12.90 14391.01 14.18 19418.55 15.91 122437.10
ICICI Prudential Value Discovery Fund(An open ended equity scheme following a value investment strategy.)
Value Blend Growth
Large
Mid
Small
Diversified
Style
Size
The figures are not netted for derivative transactions.Risk-free rate based on the last Overnight MIBOR cut-off of 3.40%DisclaimerThe Global Industry Classification Standard (“GICS”) was developed by and is the exclusive property and a service mark of MSCI Inc. (“MSCI”) and Standard & Poor’s Financial Services LLC (“S&P”) and is licensed for use by ICICI Prudential Asset Management Company Ltd. Neither MSCI, S&P nor any other party involved in making or compiling the GICS or any GICS classifications makes any express or implied warranties or representations with respect to such standard or classification (or the results to be obtained by the use thereof), and all such parties hereby expressly disclaim all warranties of originality, accuracy, completeness, merchantability and fitness for a particular purpose with respect to any of such standard or classification. Without limiting any of the foregoing, in no event shall MSCI, S&P, any of their affiliates or any third party involved in making or compiling the GICS or any GICS classifications have any liability for any direct, indirect, special, punitive, consequential or any other damages (including lost profits) even if notified of the possibility of such damages.**In addition to the fund manager managing this fund, overseas investment is managed by Ms. Priyanka Khandelwal.@@ Total Expense Ratio is as on the last business day of the month.Investors are requested to take note of proposed changes in fundamental attributes of the scheme and proposed merger with ICICI Prudential Value Fund - Series 18, ICICI Prudential Value Fund - Series 19 and ICICI Prudential Value Fund - Series 20 w.e.f. May 17, 2021 , June 24, 2021 and July 22, 2021 respectively .The performance disclosed above is of ICICI Prudential Value Discovery Fund. Performance of merging scheme i.e ICICI Prudential Value fund series 18, ICICI Prudential Value fund series 19 and ICICI Prudential Value Fund - Series 20 will be made available to investors on request.Refer page no 123 to 131 for details on option, entry load, SWP, STP/Flex STP/Value STP & minimum redemption amount pertaining to the scheme.For IDCW History : Refer page no. from 152 to 159, For SIP Returns : Refer page no. from 147 to 150, For Investment Objective : Refer page no. from 160 to 163
Quantitative Indicators
Value Fund
Category
Application Amount for fresh Subscription :Rs.1,000 (plus in multiples of Re.1)
Min.Addl.Investment :Rs.500 (plus in multiples of Re.1)
NAV (As on 30-Jul-21): Growth Option : 221.33 IDCW Option : 29.35 Direct Plan Growth Option : 238.03 Direct Plan IDCW Option : 66.18 `̀ `̀` `
`
Average P/E :
29.61Average P/B :
3.61
Average Dividend Yield :
1.54
Std Dev (Annualised) :
20.13%
Sharpe Ratio :
0.60Portfolio Beta :
0.55
Annual Portfolio Turnover Ratio : Equity - 0.63 times
Investors understand that their principal will be at Very High risk
Equity Shares 91.84% -0.01% Auto 9.21% • Mahindra & Mahindra Ltd. 6.72% TVS Motor Company Ltd. 1.36% Tata Motors Ltd. - DVR 1.13% Auto Ancillaries 2.83% Exide Industries Ltd. 1.69% Amara Raja Batteries Ltd. 1.15% Banks 9.77% ^• Axis Bank Ltd. 5.02% ICICI Bank Ltd. 3.47% HDFC Bank Ltd. 1.28% ^ Cement & Cement Products 0.77% Grasim Industries Ltd. 0.77% Construction Project 0.88% Larsen & Toubro Ltd. 0.88% Consumer Non Durables 5.33% • ITC Ltd. 5.33% Ferrous Metals 2.44% Tata Steel Ltd. 2.44% Finance 0.72% Jm Financial Ltd. 0.72% Gas 1.49% GAIL (India) Ltd. 1.49% Insurance 3.07% Max Financial Services Ltd. 1.28% HDFC Life Insurance Company Ltd. 1.01% SBI Life Insurance Company Ltd. 0.78% Non - Ferrous Metals 4.24% • Hindalco Industries Ltd. 4.24% Oil 4.32% • Oil & Natural Gas Corporation Ltd. 4.32% Petroleum Products 3.61% • Bharat Petroleum Corporation Ltd. 3.61% Pharmaceuticals 10.05% • Sun Pharmaceutical Industries Ltd. 10.05% Power 6.90% • NTPC Ltd. 6.90%
Company/Issuer Rating % to % to NAV NAV Derivatives
Company/Issuer Rating % to % to NAV NAV Derivatives
Software 7.49% • Infosys Ltd. 4.08% HCL Technologies Ltd. 2.59% Persistent Systems Ltd. 0.82% Telecom - Services 6.96% • Bharti Airtel Ltd. 6.96% Transportation 0.80% Gateway Distriparks Ltd. 0.80% Foreign Equity 1.23% Telecom - Services 0.97% Vodafone Group Plc - SP ADR 0.97% Index Futures/Options Covered Call Option Exposure -0.01% Treasury Bills 2.12% 91 Days Treasury Bill 2021 SOV 2.12% Equity less than 1% of corpus 9.98% Short Term Debt and net current assets 6.05% Total Net Assets 100.00%
• Top Ten Holdings
Securities and the corresponding derivative exposure with less than 1% to NAV, have been clubbed together with a consolidated limit of 10%.
Derivatives are considered at exposure value.
^ Value Less than 0.01% of NAV in absolute terms.
Top 10 Sectors
10.99%
10.37%
9.78%
7.93%
7.78%
7.75%
6.03%
5.43%
4.78%
4.70%
Pharmaceuticals
Banks
Auto
Telecom - Services
Power
Software
Cash,Cash Equivalents and Net Current Assets
Consumer Non Durables
Oil
Non - Ferrous Metals
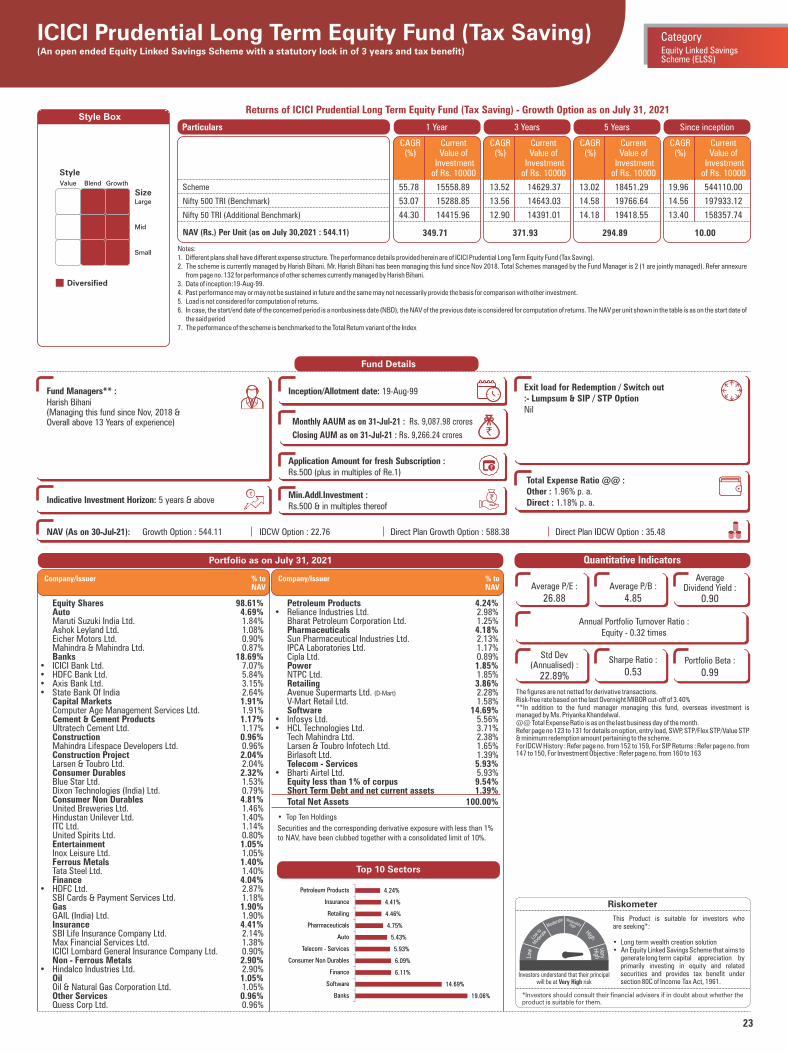
23
Style Box
Notes:1. Different plans shall have different expense structure. The performance details provided herein are of ICICI Prudential Long Term Equity Fund (Tax Saving).2. The scheme is currently managed by Harish Bihani. Mr. Harish Bihani has been managing this fund since Nov 2018. Total Schemes managed by the Fund Manager is 2 (1 are jointly managed). Refer annexure
from page no. 132 for performance of other schemes currently managed by Harish Bihani.3. Date of inception:19-Aug-99.4. Past performance may or may not be sustained in future and the same may not necessarily provide the basis for comparison with other investment.5. Load is not considered for computation of returns.6. In case, the start/end date of the concerned period is a nonbusiness date (NBD), the NAV of the previous date is considered for computation of returns. The NAV per unit shown in the table is as on the start date of
the said period7. The performance of the scheme is benchmarked to the Total Return variant of the Index
Returns of ICICI Prudential Long Term Equity Fund (Tax Saving) - Growth Option as on July 31, 2021
1 Year 3 Years 5 Years Since inceptionParticulars
349.71 371.93
Scheme
Nifty 500 TRI (Benchmark)
Nifty 50 TRI (Additional Benchmark)
NAV (Rs.) Per Unit (as on July 30,2021 : 544.11)
CAGR (%)
Current Value of
Investment of Rs. 10000
CAGR (%)
Current Value of
Investment of Rs. 10000
CAGR (%)
Current Value of
Investment of Rs. 10000
294.89
CAGR (%)
Current Value of
Investment of Rs. 10000
10.00
Top 10 Sectors
• Top Ten Holdings
Securities and the corresponding derivative exposure with less than 1% to NAV, have been clubbed together with a consolidated limit of 10%.
Portfolio as on July 31, 2021
Riskometer
This Product is suitable for investors who are seeking*:
• Long term wealth creation solution• An Equity Linked Savings Scheme that aims to
generate long term capital appreciation by primarily investing in equity and related securities and provides tax benefit under section 80C of Income Tax Act, 1961.
*Investors should consult their financial advisers if in doubt about whether theproduct is suitable for them.
Fund Details
Monthly AAUM as on 31-Jul-21 : Rs. 9,087.98 crores
Closing AUM as on 31-Jul-21 : Rs. 9,266.24 crores `
Fund Managers** :Harish Bihani(Managing this fund since Nov, 2018 &Overall above 13 Years of experience)
Indicative Investment Horizon: 5 years & above
Inception/Allotment date: 19-Aug-99 Exit load for Redemption / Switch out:- Lumpsum & SIP / STP OptionNil
Total Expense Ratio @@ :Other : 1.96% p. a.Direct : 1.18% p. a.
55.78 15558.89 13.52 14629.37 13.02 18451.29 19.96 544110.00
53.07 15288.85 13.56 14643.03 14.58 19766.64 14.56 197933.12
44.30 14415.96 12.90 14391.01 14.18 19418.55 13.40 158357.74
ICICI Prudential Long Term Equity Fund (Tax Saving)(An open ended Equity Linked Savings Scheme with a statutory lock in of 3 years and tax benefit)
Value Blend Growth
Large
Mid
Small
Diversified
Style
Size
The figures are not netted for derivative transactions.Risk-free rate based on the last Overnight MIBOR cut-off of 3.40%**In addition to the fund manager managing this fund, overseas investment is managed by Ms. Priyanka Khandelwal.@@ Total Expense Ratio is as on the last business day of the month.Refer page no 123 to 131 for details on option, entry load, SWP, STP/Flex STP/Value STP & minimum redemption amount pertaining to the scheme.For IDCW History : Refer page no. from 152 to 159, For SIP Returns : Refer page no. from 147 to 150, For Investment Objective : Refer page no. from 160 to 163
Quantitative Indicators
Equity Linked SavingsScheme (ELSS)
Category
Equity Shares 98.61% Auto 4.69% Maruti Suzuki India Ltd. 1.84% Ashok Leyland Ltd. 1.08% Eicher Motors Ltd. 0.90% Mahindra & Mahindra Ltd. 0.87% Banks 18.69%• ICICI Bank Ltd. 7.07%• HDFC Bank Ltd. 5.84%• Axis Bank Ltd. 3.15%• State Bank Of India 2.64% Capital Markets 1.91% Computer Age Management Services Ltd. 1.91% Cement & Cement Products 1.17% Ultratech Cement Ltd. 1.17% Construction 0.96% Mahindra Lifespace Developers Ltd. 0.96% Construction Project 2.04% Larsen & Toubro Ltd. 2.04% Consumer Durables 2.32% Blue Star Ltd. 1.53% Dixon Technologies (India) Ltd. 0.79% Consumer Non Durables 4.81% United Breweries Ltd. 1.46% Hindustan Unilever Ltd. 1.40% ITC Ltd. 1.14% United Spirits Ltd. 0.80% Entertainment 1.05% Inox Leisure Ltd. 1.05% Ferrous Metals 1.40% Tata Steel Ltd. 1.40% Finance 4.04%• HDFC Ltd. 2.87% SBI Cards & Payment Services Ltd. 1.18% Gas 1.90% GAIL (India) Ltd. 1.90% Insurance 4.41% SBI Life Insurance Company Ltd. 2.14% Max Financial Services Ltd. 1.38% ICICI Lombard General Insurance Company Ltd. 0.90% Non - Ferrous Metals 2.90%• Hindalco Industries Ltd. 2.90% Oil 1.05% Oil & Natural Gas Corporation Ltd. 1.05% Other Services 0.96% Quess Corp Ltd. 0.96%
Petroleum Products 4.24%• Reliance Industries Ltd. 2.98% Bharat Petroleum Corporation Ltd. 1.25% Pharmaceuticals 4.18% Sun Pharmaceutical Industries Ltd. 2.13% IPCA Laboratories Ltd. 1.17% Cipla Ltd. 0.89% Power 1.85% NTPC Ltd. 1.85% Retailing 3.86% Avenue Supermarts Ltd. (D-Mart) 2.28% V-Mart Retail Ltd. 1.58% Software 14.69%• Infosys Ltd. 5.56%• HCL Technologies Ltd. 3.71% Tech Mahindra Ltd. 2.38% Larsen & Toubro Infotech Ltd. 1.65% Birlasoft Ltd. 1.39% Telecom - Services 5.93%• Bharti Airtel Ltd. 5.93% Equity less than 1% of corpus 9.54% Short Term Debt and net current assets 1.39% Total Net Assets 100.00%
Company/Issuer % to NAV
Company/Issuer % to NAV
Application Amount for fresh Subscription :Rs.500 (plus in multiples of Re.1)
Min.Addl.Investment :Rs.500 & in multiples thereof
NAV (As on 30-Jul-21): Growth Option : 544.11 IDCW Option : 22.76 Direct Plan Growth Option : 588.38 Direct Plan IDCW Option : 35.48 `̀ `̀` `
`
Average P/E :
26.88Average P/B :
4.85
Average Dividend Yield :
0.90
Std Dev (Annualised) :
22.89%
Sharpe Ratio :
0.53Portfolio Beta :
0.99
Annual Portfolio Turnover Ratio : Equity - 0.32 times
Investors understand that their principal will be at Very High risk
19.06%
14.69%
6.11%
6.09%
5.93%
5.43%
4.75%
4.46%
4.41%
4.24%
Banks
Software
Finance
Consumer Non Durables
Telecom - Services
Auto
Pharmaceuticals
Retailing
Insurance
Petroleum Products
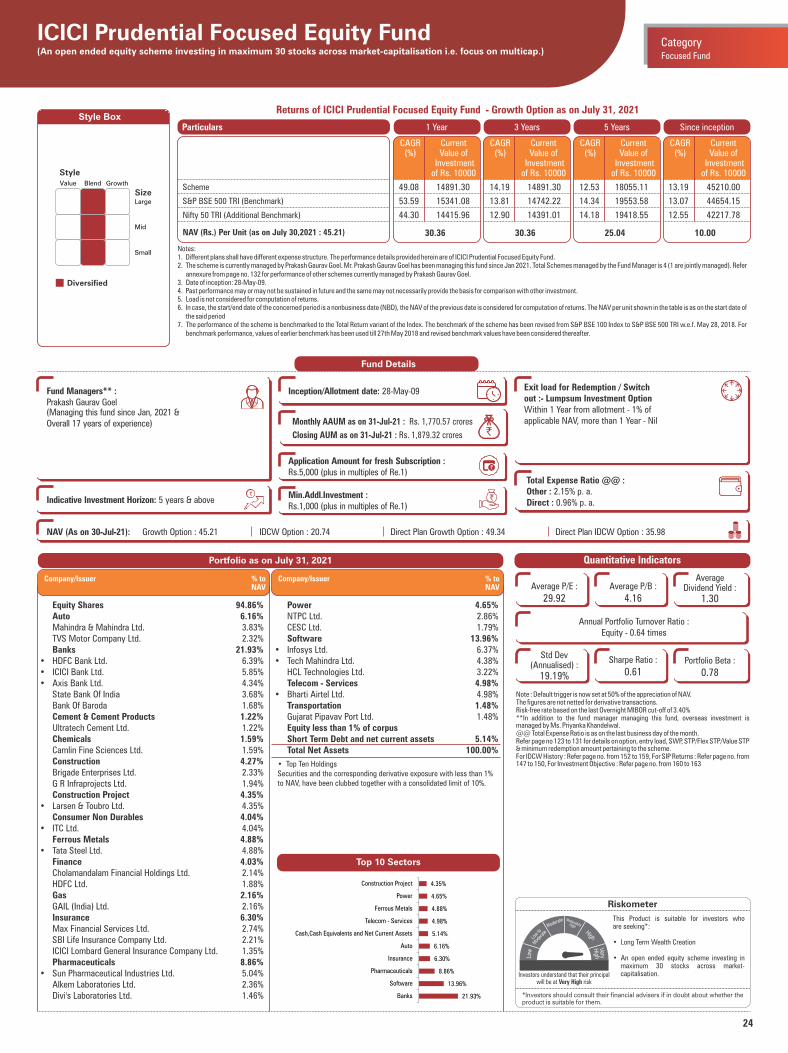
24
Style Box
Notes:1. Different plans shall have different expense structure. The performance details provided herein are of ICICI Prudential Focused Equity Fund.2. The scheme is currently managed by Prakash Gaurav Goel. Mr. Prakash Gaurav Goel has been managing this fund since Jan 2021. Total Schemes managed by the Fund Manager is 4 (1 are jointly managed). Refer
annexure from page no. 132 for performance of other schemes currently managed by Prakash Gaurav Goel.3. Date of inception: 28-May-09.4. Past performance may or may not be sustained in future and the same may not necessarily provide the basis for comparison with other investment.5. Load is not considered for computation of returns.6. In case, the start/end date of the concerned period is a nonbusiness date (NBD), the NAV of the previous date is considered for computation of returns. The NAV per unit shown in the table is as on the start date of
the said period7. The performance of the scheme is benchmarked to the Total Return variant of the Index. The benchmark of the scheme has been revised from S&P BSE 100 Index to S&P BSE 500 TRI w.e.f. May 28, 2018. For
benchmark performance, values of earlier benchmark has been used till 27th May 2018 and revised benchmark values have been considered thereafter.
Returns of ICICI Prudential Focused Equity Fund - Growth Option as on July 31, 2021
1 Year 3 Years 5 Years Since inceptionParticulars
30.36 30.36
Scheme
S&P BSE 500 TRI (Benchmark)
Nifty 50 TRI (Additional Benchmark)
NAV (Rs.) Per Unit (as on July 30,2021 : 45.21)
CAGR (%)
Current Value of
Investment of Rs. 10000
CAGR (%)
Current Value of
Investment of Rs. 10000
CAGR (%)
Current Value of
Investment of Rs. 10000
25.04
CAGR (%)
Current Value of
Investment of Rs. 10000
10.00
Top 10 Sectors
• Top Ten HoldingsSecurities and the corresponding derivative exposure with less than 1% to NAV, have been clubbed together with a consolidated limit of 10%.
Portfolio as on July 31, 2021
Riskometer
This Product is suitable for investors who are seeking*:
• Long Term Wealth Creation
• An open ended equity scheme investing in maximum 30 stocks across market-capitalisation.
*Investors should consult their financial advisers if in doubt about whether theproduct is suitable for them.
Fund Details
Monthly AAUM as on 31-Jul-21 : Rs. 1,770.57 crores
Closing AUM as on 31-Jul-21 : Rs. 1,879.32 crores `
Fund Managers** :Prakash Gaurav Goel (Managing this fund since Jan, 2021 &Overall 17 years of experience)
Indicative Investment Horizon: 5 years & above
Inception/Allotment date: 28-May-09 Exit load for Redemption / Switchout :- Lumpsum Investment OptionWithin 1 Year from allotment - 1% ofapplicable NAV, more than 1 Year - Nil
Total Expense Ratio @@ :Other : 2.15% p. a.Direct : 0.96% p. a.
49.08 14891.30 14.19 14891.30 12.53 18055.11 13.19 45210.00
53.59 15341.08 13.81 14742.22 14.34 19553.58 13.07 44654.15
44.30 14415.96 12.90 14391.01 14.18 19418.55 12.55 42217.78
ICICI Prudential Focused Equity Fund(An open ended equity scheme investing in maximum 30 stocks across market-capitalisation i.e. focus on multicap.)
Value Blend Growth
Large
Mid
Small
Diversified
Style
Size
Note : Default trigger is now set at 50% of the appreciation of NAV.The figures are not netted for derivative transactions.Risk-free rate based on the last Overnight MIBOR cut-off of 3.40%**In addition to the fund manager managing this fund, overseas investment is managed by Ms. Priyanka Khandelwal.@@ Total Expense Ratio is as on the last business day of the month.Refer page no 123 to 131 for details on option, entry load, SWP, STP/Flex STP/Value STP & minimum redemption amount pertaining to the scheme.For IDCW History : Refer page no. from 152 to 159, For SIP Returns : Refer page no. from 147 to 150, For Investment Objective : Refer page no. from 160 to 163
Quantitative Indicators
Focused Fund
Category
Equity Shares 94.86% Auto 6.16% Mahindra & Mahindra Ltd. 3.83% TVS Motor Company Ltd. 2.32% Banks 21.93%• HDFC Bank Ltd. 6.39%• ICICI Bank Ltd. 5.85%• Axis Bank Ltd. 4.34% State Bank Of India 3.68% Bank Of Baroda 1.68% Cement & Cement Products 1.22% Ultratech Cement Ltd. 1.22% Chemicals 1.59% Camlin Fine Sciences Ltd. 1.59% Construction 4.27% Brigade Enterprises Ltd. 2.33% G R Infraprojects Ltd. 1.94% Construction Project 4.35%• Larsen & Toubro Ltd. 4.35% Consumer Non Durables 4.04%• ITC Ltd. 4.04% Ferrous Metals 4.88%• Tata Steel Ltd. 4.88% Finance 4.03% Cholamandalam Financial Holdings Ltd. 2.14% HDFC Ltd. 1.88% Gas 2.16% GAIL (India) Ltd. 2.16% Insurance 6.30% Max Financial Services Ltd. 2.74% SBI Life Insurance Company Ltd. 2.21% ICICI Lombard General Insurance Company Ltd. 1.35% Pharmaceuticals 8.86%• Sun Pharmaceutical Industries Ltd. 5.04% Alkem Laboratories Ltd. 2.36% Divi's Laboratories Ltd. 1.46%
Power 4.65% NTPC Ltd. 2.86% CESC Ltd. 1.79% Software 13.96%• Infosys Ltd. 6.37%• Tech Mahindra Ltd. 4.38% HCL Technologies Ltd. 3.22% Telecom - Services 4.98%• Bharti Airtel Ltd. 4.98% Transportation 1.48% Gujarat Pipavav Port Ltd. 1.48% Equity less than 1% of corpus Short Term Debt and net current assets 5.14% Total Net Assets 100.00%
Company/Issuer % to NAV
Company/Issuer % to NAV
Application Amount for fresh Subscription :Rs.5,000 (plus in multiples of Re.1)
Min.Addl.Investment :Rs.1,000 (plus in multiples of Re.1)
NAV (As on 30-Jul-21): Growth Option : 45.21 IDCW Option : 20.74 Direct Plan Growth Option : 49.34 Direct Plan IDCW Option : 35.98 `̀ `̀` `
`
Average P/E :
29.92Average P/B :
4.16
Average Dividend Yield :
1.30
Std Dev (Annualised) :
19.19%
Sharpe Ratio :
0.61Portfolio Beta :
0.78
Annual Portfolio Turnover Ratio : Equity - 0.64 times
Investors understand that their principal will be at Very High risk
21.93%
13.96%
8.86%
6.30%
6.16%
5.14%
4.98%
4.88%
4.65%
4.35%
Banks
Software
Pharmaceuticals
Insurance
Auto
Cash,Cash Equivalents and Net Current Assets
Telecom - Services
Ferrous Metals
Power
Construction Project

25
Style Box
Notes:1. Different plans shall have different expense structure. The performance details provided herein are of ICICI Prudential Dividend Yield Equity Fund.2. The scheme is currently managed by Mittul Kalawadia. Mr. Mittul Kalawadia has been managing this fund since Jan 2018. Total Schemes managed by the Fund Manager is 7 (6 are jointly managed). Refer
annexure from page no. 132 for performance of other schemes currently managed by Mittul Kalawadia.3. Date of inception: 16-May-14.4. Past performance may or may not be sustained in future and the same may not necessarily provide the basis for comparison with other investment.5. Load is not considered for computation of returns.6. In case, the start/end date of the concerned period is a nonbusiness date (NBD), the NAV of the previous date is considered for computation of returns. The NAV per unit shown in the table is as on the start date of
the said period7. The performance of the scheme is benchmarked to the Total Return variant of the Index
Returns of ICICI Prudential Dividend Yield Equity Fund - Growth Option as on July 31, 2021
1 Year 3 Years 5 Years Since inceptionParticulars
14.48 17.20
Scheme
Nifty Dividend Opportunities 50 TRI (Benchmark)
Nifty 50 TRI (Additional Benchmark)
NAV (Rs.) Per Unit (as on July 30,2021 : 23.76)
CAGR (%)
Current Value of
Investment of Rs. 10000
CAGR (%)
Current Value of
Investment of Rs. 10000
CAGR (%)
Current Value of
Investment of Rs. 10000
13.17
CAGR (%)
Current Value of
Investment of Rs. 10000
10.00
Top 10 Sectors
Portfolio as on July 31, 2021
Riskometer
This Product is suitable for investors who are seeking*:
• Long Term Wealth Creation
• An open ended equity scheme that aims for growth by primarily investing in equity and equity related instruments of dividend yielding companies.
*Investors should consult their financial advisers if in doubt about whether theproduct is suitable for them.
Fund Details
Monthly AAUM as on 31-Jul-21 : Rs. 387.32 crores
Closing AUM as on 31-Jul-21 : Rs. 412.59 crores `
Fund Managers** :Mittul Kalawadia (Managing this fund since Jan, 2018 &Overall 13 Years of experience)
Indicative Investment Horizon: 5 years & above
Inception/Allotment date: 16-May-14 Exit load for Redemption / Switch out:- Lumpsum Investment OptionWithin 1 Year from allotment - 1% of applicable NAV, more than 1 Year -Nil
Total Expense Ratio @@ :Other : 2.76% p. a.Direct : 1.67% p. a.
64.31 16408.84 11.37 13813.95 12.51 18041.00 12.75 23760.00
46.35 14619.72 11.25 13768.45 13.53 18874.59 11.60 22058.05
44.30 14415.96 12.90 14391.01 14.18 19418.55 12.91 24006.20
ICICI Prudential Dividend Yield Equity Fund(An open ended equity scheme predominantly investing in dividend yielding stocks)
Value Blend Growth
Large
Mid
Small
Diversified
Style
Size
The figures are not netted for derivative transactions.Risk-free rate based on the last Overnight MIBOR cut-off of 3.40%**In addition to the fund manager managing this fund, overseas investment is managed by Ms. Priyanka Khandelwal.@@ Total Expense Ratio is as on the last business day of the month.Please note that ICICI Prudential Dividend Yield Equity Fund has undergone change in fundamental attributes with effect from closure of business hours on December 26, 2019. Investors may please visit website for further details.The Global Industry Classification Standard (“GICS”) was developed by and is the exclusive property and a service mark of MSCI Inc. (“MSCI”) and Standard & Poor’s Financial Services LLC (“S&P”) and is licensed for use by ICICI Prudential Asset Management Company Ltd. Neither MSCI, S&P nor any other party involved in making or compiling the GICS or any GICS classifications makes any express or implied warranties or representations with respect to such standard or classification (or the results to be obtained by the use thereof), and all such parties hereby expressly disclaim all warranties of originality, accuracy, completeness, merchantability and fitness for a particular purpose with respect to any of such standard or classification. Without limiting any of the foregoing, in no event shall MSCI, S&P, any of their affiliates or any third party involved in making or compiling the GICS or any GICS classifications have any liability for any direct, indirect, special, punitive, consequential or any other damages (including lost profits) even if notified of the possibility of such damages.Refer page no 123 to 131 for details on option, entry load, SWP, STP/Flex STP/Value STP & minimum redemption amount pertaining to the scheme.For IDCW History : Refer page no. from 152 to 159, For SIP Returns : Refer page no. from 147 to 150, For Investment Objective : Refer page no. from 160 to 163
Quantitative Indicators
Dividend Yield Fund
Category
Application Amount for fresh Subscription :Rs.5,000 (plus in multiples of Re.1)
Min.Addl.Investment :Rs.1,000 (plus in multiples of Re.1)
NAV (As on 30-Jul-21): Growth Option : 23.76 IDCW Option : 14.37 Direct Plan Growth Option : 25.09 Direct Plan IDCW Option : 16.29 `̀ `̀` `
`
Average P/E :
30.56Average P/B :
4.15
Average Dividend Yield :
1.97
Std Dev (Annualised) :
22.16%
Sharpe Ratio :
0.45Portfolio Beta :
1.20
Annual Portfolio Turnover Ratio : Equity - 0.78 times
Investors understand that their principal will be at Very High risk
Equity Shares 95.35% Aerospace & Defense 1.81% Hindustan Aeronautics Ltd. 1.81% Auto 2.30% Mahindra & Mahindra Ltd. 2.30% Banks 7.82%• Axis Bank Ltd. 3.95% HDFC Bank Ltd. 2.47% ICICI Bank Ltd. 1.40% Capital Markets 1.12% Central Depository Services (India) Ltd. 1.12% Chemicals 1.02% Camlin Fine Sciences Ltd. 1.02% Construction 1.33% G R Infraprojects Ltd. 1.33% Consumer Non Durables 4.66%• ITC Ltd. 2.94% CCL Products (India) Ltd. 1.72% Ferrous Metals 1.63% Tata Steel Ltd. 1.63% Finance 2.77% HDFC Ltd. 2.77% Gas 1.40% GAIL (India) Ltd. 1.40% Insurance 2.50% SBI Life Insurance Company Ltd. 2.50% Minerals/Mining 2.74% Coal India Ltd. 2.74% Non - Ferrous Metals 3.55% Hindalco Industries Ltd. 2.19% Vedanta Ltd. 1.36% Petroleum Products 2.86% Bharat Petroleum Corporation Ltd. 2.86% Pharmaceuticals 6.61%• Sun Pharmaceutical Industries Ltd. 6.61% Power 10.87%• NTPC Ltd. 4.81%• Tata Power Company Ltd. 3.57% Power Grid Corporation Of India Ltd. 2.49%
Software 20.30%• Infosys Ltd. 7.28%• HCL Technologies Ltd. 5.89%• Tech Mahindra Ltd. 4.42% Firstsource Solutions Ltd. 2.72% Telecom - Services 2.78% Bharti Airtel Ltd. 2.78% Textile Products 1.26% S. P. Apparels Ltd. 1.26% Transportation 6.73%• Gujarat Pipavav Port Ltd. 4.62% Gateway Distriparks Ltd. 2.11% Foreign Equity 4.88% Oil 4.88%• ConocoPhillips Co 4.88% Equity less than 1% of corpus 4.41% Short Term Debt and net current assets 4.65% Total Net Assets 100.00%
Company/Issuer % to NAV
Company/Issuer % to NAV
• Top Ten HoldingsSecurities and the corresponding derivative exposure with less than 1% to NAV, have been clubbed together with a consolidated limit of 10%.
20.30%
10.87%
7.82%
6.73%
6.61%
5.52%
4.88%
4.64%
3.55%
3.22%
Software
Power
Banks
Transportation
Pharmaceuticals
Consumer Non Durables
Oil
Cash,Cash Equivalents and Net Current Assets
Non - Ferrous Metals
Petroleum Products
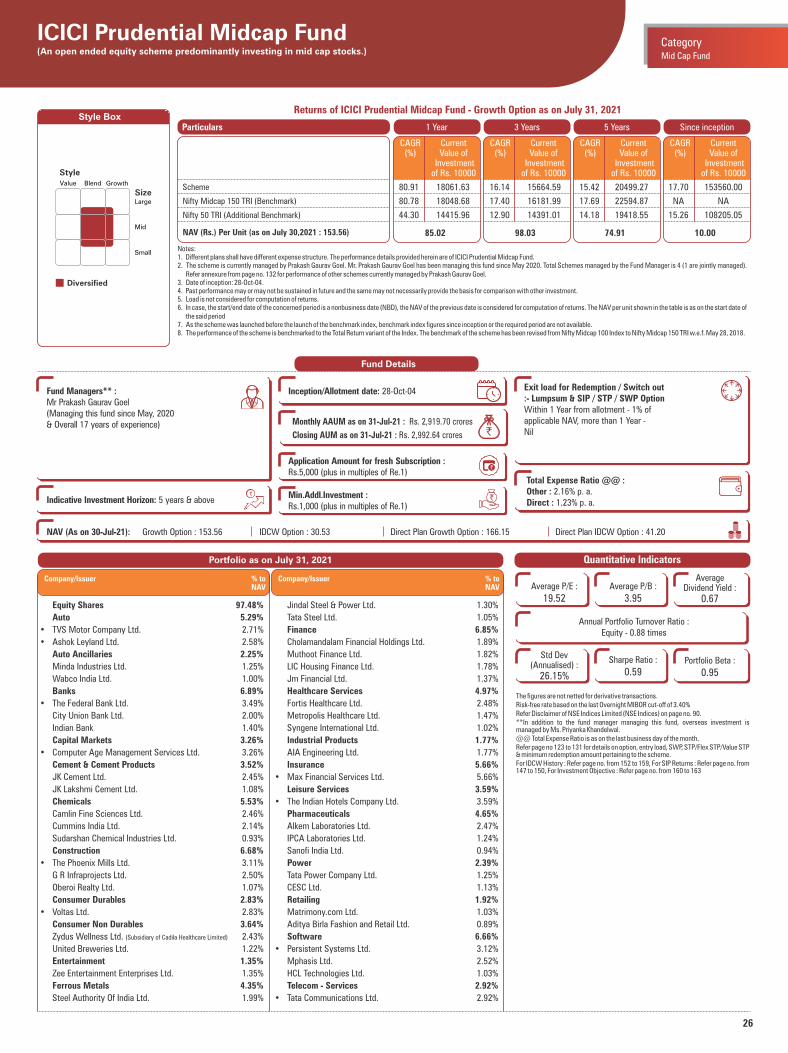
26
Style Box
Notes:1. Different plans shall have different expense structure. The performance details provided herein are of ICICI Prudential Midcap Fund.2. The scheme is currently managed by Prakash Gaurav Goel. Mr. Prakash Gaurav Goel has been managing this fund since May 2020. Total Schemes managed by the Fund Manager is 4 (1 are jointly managed).
Refer annexure from page no. 132 for performance of other schemes currently managed by Prakash Gaurav Goel.3. Date of inception: 28-Oct-04.4. Past performance may or may not be sustained in future and the same may not necessarily provide the basis for comparison with other investment.5. Load is not considered for computation of returns.6. In case, the start/end date of the concerned period is a nonbusiness date (NBD), the NAV of the previous date is considered for computation of returns. The NAV per unit shown in the table is as on the start date of
the said period7. As the scheme was launched before the launch of the benchmark index, benchmark index figures since inception or the required period are not available.8. The performance of the scheme is benchmarked to the Total Return variant of the Index. The benchmark of the scheme has been revised from Nifty Midcap 100 Index to Nifty Midcap 150 TRI w.e.f. May 28, 2018.
Returns of ICICI Prudential Midcap Fund - Growth Option as on July 31, 2021
1 Year 3 Years 5 Years Since inceptionParticulars
85.02 98.03
Scheme
Nifty Midcap 150 TRI (Benchmark)
Nifty 50 TRI (Additional Benchmark)
NAV (Rs.) Per Unit (as on July 30,2021 : 153.56)
CAGR (%)
Current Value of
Investment of Rs. 10000
CAGR (%)
Current Value of
Investment of Rs. 10000
CAGR (%)
Current Value of
Investment of Rs. 10000
74.91
CAGR (%)
Current Value of
Investment of Rs. 10000
10.00
Portfolio as on July 31, 2021
Fund Details
Monthly AAUM as on 31-Jul-21 : Rs. 2,919.70 crores
Closing AUM as on 31-Jul-21 : Rs. 2,992.64 crores `
Fund Managers** :Mr Prakash Gaurav Goel(Managing this fund since May, 2020& Overall 17 years of experience)
Indicative Investment Horizon: 5 years & above
Inception/Allotment date: 28-Oct-04 Exit load for Redemption / Switch out:- Lumpsum & SIP / STP / SWP OptionWithin 1 Year from allotment - 1% ofapplicable NAV, more than 1 Year -Nil
Total Expense Ratio @@ :Other : 2.16% p. a.Direct : 1.23% p. a.
80.91 18061.63 16.14 15664.59 15.42 20499.27 17.70 153560.00
80.78 18048.68 17.40 16181.99 17.69 22594.87 NA NA
44.30 14415.96 12.90 14391.01 14.18 19418.55 15.26 108205.05
ICICI Prudential Midcap Fund(An open ended equity scheme predominantly investing in mid cap stocks.)
Value Blend Growth
Large
Mid
Small
Diversified
Style
Size
The figures are not netted for derivative transactions. Risk-free rate based on the last Overnight MIBOR cut-off of 3.40%Refer Disclaimer of NSE Indices Limited (NSE Indices) on page no. 90. **In addition to the fund manager managing this fund, overseas investment is managed by Ms. Priyanka Khandelwal.@@ Total Expense Ratio is as on the last business day of the month.Refer page no 123 to 131 for details on option, entry load, SWP, STP/Flex STP/Value STP & minimum redemption amount pertaining to the scheme.For IDCW History : Refer page no. from 152 to 159, For SIP Returns : Refer page no. from 147 to 150, For Investment Objective : Refer page no. from 160 to 163
Quantitative Indicators
Mid Cap Fund
Category
Application Amount for fresh Subscription :Rs.5,000 (plus in multiples of Re.1)
Min.Addl.Investment :Rs.1,000 (plus in multiples of Re.1)
NAV (As on 30-Jul-21): Growth Option : 153.56 IDCW Option : 30.53 Direct Plan Growth Option : 166.15 Direct Plan IDCW Option : 41.20 `̀ `̀` `
`
Average P/E :
19.52Average P/B :
3.95
Average Dividend Yield :
0.67
Std Dev (Annualised) :
26.15%
Sharpe Ratio :
0.59Portfolio Beta :
0.95
Annual Portfolio Turnover Ratio : Equity - 0.88 times
Equity Shares 97.48%
Auto 5.29%
• TVS Motor Company Ltd. 2.71%
• Ashok Leyland Ltd. 2.58%
Auto Ancillaries 2.25%
Minda Industries Ltd. 1.25%
Wabco India Ltd. 1.00%
Banks 6.89%
• The Federal Bank Ltd. 3.49%
City Union Bank Ltd. 2.00%
Indian Bank 1.40%
Capital Markets 3.26%
• Computer Age Management Services Ltd. 3.26%
Cement & Cement Products 3.52%
JK Cement Ltd. 2.45%
JK Lakshmi Cement Ltd. 1.08%
Chemicals 5.53%
Camlin Fine Sciences Ltd. 2.46%
Cummins India Ltd. 2.14%
Sudarshan Chemical Industries Ltd. 0.93%
Construction 6.68%
• The Phoenix Mills Ltd. 3.11%
G R Infraprojects Ltd. 2.50%
Oberoi Realty Ltd. 1.07%
Consumer Durables 2.83%
• Voltas Ltd. 2.83%
Consumer Non Durables 3.64%
Zydus Wellness Ltd. 2.43%(Subsidiary of Cadila Healthcare Limited)
United Breweries Ltd. 1.22%
Entertainment 1.35%
Zee Entertainment Enterprises Ltd. 1.35%
Ferrous Metals 4.35%
Steel Authority Of India Ltd. 1.99%
Jindal Steel & Power Ltd. 1.30%
Tata Steel Ltd. 1.05%
Finance 6.85%
Cholamandalam Financial Holdings Ltd. 1.89%
Muthoot Finance Ltd. 1.82%
LIC Housing Finance Ltd. 1.78%
Jm Financial Ltd. 1.37%
Healthcare Services 4.97%
Fortis Healthcare Ltd. 2.48%
Metropolis Healthcare Ltd. 1.47%
Syngene International Ltd. 1.02%
Industrial Products 1.77%
AIA Engineering Ltd. 1.77%
Insurance 5.66%
• Max Financial Services Ltd. 5.66%
Leisure Services 3.59%
• The Indian Hotels Company Ltd. 3.59%
Pharmaceuticals 4.65%
Alkem Laboratories Ltd. 2.47%
IPCA Laboratories Ltd. 1.24%
Sanofi India Ltd. 0.94%
Power 2.39%
Tata Power Company Ltd. 1.25%
CESC Ltd. 1.13%
Retailing 1.92%
Matrimony.com Ltd. 1.03%
Aditya Birla Fashion and Retail Ltd. 0.89%
Software 6.66%
• Persistent Systems Ltd. 3.12%
Mphasis Ltd. 2.52%
HCL Technologies Ltd. 1.03%
Telecom - Services 2.92%
• Tata Communications Ltd. 2.92%
Company/Issuer % to NAV
Company/Issuer % to NAV

27
• Top Ten HoldingsSecurities and the corresponding derivative exposure with less than 1% to NAV, have been clubbed together with a consolidated limit of 10%.
Portfolio as on July 31, 2021
Transportation 1.18%
Gujarat Pipavav Port Ltd. 1.18%
Equity less than 1% of corpus 9.32%
Short Term Debt and net current assets 2.52%
Total Net Assets 100.00%
ICICI Prudential Midcap Fund(An open ended equity scheme predominantly investing in mid cap stocks.) Mid Cap Fund
Category
Top 10 SectorsCompany/Issuer % to NAV
Riskometer
This Product is suitable for investors who are seeking*:
• Long Term Wealth Creation
• An open-ended equity scheme that aims for capital appreciation by investing in diversified mid cap companies.
*Investors should consult their financial advisers if in doubt about whether theproduct is suitable for them.
Investors understand that their principal will be at Very High risk
8.33%
6.89%
6.87%
6.86%
6.29%
5.73%
5.66%
5.22%
4.97%
4.35%
Finance
Banks
Software
Construction
Chemicals
Auto
Insurance
Pharmaceuticals
Healthcare Services
Ferrous Metals
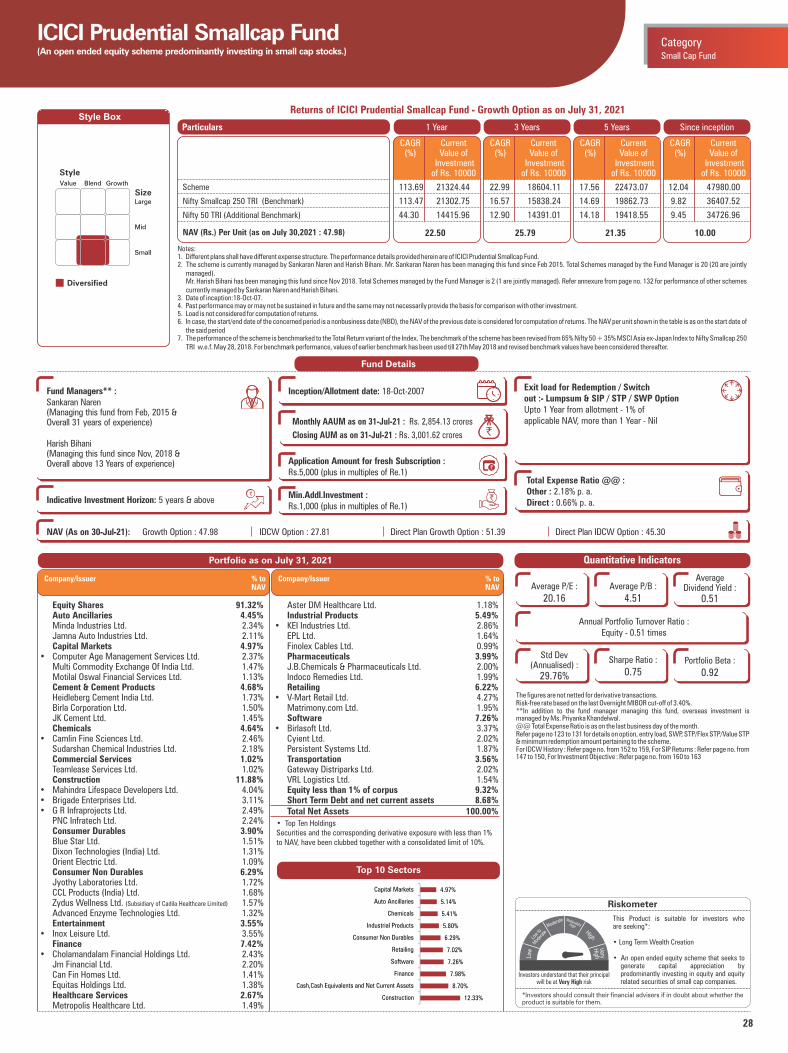
28
Style Box
Notes:1. Different plans shall have different expense structure. The performance details provided herein are of ICICI Prudential Smallcap Fund.2. The scheme is currently managed by Sankaran Naren and Harish Bihani. Mr. Sankaran Naren has been managing this fund since Feb 2015. Total Schemes managed by the Fund Manager is 20 (20 are jointly
managed). Mr. Harish Bihani has been managing this fund since Nov 2018. Total Schemes managed by the Fund Manager is 2 (1 are jointly managed). Refer annexure from page no. 132 for performance of other schemes
currently managed by Sankaran Naren and Harish Bihani.3. Date of inception:18-Oct-07.4. Past performance may or may not be sustained in future and the same may not necessarily provide the basis for comparison with other investment.5. Load is not considered for computation of returns.6. In case, the start/end date of the concerned period is a nonbusiness date (NBD), the NAV of the previous date is considered for computation of returns. The NAV per unit shown in the table is as on the start date of
the said period 7. The performance of the scheme is benchmarked to the Total Return variant of the Index. The benchmark of the scheme has been revised from 65% Nifty 50 + 35% MSCI Asia ex-Japan Index to Nifty Smallcap 250
TRI w.e.f. May 28, 2018. For benchmark performance, values of earlier benchmark has been used till 27th May 2018 and revised benchmark values have been considered thereafter.
Returns of ICICI Prudential Smallcap Fund - Growth Option as on July 31, 2021
1 Year 3 Years 5 Years Since inceptionParticulars
22.50 25.79
Scheme
Nifty Smallcap 250 TRI (Benchmark)
Nifty 50 TRI (Additional Benchmark)
NAV (Rs.) Per Unit (as on July 30,2021 : 47.98)
CAGR (%)
Current Value of
Investment of Rs. 10000
CAGR (%)
Current Value of
Investment of Rs. 10000
CAGR (%)
Current Value of
Investment of Rs. 10000
21.35
CAGR (%)
Current Value of
Investment of Rs. 10000
10.00
Portfolio as on July 31, 2021
Riskometer
This Product is suitable for investors who are seeking*:
• Long Term Wealth Creation
• An open ended equity scheme that seeks to generate capital appreciation by predominantly investing in equity and equity related securities of small cap companies.
*Investors should consult their financial advisers if in doubt about whether theproduct is suitable for them.
Fund Details
Monthly AAUM as on 31-Jul-21 : Rs. 2,854.13 crores
Closing AUM as on 31-Jul-21 : Rs. 3,001.62 crores `
Fund Managers** :Sankaran Naren (Managing this fund from Feb, 2015 &Overall 31 years of experience)
Harish Bihani(Managing this fund since Nov, 2018 &Overall above 13 Years of experience)
Indicative Investment Horizon: 5 years & above
Inception/Allotment date: 18-Oct-2007 Exit load for Redemption / Switchout :- Lumpsum & SIP / STP / SWP OptionUpto 1 Year from allotment - 1% ofapplicable NAV, more than 1 Year - Nil
Total Expense Ratio @@ :Other : 2.18% p. a.Direct : 0.66% p. a.
113.69 21324.44 22.99 18604.11 17.56 22473.07 12.04 47980.00
113.47 21302.75 16.57 15838.24 14.69 19862.73 9.82 36407.52
44.30 14415.96 12.90 14391.01 14.18 19418.55 9.45 34726.96
ICICI Prudential Smallcap Fund(An open ended equity scheme predominantly investing in small cap stocks.)
Value Blend Growth
Large
Mid
Small
Diversified
Style
Size
The figures are not netted for derivative transactions.Risk-free rate based on the last Overnight MIBOR cut-off of 3.40%.**In addition to the fund manager managing this fund, overseas investment is managed by Ms. Priyanka Khandelwal.@@ Total Expense Ratio is as on the last business day of the month.Refer page no 123 to 131 for details on option, entry load, SWP, STP/Flex STP/Value STP & minimum redemption amount pertaining to the scheme.For IDCW History : Refer page no. from 152 to 159, For SIP Returns : Refer page no. from 147 to 150, For Investment Objective : Refer page no. from 160 to 163
Quantitative Indicators
Small Cap Fund
Category
Application Amount for fresh Subscription :Rs.5,000 (plus in multiples of Re.1)
Min.Addl.Investment :Rs.1,000 (plus in multiples of Re.1)
NAV (As on 30-Jul-21): Growth Option : 47.98 IDCW Option : 27.81 Direct Plan Growth Option : 51.39 Direct Plan IDCW Option : 45.30 `̀ `̀` `
`
Average P/E :
20.16Average P/B :
4.51
Average Dividend Yield :
0.51
Std Dev (Annualised) :
29.76%
Sharpe Ratio :
0.75Portfolio Beta :
0.92
Annual Portfolio Turnover Ratio : Equity - 0.51 times
Equity Shares 91.32% Auto Ancillaries 4.45% Minda Industries Ltd. 2.34% Jamna Auto Industries Ltd. 2.11% Capital Markets 4.97%• Computer Age Management Services Ltd. 2.37% Multi Commodity Exchange Of India Ltd. 1.47% Motilal Oswal Financial Services Ltd. 1.13% Cement & Cement Products 4.68% Heidleberg Cement India Ltd. 1.73% Birla Corporation Ltd. 1.50% JK Cement Ltd. 1.45% Chemicals 4.64%• Camlin Fine Sciences Ltd. 2.46% Sudarshan Chemical Industries Ltd. 2.18% Commercial Services 1.02% Teamlease Services Ltd. 1.02% Construction 11.88%• Mahindra Lifespace Developers Ltd. 4.04%• Brigade Enterprises Ltd. 3.11%• G R Infraprojects Ltd. 2.49% PNC Infratech Ltd. 2.24% Consumer Durables 3.90% Blue Star Ltd. 1.51% Dixon Technologies (India) Ltd. 1.31% Orient Electric Ltd. 1.09% Consumer Non Durables 6.29% Jyothy Laboratories Ltd. 1.72% CCL Products (India) Ltd. 1.68% Zydus Wellness Ltd. 1.57%(Subsidiary of Cadila Healthcare Limited)
Advanced Enzyme Technologies Ltd. 1.32% Entertainment 3.55%• Inox Leisure Ltd. 3.55% Finance 7.42%• Cholamandalam Financial Holdings Ltd. 2.43% Jm Financial Ltd. 2.20% Can Fin Homes Ltd. 1.41% Equitas Holdings Ltd. 1.38% Healthcare Services 2.67% Metropolis Healthcare Ltd. 1.49%
Aster DM Healthcare Ltd. 1.18% Industrial Products 5.49%• KEI Industries Ltd. 2.86% EPL Ltd. 1.64% Finolex Cables Ltd. 0.99% Pharmaceuticals 3.99% J.B.Chemicals & Pharmaceuticals Ltd. 2.00% Indoco Remedies Ltd. 1.99% Retailing 6.22%• V-Mart Retail Ltd. 4.27% Matrimony.com Ltd. 1.95% Software 7.26%• Birlasoft Ltd. 3.37% Cyient Ltd. 2.02% Persistent Systems Ltd. 1.87% Transportation 3.56% Gateway Distriparks Ltd. 2.02% VRL Logistics Ltd. 1.54% Equity less than 1% of corpus 9.32% Short Term Debt and net current assets 8.68% Total Net Assets 100.00%
Company/Issuer % to NAV
Company/Issuer % to NAV
Investors understand that their principal will be at Very High risk
• Top Ten HoldingsSecurities and the corresponding derivative exposure with less than 1% to NAV, have been clubbed together with a consolidated limit of 10%.
Top 10 Sectors
12.33%
8.70%
7.98%
7.26%
7.02%
6.29%
5.80%
5.41%
5.14%
4.97%
Construction
Cash,Cash Equivalents and Net Current Assets
Finance
Software
Retailing
Consumer Non Durables
Industrial Products
Chemicals
Auto Ancillaries
Capital Markets
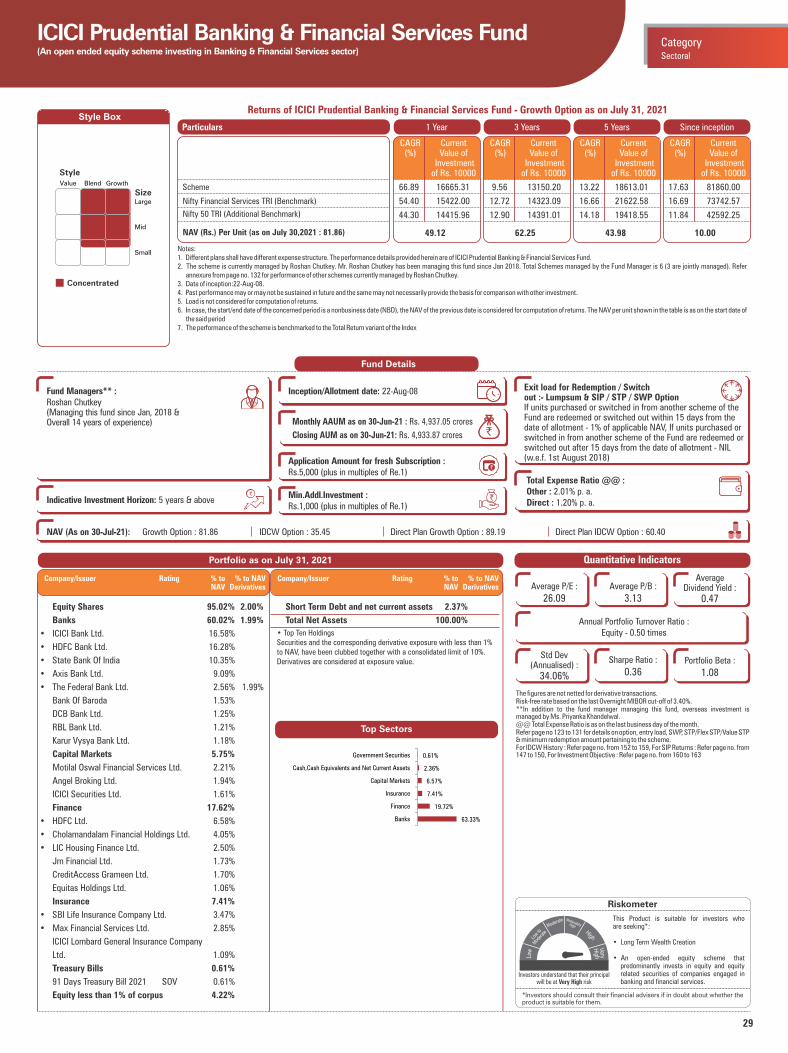
29
Style Box
Notes:1. Different plans shall have different expense structure. The performance details provided herein are of ICICI Prudential Banking & Financial Services Fund.2. The scheme is currently managed by Roshan Chutkey. Mr. Roshan Chutkey has been managing this fund since Jan 2018. Total Schemes managed by the Fund Manager is 6 (3 are jointly managed). Refer
annexure from page no. 132 for performance of other schemes currently managed by Roshan Chutkey.3. Date of inception:22-Aug-08.4. Past performance may or may not be sustained in future and the same may not necessarily provide the basis for comparison with other investment.5. Load is not considered for computation of returns.6. In case, the start/end date of the concerned period is a nonbusiness date (NBD), the NAV of the previous date is considered for computation of returns. The NAV per unit shown in the table is as on the start date of
the said period7. The performance of the scheme is benchmarked to the Total Return variant of the Index
Returns of ICICI Prudential Banking & Financial Services Fund - Growth Option as on July 31, 2021
1 Year 3 Years 5 Years Since inceptionParticulars
49.12 62.25
Scheme
Nifty Financial Services TRI (Benchmark)
Nifty 50 TRI (Additional Benchmark)
NAV (Rs.) Per Unit (as on July 30,2021 : 81.86)
CAGR (%)
Current Value of
Investment of Rs. 10000
CAGR (%)
Current Value of
Investment of Rs. 10000
CAGR (%)
Current Value of
Investment of Rs. 10000
43.98
CAGR (%)
Current Value of
Investment of Rs. 10000
10.00
Equity Shares 95.02% 2.00%
Banks 60.02% 1.99%
• ICICI Bank Ltd. 16.58%
• HDFC Bank Ltd. 16.28%
• State Bank Of India 10.35%
• Axis Bank Ltd. 9.09%
• The Federal Bank Ltd. 2.56% 1.99%
Bank Of Baroda 1.53%
DCB Bank Ltd. 1.25%
RBL Bank Ltd. 1.21%
Karur Vysya Bank Ltd. 1.18%
Capital Markets 5.75%
Motilal Oswal Financial Services Ltd. 2.21%
Angel Broking Ltd. 1.94%
ICICI Securities Ltd. 1.61%
Finance 17.62%
• HDFC Ltd. 6.58%
• Cholamandalam Financial Holdings Ltd. 4.05%
• LIC Housing Finance Ltd. 2.50%
Jm Financial Ltd. 1.73%
CreditAccess Grameen Ltd. 1.70%
Equitas Holdings Ltd. 1.06%
Insurance 7.41%
• SBI Life Insurance Company Ltd. 3.47%
• Max Financial Services Ltd. 2.85%
ICICI Lombard General Insurance Company
Ltd. 1.09%
Treasury Bills 0.61%
91 Days Treasury Bill 2021 SOV 0.61%
Equity less than 1% of corpus 4.22%
• Top Ten HoldingsSecurities and the corresponding derivative exposure with less than 1% to NAV, have been clubbed together with a consolidated limit of 10%.Derivatives are considered at exposure value.
Portfolio as on July 31, 2021
Riskometer
This Product is suitable for investors who are seeking*:
• Long Term Wealth Creation
• An open-ended equity scheme that predominantly invests in equity and equity related securities of companies engaged in banking and financial services.
*Investors should consult their financial advisers if in doubt about whether theproduct is suitable for them.
Fund Details
Monthly AAUM as on 30-Jun-21 : Rs. 4,937.05 crores
Closing AUM as on 30-Jun-21: Rs. 4,933.87 crores `
Fund Managers** :Roshan Chutkey(Managing this fund since Jan, 2018 &Overall 14 years of experience)
Indicative Investment Horizon: 5 years & above
Inception/Allotment date: 22-Aug-08 Exit load for Redemption / Switchout :- Lumpsum & SIP / STP / SWP OptionIf units purchased or switched in from another scheme of the Fund are redeemed or switched out within 15 days from the date of allotment - 1% of applicable NAV, If units purchased or switched in from another scheme of the Fund are redeemed or switched out after 15 days from the date of allotment - NIL (w.e.f. 1st August 2018)
Total Expense Ratio @@ :Other : 2.01% p. a.Direct : 1.20% p. a.
66.89 16665.31 9.56 13150.20 13.22 18613.01 17.63 81860.00
54.40 15422.00 12.72 14323.09 16.66 21622.58 16.69 73742.57
44.30 14415.96 12.90 14391.01 14.18 19418.55 11.84 42592.25
ICICI Prudential Banking & Financial Services Fund(An open ended equity scheme investing in Banking & Financial Services sector)
Value Blend Growth
Large
Mid
Small
Concentrated
Style
Size
The figures are not netted for derivative transactions.Risk-free rate based on the last Overnight MIBOR cut-off of 3.40%.**In addition to the fund manager managing this fund, overseas investment is managed by Ms. Priyanka Khandelwal.@@ Total Expense Ratio is as on the last business day of the month.Refer page no 123 to 131 for details on option, entry load, SWP, STP/Flex STP/Value STP & minimum redemption amount pertaining to the scheme.For IDCW History : Refer page no. from 152 to 159, For SIP Returns : Refer page no. from 147 to 150, For Investment Objective : Refer page no. from 160 to 163
Quantitative Indicators
Sectoral
Category
Company/Issuer Rating % to % to NAV NAV Derivatives
Application Amount for fresh Subscription :Rs.5,000 (plus in multiples of Re.1)
Min.Addl.Investment :Rs.1,000 (plus in multiples of Re.1)
NAV (As on 30-Jul-21): Growth Option : 81.86 IDCW Option : 35.45 Direct Plan Growth Option : 89.19 Direct Plan IDCW Option : 60.40 `̀ `̀` `
`
Average P/E :
26.09Average P/B :
3.13
Average Dividend Yield :
0.47
Std Dev (Annualised) :
34.06%
Sharpe Ratio :
0.36Portfolio Beta :
1.08
Annual Portfolio Turnover Ratio : Equity - 0.50 times
Investors understand that their principal will be at Very High risk
Top Sectors
Short Term Debt and net current assets 2.37%
Total Net Assets 100.00%
Company/Issuer Rating % to % to NAV NAV Derivatives
63.33%
19.72%
7.41%
6.57%
2.36%
0.61%
Banks
Finance
Insurance
Capital Markets
Cash,Cash Equivalents and Net Current Assets
Government Securities
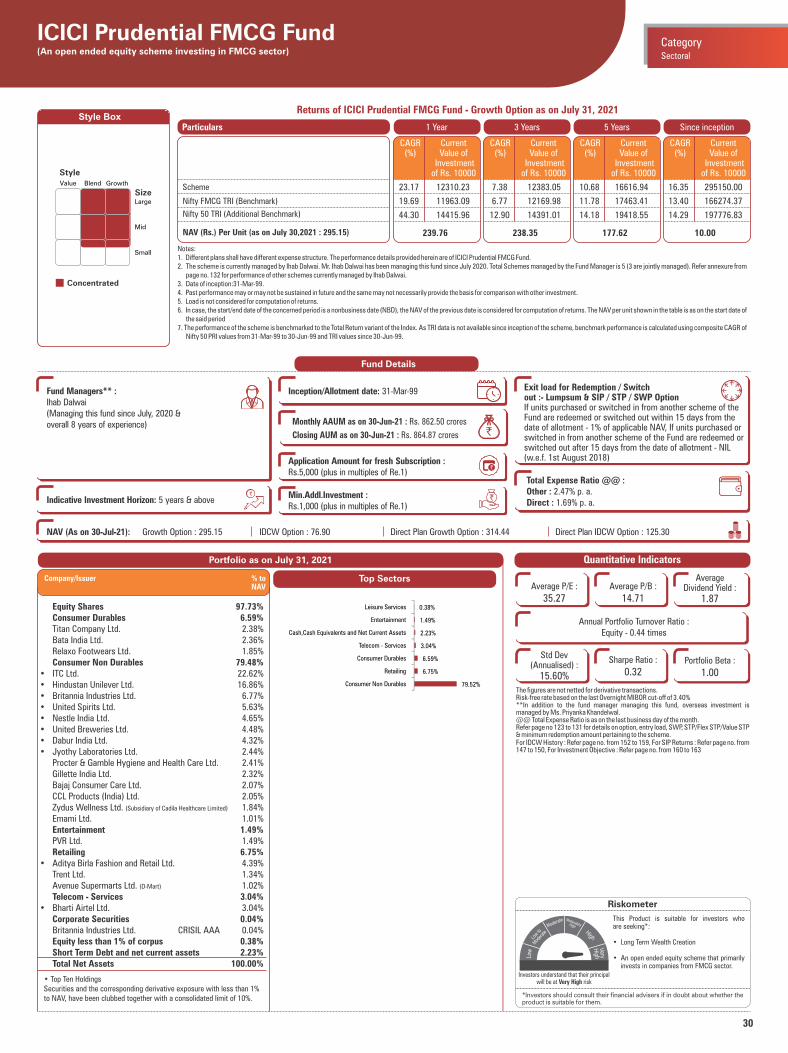
30
Style Box
Notes:1. Different plans shall have different expense structure. The performance details provided herein are of ICICI Prudential FMCG Fund.2. The scheme is currently managed by Ihab Dalwai. Mr. Ihab Dalwai has been managing this fund since July 2020. Total Schemes managed by the Fund Manager is 5 (3 are jointly managed). Refer annexure from
page no. 132 for performance of other schemes currently managed by Ihab Dalwai.3. Date of inception:31-Mar-99.4. Past performance may or may not be sustained in future and the same may not necessarily provide the basis for comparison with other investment.5. Load is not considered for computation of returns.6. In case, the start/end date of the concerned period is a nonbusiness date (NBD), the NAV of the previous date is considered for computation of returns. The NAV per unit shown in the table is as on the start date of
the said period7. The performance of the scheme is benchmarked to the Total Return variant of the Index. As TRI data is not available since inception of the scheme, benchmark performance is calculated using composite CAGR of
Nifty 50 PRI values from 31-Mar-99 to 30-Jun-99 and TRI values since 30-Jun-99.
Returns of ICICI Prudential FMCG Fund - Growth Option as on July 31, 2021
1 Year 3 Years 5 Years Since inceptionParticulars
239.76 238.35
Scheme
Nifty FMCG TRI (Benchmark)
Nifty 50 TRI (Additional Benchmark)
NAV (Rs.) Per Unit (as on July 30,2021 : 295.15)
CAGR (%)
Current Value of
Investment of Rs. 10000
CAGR (%)
Current Value of
Investment of Rs. 10000
CAGR (%)
Current Value of
Investment of Rs. 10000
177.62
CAGR (%)
Current Value of
Investment of Rs. 10000
10.00
Portfolio as on July 31, 2021
Riskometer
This Product is suitable for investors who are seeking*:
• Long Term Wealth Creation
• An open ended equity scheme that primarily invests in companies from FMCG sector.
*Investors should consult their financial advisers if in doubt about whether theproduct is suitable for them.
Fund Details
Monthly AAUM as on 30-Jun-21 : Rs. 862.50 crores
Closing AUM as on 30-Jun-21 : Rs. 864.87 crores `
Fund Managers** :Ihab Dalwai(Managing this fund since July, 2020 &overall 8 years of experience)
Indicative Investment Horizon: 5 years & above
Inception/Allotment date: 31-Mar-99 Exit load for Redemption / Switchout :- Lumpsum & SIP / STP / SWP OptionIf units purchased or switched in from another scheme of the Fund are redeemed or switched out within 15 days from the date of allotment - 1% of applicable NAV, If units purchased or switched in from another scheme of the Fund are redeemed or switched out after 15 days from the date of allotment - NIL (w.e.f. 1st August 2018)
Total Expense Ratio @@ :Other : 2.47% p. a.Direct : 1.69% p. a.
23.17 12310.23 7.38 12383.05 10.68 16616.94 16.35 295150.00
19.69 11963.09 6.77 12169.98 11.78 17463.41 13.40 166274.37
44.30 14415.96 12.90 14391.01 14.18 19418.55 14.29 197776.83
ICICI Prudential FMCG Fund(An open ended equity scheme investing in FMCG sector)
Value Blend Growth
Large
Mid
Small
Concentrated
Style
Size
The figures are not netted for derivative transactions.Risk-free rate based on the last Overnight MIBOR cut-off of 3.40%**In addition to the fund manager managing this fund, overseas investment is managed by Ms. Priyanka Khandelwal.@@ Total Expense Ratio is as on the last business day of the month.Refer page no 123 to 131 for details on option, entry load, SWP, STP/Flex STP/Value STP & minimum redemption amount pertaining to the scheme.For IDCW History : Refer page no. from 152 to 159, For SIP Returns : Refer page no. from 147 to 150, For Investment Objective : Refer page no. from 160 to 163
Quantitative Indicators
Sectoral
Category
Equity Shares 97.73% Consumer Durables 6.59% Titan Company Ltd. 2.38% Bata India Ltd. 2.36% Relaxo Footwears Ltd. 1.85% Consumer Non Durables 79.48%• ITC Ltd. 22.62%• Hindustan Unilever Ltd. 16.86%• Britannia Industries Ltd. 6.77%• United Spirits Ltd. 5.63%• Nestle India Ltd. 4.65%• United Breweries Ltd. 4.48%• Dabur India Ltd. 4.32%• Jyothy Laboratories Ltd. 2.44% Procter & Gamble Hygiene and Health Care Ltd. 2.41% Gillette India Ltd. 2.32% Bajaj Consumer Care Ltd. 2.07% CCL Products (India) Ltd. 2.05% Zydus Wellness Ltd. (Subsidiary of Cadila Healthcare Limited) 1.84% Emami Ltd. 1.01% Entertainment 1.49% PVR Ltd. 1.49% Retailing 6.75%• Aditya Birla Fashion and Retail Ltd. 4.39% Trent Ltd. 1.34% Avenue Supermarts Ltd. (D-Mart) 1.02% Telecom - Services 3.04%• Bharti Airtel Ltd. 3.04% Corporate Securities 0.04% Britannia Industries Ltd. CRISIL AAA 0.04% Equity less than 1% of corpus 0.38% Short Term Debt and net current assets 2.23% Total Net Assets 100.00%
Top Sectors
• Top Ten HoldingsSecurities and the corresponding derivative exposure with less than 1% to NAV, have been clubbed together with a consolidated limit of 10%.
Company/Issuer % to NAV
Application Amount for fresh Subscription :Rs.5,000 (plus in multiples of Re.1)
Min.Addl.Investment :Rs.1,000 (plus in multiples of Re.1)
NAV (As on 30-Jul-21): Growth Option : 295.15 IDCW Option : 76.90 Direct Plan Growth Option : 314.44 Direct Plan IDCW Option : 125.30 `̀ `̀` `
`
Average P/E :
35.27Average P/B :
14.71
Average Dividend Yield :
1.87
Std Dev (Annualised) :
15.60%
Sharpe Ratio :
0.32Portfolio Beta :
1.00
Annual Portfolio Turnover Ratio : Equity - 0.44 times
Investors understand that their principal will be at Very High risk
79.52%
6.75%
6.59%
3.04%
2.23%
1.49%
0.38%
Consumer Non Durables
Retailing
Consumer Durables
Telecom - Services
Cash,Cash Equivalents and Net Current Assets
Entertainment
Leisure Services
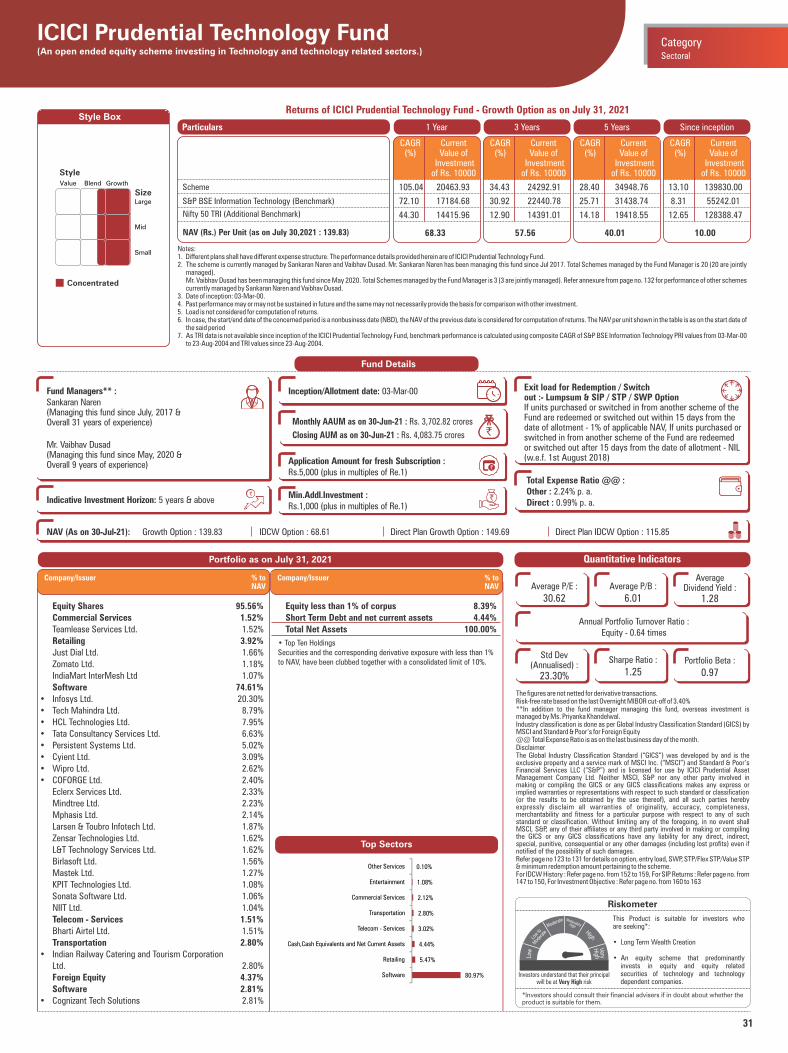
31
Style Box
Notes:1. Different plans shall have different expense structure. The performance details provided herein are of ICICI Prudential Technology Fund.2. The scheme is currently managed by Sankaran Naren and Vaibhav Dusad. Mr. Sankaran Naren has been managing this fund since Jul 2017. Total Schemes managed by the Fund Manager is 20 (20 are jointly
managed). Mr. Vaibhav Dusad has been managing this fund since May 2020. Total Schemes managed by the Fund Manager is 3 (3 are jointly managed). Refer annexure from page no. 132 for performance of other schemes
currently managed by Sankaran Naren and Vaibhav Dusad.3. Date of inception: 03-Mar-00.4. Past performance may or may not be sustained in future and the same may not necessarily provide the basis for comparison with other investment.5. Load is not considered for computation of returns.6. In case, the start/end date of the concerned period is a nonbusiness date (NBD), the NAV of the previous date is considered for computation of returns. The NAV per unit shown in the table is as on the start date of
the said period7. As TRI data is not available since inception of the ICICI Prudential Technology Fund, benchmark performance is calculated using composite CAGR of S&P BSE Information Technology PRI values from 03-Mar-00
to 23-Aug-2004 and TRI values since 23-Aug-2004.
Returns of ICICI Prudential Technology Fund - Growth Option as on July 31, 2021
1 Year 3 Years 5 Years Since inceptionParticulars
68.33 57.56
Scheme
S&P BSE Information Technology (Benchmark)
Nifty 50 TRI (Additional Benchmark)
NAV (Rs.) Per Unit (as on July 30,2021 : 139.83)
CAGR (%)
Current Value of
Investment of Rs. 10000
CAGR (%)
Current Value of
Investment of Rs. 10000
CAGR (%)
Current Value of
Investment of Rs. 10000
40.01
CAGR (%)
Current Value of
Investment of Rs. 10000
10.00
Portfolio as on July 31, 2021
Riskometer
This Product is suitable for investors who are seeking*:
• Long Term Wealth Creation
• An equity scheme that predominantly invests in equity and equity related securities of technology and technology dependent companies.
*Investors should consult their financial advisers if in doubt about whether theproduct is suitable for them.
Fund Details
Monthly AAUM as on 30-Jun-21 : Rs. 3,702.82 crores
Closing AUM as on 30-Jun-21 : Rs. 4,083.75 crores `
Fund Managers** :Sankaran Naren(Managing this fund since July, 2017 &Overall 31 years of experience)
Mr. Vaibhav Dusad(Managing this fund since May, 2020 &Overall 9 years of experience)
Indicative Investment Horizon: 5 years & above
Inception/Allotment date: 03-Mar-00 Exit load for Redemption / Switchout :- Lumpsum & SIP / STP / SWP OptionIf units purchased or switched in from another scheme of the Fund are redeemed or switched out within 15 days from the date of allotment - 1% of applicable NAV, If units purchased or switched in from another scheme of the Fund are redeemedor switched out after 15 days from the date of allotment - NIL (w.e.f. 1st August 2018)
Total Expense Ratio @@ :Other : 2.24% p. a.Direct : 0.99% p. a.
105.04 20463.93 34.43 24292.91 28.40 34948.76 13.10 139830.00
72.10 17184.68 30.92 22440.78 25.71 31438.74 8.31 55242.01
44.30 14415.96 12.90 14391.01 14.18 19418.55 12.65 128388.47
ICICI Prudential Technology Fund(An open ended equity scheme investing in Technology and technology related sectors.)
Value Blend Growth
Large
Mid
Small
Concentrated
Style
Size
The figures are not netted for derivative transactions.Risk-free rate based on the last Overnight MIBOR cut-off of 3.40%**In addition to the fund manager managing this fund, overseas investment is managed by Ms. Priyanka Khandelwal.Industry classification is done as per Global Industry Classification Standard (GICS) by MSCI and Standard & Poor’s for Foreign Equity@@ Total Expense Ratio is as on the last business day of the month.DisclaimerThe Global Industry Classification Standard (“GICS”) was developed by and is the exclusive property and a service mark of MSCI Inc. (“MSCI”) and Standard & Poor’s Financial Services LLC (“S&P”) and is licensed for use by ICICI Prudential Asset Management Company Ltd. Neither MSCI, S&P nor any other party involved in making or compiling the GICS or any GICS classifications makes any express or implied warranties or representations with respect to such standard or classification (or the results to be obtained by the use thereof), and all such parties hereby expressly disclaim all warranties of originality, accuracy, completeness, merchantability and fitness for a particular purpose with respect to any of such standard or classification. Without limiting any of the foregoing, in no event shall MSCI, S&P, any of their affiliates or any third party involved in making or compiling the GICS or any GICS classifications have any liability for any direct, indirect, special, punitive, consequential or any other damages (including lost profits) even if notified of the possibility of such damages.Refer page no 123 to 131 for details on option, entry load, SWP, STP/Flex STP/Value STP & minimum redemption amount pertaining to the scheme.For IDCW History : Refer page no. from 152 to 159, For SIP Returns : Refer page no. from 147 to 150, For Investment Objective : Refer page no. from 160 to 163
Quantitative Indicators
Sectoral
Category
Equity Shares 95.56% Commercial Services 1.52% Teamlease Services Ltd. 1.52% Retailing 3.92% Just Dial Ltd. 1.66% Zomato Ltd. 1.18% IndiaMart InterMesh Ltd 1.07% Software 74.61%• Infosys Ltd. 20.30%• Tech Mahindra Ltd. 8.79%• HCL Technologies Ltd. 7.95%• Tata Consultancy Services Ltd. 6.63%• Persistent Systems Ltd. 5.02%• Cyient Ltd. 3.09%• Wipro Ltd. 2.62%• COFORGE Ltd. 2.40% Eclerx Services Ltd. 2.33% Mindtree Ltd. 2.23% Mphasis Ltd. 2.14% Larsen & Toubro Infotech Ltd. 1.87% Zensar Technologies Ltd. 1.62% L&T Technology Services Ltd. 1.62% Birlasoft Ltd. 1.56% Mastek Ltd. 1.27% KPIT Technologies Ltd. 1.08% Sonata Software Ltd. 1.06% NIIT Ltd. 1.04% Telecom - Services 1.51% Bharti Airtel Ltd. 1.51% Transportation 2.80%• Indian Railway Catering and Tourism Corporation Ltd. 2.80% Foreign Equity 4.37% Software 2.81%• Cognizant Tech Solutions 2.81%
• Top Ten HoldingsSecurities and the corresponding derivative exposure with less than 1% to NAV, have been clubbed together with a consolidated limit of 10%.
Company/Issuer % to NAV
Application Amount for fresh Subscription :Rs.5,000 (plus in multiples of Re.1)
Min.Addl.Investment :Rs.1,000 (plus in multiples of Re.1)
NAV (As on 30-Jul-21): Growth Option : 139.83 IDCW Option : 68.61 Direct Plan Growth Option : 149.69 Direct Plan IDCW Option : 115.85 `̀ `̀` `
`
Average P/E :
30.62Average P/B :
6.01
Average Dividend Yield :
1.28
Std Dev (Annualised) :
23.30%
Sharpe Ratio :
1.25Portfolio Beta :
0.97
Annual Portfolio Turnover Ratio : Equity - 0.64 times
Top Sectors
Equity less than 1% of corpus 8.39% Short Term Debt and net current assets 4.44% Total Net Assets 100.00%
Company/Issuer % to NAV
Investors understand that their principal will be at Very High risk
80.97%
5.47%
4.44%
3.02%
2.80%
2.12%
1.08%
0.10%
Software
Retailing
Cash,Cash Equivalents and Net Current Assets
Telecom - Services
Transportation
Commercial Services
Entertainment
Other Services
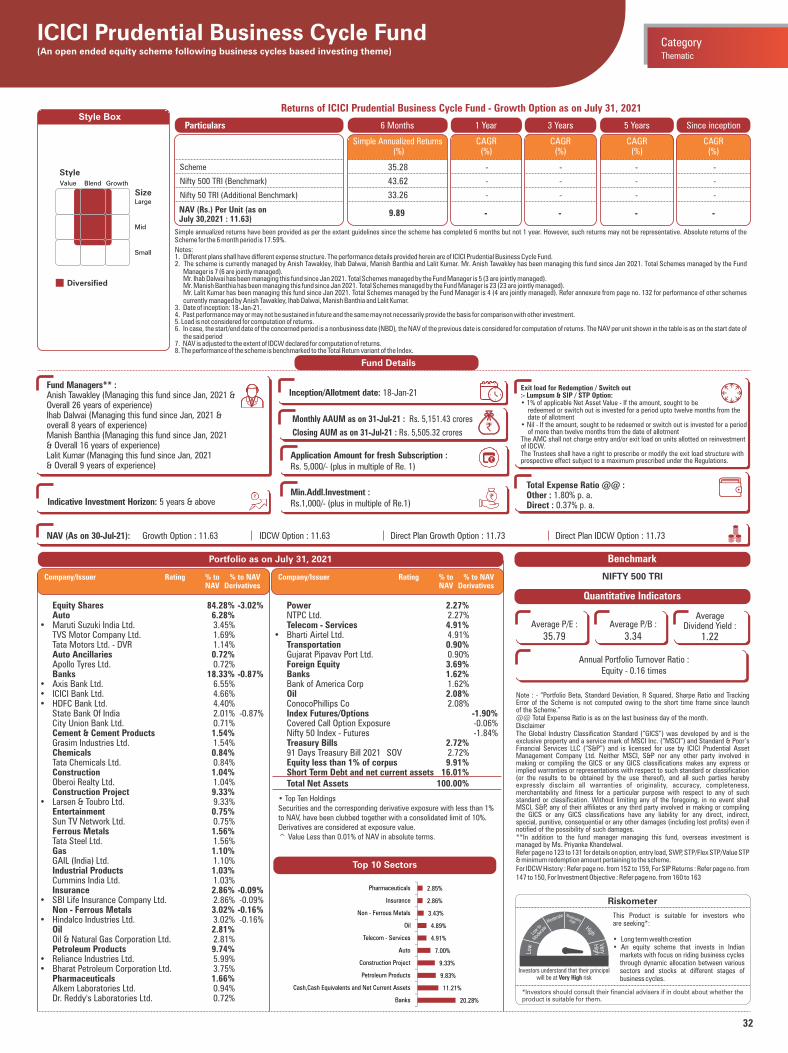
32
• Top Ten HoldingsSecurities and the corresponding derivative exposure with less than 1% to NAV, have been clubbed together with a consolidated limit of 10%.Derivatives are considered at exposure value.^ Value Less than 0.01% of NAV in absolute terms.
Portfolio as on July 31, 2021
Riskometer
This Product is suitable for investors who are seeking*:
• Long term wealth creation• An equity scheme that invests in Indian
markets with focus on riding business cycles through dynamic allocation between various sectors and stocks at different stages of business cycles.
*Investors should consult their financial advisers if in doubt about whether theproduct is suitable for them.
ICICI Prudential Business Cycle Fund(An open ended equity scheme following business cycles based investing theme) Thematic
Category
Note : - “Portfolio Beta, Standard Deviation, R Squared, Sharpe Ratio and Tracking Error of the Scheme is not computed owing to the short time frame since launch of the Scheme.”@@ Total Expense Ratio is as on the last business day of the month.DisclaimerThe Global Industry Classification Standard (“GICS”) was developed by and is the exclusive property and a service mark of MSCI Inc. (“MSCI”) and Standard & Poor’s Financial Services LLC (“S&P”) and is licensed for use by ICICI Prudential Asset Management Company Ltd. Neither MSCI, S&P nor any other party involved in making or compiling the GICS or any GICS classifications makes any express or implied warranties or representations with respect to such standard or classification (or the results to be obtained by the use thereof), and all such parties hereby expressly disclaim all warranties of originality, accuracy, completeness, merchantability and fitness for a particular purpose with respect to any of such standard or classification. Without limiting any of the foregoing, in no event shall MSCI, S&P, any of their affiliates or any third party involved in making or compiling the GICS or any GICS classifications have any liability for any direct, indirect, special, punitive, consequential or any other damages (including lost profits) even if notified of the possibility of such damages.**In addition to the fund manager managing this fund, overseas investment is managed by Ms. Priyanka Khandelwal.Refer page no 123 to 131 for details on option, entry load, SWP, STP/Flex STP/Value STP & minimum redemption amount pertaining to the scheme.For IDCW History : Refer page no. from 152 to 159, For SIP Returns : Refer page no. from 147 to 150, For Investment Objective : Refer page no. from 160 to 163
Quantitative Indicators
Benchmark
NIFTY 500 TRI
Average P/E :
35.79Average P/B :
3.34
Average Dividend Yield :
1.22
Annual Portfolio Turnover Ratio : Equity - 0.16 times
Style Box
Value Blend Growth
Large
Mid
Small
Diversified
Style
Size
Investors understand that their principal will be at Very High risk
Top 10 Sectors
Equity Shares 84.28% -3.02% Auto 6.28% • Maruti Suzuki India Ltd. 3.45% TVS Motor Company Ltd. 1.69% Tata Motors Ltd. - DVR 1.14% Auto Ancillaries 0.72% Apollo Tyres Ltd. 0.72% Banks 18.33% -0.87%• Axis Bank Ltd. 6.55% • ICICI Bank Ltd. 4.66% • HDFC Bank Ltd. 4.40% State Bank Of India 2.01% -0.87% City Union Bank Ltd. 0.71% Cement & Cement Products 1.54% Grasim Industries Ltd. 1.54% Chemicals 0.84% Tata Chemicals Ltd. 0.84% Construction 1.04% Oberoi Realty Ltd. 1.04% Construction Project 9.33% • Larsen & Toubro Ltd. 9.33% Entertainment 0.75% Sun TV Network Ltd. 0.75% Ferrous Metals 1.56% Tata Steel Ltd. 1.56% Gas 1.10% GAIL (India) Ltd. 1.10% Industrial Products 1.03% Cummins India Ltd. 1.03% Insurance 2.86% -0.09%• SBI Life Insurance Company Ltd. 2.86% -0.09% Non - Ferrous Metals 3.02% -0.16%• Hindalco Industries Ltd. 3.02% -0.16% Oil 2.81% Oil & Natural Gas Corporation Ltd. 2.81% Petroleum Products 9.74% • Reliance Industries Ltd. 5.99% • Bharat Petroleum Corporation Ltd. 3.75% Pharmaceuticals 1.66% Alkem Laboratories Ltd. 0.94% Dr. Reddy's Laboratories Ltd. 0.72%
Company/Issuer Rating % to % to NAV NAV Derivatives
Company/Issuer Rating % to % to NAV NAV Derivatives
Power 2.27% NTPC Ltd. 2.27% Telecom - Services 4.91% • Bharti Airtel Ltd. 4.91% Transportation 0.90% Gujarat Pipavav Port Ltd. 0.90% Foreign Equity 3.69% Banks 1.62% Bank of America Corp 1.62% Oil 2.08% ConocoPhillips Co 2.08% Index Futures/Options -1.90% Covered Call Option Exposure -0.06% Nifty 50 Index - Futures -1.84% Treasury Bills 2.72% 91 Days Treasury Bill 2021 SOV 2.72% Equity less than 1% of corpus 9.91% Short Term Debt and net current assets 16.01% Total Net Assets 100.00%
20.28%
11.21%
9.83%
9.33%
7.00%
4.91%
4.89%
3.43%
2.86%
2.85%
Banks
Cash,Cash Equivalents and Net Current Assets
Petroleum Products
Construction Project
Auto
Telecom - Services
Oil
Non - Ferrous Metals
Insurance
Pharmaceuticals
Fund Details
Fund Managers** :Anish Tawakley (Managing this fund since Jan, 2021 & Overall 26 years of experience)Ihab Dalwai (Managing this fund since Jan, 2021 & overall 8 years of experience)Manish Banthia (Managing this fund since Jan, 2021& Overall 16 years of experience)Lalit Kumar (Managing this fund since Jan, 2021& Overall 9 years of experience)
Total Expense Ratio @@ :Other : 1.80% p. a.Direct : 0.37% p. a.
Inception/Allotment date: 18-Jan-21Exit load for Redemption / Switch out:- Lumpsum & SIP / STP Option:• 1% of applicable Net Asset Value - If the amount, sought to be redeemed or switch out is invested for a period upto twelve months from the
date of allotment• Nil - If the amount, sought to be redeemed or switch out is invested for a period
of more than twelve months from the date of allotmentThe AMC shall not charge entry and/or exit load on units allotted on reinvestment of IDCW.The Trustees shall have a right to prescribe or modify the exit load structure with prospective effect subject to a maximum prescribed under the Regulations.
Monthly AAUM as on 31-Jul-21 : Rs. 5,151.43 crores
Closing AUM as on 31-Jul-21 : Rs. 5,505.32 crores`
Application Amount for fresh Subscription :Rs. 5,000/- (plus in multiple of Re. 1)
Min.Addl.Investment :Rs.1,000/- (plus in multiple of Re.1)
NAV (As on 30-Jul-21): Growth Option : 11.63 IDCW Option : 11.63 Direct Plan Growth Option : 11.73 Direct Plan IDCW Option : 11.73 `̀ `̀` `
`
Indicative Investment Horizon: 5 years & above
Notes:1. Different plans shall have different expense structure. The performance details provided herein are of ICICI Prudential Business Cycle Fund.2. The scheme is currently managed by Anish Tawakley, Ihab Dalwai, Manish Banthia and Lalit Kumar. Mr. Anish Tawakley has been managing this fund since Jan 2021. Total Schemes managed by the Fund
Manager is 7 (6 are jointly managed). Mr. Ihab Dalwai has been managing this fund since Jan 2021. Total Schemes managed by the Fund Manager is 5 (3 are jointly managed). Mr. Manish Banthia has been managing this fund since Jan 2021. Total Schemes managed by the Fund Manager is 23 (23 are jointly managed). Mr. Lalit Kumar has been managing this fund since Jan 2021. Total Schemes managed by the Fund Manager is 4 (4 are jointly managed). Refer annexure from page no. 132 for performance of other schemes
currently managed by Anish Tawakley, Ihab Dalwai, Manish Banthia and Lalit Kumar.3. Date of inception: 18-Jan-21.4. Past performance may or may not be sustained in future and the same may not necessarily provide the basis for comparison with other investment.5. Load is not considered for computation of returns.6. In case, the start/end date of the concerned period is a nonbusiness date (NBD), the NAV of the previous date is considered for computation of returns. The NAV per unit shown in the table is as on the start date of
the said period7. NAV is adjusted to the extent of IDCW declared for computation of returns.8. The performance of the scheme is benchmarked to the Total Return variant of the Index.
Returns of ICICI Prudential Business Cycle Fund - Growth Option as on July 31, 2021
1 Year 3 Years 5 YearsParticulars
- -
CAGR (%)
CAGR (%)
CAGR (%)
-
Scheme
Nifty 500 TRI (Benchmark)
Nifty 50 TRI (Additional Benchmark)
NAV (Rs.) Per Unit (as on July 30,2021 : 11.63)
6 Months
Simple Annualized Returns (%)
35.28 - - - -
43.62 - - - -
33.26 - - - -
9.89
Since inception
CAGR (%)
-
Simple annualized returns have been provided as per the extant guidelines since the scheme has completed 6 months but not 1 year. However, such returns may not be representative. Absolute returns of the Scheme for the 6 month period is 17.59%.
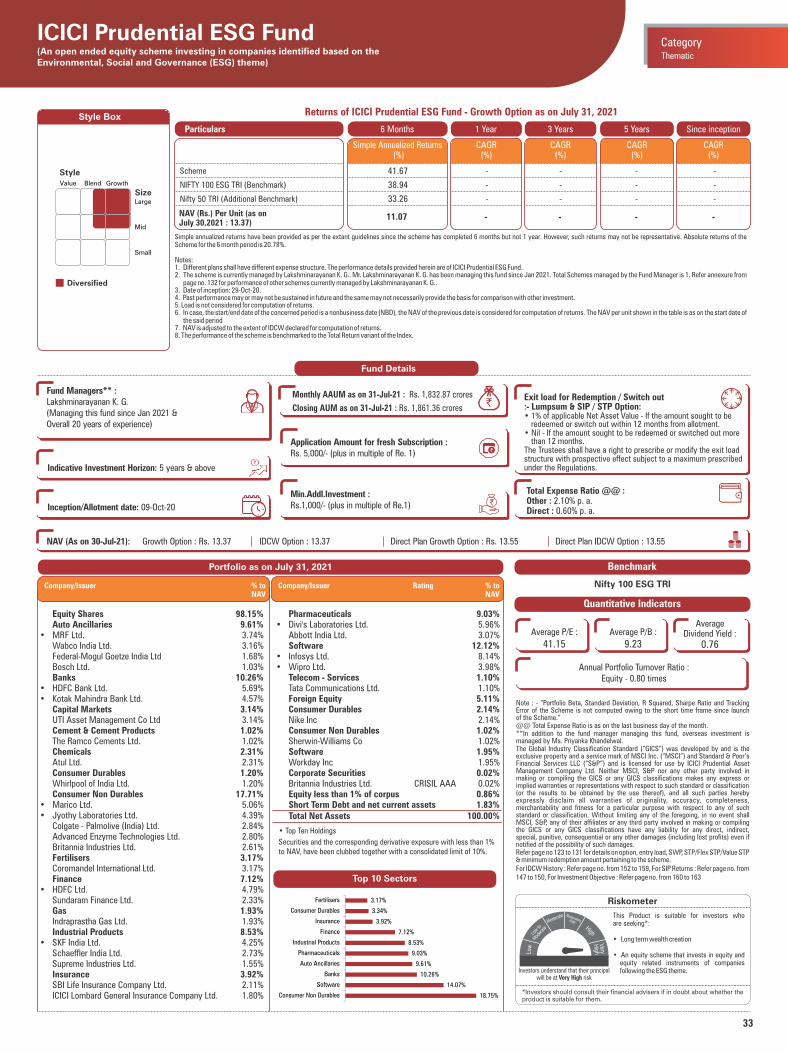
33
Portfolio as on July 31, 2021
Riskometer
This Product is suitable for investors who are seeking*:
• Long term wealth creation
• An equity scheme that invests in equity and equity related instruments of companies following the ESG theme.
*Investors should consult their financial advisers if in doubt about whether theproduct is suitable for them.
ICICI Prudential ESG Fund(An open ended equity scheme investing in companies identified based on theEnvironmental, Social and Governance (ESG) theme)
Thematic
Category
Note : - “Portfolio Beta, Standard Deviation, R Squared, Sharpe Ratio and Tracking Error of the Scheme is not computed owing to the short time frame since launch of the Scheme.”@@ Total Expense Ratio is as on the last business day of the month.**In addition to the fund manager managing this fund, overseas investment is managed by Ms. Priyanka Khandelwal.The Global Industry Classification Standard (“GICS”) was developed by and is the exclusive property and a service mark of MSCI Inc. (“MSCI”) and Standard & Poor’s Financial Services LLC (“S&P”) and is licensed for use by ICICI Prudential Asset Management Company Ltd. Neither MSCI, S&P nor any other party involved in making or compiling the GICS or any GICS classifications makes any express or implied warranties or representations with respect to such standard or classification (or the results to be obtained by the use thereof), and all such parties hereby expressly disclaim all warranties of originality, accuracy, completeness, merchantability and fitness for a particular purpose with respect to any of such standard or classification. Without limiting any of the foregoing, in no event shall MSCI, S&P, any of their affiliates or any third party involved in making or compiling the GICS or any GICS classifications have any liability for any direct, indirect, special, punitive, consequential or any other damages (including lost profits) even if notified of the possibility of such damages.Refer page no 123 to 131 for details on option, entry load, SWP, STP/Flex STP/Value STP & minimum redemption amount pertaining to the scheme.For IDCW History : Refer page no. from 152 to 159, For SIP Returns : Refer page no. from 147 to 150, For Investment Objective : Refer page no. from 160 to 163
Quantitative Indicators
Benchmark
Nifty 100 ESG TRI
Average P/E :
41.15Average P/B :
9.23
Average Dividend Yield :
0.76
Annual Portfolio Turnover Ratio : Equity - 0.80 times
Equity Shares 98.15% Auto Ancillaries 9.61%• MRF Ltd. 3.74% Wabco India Ltd. 3.16% Federal-Mogul Goetze India Ltd 1.68% Bosch Ltd. 1.03% Banks 10.26%• HDFC Bank Ltd. 5.69%• Kotak Mahindra Bank Ltd. 4.57% Capital Markets 3.14% UTI Asset Management Co Ltd 3.14% Cement & Cement Products 1.02% The Ramco Cements Ltd. 1.02% Chemicals 2.31% Atul Ltd. 2.31% Consumer Durables 1.20% Whirlpool of India Ltd. 1.20% Consumer Non Durables 17.71%• Marico Ltd. 5.06%• Jyothy Laboratories Ltd. 4.39% Colgate - Palmolive (India) Ltd. 2.84% Advanced Enzyme Technologies Ltd. 2.80% Britannia Industries Ltd. 2.61% Fertilisers 3.17% Coromandel International Ltd. 3.17% Finance 7.12%• HDFC Ltd. 4.79% Sundaram Finance Ltd. 2.33% Gas 1.93% Indraprastha Gas Ltd. 1.93% Industrial Products 8.53%• SKF India Ltd. 4.25% Schaeffler India Ltd. 2.73% Supreme Industries Ltd. 1.55% Insurance 3.92% SBI Life Insurance Company Ltd. 2.11% ICICI Lombard General Insurance Company Ltd. 1.80%
Company/Issuer % to NAV
Style Box
Value Blend Growth
Large
Mid
Small
Diversified
Style
Size
Investors understand that their principal will be at Very High risk
• Top Ten Holdings
Securities and the corresponding derivative exposure with less than 1% to NAV, have been clubbed together with a consolidated limit of 10%.
Top 10 Sectors
Company/Issuer Rating % to NAV
Pharmaceuticals 9.03%• Divi's Laboratories Ltd. 5.96% Abbott India Ltd. 3.07% Software 12.12%• Infosys Ltd. 8.14%• Wipro Ltd. 3.98% Telecom - Services 1.10% Tata Communications Ltd. 1.10% Foreign Equity 5.11% Consumer Durables 2.14% Nike Inc 2.14% Consumer Non Durables 1.02% Sherwin-Williams Co 1.02% Software 1.95% Workday Inc 1.95% Corporate Securities 0.02% Britannia Industries Ltd. CRISIL AAA 0.02% Equity less than 1% of corpus 0.86% Short Term Debt and net current assets 1.83% Total Net Assets 100.00%
Fund Details
Fund Managers** :Lakshminarayanan K. G.(Managing this fund since Jan 2021 &Overall 20 years of experience)
Total Expense Ratio @@ :Other : 2.10% p. a.Direct : 0.60% p. a.Inception/Allotment date: 09-Oct-20
Exit load for Redemption / Switch out:- Lumpsum & SIP / STP Option:• 1% of applicable Net Asset Value - If the amount sought to be
redeemed or switch out within 12 months from allotment.• Nil - If the amount sought to be redeemed or switched out more
than 12 months.The Trustees shall have a right to prescribe or modify the exit loadstructure with prospective effect subject to a maximum prescribedunder the Regulations.
Monthly AAUM as on 31-Jul-21 : Rs. 1,832.87 crores
Closing AUM as on 31-Jul-21 : Rs. 1,861.36 crores`
Application Amount for fresh Subscription :Rs. 5,000/- (plus in multiple of Re. 1)
Min.Addl.Investment :Rs.1,000/- (plus in multiple of Re.1)
NAV (As on 30-Jul-21): Growth Option : Rs. 13.37 IDCW Option : 13.37 Direct Plan Growth Option : Rs. 13.55 Direct Plan IDCW Option : 13.55 `̀ `̀` `
`
Indicative Investment Horizon: 5 years & above
Returns of ICICI Prudential ESG Fund - Growth Option as on July 31, 2021
1 Year 3 Years 5 YearsParticulars
- -
CAGR (%)
CAGR (%)
CAGR (%)
-
Scheme
NIFTY 100 ESG TRI (Benchmark)
Nifty 50 TRI (Additional Benchmark)
NAV (Rs.) Per Unit (as on July 30,2021 : 13.37)
6 Months
Simple Annualized Returns (%)
41.67 - - - -
38.94 - - - -
33.26 - - - -
11.07
Since inception
CAGR (%)
-
Notes:1. Different plans shall have different expense structure. The performance details provided herein are of ICICI Prudential ESG Fund.2. The scheme is currently managed by Lakshminarayanan K. G.. Mr. Lakshminarayanan K. G. has been managing this fund since Jan 2021. Total Schemes managed by the Fund Manager is 1. Refer annexure from
page no. 132 for performance of other schemes currently managed by Lakshminarayanan K. G..3. Date of inception: 29-Oct-20.4. Past performance may or may not be sustained in future and the same may not necessarily provide the basis for comparison with other investment.5. Load is not considered for computation of returns.6. In case, the start/end date of the concerned period is a nonbusiness date (NBD), the NAV of the previous date is considered for computation of returns. The NAV per unit shown in the table is as on the start date of
the said period7. NAV is adjusted to the extent of IDCW declared for computation of returns.8. The performance of the scheme is benchmarked to the Total Return variant of the Index.
Simple annualized returns have been provided as per the extant guidelines since the scheme has completed 6 months but not 1 year. However, such returns may not be representative. Absolute returns of the Scheme for the 6 month period is 20.78%.
18.75%
14.07%
10.26%
9.61%
9.03%
8.53%
7.12%
3.92%
3.34%
3.17%
Consumer Non Durables
Software
Banks
Auto Ancillaries
Pharmaceuticals
Industrial Products
Finance
Insurance
Consumer Durables
Fertilisers
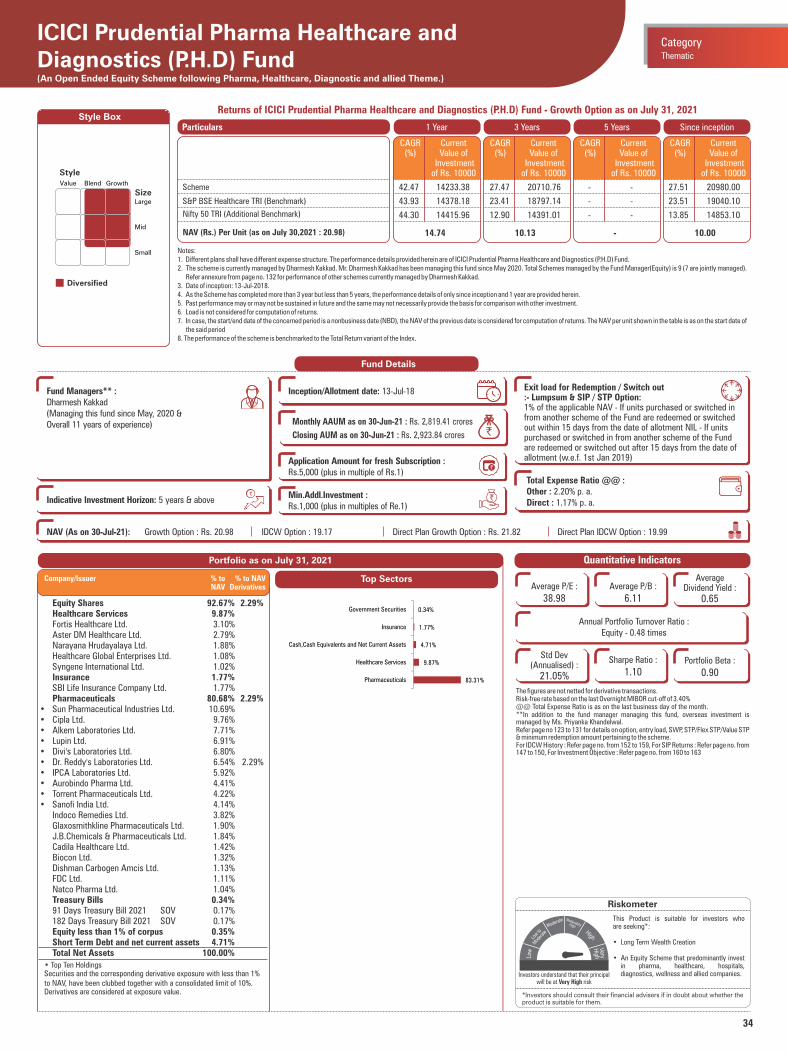
34
Style Box
Notes:1. Different plans shall have different expense structure. The performance details provided herein are of ICICI Prudential Pharma Healthcare and Diagnostics (P.H.D) Fund.2. The scheme is currently managed by Dharmesh Kakkad. Mr. Dharmesh Kakkad has been managing this fund since May 2020. Total Schemes managed by the Fund Manager(Equity) is 9 (7 are jointly managed).
Refer annexure from page no. 132 for performance of other schemes currently managed by Dharmesh Kakkad.3. Date of inception: 13-Jul-2018.4. As the Scheme has completed more than 3 year but less than 5 years, the performance details of only since inception and 1 year are provided herein.5. Past performance may or may not be sustained in future and the same may not necessarily provide the basis for comparison with other investment.6. Load is not considered for computation of returns.7. In case, the start/end date of the concerned period is a nonbusiness date (NBD), the NAV of the previous date is considered for computation of returns. The NAV per unit shown in the table is as on the start date of
the said period8. The performance of the scheme is benchmarked to the Total Return variant of the Index.
Returns of ICICI Prudential Pharma Healthcare and Diagnostics (P.H.D) Fund - Growth Option as on July 31, 2021
1 Year 3 Years 5 Years Since inceptionParticulars
14.74 10.13
Scheme
S&P BSE Healthcare TRI (Benchmark)
Nifty 50 TRI (Additional Benchmark)
NAV (Rs.) Per Unit (as on July 30,2021 : 20.98)
CAGR (%)
Current Value of
Investment of Rs. 10000
CAGR (%)
Current Value of
Investment of Rs. 10000
CAGR (%)
Current Value of
Investment of Rs. 10000
-
CAGR (%)
Current Value of
Investment of Rs. 10000
10.00
Portfolio as on July 31, 2021
Riskometer
This Product is suitable for investors who are seeking*:
• Long Term Wealth Creation
• An Equity Scheme that predominantly invest in pharma, healthcare, hospitals, diagnostics, wellness and allied companies.
*Investors should consult their financial advisers if in doubt about whether theproduct is suitable for them.
Fund Details
Monthly AAUM as on 30-Jun-21 : Rs. 2,819.41 crores
Closing AUM as on 30-Jun-21 : Rs. 2,923.84 crores `
Fund Managers** :Dharmesh Kakkad(Managing this fund since May, 2020 &Overall 11 years of experience)
Indicative Investment Horizon: 5 years & above
Inception/Allotment date: 13-Jul-18 Exit load for Redemption / Switch out:- Lumpsum & SIP / STP Option: 1% of the applicable NAV - If units purchased or switched in from another scheme of the Fund are redeemed or switched out within 15 days from the date of allotment NIL - If units purchased or switched in from another scheme of the Fund are redeemed or switched out after 15 days from the date of allotment (w.e.f. 1st Jan 2019)
Total Expense Ratio @@ :Other : 2.20% p. a.Direct : 1.17% p. a.
42.47 14233.38 27.47 20710.76 - - 27.51 20980.00
43.93 14378.18 23.41 18797.14 - - 23.51 19040.10
44.30 14415.96 12.90 14391.01 - - 13.85 14853.10
ICICI Prudential Pharma Healthcare and Diagnostics (P.H.D) Fund(An Open Ended Equity Scheme following Pharma, Healthcare, Diagnostic and allied Theme.)
Value Blend Growth
Large
Mid
Small
Diversified
Style
Size
The figures are not netted for derivative transactions.Risk-free rate based on the last Overnight MIBOR cut-off of 3.40%@@ Total Expense Ratio is as on the last business day of the month.**In addition to the fund manager managing this fund, overseas investment is managed by Ms. Priyanka Khandelwal.Refer page no 123 to 131 for details on option, entry load, SWP, STP/Flex STP/Value STP & minimum redemption amount pertaining to the scheme.For IDCW History : Refer page no. from 152 to 159, For SIP Returns : Refer page no. from 147 to 150, For Investment Objective : Refer page no. from 160 to 163
Quantitative Indicators
Thematic
Category
Top Sectors
Application Amount for fresh Subscription :Rs.5,000 (plus in multiple of Rs.1)
Min.Addl.Investment :Rs.1,000 (plus in multiples of Re.1)
NAV (As on 30-Jul-21): Growth Option : Rs. 20.98 IDCW Option : 19.17 Direct Plan Growth Option : Rs. 21.82 Direct Plan IDCW Option : 19.99 `̀ `̀` `
`
Average P/E :
38.98Average P/B :
6.11
Average Dividend Yield :
0.65
Annual Portfolio Turnover Ratio : Equity - 0.48 times
Equity Shares 92.67% 2.29% Healthcare Services 9.87% Fortis Healthcare Ltd. 3.10% Aster DM Healthcare Ltd. 2.79% Narayana Hrudayalaya Ltd. 1.88% Healthcare Global Enterprises Ltd. 1.08% Syngene International Ltd. 1.02% Insurance 1.77% SBI Life Insurance Company Ltd. 1.77% Pharmaceuticals 80.68% 2.29%• Sun Pharmaceutical Industries Ltd. 10.69% • Cipla Ltd. 9.76% • Alkem Laboratories Ltd. 7.71% • Lupin Ltd. 6.91% • Divi's Laboratories Ltd. 6.80% • Dr. Reddy's Laboratories Ltd. 6.54% 2.29%• IPCA Laboratories Ltd. 5.92% • Aurobindo Pharma Ltd. 4.41% • Torrent Pharmaceuticals Ltd. 4.22% • Sanofi India Ltd. 4.14% Indoco Remedies Ltd. 3.82% Glaxosmithkline Pharmaceuticals Ltd. 1.90% J.B.Chemicals & Pharmaceuticals Ltd. 1.84% Cadila Healthcare Ltd. 1.42% Biocon Ltd. 1.32% Dishman Carbogen Amcis Ltd. 1.13% FDC Ltd. 1.11% Natco Pharma Ltd. 1.04% Treasury Bills 0.34% 91 Days Treasury Bill 2021 SOV 0.17% 182 Days Treasury Bill 2021 SOV 0.17% Equity less than 1% of corpus 0.35% Short Term Debt and net current assets 4.71% Total Net Assets 100.00%
Company/Issuer % to % to NAV NAV Derivatives
• Top Ten HoldingsSecurities and the corresponding derivative exposure with less than 1% to NAV, have been clubbed together with a consolidated limit of 10%.Derivatives are considered at exposure value.
Investors understand that their principal will be at Very High risk
Std Dev (Annualised) :
21.05%
Sharpe Ratio :
1.10Portfolio Beta :
0.9083.31%
9.87%
4.71%
1.77%
0.34%
Pharmaceuticals
Healthcare Services
Cash,Cash Equivalents and Net Current Assets
Insurance
Government Securities
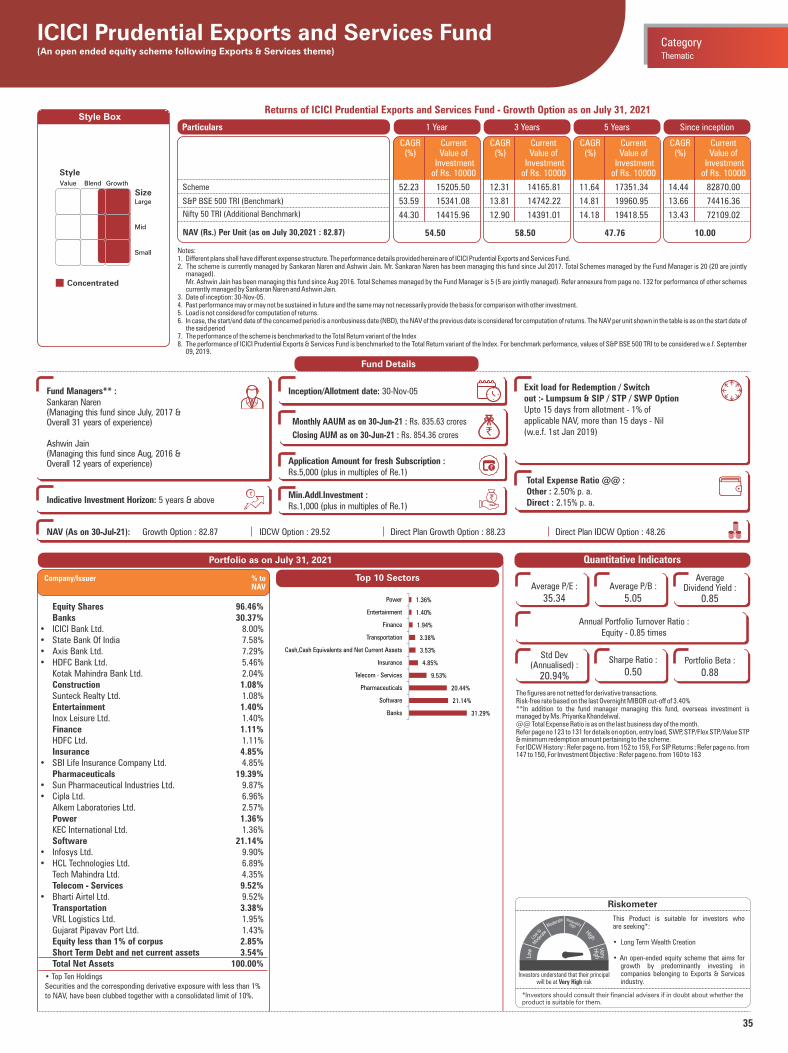
35
Style Box
Notes:1. Different plans shall have different expense structure. The performance details provided herein are of ICICI Prudential Exports and Services Fund.2. The scheme is currently managed by Sankaran Naren and Ashwin Jain. Mr. Sankaran Naren has been managing this fund since Jul 2017. Total Schemes managed by the Fund Manager is 20 (20 are jointly
managed). Mr. Ashwin Jain has been managing this fund since Aug 2016. Total Schemes managed by the Fund Manager is 5 (5 are jointly managed). Refer annexure from page no. 132 for performance of other schemes
currently managed by Sankaran Naren and Ashwin Jain.3. Date of inception: 30-Nov-05.4. Past performance may or may not be sustained in future and the same may not necessarily provide the basis for comparison with other investment.5. Load is not considered for computation of returns.6. In case, the start/end date of the concerned period is a nonbusiness date (NBD), the NAV of the previous date is considered for computation of returns. The NAV per unit shown in the table is as on the start date of
the said period7. The performance of the scheme is benchmarked to the Total Return variant of the Index8. The performance of ICICI Prudential Exports & Services Fund is benchmarked to the Total Return variant of the Index. For benchmark performance, values of S&P BSE 500 TRI to be considered w.e.f. September
09, 2019.
Returns of ICICI Prudential Exports and Services Fund - Growth Option as on July 31, 2021
1 Year 3 Years 5 Years Since inceptionParticulars
54.50 58.50
Scheme
S&P BSE 500 TRI (Benchmark)
Nifty 50 TRI (Additional Benchmark)
NAV (Rs.) Per Unit (as on July 30,2021 : 82.87)
CAGR (%)
Current Value of
Investment of Rs. 10000
CAGR (%)
Current Value of
Investment of Rs. 10000
CAGR (%)
Current Value of
Investment of Rs. 10000
47.76
CAGR (%)
Current Value of
Investment of Rs. 10000
10.00
Portfolio as on July 31, 2021
Riskometer
This Product is suitable for investors who are seeking*:
• Long Term Wealth Creation
• An open-ended equity scheme that aims for growth by predominantly investing in companies belonging to Exports & Services industry.
*Investors should consult their financial advisers if in doubt about whether theproduct is suitable for them.
Fund Details
Monthly AAUM as on 30-Jun-21 : Rs. 835.63 crores
Closing AUM as on 30-Jun-21 : Rs. 854.36 crores `
Fund Managers** :Sankaran Naren(Managing this fund since July, 2017 &Overall 31 years of experience)
Ashwin Jain(Managing this fund since Aug, 2016 &Overall 12 years of experience)
Indicative Investment Horizon: 5 years & above
Inception/Allotment date: 30-Nov-05 Exit load for Redemption / Switchout :- Lumpsum & SIP / STP / SWP OptionUpto 15 days from allotment - 1% ofapplicable NAV, more than 15 days - Nil (w.e.f. 1st Jan 2019)
Total Expense Ratio @@ :Other : 2.50% p. a.Direct : 2.15% p. a.
52.23 15205.50 12.31 14165.81 11.64 17351.34 14.44 82870.00
53.59 15341.08 13.81 14742.22 14.81 19960.95 13.66 74416.36
44.30 14415.96 12.90 14391.01 14.18 19418.55 13.43 72109.02
ICICI Prudential Exports and Services Fund(An open ended equity scheme following Exports & Services theme)
Value Blend Growth
Large
Mid
Small
Concentrated
Style
Size
The figures are not netted for derivative transactions.Risk-free rate based on the last Overnight MIBOR cut-off of 3.40%**In addition to the fund manager managing this fund, overseas investment is managed by Ms. Priyanka Khandelwal.@@ Total Expense Ratio is as on the last business day of the month.Refer page no 123 to 131 for details on option, entry load, SWP, STP/Flex STP/Value STP & minimum redemption amount pertaining to the scheme.For IDCW History : Refer page no. from 152 to 159, For SIP Returns : Refer page no. from 147 to 150, For Investment Objective : Refer page no. from 160 to 163
Quantitative Indicators
Thematic
Category
Equity Shares 96.46% Banks 30.37%• ICICI Bank Ltd. 8.00%• State Bank Of India 7.58%• Axis Bank Ltd. 7.29%• HDFC Bank Ltd. 5.46% Kotak Mahindra Bank Ltd. 2.04% Construction 1.08% Sunteck Realty Ltd. 1.08% Entertainment 1.40% Inox Leisure Ltd. 1.40% Finance 1.11% HDFC Ltd. 1.11% Insurance 4.85%• SBI Life Insurance Company Ltd. 4.85% Pharmaceuticals 19.39%• Sun Pharmaceutical Industries Ltd. 9.87%• Cipla Ltd. 6.96% Alkem Laboratories Ltd. 2.57% Power 1.36% KEC International Ltd. 1.36% Software 21.14%• Infosys Ltd. 9.90%• HCL Technologies Ltd. 6.89% Tech Mahindra Ltd. 4.35% Telecom - Services 9.52%• Bharti Airtel Ltd. 9.52% Transportation 3.38% VRL Logistics Ltd. 1.95% Gujarat Pipavav Port Ltd. 1.43% Equity less than 1% of corpus 2.85% Short Term Debt and net current assets 3.54% Total Net Assets 100.00%
• Top Ten HoldingsSecurities and the corresponding derivative exposure with less than 1% to NAV, have been clubbed together with a consolidated limit of 10%.
Company/Issuer % to NAV
Top 10 Sectors
Application Amount for fresh Subscription :Rs.5,000 (plus in multiples of Re.1)
Min.Addl.Investment :Rs.1,000 (plus in multiples of Re.1)
NAV (As on 30-Jul-21): Growth Option : 82.87 IDCW Option : 29.52 Direct Plan Growth Option : 88.23 Direct Plan IDCW Option : 48.26 `̀ `̀` `
`
Average P/E :
35.34Average P/B :
5.05
Average Dividend Yield :
0.85
Std Dev (Annualised) :
20.94%
Sharpe Ratio :
0.50Portfolio Beta :
0.88
Annual Portfolio Turnover Ratio : Equity - 0.85 times
Investors understand that their principal will be at Very High risk
31.29%
21.14%
20.44%
9.53%
4.85%
3.53%
3.38%
1.94%
1.40%
1.36%
Banks
Software
Pharmaceuticals
Telecom - Services
Insurance
Cash,Cash Equivalents and Net Current Assets
Transportation
Finance
Entertainment
Power
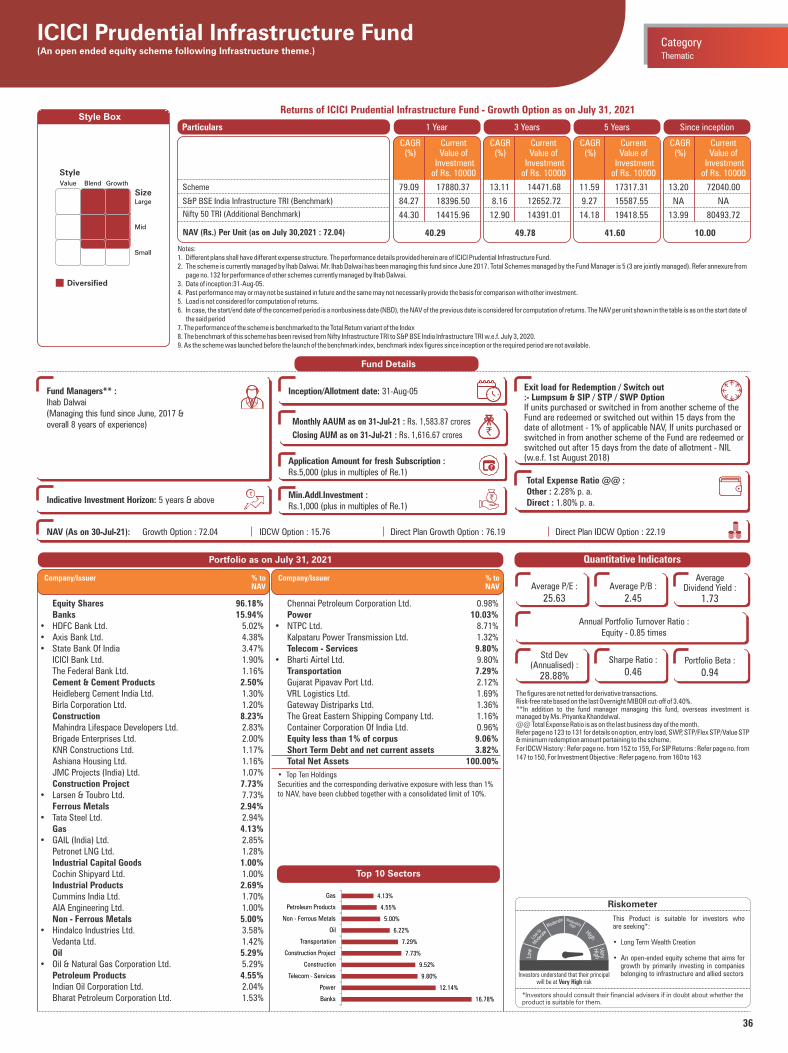
36
Style Box
Notes:1. Different plans shall have different expense structure. The performance details provided herein are of ICICI Prudential Infrastructure Fund.2. The scheme is currently managed by Ihab Dalwai. Mr. Ihab Dalwai has been managing this fund since June 2017. Total Schemes managed by the Fund Manager is 5 (3 are jointly managed). Refer annexure from
page no. 132 for performance of other schemes currently managed by Ihab Dalwai.3. Date of inception:31-Aug-05.4. Past performance may or may not be sustained in future and the same may not necessarily provide the basis for comparison with other investment.5. Load is not considered for computation of returns.6. In case, the start/end date of the concerned period is a nonbusiness date (NBD), the NAV of the previous date is considered for computation of returns. The NAV per unit shown in the table is as on the start date of
the said period7. The performance of the scheme is benchmarked to the Total Return variant of the Index8. The benchmark of this scheme has been revised from Nifty Infrastructure TRI to S&P BSE India Infrastructure TRI w.e.f. July 3, 2020.9. As the scheme was launched before the launch of the benchmark index, benchmark index figures since inception or the required period are not available.
Returns of ICICI Prudential Infrastructure Fund - Growth Option as on July 31, 2021
1 Year 3 Years 5 Years Since inceptionParticulars
40.29 49.78
Scheme
S&P BSE India Infrastructure TRI (Benchmark)
Nifty 50 TRI (Additional Benchmark)
NAV (Rs.) Per Unit (as on July 30,2021 : 72.04)
CAGR (%)
Current Value of
Investment of Rs. 10000
CAGR (%)
Current Value of
Investment of Rs. 10000
CAGR (%)
Current Value of
Investment of Rs. 10000
41.60
CAGR (%)
Current Value of
Investment of Rs. 10000
10.00
Portfolio as on July 31, 2021
Riskometer
This Product is suitable for investors who are seeking*:
• Long Term Wealth Creation
• An open-ended equity scheme that aims for growth by primarily investing in companies belonging to infrastructure and allied sectors
*Investors should consult their financial advisers if in doubt about whether theproduct is suitable for them.
Fund Details
Monthly AAUM as on 31-Jul-21 : Rs. 1,583.87 crores
Closing AUM as on 31-Jul-21 : Rs. 1,616.67 crores `
Fund Managers** :Ihab Dalwai(Managing this fund since June, 2017 & overall 8 years of experience)
Indicative Investment Horizon: 5 years & above
Inception/Allotment date: 31-Aug-05 Exit load for Redemption / Switch out:- Lumpsum & SIP / STP / SWP OptionIf units purchased or switched in from another scheme of the Fund are redeemed or switched out within 15 days from the date of allotment - 1% of applicable NAV, If units purchased or switched in from another scheme of the Fund are redeemed or switched out after 15 days from the date of allotment - NIL (w.e.f. 1st August 2018)
Total Expense Ratio @@ :Other : 2.28% p. a.Direct : 1.80% p. a.
79.09 17880.37 13.11 14471.68 11.59 17317.31 13.20 72040.00
84.27 18396.50 8.16 12652.72 9.27 15587.55 NA NA
44.30 14415.96 12.90 14391.01 14.18 19418.55 13.99 80493.72
ICICI Prudential Infrastructure Fund(An open ended equity scheme following Infrastructure theme.)
Value Blend Growth
Large
Mid
Small
Diversified
Style
Size
The figures are not netted for derivative transactions.Risk-free rate based on the last Overnight MIBOR cut-off of 3.40%.**In addition to the fund manager managing this fund, overseas investment is managed by Ms. Priyanka Khandelwal.@@ Total Expense Ratio is as on the last business day of the month.Refer page no 123 to 131 for details on option, entry load, SWP, STP/Flex STP/Value STP & minimum redemption amount pertaining to the scheme.For IDCW History : Refer page no. from 152 to 159, For SIP Returns : Refer page no. from 147 to 150, For Investment Objective : Refer page no. from 160 to 163
Quantitative Indicators
Thematic
Category
Top 10 Sectors
• Top Ten HoldingsSecurities and the corresponding derivative exposure with less than 1% to NAV, have been clubbed together with a consolidated limit of 10%.
Equity Shares 96.18% Banks 15.94%• HDFC Bank Ltd. 5.02%• Axis Bank Ltd. 4.38%• State Bank Of India 3.47% ICICI Bank Ltd. 1.90% The Federal Bank Ltd. 1.16% Cement & Cement Products 2.50% Heidleberg Cement India Ltd. 1.30% Birla Corporation Ltd. 1.20% Construction 8.23% Mahindra Lifespace Developers Ltd. 2.83% Brigade Enterprises Ltd. 2.00% KNR Constructions Ltd. 1.17% Ashiana Housing Ltd. 1.16% JMC Projects (India) Ltd. 1.07% Construction Project 7.73%• Larsen & Toubro Ltd. 7.73% Ferrous Metals 2.94%• Tata Steel Ltd. 2.94% Gas 4.13%• GAIL (India) Ltd. 2.85% Petronet LNG Ltd. 1.28% Industrial Capital Goods 1.00% Cochin Shipyard Ltd. 1.00% Industrial Products 2.69% Cummins India Ltd. 1.70% AIA Engineering Ltd. 1.00% Non - Ferrous Metals 5.00%• Hindalco Industries Ltd. 3.58% Vedanta Ltd. 1.42% Oil 5.29%• Oil & Natural Gas Corporation Ltd. 5.29% Petroleum Products 4.55% Indian Oil Corporation Ltd. 2.04% Bharat Petroleum Corporation Ltd. 1.53%
Chennai Petroleum Corporation Ltd. 0.98% Power 10.03%• NTPC Ltd. 8.71% Kalpataru Power Transmission Ltd. 1.32% Telecom - Services 9.80%• Bharti Airtel Ltd. 9.80% Transportation 7.29% Gujarat Pipavav Port Ltd. 2.12% VRL Logistics Ltd. 1.69% Gateway Distriparks Ltd. 1.36% The Great Eastern Shipping Company Ltd. 1.16% Container Corporation Of India Ltd. 0.96% Equity less than 1% of corpus 9.06% Short Term Debt and net current assets 3.82% Total Net Assets 100.00%
Company/Issuer % to NAV
Company/Issuer % to NAV
Application Amount for fresh Subscription :Rs.5,000 (plus in multiples of Re.1)
Min.Addl.Investment :Rs.1,000 (plus in multiples of Re.1)
NAV (As on 30-Jul-21): Growth Option : 72.04 IDCW Option : 15.76 Direct Plan Growth Option : 76.19 Direct Plan IDCW Option : 22.19 `̀ `̀` `
`
Average P/E :
25.63Average P/B :
2.45
Average Dividend Yield :
1.73
Std Dev (Annualised) :
28.88%
Sharpe Ratio :
0.46Portfolio Beta :
0.94
Annual Portfolio Turnover Ratio : Equity - 0.85 times
Investors understand that their principal will be at Very High risk
16.78%
12.14%
9.80%
9.52%
7.73%
7.29%
6.22%
5.00%
4.55%
4.13%
Banks
Power
Telecom - Services
Construction
Construction Project
Transportation
Oil
Non - Ferrous Metals
Petroleum Products
Gas
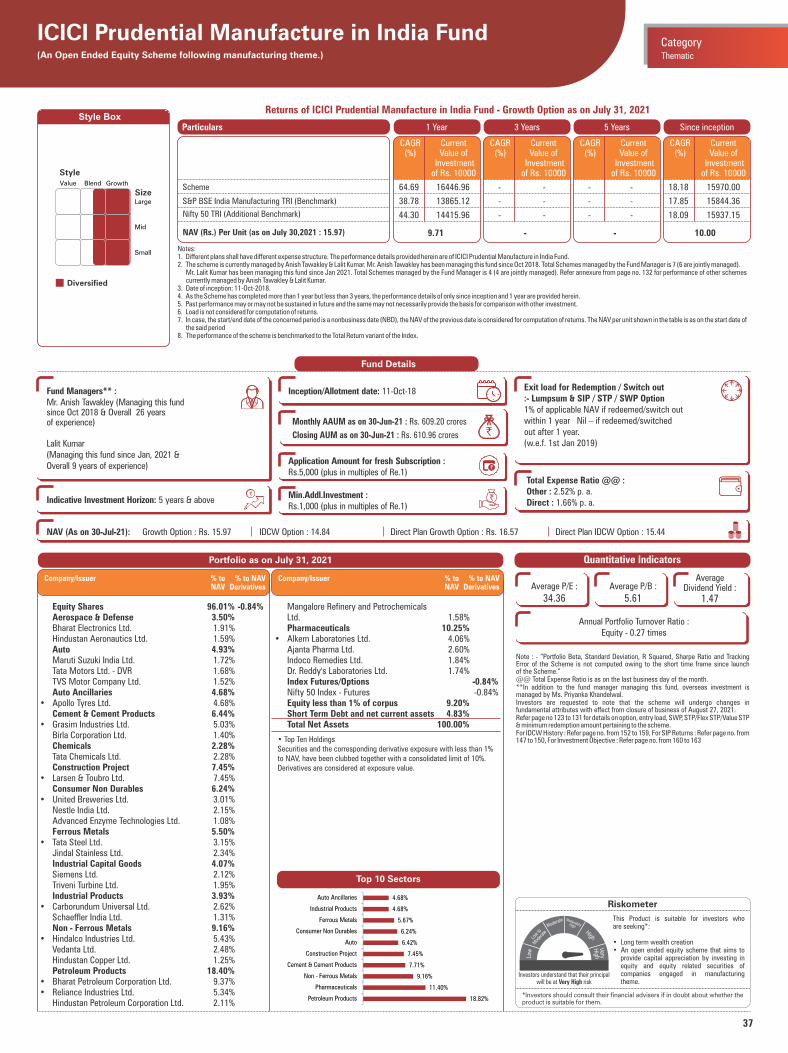
37
Style Box
Notes:1. Different plans shall have different expense structure. The performance details provided herein are of ICICI Prudential Manufacture in India Fund.2. The scheme is currently managed by Anish Tawakley & Lalit Kumar. Mr. Anish Tawakley has been managing this fund since Oct 2018. Total Schemes managed by the Fund Manager is 7 (6 are jointly managed). Mr. Lalit Kumar has been managing this fund since Jan 2021. Total Schemes managed by the Fund Manager is 4 (4 are jointly managed). Refer annexure from page no. 132 for performance of other schemes
currently managed by Anish Tawakley & Lalit Kumar.3. Date of inception: 11-Oct-2018.4. As the Scheme has completed more than 1 year but less than 3 years, the performance details of only since inception and 1 year are provided herein.5. Past performance may or may not be sustained in future and the same may not necessarily provide the basis for comparison with other investment.6. Load is not considered for computation of returns.7. In case, the start/end date of the concerned period is a nonbusiness date (NBD), the NAV of the previous date is considered for computation of returns. The NAV per unit shown in the table is as on the start date of
the said period8. The performance of the scheme is benchmarked to the Total Return variant of the Index.
Returns of ICICI Prudential Manufacture in India Fund - Growth Option as on July 31, 2021
1 Year 3 Years 5 Years Since inceptionParticulars
9.71 -
Scheme
S&P BSE India Manufacturing TRI (Benchmark)
Nifty 50 TRI (Additional Benchmark)
NAV (Rs.) Per Unit (as on July 30,2021 : 15.97)
CAGR (%)
Current Value of
Investment of Rs. 10000
CAGR (%)
Current Value of
Investment of Rs. 10000
CAGR (%)
Current Value of
Investment of Rs. 10000
-
CAGR (%)
Current Value of
Investment of Rs. 10000
10.00
Equity Shares 96.01% -0.84% Aerospace & Defense 3.50% Bharat Electronics Ltd. 1.91% Hindustan Aeronautics Ltd. 1.59% Auto 4.93% Maruti Suzuki India Ltd. 1.72% Tata Motors Ltd. - DVR 1.68% TVS Motor Company Ltd. 1.52% Auto Ancillaries 4.68% • Apollo Tyres Ltd. 4.68% Cement & Cement Products 6.44% • Grasim Industries Ltd. 5.03% Birla Corporation Ltd. 1.40% Chemicals 2.28% Tata Chemicals Ltd. 2.28% Construction Project 7.45% • Larsen & Toubro Ltd. 7.45% Consumer Non Durables 6.24% • United Breweries Ltd. 3.01% Nestle India Ltd. 2.15% Advanced Enzyme Technologies Ltd. 1.08% Ferrous Metals 5.50% • Tata Steel Ltd. 3.15% Jindal Stainless Ltd. 2.34% Industrial Capital Goods 4.07% Siemens Ltd. 2.12% Triveni Turbine Ltd. 1.95% Industrial Products 3.93% • Carborundum Universal Ltd. 2.62% Schaeffler India Ltd. 1.31% Non - Ferrous Metals 9.16% • Hindalco Industries Ltd. 5.43% Vedanta Ltd. 2.48% Hindustan Copper Ltd. 1.25% Petroleum Products 18.40% • Bharat Petroleum Corporation Ltd. 9.37% • Reliance Industries Ltd. 5.34% Hindustan Petroleum Corporation Ltd. 2.11%
Mangalore Refinery and Petrochemicals Ltd. 1.58% Pharmaceuticals 10.25% • Alkem Laboratories Ltd. 4.06% Ajanta Pharma Ltd. 2.60% Indoco Remedies Ltd. 1.84% Dr. Reddy's Laboratories Ltd. 1.74% Index Futures/Options -0.84% Nifty 50 Index - Futures -0.84% Equity less than 1% of corpus 9.20% Short Term Debt and net current assets 4.83% Total Net Assets 100.00%
Top 10 Sectors
• Top Ten HoldingsSecurities and the corresponding derivative exposure with less than 1% to NAV, have been clubbed together with a consolidated limit of 10%.Derivatives are considered at exposure value.
Portfolio as on July 31, 2021
Riskometer
This Product is suitable for investors who are seeking*:
• Long term wealth creation• An open ended equity scheme that aims to
provide capital appreciation by investing in equity and equity related securities of companies engaged in manufacturing theme.
*Investors should consult their financial advisers if in doubt about whether theproduct is suitable for them.
Fund Details
Monthly AAUM as on 30-Jun-21 : Rs. 609.20 crores
Closing AUM as on 30-Jun-21 : Rs. 610.96 crores `
Fund Managers** :Mr. Anish Tawakley (Managing this fund since Oct 2018 & Overall 26 years of experience)
Lalit Kumar(Managing this fund since Jan, 2021 &Overall 9 years of experience)
Indicative Investment Horizon: 5 years & above
Inception/Allotment date: 11-Oct-18 Exit load for Redemption / Switch out:- Lumpsum & SIP / STP / SWP Option1% of applicable NAV if redeemed/switch out within 1 year Nil – if redeemed/switched out after 1 year. (w.e.f. 1st Jan 2019)
Total Expense Ratio @@ :Other : 2.52% p. a.Direct : 1.66% p. a.
64.69 16446.96 - - - - 18.18 15970.00
38.78 13865.12 - - - - 17.85 15844.36
44.30 14415.96 - - - - 18.09 15937.15
ICICI Prudential Manufacture in India Fund(An Open Ended Equity Scheme following manufacturing theme.)
Value Blend Growth
Large
Mid
Small
Diversified
Style
Size
Note : - “Portfolio Beta, Standard Deviation, R Squared, Sharpe Ratio and Tracking Error of the Scheme is not computed owing to the short time frame since launch of the Scheme.”@@ Total Expense Ratio is as on the last business day of the month.**In addition to the fund manager managing this fund, overseas investment is managed by Ms. Priyanka Khandelwal.Investors are requested to note that the scheme will undergo changes in fundamental attributes with effect from closure of business of August 27, 2021.Refer page no 123 to 131 for details on option, entry load, SWP, STP/Flex STP/Value STP & minimum redemption amount pertaining to the scheme.For IDCW History : Refer page no. from 152 to 159, For SIP Returns : Refer page no. from 147 to 150, For Investment Objective : Refer page no. from 160 to 163
Quantitative Indicators
Thematic
Category
Company/Issuer % to % to NAV NAV Derivatives
Company/Issuer % to % to NAV NAV Derivatives
Application Amount for fresh Subscription :Rs.5,000 (plus in multiples of Re.1)
Min.Addl.Investment :Rs.1,000 (plus in multiples of Re.1)
NAV (As on 30-Jul-21): Growth Option : Rs. 15.97 IDCW Option : 14.84 Direct Plan Growth Option : Rs. 16.57 Direct Plan IDCW Option : 15.44 `̀ `̀` `
`
Average P/E :
34.36Average P/B :
5.61
Average Dividend Yield :
1.47
Annual Portfolio Turnover Ratio : Equity - 0.27 times
Investors understand that their principal will be at Very High risk
18.82%
11.40%
9.16%
7.71%
7.45%
6.42%
6.24%
5.67%
4.68%
4.68%
Petroleum Products
Pharmaceuticals
Non - Ferrous Metals
Cement & Cement Products
Construction Project
Auto
Consumer Non Durables
Ferrous Metals
Industrial Products
Auto Ancillaries
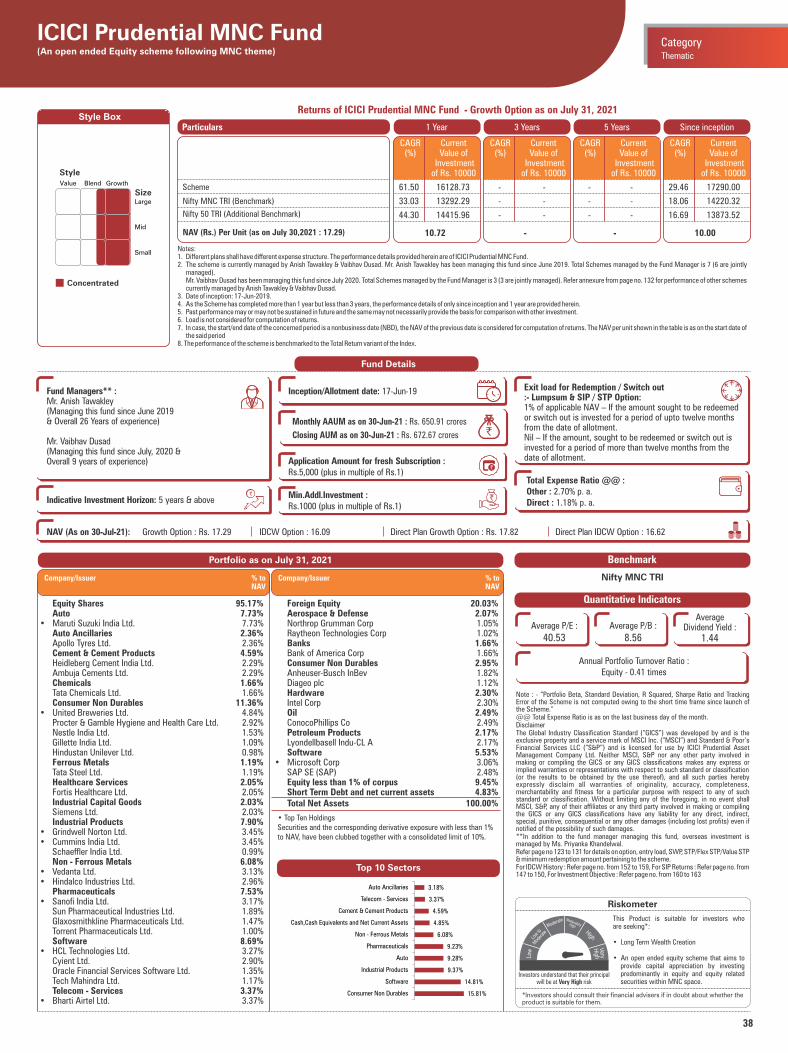
38
Riskometer
This Product is suitable for investors who are seeking*:
• Long Term Wealth Creation
• An open ended equity scheme that aims to provide capital appreciation by investing predominantly in equity and equity related securities within MNC space.
*Investors should consult their financial advisers if in doubt about whether theproduct is suitable for them.
ICICI Prudential MNC Fund (An open ended Equity scheme following MNC theme) Thematic
Category
Style Box
Value Blend Growth
Large
Mid
Small
Concentrated
Style
Size
Note : - “Portfolio Beta, Standard Deviation, R Squared, Sharpe Ratio and Tracking Error of the Scheme is not computed owing to the short time frame since launch of the Scheme.”@@ Total Expense Ratio is as on the last business day of the month.DisclaimerThe Global Industry Classification Standard (“GICS”) was developed by and is the exclusive property and a service mark of MSCI Inc. (“MSCI”) and Standard & Poor’s Financial Services LLC (“S&P”) and is licensed for use by ICICI Prudential Asset Management Company Ltd. Neither MSCI, S&P nor any other party involved in making or compiling the GICS or any GICS classifications makes any express or implied warranties or representations with respect to such standard or classification (or the results to be obtained by the use thereof), and all such parties hereby expressly disclaim all warranties of originality, accuracy, completeness, merchantability and fitness for a particular purpose with respect to any of such standard or classification. Without limiting any of the foregoing, in no event shall MSCI, S&P, any of their affiliates or any third party involved in making or compiling the GICS or any GICS classifications have any liability for any direct, indirect, special, punitive, consequential or any other damages (including lost profits) even if notified of the possibility of such damages.**In addition to the fund manager managing this fund, overseas investment is managed by Ms. Priyanka Khandelwal.Refer page no 123 to 131 for details on option, entry load, SWP, STP/Flex STP/Value STP & minimum redemption amount pertaining to the scheme.For IDCW History : Refer page no. from 152 to 159, For SIP Returns : Refer page no. from 147 to 150, For Investment Objective : Refer page no. from 160 to 163
Quantitative Indicators
Benchmark
Nifty MNC TRI
Average P/E :
40.53Average P/B :
8.56
Average Dividend Yield :
1.44
Annual Portfolio Turnover Ratio : Equity - 0.41 times
Notes:1. Different plans shall have different expense structure. The performance details provided herein are of ICICI Prudential MNC Fund.2. The scheme is currently managed by Anish Tawakley & Vaibhav Dusad. Mr. Anish Tawakley has been managing this fund since June 2019. Total Schemes managed by the Fund Manager is 7 (6 are jointly
managed). Mr. Vaibhav Dusad has been managing this fund since July 2020. Total Schemes managed by the Fund Manager is 3 (3 are jointly managed). Refer annexure from page no. 132 for performance of other schemes
currently managed by Anish Tawakley & Vaibhav Dusad.3. Date of inception: 17-Jun-2019.4. As the Scheme has completed more than 1 year but less than 3 years, the performance details of only since inception and 1 year are provided herein.5. Past performance may or may not be sustained in future and the same may not necessarily provide the basis for comparison with other investment.6. Load is not considered for computation of returns.7. In case, the start/end date of the concerned period is a nonbusiness date (NBD), the NAV of the previous date is considered for computation of returns. The NAV per unit shown in the table is as on the start date of
the said period8. The performance of the scheme is benchmarked to the Total Return variant of the Index.
Returns of ICICI Prudential MNC Fund - Growth Option as on July 31, 2021
1 Year 3 Years 5 Years Since inceptionParticulars
10.72 -
Scheme
Nifty MNC TRI (Benchmark)
Nifty 50 TRI (Additional Benchmark)
NAV (Rs.) Per Unit (as on July 30,2021 : 17.29)
CAGR (%)
Current Value of
Investment of Rs. 10000
CAGR (%)
Current Value of
Investment of Rs. 10000
CAGR (%)
Current Value of
Investment of Rs. 10000
-
CAGR (%)
Current Value of
Investment of Rs. 10000
10.00
61.50 16128.73 - - - - 29.46 17290.00
33.03 13292.29 - - - - 18.06 14220.32
44.30 14415.96 - - - - 16.69 13873.52
Top 10 Sectors
• Top Ten HoldingsSecurities and the corresponding derivative exposure with less than 1% to NAV, have been clubbed together with a consolidated limit of 10%.
Portfolio as on July 31, 2021
Fund Details
Monthly AAUM as on 30-Jun-21 : Rs. 650.91 crores
Closing AUM as on 30-Jun-21 : Rs. 672.67 crores `
Fund Managers** :Mr. Anish Tawakley(Managing this fund since June 2019& Overall 26 Years of experience)
Mr. Vaibhav Dusad(Managing this fund since July, 2020 &Overall 9 years of experience)
Indicative Investment Horizon: 5 years & above
Inception/Allotment date: 17-Jun-19 Exit load for Redemption / Switch out:- Lumpsum & SIP / STP Option:1% of applicable NAV – If the amount sought to be redeemed or switch out is invested for a period of upto twelve months from the date of allotment.Nil – If the amount, sought to be redeemed or switch out is invested for a period of more than twelve months from the date of allotment.
Total Expense Ratio @@ :Other : 2.70% p. a.Direct : 1.18% p. a.
Application Amount for fresh Subscription :Rs.5,000 (plus in multiple of Rs.1)
Min.Addl.Investment :Rs.1000 (plus in multiple of Rs.1)
NAV (As on 30-Jul-21): Growth Option : Rs. 17.29 IDCW Option : 16.09 Direct Plan Growth Option : Rs. 17.82 Direct Plan IDCW Option : 16.62 `̀ `̀` `
`
Equity Shares 95.17% Auto 7.73%• Maruti Suzuki India Ltd. 7.73% Auto Ancillaries 2.36% Apollo Tyres Ltd. 2.36% Cement & Cement Products 4.59% Heidleberg Cement India Ltd. 2.29% Ambuja Cements Ltd. 2.29% Chemicals 1.66% Tata Chemicals Ltd. 1.66% Consumer Non Durables 11.36%• United Breweries Ltd. 4.84% Procter & Gamble Hygiene and Health Care Ltd. 2.92% Nestle India Ltd. 1.53% Gillette India Ltd. 1.09% Hindustan Unilever Ltd. 0.98% Ferrous Metals 1.19% Tata Steel Ltd. 1.19% Healthcare Services 2.05% Fortis Healthcare Ltd. 2.05% Industrial Capital Goods 2.03% Siemens Ltd. 2.03% Industrial Products 7.90%• Grindwell Norton Ltd. 3.45%• Cummins India Ltd. 3.45% Schaeffler India Ltd. 0.99% Non - Ferrous Metals 6.08%• Vedanta Ltd. 3.13%• Hindalco Industries Ltd. 2.96% Pharmaceuticals 7.53%• Sanofi India Ltd. 3.17% Sun Pharmaceutical Industries Ltd. 1.89% Glaxosmithkline Pharmaceuticals Ltd. 1.47% Torrent Pharmaceuticals Ltd. 1.00% Software 8.69%• HCL Technologies Ltd. 3.27% Cyient Ltd. 2.90% Oracle Financial Services Software Ltd. 1.35% Tech Mahindra Ltd. 1.17% Telecom - Services 3.37%• Bharti Airtel Ltd. 3.37%
Foreign Equity 20.03% Aerospace & Defense 2.07% Northrop Grumman Corp 1.05% Raytheon Technologies Corp 1.02% Banks 1.66% Bank of America Corp 1.66% Consumer Non Durables 2.95% Anheuser-Busch InBev 1.82% Diageo plc 1.12% Hardware 2.30% Intel Corp 2.30% Oil 2.49% ConocoPhillips Co 2.49% Petroleum Products 2.17% Lyondellbasell Indu-CL A 2.17% Software 5.53%• Microsoft Corp 3.06% SAP SE (SAP) 2.48% Equity less than 1% of corpus 9.45% Short Term Debt and net current assets 4.83% Total Net Assets 100.00%
Company/Issuer % to NAV
Company/Issuer % to NAV
Investors understand that their principal will be at Very High risk
15.81%
14.81%
9.37%
9.28%
9.23%
6.08%
4.85%
4.59%
3.37%
3.18%
Consumer Non Durables
Software
Industrial Products
Auto
Pharmaceuticals
Non - Ferrous Metals
Cash,Cash Equivalents and Net Current Assets
Cement & Cement Products
Telecom - Services
Auto Ancillaries
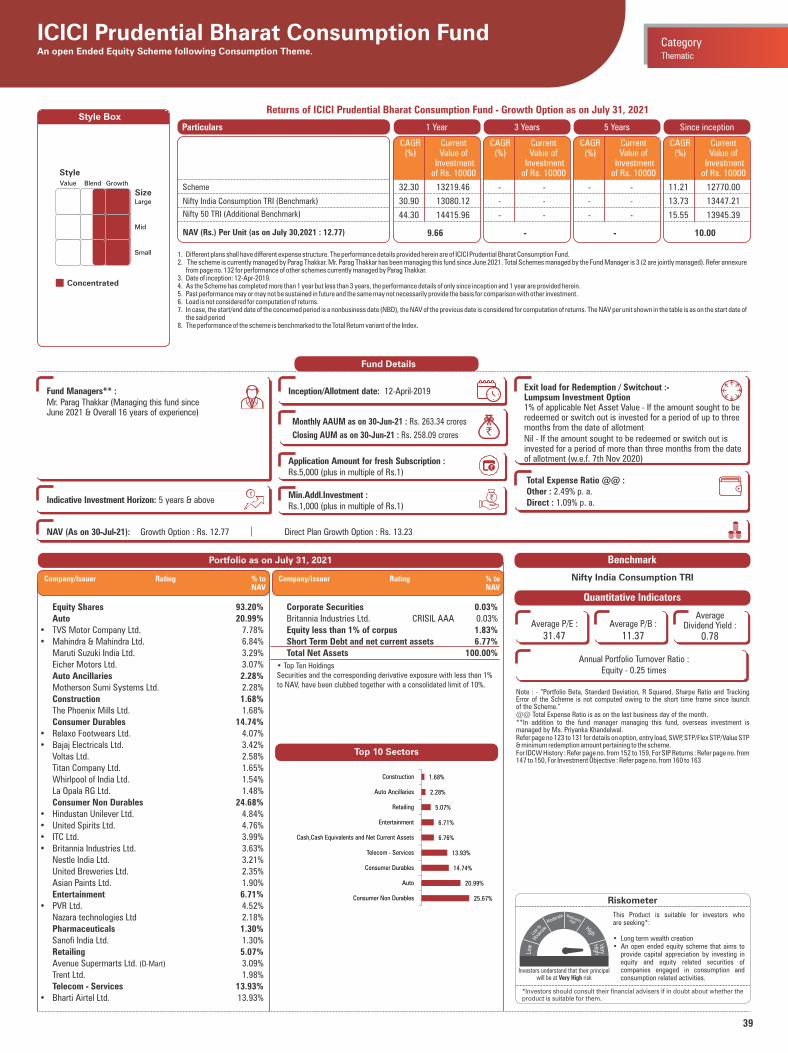
39
Style Box
Portfolio as on July 31, 2021
Riskometer
This Product is suitable for investors who are seeking*:
• Long term wealth creation • An open ended equity scheme that aims to
provide capital appreciation by investing in equity and equity related securities of companies engaged in consumption and consumption related activities.
*Investors should consult their financial advisers if in doubt about whether theproduct is suitable for them.
ICICI Prudential Bharat Consumption FundAn open Ended Equity Scheme following Consumption Theme.
Value Blend Growth
Large
Mid
Small
Concentrated
Style
Size
Thematic
Category
Equity Shares 93.20% Auto 20.99%• TVS Motor Company Ltd. 7.78%• Mahindra & Mahindra Ltd. 6.84% Maruti Suzuki India Ltd. 3.29% Eicher Motors Ltd. 3.07% Auto Ancillaries 2.28% Motherson Sumi Systems Ltd. 2.28% Construction 1.68% The Phoenix Mills Ltd. 1.68% Consumer Durables 14.74%• Relaxo Footwears Ltd. 4.07%• Bajaj Electricals Ltd. 3.42% Voltas Ltd. 2.58% Titan Company Ltd. 1.65% Whirlpool of India Ltd. 1.54% La Opala RG Ltd. 1.48% Consumer Non Durables 24.68%• Hindustan Unilever Ltd. 4.84%• United Spirits Ltd. 4.76%• ITC Ltd. 3.99%• Britannia Industries Ltd. 3.63% Nestle India Ltd. 3.21% United Breweries Ltd. 2.35% Asian Paints Ltd. 1.90% Entertainment 6.71%• PVR Ltd. 4.52% Nazara technologies Ltd 2.18% Pharmaceuticals 1.30% Sanofi India Ltd. 1.30% Retailing 5.07% Avenue Supermarts Ltd. 3.09%(D-Mart)
Trent Ltd. 1.98% Telecom - Services 13.93%• Bharti Airtel Ltd. 13.93%
• Top Ten HoldingsSecurities and the corresponding derivative exposure with less than 1% to NAV, have been clubbed together with a consolidated limit of 10%.
Company/Issuer Rating % to NAV
Top 10 Sectors
Note : - “Portfolio Beta, Standard Deviation, R Squared, Sharpe Ratio and Tracking Error of the Scheme is not computed owing to the short time frame since launch of the Scheme.”@@ Total Expense Ratio is as on the last business day of the month.**In addition to the fund manager managing this fund, overseas investment is managed by Ms. Priyanka Khandelwal.Refer page no 123 to 131 for details on option, entry load, SWP, STP/Flex STP/Value STP & minimum redemption amount pertaining to the scheme.For IDCW History : Refer page no. from 152 to 159, For SIP Returns : Refer page no. from 147 to 150, For Investment Objective : Refer page no. from 160 to 163
Quantitative Indicators
Benchmark
Nifty India Consumption TRI
Average P/E :
31.47Average P/B :
11.37
Average Dividend Yield :
0.78
Annual Portfolio Turnover Ratio : Equity - 0.25 times
1. Different plans shall have different expense structure. The performance details provided herein are of ICICI Prudential Bharat Consumption Fund.2. The scheme is currently managed by Parag Thakkar. Mr. Parag Thakkar has been managing this fund since June 2021. Total Schemes managed by the Fund Manager is 3 (2 are jointly managed). Refer annexure
from page no. 132 for performance of other schemes currently managed by Parag Thakkar.3. Date of inception: 12-Apr-2019.4. As the Scheme has completed more than 1 year but less than 3 years, the performance details of only since inception and 1 year are provided herein.5. Past performance may or may not be sustained in future and the same may not necessarily provide the basis for comparison with other investment.6. Load is not considered for computation of returns.7. In case, the start/end date of the concerned period is a nonbusiness date (NBD), the NAV of the previous date is considered for computation of returns. The NAV per unit shown in the table is as on the start date of
the said period8. The performance of the scheme is benchmarked to the Total Return variant of the Index.
Returns of ICICI Prudential Bharat Consumption Fund - Growth Option as on July 31, 2021
1 Year 3 Years 5 Years Since inceptionParticulars
9.66 -
Scheme
Nifty India Consumption TRI (Benchmark)
Nifty 50 TRI (Additional Benchmark)
NAV (Rs.) Per Unit (as on July 30,2021 : 12.77)
CAGR (%)
Current Value of
Investment of Rs. 10000
CAGR (%)
Current Value of
Investment of Rs. 10000
CAGR (%)
Current Value of
Investment of Rs. 10000
-
CAGR (%)
Current Value of
Investment of Rs. 10000
10.00
32.30 13219.46 - - - - 11.21 12770.00
30.90 13080.12 - - - - 13.73 13447.21
44.30 14415.96 - - - - 15.55 13945.39
Fund Details
Monthly AAUM as on 30-Jun-21 : Rs. 263.34 crores
Closing AUM as on 30-Jun-21 : Rs. 258.09 crores `
Fund Managers** :Mr. Parag Thakkar (Managing this fund since June 2021 & Overall 16 years of experience)
Indicative Investment Horizon: 5 years & above
Inception/Allotment date: 12-April-2019 Exit load for Redemption / Switchout :- Lumpsum Investment Option1% of applicable Net Asset Value - If the amount sought to be redeemed or switch out is invested for a period of up to three months from the date of allotmentNil - If the amount sought to be redeemed or switch out is invested for a period of more than three months from the date of allotment (w.e.f. 7th Nov 2020)
Total Expense Ratio @@ :Other : 2.49% p. a.Direct : 1.09% p. a.
Application Amount for fresh Subscription :Rs.5,000 (plus in multiple of Rs.1)
Min.Addl.Investment :Rs.1,000 (plus in multiple of Rs.1)
NAV (As on 30-Jul-21): Growth Option : Rs. 12.77 Direct Plan Growth Option : Rs. 13.23 `̀ `̀` `
`
Investors understand that their principal will be at Very High risk
Corporate Securities 0.03% Britannia Industries Ltd. CRISIL AAA 0.03% Equity less than 1% of corpus 1.83% Short Term Debt and net current assets 6.77% Total Net Assets 100.00%
Company/Issuer Rating % to NAV
25.67%
20.99%
14.74%
13.93%
6.76%
6.71%
5.07%
2.28%
1.68%
Consumer Non Durables
Auto
Consumer Durables
Telecom - Services
Cash,Cash Equivalents and Net Current Assets
Entertainment
Retailing
Auto Ancillaries
Construction
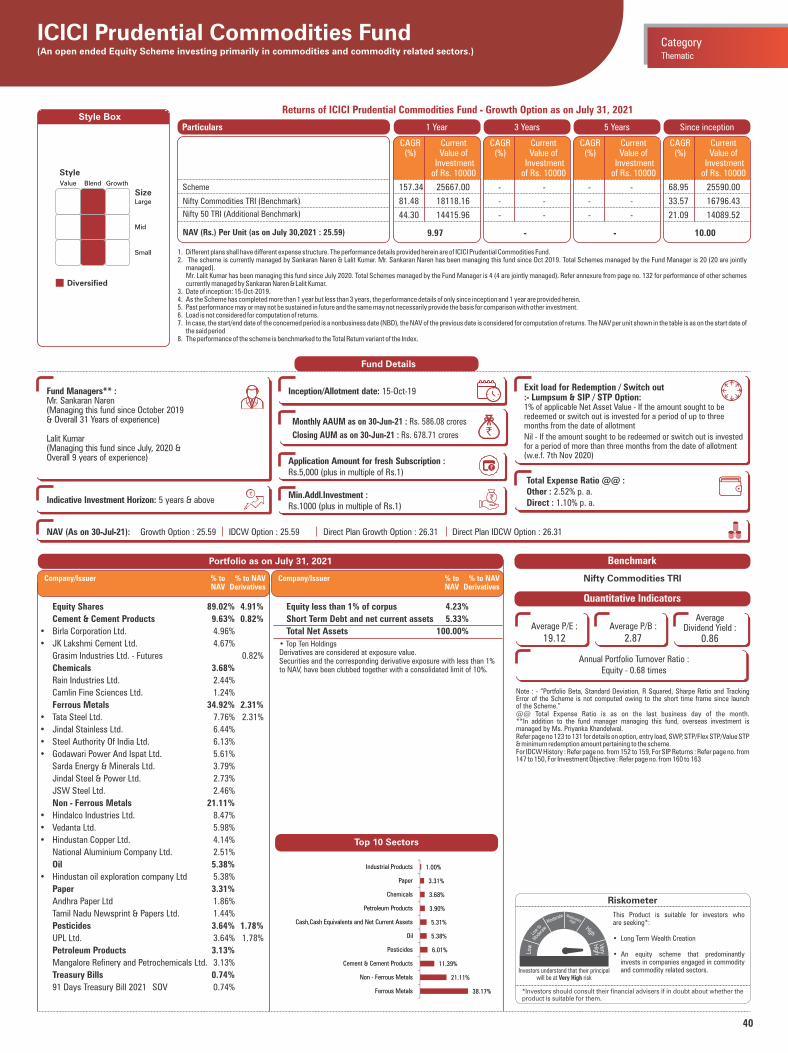
40
Style Box
• Top Ten HoldingsDerivatives are considered at exposure value.Securities and the corresponding derivative exposure with less than 1% to NAV, have been clubbed together with a consolidated limit of 10%.
Portfolio as on July 31, 2021
Riskometer
This Product is suitable for investors who are seeking*:
• Long Term Wealth Creation
• An equity scheme that predominantly invests in companies engaged in commodity and commodity related sectors.
*Investors should consult their financial advisers if in doubt about whether theproduct is suitable for them.
ICICI Prudential Commodities Fund (An open ended Equity Scheme investing primarily in commodities and commodity related sectors.)
Value Blend Growth
Large
Mid
Small
Diversified
Style
Size
Note : - “Portfolio Beta, Standard Deviation, R Squared, Sharpe Ratio and Tracking Error of the Scheme is not computed owing to the short time frame since launch of the Scheme.”@@ Total Expense Ratio is as on the last business day of the month.**In addition to the fund manager managing this fund, overseas investment is managed by Ms. Priyanka Khandelwal.Refer page no 123 to 131 for details on option, entry load, SWP, STP/Flex STP/Value STP & minimum redemption amount pertaining to the scheme.For IDCW History : Refer page no. from 152 to 159, For SIP Returns : Refer page no. from 147 to 150, For Investment Objective : Refer page no. from 160 to 163
Quantitative Indicators
Average P/E :
19.12Average P/B :
2.87
Average Dividend Yield :
0.86
Benchmark
Nifty Commodities TRI
Thematic
Category
Top 10 Sectors
Fund Details
Monthly AAUM as on 30-Jun-21 : Rs. 586.08 crores
Closing AUM as on 30-Jun-21 : Rs. 678.71 crores `
Fund Managers** :Mr. Sankaran Naren(Managing this fund since October 2019& Overall 31 Years of experience)
Lalit Kumar(Managing this fund since July, 2020 &Overall 9 years of experience)
Indicative Investment Horizon: 5 years & above
Inception/Allotment date: 15-Oct-19 Exit load for Redemption / Switch out:- Lumpsum & SIP / STP Option: 1% of applicable Net Asset Value - If the amount sought to be redeemed or switch out is invested for a period of up to three months from the date of allotment
Nil - If the amount sought to be redeemed or switch out is invested for a period of more than three months from the date of allotment (w.e.f. 7th Nov 2020)
Total Expense Ratio @@ :Other : 2.52% p. a.Direct : 1.10% p. a.
Application Amount for fresh Subscription :Rs.5,000 (plus in multiple of Rs.1)
Min.Addl.Investment :Rs.1000 (plus in multiple of Rs.1)
NAV (As on 30-Jul-21): Growth Option : 25.59 IDCW Option : 25.59 Direct Plan Growth Option : 26.31 Direct Plan IDCW Option : 26.31 `̀ `̀` `
`
1. Different plans shall have different expense structure. The performance details provided herein are of ICICI Prudential Commodities Fund.2. The scheme is currently managed by Sankaran Naren & Lalit Kumar. Mr. Sankaran Naren has been managing this fund since Oct 2019. Total Schemes managed by the Fund Manager is 20 (20 are jointly
managed). Mr. Lalit Kumar has been managing this fund since July 2020. Total Schemes managed by the Fund Manager is 4 (4 are jointly managed). Refer annexure from page no. 132 for performance of other schemes
currently managed by Sankaran Naren & Lalit Kumar.3. Date of inception: 15-Oct-2019.4. As the Scheme has completed more than 1 year but less than 3 years, the performance details of only since inception and 1 year are provided herein.5. Past performance may or may not be sustained in future and the same may not necessarily provide the basis for comparison with other investment.6. Load is not considered for computation of returns.7. In case, the start/end date of the concerned period is a nonbusiness date (NBD), the NAV of the previous date is considered for computation of returns. The NAV per unit shown in the table is as on the start date of
the said period8. The performance of the scheme is benchmarked to the Total Return variant of the Index.
Returns of ICICI Prudential Commodities Fund - Growth Option as on July 31, 2021
1 Year 3 Years 5 Years Since inceptionParticulars
9.97 -
Scheme
Nifty Commodities TRI (Benchmark)
Nifty 50 TRI (Additional Benchmark)
NAV (Rs.) Per Unit (as on July 30,2021 : 25.59)
CAGR (%)
Current Value of
Investment of Rs. 10000
CAGR (%)
Current Value of
Investment of Rs. 10000
CAGR (%)
Current Value of
Investment of Rs. 10000
-
CAGR (%)
Current Value of
Investment of Rs. 10000
10.00
157.34 25667.00 - - - - 68.95 25590.00
81.48 18118.16 - - - - 33.57 16796.43
44.30 14415.96 - - - - 21.09 14089.52
Annual Portfolio Turnover Ratio : Equity - 0.68 times
Investors understand that their principal will be at Very High risk
Equity Shares 89.02% 4.91%
Cement & Cement Products 9.63% 0.82%
• Birla Corporation Ltd. 4.96%
• JK Lakshmi Cement Ltd. 4.67%
Grasim Industries Ltd. - Futures 0.82%
Chemicals 3.68%
Rain Industries Ltd. 2.44%
Camlin Fine Sciences Ltd. 1.24%
Ferrous Metals 34.92% 2.31%
• Tata Steel Ltd. 7.76% 2.31%
• Jindal Stainless Ltd. 6.44%
• Steel Authority Of India Ltd. 6.13%
• Godawari Power And Ispat Ltd. 5.61%
Sarda Energy & Minerals Ltd. 3.79%
Jindal Steel & Power Ltd. 2.73%
JSW Steel Ltd. 2.46%
Non - Ferrous Metals 21.11%
• Hindalco Industries Ltd. 8.47%
• Vedanta Ltd. 5.98%
• Hindustan Copper Ltd. 4.14%
National Aluminium Company Ltd. 2.51%
Oil 5.38%
• Hindustan oil exploration company Ltd 5.38%
Paper 3.31%
Andhra Paper Ltd 1.86%
Tamil Nadu Newsprint & Papers Ltd. 1.44%
Pesticides 3.64% 1.78%
UPL Ltd. 3.64% 1.78%
Petroleum Products 3.13%
Mangalore Refinery and Petrochemicals Ltd. 3.13%
Treasury Bills 0.74%
91 Days Treasury Bill 2021 SOV 0.74%
Company/Issuer % to % to NAV NAV Derivatives
Equity less than 1% of corpus 4.23%
Short Term Debt and net current assets 5.33%
Total Net Assets 100.00%
Company/Issuer % to % to NAV NAV Derivatives
38.17%
21.11%
11.39%
6.01%
5.38%
5.31%
3.90%
3.68%
3.31%
1.00%
Ferrous Metals
Non - Ferrous Metals
Cement & Cement Products
Pesticides
Oil
Cash,Cash Equivalents and Net Current Assets
Petroleum Products
Chemicals
Paper
Industrial Products
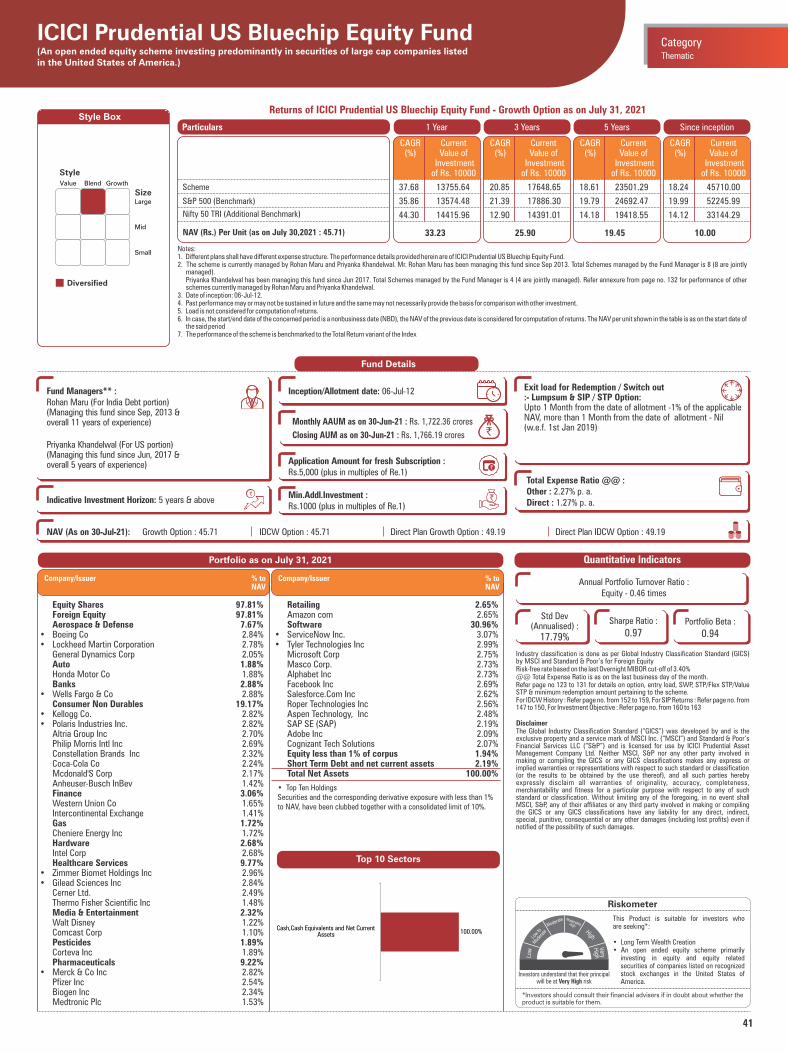
41
Style Box
Notes:1. Different plans shall have different expense structure. The performance details provided herein are of ICICI Prudential US Bluechip Equity Fund.2. The scheme is currently managed by Rohan Maru and Priyanka Khandelwal. Mr. Rohan Maru has been managing this fund since Sep 2013. Total Schemes managed by the Fund Manager is 8 (8 are jointly
managed). Priyanka Khandelwal has been managing this fund since Jun 2017. Total Schemes managed by the Fund Manager is 4 (4 are jointly managed). Refer annexure from page no. 132 for performance of other
schemes currently managed by Rohan Maru and Priyanka Khandelwal.3. Date of inception: 06-Jul-12.4. Past performance may or may not be sustained in future and the same may not necessarily provide the basis for comparison with other investment.5. Load is not considered for computation of returns.6. In case, the start/end date of the concerned period is a nonbusiness date (NBD), the NAV of the previous date is considered for computation of returns. The NAV per unit shown in the table is as on the start date of
the said period7. The performance of the scheme is benchmarked to the Total Return variant of the Index
Returns of ICICI Prudential US Bluechip Equity Fund - Growth Option as on July 31, 2021
1 Year 3 Years 5 Years Since inceptionParticulars
33.23 25.90
Scheme
S&P 500 (Benchmark)
Nifty 50 TRI (Additional Benchmark)
NAV (Rs.) Per Unit (as on July 30,2021 : 45.71)
CAGR (%)
Current Value of
Investment of Rs. 10000
CAGR (%)
Current Value of
Investment of Rs. 10000
CAGR (%)
Current Value of
Investment of Rs. 10000
19.45
CAGR (%)
Current Value of
Investment of Rs. 10000
10.00
Portfolio as on July 31, 2021
Riskometer
This Product is suitable for investors who are seeking*:
• Long Term Wealth Creation• An open ended equity scheme primarily
investing in equity and equity related securities of companies listed on recognized stock exchanges in the United States of America.
*Investors should consult their financial advisers if in doubt about whether theproduct is suitable for them.
Fund Details
Monthly AAUM as on 30-Jun-21 : Rs. 1,722.36 crores
Closing AUM as on 30-Jun-21 : Rs. 1,766.19 crores `
Fund Managers** :Rohan Maru (For India Debt portion)(Managing this fund since Sep, 2013 &overall 11 years of experience)
Priyanka Khandelwal (For US portion)(Managing this fund since Jun, 2017 & overall 5 years of experience)
Indicative Investment Horizon: 5 years & above
Inception/Allotment date: 06-Jul-12
37.68 13755.64 20.85 17648.65 18.61 23501.29 18.24 45710.00
35.86 13574.48 21.39 17886.30 19.79 24692.47 19.99 52245.99
44.30 14415.96 12.90 14391.01 14.18 19418.55 14.12 33144.29
ICICI Prudential US Bluechip Equity Fund(An open ended equity scheme investing predominantly in securities of large cap companies listed in the United States of America.)
Value Blend Growth
Large
Mid
Small
Diversified
Style
Size
Industry classification is done as per Global Industry Classification Standard (GICS) by MSCI and Standard & Poor’s for Foreign EquityRisk-free rate based on the last Overnight MIBOR cut-off of 3.40%@@ Total Expense Ratio is as on the last business day of the month.Refer page no 123 to 131 for details on option, entry load, SWP, STP/Flex STP/Value STP & minimum redemption amount pertaining to the scheme.For IDCW History : Refer page no. from 152 to 159, For SIP Returns : Refer page no. from 147 to 150, For Investment Objective : Refer page no. from 160 to 163
DisclaimerThe Global Industry Classification Standard (“GICS”) was developed by and is the exclusive property and a service mark of MSCI Inc. (“MSCI”) and Standard & Poor’s Financial Services LLC (“S&P”) and is licensed for use by ICICI Prudential Asset Management Company Ltd. Neither MSCI, S&P nor any other party involved in making or compiling the GICS or any GICS classifications makes any express or implied warranties or representations with respect to such standard or classification (or the results to be obtained by the use thereof), and all such parties hereby expressly disclaim all warranties of originality, accuracy, completeness, merchantability and fitness for a particular purpose with respect to any of such standard or classification. Without limiting any of the foregoing, in no event shall MSCI, S&P, any of their affiliates or any third party involved in making or compiling the GICS or any GICS classifications have any liability for any direct, indirect, special, punitive, consequential or any other damages (including lost profits) even if notified of the possibility of such damages.
Quantitative Indicators
Exit load for Redemption / Switch out:- Lumpsum & SIP / STP Option:Upto 1 Month from the date of allotment -1% of the applicable NAV, more than 1 Month from the date of allotment - Nil (w.e.f. 1st Jan 2019)
Total Expense Ratio @@ :Other : 2.27% p. a.Direct : 1.27% p. a.
Thematic
Category
Top 10 Sectors
• Top Ten HoldingsSecurities and the corresponding derivative exposure with less than 1% to NAV, have been clubbed together with a consolidated limit of 10%.
Equity Shares 97.81% Foreign Equity 97.81% Aerospace & Defense 7.67%• Boeing Co 2.84%• Lockheed Martin Corporation 2.78% General Dynamics Corp 2.05% Auto 1.88% Honda Motor Co 1.88% Banks 2.88%• Wells Fargo & Co 2.88% Consumer Non Durables 19.17%• Kellogg Co. 2.82%• Polaris Industries Inc. 2.82% Altria Group Inc 2.70% Philip Morris Intl Inc 2.69% Constellation Brands Inc 2.32% Coca-Cola Co 2.24% Mcdonald'S Corp 2.17% Anheuser-Busch InBev 1.42% Finance 3.06% Western Union Co 1.65% Intercontinental Exchange 1.41% Gas 1.72% Cheniere Energy Inc 1.72% Hardware 2.68% Intel Corp 2.68% Healthcare Services 9.77%• Zimmer Biomet Holdings Inc 2.96%• Gilead Sciences Inc 2.84% Cerner Ltd. 2.49% Thermo Fisher Scientific Inc 1.48% Media & Entertainment 2.32% Walt Disney 1.22% Comcast Corp 1.10% Pesticides 1.89% Corteva Inc 1.89% Pharmaceuticals 9.22%• Merck & Co Inc 2.82% Pfizer Inc 2.54% Biogen Inc 2.34% Medtronic Plc 1.53%
Retailing 2.65% Amazon com 2.65% Software 30.96%• ServiceNow Inc. 3.07%• Tyler Technologies Inc 2.99% Microsoft Corp 2.75% Masco Corp. 2.73% Alphabet Inc 2.73% Facebook Inc 2.69% Salesforce.Com Inc 2.62% Roper Technologies Inc 2.56% Aspen Technology, Inc 2.48% SAP SE (SAP) 2.19% Adobe Inc 2.09% Cognizant Tech Solutions 2.07% Equity less than 1% of corpus 1.94% Short Term Debt and net current assets 2.19% Total Net Assets 100.00%
Company/Issuer % to NAV
Company/Issuer % to NAV
Application Amount for fresh Subscription :Rs.5,000 (plus in multiples of Re.1)
Min.Addl.Investment :Rs.1000 (plus in multiples of Re.1)
NAV (As on 30-Jul-21): Growth Option : 45.71 IDCW Option : 45.71 Direct Plan Growth Option : 49.19 Direct Plan IDCW Option : 49.19 `̀ `̀` `
`
Annual Portfolio Turnover Ratio : Equity - 0.46 times
Std Dev (Annualised) :
17.79%
Sharpe Ratio :
0.97Portfolio Beta :
0.94
Investors understand that their principal will be at Very High risk
100.00%Cash,Cash Equivalents and Net Current
Assets
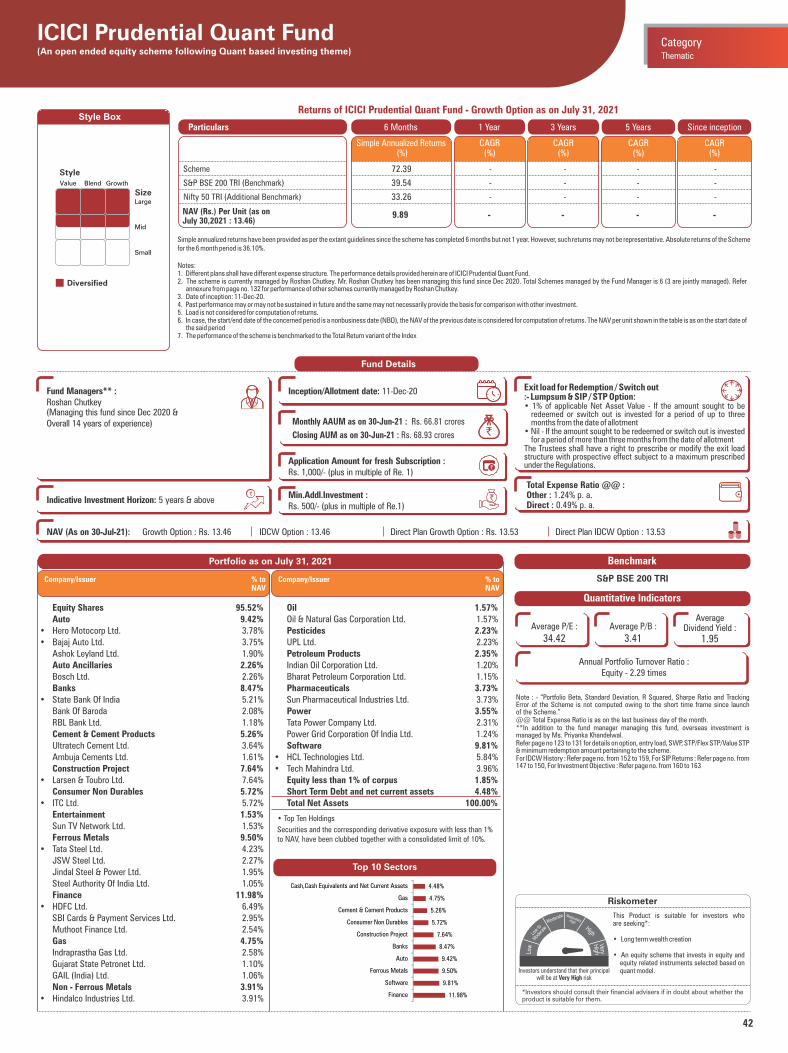
42
• Top Ten Holdings
Securities and the corresponding derivative exposure with less than 1% to NAV, have been clubbed together with a consolidated limit of 10%.
Portfolio as on July 31, 2021
Riskometer
This Product is suitable for investors who are seeking*:
• Long term wealth creation
• An equity scheme that invests in equity and equity related instruments selected based on quant model.
*Investors should consult their financial advisers if in doubt about whether theproduct is suitable for them.
ICICI Prudential Quant Fund(An open ended equity scheme following Quant based investing theme) Thematic
Category
Note : - “Portfolio Beta, Standard Deviation, R Squared, Sharpe Ratio and Tracking Error of the Scheme is not computed owing to the short time frame since launch of the Scheme.”@@ Total Expense Ratio is as on the last business day of the month.**In addition to the fund manager managing this fund, overseas investment is managed by Ms. Priyanka Khandelwal.Refer page no 123 to 131 for details on option, entry load, SWP, STP/Flex STP/Value STP & minimum redemption amount pertaining to the scheme.For IDCW History : Refer page no. from 152 to 159, For SIP Returns : Refer page no. from 147 to 150, For Investment Objective : Refer page no. from 160 to 163
Quantitative Indicators
Benchmark
S&P BSE 200 TRI
Average P/E :
34.42Average P/B :
3.41
Average Dividend Yield :
1.95
Annual Portfolio Turnover Ratio : Equity - 2.29 times
Top 10 Sectors
Style Box
Value Blend Growth
Large
Mid
Small
Diversified
Style
Size
Investors understand that their principal will be at Very High risk
Equity Shares 95.52% Auto 9.42%• Hero Motocorp Ltd. 3.78%• Bajaj Auto Ltd. 3.75% Ashok Leyland Ltd. 1.90% Auto Ancillaries 2.26% Bosch Ltd. 2.26% Banks 8.47%• State Bank Of India 5.21% Bank Of Baroda 2.08% RBL Bank Ltd. 1.18% Cement & Cement Products 5.26% Ultratech Cement Ltd. 3.64% Ambuja Cements Ltd. 1.61% Construction Project 7.64%• Larsen & Toubro Ltd. 7.64% Consumer Non Durables 5.72%• ITC Ltd. 5.72% Entertainment 1.53% Sun TV Network Ltd. 1.53% Ferrous Metals 9.50%• Tata Steel Ltd. 4.23% JSW Steel Ltd. 2.27% Jindal Steel & Power Ltd. 1.95% Steel Authority Of India Ltd. 1.05% Finance 11.98%• HDFC Ltd. 6.49% SBI Cards & Payment Services Ltd. 2.95% Muthoot Finance Ltd. 2.54% Gas 4.75% Indraprastha Gas Ltd. 2.58% Gujarat State Petronet Ltd. 1.10% GAIL (India) Ltd. 1.06% Non - Ferrous Metals 3.91%• Hindalco Industries Ltd. 3.91%
Company/Issuer % to NAV
Company/Issuer % to NAV
Oil 1.57% Oil & Natural Gas Corporation Ltd. 1.57% Pesticides 2.23% UPL Ltd. 2.23% Petroleum Products 2.35% Indian Oil Corporation Ltd. 1.20% Bharat Petroleum Corporation Ltd. 1.15% Pharmaceuticals 3.73% Sun Pharmaceutical Industries Ltd. 3.73% Power 3.55% Tata Power Company Ltd. 2.31% Power Grid Corporation Of India Ltd. 1.24% Software 9.81%• HCL Technologies Ltd. 5.84%• Tech Mahindra Ltd. 3.96% Equity less than 1% of corpus 1.85% Short Term Debt and net current assets 4.48% Total Net Assets 100.00%
Fund Details
Monthly AAUM as on 30-Jun-21 : Rs. 66.81 crores
Closing AUM as on 30-Jun-21 : Rs. 68.93 crores `
Fund Managers** :Roshan Chutkey (Managing this fund since Dec 2020 &Overall 14 years of experience)
Indicative Investment Horizon: 5 years & above
Inception/Allotment date: 11-Dec-20 Exit load for Redemption / Switch out:- Lumpsum & SIP / STP Option:• 1% of applicable Net Asset Value - If the amount sought to be
redeemed or switch out is invested for a period of up to three months from the date of allotment
• Nil - If the amount sought to be redeemed or switch out is invested for a period of more than three months from the date of allotment
The Trustees shall have a right to prescribe or modify the exit load structure with prospective effect subject to a maximum prescribed under the Regulations.
Total Expense Ratio @@ :Other : 1.24% p. a.Direct : 0.49% p. a.
Application Amount for fresh Subscription :Rs. 1,000/- (plus in multiple of Re. 1)
Min.Addl.Investment :Rs. 500/- (plus in multiple of Re.1)
NAV (As on 30-Jul-21): Growth Option : Rs. 13.46 IDCW Option : 13.46 Direct Plan Growth Option : Rs. 13.53 Direct Plan IDCW Option : 13.53 `̀ `̀` `
`
Notes:1. Different plans shall have different expense structure. The performance details provided herein are of ICICI Prudential Quant Fund.2. The scheme is currently managed by Roshan Chutkey. Mr. Roshan Chutkey has been managing this fund since Dec 2020. Total Schemes managed by the Fund Manager is 6 (3 are jointly managed). Refer
annexure from page no. 132 for performance of other schemes currently managed by Roshan Chutkey. 3. Date of inception: 11-Dec-20.4. Past performance may or may not be sustained in future and the same may not necessarily provide the basis for comparison with other investment.5. Load is not considered for computation of returns.6. In case, the start/end date of the concerned period is a nonbusiness date (NBD), the NAV of the previous date is considered for computation of returns. The NAV per unit shown in the table is as on the start date of
the said period7. The performance of the scheme is benchmarked to the Total Return variant of the Index
Simple annualized returns have been provided as per the extant guidelines since the scheme has completed 6 months but not 1 year. However, such returns may not be representative. Absolute returns of the Scheme for the 6 month period is 36.10%.
Returns of ICICI Prudential Quant Fund - Growth Option as on July 31, 2021
Particulars
- - - -
Scheme
S&P BSE 200 TRI (Benchmark)
Nifty 50 TRI (Additional Benchmark)
NAV (Rs.) Per Unit (as on July 30,2021 : 13.46)
6 Months
Simple Annualized Returns (%)
72.39 - - - -
39.54 - - - -
33.26 - - - -
9.89
1 Year 3 Years 5 Years Since inception
CAGR (%)
CAGR (%)
CAGR (%)
CAGR (%)
11.98%
9.81%
9.50%
9.42%
8.47%
7.64%
5.72%
5.26%
4.75%
4.48%
Finance
Software
Ferrous Metals
Auto
Banks
Construction Project
Consumer Non Durables
Cement & Cement Products
Gas
Cash,Cash Equivalents and Net Current Assets
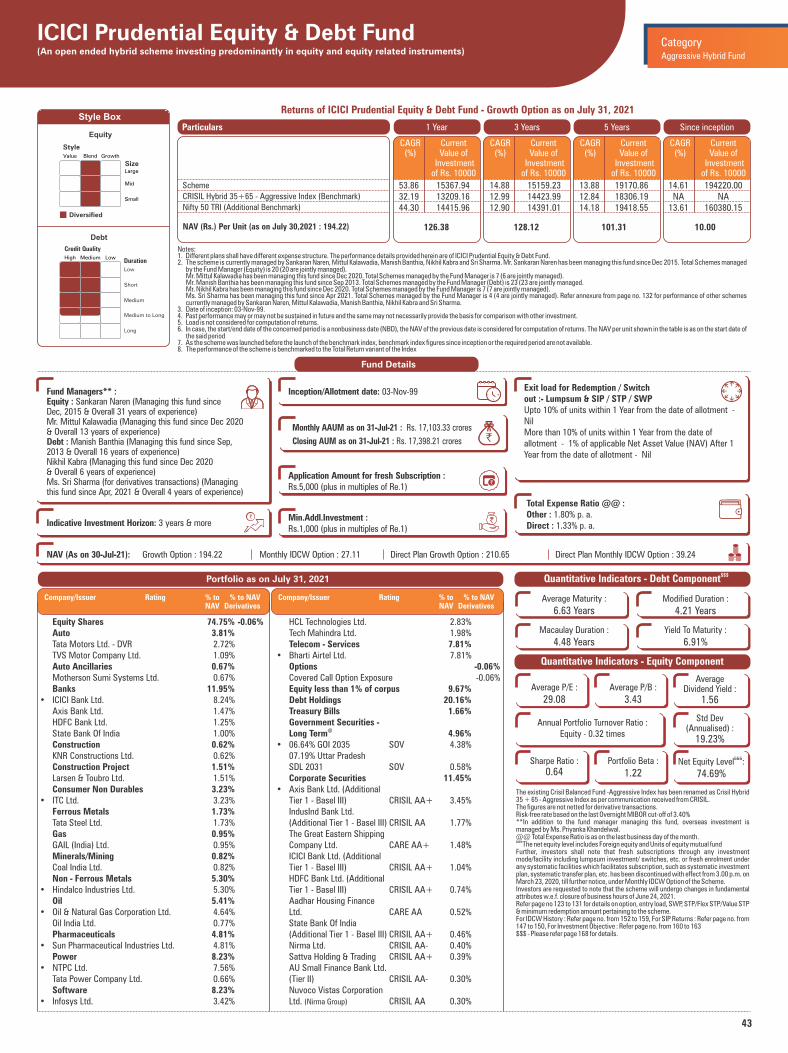
43
Value Blend Growth
Large
Mid
Small
Diversified
Equity
Style
Size
Medium to Long
High Medium Low
Low
Short
Medium
Duration
Long
Debt
Credit Quality
Style BoxReturns of ICICI Prudential Equity & Debt Fund - Growth Option as on July 31, 2021
Notes:1. Different plans shall have different expense structure. The performance details provided herein are of ICICI Prudential Equity & Debt Fund.2. The scheme is currently managed by Sankaran Naren, Mittul Kalawadia, Manish Banthia, Nikhil Kabra and Sri Sharma. Mr. Sankaran Naren has been managing this fund since Dec 2015. Total Schemes managed
by the Fund Manager (Equity) is 20 (20 are jointly managed). Mr. Mittul Kalawadia has been managing this fund since Dec 2020. Total Schemes managed by the Fund Manager is 7 (6 are jointly managed). Mr. Manish Banthia has been managing this fund since Sep 2013. Total Schemes managed by the Fund Manager (Debt) is 23 (23 are jointly managed. Mr. Nikhil Kabra has been managing this fund since Dec 2020. Total Schemes managed by the Fund Manager is 7 (7 are jointly managed). Ms. Sri Sharma has been managing this fund since Apr 2021. Total Schemes managed by the Fund Manager is 4 (4 are jointly managed). Refer annexure from page no. 132 for performance of other schemes
currently managed by Sankaran Naren, Mittul Kalawadia, Manish Banthia, Nikhil Kabra and Sri Sharma.3. Date of inception: 03-Nov-99.4. Past performance may or may not be sustained in future and the same may not necessarily provide the basis for comparison with other investment.5. Load is not considered for computation of returns.6. In case, the start/end date of the concerned period is a nonbusiness date (NBD), the NAV of the previous date is considered for computation of returns. The NAV per unit shown in the table is as on the start date of
the said period7. As the scheme was launched before the launch of the benchmark index, benchmark index figures since inception or the required period are not available. 8. The performance of the scheme is benchmarked to the Total Return variant of the Index
1 Year 3 Years 5 Years Since inceptionParticulars
126.38 128.12
Scheme
CRISIL Hybrid 35+65 - Aggressive Index (Benchmark)
Nifty 50 TRI (Additional Benchmark)
NAV (Rs.) Per Unit (as on July 30,2021 : 194.22)
CAGR (%)
Current Value of
Investment of Rs. 10000
CAGR (%)
Current Value of
Investment of Rs. 10000
CAGR (%)
Current Value of
Investment of Rs. 10000
101.31
CAGR (%)
Current Value of
Investment of Rs. 10000
10.00
Portfolio as on July 31, 2021
Fund Details
Monthly AAUM as on 31-Jul-21 : Rs. 17,103.33 crores
Closing AUM as on 31-Jul-21 : Rs. 17,398.21 crores `
Fund Managers** :Equity : Sankaran Naren (Managing this fund since Dec, 2015 & Overall 31 years of experience)Mr. Mittul Kalawadia (Managing this fund since Dec 2020 & Overall 13 years of experience)Debt : Manish Banthia (Managing this fund since Sep, 2013 & Overall 16 years of experience)Nikhil Kabra (Managing this fund since Dec 2020& Overall 6 years of experience)Ms. Sri Sharma (for derivatives transactions) (Managing this fund since Apr, 2021 & Overall 4 years of experience)
Indicative Investment Horizon: 3 years & more
Inception/Allotment date: 03-Nov-99 Exit load for Redemption / Switchout :- Lumpsum & SIP / STP / SWPUpto 10% of units within 1 Year from the date of allotment - Nil More than 10% of units within 1 Year from the date of allotment - 1% of applicable Net Asset Value (NAV) After 1 Year from the date of allotment - Nil
Total Expense Ratio @@ :Other : 1.80% p. a.Direct : 1.33% p. a.
53.86 15367.94 14.88 15159.23 13.88 19170.86 14.61 194220.0032.19 13209.16 12.99 14423.99 12.84 18306.19 NA NA44.30 14415.96 12.90 14391.01 14.18 19418.55 13.61 160380.15
$$$Quantitative Indicators - Debt Component
Average Maturity :
6.63 YearsModified Duration :
4.21 Years
Macaulay Duration :
4.48 YearsYield To Maturity :
6.91%
Quantitative Indicators - Equity Component
The existing Crisil Balanced Fund -Aggressive Index has been renamed as Crisil Hybrid 35 + 65 - Aggressive Index as per communication received from CRISIL.The figures are not netted for derivative transactions.Risk-free rate based on the last Overnight MIBOR cut-off of 3.40%**In addition to the fund manager managing this fund, overseas investment is managed by Ms. Priyanka Khandelwal.@@ Total Expense Ratio is as on the last business day of the month.&&&
The net equity level includes Foreign equity and Units of equity mutual fundFurther, investors shall note that fresh subscriptions through any investment mode/facility including lumpsum investment/ switches, etc. or fresh enrolment under any systematic facilities which facilitates subscription, such as systematic investment plan, systematic transfer plan, etc. has been discontinued with effect from 3.00 p.m. on March 23, 2020, till further notice, under Monthly IDCW Option of the Scheme. Investors are requested to note that the scheme will undergo changes in fundamental attributes w.e.f. closure of business hours of June 24, 2021.Refer page no 123 to 131 for details on option, entry load, SWP, STP/Flex STP/Value STP & minimum redemption amount pertaining to the scheme.For IDCW History : Refer page no. from 152 to 159, For SIP Returns : Refer page no. from 147 to 150, For Investment Objective : Refer page no. from 160 to 163$$$ - Please refer page 168 for details.
Aggressive Hybrid Fund
CategoryICICI Prudential Equity & Debt Fund(An open ended hybrid scheme investing predominantly in equity and equity related instruments)
NAV (As on 30-Jul-21): Growth Option : 194.22 Monthly IDCW Option : 27.11 Direct Plan Growth Option : 210.65 Direct Plan Monthly IDCW Option : 39.24 `̀ `̀` `
`
Application Amount for fresh Subscription :Rs.5,000 (plus in multiples of Re.1)
Min.Addl.Investment :Rs.1,000 (plus in multiples of Re.1)
Average P/E :
29.08Average P/B :
3.43
Average Dividend Yield :
1.56
Sharpe Ratio : 0.64
Portfolio Beta :
1.22
&&&Net Equity Level :
74.69%
Annual Portfolio Turnover Ratio : Equity - 0.32 times
Std Dev (Annualised) :
19.23%
Equity Shares 74.75% -0.06% Auto 3.81% Tata Motors Ltd. - DVR 2.72% TVS Motor Company Ltd. 1.09% Auto Ancillaries 0.67% Motherson Sumi Systems Ltd. 0.67% Banks 11.95% • ICICI Bank Ltd. 8.24% Axis Bank Ltd. 1.47% HDFC Bank Ltd. 1.25% State Bank Of India 1.00% Construction 0.62% KNR Constructions Ltd. 0.62% Construction Project 1.51% Larsen & Toubro Ltd. 1.51% Consumer Non Durables 3.23% • ITC Ltd. 3.23% Ferrous Metals 1.73% Tata Steel Ltd. 1.73% Gas 0.95% GAIL (India) Ltd. 0.95% Minerals/Mining 0.82% Coal India Ltd. 0.82% Non - Ferrous Metals 5.30% • Hindalco Industries Ltd. 5.30% Oil 5.41% • Oil & Natural Gas Corporation Ltd. 4.64% Oil India Ltd. 0.77% Pharmaceuticals 4.81% • Sun Pharmaceutical Industries Ltd. 4.81% Power 8.23% • NTPC Ltd. 7.56% Tata Power Company Ltd. 0.66% Software 8.23% • Infosys Ltd. 3.42%
HCL Technologies Ltd. 2.83% Tech Mahindra Ltd. 1.98% Telecom - Services 7.81% • Bharti Airtel Ltd. 7.81% Options -0.06% Covered Call Option Exposure -0.06% Equity less than 1% of corpus 9.67% Debt Holdings 20.16% Treasury Bills 1.66% Government Securities - Long Term 4.96% @
• 06.64% GOI 2035 SOV 4.38% 07.19% Uttar Pradesh SDL 2031 SOV 0.58% Corporate Securities 11.45% • Axis Bank Ltd. (Additional Tier 1 - Basel III) CRISIL AA+ 3.45% IndusInd Bank Ltd. (Additional Tier 1 - Basel III) CRISIL AA 1.77% The Great Eastern Shipping Company Ltd. CARE AA+ 1.48% ICICI Bank Ltd. (Additional Tier 1 - Basel III) CRISIL AA+ 1.04% HDFC Bank Ltd. (Additional Tier 1 - Basel III) CRISIL AA+ 0.74% Aadhar Housing Finance Ltd. CARE AA 0.52% State Bank Of India (Additional Tier 1 - Basel III) CRISIL AA+ 0.46% Nirma Ltd. CRISIL AA- 0.40% Sattva Holding & Trading CRISIL AA+ 0.39% AU Small Finance Bank Ltd. (Tier II) CRISIL AA- 0.30% Nuvoco Vistas Corporation Ltd. CRISIL AA 0.30% (Nirma Group)
Company/Issuer Rating % to % to NAV NAV Derivatives
Company/Issuer Rating % to % to NAV NAV Derivatives
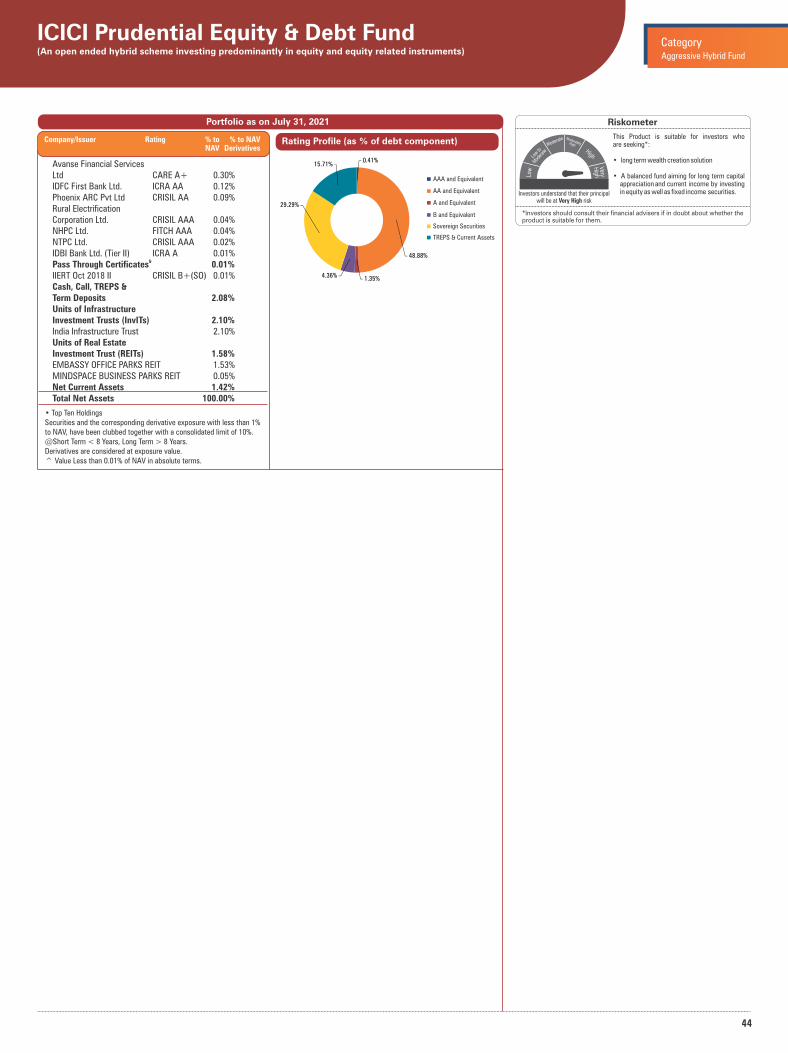
44
• Top Ten HoldingsSecurities and the corresponding derivative exposure with less than 1% to NAV, have been clubbed together with a consolidated limit of 10%.@Short Term < 8 Years, Long Term > 8 Years.Derivatives are considered at exposure value.^ Value Less than 0.01% of NAV in absolute terms.
Portfolio as on July 31, 2021
Rating Profile (as % of debt component)
ICICI Prudential Equity & Debt Fund(An open ended hybrid scheme investing predominantly in equity and equity related instruments) Aggressive Hybrid Fund
Category
AAA and Equivalent
AA and Equivalent
A and Equivalent
TREPS & Current Assets
Sovereign Securities
B and Equivalent
Riskometer
This Product is suitable for investors who are seeking*:
• long term wealth creation solution
• A balanced fund aiming for long term capital appreciation and current income by investing in equity as well as fixed income securities.
*Investors should consult their financial advisers if in doubt about whether theproduct is suitable for them.
Investors understand that their principal will be at Very High risk
Avanse Financial Services Ltd CARE A+ 0.30% IDFC First Bank Ltd. ICRA AA 0.12% Phoenix ARC Pvt Ltd CRISIL AA 0.09% Rural Electrification Corporation Ltd. CRISIL AAA 0.04% NHPC Ltd. FITCH AAA 0.04% NTPC Ltd. CRISIL AAA 0.02% IDBI Bank Ltd. (Tier II) ICRA A 0.01% Pass Through Certificates 0.01% &
IIERT Oct 2018 II CRISIL B+(SO) 0.01% Cash, Call, TREPS & Term Deposits 2.08% Units of Infrastructure Investment Trusts (InvITs) 2.10% India Infrastructure Trust 2.10% Units of Real Estate Investment Trust (REITs) 1.58% EMBASSY OFFICE PARKS REIT 1.53% MINDSPACE BUSINESS PARKS REIT 0.05% Net Current Assets 1.42% Total Net Assets 100.00%
Company/Issuer Rating % to % to NAV NAV Derivatives
0.41%
48.88%
1.35%4.36%
29.29%
15.71%

45
Value Blend Growth
Large
Mid
Small
Diversified
Equity
Style
Size
Medium to Long
High Medium Low
Low
Short
Medium
Duration
Long
Debt
Credit Quality
Style Box
Notes:1. Different plans shall have different expense structure. The performance details provided herein are of ICICI Prudential Equity - Arbitrage Fund.2. The scheme is currently managed by Kayzad Eghlim, Rohan Maru and Nikhil Kabra. Mr. Kayzad Eghlim has been managing this fund since Feb 2011. Total Schemes managed by the Fund Manager(Equity) is 22
(22 are jointly managed). Mr. Rohan Maru has been managing this fund since Dec 2020. Total Schemes managed by the Fund Manager is 8 (8 are jointly managed). Mr. Nikhil Kabra has been managing this fund since Dec 2020. Total Schemes managed by the Fund Manager is 7 (7 are jointly managed). Refer annexure from page no. 132 for performance of other schemes
currently managed by Kayzad Eghlim, Rohan Maru and Nikhil Kabra.3. Date of inception: 30-Dec-06.4. Past performance may or may not be sustained in future and the same may not necessarily provide the basis for comparison with other investment.5. Load is not considered for computation of returns.6. In case, the start/end date of the concerned period is a nonbusiness date (NBD), the NAV of the previous date is considered for computation of returns. The NAV per unit shown in the table is as on the start date of
the said period7. As the scheme was launched before the launch of the benchmark index, benchmark index figures since inception or the required period are not available. 8. The performance of the scheme is benchmarked to the Total Return variant of the Index
Returns of ICICI Prudential Equity - Arbitrage Fund - Growth Option as on July 31, 2021
Equity Shares 66.15% -66.30% Auto 1.56% -1.57% Hero Motocorp Ltd. 0.42% -0.42% Escorts Ltd. 0.40% -0.40% Mahindra & Mahindra Ltd. 0.38% -0.38% Maruti Suzuki India Ltd. 0.36% -0.36% Auto Ancillaries 0.37% -0.37% Amara Raja Batteries Ltd. 0.37% -0.37% Banks 7.79% -7.80%• State Bank Of India 2.38% -2.38% ICICI Bank Ltd. 2.01% -2.01% Axis Bank Ltd. 1.13% -1.14% IndusInd Bank Ltd. 0.64% -0.64% Kotak Mahindra Bank Ltd. 0.59% -0.60% HDFC Bank Ltd. 0.58% -0.58% Bank Of Baroda 0.47% -0.47% Cement & Cement Products 1.61% -1.61% Grasim Industries Ltd. 1.04% -1.04% Ultratech Cement Ltd. 0.57% -0.57% Chemicals 0.36% -0.36% Tata Chemicals Ltd. 0.36% -0.36% Construction 0.63% -0.63% DLF Ltd. 0.63% -0.63% Construction Project 1.60% -1.61% Larsen & Toubro Ltd. 1.60% -1.61% Consumer Durables 0.36% -0.36% Havells India Ltd. 0.36% -0.36% Consumer Non Durables 3.22% -3.23% ITC Ltd. 1.17% -1.18% Asian Paints Ltd. 0.86% -0.87% Hindustan Unilever Ltd. 0.79% -0.80% United Spirits Ltd. 0.39% -0.39% Entertainment 0.53% -0.52% Zee Entertainment Enterprises Ltd. 0.53% -0.52% Ferrous Metals 7.15% -7.18%• Tata Steel Ltd. 3.79% -3.80% JSW Steel Ltd. 1.70% -1.70% Steel Authority Of India Ltd. 0.86% -0.87%
Jindal Steel & Power Ltd. 0.80% -0.80% Finance 3.96% -3.97% HDFC Ltd. 2.29% -2.30% Bajaj Finance Ltd. 0.58% -0.58% Piramal Enterprises Ltd. 0.57% -0.57% Indiabulls Housing Finance Ltd. 0.52% -0.52% Insurance 1.42% -1.43% HDFC Life Insurance Company Ltd. 0.92% -0.93% SBI Life Insurance Company Ltd. 0.50% -0.50% Minerals/Mining 2.08% -2.09% Adani Enterprises Ltd. 1.35% -1.35% NMDC Ltd. 0.73% -0.73% Non - Ferrous Metals 2.29% -2.29% Vedanta Ltd. 1.70% -1.70% Hindalco Industries Ltd. 0.59% -0.59% Pesticides 0.70% -0.70% UPL Ltd. 0.70% -0.70% Petroleum Products 4.11% -4.12%• Reliance Industries Ltd. 2.84% -2.85% Bharat Petroleum Corporation Ltd. 0.90% -0.91% Indian Oil Corporation Ltd. 0.36% -0.36% Pharmaceuticals 5.59% -5.60%• Sun Pharmaceutical Industries Ltd. 2.32% -2.32% Cipla Ltd. 0.62% -0.62% Cadila Healthcare Ltd. 0.59% -0.60% Dr. Reddy's Laboratories Ltd. 0.57% -0.58% Divi's Laboratories Ltd. 0.57% -0.57% Lupin Ltd. 0.46% -0.46% Aurobindo Pharma Ltd. 0.45% -0.46% Power 0.74% -0.75% Tata Power Company Ltd. 0.74% -0.75% Software 4.96% -4.98% Tata Consultancy Services Ltd. 1.48% -1.48% Infosys Ltd. 1.28% -1.28% Tech Mahindra Ltd. 1.26% -1.26% HCL Technologies Ltd. 0.95% -0.95% Telecom - Services 2.85% -2.85%• Bharti Airtel Ltd. 2.85% -2.85%
Company/Issuer Rating % to % to NAV NAV Derivatives
Portfolio as on July 31, 2021
Fund Details
Monthly AAUM as on 31-Jul-21 : Rs. 13,301.31 crores
Closing AUM as on 31-Jul-21 : Rs. 15,119.07 crores `
Fund Managers** :Equity : Kayzad Eghlim (Managing this fund since Feb 2011 & Overall 29 years of experience)
Debt : Mr. Rohan Maru (Managing this fund since Dec, 2020 & Overall 11 Years of experience)Mr. Nikhil Kabra (Managing this fund since Dec 2020& Overall 6 years of experience)
Indicative Investment Horizon: 3 months and above
Inception/Allotment date: 30-Dec-06 Exit load for Redemption / Switchout :- Lumpsum & SIP / STP / SWP OptionWithin 1 Month from allotment - 0.25%of applicable NAV, more than 1 Month- Nil
Total Expense Ratio @@ :Other : 0.94% p. a.Direct : 0.41% p. a.
ICICI Prudential Blended Plan - Plan A(Merging Scheme) has been merged into ICICI Prudential Equity - Arbitrage Fund(Surviving Scheme) after the close of business hours on April 22, 2016.The figures are not netted for derivative transactions.Risk-free rate based on the last Overnight MIBOR cut-off of 3.40%**In addition to the fund manager managing this fund, overseas investment is managed by Ms. Priyanka Khandelwal.@@ Total Expense Ratio is as on the last business day of the month.Please note that ICICI Prudential Equity - Arbitrage Fund has undergone change in fundamental attributes with effect from closure of business hours on August 28, 2019. Investors may please visit website for further details.Refer page no 123 to 131 for details on option, entry load, SWP, STP/Flex STP/Value STP & minimum redemption amount pertaining to the scheme.For IDCW History : Refer page no. from 152 to 159, For SIP Returns : Refer page no. from 147 to 150, For Investment Objective : Refer page no. from 160 to 163$$$ - Please refer page 168 for details.
$$$Quantitative Indicators
Company/Issuer Rating % to % to NAV NAV Derivatives
ICICI Prudential Equity - Arbitrage Fund(An open ended scheme investing in arbitrage opportunities.)
Riskometer
This Product is suitable for investors who are seeking*:
• Short term income generation• A hybrid scheme that aims to generate low
volatility returns by using arbitrage and other derivative strategies in equity markets and investments in debt and money market instruments.
*Investors should consult their financial advisers if in doubt about whether theproduct is suitable for them.
1 Year 3 Years 5 Years Since inceptionParticulars
26.1922 23.4720
Scheme
Nifty 50 Arbitrage Index (Benchmark)
1 Year T Bill (Additional Benchmark)
NAV (Rs.) Per Unit (as on July 30,2021 : 27.2365)
CAGR (%)
Current Value of
Investment of Rs. 10000
CAGR (%)
Current Value of
Investment of Rs. 10000
CAGR (%)
Current Value of
Investment of Rs. 10000
20.8675
CAGR (%)
Current Value of
Investment of Rs. 10000
10.00
4.00 10398.71 5.08 11603.83 5.47 13052.11 7.11 27236.50
4.28 10426.49 4.72 11484.27 4.73 12601.63 NA NA
3.78 10377.30 6.41 12048.11 6.27 13555.08 6.35 24548.04
Arbitrage Fund
Category
NAV (As on 30-Jul-21): Growth Option : 27.2365 IDCW Option : 14.1443 Direct Plan Growth Option : 28.5590 Direct Plan IDCW Option : 15.2960 `̀ `̀` `
`
Application Amount for fresh Subscription :Rs.5,000 (plus in multiples of Re.1)
Min.Addl.Investment :Rs.1000/- (plus in multiples of Re.1/-)
Average P/E :
31.18Average P/B :
5.62
Average Dividend Yield :
1.21
Std Dev (Annualised) :
0.83%
Sharpe Ratio :
1.89Portfolio Beta :
0.64
Annual Portfolio Turnover Ratio : Equity - 1.24 times
Investors understand that their principal will be at Low risk

46
ICICI Prudential Equity - Arbitrage Fund(An open ended scheme investing in arbitrage opportunities.)
• Top Ten HoldingsSecurities and the corresponding derivative exposure with less than 1% to NAV, have been clubbed together with a consolidated limit of 10%.Derivatives are considered at exposure value.^ Value Less than 0.01% of NAV in absolute terms.
Company/Issuer Rating % to % to NAV NAV Derivatives
Portfolio as on July 31, 2021
Rating Profile (as % of debt component)
Transportation 2.31% -2.32% Adani Ports and Special Economic Zone Ltd. 2.31% -2.32% Equity less than 1% of corpus 9.96% -9.98% Debt Holdings 35.93% Corporate Securities 0.68% HDFC Bank Ltd. (Additional Tier 1 - Basel III) CRISIL AA+ 0.68% Britannia Industries Ltd. CRISIL AAA ^ Treasury Bills 13.21% • 91 Days Treasury Bill 2021 SOV 7.74% • 182 Days Treasury Bill 2021 SOV 5.24% 364 Days Treasury Bill 2021 SOV 0.23% Commercial Papers (CPs) 12.33% • Bajaj Finance Ltd. CRISIL A1+ 4.30% • Aditya Birla Finance Ltd. ICRA A1+ 2.64% • Panatone Finvest Ltd. CRISIL A1+ 2.58% NABARD CRISIL A1+ 1.98% Infina Finance Pvt. Ltd. CRISIL A1+ 0.83% Cash, Call, TREPS & Term Deposits 9.70% Net Current Assets -2.08% Total Net Assets 100.00%
Arbitrage Fund
Category
Total Hedged Equity
AAA and Equivalent
AA and Equivalent
Sovereign Securities
TREPS & Current Assets
66.15%
12.33%
0.68%
13.21%
7.62%
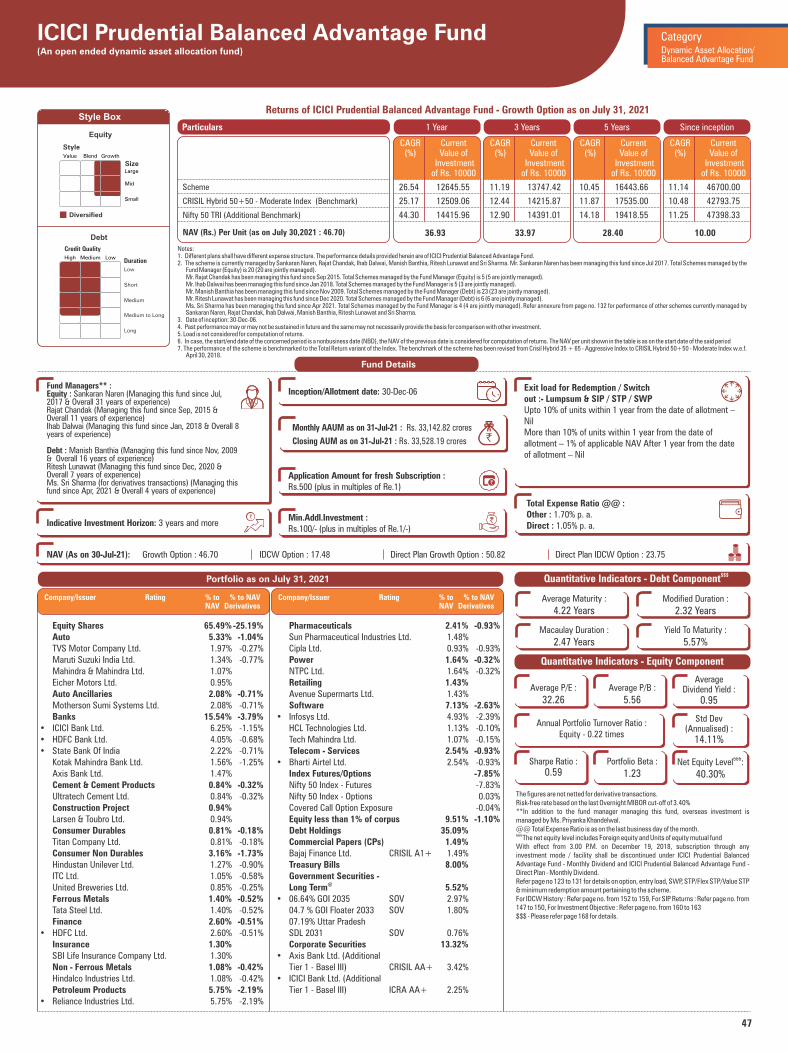
47
Value Blend Growth
Large
Mid
Small
Diversified
Equity
Style
Size
Medium to Long
High Medium Low
Low
Short
Medium
Duration
Long
Debt
Credit Quality
Style Box
Notes:1. Different plans shall have different expense structure. The performance details provided herein are of ICICI Prudential Balanced Advantage Fund.2. The scheme is currently managed by Sankaran Naren, Rajat Chandak, Ihab Dalwai, Manish Banthia, Ritesh Lunawat and Sri Sharma. Mr. Sankaran Naren has been managing this fund since Jul 2017. Total Schemes managed by the
Fund Manager (Equity) is 20 (20 are jointly managed). Mr. Rajat Chandak has been managing this fund since Sep 2015. Total Schemes managed by the Fund Manager (Equity) is 5 (5 are jointly managed). Mr. Ihab Dalwai has been managing this fund since Jan 2018. Total Schemes managed by the Fund Manager is 5 (3 are jointly managed). Mr. Manish Banthia has been managing this fund since Nov 2009. Total Schemes managed by the Fund Manager (Debt) is 23 (23 are jointly managed). Mr. Ritesh Lunawat has been managing this fund since Dec 2020. Total Schemes managed by the Fund Manager (Debt) is 6 (6 are jointly managed). Ms. Sri Sharma has been managing this fund since Apr 2021. Total Schemes managed by the Fund Manager is 4 (4 are jointly managed). Refer annexure from page no. 132 for performance of other schemes currently managed by
Sankaran Naren, Rajat Chandak, Ihab Dalwai, Manish Banthia, Ritesh Lunawat and Sri Sharma.3. Date of inception: 30-Dec-06.4. Past performance may or may not be sustained in future and the same may not necessarily provide the basis for comparison with other investment.5. Load is not considered for computation of returns.6. In case, the start/end date of the concerned period is a nonbusiness date (NBD), the NAV of the previous date is considered for computation of returns. The NAV per unit shown in the table is as on the start date of the said period7. The performance of the scheme is benchmarked to the Total Return variant of the Index. The benchmark of the scheme has been revised from Crisil Hybrid 35 + 65 - Aggressive Index to CRISIL Hybrid 50+50 - Moderate Index w.e.f.
April 30, 2018.
Returns of ICICI Prudential Balanced Advantage Fund - Growth Option as on July 31, 2021
Company/Issuer Rating % to % to NAV NAV Derivatives
Portfolio as on July 31, 2021
Fund Details
Monthly AAUM as on 31-Jul-21 : Rs. 33,142.82 crores
Closing AUM as on 31-Jul-21 : Rs. 33,528.19 crores `
Fund Managers** :Equity : Sankaran Naren (Managing this fund since Jul, 2017 & Overall 31 years of experience)Rajat Chandak (Managing this fund since Sep, 2015 & Overall 11 years of experience)Ihab Dalwai (Managing this fund since Jan, 2018 & Overall 8 years of experience)
Debt : Manish Banthia (Managing this fund since Nov, 2009 & Overall 16 years of experience)Ritesh Lunawat (Managing this fund since Dec, 2020 &Overall 7 years of experience)Ms. Sri Sharma (for derivatives transactions) (Managing this fund since Apr, 2021 & Overall 4 years of experience)
Indicative Investment Horizon: 3 years and more
Inception/Allotment date: 30-Dec-06 Exit load for Redemption / Switchout :- Lumpsum & SIP / STP / SWP Upto 10% of units within 1 year from the date of allotment – Nil More than 10% of units within 1 year from the date of allotment – 1% of applicable NAV After 1 year from the date of allotment – Nil
Total Expense Ratio @@ :Other : 1.70% p. a.Direct : 1.05% p. a.
Company/Issuer Rating % to % to NAV NAV Derivatives
ICICI Prudential Balanced Advantage Fund(An open ended dynamic asset allocation fund)
1 Year 3 Years 5 Years Since inceptionParticulars
36.93 33.97
Scheme
CRISIL Hybrid 50+50 - Moderate Index (Benchmark)
Nifty 50 TRI (Additional Benchmark)
NAV (Rs.) Per Unit (as on July 30,2021 : 46.70)
CAGR (%)
Current Value of
Investment of Rs. 10000
CAGR (%)
Current Value of
Investment of Rs. 10000
CAGR (%)
Current Value of
Investment of Rs. 10000
28.40
CAGR (%)
Current Value of
Investment of Rs. 10000
10.00
26.54 12645.55 11.19 13747.42 10.45 16443.66 11.14 46700.00
25.17 12509.06 12.44 14215.87 11.87 17535.00 10.48 42793.75
44.30 14415.96 12.90 14391.01 14.18 19418.55 11.25 47398.33
Dynamic Asset Allocation/Balanced Advantage Fund
Category
NAV (As on 30-Jul-21): Growth Option : 46.70 IDCW Option : 17.48 Direct Plan Growth Option : 50.82 Direct Plan IDCW Option : 23.75 `̀ `̀` `
`
Application Amount for fresh Subscription :Rs.500 (plus in multiples of Re.1)
Min.Addl.Investment :Rs.100/- (plus in multiples of Re.1/-)
$$$Quantitative Indicators - Debt Component
Average Maturity :
4.22 YearsModified Duration :
2.32 Years
Macaulay Duration :
2.47 YearsYield To Maturity :
5.57%
Quantitative Indicators - Equity Component
The figures are not netted for derivative transactions.Risk-free rate based on the last Overnight MIBOR cut-off of 3.40%**In addition to the fund manager managing this fund, overseas investment is managed by Ms. Priyanka Khandelwal.@@ Total Expense Ratio is as on the last business day of the month.&&&The net equity level includes Foreign equity and Units of equity mutual fundWith effect from 3.00 P.M. on December 19, 2018, subscription through any investment mode / facility shall be discontinued under ICICI Prudential Balanced Advantage Fund - Monthly Dividend and ICICI Prudential Balanced Advantage Fund - Direct Plan - Monthly Dividend.Refer page no 123 to 131 for details on option, entry load, SWP, STP/Flex STP/Value STP & minimum redemption amount pertaining to the scheme.For IDCW History : Refer page no. from 152 to 159, For SIP Returns : Refer page no. from 147 to 150, For Investment Objective : Refer page no. from 160 to 163$$$ - Please refer page 168 for details.
Average P/E :
32.26Average P/B :
5.56
Average Dividend Yield :
0.95
Sharpe Ratio : 0.59
Portfolio Beta :
1.23
&&&Net Equity Level :
40.30%
Annual Portfolio Turnover Ratio : Equity - 0.22 times
Std Dev (Annualised) :
14.11%
Pharmaceuticals 2.41% -0.93% Sun Pharmaceutical Industries Ltd. 1.48% Cipla Ltd. 0.93% -0.93% Power 1.64% -0.32% NTPC Ltd. 1.64% -0.32% Retailing 1.43% Avenue Supermarts Ltd. 1.43% Software 7.13% -2.63%• Infosys Ltd. 4.93% -2.39% HCL Technologies Ltd. 1.13% -0.10% Tech Mahindra Ltd. 1.07% -0.15% Telecom - Services 2.54% -0.93%• Bharti Airtel Ltd. 2.54% -0.93% Index Futures/Options -7.85% Nifty 50 Index - Futures -7.83% Nifty 50 Index - Options 0.03% Covered Call Option Exposure -0.04% Equity less than 1% of corpus 9.51% -1.10% Debt Holdings 35.09% Commercial Papers (CPs) 1.49% Bajaj Finance Ltd. CRISIL A1+ 1.49% Treasury Bills 8.00% Government Securities -
@ Long Term 5.52% • 06.64% GOI 2035 SOV 2.97% 04.7 % GOI Floater 2033 SOV 1.80% 07.19% Uttar Pradesh SDL 2031 SOV 0.76% Corporate Securities 13.32% • Axis Bank Ltd. (Additional Tier 1 - Basel III) CRISIL AA+ 3.42% • ICICI Bank Ltd. (Additional Tier 1 - Basel III) ICRA AA+ 2.25%
Equity Shares 65.49% -25.19% Auto 5.33% -1.04% TVS Motor Company Ltd. 1.97% -0.27% Maruti Suzuki India Ltd. 1.34% -0.77% Mahindra & Mahindra Ltd. 1.07% Eicher Motors Ltd. 0.95% Auto Ancillaries 2.08% -0.71% Motherson Sumi Systems Ltd. 2.08% -0.71% Banks 15.54% -3.79%• ICICI Bank Ltd. 6.25% -1.15%• HDFC Bank Ltd. 4.05% -0.68%• State Bank Of India 2.22% -0.71% Kotak Mahindra Bank Ltd. 1.56% -1.25% Axis Bank Ltd. 1.47% Cement & Cement Products 0.84% -0.32% Ultratech Cement Ltd. 0.84% -0.32% Construction Project 0.94% Larsen & Toubro Ltd. 0.94% Consumer Durables 0.81% -0.18% Titan Company Ltd. 0.81% -0.18% Consumer Non Durables 3.16% -1.73% Hindustan Unilever Ltd. 1.27% -0.90% ITC Ltd. 1.05% -0.58% United Breweries Ltd. 0.85% -0.25% Ferrous Metals 1.40% -0.52% Tata Steel Ltd. 1.40% -0.52% Finance 2.60% -0.51%• HDFC Ltd. 2.60% -0.51% Insurance 1.30% SBI Life Insurance Company Ltd. 1.30% Non - Ferrous Metals 1.08% -0.42% Hindalco Industries Ltd. 1.08% -0.42% Petroleum Products 5.75% -2.19%• Reliance Industries Ltd. 5.75% -2.19%

48
Company/Issuer Rating % to % to NAV NAV Derivatives
Portfolio as on July 31, 2021
ICICI Prudential Balanced Advantage Fund(An open ended dynamic asset allocation fund) Dynamic Asset Allocation/
Balanced Advantage Fund
Category
EMBASSY OFFICE PARKS REIT CRISIL AAA 1.03% Nirma Ltd. CRISIL AA- 0.81% IndusInd Bank Ltd. (Additional Tier 1 - Basel III) CRISIL AA 0.78% Sattva Holding & Trading CRISIL AA+ 0.46% Nuvoco Vistas Corporation Ltd. CRISIL AA 0.46% (Nirma Group)
TMF Holdings Ltd. (Subsidiary of Tata Motors
Limited) ICRA AA- 0.37% Coastal Gujarat Power Ltd. (guarantee from Tata Power
Company Limited) FITCH AA(CE) 0.35% IDBI Bank Ltd. (Tier II) ICRA A 0.32% Avanse Financial Services Ltd CARE A+ 0.31% Muthoot Finance Ltd. CRISIL AA+ 0.31% State Bank Of India (Additional Tier 1 - Basel III) CRISIL AA+ 0.24% The Great Eastern Shipping Company Ltd. CARE AA+ 0.23% Walwhan Renewables Energy Ltd. (guarantee from
Tata Power Co. Ltd.) CARE AA(CE) 0.19% JMC Projects (India) Ltd. CARE A+ 0.16% HDFC Bank Ltd. (Additional Tier 1 - Basel III) CRISIL AA+ 0.16% Power Finance Corporation Ltd. CRISIL AAA 0.16% State Bank Of India (Tier II - Basel III) CRISIL AAA 0.16% AU Small Finance Bank Ltd. (Tier II) CRISIL AA- 0.16% Tata Motors Ltd. CARE AA- 0.15% Bharti Telecom Ltd. CRISIL AA+ 0.15% Manappuram Finance Ltd. CRISIL AA 0.15% Motilal Oswal Home Finance Ltd ICRA AA(CE) 0.15% IDFC First Bank Ltd. ICRA AA 0.12% Phoenix ARC Pvt Ltd CRISIL AA 0.11% Prism Johnson Ltd. FITCH A+ 0.07% Aadhar Housing Finance Ltd. CARE AA 0.06% Rural Electrification Corporation Ltd. CRISIL AAA 0.02% NTPC Ltd. CRISIL AAA 0.01% Britannia Industries Ltd. CRISIL AAA 0.01% Pass Through Certificates 0.01% &
IIERT Oct 2018 II CRISIL B+(SO) 0.01% Cash, Call, TREPS & Term Deposits 6.75% Net Current Assets -0.57% Total Net Assets 100.00%
Rating Profile (as % of debt component)
AAA and Equivalent
AA and Equivalent
A and Equivalent
Sovereign Securities
B and Equivalent
TREPS & Current Assets
Riskometer
This Product is suitable for investors who are seeking*:
• Long term capital appreciation/income
• Investing in equity and equity related securities and debt instruments.
*Investors should consult their financial advisers if in doubt about whether theproduct is suitable for them.
Investors understand that their principal will be at High risk
• Top Ten HoldingsSecurities and the corresponding derivative exposure with less than 1% to NAV, have been clubbed together with a consolidated limit of 10%.Derivatives are considered at exposure value.@
Short Term < 8 Years, Long Term > 8 Years.^ Value Less than 0.01% of NAV in absolute terms.
12.03%
46.50%
3.62%
0.02%
23.17%
14.66%
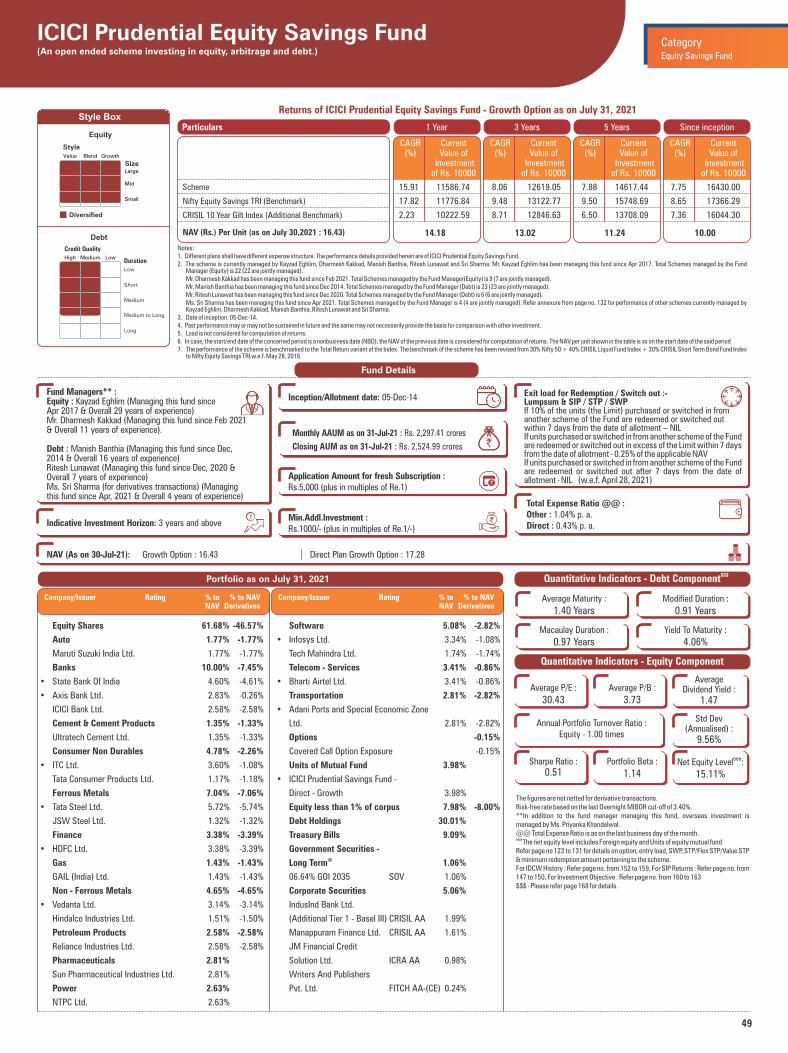
49
Value Blend Growth
Large
Mid
Small
Diversified
Equity
Style
Size
Medium to Long
High Medium Low
Low
Short
Medium
Duration
Long
Debt
Credit Quality
Style Box
Notes:1. Different plans shall have different expense structure. The performance details provided herein are of ICICI Prudential Equity Savings Fund.2. The scheme is currently managed by Kayzad Eghlim, Dharmesh Kakkad, Manish Banthia, Ritesh Lunawat and Sri Sharma. Mr. Kayzad Eghlim has been managing this fund since Apr 2017. Total Schemes managed by the Fund
Manager (Equity) is 22 (22 are jointly managed). Mr. Dharmesh Kakkad has been managing this fund since Feb 2021. Total Schemes managed by the Fund Manager(Equity) is 9 (7 are jointly managed). Mr. Manish Banthia has been managing this fund since Dec 2014. Total Schemes managed by the Fund Manager (Debt) is 23 (23 are jointly managed). Mr. Ritesh Lunawat has been managing this fund since Dec 2020. Total Schemes managed by the Fund Manager (Debt) is 6 (6 are jointly managed). Ms. Sri Sharma has been managing this fund since Apr 2021. Total Schemes managed by the Fund Manager is 4 (4 are jointly managed). Refer annexure from page no. 132 for performance of other schemes currently managed by
Kayzad Eghlim, Dharmesh Kakkad, Manish Banthia, Ritesh Lunawat and Sri Sharma.3. Date of inception: 05-Dec-14.4. Past performance may or may not be sustained in future and the same may not necessarily provide the basis for comparison with other investment.5. Load is not considered for computation of returns.6. In case, the start/end date of the concerned period is a nonbusiness date (NBD), the NAV of the previous date is considered for computation of returns. The NAV per unit shown in the table is as on the start date of the said period7. The performance of the scheme is benchmarked to the Total Return variant of the Index. The benchmark of the scheme has been revised from 30% Nifty 50 + 40% CRISIL Liquid Fund Index + 30% CRISIL Short Term Bond Fund Index
to Nifty Equity Savings TRI w.e.f. May 28, 2018.
Returns of ICICI Prudential Equity Savings Fund - Growth Option as on July 31, 2021
Equity Shares 61.68% -46.57%
Auto 1.77% -1.77%
Maruti Suzuki India Ltd. 1.77% -1.77%
Banks 10.00% -7.45%
• State Bank Of India 4.60% -4.61%
• Axis Bank Ltd. 2.83% -0.26%
ICICI Bank Ltd. 2.58% -2.58%
Cement & Cement Products 1.35% -1.33%
Ultratech Cement Ltd. 1.35% -1.33%
Consumer Non Durables 4.78% -2.26%
• ITC Ltd. 3.60% -1.08%
Tata Consumer Products Ltd. 1.17% -1.18%
Ferrous Metals 7.04% -7.06%
• Tata Steel Ltd. 5.72% -5.74%
JSW Steel Ltd. 1.32% -1.32%
Finance 3.38% -3.39%
• HDFC Ltd. 3.38% -3.39%
Gas 1.43% -1.43%
GAIL (India) Ltd. 1.43% -1.43%
Non - Ferrous Metals 4.65% -4.65%
• Vedanta Ltd. 3.14% -3.14%
Hindalco Industries Ltd. 1.51% -1.50%
Petroleum Products 2.58% -2.58%
Reliance Industries Ltd. 2.58% -2.58%
Pharmaceuticals 2.81%
Sun Pharmaceutical Industries Ltd. 2.81%
Power 2.63%
NTPC Ltd. 2.63%
Software 5.08% -2.82%
• Infosys Ltd. 3.34% -1.08%
Tech Mahindra Ltd. 1.74% -1.74%
Telecom - Services 3.41% -0.86%
• Bharti Airtel Ltd. 3.41% -0.86%
Transportation 2.81% -2.82%
• Adani Ports and Special Economic Zone
Ltd. 2.81% -2.82%
Options -0.15%
Covered Call Option Exposure -0.15%
Units of Mutual Fund 3.98%
• ICICI Prudential Savings Fund -
Direct - Growth 3.98%
Equity less than 1% of corpus 7.98% -8.00%
Debt Holdings 30.01%
Treasury Bills 9.09%
Government Securities - @ Long Term 1.06%
06.64% GOI 2035 SOV 1.06%
Corporate Securities 5.06%
IndusInd Bank Ltd.
(Additional Tier 1 - Basel III) CRISIL AA 1.99%
Manappuram Finance Ltd. CRISIL AA 1.61%
JM Financial Credit
Solution Ltd. ICRA AA 0.98%
Writers And Publishers
Pvt. Ltd. FITCH AA-(CE) 0.24%
Company/Issuer Rating % to % to NAV NAV Derivatives
Portfolio as on July 31, 2021
Fund Details
Monthly AAUM as on 31-Jul-21 : Rs. 2,297.41 crores
Closing AUM as on 31-Jul-21 : Rs. 2,524.99 crores `
Fund Managers** :Equity : Kayzad Eghlim (Managing this fund since Apr 2017 & Overall 29 years of experience)Mr. Feb 21Dharmesh Kakkad (Managing this fund since 20 & Overall years of experience)11 .
Debt : Manish Banthia (Managing this fund since Dec, 2014 & Overall 16 years of experience)Ritesh Lunawat (Managing this fund since Dec, 2020 & Overall 7 years of experience)Ms. Sri Sharma (for derivatives transactions) (Managing this fund since Apr, 2021 & Overall 4 years of experience)
Indicative Investment Horizon: 3 years and above
Inception/Allotment date: 05-Dec-14
Total Expense Ratio @@ :Other : 1.04% p. a.Direct : 0.43% p. a.
Company/Issuer Rating % to % to NAV NAV Derivatives
ICICI Prudential Equity Savings Fund(An open ended scheme investing in equity, arbitrage and debt.)
1 Year 3 Years 5 Years Since inceptionParticulars
14.18 13.02
Scheme
Nifty Equity Savings TRI (Benchmark)
CRISIL 10 Year Gilt Index (Additional Benchmark)
NAV (Rs.) Per Unit (as on July 30,2021 : 16.43)
CAGR (%)
Current Value of
Investment of Rs. 10000
CAGR (%)
Current Value of
Investment of Rs. 10000
CAGR (%)
Current Value of
Investment of Rs. 10000
11.24
CAGR (%)
Current Value of
Investment of Rs. 10000
10.00
15.91 11586.74 8.06 12619.05 7.88 14617.44 7.75 16430.00
17.82 11776.84 9.48 13122.77 9.50 15748.69 8.65 17366.29
2.23 10222.59 8.71 12846.63 6.50 13708.09 7.36 16044.30
$$$Quantitative Indicators - Debt Component
Average Maturity :
1.40 YearsModified Duration :
0.91 Years
Macaulay Duration :
0.97 YearsYield To Maturity :
4.06%
Quantitative Indicators - Equity Component
The figures are not netted for derivative transactions.Risk-free rate based on the last Overnight MIBOR cut-off of 3.40%.**In addition to the fund manager managing this fund, overseas investment is managed by Ms. Priyanka Khandelwal.@@ Total Expense Ratio is as on the last business day of the month.&&&The net equity level includes Foreign equity and Units of equity mutual fundRefer page no 123 to 131 for details on option, entry load, SWP, STP/Flex STP/Value STP & minimum redemption amount pertaining to the scheme.For IDCW History : Refer page no. from 152 to 159, For SIP Returns : Refer page no. from 147 to 150, For Investment Objective : Refer page no. from 160 to 163$$$ - Please refer page 168 for details.
Equity Savings Fund
Category
NAV (As on 30-Jul-21): Growth Option : 16.43 Direct Plan Growth Option : 17.28 `̀ `̀` `
`
Application Amount for fresh Subscription :Rs.5,000 (plus in multiples of Re.1)
Min.Addl.Investment :Rs.1000/- (plus in multiples of Re.1/-)
Average P/E :
30.43Average P/B :
3.73
Average Dividend Yield :
1.47
Sharpe Ratio : 0.51
Portfolio Beta :
1.14
&&&Net Equity Level :
15.11%
Annual Portfolio Turnover Ratio : Equity - 1.00 times
Std Dev (Annualised) :
9.56%
Exit load for Redemption / Switch out :- Lumpsum & SIP / STP / SWP If 10% of the units (the Limit) purchased or switched in from another scheme of the Fund are redeemed or switched out within 7 days from the date of allotment – NIL If units purchased or switched in from another scheme of the Fund are redeemed or switched out in excess of the Limit within 7 days from the date of allotment - 0.25% of the applicable NAV If units purchased or switched in from another scheme of the Fund are redeemed or switched out after 7 days from the date of allotment - NIL (w.e.f. April 28, 2021)
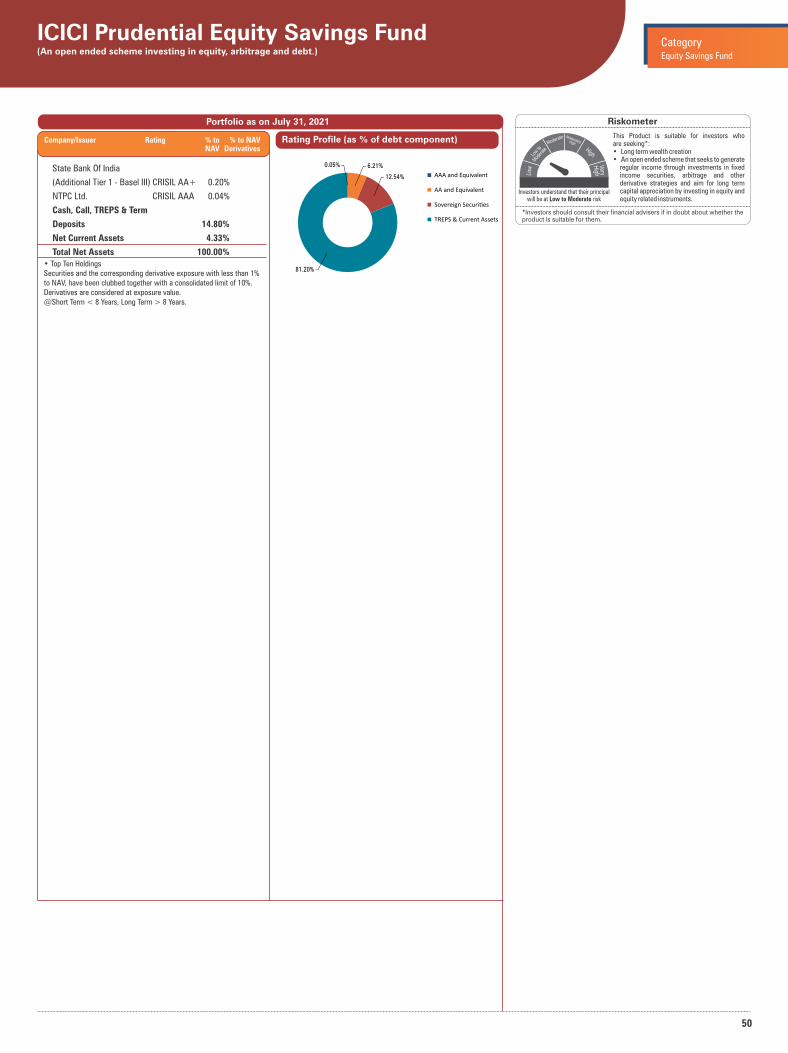
50
• Top Ten HoldingsSecurities and the corresponding derivative exposure with less than 1% to NAV, have been clubbed together with a consolidated limit of 10%.Derivatives are considered at exposure value.@Short Term < 8 Years, Long Term > 8 Years.
Company/Issuer Rating % to % to NAV NAV Derivatives
Portfolio as on July 31, 2021
Rating Profile (as % of debt component)
ICICI Prudential Equity Savings Fund(An open ended scheme investing in equity, arbitrage and debt.) Equity Savings Fund
Category
State Bank Of India
(Additional Tier 1 - Basel III) CRISIL AA+ 0.20%
NTPC Ltd. CRISIL AAA 0.04%
Cash, Call, TREPS & Term
Deposits 14.80%
Net Current Assets 4.33%
Total Net Assets 100.00%
AAA and Equivalent
AA and Equivalent
Sovereign Securi�es
TREPS & Current Assets
Riskometer
This Product is suitable for investors who are seeking*:• Long term wealth creation• An open ended scheme that seeks to generate
regular income through investments in fixed income securities, arbitrage and other derivative strategies and aim for long term capital appreciation by investing in equity and equity related instruments.
*Investors should consult their financial advisers if in doubt about whether theproduct is suitable for them.
Investors understand that their principal will be at Low to Moderate risk
0.05% 6.21%
12.54%
81.20%
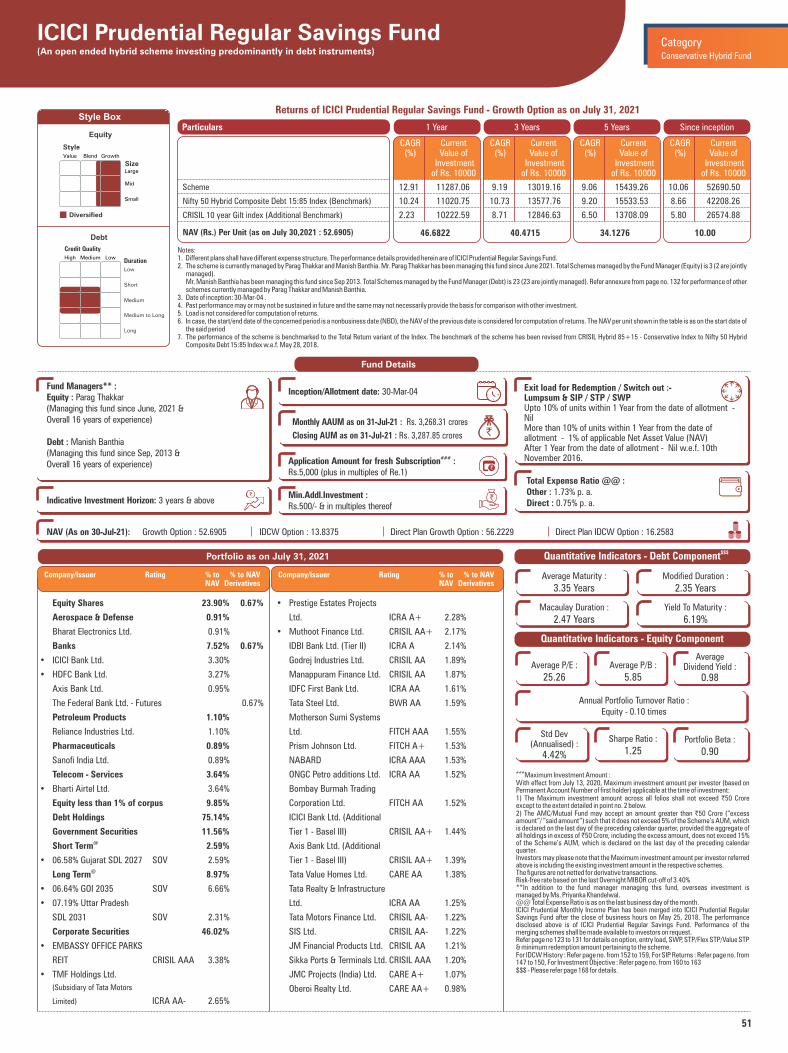
51
Value Blend Growth
Large
Mid
Small
Diversified
Equity
Style
Size
Medium to Long
High Medium Low
Low
Short
Medium
Duration
Long
Debt
Credit Quality
Style BoxReturns of ICICI Prudential Regular Savings Fund - Growth Option as on July 31, 2021
Notes:1. Different plans shall have different expense structure. The performance details provided herein are of ICICI Prudential Regular Savings Fund.2. The scheme is currently managed by Parag Thakkar and Manish Banthia. Mr. Parag Thakkar has been managing this fund since June 2021. Total Schemes managed by the Fund Manager (Equity) is 3 (2 are jointly
managed). Mr. Manish Banthia has been managing this fund since Sep 2013. Total Schemes managed by the Fund Manager (Debt) is 23 (23 are jointly managed). Refer annexure from page no. 132 for performance of other
schemes currently managed by Parag Thakkar and Manish Banthia.3. Date of inception: 30-Mar-04 .4. Past performance may or may not be sustained in future and the same may not necessarily provide the basis for comparison with other investment.5. Load is not considered for computation of returns.6. In case, the start/end date of the concerned period is a nonbusiness date (NBD), the NAV of the previous date is considered for computation of returns. The NAV per unit shown in the table is as on the start date of
the said period7. The performance of the scheme is benchmarked to the Total Return variant of the Index. The benchmark of the scheme has been revised from CRISIL Hybrid 85+15 - Conservative Index to Nifty 50 Hybrid
Composite Debt 15:85 Index w.e.f. May 28, 2018.
Portfolio as on July 31, 2021
Fund Details
Monthly AAUM as on 31-Jul-21 : Rs. 3,268.31 crores
Closing AUM as on 31-Jul-21 : Rs. 3,287.85 crores `
Fund Managers** :Equity : Parag Thakkar (Managing this fund since June, 2021 &Overall 16 years of experience)
Debt : Manish Banthia (Managing this fund since Sep, 2013 & Overall 16 years of experience)
Indicative Investment Horizon: 3 years & above
Inception/Allotment date: 30-Mar-04 Exit load for Redemption / Switch out :- Lumpsum & SIP / STP / SWP Upto 10% of units within 1 Year from the date of allotment - Nil More than 10% of units within 1 Year from the date of allotment - 1% of applicable Net Asset Value (NAV) After 1 Year from the date of allotment - Nil w.e.f. 10th November 2016.
Total Expense Ratio @@ :Other : 1.73% p. a.Direct : 0.75% p. a.
ICICI Prudential Regular Savings Fund(An open ended hybrid scheme investing predominantly in debt instruments)
1 Year 3 Years 5 Years Since inceptionParticulars
46.6822 40.4715
Scheme
Nifty 50 Hybrid Composite Debt 15:85 Index (Benchmark)
CRISIL 10 year Gilt index (Additional Benchmark)
NAV (Rs.) Per Unit (as on July 30,2021 : 52.6905)
CAGR (%)
Current Value of
Investment of Rs. 10000
CAGR (%)
Current Value of
Investment of Rs. 10000
CAGR (%)
Current Value of
Investment of Rs. 10000
34.1276
CAGR (%)
Current Value of
Investment of Rs. 10000
10.00
12.91 11287.06 9.19 13019.16 9.06 15439.26 10.06 52690.50
10.24 11020.75 10.73 13577.76 9.20 15533.53 8.66 42208.26
2.23 10222.59 8.71 12846.63 6.50 13708.09 5.80 26574.88
$$$Quantitative Indicators - Debt Component
Average Maturity :
3.35 YearsModified Duration :
2.35 Years
Macaulay Duration :
2.47 YearsYield To Maturity :
6.19%
Quantitative Indicators - Equity Component
###Maximum Investment Amount :With effect from July 13, 2020, Maximum investment amount per investor (based on Permanent Account Number of first holder) applicable at the time of investment:1) The Maximum investment amount across all folios shall not exceed `50 Crore except to the extent detailed in point no. 2 below.2) The AMC/Mutual Fund may accept an amount greater than `50 Crore (“excess amount”/ ”said amount”) such that it does not exceed 5% of the Scheme’s AUM, which is declared on the last day of the preceding calendar quarter, provided the aggregate of all holdings in excess of ̀ 50 Crore, including the excess amount, does not exceed 15% of the Scheme’s AUM, which is declared on the last day of the preceding calendar quarter.Investors may please note that the Maximum investment amount per investor referred above is including the existing investment amount in the respective schemes.The figures are not netted for derivative transactions.Risk-free rate based on the last Overnight MIBOR cut-off of 3.40%**In addition to the fund manager managing this fund, overseas investment is managed by Ms. Priyanka Khandelwal.@@ Total Expense Ratio is as on the last business day of the month.ICICI Prudential Monthly Income Plan has been merged into ICICI Prudential Regular Savings Fund after the close of business hours on May 25, 2018. The performance disclosed above is of ICICI Prudential Regular Savings Fund. Performance of the merging schemes shall be made available to investors on request.Refer page no 123 to 131 for details on option, entry load, SWP, STP/Flex STP/Value STP & minimum redemption amount pertaining to the scheme.For IDCW History : Refer page no. from 152 to 159, For SIP Returns : Refer page no. from 147 to 150, For Investment Objective : Refer page no. from 160 to 163$$$ - Please refer page 168 for details.
Conservative Hybrid Fund
Category
NAV (As on 30-Jul-21): Growth Option : 52.6905 IDCW Option : 13.8375 Direct Plan Growth Option : 56.2229 Direct Plan IDCW Option : 16.2583 `̀ `̀` `
`
###Application Amount for fresh Subscription :Rs.5,000 (plus in multiples of Re.1)
Min.Addl.Investment :Rs.500/- & in multiples thereof
Average P/E :
25.26Average P/B :
5.85
Average Dividend Yield :
0.98
Std Dev (Annualised) :
4.42%
Sharpe Ratio :
1.25Portfolio Beta :
0.90
Annual Portfolio Turnover Ratio : Equity - 0.10 times
Equity Shares 23.90% 0.67%
Aerospace & Defense 0.91%
Bharat Electronics Ltd. 0.91%
Banks 7.52% 0.67%
• ICICI Bank Ltd. 3.30%
• HDFC Bank Ltd. 3.27%
Axis Bank Ltd. 0.95%
The Federal Bank Ltd. - Futures 0.67%
Petroleum Products 1.10%
Reliance Industries Ltd. 1.10%
Pharmaceuticals 0.89%
Sanofi India Ltd. 0.89%
Telecom - Services 3.64%
• Bharti Airtel Ltd. 3.64%
Equity less than 1% of corpus 9.85%
Debt Holdings 75.14%
Government Securities 11.56%
Short Term 2.59% @
• 06.58% Gujarat SDL 2027 SOV 2.59%
Long Term 8.97% @
• 06.64% GOI 2035 SOV 6.66%
• 07.19% Uttar Pradesh
SDL 2031 SOV 2.31%
Corporate Securities 46.02%
• EMBASSY OFFICE PARKS
REIT CRISIL AAA 3.38%
• TMF Holdings Ltd.
(Subsidiary of Tata Motors
Limited) ICRA AA- 2.65%
• Prestige Estates Projects
Ltd. ICRA A+ 2.28%
• Muthoot Finance Ltd. CRISIL AA+ 2.17%
IDBI Bank Ltd. (Tier II) ICRA A 2.14%
Godrej Industries Ltd. CRISIL AA 1.89%
Manappuram Finance Ltd. CRISIL AA 1.87%
IDFC First Bank Ltd. ICRA AA 1.61%
Tata Steel Ltd. BWR AA 1.59%
Motherson Sumi Systems
Ltd. FITCH AAA 1.55%
Prism Johnson Ltd. FITCH A+ 1.53%
NABARD ICRA AAA 1.53%
ONGC Petro additions Ltd. ICRA AA 1.52%
Bombay Burmah Trading
Corporation Ltd. FITCH AA 1.52%
ICICI Bank Ltd. (Additional
Tier 1 - Basel III) CRISIL AA+ 1.44%
Axis Bank Ltd. (Additional
Tier 1 - Basel III) CRISIL AA+ 1.39%
Tata Value Homes Ltd. CARE AA 1.38%
Tata Realty & Infrastructure
Ltd. ICRA AA 1.25%
Tata Motors Finance Ltd. CRISIL AA- 1.22%
SIS Ltd. CRISIL AA- 1.22%
JM Financial Products Ltd. CRISIL AA 1.21%
Sikka Ports & Terminals Ltd. CRISIL AAA 1.20%
JMC Projects (India) Ltd. CARE A+ 1.07%
Oberoi Realty Ltd. CARE AA+ 0.98%
Company/Issuer Rating % to % to NAV NAV Derivatives
Company/Issuer Rating % to % to NAV NAV Derivatives
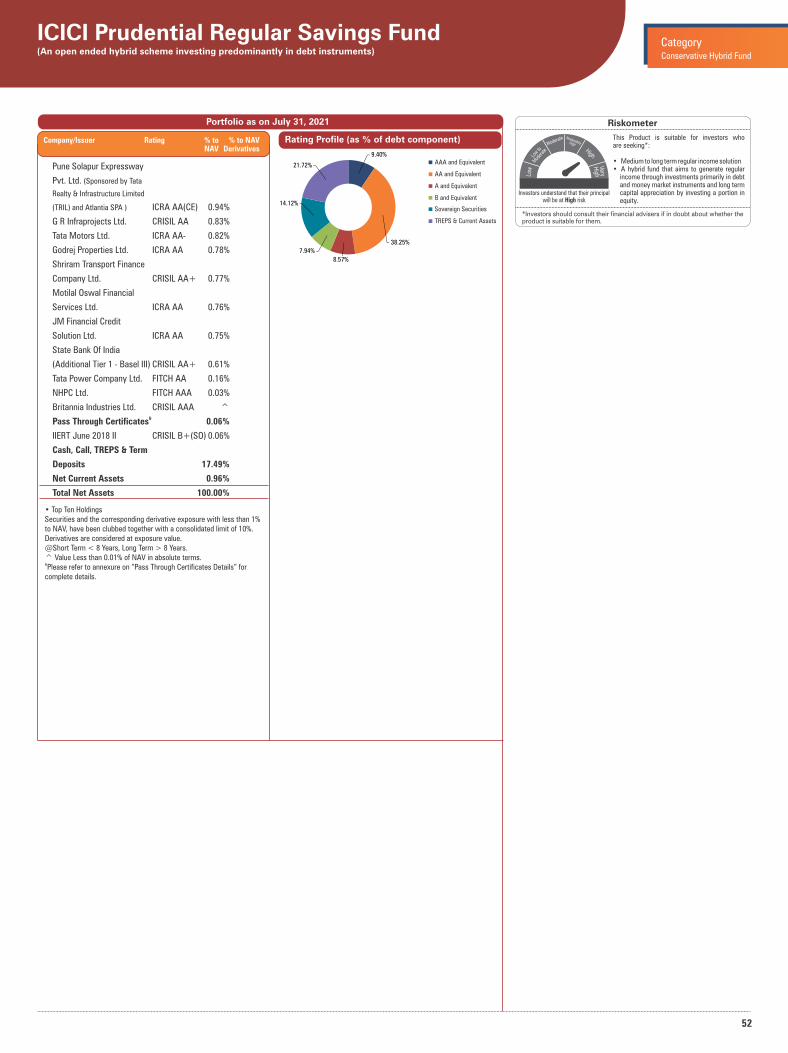
52
Portfolio as on July 31, 2021
ICICI Prudential Regular Savings Fund(An open ended hybrid scheme investing predominantly in debt instruments) Conservative Hybrid Fund
Category
• Top Ten HoldingsSecurities and the corresponding derivative exposure with less than 1% to NAV, have been clubbed together with a consolidated limit of 10%.Derivatives are considered at exposure value.@Short Term < 8 Years, Long Term > 8 Years.^ Value Less than 0.01% of NAV in absolute terms.&Please refer to annexure on “Pass Through Certificates Details” for complete details.
Rating Profile (as % of debt component)
Riskometer
This Product is suitable for investors who are seeking*:
• Medium to long term regular income solution• A hybrid fund that aims to generate regular
income through investments primarily in debt and money market instruments and long term capital appreciation by investing a portion in equity.
*Investors should consult their financial advisers if in doubt about whether theproduct is suitable for them.
Investors understand that their principal will be at High risk
Company/Issuer Rating % to % to NAV NAV Derivatives
Pune Solapur Expressway
Pvt. Ltd. (Sponsored by Tata
Realty & Infrastructure Limited
(TRIL) and Atlantia SPA ) ICRA AA(CE) 0.94%
G R Infraprojects Ltd. CRISIL AA 0.83%
Tata Motors Ltd. ICRA AA- 0.82%
Godrej Properties Ltd. ICRA AA 0.78%
Shriram Transport Finance
Company Ltd. CRISIL AA+ 0.77%
Motilal Oswal Financial
Services Ltd. ICRA AA 0.76%
JM Financial Credit
Solution Ltd. ICRA AA 0.75%
State Bank Of India
(Additional Tier 1 - Basel III) CRISIL AA+ 0.61%
Tata Power Company Ltd. FITCH AA 0.16%
NHPC Ltd. FITCH AAA 0.03%
Britannia Industries Ltd. CRISIL AAA ^
Pass Through Certificates 0.06% &
IIERT June 2018 II CRISIL B+(SO) 0.06%
Cash, Call, TREPS & Term
Deposits 17.49%
Net Current Assets 0.96%
Total Net Assets 100.00%
9.40%
38.25%
8.57%
7.94%
14.12%
21.72% AAA and Equivalent
AA and Equivalent
A and Equivalent
Sovereign Securities
B and Equivalent
TREPS & Current Assets
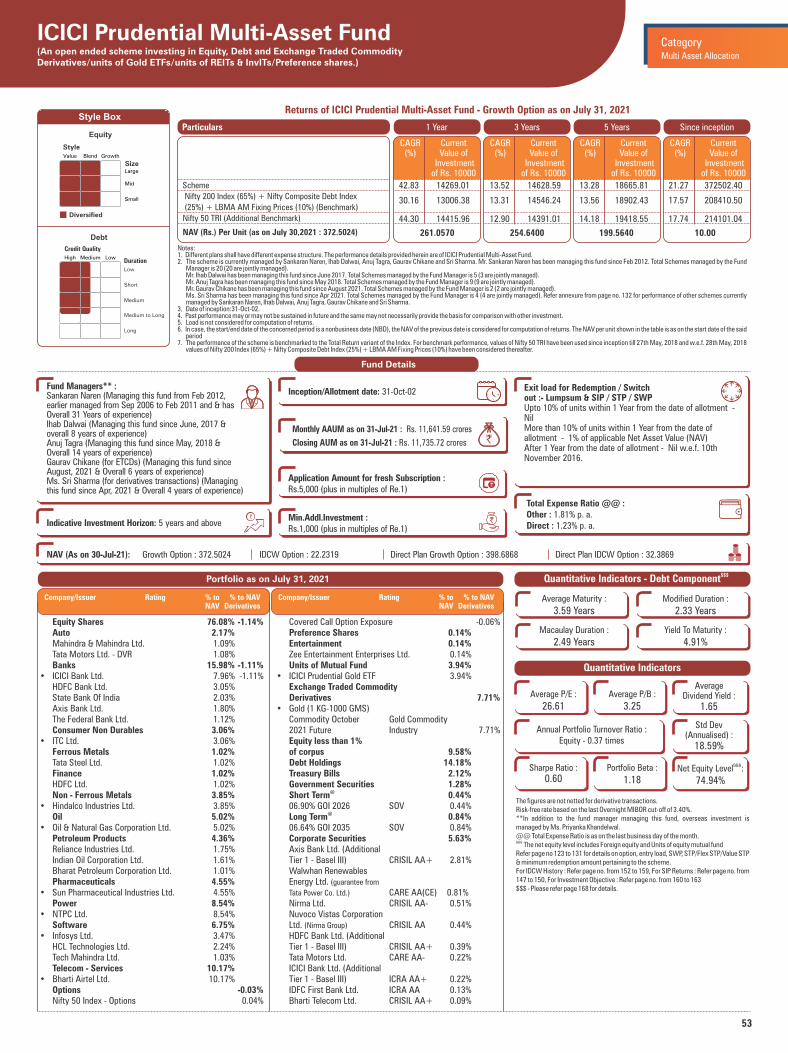
53
Value Blend Growth
Large
Mid
Small
Diversified
Equity
Style
Size
Medium to Long
High Medium Low
Low
Short
Medium
Duration
Long
Debt
Credit Quality
Style Box
Notes:1. Different plans shall have different expense structure. The performance details provided herein are of ICICI Prudential Multi-Asset Fund.2. The scheme is currently managed by Sankaran Naren, Ihab Dalwai, Anuj Tagra and . Mr. Sankaran Naren has been managing this fund since Feb 2012. Total Schemes managed by the Fund , Gaurav Chikane Sri Sharma
Manager is are jointly managed).20 (20 Mr. Ihab Dalwai has been managing this fund since June 2017. Total Schemes managed by the Fund Manager is are jointly managed). 5 (3 Mr. Anuj Tagra has been managing this fund since May 2018. Total Schemes managed by the Fund Manager is 9 (9 are jointly managed). Mr. Gaurav Chikane has been managing this fund since August 2021. Total Schemes managed by the Fund Manager is 2 (2 are jointly managed). Ms. Sri Sharma has been managing this fund since Apr 2021. Total Schemes managed by the Fund Manager is 4 (4 are jointly managed). Refer annexure from page no. 132 for performance of other schemes currently
managed by Sankaran Naren, Ihab Dalwai, Anuj Tagra, Gaurav Chikane and Sri Sharma.3. Date of inception:31-Oct-02.4. Past performance may or may not be sustained in future and the same may not necessarily provide the basis for comparison with other investment.5. Load is not considered for computation of returns.6. In case, the start/end date of the concerned period is a nonbusiness date (NBD), the NAV of the previous date is considered for computation of returns. The NAV per unit shown in the table is as on the start date of the said
period7. The performance of the scheme is benchmarked to the Total Return variant of the Index. For benchmark performance, values of Nifty 50 TRI have been used since inception till 27th May, 2018 and w.e.f. 28th May, 2018
values of Nifty 200 Index (65%) + Nifty Composite Debt Index (25%) + LBMA AM Fixing Prices (10%) have been considered thereafter.
Returns of ICICI Prudential Multi-Asset Fund - Growth Option as on July 31, 2021
Company/Issuer Rating % to % to NAV NAV Derivatives
Portfolio as on July 31, 2021
Fund Details
Monthly AAUM as on 31-Jul-21 : Rs. 11,641.59 crores
Closing AUM as on 31-Jul-21 : Rs. 11,735.72 crores `
Fund Managers** :Sankaran Naren (Managing this fund from Feb 2012, earlier managed from Sep 2006 to Feb 2011 and & has Overall 31 Years of experience)Ihab Dalwai (Managing this fund since June, 2017 &overall 8 years of experience)Anuj Tagra (Managing this fund since May, 2018 &Overall 14 years of experience) Gaurav Chikane (for ETCDs) (Managing this fund since August, 2021 & Overall 6 years of experience)Ms. Sri Sharma (for derivatives transactions) (Managing this fund since Apr, 2021 & Overall 4 years of experience)
Indicative Investment Horizon: 5 years and above
Inception/Allotment date: 31-Oct-02 Exit load for Redemption / Switchout :- Lumpsum & SIP / STP / SWP Upto 10% of units within 1 Year from the date of allotment - Nil More than 10% of units within 1 Year from the date of allotment - 1% of applicable Net Asset Value (NAV) After 1 Year from the date of allotment - Nil w.e.f. 10th November 2016.
Total Expense Ratio @@ :Other : 1.81% p. a.Direct : 1.23% p. a.
Company/Issuer Rating % to % to NAV NAV Derivatives
ICICI Prudential Multi-Asset Fund(An open ended scheme investing in Equity, Debt and Exchange Traded Commodity Derivatives/units of Gold ETFs/units of REITs & InvITs/Preference shares.)
1 Year 3 Years 5 Years Since inceptionParticulars
261.0570 254.6400
Scheme
Nifty 200 Index (65%) + Nifty Composite Debt Index
(25%) + LBMA AM Fixing Prices (10%) (Benchmark)
Nifty 50 TRI (Additional Benchmark)
NAV (Rs.) Per Unit (as on July 30,2021 : 372.5024)
CAGR (%)
Current Value of
Investment of Rs. 10000
CAGR (%)
Current Value of
Investment of Rs. 10000
CAGR (%)
Current Value of
Investment of Rs. 10000
199.5640
CAGR (%)
Current Value of
Investment of Rs. 10000
10.00
42.83 14269.01 13.52 14628.59 13.28 18665.81 21.27 372502.40
30.16 13006.38 13.31 14546.24 13.56 18902.43 17.57 208410.50
44.30 14415.96 12.90 14391.01 14.18 19418.55 17.74 214101.04
Multi Asset Allocation
Category
NAV (As on 30-Jul-21): Growth Option : 372.5024 IDCW Option : 22.2319 Direct Plan Growth Option : 398.6868 Direct Plan IDCW Option : 32.3869 `̀ `̀` `
`
Application Amount for fresh Subscription :Rs.5,000 (plus in multiples of Re.1)
Min.Addl.Investment :Rs.1,000 (plus in multiples of Re.1)
Quantitative Indicators
The figures are not netted for derivative transactions.Risk-free rate based on the last Overnight MIBOR cut-off of 3.40%.**In addition to the fund manager managing this fund, overseas investment is managed by Ms. Priyanka Khandelwal.@@ Total Expense Ratio is as on the last business day of the month.&&& The net equity level includes Foreign equity and Units of equity mutual fund Refer page no 123 to 131 for details on option, entry load, SWP, STP/Flex STP/Value STP & minimum redemption amount pertaining to the scheme.For IDCW History : Refer page no. from 152 to 159, For SIP Returns : Refer page no. from 147 to 150, For Investment Objective : Refer page no. from 160 to 163$$$ - Please refer page 168 for details.
Average P/E :
26.61Average P/B :
3.25
Average Dividend Yield :
1.65
Sharpe Ratio : 0.60
Portfolio Beta :
1.18
&&&Net Equity Level :
74.94%
Annual Portfolio Turnover Ratio : Equity - 0.37 times
Std Dev (Annualised) :
18.59%
$$$Quantitative Indicators - Debt Component
Average Maturity :
3.59 YearsModified Duration :
2.33 Years
Macaulay Duration :
2.49 YearsYield To Maturity :
4.91%
Equity Shares 76.08% -1.14% Auto 2.17% Mahindra & Mahindra Ltd. 1.09% Tata Motors Ltd. - DVR 1.08% Banks 15.98% -1.11%• ICICI Bank Ltd. 7.96% -1.11% HDFC Bank Ltd. 3.05% State Bank Of India 2.03% Axis Bank Ltd. 1.80% The Federal Bank Ltd. 1.12% Consumer Non Durables 3.06% • ITC Ltd. 3.06% Ferrous Metals 1.02% Tata Steel Ltd. 1.02% Finance 1.02% HDFC Ltd. 1.02% Non - Ferrous Metals 3.85% • Hindalco Industries Ltd. 3.85% Oil 5.02% • Oil & Natural Gas Corporation Ltd. 5.02% Petroleum Products 4.36% Reliance Industries Ltd. 1.75% Indian Oil Corporation Ltd. 1.61% Bharat Petroleum Corporation Ltd. 1.01% Pharmaceuticals 4.55% • Sun Pharmaceutical Industries Ltd. 4.55% Power 8.54% • NTPC Ltd. 8.54% Software 6.75% • Infosys Ltd. 3.47% HCL Technologies Ltd. 2.24% Tech Mahindra Ltd. 1.03% Telecom - Services 10.17% • Bharti Airtel Ltd. 10.17% Options -0.03% Nifty 50 Index - Options 0.04%
Covered Call Option Exposure -0.06% Preference Shares 0.14% Entertainment 0.14% Zee Entertainment Enterprises Ltd. 0.14% Units of Mutual Fund 3.94% • ICICI Prudential Gold ETF 3.94% Exchange Traded Commodity Derivatives 7.71%• Gold (1 KG-1000 GMS) Commodity October Gold Commodity 2021 Future Industry 7.71% Equity less than 1% of corpus 9.58% Debt Holdings 14.18% Treasury Bills 2.12% Government Securities 1.28% Short Term 0.44% @
06.90% GOI 2026 SOV 0.44% Long Term 0.84% @
06.64% GOI 2035 SOV 0.84% Corporate Securities 5.63% Axis Bank Ltd. (Additional Tier 1 - Basel III) CRISIL AA+ 2.81% Walwhan Renewables Energy Ltd. (guarantee from
Tata Power Co. Ltd.) CARE AA(CE) 0.81% Nirma Ltd. CRISIL AA- 0.51% Nuvoco Vistas Corporation Ltd. CRISIL AA 0.44% (Nirma Group)
HDFC Bank Ltd. (Additional Tier 1 - Basel III) CRISIL AA+ 0.39% Tata Motors Ltd. CARE AA- 0.22% ICICI Bank Ltd. (Additional Tier 1 - Basel III) ICRA AA+ 0.22% IDFC First Bank Ltd. ICRA AA 0.13% Bharti Telecom Ltd. CRISIL AA+ 0.09%

54
Company/Issuer Rating % to % to NAV NAV Derivatives
Portfolio as on July 31, 2021
Cash, Call, TREPS & Term Deposits 5.15% Units of Infrastructure Investment Trusts (InvITs) 1.33% India Infrastructure Trust 1.33% Units of Real Estate Investment Trust (REITs) 1.16% EMBASSY OFFICE PARKS REIT 1.15% MINDSPACE BUSINESS PARKS REIT 0.01% Net Current Assets 3.17% Total Net Assets 100.00%
ICICI Prudential Multi-Asset Fund(An open ended scheme investing in Equity, Debt and Exchange Traded Commodity Derivatives/units of Gold ETFs/units of REITs & InvITs/Preference shares.)
Multi Asset Allocation
Category
• Top Ten HoldingsSecurities and the corresponding derivative exposure with less than 1% to NAV, have been clubbed together with a consolidated limit of 10%.Derivatives are considered at exposure value.@Short Term < 8 Years, Long Term > 8 Years.
Rating Profile (as % of debt component)
AA and Equivalent
Sovereign Securities
TREPS & Current Assets
Riskometer
This Product is suitable for investors who are seeking*:
• Long term wealth creation
• An open ended scheme investing across asset classes
*Investors should consult their financial advisers if in doubt about whether theproduct is suitable for them.
Investors understand that their principal will be at Very High risk
52.23%
31.55%
16.22%
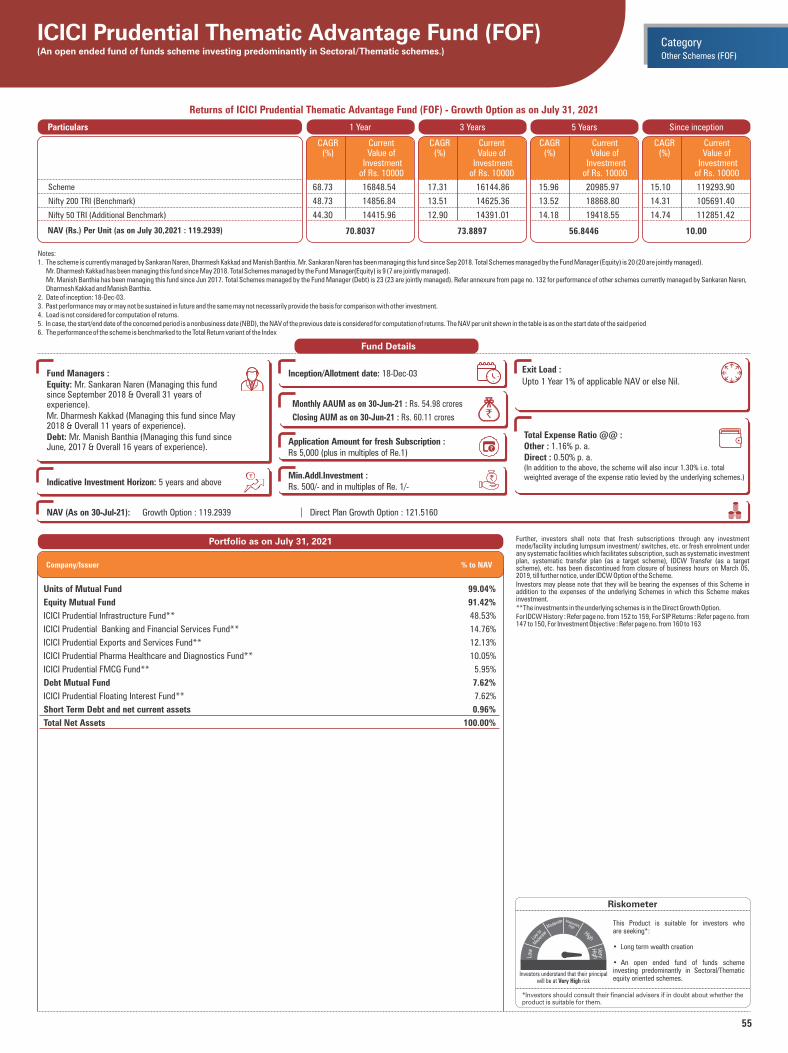
55
Notes:1. The scheme is currently managed by Sankaran Naren, Dharmesh Kakkad and Manish Banthia. Mr. Sankaran Naren has been managing this fund since Sep 2018. Total Schemes managed by the Fund Manager (Equity) is 20 (20 are jointly managed). Mr. Dharmesh Kakkad has been managing this fund since May 2018. Total Schemes managed by the Fund Manager(Equity) is 9 (7 are jointly managed). Mr. Manish Banthia has been managing this fund since Jun 2017. Total Schemes managed by the Fund Manager (Debt) is 23 (23 are jointly managed). Refer annexure from page no. 132 for performance of other schemes currently managed by Sankaran Naren,
Dharmesh Kakkad and Manish Banthia.2. Date of inception: 18-Dec-03.3. Past performance may or may not be sustained in future and the same may not necessarily provide the basis for comparison with other investment.4. Load is not considered for computation of returns.5. In case, the start/end date of the concerned period is a nonbusiness date (NBD), the NAV of the previous date is considered for computation of returns. The NAV per unit shown in the table is as on the start date of the said period6. The performance of the scheme is benchmarked to the Total Return variant of the Index
Returns of ICICI Prudential Thematic Advantage Fund (FOF) - Growth Option as on July 31, 2021
Riskometer
This Product is suitable for investors who are seeking*:
• Long term wealth creation
• An open ended fund of funds scheme investing predominantly in Sectoral/Thematic equity oriented schemes.
*Investors should consult their financial advisers if in doubt about whether theproduct is suitable for them.
ICICI Prudential Thematic Advantage Fund (FOF)(An open ended fund of funds scheme investing predominantly in Sectoral/Thematic schemes.)
Further, investors shall note that fresh subscriptions through any investment mode/facility including lumpsum investment/ switches, etc. or fresh enrolment under any systematic facilities which facilitates subscription, such as systematic investment plan, systematic transfer plan (as a target scheme), IDCW Transfer (as a target scheme), etc. has been discontinued from closure of business hours on March 05, 2019, till further notice, under IDCW Option of the Scheme. Investors may please note that they will be bearing the expenses of this Scheme in addition to the expenses of the underlying Schemes in which this Scheme makes investment.**The investments in the underlying schemes is in the Direct Growth Option.For IDCW History : Refer page no. from 152 to 159, For SIP Returns : Refer page no. from 147 to 150, For Investment Objective : Refer page no. from 160 to 163
1 Year 3 Years 5 Years Since inceptionParticulars
70.8037 73.8897
CAGR (%)
Current Value of
Investment of Rs. 10000
CAGR (%)
Current Value of
Investment of Rs. 10000
CAGR (%)
Current Value of
Investment of Rs. 10000
56.8446
CAGR (%)
Current Value of
Investment of Rs. 10000
10.00
Scheme
Nifty 200 TRI (Benchmark)
Nifty 50 TRI (Additional Benchmark)
NAV (Rs.) Per Unit (as on July 30,2021 : 119.2939)
68.73 16848.54 17.31 16144.86 15.96 20985.97 15.10 119293.90
48.73 14856.84 13.51 14625.36 13.52 18868.80 14.31 105691.40
44.30 14415.96 12.90 14391.01 14.18 19418.55 14.74 112851.42
Other Schemes (FOF)
Category
Portfolio as on July 31, 2021
Units of Mutual Fund 99.04%
Equity Mutual Fund 91.42%
ICICI Prudential Infrastructure Fund** 48.53%
ICICI Prudential Banking and Financial Services Fund** 14.76%
ICICI Prudential Exports and Services Fund** 12.13%
ICICI Prudential Pharma Healthcare and Diagnostics Fund** 10.05%
ICICI Prudential FMCG Fund** 5.95%
Debt Mutual Fund 7.62%
ICICI Prudential Floating Interest Fund** 7.62%
Short Term Debt and net current assets 0.96%
Total Net Assets 100.00%
Company/Issuer % to NAV
Fund Details
Monthly AAUM as on 30-Jun-21 : Rs. 54.98 crores
Closing AUM as on 30-Jun-21 : Rs. 60.11 crores `
Fund Managers : Equity: Mr. Sankaran Naren (Managing this fund since September 2018 & Overall 31 years of experience). Mr. Dharmesh Kakkad (Managing this fund since May 2018 & Overall 11 years of experience). Debt: Mr. Manish Banthia (Managing this fund since June, 2017 & Overall 16 years of experience).
Indicative Investment Horizon: 5 years and above
Inception/Allotment date: 18-Dec-03 Exit Load :
Upto 1 Year 1% of applicable NAV or else Nil.
Total Expense Ratio @@ :Other : 1.16% p. a.Direct : 0.50% p. a.(In addition to the above, the scheme will also incur 1.30% i.e. total weighted average of the expense ratio levied by the underlying schemes.)
NAV (As on 30-Jul-21): Growth Option : 119.2939 Direct Plan Growth Option : 121.5160 `̀ `̀` `
`
Application Amount for fresh Subscription :Rs 5,000 (plus in multiples of Re.1)
Min.Addl.Investment :Rs. 500/- and in multiples of Re. 1/-
Investors understand that their principal will be at Very High risk
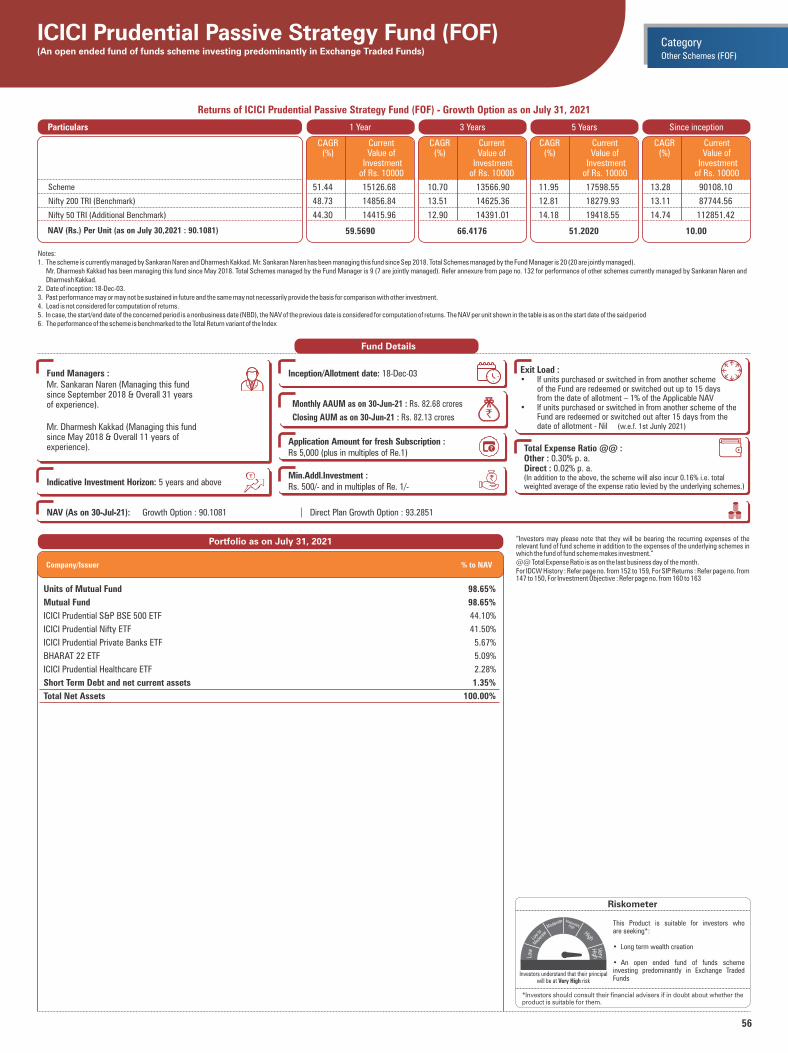
56
Notes:1. The scheme is currently managed by Sankaran Naren and Dharmesh Kakkad. Mr. Sankaran Naren has been managing this fund since Sep 2018. Total Schemes managed by the Fund Manager is 20 (20 are jointly managed). Mr. Dharmesh Kakkad has been managing this fund since May 2018. Total Schemes managed by the Fund Manager is 9 (7 are jointly managed). Refer annexure from page no. 132 for performance of other schemes currently managed by Sankaran Naren and
Dharmesh Kakkad.2. Date of inception: 18-Dec-03.3. Past performance may or may not be sustained in future and the same may not necessarily provide the basis for comparison with other investment.4. Load is not considered for computation of returns.5. In case, the start/end date of the concerned period is a nonbusiness date (NBD), the NAV of the previous date is considered for computation of returns. The NAV per unit shown in the table is as on the start date of the said period6. The performance of the scheme is benchmarked to the Total Return variant of the Index
Returns of ICICI Prudential Passive Strategy Fund (FOF) - Growth Option as on July 31, 2021
Riskometer
This Product is suitable for investors who are seeking*:
• Long term wealth creation
• An open ended fund of funds scheme investing predominantly in Exchange Traded Funds
*Investors should consult their financial advisers if in doubt about whether theproduct is suitable for them.
ICICI Prudential Passive Strategy Fund (FOF) (An open ended fund of funds scheme investing predominantly in Exchange Traded Funds)
“Investors may please note that they will be bearing the recurring expenses of the relevant fund of fund scheme in addition to the expenses of the underlying schemes in which the fund of fund scheme makes investment.”@@ Total Expense Ratio is as on the last business day of the month.For IDCW History : Refer page no. from 152 to 159, For SIP Returns : Refer page no. from 147 to 150, For Investment Objective : Refer page no. from 160 to 163
Portfolio as on July 31, 2021
Units of Mutual Fund 98.65%
Mutual Fund 98.65%
ICICI Prudential S&P BSE 500 ETF 44.10%
ICICI Prudential Nifty ETF 41.50%
ICICI Prudential Private Banks ETF 5.67%
BHARAT 22 ETF 5.09%
ICICI Prudential Healthcare ETF 2.28%
Short Term Debt and net current assets 1.35%
Total Net Assets 100.00%
Company/Issuer % to NAV
Fund Details
Monthly AAUM as on 30-Jun-21 : Rs. 82.68 crores
Closing AUM as on 30-Jun-21 : Rs. 82.13 crores `
Fund Managers : Mr. Sankaran Naren (Managing this fund since September 2018 & Overall 31 years of experience).
Mr. Dharmesh Kakkad (Managing this fund since May 2018 & Overall 11 years of experience).
Indicative Investment Horizon: 5 years and above
Inception/Allotment date: 18-Dec-03
Total Expense Ratio @@ :Other : 0.30% p. a.Direct : 0.02% p. a.(In addition to the above, the scheme will also incur 0.16% i.e. total weighted average of the expense ratio levied by the underlying schemes.)
NAV (As on 30-Jul-21): Growth Option : 90.1081 Direct Plan Growth Option : 93.2851 `̀ `̀` `
`
Application Amount for fresh Subscription :Rs 5,000 (plus in multiples of Re.1)
Min.Addl.Investment :Rs. 500/- and in multiples of Re. 1/-
Investors understand that their principal will be at Very High risk
Exit Load : • If units purchased or switched in from another scheme of the Fund are redeemed or switched out up to 15 days from the date of allotment – 1% of the Applicable NAV • If units purchased or switched in from another scheme of the
Fund are redeemed or switched out after 15 days from the date of allotment - Nil (w.e.f. 1st Junly 2021)
Other Schemes (FOF)
Category
1 Year 3 Years 5 Years Since inceptionParticulars
59.5690 66.4176
CAGR (%)
Current Value of
Investment of Rs. 10000
CAGR (%)
Current Value of
Investment of Rs. 10000
CAGR (%)
Current Value of
Investment of Rs. 10000
51.2020
CAGR (%)
Current Value of
Investment of Rs. 10000
10.00
Scheme
Nifty 200 TRI (Benchmark)
Nifty 50 TRI (Additional Benchmark)
NAV (Rs.) Per Unit (as on July 30,2021 : 90.1081)
51.44 15126.68 10.70 13566.90 11.95 17598.55 13.28 90108.10
48.73 14856.84 13.51 14625.36 12.81 18279.93 13.11 87744.56
44.30 14415.96 12.90 14391.01 14.18 19418.55 14.74 112851.42

57
Riskometer
This Product is suitable for investors who are seeking*:
• Long Term Wealth Creation
• An Open-ended Fund of Funds scheme investing in units of equity oriented mutual fund schemes.
*Investors should consult their financial advisers if in doubt about whether theproduct is suitable for them.
ICICI Prudential India Equity FOF (An Open ended Fund of Funds investing in units of equity oriented schemes.)
Investors may please note that they will be bearing the recurring expenses of this Scheme in addition to the expenses of the underlying Schemes in which this scheme makes investment.For ICICI Prudential India Equity FOF and ICICI Prudential Debt Management Fund (FOF) provisions w.r.t minimum application amount, minimum additional application amount, SIP amount, STP, Flex STP, Value STP will be revised w.e.f. November 14, 2020 , investors are requested to refer to addendum on the website for detailsFor IDCW History : Refer page no. from 152 to 159, For SIP Returns : Refer page no. from 147 to 150, For Investment Objective : Refer page no. from 160 to 163
Portfolio as on July 31, 2021
Units of Mutual Fund 97.14%
Mutual Fund 97.14%
• ICICI Prudential India Opportunities Fund** 14.83%
• Reliance CPSE ETF 13.72%
• Quantum Long Term Equity Value Fund** 11.91%
• ICICI Prudential Focused Equity Fund** 11.78%
• ICICI Prudential Dividend Yield Equity Fund** 9.35%
• SBI Contra Fund** 8.98%
• Invesco India Contra Fund** 8.92%
• Parag Parikh Long Term Equity** 8.74%
• Franklin India Equity Advantage Fund** 5.22%
• ICICI Prudential Business Cycle Fund** 3.69%
Short Term Debt and net current assets 2.86%
Total Net Assets 100.00%
Company/Issuer % to NAV
Fund Details
Monthly AAUM as on 30-Jun-21 : Rs. 33.10 crores
Closing AUM as on 30-Jun-21 : Rs. 33.93 crores `
Fund Managers : Mr. Dharmesh Kakkad (Managing this fund since February 2020 & Overall 11 Years of experience)
Indicative Investment Horizon: 5 years and above
Inception/Allotment date: 25-Feb-2020 Exit Load :
If the amount sought to be redeemed or switched out within 12 months from allotment: 1.00% of applicable NAV.
If the amount sought to be redeemed or switched out more than 12 months from allotment: Nil
Total Expense Ratio @@ :Other : 1.52% p. a.Direct : 0.49% p. a.(In addition to the above, the scheme will also incur 0.71% i.e. total weighted average of the expense ratio levied by the underlying schemes.)
NAV (As on 30-Jul-21): Growth Option : Rs. 15.2720 Direct Plan Growth Option : 15.4731 `̀ `̀` `
`
Application Amount for fresh Subscription :Rs 500/- (plus in multiples of Re.1)
Min.Addl.Investment :Rs. 500/- and in multiples of Re. 1/-
Investors understand that their principal will be at Very High risk
Other Schemes (FOF)
Category
Notes:1. The scheme is currently managed by Dharmesh Kakkad. Mr. Dharmesh Kakkad has been managing this fund since Feb 2020. Total Schemes managed by the Fund Manager is 9 (7 are jointly managed). Refer annexure from page no. 132 for performance of other
schemes currently managed by Dharmesh Kakkad.2. Date of inception: 25-Feb-20.3. As the Scheme has completed more than 1 year but less than 3 years, the performance details of only since inception and 1 year are provided herein.4. Past performance may or may not be sustained in future and the same may not necessarily provide the basis for comparison with other investment.5. Load is not considered for computation of returns.6. In case, the start/end date of the concerned period is a nonbusiness date (NBD), the NAV of the previous date is considered for computation of returns. The NAV per unit shown in the table is as on the start date of the said period7. The performance of the scheme is benchmarked to the Total Return variant of the Index
Returns of ICICI Prudential India Equity FOF - Growth Option as on July 31, 2021
1 Year 3 Years 5 Years Since inceptionParticulars
9.2115 -
CAGR (%)
Current Value of
Investment of Rs. 10000
CAGR (%)
Current Value of
Investment of Rs. 10000
CAGR (%)
Current Value of
Investment of Rs. 10000
-
CAGR (%)
Current Value of
Investment of Rs. 10000
10.00
Scheme
S&P BSE 500 TRI (Benchmark)
Nifty 50 TRI (Additional Benchmark)
NAV (Rs.) Per Unit (as on July 30,2021 : 15.2720)
66.02 16579.28 - - - - 34.53 15272.00
53.59 15341.08 - - - - 29.08 14396.00
44.30 14415.96 - - - - 24.14 13616.51
• Top Ten Holdings
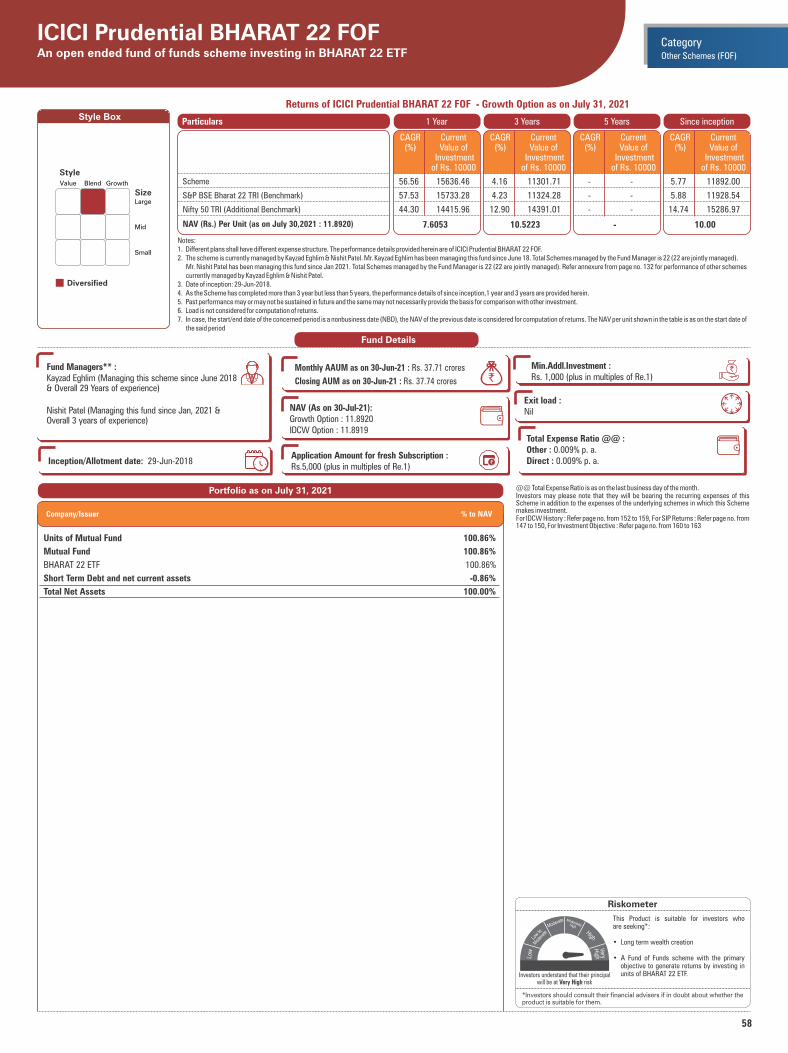
58
Notes:1. Different plans shall have different expense structure. The performance details provided herein are of ICICI Prudential BHARAT 22 FOF.2. The scheme is currently managed by Kayzad Eghlim & Nishit Patel. Mr. Kayzad Eghlim has been managing this fund since June 18. Total Schemes managed by the Fund Manager is 22 (22 are jointly managed). Mr. Nishit Patel has been managing this fund since Jan 2021. Total Schemes managed by the Fund Manager is 22 (22 are jointly managed). Refer annexure from page no. 132 for performance of other schemes
currently managed by Kayzad Eghlim & Nishit Patel.3. Date of inception: 29-Jun-2018.4. As the Scheme has completed more than 3 year but less than 5 years, the performance details of since inception,1 year and 3 years are provided herein.5. Past performance may or may not be sustained in future and the same may not necessarily provide the basis for comparison with other investment.6. Load is not considered for computation of returns.7. In case, the start/end date of the concerned period is a nonbusiness date (NBD), the NAV of the previous date is considered for computation of returns. The NAV per unit shown in the table is as on the start date of
the said period
Returns of ICICI Prudential BHARAT 22 FOF - Growth Option as on July 31, 2021
1 Year 3 Years 5 Years Since inceptionParticulars
7.6053 10.5223
Scheme
S&P BSE Bharat 22 TRI (Benchmark)
Nifty 50 TRI (Additional Benchmark)
NAV (Rs.) Per Unit (as on July 30,2021 : 11.8920)
CAGR (%)
Current Value of
Investment of Rs. 10000
CAGR (%)
Current Value of
Investment of Rs. 10000
CAGR (%)
Current Value of
Investment of Rs. 10000
-
CAGR (%)
Current Value of
Investment of Rs. 10000
10.00
Riskometer
This Product is suitable for investors who are seeking*:
• Long term wealth creation
• A Fund of Funds scheme with the primary objective to generate returns by investing in units of BHARAT 22 ETF.
*Investors should consult their financial advisers if in doubt about whether theproduct is suitable for them.
56.56 15636.46 4.16 11301.71 - - 5.77 11892.00
57.53 15733.28 4.23 11324.28 - - 5.88 11928.54
44.30 14415.96 12.90 14391.01 - - 14.74 15286.97
ICICI Prudential BHARAT 22 FOF An open ended fund of funds scheme investing in BHARAT 22 ETF
@@ Total Expense Ratio is as on the last business day of the month. Investors may please note that they will be bearing the recurring expenses of this Scheme in addition to the expenses of the underlying schemes in which this Scheme makes investment.For IDCW History : Refer page no. from 152 to 159, For SIP Returns : Refer page no. from 147 to 150, For Investment Objective : Refer page no. from 160 to 163
Style Box
Value Blend Growth
Large
Mid
Small
Diversified
Style
Size
Portfolio as on July 31, 2021
Units of Mutual Fund 100.86%
Mutual Fund 100.86%
BHARAT 22 ETF 100.86%
Short Term Debt and net current assets -0.86%
Total Net Assets 100.00%
Company/Issuer % to NAV
Fund Details
Fund Managers** :Kayzad Eghlim (Managing this scheme since June 2018 & Overall 29 Years of experience)
Nishit Patel (Managing this fund since Jan, 2021 & Overall 3 years of experience)
Inception/Allotment date: 29-Jun-2018
Monthly AAUM as on 30-Jun-21 : Rs. 37.71 crores
Closing AUM as on 30-Jun-21 : Rs. 37.74 crores `
Exit load : Nil
Total Expense Ratio @@ :Other : 0.009% p. a.Direct : 0.009% p. a.
NAV (As on 30-Jul-21):Growth Option : 11.8920IDCW Option : 11.8919
Application Amount for fresh Subscription :Rs.5,000 (plus in multiples of Re.1)
Min.Addl.Investment :Rs. 1,000 (plus in multiples of Re.1)
Investors understand that their principal will be at Very High risk
Other Schemes (FOF)
Category
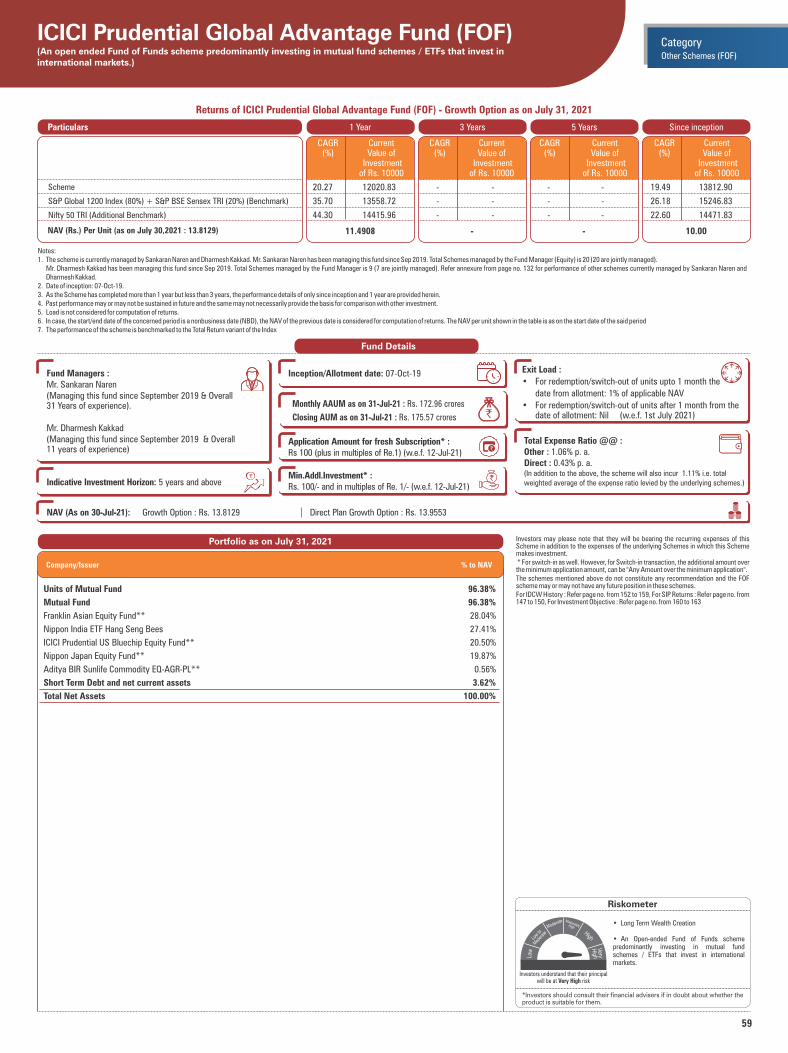
59
Notes:1. The scheme is currently managed by Sankaran Naren and Dharmesh Kakkad. Mr. Sankaran Naren has been managing this fund since Sep 2019. Total Schemes managed by the Fund Manager (Equity) is 20 (20 are jointly managed). Mr. Dharmesh Kakkad has been managing this fund since Sep 2019. Total Schemes managed by the Fund Manager is 9 (7 are jointly managed). Refer annexure from page no. 132 for performance of other schemes currently managed by Sankaran Naren and
Dharmesh Kakkad.2. Date of inception: 07-Oct-19.3. As the Scheme has completed more than 1 year but less than 3 years, the performance details of only since inception and 1 year are provided herein.4. Past performance may or may not be sustained in future and the same may not necessarily provide the basis for comparison with other investment.5. Load is not considered for computation of returns.6. In case, the start/end date of the concerned period is a nonbusiness date (NBD), the NAV of the previous date is considered for computation of returns. The NAV per unit shown in the table is as on the start date of the said period7. The performance of the scheme is benchmarked to the Total Return variant of the Index
Returns of ICICI Prudential Global Advantage Fund (FOF) - Growth Option as on July 31, 2021
Riskometer
• Long Term Wealth Creation
• An Open-ended Fund of Funds scheme predominantly investing in mutual fund schemes / ETFs that invest in international markets.
*Investors should consult their financial advisers if in doubt about whether theproduct is suitable for them.
ICICI Prudential Global Advantage Fund (FOF)(An open ended Fund of Funds scheme predominantly investing in mutual fund schemes / ETFs that invest in international markets.)
Investors may please note that they will be bearing the recurring expenses of this Scheme in addition to the expenses of the underlying Schemes in which this Scheme makes investment. * For switch-in as well. However, for Switch-in transaction, the additional amount over the minimum application amount, can be "Any Amount over the minimum application". The schemes mentioned above do not constitute any recommendation and the FOF scheme may or may not have any future position in these schemes.For IDCW History : Refer page no. from 152 to 159, For SIP Returns : Refer page no. from 147 to 150, For Investment Objective : Refer page no. from 160 to 163
Portfolio as on July 31, 2021
Units of Mutual Fund 96.38%
Mutual Fund 96.38%
Franklin Asian Equity Fund** 28.04%
Nippon India ETF Hang Seng Bees 27.41%
ICICI Prudential US Bluechip Equity Fund** 20.50%
Nippon Japan Equity Fund** 19.87%
Aditya BIR Sunlife Commodity EQ-AGR-PL** 0.56%
Short Term Debt and net current assets 3.62%
Total Net Assets 100.00%
Company/Issuer % to NAV
Fund Details
Monthly AAUM as on 31-Jul-21 : Rs. 172.96 crores
Closing AUM as on 31-Jul-21 : Rs. 175.57 crores `
Fund Managers : Mr. Sankaran Naren (Managing this fund since September 2019 & Overall 31 Years of experience).
Mr. Dharmesh Kakkad (Managing this fund since September 2019 & Overall 11 years of experience)
Indicative Investment Horizon: 5 years and above
Inception/Allotment date: 07-Oct-19 Exit Load :
• For redemption/switch-out of units upto 1 month the
date from allotment: 1% of applicable NAV
• For redemption/switch-out of units after 1 month from the date of allotment: Nil (w.e.f. 1st July 2021)
Total Expense Ratio @@ :Other : 1.06% p. a.Direct : 0.43% p. a.(In addition to the above, the scheme will also incur 1.11% i.e. total weighted average of the expense ratio levied by the underlying schemes.)
NAV (As on 30-Jul-21): Growth Option : Rs. 13.8129 Direct Plan Growth Option : Rs. 13.9553 `̀ `̀` `
`
Application Amount for fresh Subscription* :Rs 100 (plus in multiples of Re.1) (w.e.f. 12-Jul-21)
Min.Addl.Investment* :Rs. 100/- and in multiples of Re. 1/- (w.e.f. 12-Jul-21)
Investors understand that their principal will be at Very High risk
Other Schemes (FOF)
Category
1 Year 3 Years 5 Years Since inceptionParticulars
11.4908 -
CAGR (%)
Current Value of
Investment of Rs. 10000
CAGR (%)
Current Value of
Investment of Rs. 10000
CAGR (%)
Current Value of
Investment of Rs. 10000
-
CAGR (%)
Current Value of
Investment of Rs. 10000
10.00
Scheme
S&P Global 1200 Index (80%) + S&P BSE Sensex TRI (20%) (Benchmark)
Nifty 50 TRI (Additional Benchmark)
NAV (Rs.) Per Unit (as on July 30,2021 : 13.8129)
20.27 12020.83 - - - - 19.49 13812.90
35.70 13558.72 - - - - 26.18 15246.83
44.30 14415.96 - - - - 22.60 14471.83
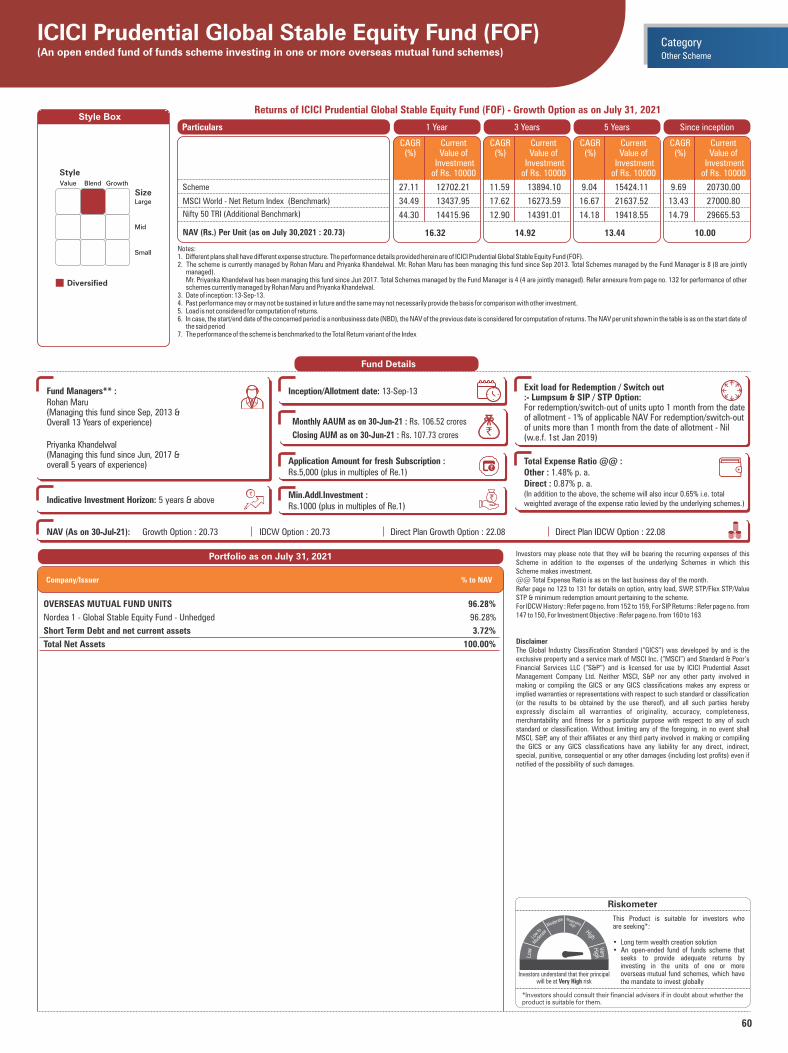
60
Style Box
Notes:1. Different plans shall have different expense structure. The performance details provided herein are of ICICI Prudential Global Stable Equity Fund (FOF).2. The scheme is currently managed by Rohan Maru and Priyanka Khandelwal. Mr. Rohan Maru has been managing this fund since Sep 2013. Total Schemes managed by the Fund Manager is 8 (8 are jointly
managed). Mr. Priyanka Khandelwal has been managing this fund since Jun 2017. Total Schemes managed by the Fund Manager is 4 (4 are jointly managed). Refer annexure from page no. 132 for performance of other
schemes currently managed by Rohan Maru and Priyanka Khandelwal.3. Date of inception: 13-Sep-13.4. Past performance may or may not be sustained in future and the same may not necessarily provide the basis for comparison with other investment.5. Load is not considered for computation of returns.6. In case, the start/end date of the concerned period is a nonbusiness date (NBD), the NAV of the previous date is considered for computation of returns. The NAV per unit shown in the table is as on the start date of
the said period7. The performance of the scheme is benchmarked to the Total Return variant of the Index
Returns of ICICI Prudential Global Stable Equity Fund (FOF) - Growth Option as on July 31, 2021
1 Year 3 Years 5 Years Since inceptionParticulars
16.32 14.92
Scheme
MSCI World - Net Return Index (Benchmark)
Nifty 50 TRI (Additional Benchmark)
NAV (Rs.) Per Unit (as on July 30,2021 : 20.73)
CAGR (%)
Current Value of
Investment of Rs. 10000
CAGR (%)
Current Value of
Investment of Rs. 10000
CAGR (%)
Current Value of
Investment of Rs. 10000
13.44
CAGR (%)
Current Value of
Investment of Rs. 10000
10.00
Riskometer
This Product is suitable for investors who are seeking*:
• Long term wealth creation solution• An open-ended fund of funds scheme that
seeks to provide adequate returns by investing in the units of one or more overseas mutual fund schemes, which have the mandate to invest globally
*Investors should consult their financial advisers if in doubt about whether theproduct is suitable for them.
Fund Details
Monthly AAUM as on 30-Jun-21 : Rs. 106.52 crores
Closing AUM as on 30-Jun-21 : Rs. 107.73 crores `
Fund Managers** :Rohan Maru(Managing this fund since Sep, 2013 &Overall 13 Years of experience)
Priyanka Khandelwal(Managing this fund since Jun, 2017 & overall 5 years of experience)
Indicative Investment Horizon: 5 years & above
Inception/Allotment date: 13-Sep-13 Exit load for Redemption / Switch out:- Lumpsum & SIP / STP Option:For redemption/switch-out of units upto 1 month from the date of allotment - 1% of applicable NAV For redemption/switch-out of units more than 1 month from the date of allotment - Nil (w.e.f. 1st Jan 2019)
Total Expense Ratio @@ :Other : 1.48% p. a.Direct : 0.87% p. a.(In addition to the above, the scheme will also incur 0.65% i.e. total weighted average of the expense ratio levied by the underlying schemes.)
27.11 12702.21 11.59 13894.10 9.04 15424.11 9.69 20730.00
34.49 13437.95 17.62 16273.59 16.67 21637.52 13.43 27000.80
44.30 14415.96 12.90 14391.01 14.18 19418.55 14.79 29665.53
ICICI Prudential Global Stable Equity Fund (FOF)(An open ended fund of funds scheme investing in one or more overseas mutual fund schemes)
Value Blend Growth
Large
Mid
Small
Diversified
Style
Size
Investors may please note that they will be bearing the recurring expenses of this Scheme in addition to the expenses of the underlying Schemes in which this Scheme makes investment.@@ Total Expense Ratio is as on the last business day of the month.Refer page no 123 to 131 for details on option, entry load, SWP, STP/Flex STP/Value STP & minimum redemption amount pertaining to the scheme.For IDCW History : Refer page no. from 152 to 159, For SIP Returns : Refer page no. from 147 to 150, For Investment Objective : Refer page no. from 160 to 163
DisclaimerThe Global Industry Classification Standard (“GICS”) was developed by and is the exclusive property and a service mark of MSCI Inc. (“MSCI”) and Standard & Poor’s Financial Services LLC (“S&P”) and is licensed for use by ICICI Prudential Asset Management Company Ltd. Neither MSCI, S&P nor any other party involved in making or compiling the GICS or any GICS classifications makes any express or implied warranties or representations with respect to such standard or classification (or the results to be obtained by the use thereof), and all such parties hereby expressly disclaim all warranties of originality, accuracy, completeness, merchantability and fitness for a particular purpose with respect to any of such standard or classification. Without limiting any of the foregoing, in no event shall MSCI, S&P, any of their affiliates or any third party involved in making or compiling the GICS or any GICS classifications have any liability for any direct, indirect, special, punitive, consequential or any other damages (including lost profits) even if notified of the possibility of such damages.
Other Scheme
Category
Portfolio as on July 31, 2021
OVERSEAS MUTUAL FUND UNITS 96.28%
Nordea 1 - Global Stable Equity Fund - Unhedged 96.28%
Short Term Debt and net current assets 3.72%
Total Net Assets 100.00%
Company/Issuer % to NAV
NAV (As on 30-Jul-21): Growth Option : 20.73 IDCW Option : 20.73 Direct Plan Growth Option : 22.08 Direct Plan IDCW Option : 22.08 `̀ `̀` `
`
Application Amount for fresh Subscription :Rs.5,000 (plus in multiples of Re.1)
Min.Addl.Investment :Rs.1000 (plus in multiples of Re.1)
Investors understand that their principal will be at Very High risk
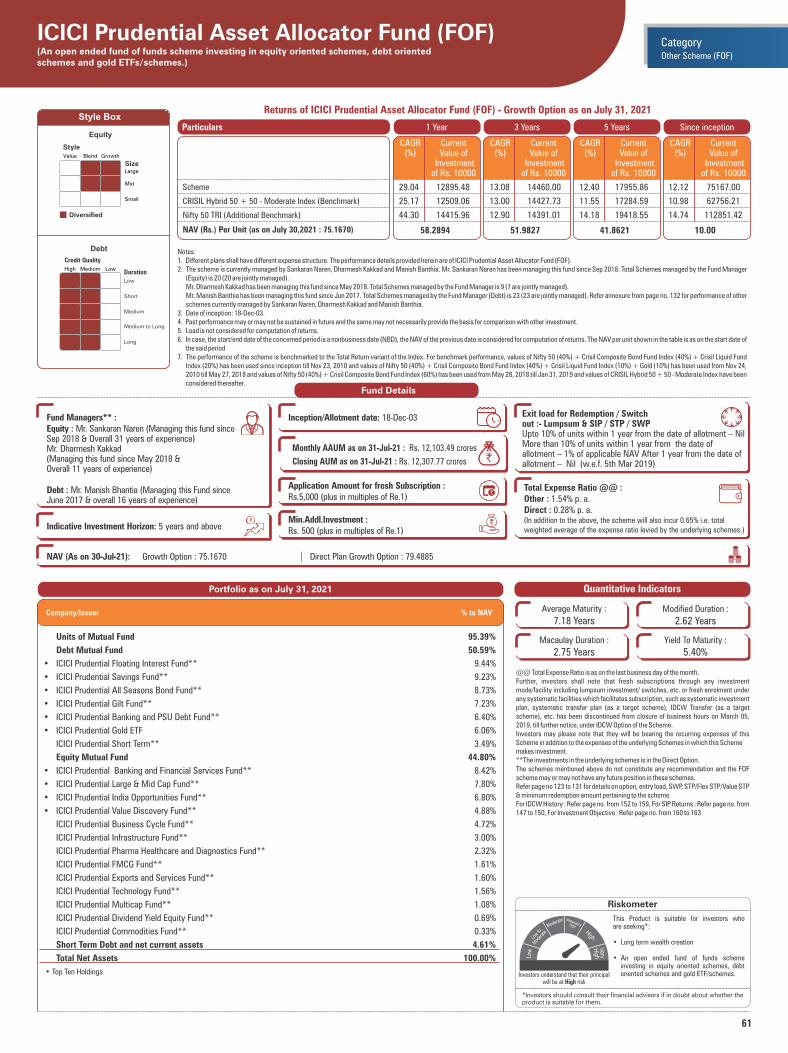
61
Returns of ICICI Prudential Asset Allocator Fund (FOF) - Growth Option as on July 31, 2021
Notes:1. Different plans shall have different expense structure. The performance details provided herein are of ICICI Prudential Asset Allocator Fund (FOF).2. The scheme is currently managed by Sankaran Naren, Dharmesh Kakkad and Manish Banthia. Mr. Sankaran Naren has been managing this fund since Sep 2018. Total Schemes managed by the Fund Manager
(Equity) is 20 (20 are jointly managed). Mr. Dharmesh Kakkad has been managing this fund since May 2018. Total Schemes managed by the Fund Manager is 9 (7 are jointly managed). Mr. Manish Banthia has been managing this fund since Jun 2017. Total Schemes managed by the Fund Manager (Debt) is 23 (23 are jointly managed). Refer annexure from page no. 132 for performance of other
schemes currently managed by Sankaran Naren, Dharmesh Kakkad and Manish Banthia.3. Date of inception: 18-Dec-03.4. Past performance may or may not be sustained in future and the same may not necessarily provide the basis for comparison with other investment.5. Load is not considered for computation of returns.6. In case, the start/end date of the concerned period is a nonbusiness date (NBD), the NAV of the previous date is considered for computation of returns. The NAV per unit shown in the table is as on the start date of
the said period7. The performance of the scheme is benchmarked to the Total Return variant of the Index. For benchmark performance, values of Nifty 50 (40%) + Crisil Composite Bond Fund Index (40%) + Crisil Liquid Fund
Index (20%) has been used since inception till Nov 23, 2010 and values of Nifty 50 (40%) + Crisil Composite Bond Fund Index (40%) + Crisil Liquid Fund Index (10%) + Gold (10%) has been used from Nov 24, 2010 till May 27, 2018 and values of Nifty 50 (40%) + Crisil Composite Bond Fund Index (60%) has been used from May 28, 2018 till Jan 31, 2019 and values of CRISIL Hybrid 50 + 50 - Moderate Index have been considered thereafter.
Riskometer
This Product is suitable for investors who are seeking*:
• Long term wealth creation
• An open ended fund of funds scheme investing in equity oriented schemes, debt oriented schemes and gold ETF/schemes.
*Investors should consult their financial advisers if in doubt about whether theproduct is suitable for them.
Fund Details
Monthly AAUM as on 31-Jul-21 : Rs. 12,103.49 crores
Closing AUM as on 31-Jul-21 : Rs. 12,307.77 crores `
Fund Managers** :Equity : Mr. Sankaran Naren (Managing this fund since Sep 2018 & Overall 31 years of experience) Mr. Dharmesh Kakkad (Managing this fund since May 2018 & Overall 11 years of experience)
Debt : Mr. Manish Bhantia (Managing this Fund since June 2017 & overall 16 years of experience)
Indicative Investment Horizon: 5 years and above
Inception/Allotment date: 18-Dec-03
ICICI Prudential Asset Allocator Fund (FOF)(An open ended fund of funds scheme investing in equity oriented schemes, debt oriented schemes and gold ETFs/schemes.)
@@ Total Expense Ratio is as on the last business day of the month.Further, investors shall note that fresh subscriptions through any investment mode/facility including lumpsum investment/ switches, etc. or fresh enrolment under any systematic facilities which facilitates subscription, such as systematic investment plan, systematic transfer plan (as a target scheme), IDCW Transfer (as a target scheme), etc. has been discontinued from closure of business hours on March 05, 2019, till further notice, under IDCW Option of the Scheme.Investors may please note that they will be bearing the recurring expenses of this Scheme in addition to the expenses of the underlying Schemes in which this Schememakes investment.**The investments in the underlying schemes is in the Direct Option.The schemes mentioned above do not constitute any recommendation and the FOF scheme may or may not have any future position in these schemes.Refer page no 123 to 131 for details on option, entry load, SWP, STP/Flex STP/Value STP & minimum redemption amount pertaining to the scheme.For IDCW History : Refer page no. from 152 to 159, For SIP Returns : Refer page no. from 147 to 150, For Investment Objective : Refer page no. from 160 to 163
Value Blend Growth
Large
Mid
Small
Diversified
Equity
Style
Size
Medium to Long
High Medium Low
Low
Short
Medium
Duration
Long
Debt
Credit Quality
Style Box
Exit load for Redemption / Switchout :- Lumpsum & SIP / STP / SWP Upto 10% of units within 1 year from the date of allotment – Nil More than 10% of units within 1 year from the date of allotment – 1% of applicable NAV After 1 year from the date of allotment – Nil (w.e.f. 5th Mar 2019)
Total Expense Ratio @@ :Other : 1.54% p. a.Direct : 0.28% p. a.(In addition to the above, the scheme will also incur 0.65% i.e. total weighted average of the expense ratio levied by the underlying schemes.)
Other Scheme (FOF)
Category
Portfolio as on July 31, 2021
Units of Mutual Fund 95.39%
Debt Mutual Fund 50.59%
• ICICI Prudential Floating Interest Fund** 9.44%
• ICICI Prudential Savings Fund** 9.23%
• ICICI Prudential All Seasons Bond Fund** 8.73%
• ICICI Prudential Gilt Fund** 7.23%
• ICICI Prudential Banking and PSU Debt Fund** 6.40%
• ICICI Prudential Gold ETF 6.06%
ICICI Prudential Short Term** 3.49%
Equity Mutual Fund 44.80%
• ICICI Prudential Banking and Financial Services Fund** 8.42%
• ICICI Prudential Large & Mid Cap Fund** 7.80%
• ICICI Prudential India Opportunities Fund** 6.80%
• ICICI Prudential Value Discovery Fund** 4.88%
ICICI Prudential Business Cycle Fund** 4.72%
ICICI Prudential Infrastructure Fund** 3.00%
ICICI Prudential Pharma Healthcare and Diagnostics Fund** 2.32%
ICICI Prudential FMCG Fund** 1.61%
ICICI Prudential Exports and Services Fund** 1.60%
ICICI Prudential Technology Fund** 1.56%
ICICI Prudential Multicap Fund** 1.08%
ICICI Prudential Dividend Yield Equity Fund** 0.69%
ICICI Prudential Commodities Fund** 0.33%
Short Term Debt and net current assets 4.61%
Total Net Assets 100.00%
Company/Issuer % to NAV
NAV (As on 30-Jul-21): Growth Option : 75.1670 Direct Plan Growth Option : 79.4885 `̀ `̀` `
`
Application Amount for fresh Subscription :Rs.5,000 (plus in multiples of Re.1)
Min.Addl.Investment :Rs. 500 (plus in multiples of Re.1)
• Top Ten Holdings
Quantitative Indicators
Average Maturity :
7.18 YearsModified Duration :
2.62 Years
Macaulay Duration :
2.75 YearsYield To Maturity :
5.40%
Investors understand that their principal will be at High risk
1 Year 3 Years 5 Years Since inceptionParticulars
58.2894 51.9827
Scheme
CRISIL Hybrid 50 + 50 - Moderate Index (Benchmark)
Nifty 50 TRI (Additional Benchmark)
NAV (Rs.) Per Unit (as on July 30,2021 : 75.1670)
CAGR (%)
Current Value of
Investment of Rs. 10000
CAGR (%)
Current Value of
Investment of Rs. 10000
CAGR (%)
Current Value of
Investment of Rs. 10000
41.8621
CAGR (%)
Current Value of
Investment of Rs. 10000
10.00
29.04 12895.48 13.08 14460.00 12.40 17955.86 12.12 75167.00
25.17 12509.06 13.00 14427.73 11.55 17284.59 10.98 62756.21
44.30 14415.96 12.90 14391.01 14.18 19418.55 14.74 112851.42
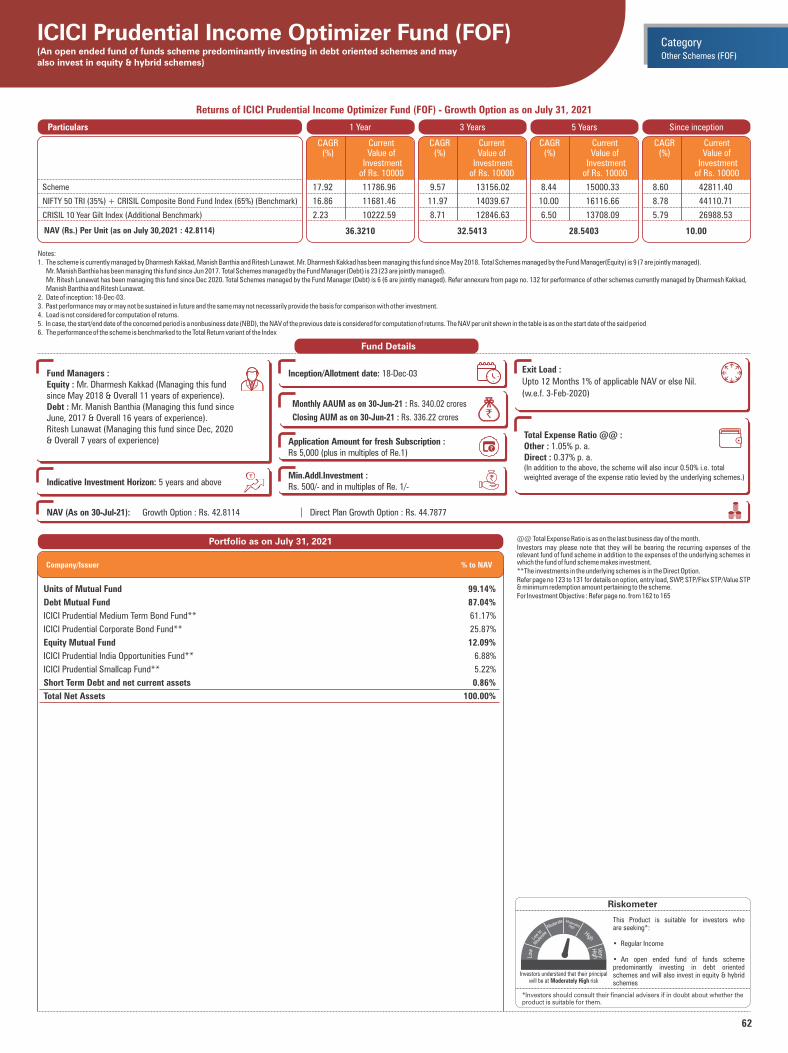
62
Notes:1. The scheme is currently managed by Dharmesh Kakkad, Manish Banthia and Ritesh Lunawat. Mr. Dharmesh Kakkad has been managing this fund since May 2018. Total Schemes managed by the Fund Manager(Equity) is 9 (7 are jointly managed). Mr. Manish Banthia has been managing this fund since Jun 2017. Total Schemes managed by the Fund Manager (Debt) is 23 (23 are jointly managed). Mr. Ritesh Lunawat has been managing this fund since Dec 2020. Total Schemes managed by the Fund Manager (Debt) is 6 (6 are jointly managed). Refer annexure from page no. 132 for performance of other schemes currently managed by Dharmesh Kakkad,
Manish Banthia and Ritesh Lunawat.2. Date of inception: 18-Dec-03.3. Past performance may or may not be sustained in future and the same may not necessarily provide the basis for comparison with other investment.4. Load is not considered for computation of returns.5. In case, the start/end date of the concerned period is a nonbusiness date (NBD), the NAV of the previous date is considered for computation of returns. The NAV per unit shown in the table is as on the start date of the said period6. The performance of the scheme is benchmarked to the Total Return variant of the Index
Returns of ICICI Prudential Income Optimizer Fund (FOF) - Growth Option as on July 31, 2021
Riskometer
This Product is suitable for investors who are seeking*:
• Regular Income
• An open ended fund of funds scheme predominantly investing in debt oriented schemes and will also invest in equity & hybrid schemes
*Investors should consult their financial advisers if in doubt about whether theproduct is suitable for them.
ICICI Prudential Income Optimizer Fund (FOF) (An open ended fund of funds scheme predominantly investing in debt oriented schemes and may also invest in equity & hybrid schemes)
Portfolio as on July 31, 2021
Units of Mutual Fund 99.14%
Debt Mutual Fund 87.04%
ICICI Prudential Medium Term Bond Fund** 61.17%
ICICI Prudential Corporate Bond Fund** 25.87%
Equity Mutual Fund 12.09%
ICICI Prudential India Opportunities Fund** 6.88%
ICICI Prudential Smallcap Fund** 5.22%
Short Term Debt and net current assets 0.86%
Total Net Assets 100.00%
Company/Issuer % to NAV
Fund Details
Monthly AAUM as on 30-Jun-21 : Rs. 340.02 crores
Closing AUM as on 30-Jun-21 : Rs. 336.22 crores `
Fund Managers : Equity : Mr. Dharmesh Kakkad (Managing this fund since May 2018 & Overall 11 years of experience). Debt : Mr. Manish Banthia (Managing this fund since June, 2017 & Overall 16 years of experience). Ritesh Lunawat (Managing this fund since Dec, 2020 & Overall 7 years of experience)
Indicative Investment Horizon: 5 years and above
Inception/Allotment date: 18-Dec-03 Exit Load :
Upto 12 Months 1% of applicable NAV or else Nil.
(w.e.f. 3-Feb-2020)
Total Expense Ratio @@ :Other : 1.05% p. a.Direct : 0.37% p. a.(In addition to the above, the scheme will also incur 0.50% i.e. total weighted average of the expense ratio levied by the underlying schemes.)
NAV (As on 30-Jul-21): Growth Option : Rs. 42.8114 Direct Plan Growth Option : Rs. 44.7877 `̀ `̀` `
`
Application Amount for fresh Subscription :Rs 5,000 (plus in multiples of Re.1)
Min.Addl.Investment :Rs. 500/- and in multiples of Re. 1/-
Investors understand that their principal will be at Moderately High risk
Other Schemes (FOF)
Category
@@ Total Expense Ratio is as on the last business day of the month.Investors may please note that they will be bearing the recurring expenses of the relevant fund of fund scheme in addition to the expenses of the underlying schemes in which the fund of fund scheme makes investment.**The investments in the underlying schemes is in the Direct Option.Refer page no 123 to 131 for details on option, entry load, SWP, STP/Flex STP/Value STP & minimum redemption amount pertaining to the scheme.For Investment Objective : Refer page no. from 162 to 165
1 Year 3 Years 5 Years Since inceptionParticulars
36.3210 32.5413
CAGR (%)
Current Value of
Investment of Rs. 10000
CAGR (%)
Current Value of
Investment of Rs. 10000
CAGR (%)
Current Value of
Investment of Rs. 10000
28.5403
CAGR (%)
Current Value of
Investment of Rs. 10000
10.00
Scheme
NIFTY 50 TRI (35%) + CRISIL Composite Bond Fund Index (65%) (Benchmark)
CRISIL 10 Year Gilt Index (Additional Benchmark)
NAV (Rs.) Per Unit (as on July 30,2021 : 42.8114)
17.92 11786.96 9.57 13156.02 8.44 15000.33 8.60 42811.40
16.86 11681.46 11.97 14039.67 10.00 16116.66 8.78 44110.71
2.23 10222.59 8.71 12846.63 6.50 13708.09 5.79 26988.53
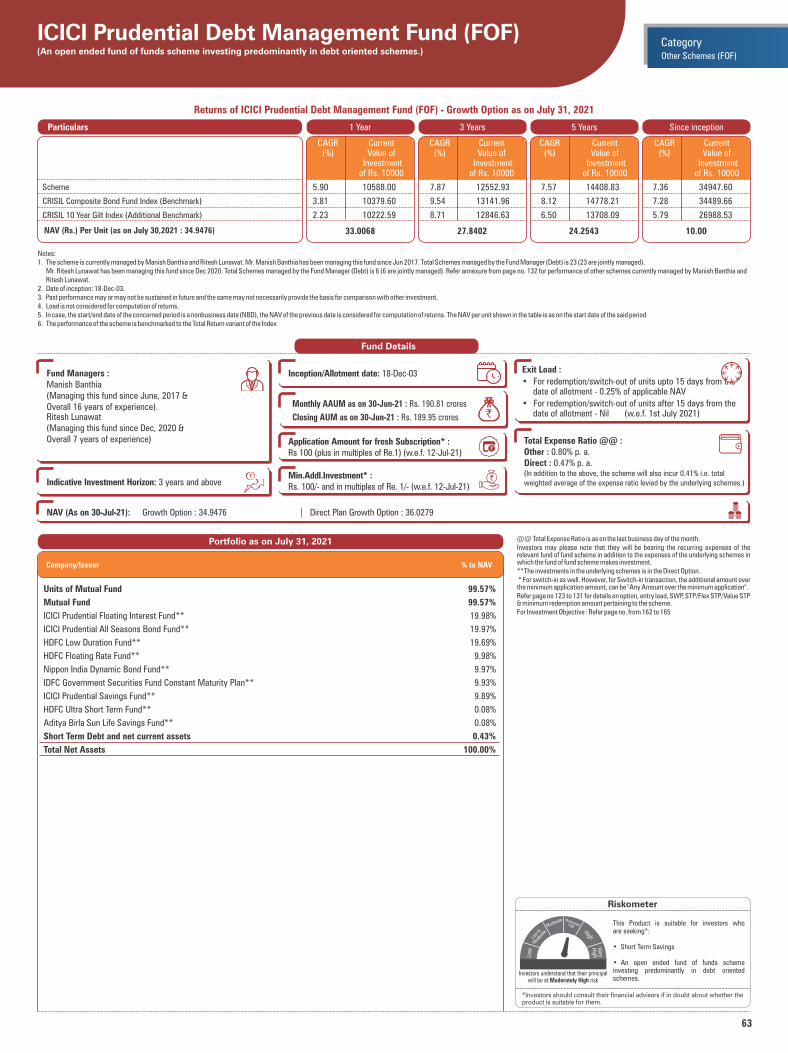
63
Notes:1. The scheme is currently managed by Manish Banthia and Ritesh Lunawat. Mr. Manish Banthia has been managing this fund since Jun 2017. Total Schemes managed by the Fund Manager (Debt) is 23 (23 are jointly managed). Mr. Ritesh Lunawat has been managing this fund since Dec 2020. Total Schemes managed by the Fund Manager (Debt) is 6 (6 are jointly managed). Refer annexure from page no. 132 for performance of other schemes currently managed by Manish Banthia and
Ritesh Lunawat.2. Date of inception: 18-Dec-03.3. Past performance may or may not be sustained in future and the same may not necessarily provide the basis for comparison with other investment.4. Load is not considered for computation of returns.5. In case, the start/end date of the concerned period is a nonbusiness date (NBD), the NAV of the previous date is considered for computation of returns. The NAV per unit shown in the table is as on the start date of the said period6. The performance of the scheme is benchmarked to the Total Return variant of the Index
Returns of ICICI Prudential Debt Management Fund (FOF) - Growth Option as on July 31, 2021
Riskometer
This Product is suitable for investors who are seeking*:
• Short Term Savings
• An open ended fund of funds scheme investing predominantly in debt oriented schemes.
*Investors should consult their financial advisers if in doubt about whether theproduct is suitable for them.
ICICI Prudential Debt Management Fund (FOF) (An open ended fund of funds scheme investing predominantly in debt oriented schemes.)
Portfolio as on July 31, 2021
Units of Mutual Fund 99.57%
Mutual Fund 99.57%
ICICI Prudential Floating Interest Fund** 19.98%
ICICI Prudential All Seasons Bond Fund** 19.97%
HDFC Low Duration Fund** 19.69%
HDFC Floating Rate Fund** 9.98%
Nippon India Dynamic Bond Fund** 9.97%
IDFC Government Securities Fund Constant Maturity Plan** 9.93%
ICICI Prudential Savings Fund** 9.89%
HDFC Ultra Short Term Fund** 0.08%
Aditya Birla Sun Life Savings Fund** 0.08%
Short Term Debt and net current assets 0.43%
Total Net Assets 100.00%
Company/Issuer % to NAV
Fund Details
Monthly AAUM as on 30-Jun-21 : Rs. 190.81 crores
Closing AUM as on 30-Jun-21 : Rs. 189.95 crores `
Fund Managers : Manish Banthia (Managing this fund since June, & 2017Overall years of experience)16 . Ritesh Lunawat (Managing this fund since Dec, 2020 & Overall 7 years of experience)
Indicative Investment Horizon: 3 years and above
Inception/Allotment date: 18-Dec-03 Exit Load :
• For redemption/switch-out of units upto 15 days from the date of allotment - 0.25% of applicable NAV
• For redemption/switch-out of units after 15 days from the date of allotment - Nil (w.e.f. 1st July 2021)
Total Expense Ratio @@ :Other : 0.80% p. a.Direct : 0.47% p. a.(In addition to the above, the scheme will also incur 0.41% i.e. total weighted average of the expense ratio levied by the underlying schemes.)
NAV (As on 30-Jul-21): Growth Option : 34.9476 Direct Plan Growth Option : 36.0279 `̀ `̀` `
`
Application Amount for fresh Subscription* :Rs 100 (plus in multiples of Re.1) (w.e.f. 12-Jul-21)
Min.Addl.Investment* :Rs. 100/- and in multiples of Re. 1/- (w.e.f. 12-Jul-21)
Investors understand that their principal will be at Moderately High risk
Other Schemes (FOF)
Category
@@ Total Expense Ratio is as on the last business day of the month.Investors may please note that they will be bearing the recurring expenses of the relevant fund of fund scheme in addition to the expenses of the underlying schemes in which the fund of fund scheme makes investment.**The investments in the underlying schemes is in the Direct Option. * For switch-in as well. However, for Switch-in transaction, the additional amount over the minimum application amount, can be "Any Amount over the minimum application". Refer page no 123 to 131 for details on option, entry load, SWP, STP/Flex STP/Value STP & minimum redemption amount pertaining to the scheme.For Investment Objective : Refer page no. from 162 to 165
1 Year 3 Years 5 Years Since inceptionParticulars
33.0068 27.8402
CAGR (%)
Current Value of
Investment of Rs. 10000
CAGR (%)
Current Value of
Investment of Rs. 10000
CAGR (%)
Current Value of
Investment of Rs. 10000
24.2543
CAGR (%)
Current Value of
Investment of Rs. 10000
10.00
Scheme
CRISIL Composite Bond Fund Index (Benchmark)
CRISIL 10 Year Gilt Index (Additional Benchmark)
NAV (Rs.) Per Unit (as on July 30,2021 : 34.9476)
5.90 10588.00 7.87 12552.93 7.57 14408.83 7.36 34947.60
3.81 10379.60 9.54 13141.96 8.12 14778.21 7.28 34489.66
2.23 10222.59 8.71 12846.63 6.50 13708.09 5.79 26988.53

64
Notes:1. Different plans shall have different expense structure. The performance details provided herein are of ICICI Prudential Regular Gold Savings Fund.2. The scheme is currently managed by Manish Banthia and Nishit Patel. Mr. Manish Banthia has been managing this fund since Sep 2012. Total Schemes managed by the Fund Manager is 23 (23 are jointly managed). Mr. Nishit Patel has been managing this fund since Dec 2020. Total Schemes managed by the Fund Manager is 22 (22 are jointly managed). Refer annexure from page no. 132 for performance of other schemes currently managed by Manish Banthia and Nishit
Patel.3. Date of inception: 11-Oct-11.4. Past performance may or may not be sustained in future and the same may not necessarily provide the basis for comparison with other investment.5. Load is not considered for computation of returns.6. In case, the start/end date of the concerned period is a nonbusiness date (NBD), the NAV of the previous date is considered for computation of returns. The NAV per unit shown in the table is as on the start date of the said period
Returns of ICICI Prudential Regular Gold Savings Fund - Growth Option as on July 31, 2021
Riskometer
This Product is suitable for investors who are seeking*:
• Long term wealth creation solution
• A fund of funds scheme with the primary objective to generate returns by investing in units of ICICI Prudential Gold ETF.
*Investors should consult their financial advisers if in doubt about whether theproduct is suitable for them.
ICICI Prudential Regular Gold Savings Fund (FOF)(An Open Ended Fund of Funds scheme investing in ICICI Prudential Gold ETF)
For Schemes which have discontinued fresh subscriptions with effect from October 01,2012,the IDCW declared will be compulsorily paid out under the “IDCW payout “option.“Investors may please note that they will be bearing the recurring expenses of the relevant fund of fund scheme in addition to the expenses of the underlying schemes in which the fund of fund scheme makes investment.”@@ Total Expense Ratio is as on the last business day of the month.* applicable for switch-ins as wellFor IDCW History : Refer page no. from 152 to 159, For SIP Returns : Refer page no. from 147 to 150, For Investment Objective : Refer page no. from 160 to 163
Portfolio as on July 31, 2021
Mutual Fund 100.01%
ICICI Prudential Gold ETF 100.01%
Short Term Debt and net current assets -0.01%
Total Net Assets 100.00%
Company/Issuer % to NAV
Fund Details
Fund Managers** :Manish Banthia (Managing this fund since Sep, 2012 & Overall 16 years of experience)Nishit Patel (Managing this fund since Dec, 2020 & Overall 3 years of experience)
Indicative Investment Horizon: 5 years and above Total Expense Ratio @@ :Other : 0.53% p. a.Direct : 0.09% p. a.(In addition to the above, the scheme will also incur 0.50% i.e. the expense ratio levied by the underlying scheme.)Inception/Allotment date: 11-Oct-11
Exit load for Redemption / Switchout :- Lumpsum & SIP / STP / SWP OptionUpto 15 days from allotment - 1% of applicable NAV, more than 15 days - Nil
Monthly AAUM as on 30-Jun-21 : Rs. 548.84 crores
Closing AUM as on 30-Jun-21 : Rs. 557.04 crores`
Min.Addl.Investment :Rs.100 (plus in multiples of Rs. 1/-)
NAV (As on 30-Jul-21): Growth Option : 15.8336 IDCW Option : 15.8336 Direct Plan Growth Option : 16.2142 Direct Plan IDCW Option : 16.2157 `̀ `̀` `
`
IDCW facility : Payout and Reinvestment. Cut off time (Purchase, Switch & Redemption) :3.00 pm
Benchmark : Domestic Gold Price
Application Amount for fresh Subscription :Rs. 100 (plus in multiples of Rs. 1/-)*
Investors understand that their principal will be at Moderately High risk
Other Schemes (FOF)
Category
1 Year 3 Years 5 Years Since inceptionParticulars
17.7552 10.1315
CAGR (%)
Current Value of
Investment of Rs. 10000
CAGR (%)
Current Value of
Investment of Rs. 10000
CAGR (%)
Current Value of
Investment of Rs. 10000
10.7608
CAGR (%)
Current Value of
Investment of Rs. 10000
10.00
Scheme
Domestic Gold Price (Benchmark)
NAV (Rs.) Per Unit (as on July 30,2021 : 15.8336)
-10.85 8917.73 16.05 15628.09 8.02 14714.15 4.80 15833.60
-9.65 9037.83 17.73 16319.22 8.51 15047.35 6.23 18096.24
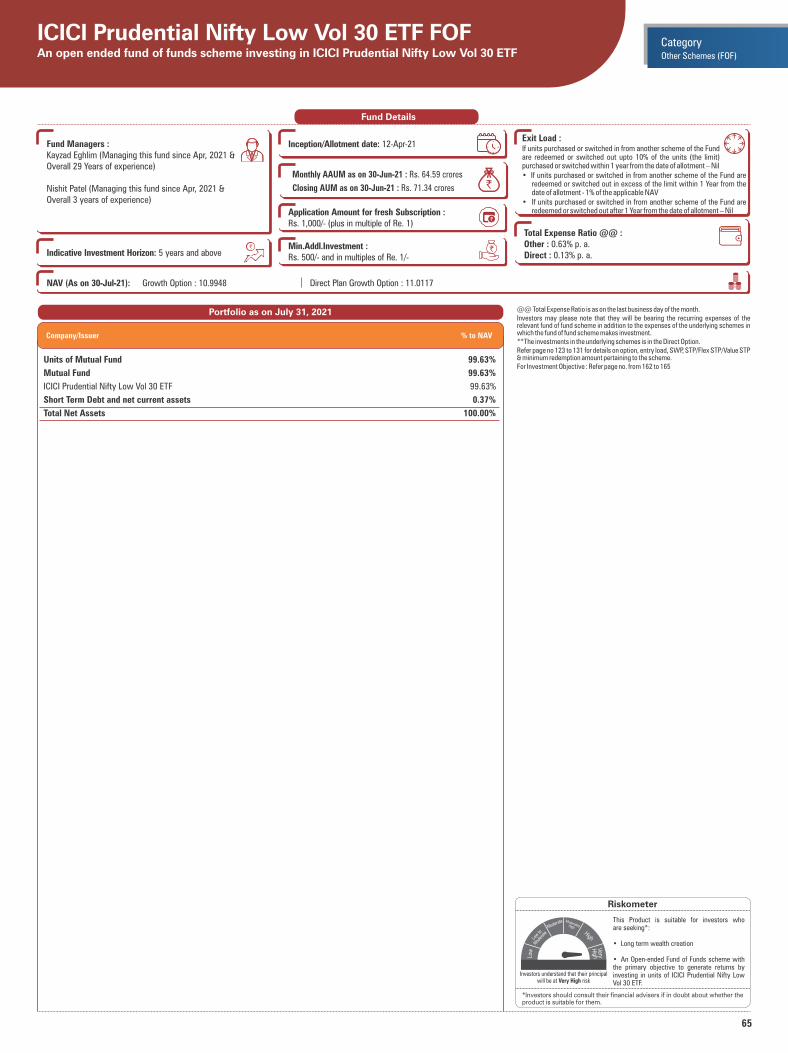
65
Riskometer
This Product is suitable for investors who are seeking*:
• Long term wealth creation
• An Open-ended Fund of Funds scheme with the primary objective to generate returns by investing in units of ICICI Prudential Nifty Low Vol 30 ETF.
*Investors should consult their financial advisers if in doubt about whether theproduct is suitable for them.
ICICI Prudential Nifty Low Vol 30 ETF FOF An open ended fund of funds scheme investing in ICICI Prudential Nifty Low Vol 30 ETF
Portfolio as on July 31, 2021
Units of Mutual Fund 99.63%
Mutual Fund 99.63%
ICICI Prudential Nifty Low Vol 30 ETF 99.63%
Short Term Debt and net current assets 0.37%
Total Net Assets 100.00%
Company/Issuer % to NAV
Fund Details
Monthly AAUM as on 30-Jun-21 : Rs. 64.59 crores
Closing AUM as on 30-Jun-21 : Rs. 71.34 crores `
Fund Managers : Kayzad Eghlim (Managing this fund since Apr, 2021 & Overall 29 Years of experience)
Nishit Patel (Managing this fund since Apr, 2021 &Overall 3 years of experience)
Indicative Investment Horizon: 5 years and above
Inception/Allotment date: 12-Apr-21Exit Load :If units purchased or switched in from another scheme of the Fund are redeemed or switched out upto 10% of the units (the limit) purchased or switched within 1 year from the date of allotment – Nil • If units purchased or switched in from another scheme of the Fund are
redeemed or switched out in excess of the limit within 1 Year from the date of allotment - 1% of the applicable NAV
• If units purchased or switched in from another scheme of the Fund are redeemed or switched out after 1 Year from the date of allotment – Nil
Total Expense Ratio @@ :Other : 0.63% p. a.Direct : 0.13% p. a.
NAV (As on 30-Jul-21): Growth Option : 10.9948 Direct Plan Growth Option : 11.0117 `̀ `̀` `
`
Application Amount for fresh Subscription :Rs. 1,000/- (plus in multiple of Re. 1)
Min.Addl.Investment :Rs. 500/- and in multiples of Re. 1/-
Investors understand that their principal will be at Very High risk
Other Schemes (FOF)
Category
@@ Total Expense Ratio is as on the last business day of the month.Investors may please note that they will be bearing the recurring expenses of the relevant fund of fund scheme in addition to the expenses of the underlying schemes in which the fund of fund scheme makes investment.**The investments in the underlying schemes is in the Direct Option.Refer page no 123 to 131 for details on option, entry load, SWP, STP/Flex STP/Value STP & minimum redemption amount pertaining to the scheme.For Investment Objective : Refer page no. from 162 to 165
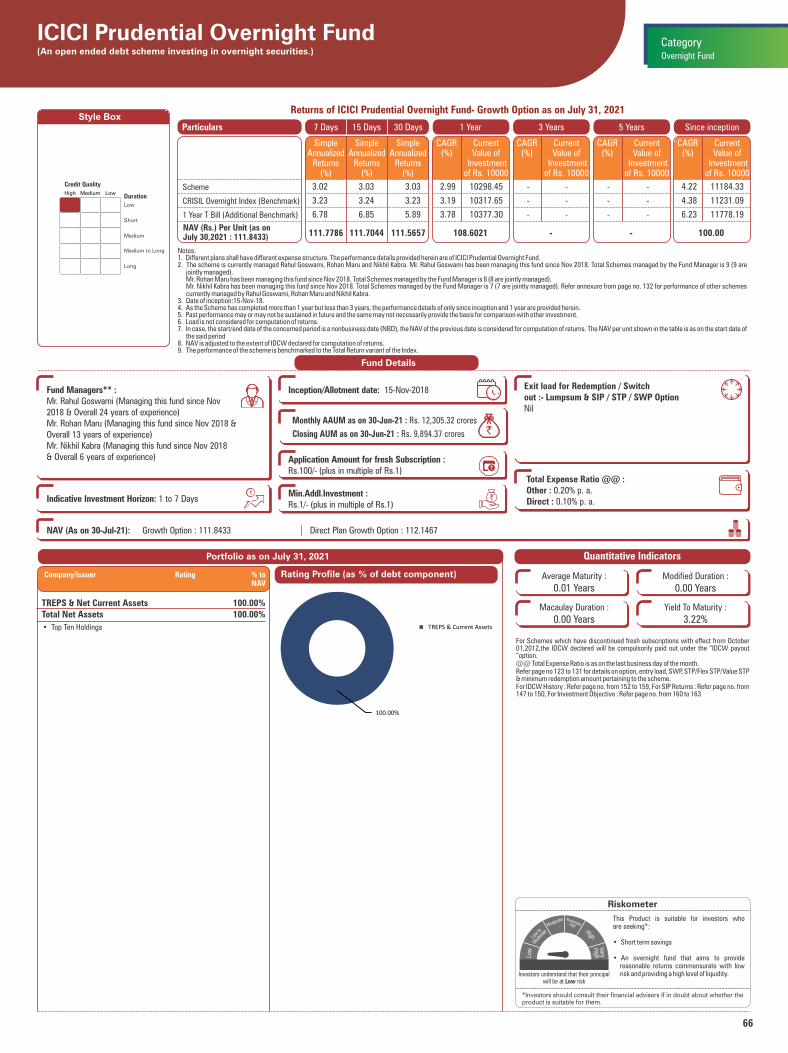
66
ICICI Prudential Overnight Fund(An open ended debt scheme investing in overnight securities.)
Medium to Long
High Medium Low
Low
Short
Medium
Duration
Long
Credit Quality
Style Box
Notes:1. Different plans shall have different expense structure. The performance details provided herein are of ICICI Prudential Overnight Fund.2. The scheme is currently managed Rahul Goswami, Rohan Maru and Nikhil Kabra. Mr. Rahul Goswami has been managing this fund since Nov 2018. Total Schemes managed by the Fund Manager is 9 (9 are
jointly managed). Mr. Rohan Maru has been managing this fund since Nov 2018. Total Schemes managed by the Fund Manager is 8 (8 are jointly managed). Mr. Nikhil Kabra has been managing this fund since Nov 2018. Total Schemes managed by the Fund Manager is 7 (7 are jointly managed). Refer annexure from page no. 132 for performance of other schemes
currently managed by Rahul Goswami, Rohan Maru and Nikhil Kabra.3. Date of inception:15-Nov-18.4. As the Scheme has completed more than 1 year but less than 3 years, the performance details of only since inception and 1 year are provided herein.5. Past performance may or may not be sustained in future and the same may not necessarily provide the basis for comparison with other investment.6. Load is not considered for computation of returns.7. In case, the start/end date of the concerned period is a nonbusiness date (NBD), the NAV of the previous date is considered for computation of returns. The NAV per unit shown in the table is as on the start date of
the said period8. NAV is adjusted to the extent of IDCW declared for computation of returns.9. The performance of the scheme is benchmarked to the Total Return variant of the Index.
Returns of ICICI Prudential Overnight Fund- Growth Option as on July 31, 2021
1 Year 3 Years 5 Years Since inceptionParticulars
108.6021 -
Scheme
CRISIL Overnight Index (Benchmark)
1 Year T Bill (Additional Benchmark)
NAV (Rs.) Per Unit (as on July 30,2021 : 111.8433)
CAGR (%)
Current Value of
Investment of Rs. 10000
CAGR (%)
Current Value of
Investment of Rs. 10000
CAGR (%)
Current Value of
Investment of Rs. 10000
-
CAGR (%)
Current Value of
Investment of Rs. 10000
100.00
Portfolio as on July 31, 2021
Fund Details
Quantitative Indicators
Average Maturity :
0.01 YearsModified Duration :
0.00 Years
Macaulay Duration :
0.00 YearsYield To Maturity :
3.22%
For Schemes which have discontinued fresh subscriptions with effect from October 01,2012,the IDCW declared will be compulsorily paid out under the “IDCW payout “option.@@ Total Expense Ratio is as on the last business day of the month.Refer page no 123 to 131 for details on option, entry load, SWP, STP/Flex STP/Value STP & minimum redemption amount pertaining to the scheme.For IDCW History : Refer page no. from 152 to 159, For SIP Returns : Refer page no. from 147 to 150, For Investment Objective : Refer page no. from 160 to 163
Riskometer
This Product is suitable for investors who are seeking*:
• Short term savings
• An overnight fund that aims to provide reasonable returns commensurate with low risk and providing a high level of liquidity.
*Investors should consult their financial advisers if in doubt about whether theproduct is suitable for them.
Monthly AAUM as on 30-Jun-21 : Rs. 12,305.32 crores
Closing AUM as on 30-Jun-21 : Rs. 9,894.37 crores `
Fund Managers** :Mr. Rahul Goswami (Managing this fund since Nov 2018 & Overall 24 years of experience)Mr. Rohan Maru (Managing this fund since Nov 2018 & Overall 13 years of experience)Mr. Nikhil Kabra (Managing this fund since Nov 2018 & Overall 6 years of experience)
Indicative Investment Horizon: 1 to 7 Days
Inception/Allotment date: 15-Nov-2018 Exit load for Redemption / Switchout :- Lumpsum & SIP / STP / SWP OptionNil
Total Expense Ratio @@ :Other : 0.20% p. a.Direct : 0.10% p. a.
7 Days
111.7044111.7786 111.5657
15 Days 30 Days
Overnight Fund
Category
Rating Profile (as % of debt component)
• Top Ten Holdings
TREPS & Net Current Assets 100.00%Total Net Assets 100.00%
Company/Issuer Rating % to NAV
100.00%
TREPS & Current Assets
NAV (As on 30-Jul-21): Growth Option : 111.8433 Direct Plan Growth Option : 112.1467 `̀ `̀` `
`
Application Amount for fresh Subscription :Rs.100/- (plus in multiple of Rs.1)
Min.Addl.Investment :Rs.1/- (plus in multiple of Rs.1)
3.02 3.03 3.03 2.99 10298.45 - - - - 4.22 11184.33
3.23 3.24 3.23 3.19 10317.65 - - - - 4.38 11231.09
6.78 6.85 5.89 3.78 10377.30 - - - - 6.23 11778.19
Investors understand that their principal will be at Low risk
SimpleAnnualized
Returns(%)
SimpleAnnualized
Returns(%)
SimpleAnnualized
Returns(%)
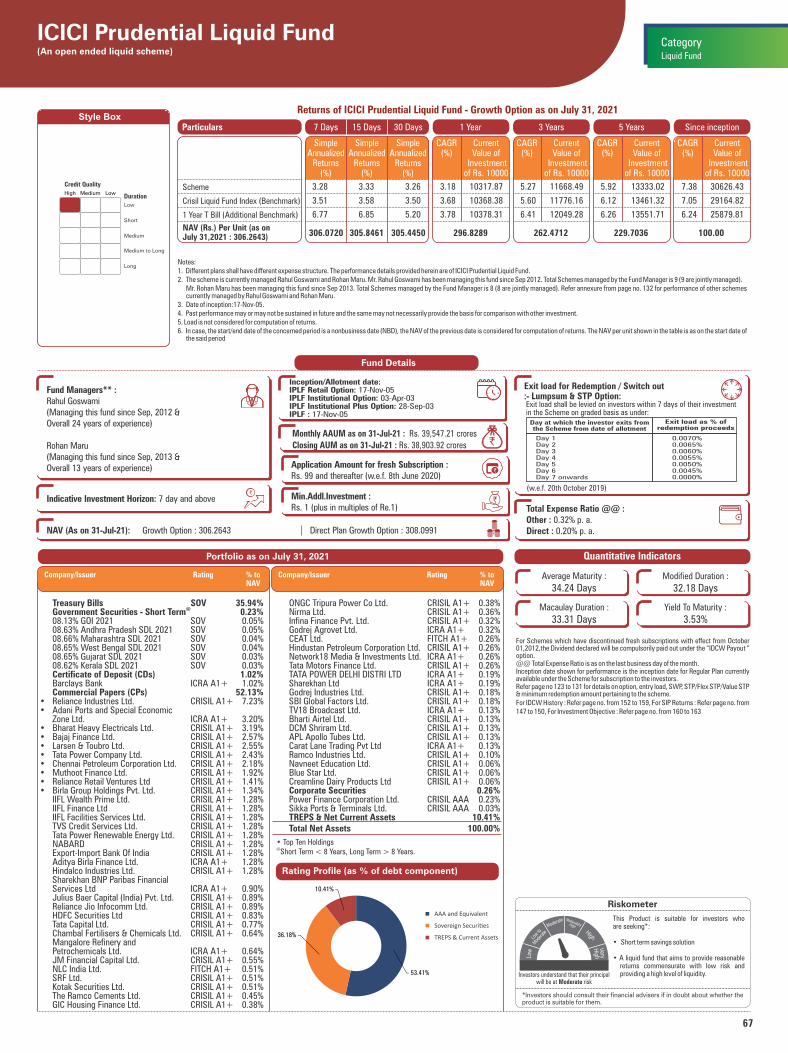
67
ICICI Prudential Liquid Fund(An open ended liquid scheme)
Medium to Long
High Medium Low
Low
Short
Medium
Duration
Long
Credit Quality
Style Box
Notes:1. Different plans shall have different expense structure. The performance details provided herein are of ICICI Prudential Liquid Fund.2. The scheme is currently managed Rahul Goswami and Rohan Maru. Mr. Rahul Goswami has been managing this fund since Sep 2012. Total Schemes managed by the Fund Manager is 9 (9 are jointly managed). Mr. Rohan Maru has been managing this fund since Sep 2013. Total Schemes managed by the Fund Manager is 8 (8 are jointly managed). Refer annexure from page no. 132 for performance of other schemes
currently managed by Rahul Goswami and Rohan Maru.3. Date of inception:17-Nov-05.4. Past performance may or may not be sustained in future and the same may not necessarily provide the basis for comparison with other investment.5. Load is not considered for computation of returns.6. In case, the start/end date of the concerned period is a nonbusiness date (NBD), the NAV of the previous date is considered for computation of returns. The NAV per unit shown in the table is as on the start date of
the said period
Returns of ICICI Prudential Liquid Fund - Growth Option as on July 31, 2021
1 Year 3 Years 5 Years Since inceptionParticulars
296.8289 262.4712
Scheme
Crisil Liquid Fund Index (Benchmark)
1 Year T Bill (Additional Benchmark)
NAV (Rs.) Per Unit (as on July 31,2021 : 306.2643)
CAGR (%)
Current Value of
Investment of Rs. 10000
CAGR (%)
Current Value of
Investment of Rs. 10000
CAGR (%)
Current Value of
Investment of Rs. 10000
229.7036
CAGR (%)
Current Value of
Investment of Rs. 10000
100.00
Company/Issuer Rating % to NAV
Portfolio as on July 31, 2021
Fund Details
Quantitative Indicators
Average Maturity :
34.24 DaysModified Duration :
32.18 Days
Macaulay Duration :
33.31 DaysYield To Maturity :
3.53%
For Schemes which have discontinued fresh subscriptions with effect from October 01,2012,the Dividend declared will be compulsorily paid out under the “IDCW Payout “ option.@@ Total Expense Ratio is as on the last business day of the month.Inception date shown for performance is the inception date for Regular Plan currently available under the Scheme for subscription to the investors.Refer page no 123 to 131 for details on option, entry load, SWP, STP/Flex STP/Value STP & minimum redemption amount pertaining to the scheme.For IDCW History : Refer page no. from 152 to 159, For SIP Returns : Refer page no. from 147 to 150, For Investment Objective : Refer page no. from 160 to 163
Riskometer
This Product is suitable for investors who are seeking*:
• Short term savings solution
• A liquid fund that aims to provide reasonable returns commensurate with low risk and providing a high level of liquidity.
*Investors should consult their financial advisers if in doubt about whether theproduct is suitable for them.
Monthly AAUM as on 31-Jul-21 : Rs. 39,547.21 croresClosing AUM as on 31-Jul-21 : Rs. 38,903.92 crores
Fund Managers** :Rahul Goswami (Managing this fund since Sep, 2012 & Overall 24 years of experience)
Rohan Maru(Managing this fund since Sep, 2013 & Overall 13 years of experience)
Indicative Investment Horizon: 7 day and above
Inception/Allotment date:IPLF Retail Option: 17-Nov-05IPLF Institutional Option: 03-Apr-03IPLF Institutional Plus Option: 28-Sep-03IPLF : 17-Nov-05
Exit load for Redemption / Switch out:- Lumpsum & STP Option:
Total Expense Ratio @@ :Other : 0.32% p. a.Direct : 0.20% p. a.
`
Company/Issuer Rating % to NAV
7 Days
305.8461306.0720 305.4450
15 Days 30 Days
(w.e.f. 20th October 2019)
Exit load shall be levied on investors within 7 days of their investment in the Scheme on graded basis as under:
Liquid Fund
Category
NAV (As on 31-Jul-21): Growth Option : 306.2643 Direct Plan Growth Option : 308.0991 `̀ `̀` `
`
Application Amount for fresh Subscription :Rs. 99 and thereafter (w.e.f. 8th June 2020)
Min.Addl.Investment :Rs. 1 (plus in multiples of Re.1)
3.28 3.33 3.26 3.18 10317.87 5.27 11668.49 5.92 13333.02 7.38 30626.43
3.51 3.58 3.50 3.68 10368.38 5.60 11776.16 6.12 13461.32 7.05 29164.82
6.77 6.85 5.20 3.78 10378.31 6.41 12049.28 6.26 13551.71 6.24 25879.81
Investors understand that their principal will be at Moderate risk
Treasury Bills SOV 35.94%@ Government Securities - Short Term 0.23%
08.13% GOI 2021 SOV 0.05% 08.63% Andhra Pradesh SDL 2021 SOV 0.05% 08.66% Maharashtra SDL 2021 SOV 0.04% 08.65% West Bengal SDL 2021 SOV 0.04% 08.65% Gujarat SDL 2021 SOV 0.03% 08.62% Kerala SDL 2021 SOV 0.03% Certificate of Deposit (CDs) 1.02% Barclays Bank ICRA A1+ 1.02% Commercial Papers (CPs) 52.13%• Reliance Industries Ltd. CRISIL A1+ 7.23%• Adani Ports and Special Economic Zone Ltd. ICRA A1+ 3.20%• Bharat Heavy Electricals Ltd. CRISIL A1+ 3.19%• Bajaj Finance Ltd. CRISIL A1+ 2.57%• Larsen & Toubro Ltd. CRISIL A1+ 2.55%• Tata Power Company Ltd. CRISIL A1+ 2.43%• Chennai Petroleum Corporation Ltd. CRISIL A1+ 2.18%• Muthoot Finance Ltd. CRISIL A1+ 1.92%• Reliance Retail Ventures Ltd CRISIL A1+ 1.41%• Birla Group Holdings Pvt. Ltd. CRISIL A1+ 1.34% IIFL Wealth Prime Ltd. CRISIL A1+ 1.28% IIFL Finance Ltd CRISIL A1+ 1.28% IIFL Facilities Services Ltd. CRISIL A1+ 1.28% TVS Credit Services Ltd. CRISIL A1+ 1.28% Tata Power Renewable Energy Ltd. CRISIL A1+ 1.28% NABARD CRISIL A1+ 1.28% Export-Import Bank Of India CRISIL A1+ 1.28% Aditya Birla Finance Ltd. ICRA A1+ 1.28% Hindalco Industries Ltd. CRISIL A1+ 1.28% Sharekhan BNP Paribas Financial Services Ltd ICRA A1+ 0.90% Julius Baer Capital (India) Pvt. Ltd. CRISIL A1+ 0.89% Reliance Jio Infocomm Ltd. CRISIL A1+ 0.89% HDFC Securities Ltd CRISIL A1+ 0.83% Tata Capital Ltd. CRISIL A1+ 0.77% Chambal Fertilisers & Chemicals Ltd. CRISIL A1+ 0.64% Mangalore Refinery and Petrochemicals Ltd. ICRA A1+ 0.64% JM Financial Capital Ltd. CRISIL A1+ 0.55% NLC India Ltd. FITCH A1+ 0.51% SRF Ltd. CRISIL A1+ 0.51% Kotak Securities Ltd. CRISIL A1+ 0.51% The Ramco Cements Ltd. CRISIL A1+ 0.45% GIC Housing Finance Ltd. CRISIL A1+ 0.38%
ONGC Tripura Power Co Ltd. CRISIL A1+ 0.38% Nirma Ltd. CRISIL A1+ 0.36% Infina Finance Pvt. Ltd. CRISIL A1+ 0.32% Godrej Agrovet Ltd. ICRA A1+ 0.32% CEAT Ltd. FITCH A1+ 0.26% Hindustan Petroleum Corporation Ltd. CRISIL A1+ 0.26% Network18 Media & Investments Ltd. ICRA A1+ 0.26% Tata Motors Finance Ltd. CRISIL A1+ 0.26% TATA POWER DELHI DISTRI LTD ICRA A1+ 0.19% Sharekhan Ltd ICRA A1+ 0.19% Godrej Industries Ltd. CRISIL A1+ 0.18% SBI Global Factors Ltd. CRISIL A1+ 0.18% TV18 Broadcast Ltd. ICRA A1+ 0.13% Bharti Airtel Ltd. CRISIL A1+ 0.13% DCM Shriram Ltd. CRISIL A1+ 0.13% APL Apollo Tubes Ltd. CRISIL A1+ 0.13% Carat Lane Trading Pvt Ltd ICRA A1+ 0.13% Ramco Industries Ltd. CRISIL A1+ 0.10% Navneet Education Ltd. CRISIL A1+ 0.06% Blue Star Ltd. CRISIL A1+ 0.06% Creamline Dairy Products Ltd CRISIL A1+ 0.06% Corporate Securities 0.26% Power Finance Corporation Ltd. CRISIL AAA 0.23% Sikka Ports & Terminals Ltd. CRISIL AAA 0.03% TREPS & Net Current Assets 10.41% Total Net Assets 100.00%
• Top Ten Holdings@
Short Term < 8 Years, Long Term > 8 Years.
Rating Profile (as % of debt component)
AAA and Equivalent
Sovereign Securi�es
TREPS & Current Assets
SimpleAnnualized
Returns(%)
SimpleAnnualized
Returns(%)
SimpleAnnualized
Returns(%)
53.41%
36.18%
10.41%

68
ICICI Prudential Money Market Fund(An open ended debt scheme investing in money market instruments)
Medium to Long
High Medium Low
Low
Short
Medium
Duration
Long
Credit Quality
Style Box
Notes:1. Different plans shall have different expense structure. The performance details provided herein are of ICICI Prudential Money Market Fund.2. The scheme is currently managed by Rahul Goswami and Nikhil Kabra. Mr. Rahul Goswami has been managing this fund since Oct 2013. Total Schemes managed by the Fund Manager is 9 (9 are jointly
managed). Mr. Nikhil Kabra has been managing this fund since Aug 2016. Total Schemes managed by the Fund Manager is 7 (7 are jointly managed). Refer annexure from page no. 132 for performance of other schemes
currently managed by Rahul Goswami and Nikhil Kabra.3. Date of inception: 08-Mar-06.4. Past performance may or may not be sustained in future and the same may not necessarily provide the basis for comparison with other investment.5. Load is not considered for computation of returns.6. In case, the start/end date of the concerned period is a nonbusiness date (NBD), the NAV of the previous date is considered for computation of returns. The NAV per unit shown in the table is as on the start date of
the said period7. The benchmark of this scheme has been revised from CRISIL Liquid Fund to CRISIL Money Market Index w.e.f. February 24, 2020.
Returns of ICICI Prudential Money Market Fund - Growth Option as on July 31, 2021
1 Year 3 Years 5 Years Since inceptionParticulars
285.5889 245.3748
Scheme
Crisil Money Market Index (Benchmark)
1 Year T Bill (Additional Benchmark)
NAV (Rs.) Per Unit (as on July 30,2021 : 296.7492)
CAGR (%)
Current Value of
Investment of Rs. 10000
CAGR (%)
Current Value of
Investment of Rs. 10000
CAGR (%)
Current Value of
Investment of Rs. 10000
214.6062
CAGR (%)
Current Value of
Investment of Rs. 10000
100.00
Portfolio as on July 31, 2021
Fund Details
Quantitative Indicators
Average Maturity :
106.87 DaysModified Duration :
101.46 Days
Macaulay Duration :
105.00 DaysYield To Maturity :
3.74%
For Schemes which have discontinued fresh subscriptions with effect from October 01,2012,the Dividend declared will be compulsorily paid out under the “IDCW Payout “option.@@ Total Expense Ratio is as on the last business day of the month.Inception date shown for performance is the inception date for Regular Plan currently available under the Scheme for subscription to the investors.Refer page no 123 to 131 for details on option, entry load, SWP, STP/Flex STP/Value STP & minimum redemption amount pertaining to the scheme.For IDCW History : Refer page no. from 152 to 159, For SIP Returns : Refer page no. from 147 to 150, For Investment Objective : Refer page no. from 160 to 163
Riskometer
This Product is suitable for investors who are seeking*:
• Short term savings
• A money market scheme that seeks to provide reasonable returns, commensurate with low risk while providing a high level of liquidity
*Investors should consult their financial advisers if in doubt about whether theproduct is suitable for them.
Monthly AAUM as on 31-Jul-21 : Rs. 13,544.51 crores
Closing AUM as on 31-Jul-21 : Rs. 13,931.16 crores `
Fund Managers** :Rahul Goswami (Managing this fund since Oct, 2013 & Overall 24 years of experience)
Nikhil Kabra(Managing this fund since Aug, 2016 & Overall 6 years of experience)
Indicative Investment Horizon: 30 days and above
Inception/Allotment date:
IPMMF Retail Option : 08-Mar-06
IPMMF : 08-Mar-06
NAV (As on 30-Jul-21):Growth Option : 296.7492Direct Plan Growth Option : 299.1025
`̀ `̀` `
`
Exit Load : Nil
Total Expense Ratio @@ :Other : 0.33% p. a.Direct : 0.21% p. a.
7 Days
296.2846296.5409 295.7671
15 Days 30 Days
Money Market Fund
Category
• Top Ten Holdings@Short Term < 8 Years, Long Term > 8 Years.
Company/Issuer Rating % to NAV
Rating Profile (as % of debt component)
AAA and Equivalent
Sovereign Securi�es
TREPS & Current Assets
Application Amount for fresh Subscription :Rs.500 (plus in multiples of Re.1)
Min.Addl.Investment :Rs.1 (plus in multiples of Re.1) (w.e.f. 01-Oct-16)
Company/Issuer Rating % to NAV
3.66 3.82 4.04 3.92 10390.78 6.54 12093.71 6.70 13827.62 7.32 29674.92
4.47 4.62 4.62 4.23 10421.69 6.33 12020.59 6.61 13769.50 7.44 30190.31
6.78 6.85 5.89 3.78 10377.30 6.41 12048.11 6.27 13550.39 6.31 25653.14
Investors understand that their principal will be at Moderate risk
Treasury Bills SOV 9.24%@ Government Securities - Short Term 18.03%
• 08.20% GOI 2022 SOV 10.09%
• 08.79% GOI 2021 SOV 7.90%
08.55% Rajasthan SDL 2021 SOV 0.04%
Certificate of Deposit (CDs) 6.96%
• Axis Bank Ltd. CRISIL A1+ 6.25%
SBM Bank (India) Ltd. ICRA A1+ 0.36%
SBM Bank (India) Ltd. ICRA A1+ 0.35%
Commercial Papers (CPs) 56.25%
• NABARD CRISIL A1+ 5.72%
• Tata Teleservices (Maharashtra) Ltd. CRISIL A1+ 4.53%
• Panatone Finvest Ltd. CRISIL A1+ 4.20%
• Reliance Industries Ltd. CRISIL A1+ 4.10%
• Tata Motors Ltd. CRISIL A1+ 4.06%
• Cadila Healthcare Ltd. CRISIL A1+ 3.74%
• HDFC Ltd. CRISIL A1+ 3.56%
Tata Teleservices Ltd. CRISIL A1+ 3.34%
LIC Housing Finance Ltd. CRISIL A1+ 2.84%
Can Fin Homes Ltd. ICRA A1+ 2.83%
Mahindra & Mahindra Financial
Services Ltd. CRISIL A1+ 2.11%
Infina Finance Pvt. Ltd. CRISIL A1+ 1.92%
NTPC Ltd. CRISIL A1+ 1.79%
Barclays Investments & Loans (India)
Ltd. CRISIL A1+ 1.64%
Kotak Mahindra Investments Ltd. CRISIL A1+ 1.59%
Sharekhan Ltd ICRA A1+ 1.59%
Indian Oil Corporation Ltd. ICRA A1+ 1.43%
Sharekhan BNP Paribas Financial
Services Ltd ICRA A1+ 1.43%
Muthoot Finance Ltd. CRISIL A1+ 0.96%
National Housing Bank CRISIL A1+ 0.89%
Axis Finance Ltd. CRISIL A1+ 0.71%
Cholamandalam Investment And
Finance Company Ltd. CRISIL A1+ 0.70%
Standard Chartered Investment &
Loan (India) Ltd. CRISIL A1+ 0.36%
Tata Motors Finance Ltd. CRISIL A1+ 0.18%
TREPS & Net Current Assets 9.53%
Total Net Assets 100.00%
SimpleAnnualized
Returns(%)
SimpleAnnualized
Returns(%)
SimpleAnnualized
Returns(%)
63.21%
27.26%
9.53%
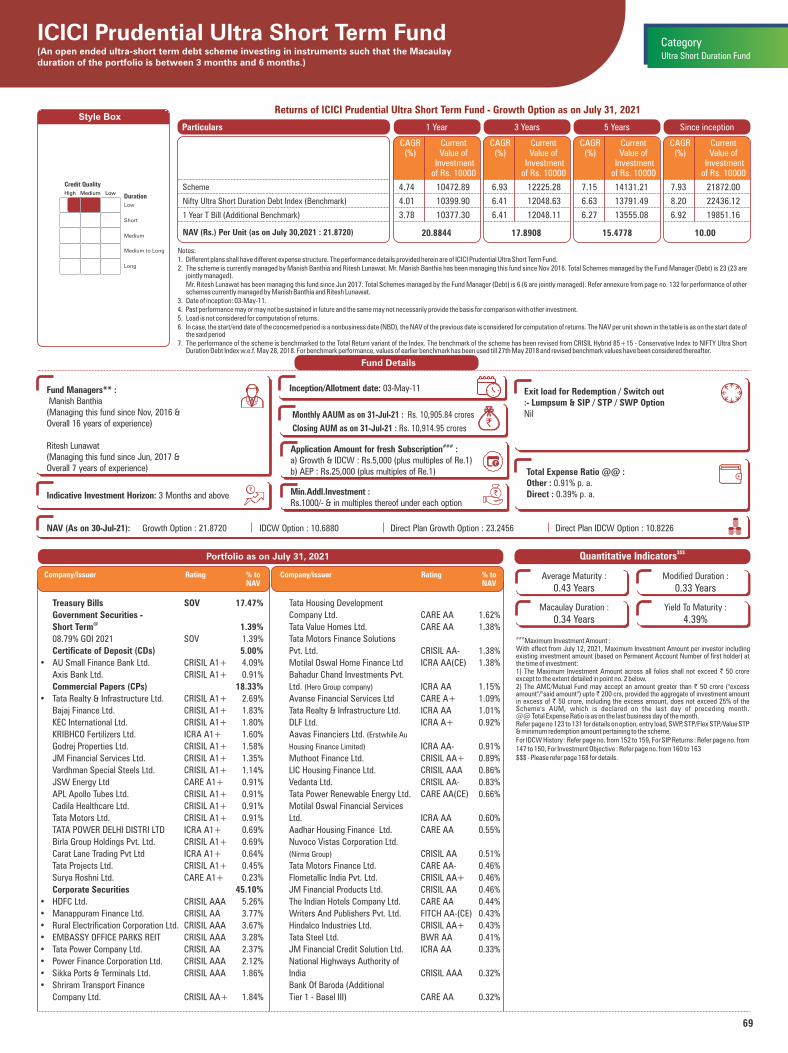
69
ICICI Prudential Ultra Short Term Fund(An open ended ultra-short term debt scheme investing in instruments such that the Macaulay duration of the portfolio is between 3 months and 6 months.)
Medium to Long
High Medium Low
Low
Short
Medium
Duration
Long
Credit Quality
Style Box
Notes:1. Different plans shall have different expense structure. The performance details provided herein are of ICICI Prudential Ultra Short Term Fund.2. The scheme is currently managed by Manish Banthia and Ritesh Lunawat. Mr. Manish Banthia has been managing this fund since Nov 2016. Total Schemes managed by the Fund Manager (Debt) is 23 (23 are
jointly managed). Mr. Ritesh Lunawat has been managing this fund since Jun 2017. Total Schemes managed by the Fund Manager (Debt) is 6 (6 are jointly managed). Refer annexure from page no. 132 for performance of other
schemes currently managed by Manish Banthia and Ritesh Lunawat.3. Date of inception: 03-May-11.4. Past performance may or may not be sustained in future and the same may not necessarily provide the basis for comparison with other investment.5. Load is not considered for computation of returns.6. In case, the start/end date of the concerned period is a nonbusiness date (NBD), the NAV of the previous date is considered for computation of returns. The NAV per unit shown in the table is as on the start date of
the said period7. The performance of the scheme is benchmarked to the Total Return variant of the Index. The benchmark of the scheme has been revised from CRISIL Hybrid 85+15 - Conservative Index to NIFTY Ultra Short
Duration Debt Index w.e.f. May 28, 2018. For benchmark performance, values of earlier benchmark has been used till 27th May 2018 and revised benchmark values have been considered thereafter.
Returns of ICICI Prudential Ultra Short Term Fund - Growth Option as on July 31, 2021
Treasury Bills SOV 17.47%
Government Securities - @ Short Term 1.39%
08.79% GOI 2021 SOV 1.39%
Certificate of Deposit (CDs) 5.00%
• AU Small Finance Bank Ltd. CRISIL A1+ 4.09%
Axis Bank Ltd. CRISIL A1+ 0.91%
Commercial Papers (CPs) 18.33%
• Tata Realty & Infrastructure Ltd. CRISIL A1+ 2.69%
Bajaj Finance Ltd. CRISIL A1+ 1.83%
KEC International Ltd. CRISIL A1+ 1.80%
KRIBHCO Fertilizers Ltd. ICRA A1+ 1.60%
Godrej Properties Ltd. CRISIL A1+ 1.58%
JM Financial Services Ltd. CRISIL A1+ 1.35%
Vardhman Special Steels Ltd. CRISIL A1+ 1.14%
JSW Energy Ltd CARE A1+ 0.91%
APL Apollo Tubes Ltd. CRISIL A1+ 0.91%
Cadila Healthcare Ltd. CRISIL A1+ 0.91%
Tata Motors Ltd. CRISIL A1+ 0.91%
TATA POWER DELHI DISTRI LTD ICRA A1+ 0.69%
Birla Group Holdings Pvt. Ltd. CRISIL A1+ 0.69%
Carat Lane Trading Pvt Ltd ICRA A1+ 0.64%
Tata Projects Ltd. CRISIL A1+ 0.45%
Surya Roshni Ltd. CARE A1+ 0.23%
Corporate Securities 45.10%
• HDFC Ltd. CRISIL AAA 5.26%
• Manappuram Finance Ltd. CRISIL AA 3.77%
• Rural Electrification Corporation Ltd. CRISIL AAA 3.67%
• EMBASSY OFFICE PARKS REIT CRISIL AAA 3.28%
• Tata Power Company Ltd. CRISIL AA 2.37%
• Power Finance Corporation Ltd. CRISIL AAA 2.12%
• Sikka Ports & Terminals Ltd. CRISIL AAA 1.86%
• Shriram Transport Finance
Company Ltd. CRISIL AA+ 1.84%
Tata Housing Development
Company Ltd. CARE AA 1.62%
Tata Value Homes Ltd. CARE AA 1.38%
Tata Motors Finance Solutions
Pvt. Ltd. CRISIL AA- 1.38%
Motilal Oswal Home Finance Ltd ICRA AA(CE) 1.38%
Bahadur Chand Investments Pvt.
Ltd. (Hero Group company) ICRA AA 1.15%
Avanse Financial Services Ltd CARE A+ 1.09%
Tata Realty & Infrastructure Ltd. ICRA AA 1.01%
DLF Ltd. ICRA A+ 0.92%
Aavas Financiers Ltd. (Erstwhile Au
Housing Finance Limited) ICRA AA- 0.91%
Muthoot Finance Ltd. CRISIL AA+ 0.89%
LIC Housing Finance Ltd. CRISIL AAA 0.86%
Vedanta Ltd. CRISIL AA- 0.83%
Tata Power Renewable Energy Ltd. CARE AA(CE) 0.66%
Motilal Oswal Financial Services
Ltd. ICRA AA 0.60%
Aadhar Housing Finance Ltd. CARE AA 0.55%
Nuvoco Vistas Corporation Ltd.
CRISIL AA 0.51%(Nirma Group)
Tata Motors Finance Ltd. CARE AA- 0.46%
Flometallic India Pvt. Ltd. CRISIL AA+ 0.46%
JM Financial Products Ltd. CRISIL AA 0.46%
The Indian Hotels Company Ltd. CARE AA 0.44%
Writers And Publishers Pvt. Ltd. FITCH AA-(CE) 0.43%
Hindalco Industries Ltd. CRISIL AA+ 0.43%
Tata Steel Ltd. BWR AA 0.41%
JM Financial Credit Solution Ltd. ICRA AA 0.33%
National Highways Authority of
India CRISIL AAA 0.32%
Bank Of Baroda (Additional
Tier 1 - Basel III) CARE AA 0.32%
Portfolio as on July 31, 2021
Fund Details
$$$Quantitative Indicators
Average Maturity :
0.43 YearsModified Duration :
0.33 Years
Macaulay Duration :
0.34 YearsYield To Maturity :
4.39%
###Maximum Investment Amount :
With effect from July 12, 2021, Maximum Investment Amount per investor including existing investment amount (based on Permanent Account Number of first holder) at the time of investment: 1) The Maximum Investment Amount across all folios shall not exceed ` 50 crore except to the extent detailed in point no. 2 below. 2) The AMC/Mutual Fund may accept an amount greater than ` 50 crore ("excess amount"/"said amount") upto ̀ 200 crs, provided the aggregate of investment amount in excess of ` 50 crore, including the excess amount, does not exceed 25% of the Scheme's AUM, which is declared on the last day of preceding month. @@ Total Expense Ratio is as on the last business day of the month.Refer page no 123 to 131 for details on option, entry load, SWP, STP/Flex STP/Value STP & minimum redemption amount pertaining to the scheme.For IDCW History : Refer page no. from 152 to 159, For SIP Returns : Refer page no. from 147 to 150, For Investment Objective : Refer page no. from 160 to 163$$$ - Please refer page 168 for details.
1 Year 3 Years 5 Years Since inceptionParticulars
20.8844 17.8908NAV (Rs.) Per Unit (as on July 30,2021 : 21.8720)
CAGR (%)
Current Value of
Investment of Rs. 10000
CAGR (%)
Current Value of
Investment of Rs. 10000
CAGR (%)
Current Value of
Investment of Rs. 10000
15.4778
CAGR (%)
Current Value of
Investment of Rs. 10000
10.00
4.74 10472.89 6.93 12225.28 7.15 14131.21 7.93 21872.00
4.01 10399.90 6.41 12048.63 6.63 13791.49 8.20 22436.12
3.78 10377.30 6.41 12048.11 6.27 13555.08 6.92 19851.16
Scheme
Nifty Ultra Short Duration Debt Index (Benchmark)
1 Year T Bill (Additional Benchmark)
Ultra Short Duration Fund
Category
Company/Issuer Rating % to NAV
Company/Issuer Rating % to NAV
Monthly AAUM as on 31-Jul-21 : Rs. 10,905.84 crores
Closing AUM as on 31-Jul-21 : Rs. 10,914.95 crores`
Fund Managers** : Manish Banthia(Managing this fund since Nov, 2016 & Overall 16 years of experience)
Ritesh Lunawat(Managing this fund since Jun, 2017 & Overall 7 years of experience)
Indicative Investment Horizon: 3 Months and above
Inception/Allotment date: 03-May-11
Total Expense Ratio @@ :Other : 0.91% p. a.Direct : 0.39% p. a.
Exit load for Redemption / Switch out:- Lumpsum & SIP / STP / SWP OptionNil
###Application Amount for fresh Subscription :a) Growth & IDCW : Rs.5,000 (plus multiples of Re.1)b) AEP : Rs.25,000 (plus multiples of Re.1)
Min.Addl.Investment :Rs.1000/- & in multiples thereof under each option
NAV (As on 30-Jul-21): Growth Option : 21.8720 IDCW Option : 10.6880 Direct Plan Growth Option : 23.2456 Direct Plan IDCW Option : 10.8226 `̀ `̀` `
`
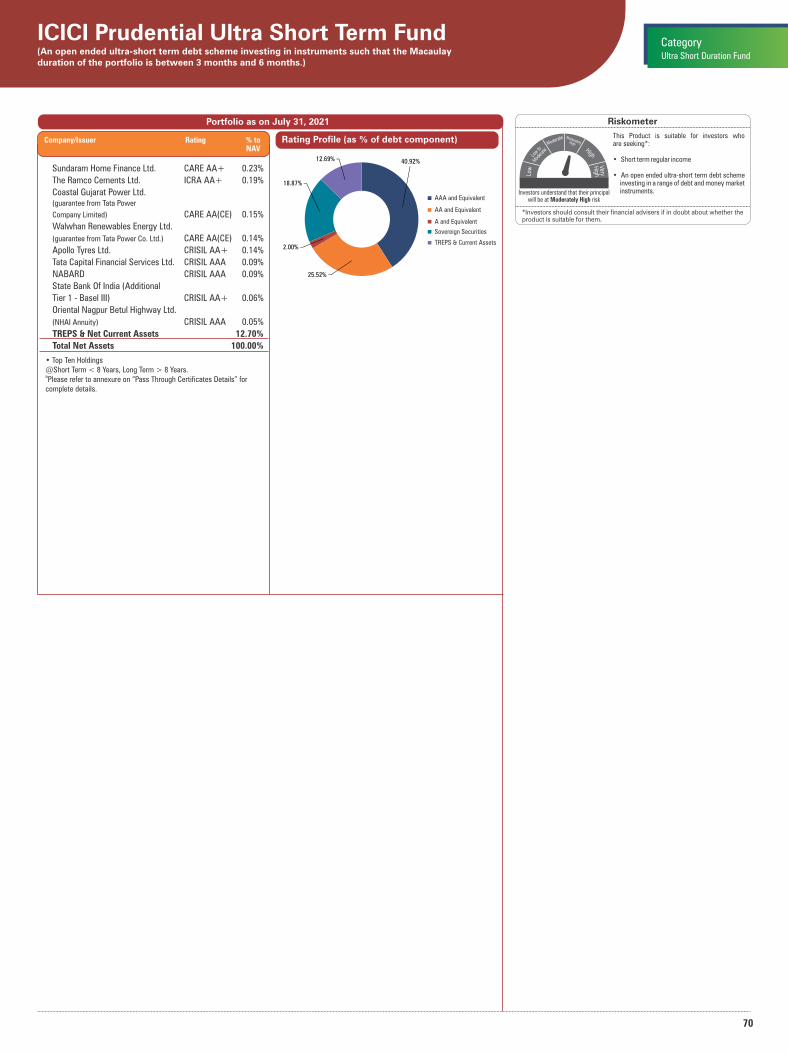
70
Company/Issuer Rating % to NAV
Portfolio as on July 31, 2021
Sundaram Home Finance Ltd. CARE AA+ 0.23%
The Ramco Cements Ltd. ICRA AA+ 0.19%
Coastal Gujarat Power Ltd. (guarantee from Tata Power
Company Limited) CARE AA(CE) 0.15%
Walwhan Renewables Energy Ltd.
(guarantee from Tata Power Co. Ltd.) CARE AA(CE) 0.14%
Apollo Tyres Ltd. CRISIL AA+ 0.14%
Tata Capital Financial Services Ltd. CRISIL AAA 0.09%
NABARD CRISIL AAA 0.09%
State Bank Of India (Additional
Tier 1 - Basel III) CRISIL AA+ 0.06%
Oriental Nagpur Betul Highway Ltd.
CRISIL AAA 0.05%(NHAI Annuity)
TREPS & Net Current Assets 12.70%
Total Net Assets 100.00%
ICICI Prudential Ultra Short Term Fund(An open ended ultra-short term debt scheme investing in instruments such that the Macaulay duration of the portfolio is between 3 months and 6 months.)
Ultra Short Duration Fund
Category
Riskometer
This Product is suitable for investors who are seeking*:
• Short term regular income
• An open ended ultra-short term debt scheme investing in a range of debt and money market instruments.
*Investors should consult their financial advisers if in doubt about whether theproduct is suitable for them.
Rating Profile (as % of debt component)
AAA and Equivalent
AA and Equivalent
A and Equivalent
TREPS & Current Assets
Sovereign Securities
• Top Ten Holdings@Short Term < 8 Years, Long Term > 8 Years.&Please refer to annexure on “Pass Through Certificates Details” for
complete details.
Investors understand that their principal will be at Moderately High risk
40.92%
25.52%
2.00%
18.87%
12.69%

71
ICICI Prudential Savings Fund(An open ended low duration debt scheme investing in instruments such that the Macaulay duration of the portfolio is between 6 months and 12 months.)
Medium to Long
High Medium Low
Low
Short
Medium
Duration
Long
Credit Quality
Style Box
Notes:1. Different plans shall have different expense structure. The performance details provided herein are of ICICI Prudential Savings Fund.2. The scheme is currently managed Rahul Goswami and Rohan Maru. Mr. Rahul Goswami has been managing this fund since Sep 2012. Total Schemes managed by the Fund Manager is 9 (9 are jointly managed). Mr. Rohan Maru has been managing this fund since Sep 2013. Total Schemes managed by the Fund Manager is 8 (8 are jointly managed). Refer annexure from page no. 132 for performance of other schemes
currently managed by Rahul Goswami and Rohan Maru.3. Date of inception: 27-Sep-02.4. Past performance may or may not be sustained in future and the same may not necessarily provide the basis for comparison with other investment.5. Load is not considered for computation of returns.6. In case, the start/end date of the concerned period is a nonbusiness date (NBD), the NAV of the previous date is considered for computation of returns. The NAV per unit shown in the table is as on the start date of
the said period
Returns of ICICI Prudential Savings Fund - Growth Option as on July 31, 2021
Portfolio as on July 31, 2021
Fund Details
$$$Quantitative Indicators
Average Maturity :
3.68 YearsModified Duration :
0.82 Years
Macaulay Duration :
0.87 YearsYield To Maturity :
4.52%
For Schemes which have discontinued fresh subscriptions with effect from October 01,2012,the Dividend declared will be compulsorily paid out under the “IDCW Payout “option.With effect from May 28, 2018, the benchmark of ICICI Prudential Savings Fund has been changed from CRISIL Liquid Fund Index to Nifty Low Duration Debt Index* applicable for switch-ins as wellThe AUM/AAUM figures have been adjusted with respect to investments made by other schemes of the Mutual Fund into aforesaid scheme. The aggregate value of such interscheme investments amounts to Rs. 100.41 crores.Refer page no 123 to 131 for details on option, entry load, SWP, STP/Flex STP/Value STP & minimum redemption amount pertaining to the scheme.For IDCW History : Refer page no. from 152 to 159, For SIP Returns : Refer page no. from 147 to 150, For Investment Objective : Refer page no. from 160 to 163$$$ - Please refer page 168 for details.
Riskometer
This Product is suitable for investors who are seeking*:
• Short term savings• An open ended low duration debt scheme that
aims to maximise income by investing in debt and money market instruments while maintaining optimum balance of yield, safety and liquidity.
*Investors should consult their financial advisers if in doubt about whether theproduct is suitable for them.
1 Year 3 Years 5 Years Since inceptionParticulars
402.6238 339.9416NAV (Rs.) Per Unit (as on July 30,2021 : 423.6198)
CAGR (%)
Current Value of
Investment of Rs. 10000
CAGR (%)
Current Value of
Investment of Rs. 10000
CAGR (%)
Current Value of
Investment of Rs. 10000
294.9888
CAGR (%)
Current Value of
Investment of Rs. 10000
10.00
5.23 10521.48 7.61 12461.55 7.50 14360.54 7.96 42361.98
4.51 10450.03 6.85 12199.88 6.91 13972.08 7.65 40145.61
3.78 10377.30 6.41 12048.11 6.27 13555.08 6.01 30042.39
Scheme
Nifty Low Duration Debt Index (Benchmark)
1 Year T Bill (Additional Benchmark)
Monthly AAUM as on 31-Jul-21 : Rs. 34,758.38 crores
Closing AUM as on 31-Jul-21 : Rs. 35,482.76 crores `
Fund Managers** :Rahul Goswami (Managing this fund since Sep, 2012 & Overall 24 years of experience)
Rohan Maru (Managing this fund since Sep, 2013 & Overall 13 years of experience)
Indicative Investment Horizon: 60 days and above
Inception/Allotment date: 27-Sep-02 NAV (As on 30-Jul-21):Growth Option : 423.6198Direct Plan Growth Option : 427.5292
`̀ `̀` `
`
Total Expense Ratio @@ :Other : 0.52% p. a.Direct : 0.41% p. a.
Exit load for Redemption / Switch out:- Lumpsum & SIP / STP / SWP OptionNil
Low Duration Fund
Category
Treasury Bills SOV 14.57% Government Securities 36.01%
@ Short Term 16.46%• 05.18 % GOI Floater 2024 SOV 4.94%• 05.09% GOI 2022 SOV 1.99% 06.79% GOI 2027 SOV 1.30% 08.20% GOI 2022 SOV 1.14% 05.93% Rajasthan SDL 2025 SOV 0.83% 07.59% GOI 2026 SOV 0.75% 05.15% GOI 2025 SOV 0.73% 06.84% GOI 2022 SOV 0.73% 08.20% GOI 2025 SOV 0.54% 06.58% Gujarat SDL 2027 SOV 0.48% 06.18% Gujarat SDL 2026 SOV 0.45% 8.6% Goa SDL 2023 SOV 0.39% 06.69% Madhya Pradesh SDL 2025 SOV 0.29% 06.35% Bihar SDL 2023 SOV 0.29% 07.32% GOI 2024 SOV 0.27% 07.27% GOI 2026 SOV 0.25% 05.88% Gujarat SDL 2025 SOV 0.21% 08.21% Haryana SDL 2024 SOV 0.18% 06.90% GOI 2026 SOV 0.14% 07.16% GOI 2023 SOV 0.13% 08.57% Puducherry SDL 2023 SOV 0.12% 08.58% Meghalaya SDL 2023 SOV 0.09% 7.00% FERT GOI 2022 SOV 0.06% 08.65% GOI 2023 SOV 0.03% 08.91% West Bengal SDL 2022 SOV 0.03% 08.95% West Bengal SDL 2022 SOV 0.03% 08.27% Rajasthan SDL 2022 SOV 0.02% 08.21% Haryana SDL 2022 SOV 0.02% 08.15% GOI 2022 SOV 0.01% 08.45% Jammu & Kashmir SDL 2023 SOV 0.01% 07.63% Telangana SDL 2023 SOV 0.01% 08.76% Maharashtra SDL 2022 SOV ^ 08.60% Kerala SDL 2021 SOV ^ 7.37% GOI 2023 SOV ^ 08.39% Rajasthan SDL 2022 SOV ^
Long Term 19.55%@
• 04.7 % GOI Floater 2033 SOV 18.89% 06.10% GOI Floater 2031 SOV 0.66% Commercial Papers (CPs) 13.27%• Panatone Finvest Ltd. CRISIL A1+ 2.47%• Reliance Industries Ltd. CRISIL A1+ 2.09%• NABARD CRISIL A1+ 1.41%• Bajaj Finance Ltd. CRISIL A1+ 1.40% LIC Housing Finance Ltd. CRISIL A1+ 0.96% Aditya Birla Finance Ltd. ICRA A1+ 0.84% Larsen & Toubro Ltd. CRISIL A1+ 0.70% Bharat Heavy Electricals Ltd. CRISIL A1+ 0.70% Tata Teleservices (Maharashtra) Ltd. CRISIL A1+ 0.62% Sharekhan BNP Paribas Financial Services Ltd ICRA A1+ 0.56% Tata Teleservices Ltd. CRISIL A1+ 0.46% Tata Motors Finance Ltd. CRISIL A1+ 0.42% Tata Motors Ltd. CRISIL A1+ 0.35% Infina Finance Pvt. Ltd. CRISIL A1+ 0.28% Corporate Securities 24.05%• State Bank Of India (Tier II - Basel III) CRISIL AAA 2.73%• State Bank Of India (Additional Tier 1 - Basel III) CRISIL AA+ 1.65%• HDFC Ltd. CRISIL AAA 1.49% Pipeline Infrastructure Pvt Ltd. CRISIL AAA 1.38%(Sponsored by Brookfield)
Axis Bank Ltd. (Additional Tier 1 - Basel III) CRISIL AA+ 1.20% Rural Electrification Corporation Ltd. CRISIL AAA 1.07% NABARD CRISIL AAA 1.04% Bharti Telecom Ltd. CRISIL AA+ 1.04% EMBASSY OFFICE PARKS REIT CRISIL AAA 0.99% Sikka Ports & Terminals Ltd. CRISIL AAA 0.95% John Deere Financial India Pvt. Ltd. CRISIL AAA 0.79% Tata Capital Financial Services Ltd. ICRA AAA 0.78% Grasim Industries Ltd. CRISIL AAA 0.75%
Company/Issuer Rating % to NAV
Company/Issuer Rating % to NAV
Application Amount for fresh Subscription :Rs.100 (plus in multiples of Re.1)*
Min.Addl.Investment :Rs.100 (plus in multiples of Re.1)
Investors understand that their principal will be at Low to Moderate risk
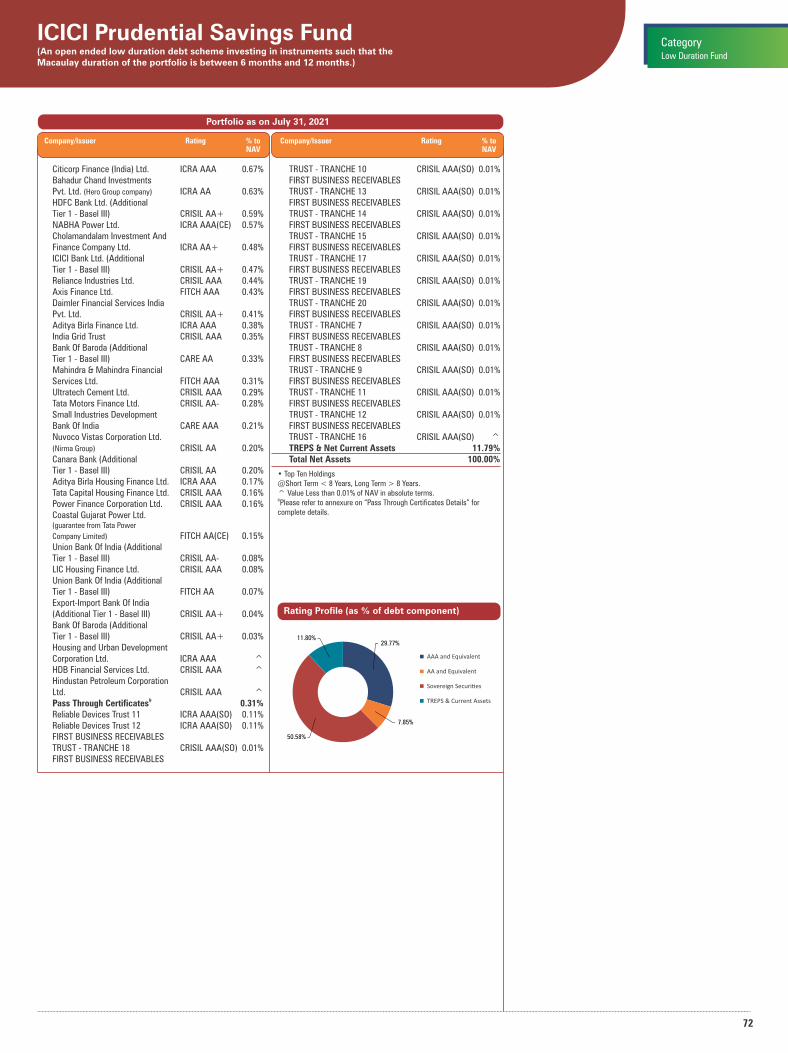
72
AAA and Equivalent
AA and Equivalent
Sovereign Securi�es
TREPS & Current Assets
Portfolio as on July 31, 2021
ICICI Prudential Savings Fund(An open ended low duration debt scheme investing in instruments such that the Macaulay duration of the portfolio is between 6 months and 12 months.)
Low Duration Fund
Category
Citicorp Finance (India) Ltd. ICRA AAA 0.67% Bahadur Chand Investments Pvt. Ltd. (Hero Group company) ICRA AA 0.63% HDFC Bank Ltd. (Additional Tier 1 - Basel III) CRISIL AA+ 0.59% NABHA Power Ltd. ICRA AAA(CE) 0.57% Cholamandalam Investment And Finance Company Ltd. ICRA AA+ 0.48% ICICI Bank Ltd. (Additional Tier 1 - Basel III) CRISIL AA+ 0.47% Reliance Industries Ltd. CRISIL AAA 0.44% Axis Finance Ltd. FITCH AAA 0.43% Daimler Financial Services India Pvt. Ltd. CRISIL AA+ 0.41% Aditya Birla Finance Ltd. ICRA AAA 0.38% India Grid Trust CRISIL AAA 0.35% Bank Of Baroda (Additional Tier 1 - Basel III) CARE AA 0.33% Mahindra & Mahindra Financial Services Ltd. FITCH AAA 0.31% Ultratech Cement Ltd. CRISIL AAA 0.29% Tata Motors Finance Ltd. CRISIL AA- 0.28% Small Industries Development Bank Of India CARE AAA 0.21% Nuvoco Vistas Corporation Ltd. (Nirma Group) CRISIL AA 0.20% Canara Bank (Additional Tier 1 - Basel III) CRISIL AA 0.20% Aditya Birla Housing Finance Ltd. ICRA AAA 0.17% Tata Capital Housing Finance Ltd. CRISIL AAA 0.16% Power Finance Corporation Ltd. CRISIL AAA 0.16% Coastal Gujarat Power Ltd. (guarantee from Tata Power
Company Limited) FITCH AA(CE) 0.15% Union Bank Of India (Additional Tier 1 - Basel III) CRISIL AA- 0.08% LIC Housing Finance Ltd. CRISIL AAA 0.08% Union Bank Of India (Additional Tier 1 - Basel III) FITCH AA 0.07% Export-Import Bank Of India (Additional Tier 1 - Basel III) CRISIL AA+ 0.04% Bank Of Baroda (Additional Tier 1 - Basel III) CRISIL AA+ 0.03% Housing and Urban Development Corporation Ltd. ICRA AAA ^ HDB Financial Services Ltd. CRISIL AAA ^ Hindustan Petroleum Corporation Ltd. CRISIL AAA ^ Pass Through Certificates 0.31%&
Reliable Devices Trust 11 ICRA AAA(SO) 0.11% Reliable Devices Trust 12 ICRA AAA(SO) 0.11% FIRST BUSINESS RECEIVABLES TRUST - TRANCHE 18 CRISIL AAA(SO) 0.01% FIRST BUSINESS RECEIVABLES
TRUST - TRANCHE 10 CRISIL AAA(SO) 0.01% FIRST BUSINESS RECEIVABLES TRUST - TRANCHE 13 CRISIL AAA(SO) 0.01% FIRST BUSINESS RECEIVABLES TRUST - TRANCHE 14 CRISIL AAA(SO) 0.01% FIRST BUSINESS RECEIVABLES TRUST - TRANCHE 15 CRISIL AAA(SO) 0.01% FIRST BUSINESS RECEIVABLES TRUST - TRANCHE 17 CRISIL AAA(SO) 0.01% FIRST BUSINESS RECEIVABLES TRUST - TRANCHE 19 CRISIL AAA(SO) 0.01% FIRST BUSINESS RECEIVABLES TRUST - TRANCHE 20 CRISIL AAA(SO) 0.01% FIRST BUSINESS RECEIVABLES TRUST - TRANCHE 7 CRISIL AAA(SO) 0.01% FIRST BUSINESS RECEIVABLES TRUST - TRANCHE 8 CRISIL AAA(SO) 0.01% FIRST BUSINESS RECEIVABLES TRUST - TRANCHE 9 CRISIL AAA(SO) 0.01% FIRST BUSINESS RECEIVABLES TRUST - TRANCHE 11 CRISIL AAA(SO) 0.01% FIRST BUSINESS RECEIVABLES TRUST - TRANCHE 12 CRISIL AAA(SO) 0.01% FIRST BUSINESS RECEIVABLES TRUST - TRANCHE 16 CRISIL AAA(SO) ^ TREPS & Net Current Assets 11.79% Total Net Assets 100.00%
Rating Profile (as % of debt component)
Company/Issuer Rating % to NAV
Company/Issuer Rating % to NAV
• Top Ten Holdings@Short Term < 8 Years, Long Term > 8 Years.^ Value Less than 0.01% of NAV in absolute terms.&Please refer to annexure on “Pass Through Certificates Details” for
complete details.
29.77%
7.85%
50.58%
11.80%
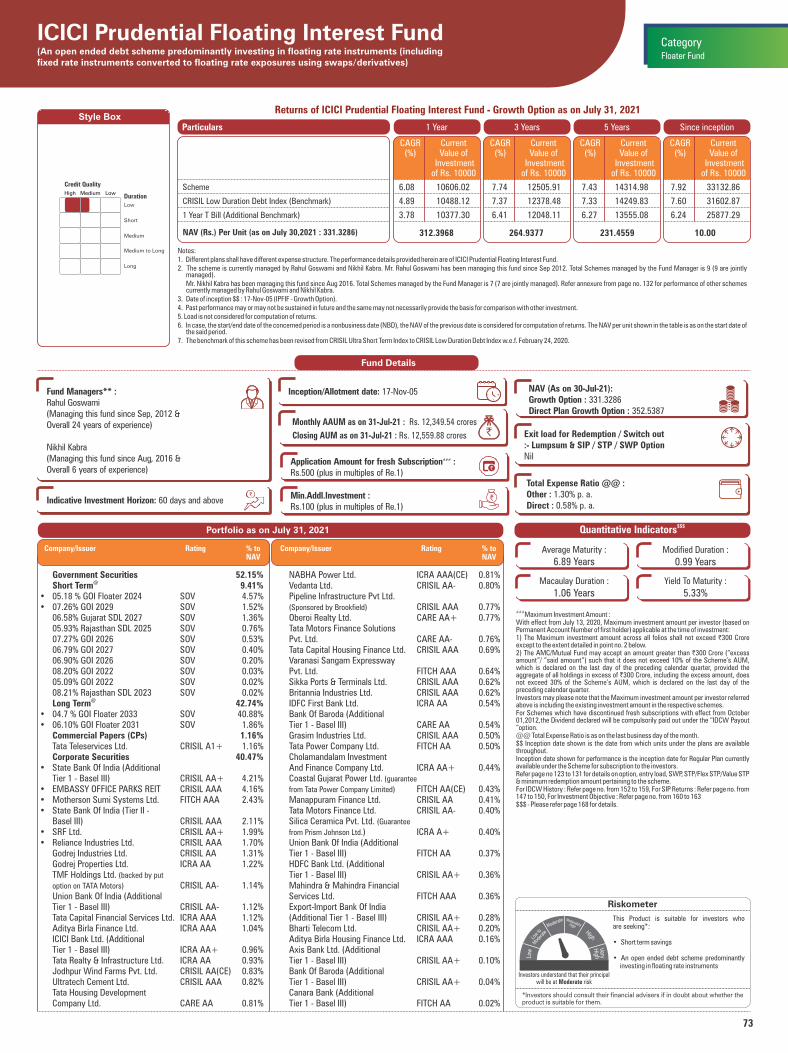
73
ICICI Prudential Floating Interest Fund(An open ended debt scheme predominantly investing in floating rate instruments (including fixed rate instruments converted to floating rate exposures using swaps/derivatives)
Medium to Long
High Medium Low
Low
Short
Medium
Duration
Long
Credit Quality
Style Box
Notes:1. Different plans shall have different expense structure. The performance details provided herein are of ICICI Prudential Floating Interest Fund.2. The scheme is currently managed by Rahul Goswami and Nikhil Kabra. Mr. Rahul Goswami has been managing this fund since Sep 2012. Total Schemes managed by the Fund Manager is 9 (9 are jointly
managed). Mr. Nikhil Kabra has been managing this fund since Aug 2016. Total Schemes managed by the Fund Manager is 7 (7 are jointly managed). Refer annexure from page no. 132 for performance of other schemes
currently managed by Rahul Goswami and Nikhil Kabra.3. Date of inception $$ : 17-Nov-05 (IPFIF - Growth Option).4. Past performance may or may not be sustained in future and the same may not necessarily provide the basis for comparison with other investment.5. Load is not considered for computation of returns.6. In case, the start/end date of the concerned period is a nonbusiness date (NBD), the NAV of the previous date is considered for computation of returns. The NAV per unit shown in the table is as on the start date of
the said period.7. The benchmark of this scheme has been revised from CRISIL Ultra Short Term Index to CRISIL Low Duration Debt Index w.e.f. February 24, 2020.
Returns of ICICI Prudential Floating Interest Fund - Growth Option as on July 31, 2021
Fund Details
$$$Quantitative Indicators
Average Maturity :
6.89 YearsModified Duration :
0.99 Years
Macaulay Duration :
1.06 YearsYield To Maturity :
5.33%
###Maximum Investment Amount :
With effect from July 13, 2020, Maximum investment amount per investor (based on Permanent Account Number of first holder) applicable at the time of investment:1) The Maximum investment amount across all folios shall not exceed `300 Crore except to the extent detailed in point no. 2 below.2) The AMC/Mutual Fund may accept an amount greater than `300 Crore (“excess amount”/ ”said amount”) such that it does not exceed 10% of the Scheme’s AUM, which is declared on the last day of the preceding calendar quarter, provided the aggregate of all holdings in excess of `300 Crore, including the excess amount, does not exceed 30% of the Scheme’s AUM, which is declared on the last day of the preceding calendar quarter.Investors may please note that the Maximum investment amount per investor referred above is including the existing investment amount in the respective schemes.For Schemes which have discontinued fresh subscriptions with effect from October 01,2012,the Dividend declared will be compulsorily paid out under the “IDCW Payout “option.@@ Total Expense Ratio is as on the last business day of the month.$$ Inception date shown is the date from which units under the plans are available throughout.Inception date shown for performance is the inception date for Regular Plan currently available under the Scheme for subscription to the investors.Refer page no 123 to 131 for details on option, entry load, SWP, STP/Flex STP/Value STP & minimum redemption amount pertaining to the scheme.For IDCW History : Refer page no. from 152 to 159, For SIP Returns : Refer page no. from 147 to 150, For Investment Objective : Refer page no. from 160 to 163$$$ - Please refer page 168 for details.
Riskometer
This Product is suitable for investors who are seeking*:
• Short term savings
• An open ended debt scheme predominantly investing in floating rate instruments
*Investors should consult their financial advisers if in doubt about whether theproduct is suitable for them.
1 Year 3 Years 5 Years Since inceptionParticulars
312.3968 264.9377NAV (Rs.) Per Unit (as on July 30,2021 : 331.3286)
CAGR (%)
Current Value of
Investment of Rs. 10000
CAGR (%)
Current Value of
Investment of Rs. 10000
CAGR (%)
Current Value of
Investment of Rs. 10000
231.4559
CAGR (%)
Current Value of
Investment of Rs. 10000
10.00
6.08 10606.02 7.74 12505.91 7.43 14314.98 7.92 33132.86
4.89 10488.12 7.37 12378.48 7.33 14249.83 7.60 31602.87
3.78 10377.30 6.41 12048.11 6.27 13555.08 6.24 25877.29
Scheme
CRISIL Low Duration Debt Index (Benchmark)
1 Year T Bill (Additional Benchmark)
Monthly AAUM as on 31-Jul-21 : Rs. 12,349.54 crores
Closing AUM as on 31-Jul-21 : Rs. 12,559.88 crores `
Fund Managers** :Rahul Goswami (Managing this fund since Sep, 2012 & Overall 24 years of experience)
Nikhil Kabra(Managing this fund since Aug, 2016 & Overall 6 years of experience)
Indicative Investment Horizon: 60 days and above
Inception/Allotment date: 17-Nov-05
Floater Fund
Category
Portfolio as on July 31, 2021
Government Securities 52.15% Short Term 9.41%@
• 05.18 % GOI Floater 2024 SOV 4.57%• 07.26% GOI 2029 SOV 1.52% 06.58% Gujarat SDL 2027 SOV 1.36% 05.93% Rajasthan SDL 2025 SOV 0.76% 07.27% GOI 2026 SOV 0.53% 06.79% GOI 2027 SOV 0.40% 06.90% GOI 2026 SOV 0.20% 08.20% GOI 2022 SOV 0.03% 05.09% GOI 2022 SOV 0.02% 08.21% Rajasthan SDL 2023 SOV 0.02% Long Term 42.74%@
• 04.7 % GOI Floater 2033 SOV 40.88%• 06.10% GOI Floater 2031 SOV 1.86% Commercial Papers (CPs) 1.16% Tata Teleservices Ltd. CRISIL A1+ 1.16% Corporate Securities 40.47%• State Bank Of India (Additional Tier 1 - Basel III) CRISIL AA+ 4.21%• EMBASSY OFFICE PARKS REIT CRISIL AAA 4.16%• Motherson Sumi Systems Ltd. FITCH AAA 2.43%• State Bank Of India (Tier II - Basel III) CRISIL AAA 2.11%• SRF Ltd. CRISIL AA+ 1.99%• Reliance Industries Ltd. CRISIL AAA 1.70% Godrej Industries Ltd. CRISIL AA 1.31% Godrej Properties Ltd. ICRA AA 1.22% TMF Holdings Ltd. (backed by put
option on TATA Motors) CRISIL AA- 1.14% Union Bank Of India (Additional Tier 1 - Basel III) CRISIL AA- 1.12% Tata Capital Financial Services Ltd. ICRA AAA 1.12% Aditya Birla Finance Ltd. ICRA AAA 1.04% ICICI Bank Ltd. (Additional Tier 1 - Basel III) ICRA AA+ 0.96% Tata Realty & Infrastructure Ltd. ICRA AA 0.93% Jodhpur Wind Farms Pvt. Ltd. CRISIL AA(CE) 0.83% Ultratech Cement Ltd. CRISIL AAA 0.82% Tata Housing Development Company Ltd. CARE AA 0.81%
NABHA Power Ltd. ICRA AAA(CE) 0.81% Vedanta Ltd. CRISIL AA- 0.80% Pipeline Infrastructure Pvt Ltd. CRISIL AAA 0.77%(Sponsored by Brookfield)
Oberoi Realty Ltd. CARE AA+ 0.77% Tata Motors Finance Solutions Pvt. Ltd. CARE AA- 0.76% Tata Capital Housing Finance Ltd. CRISIL AAA 0.69% Varanasi Sangam Expressway Pvt. Ltd. FITCH AAA 0.64% Sikka Ports & Terminals Ltd. CRISIL AAA 0.62% Britannia Industries Ltd. CRISIL AAA 0.62% IDFC First Bank Ltd. ICRA AA 0.54% Bank Of Baroda (Additional Tier 1 - Basel III) CARE AA 0.54% Grasim Industries Ltd. CRISIL AAA 0.50% Tata Power Company Ltd. FITCH AA 0.50% Cholamandalam Investment And Finance Company Ltd. ICRA AA+ 0.44% Coastal Gujarat Power Ltd. (guarantee
from Tata Power Company Limited) FITCH AA(CE) 0.43% Manappuram Finance Ltd. CRISIL AA 0.41% Tata Motors Finance Ltd. CRISIL AA- 0.40% Silica Ceramica Pvt. Ltd. (Guarantee
from Prism Johnson Ltd.) ICRA A+ 0.40% Union Bank Of India (Additional Tier 1 - Basel III) FITCH AA 0.37% HDFC Bank Ltd. (Additional Tier 1 - Basel III) CRISIL AA+ 0.36% Mahindra & Mahindra Financial Services Ltd. FITCH AAA 0.36% Export-Import Bank Of India (Additional Tier 1 - Basel III) CRISIL AA+ 0.28% Bharti Telecom Ltd. CRISIL AA+ 0.20% Aditya Birla Housing Finance Ltd. ICRA AAA 0.16% Axis Bank Ltd. (Additional Tier 1 - Basel III) CRISIL AA+ 0.10% Bank Of Baroda (Additional Tier 1 - Basel III) CRISIL AA+ 0.04% Canara Bank (Additional Tier 1 - Basel III) FITCH AA 0.02%
Company/Issuer Rating % to NAV
Company/Issuer Rating % to NAV
NAV (As on 30-Jul-21):Growth Option : 331.3286Direct Plan Growth Option : 352.5387
`̀ `̀` `
`
Total Expense Ratio @@ :Other : 1.30% p. a.Direct : 0.58% p. a.
Exit load for Redemption / Switch out:- Lumpsum & SIP / STP / SWP OptionNil ###Application Amount for fresh Subscription :
Rs.500 (plus in multiples of Re.1)
Min.Addl.Investment :Rs.100 (plus in multiples of Re.1)
Investors understand that their principal will be at Moderate risk
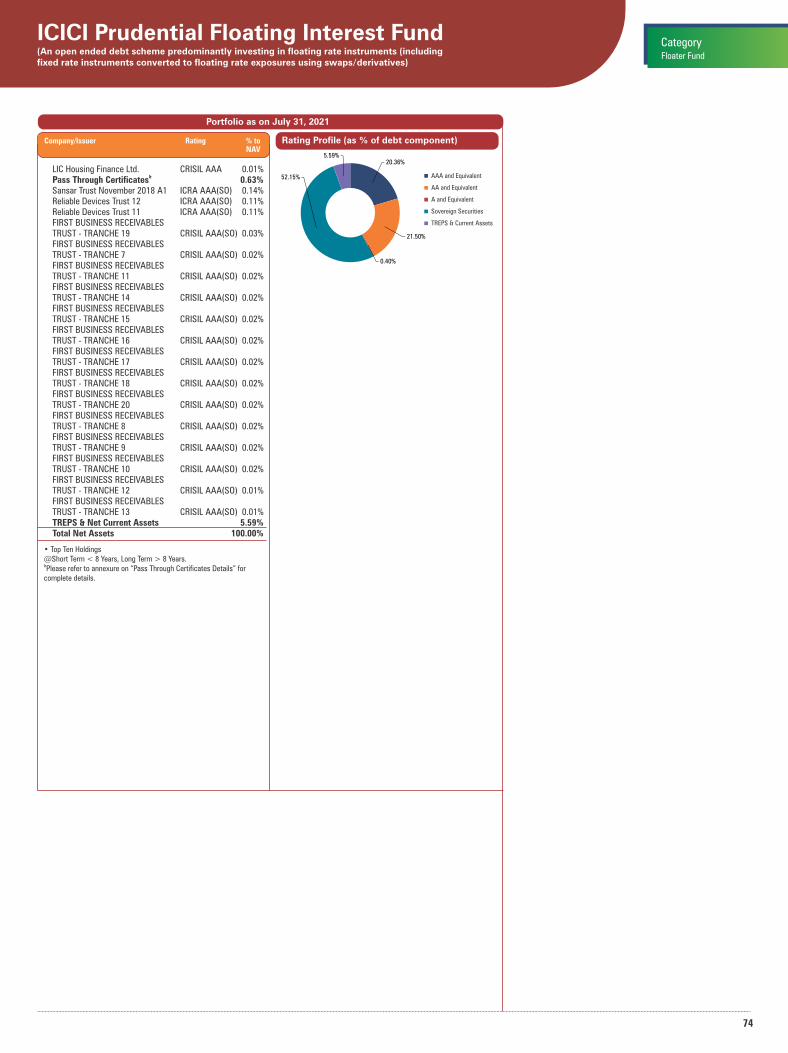
74
ICICI Prudential Floating Interest Fund(An open ended debt scheme predominantly investing in floating rate instruments (including fixed rate instruments converted to floating rate exposures using swaps/derivatives)
Floater Fund
Category
Portfolio as on July 31, 2021
LIC Housing Finance Ltd. CRISIL AAA 0.01%& Pass Through Certificates 0.63%
Sansar Trust November 2018 A1 ICRA AAA(SO) 0.14% Reliable Devices Trust 12 ICRA AAA(SO) 0.11% Reliable Devices Trust 11 ICRA AAA(SO) 0.11% FIRST BUSINESS RECEIVABLES TRUST - TRANCHE 19 CRISIL AAA(SO) 0.03% FIRST BUSINESS RECEIVABLES TRUST - TRANCHE 7 CRISIL AAA(SO) 0.02% FIRST BUSINESS RECEIVABLES TRUST - TRANCHE 11 CRISIL AAA(SO) 0.02% FIRST BUSINESS RECEIVABLES TRUST - TRANCHE 14 CRISIL AAA(SO) 0.02% FIRST BUSINESS RECEIVABLES TRUST - TRANCHE 15 CRISIL AAA(SO) 0.02% FIRST BUSINESS RECEIVABLES TRUST - TRANCHE 16 CRISIL AAA(SO) 0.02% FIRST BUSINESS RECEIVABLES TRUST - TRANCHE 17 CRISIL AAA(SO) 0.02% FIRST BUSINESS RECEIVABLES TRUST - TRANCHE 18 CRISIL AAA(SO) 0.02% FIRST BUSINESS RECEIVABLES TRUST - TRANCHE 20 CRISIL AAA(SO) 0.02% FIRST BUSINESS RECEIVABLES TRUST - TRANCHE 8 CRISIL AAA(SO) 0.02% FIRST BUSINESS RECEIVABLES TRUST - TRANCHE 9 CRISIL AAA(SO) 0.02% FIRST BUSINESS RECEIVABLES TRUST - TRANCHE 10 CRISIL AAA(SO) 0.02% FIRST BUSINESS RECEIVABLES TRUST - TRANCHE 12 CRISIL AAA(SO) 0.01% FIRST BUSINESS RECEIVABLES TRUST - TRANCHE 13 CRISIL AAA(SO) 0.01% TREPS & Net Current Assets 5.59% Total Net Assets 100.00%
• Top Ten Holdings@Short Term < 8 Years, Long Term > 8 Years.&Please refer to annexure on “Pass Through Certificates Details” for complete details.
Rating Profile (as % of debt component)Company/Issuer Rating % to NAV
AAA and Equivalent
AA and Equivalent
A and Equivalent
Sovereign Securities
TREPS & Current Assets
20.36%
21.50%
0.40%
52.15%
5.59%

75
ICICI Prudential Short Term Fund(An open ended short term debt scheme investing in instruments such that the Macaulay duration of the portfolio is between 1 Year and 3 Years.)
Medium to Long
High Medium Low
Low
Short
Medium
Duration
Long
Credit Quality
Style Box
Notes:1. Different plans shall have different expense structure. The performance details provided herein are of ICICI Prudential Short Term Fund.2. The scheme is currently managed by Manish Banthia and Nikhil Kabra. Mr. Manish Banthia has been managing this fund since Nov 2009. Total Schemes managed by the Fund Manager is 23 (23 are jointly
managed). Mr. Nikhil Kabra has been managing this fund since Dec 2020. Total Schemes managed by the Fund Manager is 7 (7 are jointly managed). Refer annexure from page no. 132 for performance of other schemes
currently managed by Manish Banthia and Nikhil Kabra.3. Date of inception: 25-Oct-01.4. Past performance may or may not be sustained in future and the same may not necessarily provide the basis for comparison with other investment.5. Load is not considered for computation of returns.6. In case, the start/end date of the concerned period is a nonbusiness date (NBD), the NAV of the previous date is considered for computation of returns. The NAV per unit shown in the table is as on the start date of
the said period7. As the scheme was launched before the launch of the benchmark index, benchmark index figures since inception or the required period are not available.
Returns of ICICI Prudential Short Term Fund - Growth Option as on July 31, 2021
Portfolio as on July 31, 2021
Fund Details
$$$Quantitative Indicators
Average Maturity :
4.11 YearsModified Duration :
2.40 Years
Macaulay Duration :
2.51 YearsYield To Maturity :
5.43%
For Schemes which have discontinued fresh subscriptions with effect from October 01,2012,the Dividend declared will be compulsorily paid out under the “IDCW Payout “option.@@ Total Expense Ratio is as on the last business day of the month.Refer page no 123 to 131 for details on option, entry load, SWP, STP/Flex STP/Value STP & minimum redemption amount pertaining to the scheme.For IDCW History : Refer page no. from 152 to 159, For SIP Returns : Refer page no. from 147 to 150, For Investment Objective : Refer page no. from 160 to 163$$$ - Please refer page 168 for details.
Riskometer
This Product is suitable for investors who are seeking*:
• Short term income generation and capital appreciation solution
• A debt fund that aims to generate income by investing in a range of debt and money market instruments of various maturities.
*Investors should consult their financial advisers if in doubt about whether theproduct is suitable for them.
1 Year 3 Years 5 Years Since inceptionParticulars
44.3997 36.5747NAV (Rs.) Per Unit (as on July 30,2021 : 46.6681)
CAGR (%)
Current Value of
Investment of Rs. 10000
CAGR (%)
Current Value of
Investment of Rs. 10000
CAGR (%)
Current Value of
Investment of Rs. 10000
32.2240
CAGR (%)
Current Value of
Investment of Rs. 10000
10.00
5.12 10510.90 8.46 12759.67 7.68 14482.40 8.10 46668.10
5.32 10530.38 8.66 12830.39 7.80 14563.58 NA NA
2.23 10222.59 8.71 12846.63 6.50 13708.09 7.20 39560.32
Scheme
CRISIL Short Term Bond Fund Index (Benchmark)
CRISIL 10 Year Gilt Index (Additional Benchmark)
Monthly AAUM as on 31-Jul-21 : Rs. 20,843.41 crores
Closing AUM as on 31-Jul-21 : Rs. 20,793.40 crores `
Fund Managers** :Manish Banthia (Managing this fund since Nov, 2009 & Overall 16 years of experience)Nikhil Kabra (Managing this fund since Dec 2020& Overall 6 years of experience)
Indicative Investment Horizon: 6 months and above
Inception/Allotment date:IPSTP : 25-Oct-01IPSTP Institutional Option : 03-Apr-03
Short Duration Fund
Category
Treasury Bills SOV 7.61% Government Securities 25.44%
@ Short Term 11.00% 06.79% GOI 2027 SOV 1.62% 06.58% Gujarat SDL 2027 SOV 0.82% 08.15% GOI 2026 SOV 0.72% 07.52% Tamil Nadu SDL 2027 SOV 0.70% 8.04% Chhattisgarh SDL 2026 SOV 0.57% 06.97% GOI 2026 SOV 0.55% 07.47% Uttar Pradesh SDL 2027 SOV 0.50% 08.33% GOI 2026 SOV 0.42% 07.59% Gujarat SDL 2027 SOV 0.40% 07.08% Andhra Pradesh SDL 2026 SOV 0.29% 08.52% Telangana SDL 2026 SOV 0.26% 07.62% Uttar Pradesh SDL 2027 SOV 0.25% 06.45% Maharashtra SDL 2027 SOV 0.24% 07.06% Rajasthan SDL 2026 SOV 0.22% 07.86% West Bengal SDL 2026 SOV 0.20% 08.26% GOI 2027 SOV 0.20% 07.27% Uttar Pradesh SDL 2027 SOV 0.17% 07.19% Gujarat SDL 2027 SOV 0.17% 07.18% Tamil Nadu SDL 2027 SOV 0.17% 05.18 % GOI Floater 2024 SOV 0.17% 07.41% Uttar Pradesh SDL 2026 SOV 0.15% 07.40% Telangana SDL 2026 SOV 0.15% 08.21% West Bengal SDL 2025 SOV 0.13% 08.31% Rajasthan SDL 2027 SOV 0.13% 07.38% Rajasthan SDL 2026 SOV 0.13% 07.29% Uttar Pradesh SDL 2027 SOV 0.10% 08.31% Telangana SDL 2026 SOV 0.10% 07.39% Uttar Pradesh SDL 2026 SOV 0.10% 07.19% Uttar Pradesh SDL 2027 SOV 0.10% 08.28% GOI 2027 SOV 0.08% 07.37% Tamil Nadu SDL 2026 SOV 0.08% 07.27% Jharkhand SDL 2027 SOV 0.08% 07.74% Tamil Nadu SDL 2027 SOV 0.08% 07.40% Madhya Pradesh SDL 2026 SOV 0.08% 07.20% Tamil Nadu SDL 2027 SOV 0.07% 08.27% Gujarat SDL 2026 SOV 0.05% 07.84% Tamil Nadu SDL 2026 SOV 0.05% 07.85% Tamil Nadu SDL 2027 SOV 0.05% 07.59% Karnataka SDL 2027 SOV 0.05% 07.37% Maharashtra SDL 2026 SOV 0.05% 07.20% Karnataka SDL 2027 SOV 0.05% 07.20% Uttar Pradesh SDL 2027 SOV 0.05%
07.16% West Bengal SDL 2027 SOV 0.05% 06.90% Jharkhand SDL 2026 SOV 0.05% 08.27% Rajasthan SDL 2022 SOV 0.04% 08.10% Jharkhand SDL 2025 SOV 0.03% 08.01% Tamil Nadu SDL 2026 SOV 0.03% 07.86% Rajasthan SDL 2027 SOV 0.03% 07.61% Tamil Nadu SDL 2027 SOV 0.03% 07.59% Uttar Pradesh SDL 2027 SOV 0.03% 07.38% Karnataka SDL 2027 SOV 0.03% 07.16% Maharashtra SDL 2026 SOV 0.02% 07.21% Gujarat SDL 2027 SOV 0.02% 07.10% West Bengal SDL 2026 SOV 0.02% 07.27% GOI 2026 SOV 0.02% 07.26% GOI 2029 SOV 0.02% 06.88% Telangana SDL 2025 SOV 0.02% 07.89% Gujarat SDL 2025 SOV 0.01% Long Term 14.44%@
• 06.64% GOI 2035 SOV 7.77%• 04.7 % GOI Floater 2033 SOV 3.28% 07.19% Uttar Pradesh SDL 2031 SOV 1.80% 06.67% GOI 2050 SOV 1.58% 07.27% Mizoram SDL 2033 SOV 0.01% Certificate of Deposit (CDs) 0.71% NABARD CRISIL A1+ 0.71% Commercial Papers (CPs) 3.54% Panatone Finvest Ltd. CRISIL A1+ 1.88% Reliance Industries Ltd. CRISIL A1+ 1.20% Tata Teleservices (Maharashtra) Ltd. CRISIL A1+ 0.46% Corporate Securities 52.47%• NABARD CRISIL AAA 5.61%• HDFC Ltd. CRISIL AAA 3.99%• Power Finance Corporation Ltd. CRISIL AAA 2.97%• State Bank Of India (Additional Tier 1 - Basel III) CRISIL AA+ 2.61%• Rural Electrification Corporation Ltd. CRISIL AAA 2.33%• EMBASSY OFFICE PARKS REIT CRISIL AAA 2.31%• Jamnagar Utilities & Power Pvt. Ltd. CRISIL AAA 2.24%• Pipeline Infrastructure Pvt Ltd. (Sponsored by Brookfield) CRISIL AAA 2.14% ICICI Bank Ltd. (Additional Tier 1 - Basel III) CRISIL AA+ 1.94% Godrej Industries Ltd. CRISIL AA 1.52%
Company/Issuer Rating % to NAV
Company/Issuer Rating % to NAV
NAV (As on 30-Jul-21):Growth Option : 46.6681Direct Plan Growth Option : 49.5969
`̀ `̀` `
`
Total Expense Ratio @@ :Other : 1.14% p. a.Direct : 0.38% p. a.
Exit load for Redemption / Switchout :- Lumpsum & SIP / STP OptionNil (w.e.f. 1st Jan 2019)
Application Amount for fresh Subscription :Rs.5,000 (plus in multiples of Re.1)
Min.Addl.Investment :Rs.1,000 (plus in multiples of Re.1)
Investors understand that their principal will be at Moderate risk
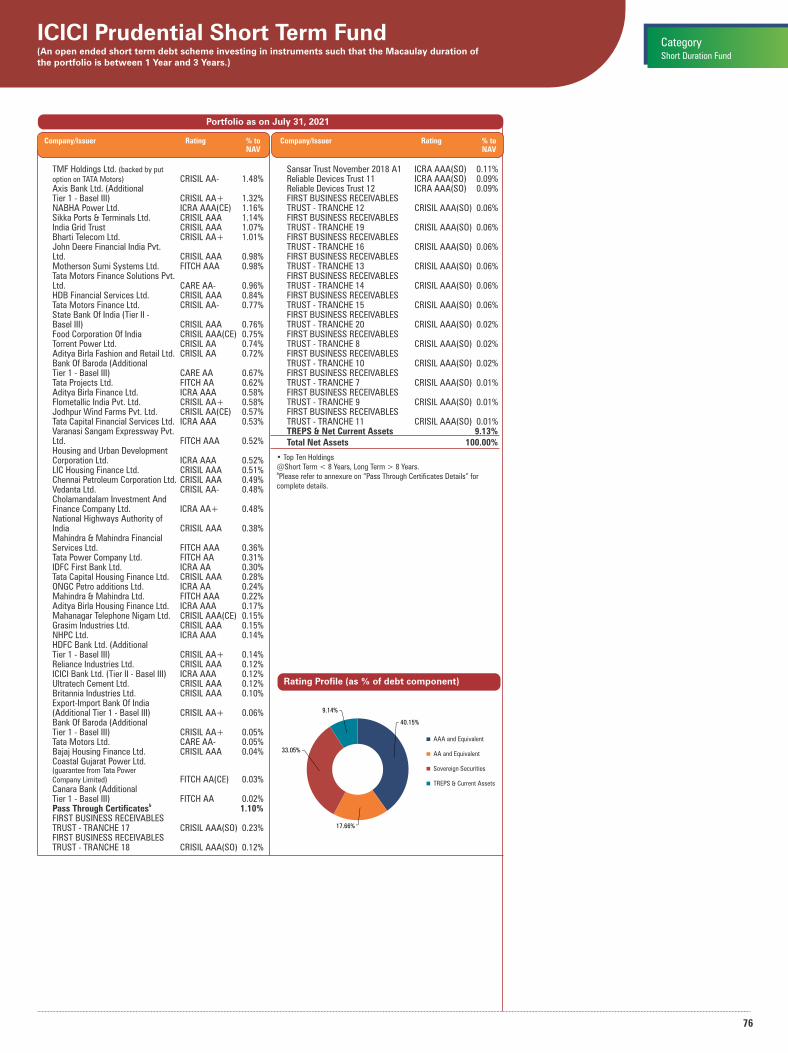
76
AAA and Equivalent
AA and Equivalent
Sovereign Securities
TREPS & Current Assets
ICICI Prudential Short Term Fund(An open ended short term debt scheme investing in instruments such that the Macaulay duration of the portfolio is between 1 Year and 3 Years.)
Short Duration Fund
Category
Portfolio as on July 31, 2021
TMF Holdings Ltd. (backed by put option on TATA Motors) CRISIL AA- 1.48% Axis Bank Ltd. (Additional Tier 1 - Basel III) CRISIL AA+ 1.32% NABHA Power Ltd. ICRA AAA(CE) 1.16% Sikka Ports & Terminals Ltd. CRISIL AAA 1.14% India Grid Trust CRISIL AAA 1.07% Bharti Telecom Ltd. CRISIL AA+ 1.01% John Deere Financial India Pvt. Ltd. CRISIL AAA 0.98% Motherson Sumi Systems Ltd. FITCH AAA 0.98% Tata Motors Finance Solutions Pvt. Ltd. CARE AA- 0.96% HDB Financial Services Ltd. CRISIL AAA 0.84% Tata Motors Finance Ltd. CRISIL AA- 0.77% State Bank Of India (Tier II - Basel III) CRISIL AAA 0.76% Food Corporation Of India CRISIL AAA(CE) 0.75% Torrent Power Ltd. CRISIL AA 0.74% Aditya Birla Fashion and Retail Ltd. CRISIL AA 0.72% Bank Of Baroda (Additional Tier 1 - Basel III) CARE AA 0.67% Tata Projects Ltd. FITCH AA 0.62% Aditya Birla Finance Ltd. ICRA AAA 0.58% Flometallic India Pvt. Ltd. CRISIL AA+ 0.58% Jodhpur Wind Farms Pvt. Ltd. CRISIL AA(CE) 0.57% Tata Capital Financial Services Ltd. ICRA AAA 0.53% Varanasi Sangam Expressway Pvt. Ltd. FITCH AAA 0.52% Housing and Urban Development Corporation Ltd. ICRA AAA 0.52% LIC Housing Finance Ltd. CRISIL AAA 0.51% Chennai Petroleum Corporation Ltd. CRISIL AAA 0.49% Vedanta Ltd. CRISIL AA- 0.48% Cholamandalam Investment And Finance Company Ltd. ICRA AA+ 0.48% National Highways Authority of India CRISIL AAA 0.38% Mahindra & Mahindra Financial Services Ltd. FITCH AAA 0.36% Tata Power Company Ltd. FITCH AA 0.31% IDFC First Bank Ltd. ICRA AA 0.30% Tata Capital Housing Finance Ltd. CRISIL AAA 0.28% ONGC Petro additions Ltd. ICRA AA 0.24% Mahindra & Mahindra Ltd. FITCH AAA 0.22% Aditya Birla Housing Finance Ltd. ICRA AAA 0.17% Mahanagar Telephone Nigam Ltd. CRISIL AAA(CE) 0.15% Grasim Industries Ltd. CRISIL AAA 0.15% NHPC Ltd. ICRA AAA 0.14% HDFC Bank Ltd. (Additional Tier 1 - Basel III) CRISIL AA+ 0.14% Reliance Industries Ltd. CRISIL AAA 0.12% ICICI Bank Ltd. (Tier II - Basel III) ICRA AAA 0.12% Ultratech Cement Ltd. CRISIL AAA 0.12% Britannia Industries Ltd. CRISIL AAA 0.10% Export-Import Bank Of India (Additional Tier 1 - Basel III) CRISIL AA+ 0.06% Bank Of Baroda (Additional Tier 1 - Basel III) CRISIL AA+ 0.05% Tata Motors Ltd. CARE AA- 0.05% Bajaj Housing Finance Ltd. CRISIL AAA 0.04% Coastal Gujarat Power Ltd. (guarantee from Tata Power Company Limited) FITCH AA(CE) 0.03% Canara Bank (Additional Tier 1 - Basel III) FITCH AA 0.02% Pass Through Certificates 1.10%&
FIRST BUSINESS RECEIVABLES TRUST - TRANCHE 17 CRISIL AAA(SO) 0.23% FIRST BUSINESS RECEIVABLES TRUST - TRANCHE 18 CRISIL AAA(SO) 0.12%
• Top Ten Holdings@Short Term < 8 Years, Long Term > 8 Years.&Please refer to annexure on “Pass Through Certificates Details” for complete details.
Rating Profile (as % of debt component)
Company/Issuer Rating % to NAV
Company/Issuer Rating % to NAV
Sansar Trust November 2018 A1 ICRA AAA(SO) 0.11% Reliable Devices Trust 11 ICRA AAA(SO) 0.09% Reliable Devices Trust 12 ICRA AAA(SO) 0.09% FIRST BUSINESS RECEIVABLES TRUST - TRANCHE 12 CRISIL AAA(SO) 0.06% FIRST BUSINESS RECEIVABLES TRUST - TRANCHE 19 CRISIL AAA(SO) 0.06% FIRST BUSINESS RECEIVABLES TRUST - TRANCHE 16 CRISIL AAA(SO) 0.06% FIRST BUSINESS RECEIVABLES TRUST - TRANCHE 13 CRISIL AAA(SO) 0.06% FIRST BUSINESS RECEIVABLES TRUST - TRANCHE 14 CRISIL AAA(SO) 0.06% FIRST BUSINESS RECEIVABLES TRUST - TRANCHE 15 CRISIL AAA(SO) 0.06% FIRST BUSINESS RECEIVABLES TRUST - TRANCHE 20 CRISIL AAA(SO) 0.02% FIRST BUSINESS RECEIVABLES TRUST - TRANCHE 8 CRISIL AAA(SO) 0.02% FIRST BUSINESS RECEIVABLES TRUST - TRANCHE 10 CRISIL AAA(SO) 0.02% FIRST BUSINESS RECEIVABLES TRUST - TRANCHE 7 CRISIL AAA(SO) 0.01% FIRST BUSINESS RECEIVABLES TRUST - TRANCHE 9 CRISIL AAA(SO) 0.01% FIRST BUSINESS RECEIVABLES TRUST - TRANCHE 11 CRISIL AAA(SO) 0.01% TREPS & Net Current Assets 9.13% Total Net Assets 100.00%
40.15%
17.66%
33.05%
9.14%
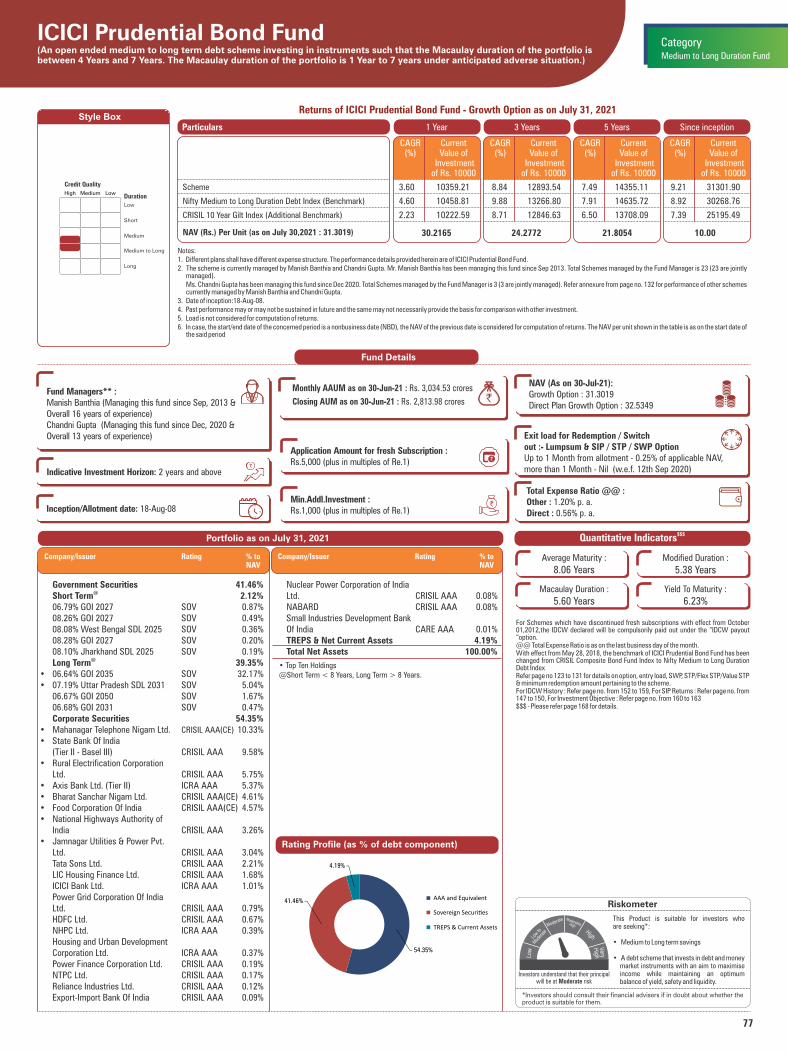
77
ICICI Prudential Bond Fund(An open ended medium to long term debt scheme investing in instruments such that the Macaulay duration of the portfolio is between 4 Years and 7 Years. The Macaulay duration of the portfolio is 1 Year to 7 years under anticipated adverse situation.)
Medium to Long
High Medium Low
Low
Short
Medium
Duration
Long
Credit Quality
Style Box
Notes:1. Different plans shall have different expense structure. The performance details provided herein are of ICICI Prudential Bond Fund.2. The scheme is currently managed by Manish Banthia and Chandni Gupta. Mr. Manish Banthia has been managing this fund since Sep 2013. Total Schemes managed by the Fund Manager is 23 (23 are jointly
managed). Ms. Chandni Gupta has been managing this fund since Dec 2020. Total Schemes managed by the Fund Manager is 3 (3 are jointly managed). Refer annexure from page no. 132 for performance of other schemes
currently managed by Manish Banthia and Chandni Gupta.3. Date of inception:18-Aug-08.4. Past performance may or may not be sustained in future and the same may not necessarily provide the basis for comparison with other investment.5. Load is not considered for computation of returns.6. In case, the start/end date of the concerned period is a nonbusiness date (NBD), the NAV of the previous date is considered for computation of returns. The NAV per unit shown in the table is as on the start date of
the said period
Returns of ICICI Prudential Bond Fund - Growth Option as on July 31, 2021
Government Securities 41.46%@ Short Term 2.12%
06.79% GOI 2027 SOV 0.87% 08.26% GOI 2027 SOV 0.49% 08.08% West Bengal SDL 2025 SOV 0.36% 08.28% GOI 2027 SOV 0.20% 08.10% Jharkhand SDL 2025 SOV 0.19%
@ Long Term 39.35%• 06.64% GOI 2035 SOV 32.17%• 07.19% Uttar Pradesh SDL 2031 SOV 5.04% 06.67% GOI 2050 SOV 1.67% 06.68% GOI 2031 SOV 0.47% Corporate Securities 54.35%• Mahanagar Telephone Nigam Ltd. CRISIL AAA(CE) 10.33%• State Bank Of India (Tier II - Basel III) CRISIL AAA 9.58%• Rural Electrification Corporation Ltd. CRISIL AAA 5.75%• Axis Bank Ltd. (Tier II) ICRA AAA 5.37%• Bharat Sanchar Nigam Ltd. CRISIL AAA(CE) 4.61%• Food Corporation Of India CRISIL AAA(CE) 4.57%• National Highways Authority of India CRISIL AAA 3.26%• Jamnagar Utilities & Power Pvt. Ltd. CRISIL AAA 3.04% Tata Sons Ltd. CRISIL AAA 2.21% LIC Housing Finance Ltd. CRISIL AAA 1.68% ICICI Bank Ltd. ICRA AAA 1.01% Power Grid Corporation Of India Ltd. CRISIL AAA 0.79% HDFC Ltd. CRISIL AAA 0.67% NHPC Ltd. ICRA AAA 0.39% Housing and Urban Development Corporation Ltd. ICRA AAA 0.37% Power Finance Corporation Ltd. CRISIL AAA 0.19% NTPC Ltd. CRISIL AAA 0.17% Reliance Industries Ltd. CRISIL AAA 0.12% Export-Import Bank Of India CRISIL AAA 0.09%
• Top Ten Holdings@Short Term < 8 Years, Long Term > 8 Years.
Fund Details
$$$Quantitative Indicators
Average Maturity :
8.06 YearsModified Duration :
5.38 Years
Macaulay Duration :
5.60 YearsYield To Maturity :
6.23%
For Schemes which have discontinued fresh subscriptions with effect from October 01,2012,the IDCW declared will be compulsorily paid out under the “IDCW payout “option.@@ Total Expense Ratio is as on the last business day of the month.With effect from May 28, 2018, the benchmark of ICICI Prudential Bond Fund has been changed from CRISIL Composite Bond Fund Index to Nifty Medium to Long Duration Debt IndexRefer page no 123 to 131 for details on option, entry load, SWP, STP/Flex STP/Value STP & minimum redemption amount pertaining to the scheme.For IDCW History : Refer page no. from 152 to 159, For SIP Returns : Refer page no. from 147 to 150, For Investment Objective : Refer page no. from 160 to 163$$$ - Please refer page 168 for details.
Riskometer
This Product is suitable for investors who are seeking*:
• Medium to Long term savings
• A debt scheme that invests in debt and money market instruments with an aim to maximise income while maintaining an optimum balance of yield, safety and liquidity.
*Investors should consult their financial advisers if in doubt about whether theproduct is suitable for them.
1 Year 3 Years 5 Years Since inceptionParticulars
30.2165 24.2772NAV (Rs.) Per Unit (as on July 30,2021 : 31.3019)
CAGR (%)
Current Value of
Investment of Rs. 10000
CAGR (%)
Current Value of
Investment of Rs. 10000
CAGR (%)
Current Value of
Investment of Rs. 10000
21.8054
CAGR (%)
Current Value of
Investment of Rs. 10000
10.00
3.60 10359.21 8.84 12893.54 7.49 14355.11 9.21 31301.90
4.60 10458.81 9.88 13266.80 7.91 14635.72 8.92 30268.76
2.23 10222.59 8.71 12846.63 6.50 13708.09 7.39 25195.49
Scheme
Nifty Medium to Long Duration Debt Index (Benchmark)
CRISIL 10 Year Gilt Index (Additional Benchmark)
Fund Managers** :Manish Banthia (Managing this fund since Sep, 2013 & Overall 16 years of experience)Chandni Gupta (Managing this fund since Dec, 2020 & Overall 13 years of experience)
Indicative Investment Horizon: 2 years and above
NAV (As on 30-Jul-21):Growth Option : 31.3019Direct Plan Growth Option : 32.5349
`̀ `̀` `
`
Exit load for Redemption / Switchout :- Lumpsum & SIP / STP / SWP OptionUp to 1 Month from allotment - 0.25% of applicable NAV, more than 1 Month - Nil (w.e.f. 12th Sep 2020)
Total Expense Ratio @@ :Other : 1.20% p. a.Direct : 0.56% p. a.Inception/Allotment date: 18-Aug-08
Monthly AAUM as on 30-Jun-21 : Rs. 3,034.53 crores
Closing AUM as on 30-Jun-21 : Rs. 2,813.98 crores `
Medium to Long Duration Fund
Category
Portfolio as on July 31, 2021
Company/Issuer Rating % to NAV
Application Amount for fresh Subscription :Rs.5,000 (plus in multiples of Re.1)
Min.Addl.Investment :Rs.1,000 (plus in multiples of Re.1)
Rating Profile (as % of debt component)
AAA and Equivalent
Sovereign Securi�es
TREPS & Current Assets
Company/Issuer Rating % to NAV
Nuclear Power Corporation of India Ltd. CRISIL AAA 0.08% NABARD CRISIL AAA 0.08% Small Industries Development Bank Of India CARE AAA 0.01% TREPS & Net Current Assets 4.19% Total Net Assets 100.00%
Investors understand that their principal will be at Moderate risk
54.35%
41.46%
4.19%
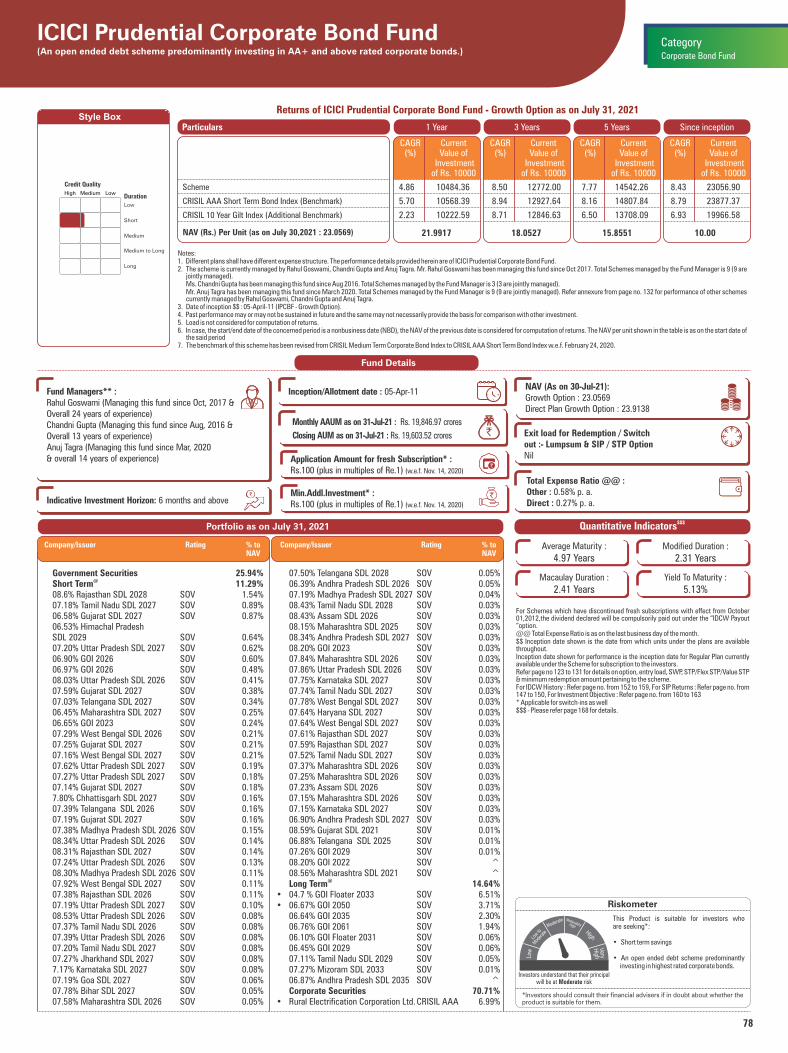
78
ICICI Prudential Corporate Bond Fund(An open ended debt scheme predominantly investing in AA+ and above rated corporate bonds.)
Medium to Long
High Medium Low
Low
Short
Medium
Duration
Long
Credit Quality
Style Box
Notes:1. Different plans shall have different expense structure. The performance details provided herein are of ICICI Prudential Corporate Bond Fund.2. The scheme is currently managed by Rahul Goswami, Chandni Gupta and Anuj Tagra. Mr. Rahul Goswami has been managing this fund since Oct 2017. Total Schemes managed by the Fund Manager is 9 (9 are
jointly managed). Ms. Chandni Gupta has been managing this fund since Aug 2016. Total Schemes managed by the Fund Manager is 3 (3 are jointly managed). Mr. Anuj Tagra has been managing this fund since March 2020. Total Schemes managed by the Fund Manager is 9 (9 are jointly managed). Refer annexure from page no. 132 for performance of other schemes
currently managed by Rahul Goswami, Chandni Gupta and Anuj Tagra.3. Date of inception $$ : 05-April-11 (IPCBF - Growth Option).4. Past performance may or may not be sustained in future and the same may not necessarily provide the basis for comparison with other investment.5. Load is not considered for computation of returns.6. In case, the start/end date of the concerned period is a nonbusiness date (NBD), the NAV of the previous date is considered for computation of returns. The NAV per unit shown in the table is as on the start date of
the said period7. The benchmark of this scheme has been revised from CRISIL Medium Term Corporate Bond Index to CRISIL AAA Short Term Bond Index w.e.f. February 24, 2020.
Returns of ICICI Prudential Corporate Bond Fund - Growth Option as on July 31, 2021
Fund Details
$$$Quantitative Indicators
Average Maturity :
4.97 YearsModified Duration :
2.31 Years
Macaulay Duration :
2.41 YearsYield To Maturity :
5.13%
For Schemes which have discontinued fresh subscriptions with effect from October 01,2012,the dividend declared will be compulsorily paid out under the “IDCW Payout “option.@@ Total Expense Ratio is as on the last business day of the month.$$ Inception date shown is the date from which units under the plans are available throughout. Inception date shown for performance is the inception date for Regular Plan currently available under the Scheme for subscription to the investors.Refer page no 123 to 131 for details on option, entry load, SWP, STP/Flex STP/Value STP & minimum redemption amount pertaining to the scheme.For IDCW History : Refer page no. from 152 to 159, For SIP Returns : Refer page no. from 147 to 150, For Investment Objective : Refer page no. from 160 to 163* Applicable for switch-ins as well $$$ - Please refer page 168 for details.
Riskometer
This Product is suitable for investors who are seeking*:
• Short term savings
• An open ended debt scheme predominantly investing in highest rated corporate bonds.
*Investors should consult their financial advisers if in doubt about whether theproduct is suitable for them.
1 Year 3 Years 5 Years Since inceptionParticulars
21.9917 18.0527NAV (Rs.) Per Unit (as on July 30,2021 : 23.0569)
CAGR (%)
Current Value of
Investment of Rs. 10000
CAGR (%)
Current Value of
Investment of Rs. 10000
CAGR (%)
Current Value of
Investment of Rs. 10000
15.8551
CAGR (%)
Current Value of
Investment of Rs. 10000
10.00
4.86 10484.36 8.50 12772.00 7.77 14542.26 8.43 23056.90
5.70 10568.39 8.94 12927.64 8.16 14807.84 8.79 23877.37
2.23 10222.59 8.71 12846.63 6.50 13708.09 6.93 19966.58
Scheme
CRISIL AAA Short Term Bond Index (Benchmark)
CRISIL 10 Year Gilt Index (Additional Benchmark)
Fund Managers** :Rahul Goswami (Managing this fund since Oct, 2017 & Overall 24 years of experience)Chandni Gupta (Managing this fund since Aug, 2016 &Overall 13 years of experience)Anuj Tagra (Managing this fund since Mar, 2020& overall 14 years of experience)
Indicative Investment Horizon: 6 months and above
Exit load for Redemption / Switchout :- Lumpsum & SIP / STP OptionNil
Total Expense Ratio @@ :Other : 0.58% p. a.Direct : 0.27% p. a.
Monthly AAUM as on 31-Jul-21 : Rs. 19,846.97 crores
Closing AUM as on 31-Jul-21 : Rs. 19,603.52 crores `
Inception/Allotment date : 05-Apr-11NAV (As on 30-Jul-21):Growth Option : 23.0569Direct Plan Growth Option : 23.9138
`̀ `̀` `
`
Corporate Bond Fund
Category
Government Securities 25.94%@ Short Term 11.29%
08.6% Rajasthan SDL 2028 SOV 1.54% 07.18% Tamil Nadu SDL 2027 SOV 0.89% 06.58% Gujarat SDL 2027 SOV 0.87% 06.53% Himachal Pradesh SDL 2029 SOV 0.64% 07.20% Uttar Pradesh SDL 2027 SOV 0.62% 06.90% GOI 2026 SOV 0.60% 06.97% GOI 2026 SOV 0.48% 08.03% Uttar Pradesh SDL 2026 SOV 0.41% 07.59% Gujarat SDL 2027 SOV 0.38% 07.03% Telangana SDL 2027 SOV 0.34% 06.45% Maharashtra SDL 2027 SOV 0.25% 06.65% GOI 2023 SOV 0.24% 07.29% West Bengal SDL 2026 SOV 0.21% 07.25% Gujarat SDL 2027 SOV 0.21% 07.16% West Bengal SDL 2027 SOV 0.21% 07.62% Uttar Pradesh SDL 2027 SOV 0.19% 07.27% Uttar Pradesh SDL 2027 SOV 0.18% 07.14% Gujarat SDL 2027 SOV 0.18% 7.80% Chhattisgarh SDL 2027 SOV 0.16% 07.39% Telangana SDL 2026 SOV 0.16% 07.19% Gujarat SDL 2027 SOV 0.16% 07.38% Madhya Pradesh SDL 2026 SOV 0.15% 08.34% Uttar Pradesh SDL 2026 SOV 0.14% 08.31% Rajasthan SDL 2027 SOV 0.14% 07.24% Uttar Pradesh SDL 2026 SOV 0.13% 08.30% Madhya Pradesh SDL 2026 SOV 0.11% 07.92% West Bengal SDL 2027 SOV 0.11% 07.38% Rajasthan SDL 2026 SOV 0.11% 07.19% Uttar Pradesh SDL 2027 SOV 0.10% 08.53% Uttar Pradesh SDL 2026 SOV 0.08% 07.37% Tamil Nadu SDL 2026 SOV 0.08% 07.39% Uttar Pradesh SDL 2026 SOV 0.08% 07.20% Tamil Nadu SDL 2027 SOV 0.08% 07.27% Jharkhand SDL 2027 SOV 0.08% 7.17% Karnataka SDL 2027 SOV 0.08% 07.19% Goa SDL 2027 SOV 0.06% 07.78% Bihar SDL 2027 SOV 0.05% 07.58% Maharashtra SDL 2026 SOV 0.05%
07.50% Telangana SDL 2028 SOV 0.05% 06.39% Andhra Pradesh SDL 2026 SOV 0.05% 07.19% Madhya Pradesh SDL 2027 SOV 0.04% 08.43% Tamil Nadu SDL 2028 SOV 0.03% 08.43% Assam SDL 2026 SOV 0.03% 08.15% Maharashtra SDL 2025 SOV 0.03% 08.34% Andhra Pradesh SDL 2027 SOV 0.03% 08.20% GOI 2023 SOV 0.03% 07.84% Maharashtra SDL 2026 SOV 0.03% 07.86% Uttar Pradesh SDL 2026 SOV 0.03% 07.75% Karnataka SDL 2027 SOV 0.03% 07.74% Tamil Nadu SDL 2027 SOV 0.03% 07.78% West Bengal SDL 2027 SOV 0.03% 07.64% Haryana SDL 2027 SOV 0.03% 07.64% West Bengal SDL 2027 SOV 0.03% 07.61% Rajasthan SDL 2027 SOV 0.03% 07.59% Rajasthan SDL 2027 SOV 0.03% 07.52% Tamil Nadu SDL 2027 SOV 0.03% 07.37% Maharashtra SDL 2026 SOV 0.03% 07.25% Maharashtra SDL 2026 SOV 0.03% 07.23% Assam SDL 2026 SOV 0.03% 07.15% Maharashtra SDL 2026 SOV 0.03% 07.15% Karnataka SDL 2027 SOV 0.03% 06.90% Andhra Pradesh SDL 2027 SOV 0.03% 08.59% Gujarat SDL 2021 SOV 0.01% 06.88% Telangana SDL 2025 SOV 0.01% 07.26% GOI 2029 SOV 0.01% 08.20% GOI 2022 SOV ^ 08.56% Maharashtra SDL 2021 SOV ^
@ Long Term 14.64%• 04.7 % GOI Floater 2033 SOV 6.51%• 06.67% GOI 2050 SOV 3.71% 06.64% GOI 2035 SOV 2.30% 06.76% GOI 2061 SOV 1.94% 06.10% GOI Floater 2031 SOV 0.06% 06.45% GOI 2029 SOV 0.06% 07.11% Tamil Nadu SDL 2029 SOV 0.05% 07.27% Mizoram SDL 2033 SOV 0.01% 06.87% Andhra Pradesh SDL 2035 SOV ^ Corporate Securities 70.71%• Rural Electrification Corporation Ltd. CRISIL AAA 6.99%
Company/Issuer Rating % to NAV
Company/Issuer Rating % to NAV
Portfolio as on July 31, 2021
Application Amount for fresh Subscription* :Rs.100 (plus in multiples of Re.1) (w.e.f. Nov. 14, 2020)
Min.Addl.Investment* :Rs.100 (plus in multiples of Re.1) (w.e.f. Nov. 14, 2020)
Investors understand that their principal will be at Moderate risk
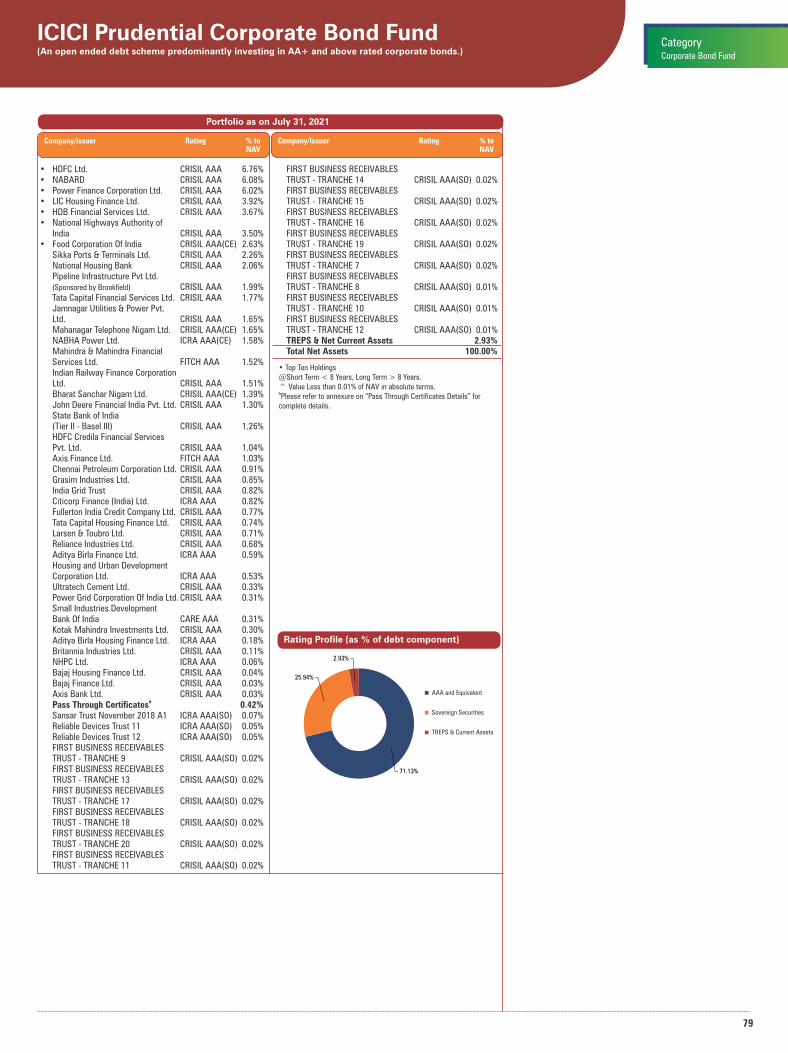
79
AAA and Equivalent
Sovereign Securities
TREPS & Current Assets
ICICI Prudential Corporate Bond Fund(An open ended debt scheme predominantly investing in AA+ and above rated corporate bonds.) Corporate Bond Fund
Category
Portfolio as on July 31, 2021
• HDFC Ltd. CRISIL AAA 6.76%• NABARD CRISIL AAA 6.08%• Power Finance Corporation Ltd. CRISIL AAA 6.02%• LIC Housing Finance Ltd. CRISIL AAA 3.92%• HDB Financial Services Ltd. CRISIL AAA 3.67%• National Highways Authority of India CRISIL AAA 3.50%• Food Corporation Of India CRISIL AAA(CE) 2.63% Sikka Ports & Terminals Ltd. CRISIL AAA 2.26% National Housing Bank CRISIL AAA 2.06% Pipeline Infrastructure Pvt Ltd. CRISIL AAA 1.99%(Sponsored by Brookfield)
Tata Capital Financial Services Ltd. CRISIL AAA 1.77% Jamnagar Utilities & Power Pvt. Ltd. CRISIL AAA 1.65% Mahanagar Telephone Nigam Ltd. CRISIL AAA(CE) 1.65% NABHA Power Ltd. ICRA AAA(CE) 1.58% Mahindra & Mahindra Financial Services Ltd. FITCH AAA 1.52% Indian Railway Finance Corporation Ltd. CRISIL AAA 1.51% Bharat Sanchar Nigam Ltd. CRISIL AAA(CE) 1.39% John Deere Financial India Pvt. Ltd. CRISIL AAA 1.30% State Bank of India (Tier II - Basel III) CRISIL AAA 1.26% HDFC Credila Financial Services Pvt. Ltd. CRISIL AAA 1.04% Axis Finance Ltd. FITCH AAA 1.03% Chennai Petroleum Corporation Ltd. CRISIL AAA 0.91% Grasim Industries Ltd. CRISIL AAA 0.85% India Grid Trust CRISIL AAA 0.82% Citicorp Finance (India) Ltd. ICRA AAA 0.82% Fullerton India Credit Company Ltd. CRISIL AAA 0.77% Tata Capital Housing Finance Ltd. CRISIL AAA 0.74% Larsen & Toubro Ltd. CRISIL AAA 0.71% Reliance Industries Ltd. CRISIL AAA 0.68% Aditya Birla Finance Ltd. ICRA AAA 0.59% Housing and Urban Development Corporation Ltd. ICRA AAA 0.53% Ultratech Cement Ltd. CRISIL AAA 0.33% Power Grid Corporation Of India Ltd. CRISIL AAA 0.31% Small Industries Development Bank Of India CARE AAA 0.31% Kotak Mahindra Investments Ltd. CRISIL AAA 0.30% Aditya Birla Housing Finance Ltd. ICRA AAA 0.18% Britannia Industries Ltd. CRISIL AAA 0.11% NHPC Ltd. ICRA AAA 0.06% Bajaj Housing Finance Ltd. CRISIL AAA 0.04% Bajaj Finance Ltd. CRISIL AAA 0.03% Axis Bank Ltd. CRISIL AAA 0.03% Pass Through Certificates 0.42%&
Sansar Trust November 2018 A1 ICRA AAA(SO) 0.07% Reliable Devices Trust 11 ICRA AAA(SO) 0.05% Reliable Devices Trust 12 ICRA AAA(SO) 0.05% FIRST BUSINESS RECEIVABLES TRUST - TRANCHE 9 CRISIL AAA(SO) 0.02% FIRST BUSINESS RECEIVABLES TRUST - TRANCHE 13 CRISIL AAA(SO) 0.02% FIRST BUSINESS RECEIVABLES TRUST - TRANCHE 17 CRISIL AAA(SO) 0.02% FIRST BUSINESS RECEIVABLES TRUST - TRANCHE 18 CRISIL AAA(SO) 0.02% FIRST BUSINESS RECEIVABLES TRUST - TRANCHE 20 CRISIL AAA(SO) 0.02% FIRST BUSINESS RECEIVABLES TRUST - TRANCHE 11 CRISIL AAA(SO) 0.02%
• Top Ten Holdings@Short Term < 8 Years, Long Term > 8 Years.^ Value Less than 0.01% of NAV in absolute terms.&Please refer to annexure on “Pass Through Certificates Details” for complete details.
Rating Profile (as % of debt component)
Company/Issuer Rating % to NAV
FIRST BUSINESS RECEIVABLES TRUST - TRANCHE 14 CRISIL AAA(SO) 0.02% FIRST BUSINESS RECEIVABLES TRUST - TRANCHE 15 CRISIL AAA(SO) 0.02% FIRST BUSINESS RECEIVABLES TRUST - TRANCHE 16 CRISIL AAA(SO) 0.02% FIRST BUSINESS RECEIVABLES TRUST - TRANCHE 19 CRISIL AAA(SO) 0.02% FIRST BUSINESS RECEIVABLES TRUST - TRANCHE 7 CRISIL AAA(SO) 0.02% FIRST BUSINESS RECEIVABLES TRUST - TRANCHE 8 CRISIL AAA(SO) 0.01% FIRST BUSINESS RECEIVABLES TRUST - TRANCHE 10 CRISIL AAA(SO) 0.01% FIRST BUSINESS RECEIVABLES TRUST - TRANCHE 12 CRISIL AAA(SO) 0.01% TREPS & Net Current Assets 2.93% Total Net Assets 100.00%
Company/Issuer Rating % to NAV
71.13%
25.94%
2.93%
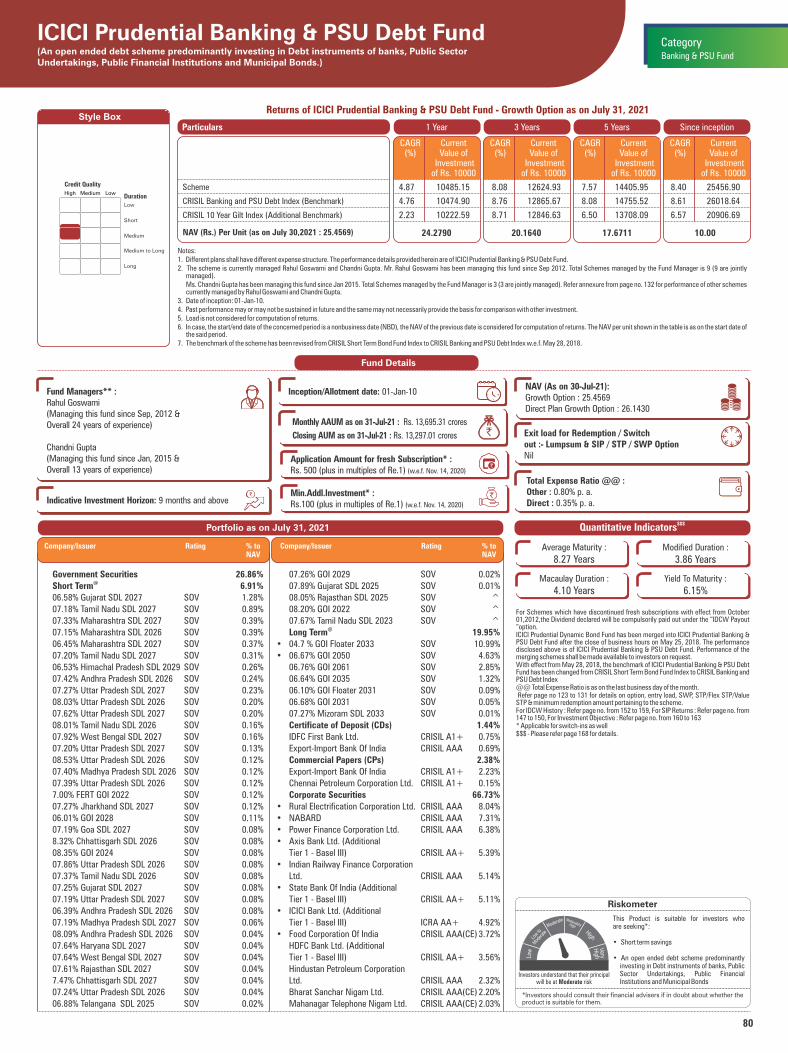
80
ICICI Prudential Banking & PSU Debt Fund(An open ended debt scheme predominantly investing in Debt instruments of banks, Public Sector Undertakings, Public Financial Institutions and Municipal Bonds.)
Medium to Long
High Medium Low
Low
Short
Medium
Duration
Long
Credit Quality
Style BoxReturns of ICICI Prudential Banking & PSU Debt Fund - Growth Option as on July 31, 2021
Notes:1. Different plans shall have different expense structure. The performance details provided herein are of ICICI Prudential Banking & PSU Debt Fund.2. The scheme is currently managed Rahul Goswami and Chandni Gupta. Mr. Rahul Goswami has been managing this fund since Sep 2012. Total Schemes managed by the Fund Manager is 9 (9 are jointly
managed). Ms. Chandni Gupta has been managing this fund since Jan 2015. Total Schemes managed by the Fund Manager is 3 (3 are jointly managed). Refer annexure from page no. 132 for performance of other schemes
currently managed by Rahul Goswami and Chandni Gupta.3. Date of inception: 01-Jan-10.4. Past performance may or may not be sustained in future and the same may not necessarily provide the basis for comparison with other investment.5. Load is not considered for computation of returns.6. In case, the start/end date of the concerned period is a nonbusiness date (NBD), the NAV of the previous date is considered for computation of returns. The NAV per unit shown in the table is as on the start date of
the said period.7. The benchmark of the scheme has been revised from CRISIL Short Term Bond Fund Index to CRISIL Banking and PSU Debt Index w.e.f. May 28, 2018.
Fund Details
$$$Quantitative Indicators
Average Maturity :
8.27 YearsModified Duration :
3.86 Years
Macaulay Duration :
4.10 YearsYield To Maturity :
6.15%
For Schemes which have discontinued fresh subscriptions with effect from October 01,2012,the Dividend declared will be compulsorily paid out under the “IDCW Payout “option.ICICI Prudential Dynamic Bond Fund has been merged into ICICI Prudential Banking & PSU Debt Fund after the close of business hours on May 25, 2018. The performance disclosed above is of ICICI Prudential Banking & PSU Debt Fund. Performance of the merging schemes shall be made available to investors on request.With effect from May 28, 2018, the benchmark of ICICI Prudential Banking & PSU Debt Fund has been changed from CRISIL Short Term Bond Fund Index to CRISIL Banking and PSU Debt Index@@ Total Expense Ratio is as on the last business day of the month. Refer page no 123 to 131 for details on option, entry load, SWP, STP/Flex STP/Value STP & minimum redemption amount pertaining to the scheme.For IDCW History : Refer page no. from 152 to 159, For SIP Returns : Refer page no. from 147 to 150, For Investment Objective : Refer page no. from 160 to 163* Applicable for switch-ins as well $$$ - Please refer page 168 for details.
Riskometer
This Product is suitable for investors who are seeking*:
• Short term savings
• An open ended debt scheme predominantly investing in Debt instruments of banks, Public Sector Undertakings, Public Financial Institutions and Municipal Bonds
*Investors should consult their financial advisers if in doubt about whether theproduct is suitable for them.
1 Year 3 Years 5 Years Since inceptionParticulars
24.2790 20.1640NAV (Rs.) Per Unit (as on July 30,2021 : 25.4569)
CAGR (%)
Current Value of
Investment of Rs. 10000
CAGR (%)
Current Value of
Investment of Rs. 10000
CAGR (%)
Current Value of
Investment of Rs. 10000
17.6711
CAGR (%)
Current Value of
Investment of Rs. 10000
10.00
4.87 10485.15 8.08 12624.93 7.57 14405.95 8.40 25456.90
4.76 10474.90 8.76 12865.67 8.08 14755.52 8.61 26018.64
2.23 10222.59 8.71 12846.63 6.50 13708.09 6.57 20906.69
Scheme
CRISIL Banking and PSU Debt Index (Benchmark)
CRISIL 10 Year Gilt Index (Additional Benchmark)
Monthly AAUM as on 31-Jul-21 : Rs. 13,695.31 crores
Closing AUM as on 31-Jul-21 : Rs. 13,297.01 crores `
Fund Managers** :Rahul Goswami (Managing this fund since Sep, 2012 & Overall 24 years of experience)
Chandni Gupta(Managing this fund since Jan, 2015 & Overall 13 years of experience)
Indicative Investment Horizon: 9 months and above
Inception/Allotment date: 01-Jan-10
Banking & PSU Fund
Category
Government Securities 26.86%@ Short Term 6.91%
06.58% Gujarat SDL 2027 SOV 1.28% 07.18% Tamil Nadu SDL 2027 SOV 0.89% 07.33% Maharashtra SDL 2027 SOV 0.39% 07.15% Maharashtra SDL 2026 SOV 0.39% 06.45% Maharashtra SDL 2027 SOV 0.37% 07.20% Tamil Nadu SDL 2027 SOV 0.31% 06.53% Himachal Pradesh SDL 2029 SOV 0.26% 07.42% Andhra Pradesh SDL 2026 SOV 0.24% 07.27% Uttar Pradesh SDL 2027 SOV 0.23% 08.03% Uttar Pradesh SDL 2026 SOV 0.20% 07.62% Uttar Pradesh SDL 2027 SOV 0.20% 08.01% Tamil Nadu SDL 2026 SOV 0.16% 07.92% West Bengal SDL 2027 SOV 0.16% 07.20% Uttar Pradesh SDL 2027 SOV 0.13% 08.53% Uttar Pradesh SDL 2026 SOV 0.12% 07.40% Madhya Pradesh SDL 2026 SOV 0.12% 07.39% Uttar Pradesh SDL 2026 SOV 0.12% 7.00% FERT GOI 2022 SOV 0.12% 07.27% Jharkhand SDL 2027 SOV 0.12% 06.01% GOI 2028 SOV 0.11% 07.19% Goa SDL 2027 SOV 0.08% 8.32% Chhattisgarh SDL 2026 SOV 0.08% 08.35% GOI 2024 SOV 0.08% 07.86% Uttar Pradesh SDL 2026 SOV 0.08% 07.37% Tamil Nadu SDL 2026 SOV 0.08% 07.25% Gujarat SDL 2027 SOV 0.08% 07.19% Uttar Pradesh SDL 2027 SOV 0.08% 06.39% Andhra Pradesh SDL 2026 SOV 0.08% 07.19% Madhya Pradesh SDL 2027 SOV 0.06% 08.09% Andhra Pradesh SDL 2026 SOV 0.04% 07.64% Haryana SDL 2027 SOV 0.04% 07.64% West Bengal SDL 2027 SOV 0.04% 07.61% Rajasthan SDL 2027 SOV 0.04% 7.47% Chhattisgarh SDL 2027 SOV 0.04% 07.24% Uttar Pradesh SDL 2026 SOV 0.04% 06.88% Telangana SDL 2025 SOV 0.02%
07.26% GOI 2029 SOV 0.02% 07.89% Gujarat SDL 2025 SOV 0.01% 08.05% Rajasthan SDL 2025 SOV ^ 08.20% GOI 2022 SOV ^ 07.67% Tamil Nadu SDL 2023 SOV ^
@ Long Term 19.95%• 04.7 % GOI Floater 2033 SOV 10.99%• 06.67% GOI 2050 SOV 4.63% 06.76% GOI 2061 SOV 2.85% 06.64% GOI 2035 SOV 1.32% 06.10% GOI Floater 2031 SOV 0.09% 06.68% GOI 2031 SOV 0.05% 07.27% Mizoram SDL 2033 SOV 0.01% Certificate of Deposit (CDs) 1.44% IDFC First Bank Ltd. CRISIL A1+ 0.75% Export-Import Bank Of India CRISIL AAA 0.69% Commercial Papers (CPs) 2.38% Export-Import Bank Of India CRISIL A1+ 2.23% Chennai Petroleum Corporation Ltd. CRISIL A1+ 0.15% Corporate Securities 66.73%• Rural Electrification Corporation Ltd. CRISIL AAA 8.04%• NABARD CRISIL AAA 7.31%• Power Finance Corporation Ltd. CRISIL AAA 6.38%• Axis Bank Ltd. (Additional Tier 1 - Basel III) CRISIL AA+ 5.39%• Indian Railway Finance Corporation Ltd. CRISIL AAA 5.14%• State Bank Of India (Additional Tier 1 - Basel III) CRISIL AA+ 5.11%• ICICI Bank Ltd. (Additional Tier 1 - Basel III) ICRA AA+ 4.92%• Food Corporation Of India CRISIL AAA(CE) 3.72% HDFC Bank Ltd. (Additional Tier 1 - Basel III) CRISIL AA+ 3.56% Hindustan Petroleum Corporation Ltd. CRISIL AAA 2.32% Bharat Sanchar Nigam Ltd. CRISIL AAA(CE) 2.20% Mahanagar Telephone Nigam Ltd. CRISIL AAA(CE) 2.03%
Portfolio as on July 31, 2021
Company/Issuer Rating % to NAV
Company/Issuer Rating % to NAV
Exit load for Redemption / Switchout :- Lumpsum & SIP / STP / SWP OptionNil
Total Expense Ratio @@ :Other : 0.80% p. a.Direct : 0.35% p. a.
NAV (As on 30-Jul-21):Growth Option : 25.4569Direct Plan Growth Option : 26.1430
`̀ `̀` `
`
Application Amount for fresh Subscription* :Rs. 500 (plus in multiples of Re.1) (w.e.f. Nov. 14, 2020)
Min.Addl.Investment* :Rs.100 (plus in multiples of Re.1) (w.e.f. Nov. 14, 2020)
Investors understand that their principal will be at Moderate risk
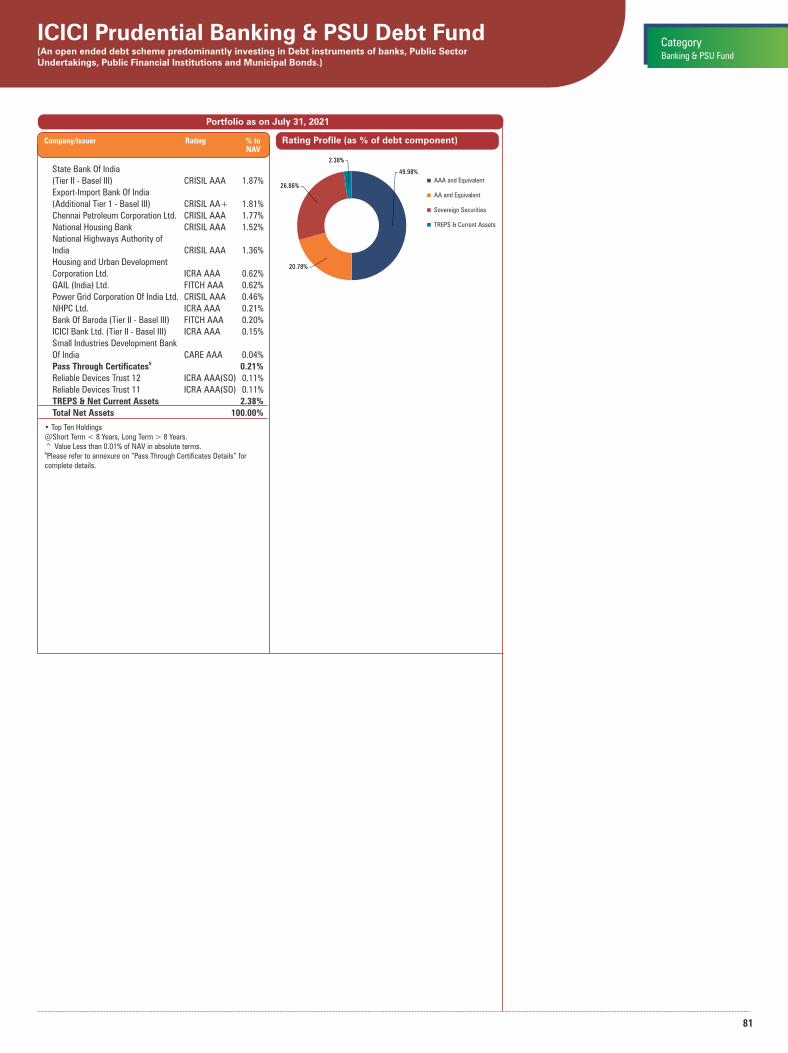
81
Portfolio as on July 31, 2021
State Bank Of India (Tier II - Basel III) CRISIL AAA 1.87% Export-Import Bank Of India (Additional Tier 1 - Basel III) CRISIL AA+ 1.81% Chennai Petroleum Corporation Ltd. CRISIL AAA 1.77% National Housing Bank CRISIL AAA 1.52% National Highways Authority of India CRISIL AAA 1.36% Housing and Urban Development Corporation Ltd. ICRA AAA 0.62% GAIL (India) Ltd. FITCH AAA 0.62% Power Grid Corporation Of India Ltd. CRISIL AAA 0.46% NHPC Ltd. ICRA AAA 0.21% Bank Of Baroda (Tier II - Basel III) FITCH AAA 0.20% ICICI Bank Ltd. (Tier II - Basel III) ICRA AAA 0.15% Small Industries Development Bank Of India CARE AAA 0.04%
& Pass Through Certificates 0.21% Reliable Devices Trust 12 ICRA AAA(SO) 0.11% Reliable Devices Trust 11 ICRA AAA(SO) 0.11% TREPS & Net Current Assets 2.38% Total Net Assets 100.00%
• Top Ten Holdings@Short Term < 8 Years, Long Term > 8 Years.^ Value Less than 0.01% of NAV in absolute terms.&Please refer to annexure on “Pass Through Certificates Details” for complete details.
Company/Issuer Rating % to NAV
ICICI Prudential Banking & PSU Debt Fund(An open ended debt scheme predominantly investing in Debt instruments of banks, Public Sector Undertakings, Public Financial Institutions and Municipal Bonds.)
Banking & PSU Fund
Category
Rating Profile (as % of debt component)
AAA and Equivalent
AA and Equivalent
Sovereign Securities
TREPS & Current Assets
49.98%
20.78%
26.86%
2.38%
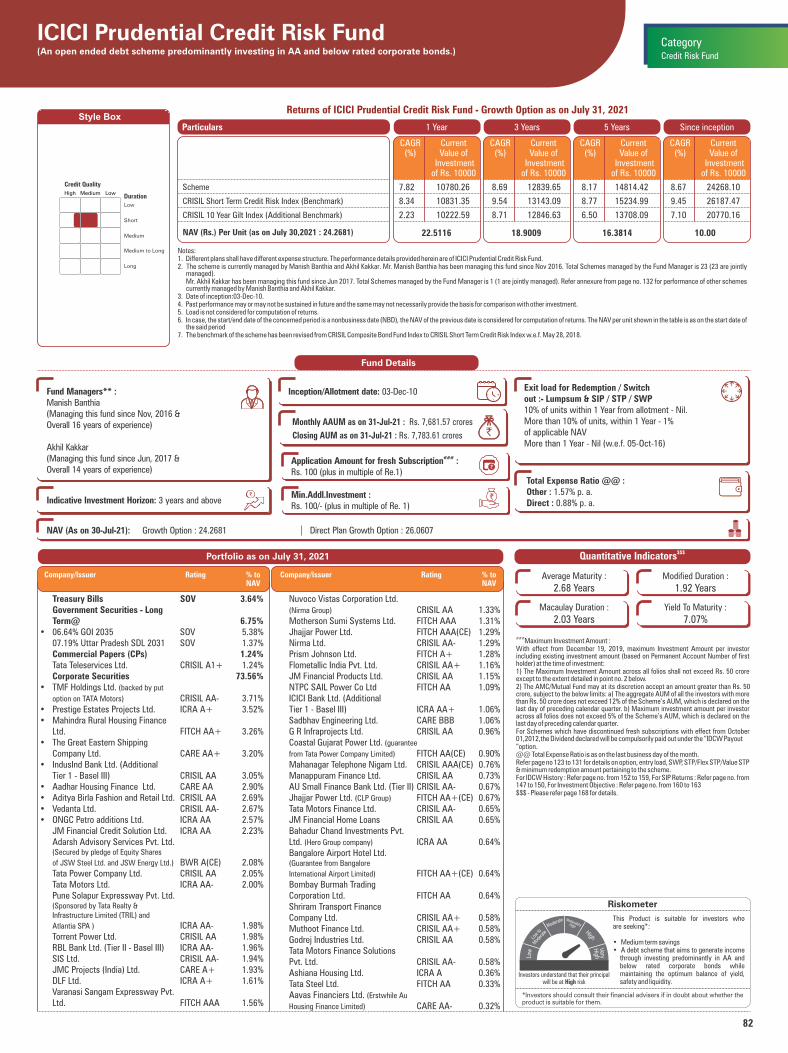
82
ICICI Prudential Credit Risk Fund(An open ended debt scheme predominantly investing in AA and below rated corporate bonds.)
Medium to Long
High Medium Low
Low
Short
Medium
Duration
Long
Credit Quality
Style Box
Notes:1. Different plans shall have different expense structure. The performance details provided herein are of ICICI Prudential Credit Risk Fund.2. The scheme is currently managed by Manish Banthia and Akhil Kakkar. Mr. Manish Banthia has been managing this fund since Nov 2016. Total Schemes managed by the Fund Manager is 23 (23 are jointly
managed). Mr. Akhil Kakkar has been managing this fund since Jun 2017. Total Schemes managed by the Fund Manager is 1 (1 are jointly managed). Refer annexure from page no. 132 for performance of other schemes
currently managed by Manish Banthia and Akhil Kakkar.3. Date of inception:03-Dec-10.4. Past performance may or may not be sustained in future and the same may not necessarily provide the basis for comparison with other investment.5. Load is not considered for computation of returns.6. In case, the start/end date of the concerned period is a nonbusiness date (NBD), the NAV of the previous date is considered for computation of returns. The NAV per unit shown in the table is as on the start date of
the said period7. The benchmark of the scheme has been revised from CRISIL Composite Bond Fund Index to CRISIL Short Term Credit Risk Index w.e.f. May 28, 2018.
Returns of ICICI Prudential Credit Risk Fund - Growth Option as on July 31, 2021
Fund Details
$$$Quantitative Indicators
Average Maturity :
2.68 YearsModified Duration :
1.92 Years
Macaulay Duration :
2.03 YearsYield To Maturity :
7.07%
###Maximum Investment Amount :
With effect from December 19, 2019, maximum Investment Amount per investor including existing investment amount (based on Permanent Account Number of first holder) at the time of investment:1) The Maximum Investment Amount across all folios shall not exceed Rs. 50 crore except to the extent detailed in point no. 2 below. 2) The AMC/Mutual Fund may at its discretion accept an amount greater than Rs. 50 crore, subject to the below limits: a) The aggregate AUM of all the investors with more than Rs. 50 crore does not exceed 12% of the Scheme’s AUM, which is declared on the last day of preceding calendar quarter. b) Maximum investment amount per investor across all folios does not exceed 5% of the Scheme’s AUM, which is declared on the last day of preceding calendar quarter.For Schemes which have discontinued fresh subscriptions with effect from October 01,2012,the Dividend declared will be compulsorily paid out under the “IDCW Payout“option.@@ Total Expense Ratio is as on the last business day of the month.Refer page no 123 to 131 for details on option, entry load, SWP, STP/Flex STP/Value STP & minimum redemption amount pertaining to the scheme.For IDCW History : Refer page no. from 152 to 159, For SIP Returns : Refer page no. from 147 to 150, For Investment Objective : Refer page no. from 160 to 163$$$ - Please refer page 168 for details.
Riskometer
This Product is suitable for investors who are seeking*:
• Medium term savings• A debt scheme that aims to generate income
through investing predominantly in AA and below rated corporate bonds while maintaining the optimum balance of yield, safety and liquidity.
*Investors should consult their financial advisers if in doubt about whether theproduct is suitable for them.
1 Year 3 Years 5 Years Since inceptionParticulars
22.5116 18.9009NAV (Rs.) Per Unit (as on July 30,2021 : 24.2681)
CAGR (%)
Current Value of
Investment of Rs. 10000
CAGR (%)
Current Value of
Investment of Rs. 10000
CAGR (%)
Current Value of
Investment of Rs. 10000
16.3814
CAGR (%)
Current Value of
Investment of Rs. 10000
10.00
7.82 10780.26 8.69 12839.65 8.17 14814.42 8.67 24268.10
8.34 10831.35 9.54 13143.09 8.77 15234.99 9.45 26187.47
2.23 10222.59 8.71 12846.63 6.50 13708.09 7.10 20770.16
Scheme
CRISIL Short Term Credit Risk Index (Benchmark)
CRISIL 10 Year Gilt Index (Additional Benchmark)
Fund Managers** :Manish Banthia(Managing this fund since Nov, 2016 & Overall 16 years of experience)
Akhil Kakkar (Managing this fund since Jun, 2017 & Overall 14 years of experience)
Indicative Investment Horizon: 3 years and above
Exit load for Redemption / Switchout :- Lumpsum & SIP / STP / SWP 10% of units within 1 Year from allotment - Nil.More than 10% of units, within 1 Year - 1% of applicable NAVMore than 1 Year - Nil (w.e.f. 05-Oct-16)
Total Expense Ratio @@ :Other : 1.57% p. a.Direct : 0.88% p. a.
Monthly AAUM as on 31-Jul-21 : Rs. 7,681.57 crores
Closing AUM as on 31-Jul-21 : Rs. 7,783.61 crores `
Inception/Allotment date: 03-Dec-10
Credit Risk Fund
Category
Treasury Bills SOV 3.64% Government Securities - Long Term@ 6.75%• 06.64% GOI 2035 SOV 5.38% 07.19% Uttar Pradesh SDL 2031 SOV 1.37% Commercial Papers (CPs) 1.24% Tata Teleservices Ltd. CRISIL A1+ 1.24% Corporate Securities 73.56%• TMF Holdings Ltd. (backed by put
option on TATA Motors) CRISIL AA- 3.71%• Prestige Estates Projects Ltd. ICRA A+ 3.52%• Mahindra Rural Housing Finance Ltd. FITCH AA+ 3.26%• The Great Eastern Shipping Company Ltd. CARE AA+ 3.20%• IndusInd Bank Ltd. (Additional Tier 1 - Basel III) CRISIL AA 3.05%• Aadhar Housing Finance Ltd. CARE AA 2.90%• Aditya Birla Fashion and Retail Ltd. CRISIL AA 2.69%• Vedanta Ltd. CRISIL AA- 2.67%• ONGC Petro additions Ltd. ICRA AA 2.57% JM Financial Credit Solution Ltd. ICRA AA 2.23% Adarsh Advisory Services Pvt. Ltd. (Secured by pledge of Equity Shares
of JSW Steel Ltd. and JSW Energy Ltd.) BWR A(CE) 2.08% Tata Power Company Ltd. CRISIL AA 2.05% Tata Motors Ltd. ICRA AA- 2.00% Pune Solapur Expressway Pvt. Ltd. (Sponsored by Tata Realty & Infrastructure Limited (TRIL) and
Atlantia SPA ) ICRA AA- 1.98% Torrent Power Ltd. CRISIL AA 1.98% RBL Bank Ltd. (Tier II - Basel III) ICRA AA- 1.96% SIS Ltd. CRISIL AA- 1.94% JMC Projects (India) Ltd. CARE A+ 1.93% DLF Ltd. ICRA A+ 1.61% Varanasi Sangam Expressway Pvt. Ltd. FITCH AAA 1.56%
Nuvoco Vistas Corporation Ltd. CRISIL AA 1.33%(Nirma Group)
Motherson Sumi Systems Ltd. FITCH AAA 1.31% Jhajjar Power Ltd. FITCH AAA(CE) 1.29% Nirma Ltd. CRISIL AA- 1.29% Prism Johnson Ltd. FITCH A+ 1.28% Flometallic India Pvt. Ltd. CRISIL AA+ 1.16% JM Financial Products Ltd. CRISIL AA 1.15% NTPC SAIL Power Co Ltd FITCH AA 1.09% ICICI Bank Ltd. (Additional Tier 1 - Basel III) ICRA AA+ 1.06% Sadbhav Engineering Ltd. CARE BBB 1.06% G R Infraprojects Ltd. CRISIL AA 0.96% Coastal Gujarat Power Ltd. (guarantee
from Tata Power Company Limited) FITCH AA(CE) 0.90% Mahanagar Telephone Nigam Ltd. CRISIL AAA(CE) 0.76% Manappuram Finance Ltd. CRISIL AA 0.73% AU Small Finance Bank Ltd. (Tier II) CRISIL AA- 0.67% Jhajjar Power Ltd. FITCH AA+(CE) 0.67%(CLP Group)
Tata Motors Finance Ltd. CRISIL AA- 0.65% JM Financial Home Loans CRISIL AA 0.65% Bahadur Chand Investments Pvt. Ltd. ICRA AA 0.64%(Hero Group company)
Bangalore Airport Hotel Ltd. (Guarantee from Bangalore
International Airport Limited) FITCH AA+(CE) 0.64% Bombay Burmah Trading Corporation Ltd. FITCH AA 0.64% Shriram Transport Finance Company Ltd. CRISIL AA+ 0.58% Muthoot Finance Ltd. CRISIL AA+ 0.58% Godrej Industries Ltd. CRISIL AA 0.58% Tata Motors Finance Solutions Pvt. Ltd. CRISIL AA- 0.58% Ashiana Housing Ltd. ICRA A 0.36% Tata Steel Ltd. FITCH AA 0.33% Aavas Financiers Ltd. (Erstwhile Au
Housing Finance Limited) CARE AA- 0.32%
Company/Issuer Rating % to NAV
Company/Issuer Rating % to NAV
Portfolio as on July 31, 2021
NAV (As on 30-Jul-21): Growth Option : 24.2681 Direct Plan Growth Option : 26.0607 `̀ `̀` `
`
###Application Amount for fresh Subscription :Rs. 100 (plus in multiple of Re.1)
Min.Addl.Investment :Rs. 100/- (plus in multiple of Re. 1)
Investors understand that their principal will be at High risk
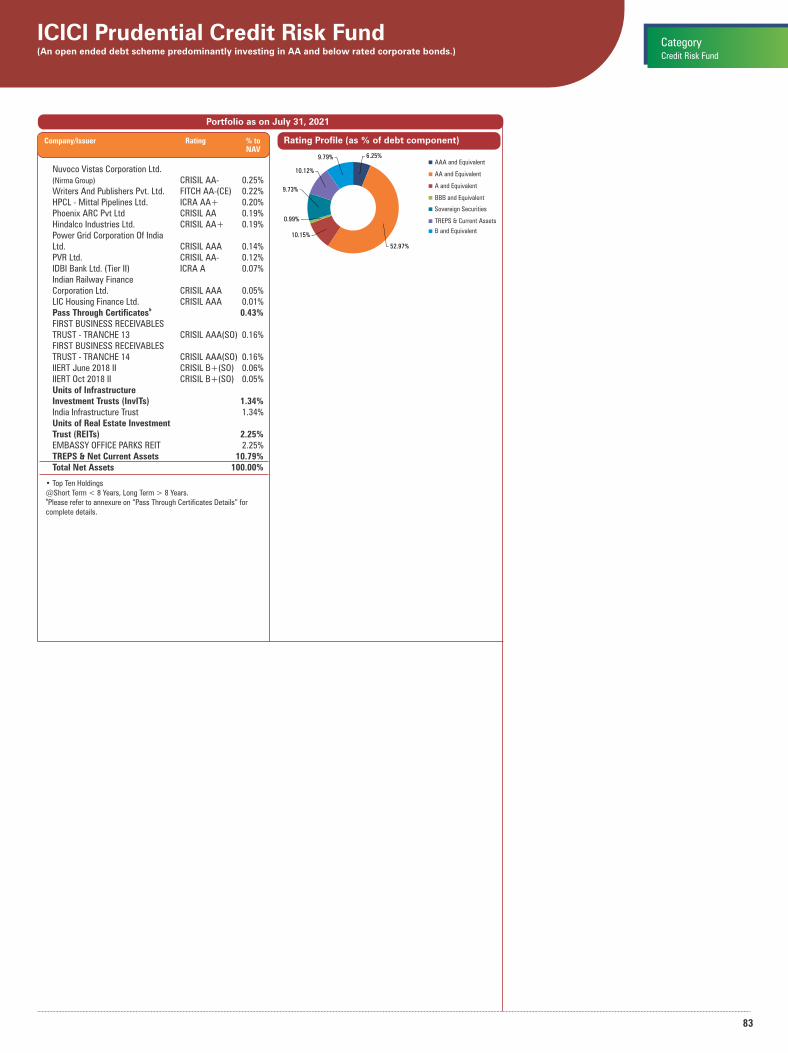
83
ICICI Prudential Credit Risk Fund(An open ended debt scheme predominantly investing in AA and below rated corporate bonds.) Credit Risk Fund
Category
Portfolio as on July 31, 2021
Nuvoco Vistas Corporation Ltd. CRISIL AA- 0.25%(Nirma Group)
Writers And Publishers Pvt. Ltd. FITCH AA-(CE) 0.22% HPCL - Mittal Pipelines Ltd. ICRA AA+ 0.20% Phoenix ARC Pvt Ltd CRISIL AA 0.19% Hindalco Industries Ltd. CRISIL AA+ 0.19% Power Grid Corporation Of India Ltd. CRISIL AAA 0.14% PVR Ltd. CRISIL AA- 0.12% IDBI Bank Ltd. (Tier II) ICRA A 0.07% Indian Railway Finance Corporation Ltd. CRISIL AAA 0.05% LIC Housing Finance Ltd. CRISIL AAA 0.01%
& Pass Through Certificates 0.43% FIRST BUSINESS RECEIVABLES TRUST - TRANCHE 13 CRISIL AAA(SO) 0.16% FIRST BUSINESS RECEIVABLES TRUST - TRANCHE 14 CRISIL AAA(SO) 0.16% IIERT June 2018 II CRISIL B+(SO) 0.06% IIERT Oct 2018 II CRISIL B+(SO) 0.05% Units of Infrastructure Investment Trusts (InvITs) 1.34% India Infrastructure Trust 1.34% Units of Real Estate Investment Trust (REITs) 2.25% EMBASSY OFFICE PARKS REIT 2.25% TREPS & Net Current Assets 10.79% Total Net Assets 100.00%
• Top Ten Holdings@Short Term < 8 Years, Long Term > 8 Years.&Please refer to annexure on “Pass Through Certificates Details” for
complete details.
Rating Profile (as % of debt component)Company/Issuer Rating % to NAV
AAA and Equivalent
AA and Equivalent
A and Equivalent
Sovereign Securities
BBB and Equivalent
TREPS & Current Assets
6.25%
52.97%
10.15%
0.99%
9.73%
10.12%
9.79%
B and Equivalent
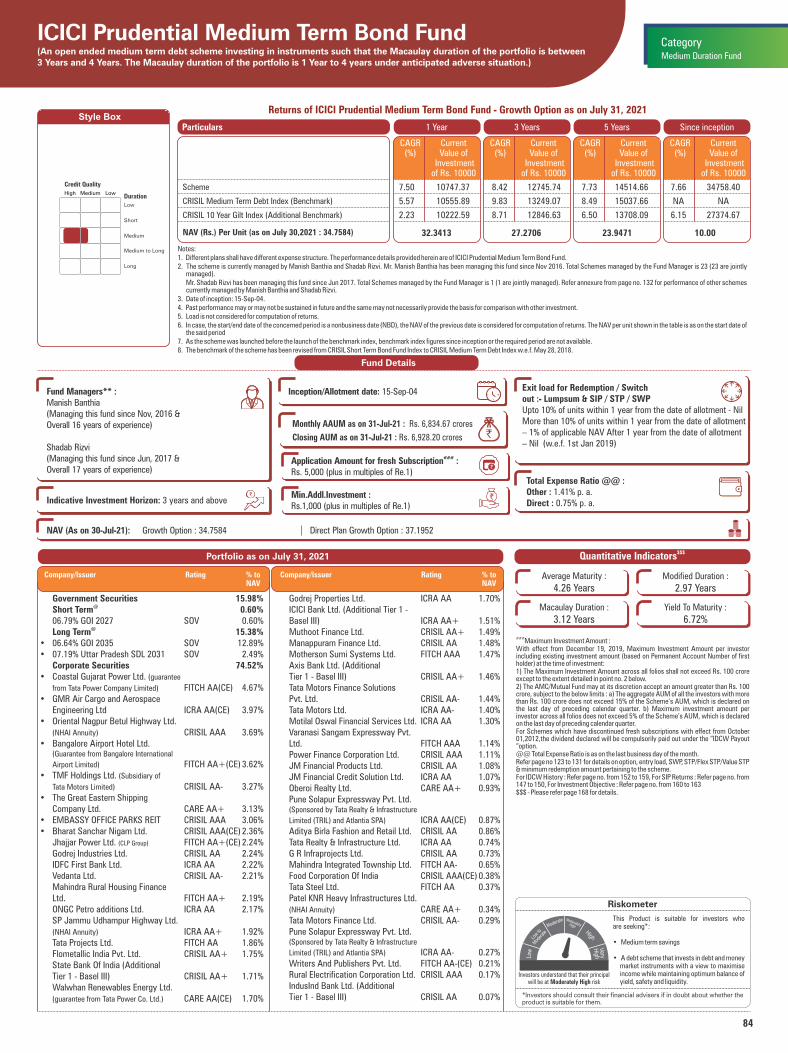
84
ICICI Prudential Medium Term Bond Fund(An open ended medium term debt scheme investing in instruments such that the Macaulay duration of the portfolio is between 3 Years and 4 Years. The Macaulay duration of the portfolio is 1 Year to 4 years under anticipated adverse situation.)
Medium to Long
High Medium Low
Low
Short
Medium
Duration
Long
Credit Quality
Style Box
Notes:1. Different plans shall have different expense structure. The performance details provided herein are of ICICI Prudential Medium Term Bond Fund.2. The scheme is currently managed by Manish Banthia and Shadab Rizvi. Mr. Manish Banthia has been managing this fund since Nov 2016. Total Schemes managed by the Fund Manager is 23 (23 are jointly
managed). Mr. Shadab Rizvi has been managing this fund since Jun 2017. Total Schemes managed by the Fund Manager is 1 (1 are jointly managed). Refer annexure from page no. 132 for performance of other schemes
currently managed by Manish Banthia and Shadab Rizvi.3. Date of inception: 15-Sep-04.4. Past performance may or may not be sustained in future and the same may not necessarily provide the basis for comparison with other investment.5. Load is not considered for computation of returns.6. In case, the start/end date of the concerned period is a nonbusiness date (NBD), the NAV of the previous date is considered for computation of returns. The NAV per unit shown in the table is as on the start date of
the said period7. As the scheme was launched before the launch of the benchmark index, benchmark index figures since inception or the required period are not available.8. The benchmark of the scheme has been revised from CRISIL Short Term Bond Fund Index to CRISIL Medium Term Debt Index w.e.f. May 28, 2018.
Returns of ICICI Prudential Medium Term Bond Fund - Growth Option as on July 31, 2021
Fund Details
$$$Quantitative Indicators
Average Maturity :
4.26 YearsModified Duration :
2.97 Years
Macaulay Duration :
3.12 YearsYield To Maturity :
6.72%
###Maximum Investment Amount :
With effect from December 19, 2019, Maximum Investment Amount per investor including existing investment amount (based on Permanent Account Number of first holder) at the time of investment:1) The Maximum Investment Amount across all folios shall not exceed Rs. 100 crore except to the extent detailed in point no. 2 below.2) The AMC/Mutual Fund may at its discretion accept an amount greater than Rs. 100 crore, subject to the below limits : a) The aggregate AUM of all the investors with more than Rs. 100 crore does not exceed 15% of the Scheme’s AUM, which is declared on the last day of preceding calendar quarter. b) Maximum investment amount per investor across all folios does not exceed 5% of the Scheme’s AUM, which is declared on the last day of preceding calendar quarter.For Schemes which have discontinued fresh subscriptions with effect from October 01,2012,the dividend declared will be compulsorily paid out under the “IDCW Payout “option.@@ Total Expense Ratio is as on the last business day of the month.Refer page no 123 to 131 for details on option, entry load, SWP, STP/Flex STP/Value STP & minimum redemption amount pertaining to the scheme.For IDCW History : Refer page no. from 152 to 159, For SIP Returns : Refer page no. from 147 to 150, For Investment Objective : Refer page no. from 160 to 163$$$ - Please refer page 168 for details.
Riskometer
This Product is suitable for investors who are seeking*:
• Medium term savings
• A debt scheme that invests in debt and money market instruments with a view to maximise income while maintaining optimum balance of yield, safety and liquidity.
*Investors should consult their financial advisers if in doubt about whether theproduct is suitable for them.
1 Year 3 Years 5 Years Since inceptionParticulars
32.3413 27.2706NAV (Rs.) Per Unit (as on July 30,2021 : 34.7584)
CAGR (%)
Current Value of
Investment of Rs. 10000
CAGR (%)
Current Value of
Investment of Rs. 10000
CAGR (%)
Current Value of
Investment of Rs. 10000
23.9471
CAGR (%)
Current Value of
Investment of Rs. 10000
10.00
7.50 10747.37 8.42 12745.74 7.73 14514.66 7.66 34758.40
5.57 10555.89 9.83 13249.07 8.49 15037.66 NA NA
2.23 10222.59 8.71 12846.63 6.50 13708.09 6.15 27374.67
Scheme
CRISIL Medium Term Debt Index (Benchmark)
CRISIL 10 Year Gilt Index (Additional Benchmark)
Monthly AAUM as on 31-Jul-21 : Rs. 6,834.67 crores
Closing AUM as on 31-Jul-21 : Rs. 6,928.20 crores `
Fund Managers** :Manish Banthia(Managing this fund since Nov, 2016 & Overall 16 years of experience)
Shadab Rizvi(Managing this fund since Jun, 2017 & Overall 17 years of experience)
Indicative Investment Horizon: 3 years and above
Inception/Allotment date: 15-Sep-04 Exit load for Redemption / Switchout :- Lumpsum & SIP / STP / SWP Upto 10% of units within 1 year from the date of allotment - Nil More than 10% of units within 1 year from the date of allotment – 1% of applicable NAV After 1 year from the date of allotment – Nil (w.e.f. 1st Jan 2019)
Total Expense Ratio @@ :Other : 1.41% p. a.Direct : 0.75% p. a.
Medium Duration Fund
Category
Government Securities 15.98%@ Short Term 0.60%
06.79% GOI 2027 SOV 0.60%@ Long Term 15.38%
• 06.64% GOI 2035 SOV 12.89%• 07.19% Uttar Pradesh SDL 2031 SOV 2.49% Corporate Securities 74.52%• Coastal Gujarat Power Ltd. (guarantee
from Tata Power Company Limited) FITCH AA(CE) 4.67%• GMR Air Cargo and Aerospace Engineering Ltd ICRA AA(CE) 3.97%• Oriental Nagpur Betul Highway Ltd. (NHAI Annuity) CRISIL AAA 3.69%• Bangalore Airport Hotel Ltd. (Guarantee from Bangalore International
Airport Limited) FITCH AA+(CE) 3.62%• TMF Holdings Ltd. (Subsidiary of
Tata Motors Limited) CRISIL AA- 3.27%• The Great Eastern Shipping Company Ltd. CARE AA+ 3.13%• EMBASSY OFFICE PARKS REIT CRISIL AAA 3.06%• Bharat Sanchar Nigam Ltd. CRISIL AAA(CE) 2.36% Jhajjar Power Ltd. FITCH AA+(CE) 2.24%(CLP Group)
Godrej Industries Ltd. CRISIL AA 2.24% IDFC First Bank Ltd. ICRA AA 2.22% Vedanta Ltd. CRISIL AA- 2.21% Mahindra Rural Housing Finance Ltd. FITCH AA+ 2.19% ONGC Petro additions Ltd. ICRA AA 2.17% SP Jammu Udhampur Highway Ltd. ICRA AA+ 1.92%(NHAI Annuity)
Tata Projects Ltd. FITCH AA 1.86% Flometallic India Pvt. Ltd. CRISIL AA+ 1.75% State Bank Of India (Additional Tier 1 - Basel III) CRISIL AA+ 1.71% Walwhan Renewables Energy Ltd. (guarantee from Tata Power Co. Ltd.) CARE AA(CE) 1.70%
Godrej Properties Ltd. ICRA AA 1.70% ICICI Bank Ltd. (Additional Tier 1 - Basel III) ICRA AA+ 1.51% Muthoot Finance Ltd. CRISIL AA+ 1.49% Manappuram Finance Ltd. CRISIL AA 1.48% Motherson Sumi Systems Ltd. FITCH AAA 1.47% Axis Bank Ltd. (Additional Tier 1 - Basel III) CRISIL AA+ 1.46% Tata Motors Finance Solutions Pvt. Ltd. CRISIL AA- 1.44% Tata Motors Ltd. ICRA AA- 1.40% Motilal Oswal Financial Services Ltd. ICRA AA 1.30% Varanasi Sangam Expressway Pvt. Ltd. FITCH AAA 1.14% Power Finance Corporation Ltd. CRISIL AAA 1.11% JM Financial Products Ltd. CRISIL AA 1.08% JM Financial Credit Solution Ltd. ICRA AA 1.07% Oberoi Realty Ltd. CARE AA+ 0.93% Pune Solapur Expressway Pvt. Ltd. (Sponsored by Tata Realty & Infrastructure
Limited (TRIL) and Atlantia SPA) ICRA AA(CE) 0.87% Aditya Birla Fashion and Retail Ltd. CRISIL AA 0.86% Tata Realty & Infrastructure Ltd. ICRA AA 0.74% G R Infraprojects Ltd. CRISIL AA 0.73% Mahindra Integrated Township Ltd. FITCH AA- 0.65% Food Corporation Of India CRISIL AAA(CE) 0.38% Tata Steel Ltd. FITCH AA 0.37% Patel KNR Heavy Infrastructures Ltd. CARE AA+ 0.34%(NHAI Annuity)
Tata Motors Finance Ltd. CRISIL AA- 0.29% Pune Solapur Expressway Pvt. Ltd. (Sponsored by Tata Realty & Infrastructure
Limited (TRIL) and Atlantia SPA) ICRA AA- 0.27% Writers And Publishers Pvt. Ltd. FITCH AA-(CE) 0.21% Rural Electrification Corporation Ltd. CRISIL AAA 0.17% IndusInd Bank Ltd. (Additional Tier 1 - Basel III) CRISIL AA 0.07%
Portfolio as on July 31, 2021
Company/Issuer Rating % to NAV
Company/Issuer Rating % to NAV
NAV (As on 30-Jul-21): Growth Option : 34.7584 Direct Plan Growth Option : 37.1952 `̀ `̀` `
`
###Application Amount for fresh Subscription :Rs. 5,000 (plus in multiples of Re.1)
Min.Addl.Investment :Rs.1,000 (plus in multiples of Re.1)
Investors understand that their principal will be at Moderately High risk

85
ICICI Prudential Medium Term Bond Fund(An open ended medium term debt scheme investing in instruments such that the Macaulay duration of the portfolio is between 3 Years and 4 Years. The Macaulay duration of the portfolio is 1 Year to 4 years under anticipated adverse situation.)
Medium Duration Fund
Category
Portfolio as on July 31, 2021
Hindalco Industries Ltd. CRISIL AA+ 0.01% TREPS & Net Current Assets 9.50% Total Net Assets 100.00%
• Top Ten Holdings@Short Term < 8 Years, Long Term > 8 Years.&Please refer to annexure on “Pass Through Certificates Details” for
complete details.
Company/Issuer Rating % to NAV
Rating Profile (as % of debt component)
AAA and Equivalent
AA and Equivalent
TREPS & Current Assets
Sovereign Securi�es
13.37%
61.15%
15.98%
9.50%

86
ICICI Prudential Long Term Bond Fund(An open ended debt scheme investing in instruments such that the Macaulay duration of the portfolio is greater than 7 Years)
Medium to Long
High Medium Low
Low
Short
Medium
Duration
Long
Credit Quality
Style Box
Notes:1. Different plans shall have different expense structure. The performance details provided herein are of ICICI Prudential Long Term Bond Fund.2. The scheme is currently managed by Manish Banthia and Anuj Tagra. Mr. Manish Banthia has been managing this fund since Sep 2013. Total Schemes managed by the Fund Manager is 23 (23 are jointly
managed). Mr. Anuj Tagra has been managing this fund since Dec 2020. Total Schemes managed by the Fund Manager is 9 (9 are jointly managed). Refer annexure from page no. 132 for performance of other schemes
currently managed by Manish Banthia and Anuj Tagra.3. Date of inception: 09-Jul-98.4. Past performance may or may not be sustained in future and the same may not necessarily provide the basis for comparison with other investment.5. Load is not considered for computation of returns.6. In case, the start/end date of the concerned period is a nonbusiness date (NBD), the NAV of the previous date is considered for computation of returns. The NAV per unit shown in the table is as on the start date of
the said period7. As the scheme was launched before the launch of the benchmark index, benchmark index figures since inception or the required period are not available.
Returns of ICICI Prudential Long Term Bond Fund - Growth Option as on July 31, 2021
Quantitative Indicators
Average Maturity :
15.18 YearsModified Duration :
8.72 Years
Macaulay Duration :
9.05 YearsYield To Maturity :
6.98%
For Schemes which have discontinued fresh subscriptions with effect from October 01,2012,the IDCW declared will be compulsorily paid out under the “IDCW payout “option.@@ Total Expense Ratio is as on the last business day of the month.With effect from May 28, 2018, the benchmark of ICICI Prudential Long Term Bond Fund has been changed from Crisil Composite Bond Fund Index to Nifty Long Duration Debt IndexRefer page no 123 to 131 for details on option, entry load, SWP, STP/Flex STP/Value STP & minimum redemption amount pertaining to the scheme.For IDCW History : Refer page no. from 152 to 159, For SIP Returns : Refer page no. from 147 to 150, For Investment Objective : Refer page no. from 160 to 163
Riskometer
This Product is suitable for investors who are seeking*:
• Long term wealth creation
• A debt scheme that invests in debt and money market instruments with an aim to maximise income while maintaining an optimum balance of yield, safety and liquidity.
*Investors should consult their financial advisers if in doubt about whether theproduct is suitable for them.
1 Year 3 Years 5 Years Since inceptionParticulars
70.7074 54.8269NAV (Rs.) Per Unit (as on July 30,2021 : 71.0529)
CAGR (%)
Current Value of
Investment of Rs. 10000
CAGR (%)
Current Value of
Investment of Rs. 10000
CAGR (%)
Current Value of
Investment of Rs. 10000
49.2559
CAGR (%)
Current Value of
Investment of Rs. 10000
10.00
0.49 10048.86 9.03 12959.50 7.59 14425.26 8.87 71052.90
3.10 10309.37 10.35 13438.67 7.82 14575.63 NA NA
2.23 10222.59 8.71 12846.63 6.50 13708.09 NA NA
Scheme
Nifty Long Duration Debt Index (Benchmark)
CRISIL 10 year Gilt index (Additional Benchmark)
Long Duration Fund
Category
Government Securities 85.48%@Short Term 0.26%
07.67% Tamil Nadu SDL 2023 SOV 0.26%@Long Term 85.22%
06.64% GOI 2035 SOV 62.38%06.67% GOI 2050 SOV 15.74%07.19% Uttar Pradesh SDL 2031 SOV 6.79%07.27% Mizoram SDL 2033 SOV 0.18%06.79% GOI 2029 SOV 0.14%Corporate Securities 12.94%The Great Eastern Shipping Company Ltd. CARE AA+ 7.98%NABARD CRISIL AAA 4.55%Indian Railway Finance Corporation Ltd. CRISIL AAA 0.41%TREPS & Net Current Assets 1.58%Total Net Assets 100.00%
@Short Term < 8 Years, Long Term > 8 Years.
Portfolio as on July 31, 2021
Rating Profile (as % of debt component)Company/Issuer Rating % to NAV
AAA and Equivalent
AA and Equivalent
Sovereign Securi�es
TREPS & Current Assets
Fund Details
Fund Managers** :Manish Banthia (Managing this fund since Sep, 2013 & Overall 16 years of experience)Anuj Tagra (Managing this fund since Dec, 2020& overall 14 years of experience)
Indicative Investment Horizon: 3 years and above
Exit load for Redemption / Switchout :- Lumpsum & SIP / STP / SWP Nil
Inception/Allotment date: 09-Jul-98
Monthly AAUM as on 30-Jun-21 : Rs. 754.93 crores
Closing AUM as on 30-Jun-21 : Rs. 746.14 crores `
Total Expense Ratio @@ :Other : 2.00% p. a.Direct : 1.40% p. a.
NAV (As on 30-Jul-21): Growth Option : 71.0529 Direct Plan Growth Option : 76.1077 `̀ `̀` `
`
Application Amount for fresh Subscription :Rs.5,000 (plus in multiples of Re.1)
Min.Addl.Investment :Rs.1,000 (plus in multiples of Re.1)
Investors understand that their principal will be at Moderate risk
4.96%7.98%
85.48%
1.58%
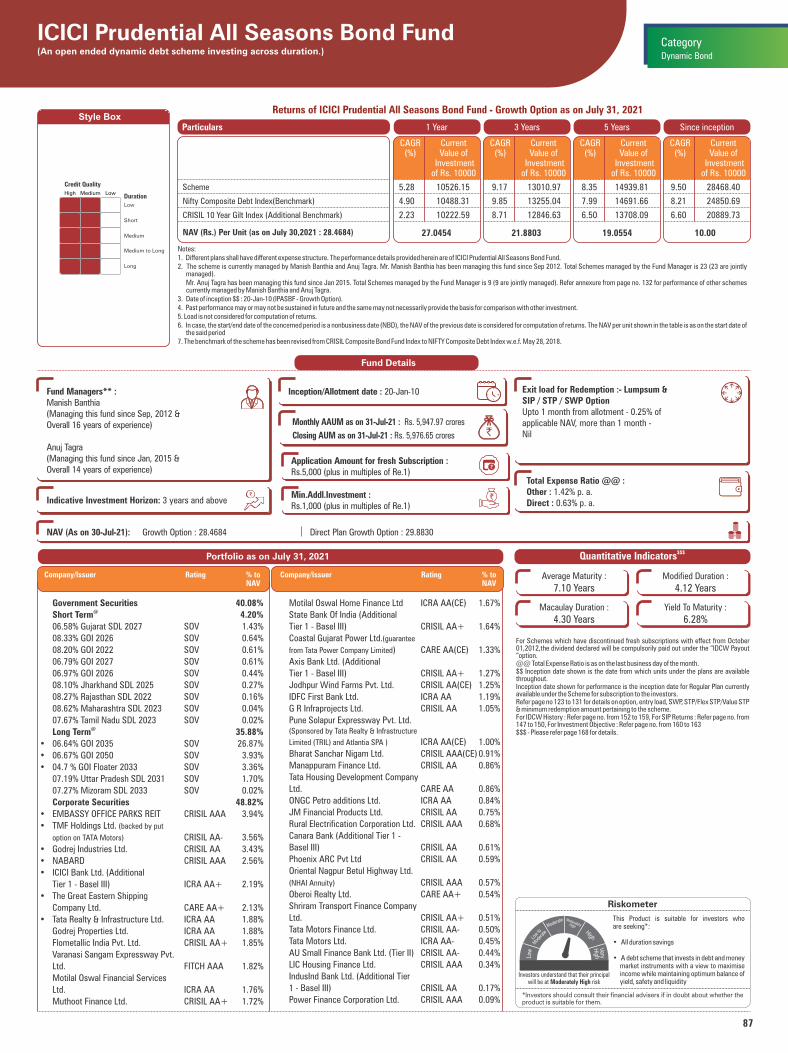
87
ICICI Prudential All Seasons Bond Fund(An open ended dynamic debt scheme investing across duration.)
Medium to Long
High Medium Low
Low
Short
Medium
Duration
Long
Credit Quality
Style Box
Notes:1. Different plans shall have different expense structure. The performance details provided herein are of ICICI Prudential All Seasons Bond Fund.2. The scheme is currently managed by Manish Banthia and Anuj Tagra. Mr. Manish Banthia has been managing this fund since Sep 2012. Total Schemes managed by the Fund Manager is 23 (23 are jointly
managed). Mr. Anuj Tagra has been managing this fund since Jan 2015. Total Schemes managed by the Fund Manager is 9 (9 are jointly managed). Refer annexure from page no. 132 for performance of other schemes
currently managed by Manish Banthia and Anuj Tagra.3. Date of inception $$ : 20-Jan-10 (IPASBF - Growth Option).4. Past performance may or may not be sustained in future and the same may not necessarily provide the basis for comparison with other investment.5. Load is not considered for computation of returns.6. In case, the start/end date of the concerned period is a nonbusiness date (NBD), the NAV of the previous date is considered for computation of returns. The NAV per unit shown in the table is as on the start date of
the said period7. The benchmark of the scheme has been revised from CRISIL Composite Bond Fund Index to NIFTY Composite Debt Index w.e.f. May 28, 2018.
Returns of ICICI Prudential All Seasons Bond Fund - Growth Option as on July 31, 2021
Fund Details
$$$Quantitative Indicators
Average Maturity :
7.10 YearsModified Duration :
4.12 Years
Macaulay Duration :
4.30 YearsYield To Maturity :
6.28%
For Schemes which have discontinued fresh subscriptions with effect from October 01,2012,the dividend declared will be compulsorily paid out under the “IDCW Payout “option.@@ Total Expense Ratio is as on the last business day of the month.$$ Inception date shown is the date from which units under the plans are available throughout.Inception date shown for performance is the inception date for Regular Plan currently available under the Scheme for subscription to the investors.Refer page no 123 to 131 for details on option, entry load, SWP, STP/Flex STP/Value STP & minimum redemption amount pertaining to the scheme.For IDCW History : Refer page no. from 152 to 159, For SIP Returns : Refer page no. from 147 to 150, For Investment Objective : Refer page no. from 160 to 163$$$ - Please refer page 168 for details.
Riskometer
This Product is suitable for investors who are seeking*:
• All duration savings
• A debt scheme that invests in debt and money market instruments with a view to maximise income while maintaining optimum balance of yield, safety and liquidity
*Investors should consult their financial advisers if in doubt about whether theproduct is suitable for them.
1 Year 3 Years 5 Years Since inceptionParticulars
27.0454 21.8803NAV (Rs.) Per Unit (as on July 30,2021 : 28.4684)
CAGR (%)
Current Value of
Investment of Rs. 10000
CAGR (%)
Current Value of
Investment of Rs. 10000
CAGR (%)
Current Value of
Investment of Rs. 10000
19.0554
CAGR (%)
Current Value of
Investment of Rs. 10000
10.00
5.28 10526.15 9.17 13010.97 8.35 14939.81 9.50 28468.40
4.90 10488.31 9.85 13255.04 7.99 14691.66 8.21 24850.69
2.23 10222.59 8.71 12846.63 6.50 13708.09 6.60 20889.73
Scheme
Nifty Composite Debt Index(Benchmark)
CRISIL 10 Year Gilt Index (Additional Benchmark)
Monthly AAUM as on 31-Jul-21 : Rs. 5,947.97 crores
Closing AUM as on 31-Jul-21 : Rs. 5,976.65 crores `
Fund Managers** :Manish Banthia (Managing this fund since Sep, 2012 & Overall 16 years of experience)
Anuj Tagra(Managing this fund since Jan, 2015 & Overall 14 years of experience)
Indicative Investment Horizon: 3 years and above
Inception/Allotment date : 20-Jan-10 Exit load for Redemption :- Lumpsum &SIP / STP / SWP OptionUpto 1 month from allotment - 0.25% ofapplicable NAV, more than 1 month -Nil
Total Expense Ratio @@ :Other : 1.42% p. a.Direct : 0.63% p. a.
Dynamic Bond
Category
Government Securities 40.08%
Short Term 4.20%@
06.58% Gujarat SDL 2027 SOV 1.43%
08.33% GOI 2026 SOV 0.64%
08.20% GOI 2022 SOV 0.61%
06.79% GOI 2027 SOV 0.61%
06.97% GOI 2026 SOV 0.44%
08.10% Jharkhand SDL 2025 SOV 0.27%
08.27% Rajasthan SDL 2022 SOV 0.16%
08.62% Maharashtra SDL 2023 SOV 0.04%
07.67% Tamil Nadu SDL 2023 SOV 0.02%
Long Term 35.88%@
• 06.64% GOI 2035 SOV 26.87%
• 06.67% GOI 2050 SOV 3.93%
• 04.7 % GOI Floater 2033 SOV 3.36%
07.19% Uttar Pradesh SDL 2031 SOV 1.70%
07.27% Mizoram SDL 2033 SOV 0.02%
Corporate Securities 48.82%
• EMBASSY OFFICE PARKS REIT CRISIL AAA 3.94%
• TMF Holdings Ltd. (backed by put
option on TATA Motors) CRISIL AA- 3.56%
• Godrej Industries Ltd. CRISIL AA 3.43%
• NABARD CRISIL AAA 2.56%
• ICICI Bank Ltd. (Additional
Tier 1 - Basel III) ICRA AA+ 2.19%
• The Great Eastern Shipping
Company Ltd. CARE AA+ 2.13%
• Tata Realty & Infrastructure Ltd. ICRA AA 1.88%
Godrej Properties Ltd. ICRA AA 1.88%
Flometallic India Pvt. Ltd. CRISIL AA+ 1.85%
Varanasi Sangam Expressway Pvt.
Ltd. FITCH AAA 1.82%
Motilal Oswal Financial Services
Ltd. ICRA AA 1.76%
Muthoot Finance Ltd. CRISIL AA+ 1.72%
Portfolio as on July 31, 2021
Company/Issuer Rating % to NAV
NAV (As on 30-Jul-21): Growth Option : 28.4684 Direct Plan Growth Option : 29.8830 `̀ `̀` `
`
Application Amount for fresh Subscription :Rs.5,000 (plus in multiples of Re.1)
Min.Addl.Investment :Rs.1,000 (plus in multiples of Re.1)
Motilal Oswal Home Finance Ltd ICRA AA(CE) 1.67%
State Bank Of India (Additional
Tier 1 - Basel III) CRISIL AA+ 1.64%
Coastal Gujarat Power Ltd.(guarantee
from Tata Power Company Limited) CARE AA(CE) 1.33%
Axis Bank Ltd. (Additional
Tier 1 - Basel III) CRISIL AA+ 1.27%
Jodhpur Wind Farms Pvt. Ltd. CRISIL AA(CE) 1.25%
IDFC First Bank Ltd. ICRA AA 1.19%
G R Infraprojects Ltd. CRISIL AA 1.05%
Pune Solapur Expressway Pvt. Ltd. (Sponsored by Tata Realty & Infrastructure
Limited (TRIL) and Atlantia SPA ) ICRA AA(CE) 1.00%
Bharat Sanchar Nigam Ltd. CRISIL AAA(CE) 0.91%
Manappuram Finance Ltd. CRISIL AA 0.86%
Tata Housing Development Company
Ltd. CARE AA 0.86%
ONGC Petro additions Ltd. ICRA AA 0.84%
JM Financial Products Ltd. CRISIL AA 0.75%
Rural Electrification Corporation Ltd. CRISIL AAA 0.68%
Canara Bank (Additional Tier 1 -
Basel III) CRISIL AA 0.61%
Phoenix ARC Pvt Ltd CRISIL AA 0.59%
Oriental Nagpur Betul Highway Ltd.
(NHAI Annuity) CRISIL AAA 0.57%
Oberoi Realty Ltd. CARE AA+ 0.54%
Shriram Transport Finance Company
Ltd. CRISIL AA+ 0.51%
Tata Motors Finance Ltd. CRISIL AA- 0.50%
Tata Motors Ltd. ICRA AA- 0.45%
AU Small Finance Bank Ltd. (Tier II) CRISIL AA- 0.44%
LIC Housing Finance Ltd. CRISIL AAA 0.34%
IndusInd Bank Ltd. (Additional Tier
1 - Basel III) CRISIL AA 0.17%
Power Finance Corporation Ltd. CRISIL AAA 0.09%
Company/Issuer Rating % to NAV
Investors understand that their principal will be at Moderately High risk

88
ICICI Prudential All Seasons Bond Fund(An open ended dynamic debt scheme investing across duration.) Dynamic Bond
Category
Portfolio as on July 31, 2021
Pass Through Certificates 0.18%&
Sansar Trust November 2018 A1 ICRA AAA(SO) 0.18%
TREPS & Net Current Assets 10.92%
Total Net Assets 100.00%
• Top Ten Holdings@Short Term < 8 Years, Long Term > 8 Years.&Please refer to annexure on “Pass Through Certificates Details” for
complete details.
Company/Issuer Rating % to NAV
Rating Profile (as % of debt component)
AAA and Equivalent
AA and Equivalent
Sovereign Securi�es
TREPS & Current Assets
11.09%
37.91%
40.08%
10.92%
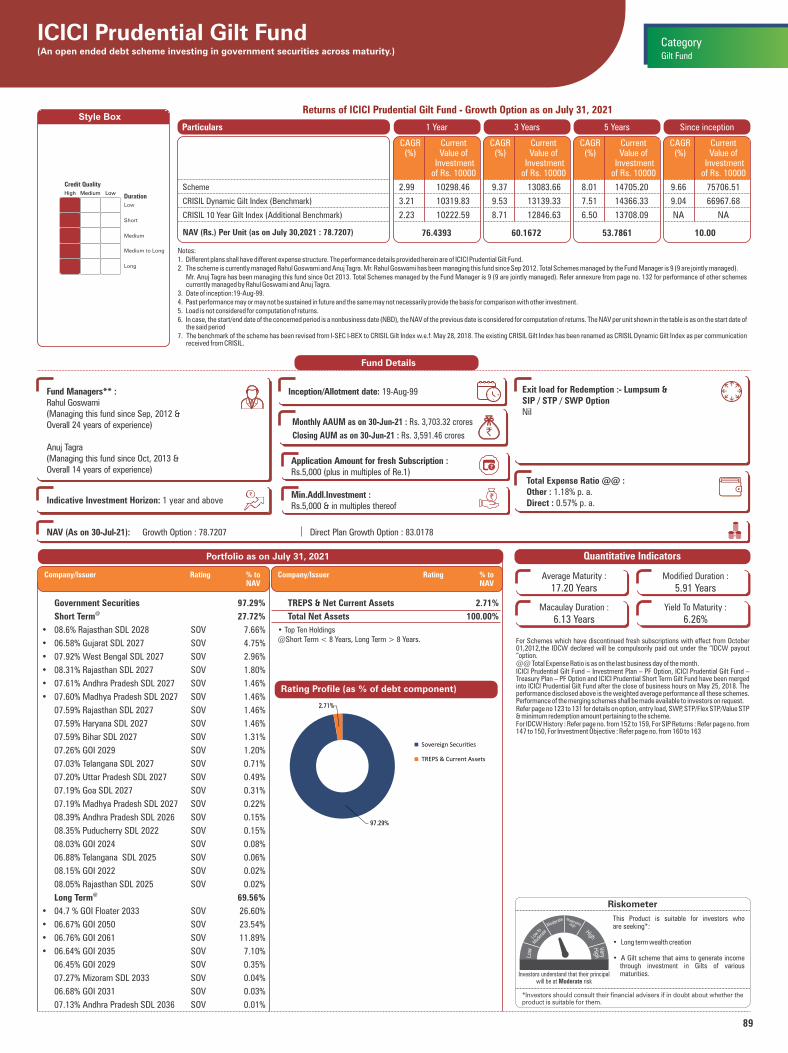
89
ICICI Prudential Gilt Fund(An open ended debt scheme investing in government securities across maturity.)
Medium to Long
High Medium Low
Low
Short
Medium
Duration
Long
Credit Quality
Style Box
Notes:1. Different plans shall have different expense structure. The performance details provided herein are of ICICI Prudential Gilt Fund.2. The scheme is currently managed Rahul Goswami and Anuj Tagra. Mr. Rahul Goswami has been managing this fund since Sep 2012. Total Schemes managed by the Fund Manager is 9 (9 are jointly managed). Mr. Anuj Tagra has been managing this fund since Oct 2013. Total Schemes managed by the Fund Manager is 9 (9 are jointly managed). Refer annexure from page no. 132 for performance of other schemes
currently managed by Rahul Goswami and Anuj Tagra.3. Date of inception:19-Aug-99.4. Past performance may or may not be sustained in future and the same may not necessarily provide the basis for comparison with other investment.5. Load is not considered for computation of returns.6. In case, the start/end date of the concerned period is a nonbusiness date (NBD), the NAV of the previous date is considered for computation of returns. The NAV per unit shown in the table is as on the start date of
the said period7. The benchmark of the scheme has been revised from I-SEC I-BEX to CRISIL Gilt Index w.e.f. May 28, 2018. The existing CRISIL Gilt Index has been renamed as CRISIL Dynamic Gilt Index as per communication
received from CRISIL.
Returns of ICICI Prudential Gilt Fund - Growth Option as on July 31, 2021
Fund Details
Quantitative Indicators
Average Maturity :
17.20 YearsModified Duration :
5.91 Years
Macaulay Duration :
6.13 YearsYield To Maturity :
6.26%
For Schemes which have discontinued fresh subscriptions with effect from October 01,2012,the IDCW declared will be compulsorily paid out under the “IDCW payout “option.@@ Total Expense Ratio is as on the last business day of the month.ICICI Prudential Gilt Fund – Investment Plan – PF Option, ICICI Prudential Gilt Fund – Treasury Plan – PF Option and ICICI Prudential Short Term Gilt Fund have been merged into ICICI Prudential Gilt Fund after the close of business hours on May 25, 2018. The performance disclosed above is the weighted average performance all these schemes. Performance of the merging schemes shall be made available to investors on request.Refer page no 123 to 131 for details on option, entry load, SWP, STP/Flex STP/Value STP & minimum redemption amount pertaining to the scheme.For IDCW History : Refer page no. from 152 to 159, For SIP Returns : Refer page no. from 147 to 150, For Investment Objective : Refer page no. from 160 to 163
Riskometer
This Product is suitable for investors who are seeking*:
• Long term wealth creation
• A Gilt scheme that aims to generate income through investment in Gilts of various maturities.
*Investors should consult their financial advisers if in doubt about whether theproduct is suitable for them.
1 Year 3 Years 5 Years Since inceptionParticulars
76.4393 60.1672NAV (Rs.) Per Unit (as on July 30,2021 : 78.7207)
CAGR (%)
Current Value of
Investment of Rs. 10000
CAGR (%)
Current Value of
Investment of Rs. 10000
CAGR (%)
Current Value of
Investment of Rs. 10000
53.7861
CAGR (%)
Current Value of
Investment of Rs. 10000
10.00
2.99 10298.46 9.37 13083.66 8.01 14705.20 9.66 75706.51
3.21 10319.83 9.53 13139.33 7.51 14366.33 9.04 66967.68
2.23 10222.59 8.71 12846.63 6.50 13708.09 NA NA
Scheme
CRISIL Dynamic Gilt Index (Benchmark)
CRISIL 10 Year Gilt Index (Additional Benchmark)
Monthly AAUM as on 30-Jun-21 : Rs. 3,703.32 crores
Closing AUM as on 30-Jun-21 : Rs. 3,591.46 crores `
Fund Managers** :Rahul Goswami (Managing this fund since Sep, 2012 & Overall 24 years of experience)
Anuj Tagra (Managing this fund since Oct, 2013 & Overall 14 years of experience)
Indicative Investment Horizon: 1 year and above
Inception/Allotment date: 19-Aug-99 Exit load for Redemption :- Lumpsum &SIP / STP / SWP OptionNil
Total Expense Ratio @@ :Other : 1.18% p. a.Direct : 0.57% p. a.
Gilt Fund
Category
Government Securities 97.29%@ Short Term 27.72%
• 08.6% Rajasthan SDL 2028 SOV 7.66%
• 06.58% Gujarat SDL 2027 SOV 4.75%
• 07.92% West Bengal SDL 2027 SOV 2.96%
• 08.31% Rajasthan SDL 2027 SOV 1.80%
• 07.61% Andhra Pradesh SDL 2027 SOV 1.46%
• 07.60% Madhya Pradesh SDL 2027 SOV 1.46%
07.59% Rajasthan SDL 2027 SOV 1.46%
07.59% Haryana SDL 2027 SOV 1.46%
07.59% Bihar SDL 2027 SOV 1.31%
07.26% GOI 2029 SOV 1.20%
07.03% Telangana SDL 2027 SOV 0.71%
07.20% Uttar Pradesh SDL 2027 SOV 0.49%
07.19% Goa SDL 2027 SOV 0.31%
07.19% Madhya Pradesh SDL 2027 SOV 0.22%
08.39% Andhra Pradesh SDL 2026 SOV 0.15%
08.35% Puducherry SDL 2022 SOV 0.15%
08.03% GOI 2024 SOV 0.08%
06.88% Telangana SDL 2025 SOV 0.06%
08.15% GOI 2022 SOV 0.02%
08.05% Rajasthan SDL 2025 SOV 0.02%@ Long Term 69.56%
• 04.7 % GOI Floater 2033 SOV 26.60%
• 06.67% GOI 2050 SOV 23.54%
• 06.76% GOI 2061 SOV 11.89%
• 06.64% GOI 2035 SOV 7.10%
06.45% GOI 2029 SOV 0.35%
07.27% Mizoram SDL 2033 SOV 0.04%
06.68% GOI 2031 SOV 0.03%
07.13% Andhra Pradesh SDL 2036 SOV 0.01%
• Top Ten Holdings@Short Term < 8 Years, Long Term > 8 Years.
Portfolio as on July 31, 2021
Rating Profile (as % of debt component)
Company/Issuer Rating % to NAV
Sovereign Securi�es
TREPS & Current Assets
NAV (As on 30-Jul-21): Growth Option : 78.7207 Direct Plan Growth Option : 83.0178 `̀ `̀` `
`
Application Amount for fresh Subscription :Rs.5,000 (plus in multiples of Re.1)
Min.Addl.Investment :Rs.5,000 & in multiples thereof
Investors understand that their principal will be at Moderate risk
TREPS & Net Current Assets 2.71%
Total Net Assets 100.00%
Company/Issuer Rating % to NAV
97.29%
2.71%
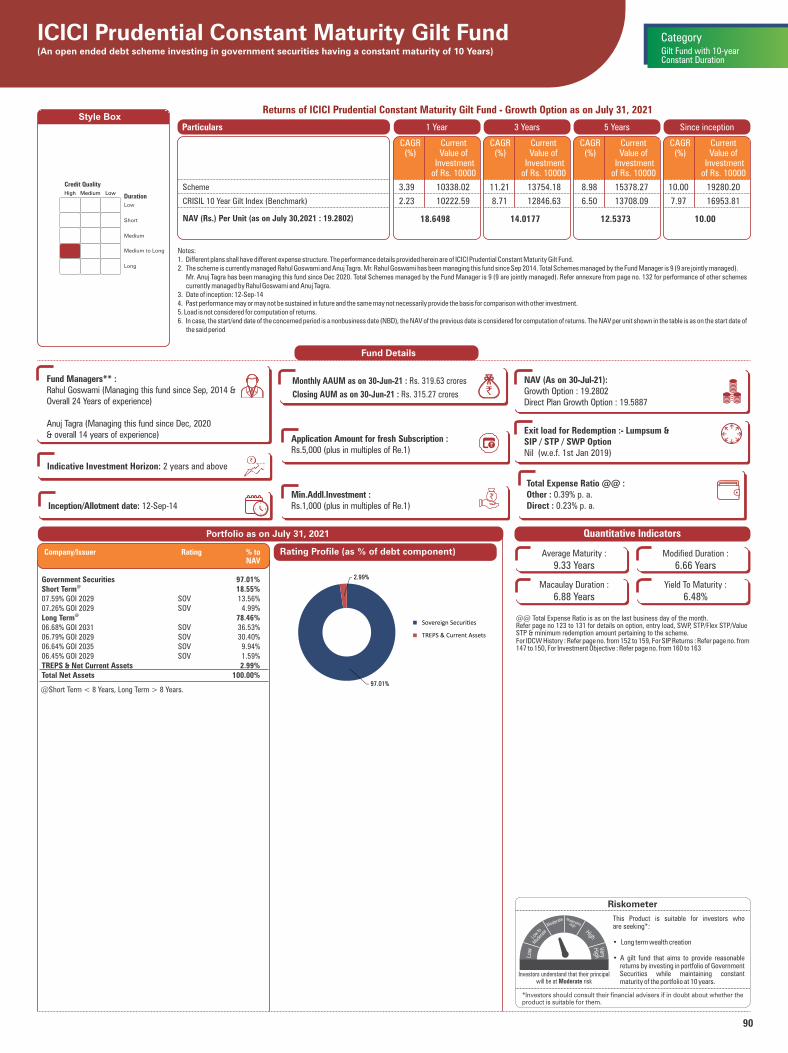
90
ICICI Prudential Constant Maturity Gilt Fund(An open ended debt scheme investing in government securities having a constant maturity of 10 Years)
Medium to Long
High Medium Low
Low
Short
Medium
Duration
Long
Credit Quality
Style Box
Notes:1. Different plans shall have different expense structure. The performance details provided herein are of ICICI Prudential Constant Maturity Gilt Fund.2. The scheme is currently managed Rahul Goswami and Anuj Tagra. Mr. Rahul Goswami has been managing this fund since Sep 2014. Total Schemes managed by the Fund Manager is 9 (9 are jointly managed). Mr. Anuj Tagra has been managing this fund since Dec 2020. Total Schemes managed by the Fund Manager is 9 (9 are jointly managed). Refer annexure from page no. 132 for performance of other schemes
currently managed by Rahul Goswami and Anuj Tagra.3. Date of inception: 12-Sep-144. Past performance may or may not be sustained in future and the same may not necessarily provide the basis for comparison with other investment.5. Load is not considered for computation of returns.6. In case, the start/end date of the concerned period is a nonbusiness date (NBD), the NAV of the previous date is considered for computation of returns. The NAV per unit shown in the table is as on the start date of
the said period
Returns of ICICI Prudential Constant Maturity Gilt Fund - Growth Option as on July 31, 2021
Quantitative Indicators
Average Maturity :
9.33 YearsModified Duration :
6.66 Years
Macaulay Duration :
6.88 YearsYield To Maturity :
6.48%
@@ Total Expense Ratio is as on the last business day of the month.Refer page no 123 to 131 for details on option, entry load, SWP, STP/Flex STP/Value STP & minimum redemption amount pertaining to the scheme.For IDCW History : Refer page no. from 152 to 159, For SIP Returns : Refer page no. from 147 to 150, For Investment Objective : Refer page no. from 160 to 163
Riskometer
This Product is suitable for investors who are seeking*:
• Long term wealth creation
• A gilt fund that aims to provide reasonable returns by investing in portfolio of Government Securities while maintaining constant maturity of the portfolio at 10 years.
*Investors should consult their financial advisers if in doubt about whether theproduct is suitable for them.
1 Year 3 Years 5 Years Since inceptionParticulars
18.6498 14.0177
Scheme
CRISIL 10 Year Gilt Index (Benchmark)
NAV (Rs.) Per Unit (as on July 30,2021 : 19.2802)
CAGR (%)
Current Value of
Investment of Rs. 10000
CAGR (%)
Current Value of
Investment of Rs. 10000
CAGR (%)
Current Value of
Investment of Rs. 10000
12.5373
CAGR (%)
Current Value of
Investment of Rs. 10000
10.00
3.39 10338.02 11.21 13754.18 8.98 15378.27 10.00 19280.20
2.23 10222.59 8.71 12846.63 6.50 13708.09 7.97 16953.81
Gilt Fund with 10-yearConstant Duration
Category
Government Securities 97.01%@ Short Term 18.55%
07.59% GOI 2029 SOV 13.56%07.26% GOI 2029 SOV 4.99%
@ Long Term 78.46%06.68% GOI 2031 SOV 36.53%06.79% GOI 2029 SOV 30.40%06.64% GOI 2035 SOV 9.94%06.45% GOI 2029 SOV 1.59%TREPS & Net Current Assets 2.99%Total Net Assets 100.00%
@Short Term < 8 Years, Long Term > 8 Years.
Portfolio as on July 31, 2021
Rating Profile (as % of debt component)Company/Issuer Rating % to NAV
Sovereign Securi�es
TREPS & Current Assets
Fund Details
Fund Managers** :Rahul Goswami (Managing this fund since Sep, 2014 &Overall 24 Years of experience)
Anuj Tagra (Managing this fund since Dec, 2020& overall 14 years of experience)
Indicative Investment Horizon: 2 years and above
Exit load for Redemption :- Lumpsum &SIP / STP / SWP Option
(w.e.f. 1st Jan 2019) Nil
Inception/Allotment date: 12-Sep-14
Monthly AAUM as on 30-Jun-21 : Rs. 319.63 crores
Closing AUM as on 30-Jun-21 : Rs. 315.27 crores `
Total Expense Ratio @@ :Other : 0.39% p. a.Direct : 0.23% p. a.
Application Amount for fresh Subscription :Rs.5,000 (plus in multiples of Re.1)
Min.Addl.Investment :Rs.1,000 (plus in multiples of Re.1)
`̀ `̀` `
`NAV (As on 30-Jul-21):Growth Option : 19.2802Direct Plan Growth Option : 19.5887
Investors understand that their principal will be at Moderate risk
97.01%
2.99%
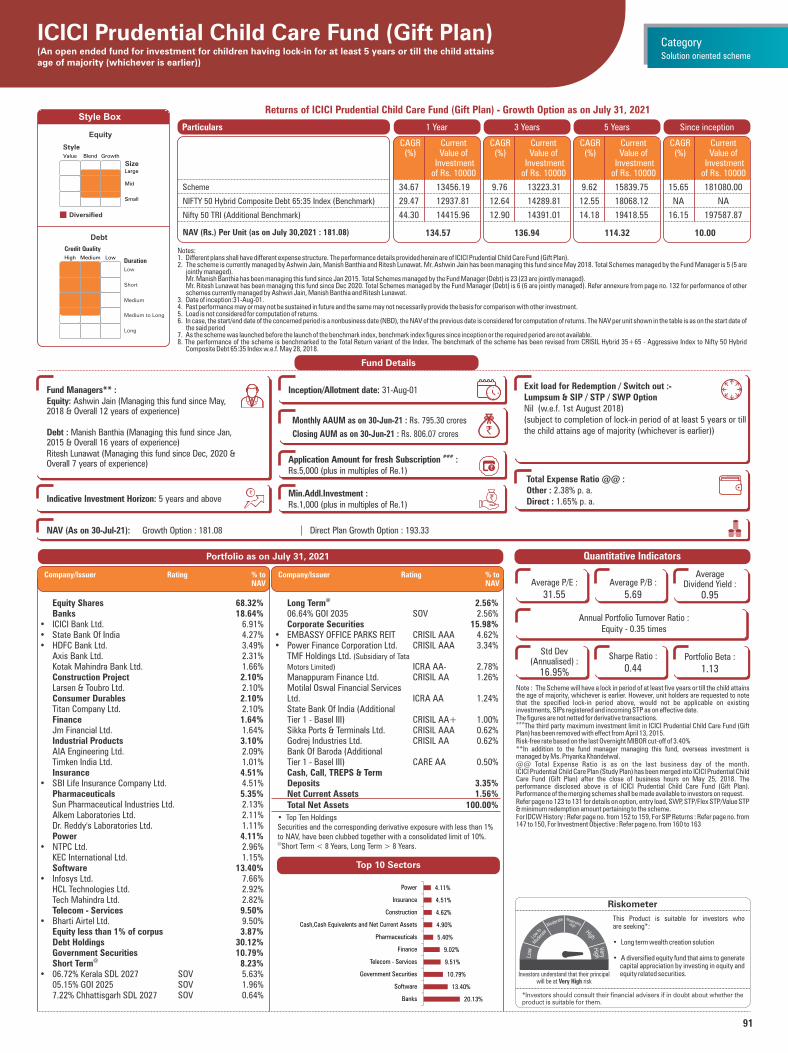
91
Solution oriented scheme
Category
Value Blend Growth
Large
Mid
Small
Diversified
Equity
Style
Size
Medium to Long
High Medium Low
Low
Short
Medium
Duration
Long
Debt
Credit Quality
Style Box
Notes:1. Different plans shall have different expense structure. The performance details provided herein are of ICICI Prudential Child Care Fund (Gift Plan).2. The scheme is currently managed by Ashwin Jain, Manish Banthia and Ritesh Lunawat. Mr. Ashwin Jain has been managing this fund since May 2018. Total Schemes managed by the Fund Manager is 5 (5 are
jointly managed). Mr. Manish Banthia has been managing this fund since Jan 2015. Total Schemes managed by the Fund Manager (Debt) is 23 (23 are jointly managed). Mr. Ritesh Lunawat has been managing this fund since Dec 2020. Total Schemes managed by the Fund Manager (Debt) is 6 (6 are jointly managed). Refer annexure from page no. 132 for performance of other
schemes currently managed by Ashwin Jain, Manish Banthia and Ritesh Lunawat.3. Date of inception:31-Aug-01.4. Past performance may or may not be sustained in future and the same may not necessarily provide the basis for comparison with other investment.5. Load is not considered for computation of returns.6. In case, the start/end date of the concerned period is a nonbusiness date (NBD), the NAV of the previous date is considered for computation of returns. The NAV per unit shown in the table is as on the start date of
the said period7. As the scheme was launched before the launch of the benchmark index, benchmark index figures since inception or the required period are not available. 8. The performance of the scheme is benchmarked to the Total Return variant of the Index. The benchmark of the scheme has been revised from CRISIL Hybrid 35+65 - Aggressive Index to Nifty 50 Hybrid
Composite Debt 65:35 Index w.e.f. May 28, 2018.
Returns of ICICI Prudential Child Care Fund (Gift Plan) - Growth Option as on July 31, 2021
1 Year 3 Years 5 Years Since inceptionParticulars
134.57 136.94
Scheme
NIFTY 50 Hybrid Composite Debt 65:35 Index (Benchmark)
Nifty 50 TRI (Additional Benchmark)
NAV (Rs.) Per Unit (as on July 30,2021 : 181.08)
CAGR (%)
Current Value of
Investment of Rs. 10000
CAGR (%)
Current Value of
Investment of Rs. 10000
CAGR (%)
Current Value of
Investment of Rs. 10000
114.32
CAGR (%)
Current Value of
Investment of Rs. 10000
10.00
Fund Details
Note : The Scheme will have a lock in period of at least five years or till the child attains the age of majority, whichever is earlier. However, unit holders are requested to note that the specified lock-in period above, would not be applicable on existing investments, SIPs registered and incoming STP as on effective date.The figures are not netted for derivative transactions.###
The third party maximum investment limit in ICICI Prudential Child Care Fund (Gift Plan) has been removed with effect from April 13, 2015.Risk-free rate based on the last Overnight MIBOR cut-off of 3.40%**In addition to the fund manager managing this fund, overseas investment is managed by Ms. Priyanka Khandelwal.@@ Total Expense Ratio is as on the last business day of the month.ICICI Prudential Child Care Plan (Study Plan) has been merged into ICICI Prudential Child Care Fund (Gift Plan) after the close of business hours on May 25, 2018. The performance disclosed above is of ICICI Prudential Child Care Fund (Gift Plan). Performance of the merging schemes shall be made available to investors on request.Refer page no 123 to 131 for details on option, entry load, SWP, STP/Flex STP/Value STP & minimum redemption amount pertaining to the scheme.For IDCW History : Refer page no. from 152 to 159, For SIP Returns : Refer page no. from 147 to 150, For Investment Objective : Refer page no. from 160 to 163
Riskometer
This Product is suitable for investors who are seeking*:
• Long term wealth creation solution
• A diversified equity fund that aims to generate capital appreciation by investing in equity and equity related securities.
*Investors should consult their financial advisers if in doubt about whether theproduct is suitable for them.
Monthly AAUM as on 30-Jun-21 : Rs. 795.30 crores
Closing AUM as on 30-Jun-21 : Rs. 806.07 crores `
Fund Managers** :Equity: Ashwin Jain (Managing this fund since May, 2018 & Overall 12 years of experience)
Debt : Manish Banthia (Managing this fund since Jan, 2015 & Overall 16 years of experience)Ritesh Lunawat (Managing this fund since Dec, 2020 &Overall 7 years of experience)
Indicative Investment Horizon: 5 years and above
Inception/Allotment date: 31-Aug-01 Exit load for Redemption / Switch out :- Lumpsum & SIP / STP / SWP OptionNil (w.e.f. 1st August 2018)(subject to completion of lock-in period of at least 5 years or till the child attains age of majority (whichever is earlier))
Total Expense Ratio @@ :Other : 2.38% p. a.Direct : 1.65% p. a.
34.67 13456.19 9.76 13223.31 9.62 15839.75 15.65 181080.00
29.47 12937.81 12.64 14289.81 12.55 18068.12 NA NA
44.30 14415.96 12.90 14391.01 14.18 19418.55 16.15 197587.87
Quantitative IndicatorsPortfolio as on July 31, 2021
ICICI Prudential Child Care Fund (Gift Plan)(An open ended fund for investment for children having lock-in for at least 5 years or till the child attainsage of majority (whichever is earlier))
• Top Ten HoldingsSecurities and the corresponding derivative exposure with less than 1% to NAV, have been clubbed together with a consolidated limit of 10%.@Short Term < 8 Years, Long Term > 8 Years.
Equity Shares 68.32% Banks 18.64%• ICICI Bank Ltd. 6.91%• State Bank Of India 4.27%• HDFC Bank Ltd. 3.49% Axis Bank Ltd. 2.31% Kotak Mahindra Bank Ltd. 1.66% Construction Project 2.10% Larsen & Toubro Ltd. 2.10% Consumer Durables 2.10% Titan Company Ltd. 2.10% Finance 1.64% Jm Financial Ltd. 1.64% Industrial Products 3.10% AIA Engineering Ltd. 2.09% Timken India Ltd. 1.01% Insurance 4.51%• SBI Life Insurance Company Ltd. 4.51% Pharmaceuticals 5.35% Sun Pharmaceutical Industries Ltd. 2.13% Alkem Laboratories Ltd. 2.11% Dr. Reddy's Laboratories Ltd. 1.11% Power 4.11%• NTPC Ltd. 2.96% KEC International Ltd. 1.15% Software 13.40%• Infosys Ltd. 7.66% HCL Technologies Ltd. 2.92% Tech Mahindra Ltd. 2.82% Telecom - Services 9.50%• Bharti Airtel Ltd. 9.50% Equity less than 1% of corpus 3.87% Debt Holdings 30.12% Government Securities 10.79%
@ Short Term 8.23%• 06.72% Kerala SDL 2027 SOV 5.63% 05.15% GOI 2025 SOV 1.96% 7.22% Chhattisgarh SDL 2027 SOV 0.64%
@ Long Term 2.56% 06.64% GOI 2035 SOV 2.56% Corporate Securities 15.98%• EMBASSY OFFICE PARKS REIT CRISIL AAA 4.62%• Power Finance Corporation Ltd. CRISIL AAA 3.34% TMF Holdings Ltd. (Subsidiary of Tata
Motors Limited) ICRA AA- 2.78% Manappuram Finance Ltd. CRISIL AA 1.26% Motilal Oswal Financial Services Ltd. ICRA AA 1.24% State Bank Of India (Additional Tier 1 - Basel III) CRISIL AA+ 1.00% Sikka Ports & Terminals Ltd. CRISIL AAA 0.62% Godrej Industries Ltd. CRISIL AA 0.62% Bank Of Baroda (Additional Tier 1 - Basel III) CARE AA 0.50% Cash, Call, TREPS & Term Deposits 3.35% Net Current Assets 1.56% Total Net Assets 100.00%
Company/Issuer Rating % to NAV
Company/Issuer Rating % to NAV
Top 10 Sectors
NAV (As on 30-Jul-21): Growth Option : 181.08 Direct Plan Growth Option : 193.33 `̀ `̀` `
`
###Application Amount for fresh Subscription :Rs.5,000 (plus in multiples of Re.1)
Min.Addl.Investment :Rs.1,000 (plus in multiples of Re.1)
Average P/E :
31.55Average P/B :
5.69
Average Dividend Yield :
0.95
Std Dev (Annualised) :
16.95%
Sharpe Ratio :
0.44Portfolio Beta :
1.13
Annual Portfolio Turnover Ratio : Equity - 0.35 times
Investors understand that their principal will be at Very High risk
20.13%
13.40%
10.79%
9.51%
9.02%
5.40%
4.90%
4.62%
4.51%
4.11%
Banks
Software
Government Securities
Telecom - Services
Finance
Pharmaceuticals
Cash,Cash Equivalents and Net Current Assets
Construction
Insurance
Power
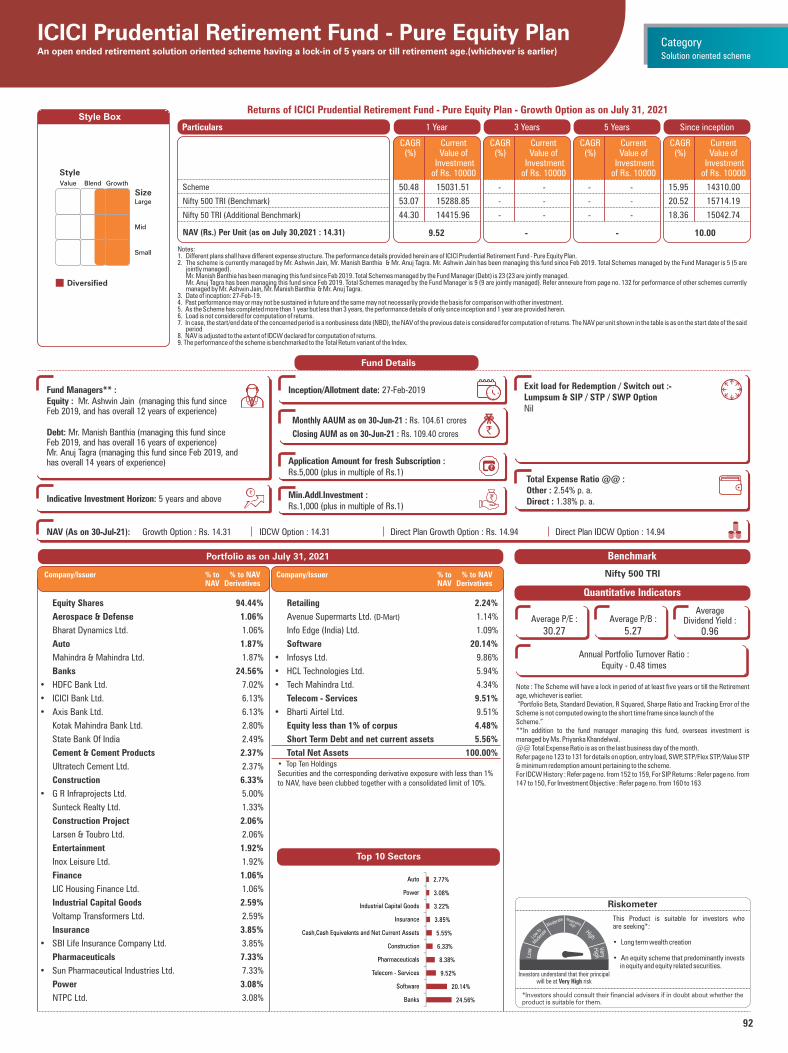
92
Style Box
Notes:1. Different plans shall have different expense structure. The performance details provided herein are of ICICI Prudential Retirement Fund - Pure Equity Plan.2. The scheme is currently managed by Mr. Ashwin Jain, Mr. Manish Banthia & Mr. Anuj Tagra. Mr. Ashwin Jain has been managing this fund since Feb 2019. Total Schemes managed by the Fund Manager is 5 (5 are
jointly managed). Mr. Manish Banthia has been managing this fund since Feb 2019. Total Schemes managed by the Fund Manager (Debt) is 23 (23 are jointly managed. Mr. Anuj Tagra has been managing this fund since Feb 2019. Total Schemes managed by the Fund Manager is 9 (9 are jointly managed). Refer annexure from page no. 132 for performance of other schemes currently
managed by Mr. Ashwin Jain, Mr. Manish Banthia & Mr. Anuj Tagra.3. Date of inception: 27-Feb-19.4. Past performance may or may not be sustained in future and the same may not necessarily provide the basis for comparison with other investment.5. As the Scheme has completed more than 1 year but less than 3 years, the performance details of only since inception and 1 year are provided herein.6. Load is not considered for computation of returns.7. In case, the start/end date of the concerned period is a nonbusiness date (NBD), the NAV of the previous date is considered for computation of returns. The NAV per unit shown in the table is as on the start date of the said
period8. NAV is adjusted to the extent of IDCW declared for computation of returns.9. The performance of the scheme is benchmarked to the Total Return variant of the Index.
Returns of ICICI Prudential Retirement Fund - Pure Equity Plan - Growth Option as on July 31, 2021
1 Year 3 Years 5 Years Since inceptionParticulars
9.52 -NAV (Rs.) Per Unit (as on July 30,2021 : 14.31)
CAGR (%)
Current Value of
Investment of Rs. 10000
CAGR (%)
Current Value of
Investment of Rs. 10000
CAGR (%)
Current Value of
Investment of Rs. 10000
-
CAGR (%)
Current Value of
Investment of Rs. 10000
10.00
Fund Details
Riskometer
This Product is suitable for investors who are seeking*:
• Long term wealth creation
• An equity scheme that predominantly invests in equity and equity related securities.
*Investors should consult their financial advisers if in doubt about whether theproduct is suitable for them.
Monthly AAUM as on 30-Jun-21 : Rs. 104.61 crores
Closing AUM as on 30-Jun-21 : Rs. 109.40 crores `
Fund Managers** :Equity : Mr. Ashwin Jain (managing this fund since Feb 2019, and has overall 12 years of experience)
Debt: Mr. Manish Banthia (managing this fund since Feb 2019, and has overall 16 years of experience)Mr. Anuj Tagra (managing this fund since Feb 2019, and has overall 14 years of experience)
Indicative Investment Horizon: 5 years and above
Inception/Allotment date: 27-Feb-2019 Exit load for Redemption / Switch out :- Lumpsum & SIP / STP / SWP OptionNil
Total Expense Ratio @@ :Other : 2.54% p. a.Direct : 1.38% p. a.
50.48 15031.51 - - - - 15.95 14310.00
53.07 15288.85 - - - - 20.52 15714.19
44.30 14415.96 - - - - 18.36 15042.74
Portfolio as on July 31, 2021
ICICI Prudential Retirement Fund - Pure Equity PlanAn open ended retirement solution oriented scheme having a lock-in of 5 years or till retirement age.(whichever is earlier)
Value Blend Growth
Large
Mid
Small
Diversified
Style
SizeScheme
Nifty 500 TRI (Benchmark)
Nifty 50 TRI (Additional Benchmark)
Note : The Scheme will have a lock in period of at least five years or till the Retirement age, whichever is earlier. “Portfolio Beta, Standard Deviation, R Squared, Sharpe Ratio and Tracking Error of the Scheme is not computed owing to the short time frame since launch of the Scheme.” **In addition to the fund manager managing this fund, overseas investment is managed by Ms. Priyanka Khandelwal. @@ Total Expense Ratio is as on the last business day of the month. Refer page no 123 to 131 for details on option, entry load, SWP, STP/Flex STP/Value STP & minimum redemption amount pertaining to the scheme.For IDCW History : Refer page no. from 152 to 159, For SIP Returns : Refer page no. from 147 to 150, For Investment Objective : Refer page no. from 160 to 163
Quantitative Indicators
Benchmark
Nifty 500 TRI
Solution oriented scheme
Category
Top 10 Sectors
NAV (As on 30-Jul-21): Growth Option : Rs. 14.31 IDCW Option : 14.31 Direct Plan Growth Option : Rs. 14.94 Direct Plan IDCW Option : 14.94 `̀ `̀` `
`
Application Amount for fresh Subscription :Rs.5,000 (plus in multiple of Rs.1)
Min.Addl.Investment :Rs.1,000 (plus in multiple of Rs.1)
Average P/E :
30.27Average P/B :
5.27
Average Dividend Yield :
0.96
Annual Portfolio Turnover Ratio : Equity - 0.48 times
Investors understand that their principal will be at Very High risk
Company/Issuer % to % to NAV NAV Derivatives
Company/Issuer % to % to NAV NAV Derivatives
• Top Ten HoldingsSecurities and the corresponding derivative exposure with less than 1% to NAV, have been clubbed together with a consolidated limit of 10%.
Equity Shares 94.44%
Aerospace & Defense 1.06%
Bharat Dynamics Ltd. 1.06%
Auto 1.87%
Mahindra & Mahindra Ltd. 1.87%
Banks 24.56%
• HDFC Bank Ltd. 7.02%
• ICICI Bank Ltd. 6.13%
• Axis Bank Ltd. 6.13%
Kotak Mahindra Bank Ltd. 2.80%
State Bank Of India 2.49%
Cement & Cement Products 2.37%
Ultratech Cement Ltd. 2.37%
Construction 6.33%
• G R Infraprojects Ltd. 5.00%
Sunteck Realty Ltd. 1.33%
Construction Project 2.06%
Larsen & Toubro Ltd. 2.06%
Entertainment 1.92%
Inox Leisure Ltd. 1.92%
Finance 1.06%
LIC Housing Finance Ltd. 1.06%
Industrial Capital Goods 2.59%
Voltamp Transformers Ltd. 2.59%
Insurance 3.85%
• SBI Life Insurance Company Ltd. 3.85%
Pharmaceuticals 7.33%
• Sun Pharmaceutical Industries Ltd. 7.33%
Power 3.08%
NTPC Ltd. 3.08%
Retailing 2.24%
Avenue Supermarts Ltd. 1.14%(D-Mart)
Info Edge (India) Ltd. 1.09%
Software 20.14%
• Infosys Ltd. 9.86%
• HCL Technologies Ltd. 5.94%
• Tech Mahindra Ltd. 4.34%
Telecom - Services 9.51%
• Bharti Airtel Ltd. 9.51%
Equity less than 1% of corpus 4.48%
Short Term Debt and net current assets 5.56%
Total Net Assets 100.00%
24.56%
20.14%
9.52%
8.38%
6.33%
5.55%
3.85%
3.22%
3.08%
2.77%
Banks
Software
Telecom - Services
Pharmaceuticals
Construction
Cash,Cash Equivalents and Net Current Assets
Insurance
Industrial Capital Goods
Power
Auto
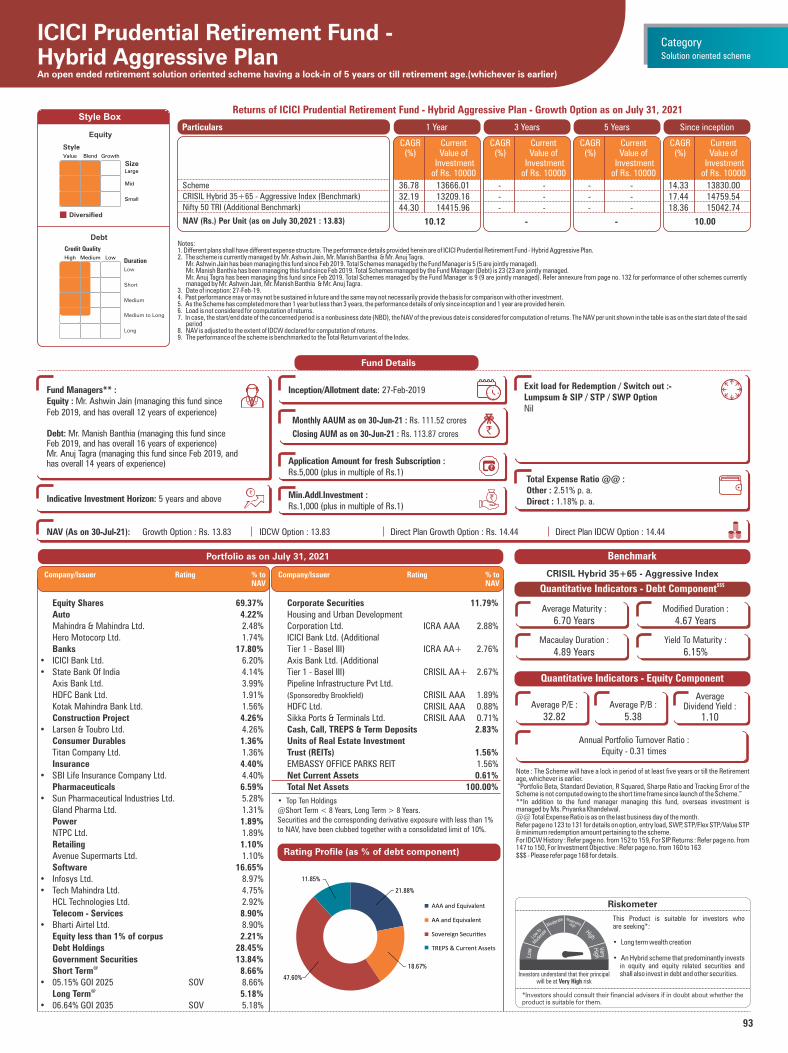
93
Style Box
Notes:1. Different plans shall have different expense structure. The performance details provided herein are of ICICI Prudential Retirement Fund - Hybrid Aggressive Plan.2. The scheme is currently managed by Mr. Ashwin Jain, Mr. Manish Banthia & Mr. Anuj Tagra. Mr. Ashwin Jain has been managing this fund since Feb 2019. Total Schemes managed by the Fund Manager is 5 (5 are jointly managed). Mr. Manish Banthia has been managing this fund since Feb 2019. Total Schemes managed by the Fund Manager (Debt) is 23 (23 are jointly managed. Mr. Anuj Tagra has been managing this fund since Feb 2019. Total Schemes managed by the Fund Manager is 9 (9 are jointly managed). Refer annexure from page no. 132 for performance of other schemes currently
managed by Mr. Ashwin Jain, Mr. Manish Banthia & Mr. Anuj Tagra.3. Date of inception: 27-Feb-19.4. Past performance may or may not be sustained in future and the same may not necessarily provide the basis for comparison with other investment.5. As the Scheme has completed more than 1 year but less than 3 years, the performance details of only since inception and 1 year are provided herein.6. Load is not considered for computation of returns.7. In case, the start/end date of the concerned period is a nonbusiness date (NBD), the NAV of the previous date is considered for computation of returns. The NAV per unit shown in the table is as on the start date of the said
period8. NAV is adjusted to the extent of IDCW declared for computation of returns.9. The performance of the scheme is benchmarked to the Total Return variant of the Index.
Returns of ICICI Prudential Retirement Fund - Hybrid Aggressive Plan - Growth Option as on July 31, 2021
Fund Details
Riskometer
This Product is suitable for investors who are seeking*:
• Long term wealth creation
• An Hybrid scheme that predominantly invests in equity and equity related securities and shall also invest in debt and other securities.
*Investors should consult their financial advisers if in doubt about whether theproduct is suitable for them.
Monthly AAUM as on 30-Jun-21 : Rs. 111.52 crores
Closing AUM as on 30-Jun-21 : Rs. 113.87 crores `
Fund Managers** :Equity : Mr. Ashwin Jain (managing this fund since Feb 2019, and has overall 12 years of experience)
Debt: Mr. Manish Banthia (managing this fund since Feb 2019, and has overall 16 years of experience)Mr. Anuj Tagra (managing this fund since Feb 2019, and has overall 14 years of experience)
Indicative Investment Horizon: 5 years and above
Inception/Allotment date: 27-Feb-2019 Exit load for Redemption / Switch out :- Lumpsum & SIP / STP / SWP OptionNil
Total Expense Ratio @@ :Other : 2.51% p. a.Direct : 1.18% p. a.
Portfolio as on July 31, 2021
ICICI Prudential Retirement Fund - Hybrid Aggressive PlanAn open ended retirement solution oriented scheme having a lock-in of 5 years or till retirement age.(whichever is earlier)
1 Year 3 Years 5 Years Since inceptionParticulars
10.12 -
Scheme
CRISIL Hybrid 35+65 - Aggressive Index (Benchmark)
Nifty 50 TRI (Additional Benchmark)
NAV (Rs.) Per Unit (as on July 30,2021 : 13.83)
CAGR (%)
Current Value of
Investment of Rs. 10000
CAGR (%)
Current Value of
Investment of Rs. 10000
CAGR (%)
Current Value of
Investment of Rs. 10000
-
CAGR (%)
Current Value of
Investment of Rs. 10000
10.00
36.78 13666.01 - - - - 14.33 13830.0032.19 13209.16 - - - - 17.44 14759.5444.30 14415.96 - - - - 18.36 15042.74
Value Blend Growth
Large
Mid
Small
Diversified
Equity
Style
Size
Medium to Long
High Medium Low
Low
Short
Medium
Duration
Long
Debt
Credit Quality
Note : The Scheme will have a lock in period of at least five years or till the Retirement age, whichever is earlier. “Portfolio Beta, Standard Deviation, R Squared, Sharpe Ratio and Tracking Error of the Scheme is not computed owing to the short time frame since launch of the Scheme.” **In addition to the fund manager managing this fund, overseas investment is managed by Ms. Priyanka Khandelwal. @@ Total Expense Ratio is as on the last business day of the month. Refer page no 123 to 131 for details on option, entry load, SWP, STP/Flex STP/Value STP & minimum redemption amount pertaining to the scheme.For IDCW History : Refer page no. from 152 to 159, For SIP Returns : Refer page no. from 147 to 150, For Investment Objective : Refer page no. from 160 to 163$$$ - Please refer page 168 for details.
Quantitative Indicators - Equity Component
Benchmark
CRISIL Hybrid 35+65 - Aggressive Index$$$Quantitative Indicators - Debt Component
Average Maturity :
6.70 YearsModified Duration :
4.67 Years
Macaulay Duration :
4.89 YearsYield To Maturity :
6.15%
Rating Profile (as % of debt component)
Solution oriented scheme
Category
• Top Ten Holdings@Short Term < 8 Years, Long Term > 8 Years.Securities and the corresponding derivative exposure with less than 1% to NAV, have been clubbed together with a consolidated limit of 10%.
Equity Shares 69.37% Auto 4.22% Mahindra & Mahindra Ltd. 2.48% Hero Motocorp Ltd. 1.74% Banks 17.80%• ICICI Bank Ltd. 6.20%• State Bank Of India 4.14% Axis Bank Ltd. 3.99% HDFC Bank Ltd. 1.91% Kotak Mahindra Bank Ltd. 1.56% Construction Project 4.26%• Larsen & Toubro Ltd. 4.26% Consumer Durables 1.36% Titan Company Ltd. 1.36% Insurance 4.40%• SBI Life Insurance Company Ltd. 4.40% Pharmaceuticals 6.59%• Sun Pharmaceutical Industries Ltd. 5.28% Gland Pharma Ltd. 1.31% Power 1.89% NTPC Ltd. 1.89% Retailing 1.10% Avenue Supermarts Ltd. 1.10% Software 16.65%• Infosys Ltd. 8.97%• Tech Mahindra Ltd. 4.75% HCL Technologies Ltd. 2.92% Telecom - Services 8.90%• Bharti Airtel Ltd. 8.90% Equity less than 1% of corpus 2.21% Debt Holdings 28.45% Government Securities 13.84%
@ Short Term 8.66%• 05.15% GOI 2025 SOV 8.66%
@ Long Term 5.18%• 06.64% GOI 2035 SOV 5.18%
Corporate Securities 11.79% Housing and Urban Development Corporation Ltd. ICRA AAA 2.88% ICICI Bank Ltd. (Additional Tier 1 - Basel III) ICRA AA+ 2.76% Axis Bank Ltd. (Additional Tier 1 - Basel III) CRISIL AA+ 2.67% Pipeline Infrastructure Pvt Ltd. CRISIL AAA 1.89%(Sponsoredby Brookfield)
HDFC Ltd. CRISIL AAA 0.88% Sikka Ports & Terminals Ltd. CRISIL AAA 0.71% Cash, Call, TREPS & Term Deposits 2.83% Units of Real Estate Investment Trust (REITs) 1.56% EMBASSY OFFICE PARKS REIT 1.56% Net Current Assets 0.61% Total Net Assets 100.00%
Company/Issuer Rating % to NAV
Company/Issuer Rating % to NAV
AAA and Equivalent
AA and Equivalent
Sovereign Securi�es
NAV (As on 30-Jul-21): Growth Option : Rs. 13.83 IDCW Option : 13.83 Direct Plan Growth Option : Rs. 14.44 Direct Plan IDCW Option : 14.44 `̀ `̀` `
`
Application Amount for fresh Subscription :Rs.5,000 (plus in multiple of Rs.1)
Min.Addl.Investment :Rs.1,000 (plus in multiple of Rs.1)
Average P/E :
32.82Average P/B :
5.38
Average Dividend Yield :
1.10
Annual Portfolio Turnover Ratio : Equity - 0.31 times
Investors understand that their principal will be at Very High risk
TREPS & Current Assets
21.88%
18.67%
47.60%
11.85%

94
Style Box
Notes:1. Different plans shall have different expense structure. The performance details provided herein are of ICICI Prudential Retirement Fund - Hybrid Conservative Plan.2. The scheme is currently managed by Mr. Ashwin Jain, Mr. Manish Banthia & Mr. Anuj Tagra. Mr. Ashwin Jain has been managing this fund since Feb 2019. Total Schemes managed by the Fund Manager is 5 (5 are jointly managed). Mr. Manish Banthia has been managing this fund since Feb 2019. Total Schemes managed by the Fund Manager (Debt) is 23 (23 are jointly managed. Mr. Anuj Tagra has been managing this fund since Feb 2019. Total Schemes managed by the Fund Manager is 9 (9 are jointly managed). Refer annexure from page no. 132 for performance of other schemes currently
managed by Mr. Ashwin Jain, Mr. Manish Banthia & Mr. Anuj Tagra.3. Date of inception: 27-Feb-19.4. Past performance may or may not be sustained in future and the same may not necessarily provide the basis for comparison with other investment.5. As the Scheme has completed more than 1 year but less than 3 years, the performance details of only since inception and 1 year are provided herein.6. Load is not considered for computation of returns.7. In case, the start/end date of the concerned period is a nonbusiness date (NBD), the NAV of the previous date is considered for computation of returns. The NAV per unit shown in the table is as on the start date of the said
period8. NAV is adjusted to the extent of IDCW declared for computation of returns.9. The performance of the scheme is benchmarked to the Total Return variant of the Index.
Returns of ICICI Prudential Retirement Fund - Hybrid Conservative Plan - Growth Option as on July 31, 2021
Fund Details
Riskometer
This Product is suitable for investors who are seeking*:
• Medium to Long term regular income• An Hybrid scheme that aims to generate
regular income through investments primarily in debt and money market instruments and long term capital appreciation by investing a portion in equity.
*Investors should consult their financial advisers if in doubt about whether theproduct is suitable for them.
Monthly AAUM as on 30-Jun-21 : Rs. 65.64 crores
Closing AUM as on 30-Jun-21 : Rs. 67.24 crores `
Fund Managers** :Equity : Mr. Ashwin Jain (managing this fund since Feb 2019, and has overall 12 years of experience)
Debt: Mr. Manish Banthia (managing this fund since Feb 2019, and has overall 16 years of experience)Mr. Anuj Tagra (managing this fund since Feb 2019, and has overall 14 years of experience)
Indicative Investment Horizon: 5 years and above
Inception/Allotment date: 27-Feb-2019 Exit load for Redemption / Switch out :- Lumpsum & SIP / STP / SWP OptionNil
Total Expense Ratio @@ :Other : 2.07% p. a.Direct : 0.54% p. a.
Portfolio as on July 31, 2021
ICICI Prudential Retirement Fund - Hybrid Conservative PlanAn open ended retirement solution oriented scheme having a lock-in of 5 years or till retirement age.(whichever is earlier)
1 Year 3 Years 5 Years Since inceptionParticulars
11.2600 -
Scheme
Nifty 50 Hybrid Composite Debt 15:85 Index (Benchmark)
Nifty 50 TRI (Additional Benchmark)
CRISIL 10 Year Gilt Index (Additional Benchmark)
NAV (Rs.) Per Unit (as on July 30,2021 : 12.4329)
CAGR (%)
Current Value of
Investment of Rs. 10000
CAGR (%)
Current Value of
Investment of Rs. 10000
CAGR (%)
Current Value of
Investment of Rs. 10000
-
CAGR (%)
Current Value of
Investment of Rs. 10000
10.00
10.45 11041.65 - - - - 9.41 12432.9010.24 11020.75 - - - - 11.89 13128.0044.30 14415.96 - - - - 18.36 15042.742.23 10222.59 - - - - 8.66 12226.76
Value Blend Growth
Large
Mid
Small
Diversified
Equity
Style
Size
Debt
Medium to Long
High Medium Low
Low
Short
Medium
Duration
Long
Credit Quality
Note : The Scheme will have a lock in period of at least five years or till the Retirement age, whichever is earlier. “Portfolio Beta, Standard Deviation, R Squared, Sharpe Ratio and Tracking Error of the Scheme is not computed owing to the short time frame since launch of the Scheme.” **In addition to the fund manager managing this fund, overseas investment is managed by Ms. Priyanka Khandelwal. @@ Total Expense Ratio is as on the last business day of the month. Refer page no 123 to 131 for details on option, entry load, SWP, STP/Flex STP/Value STP & minimum redemption amount pertaining to the scheme.For IDCW History : Refer page no. from 152 to 159, For SIP Returns : Refer page no. from 147 to 150, For Investment Objective : Refer page no. from 160 to 163$$$ - Please refer page 168 for details.
Quantitative Indicators - Equity Component
Benchmark
Nifty 50 Hybrid Composite Debt 15:85 Index
$$$Quantitative Indicators - Debt Component
Average Maturity :
6.41 YearsModified Duration :
4.33 Years
Macaulay Duration :
4.54 YearsYield To Maturity :
6.13%
Rating Profile (as % of debt component)
Solution oriented scheme
Category
• Top Ten HoldingsSecurities and the corresponding derivative exposure with less than 1% to NAV, have been clubbed together with a consolidated limit of 10%.@Short Term < 8 Years, Long Term > 8 Years.
Equity Shares 15.20%
Banks 4.34%
ICICI Bank Ltd. 3.18%
HDFC Bank Ltd. 1.16%
Construction Project 1.08%
Larsen & Toubro Ltd. 1.08%
Insurance 2.04%
SBI Life Insurance Company Ltd. 2.04%
Software 4.60%
• Infosys Ltd. 4.60%
Telecom - Services 2.49%
Bharti Airtel Ltd. 2.49%
Equity less than 1% of corpus 0.66%
Debt Holdings 83.38%
Government Securities 27.67%
Short Term 12.39%@
• 08.15% GOI 2026 SOV 6.52%
• 05.15% GOI 2025 SOV 5.86%
Long Term 15.28%@
• 06.64% GOI 2035 SOV 15.28%
Corporate Securities 43.09%
• Housing and Urban Development
Corporation Ltd. ICRA AAA 8.14%
• Axis Bank Ltd. (Additional
Tier 1 - Basel III) CRISIL AA+ 7.53%
• State Bank Of India (Additional
Tier 1 - Basel III) CRISIL AA+ 6.79%
• Pipeline Infrastructure Pvt Ltd.
CRISIL AAA 6.40%(Sponsoredby Brookfield)
• Godrej Industries Ltd. CRISIL AA 4.47%
• EMBASSY OFFICE PARKS REIT CRISIL AAA 3.69%
ICICI Bank Ltd. (Additional
Tier 1 - Basel III) ICRA AA+ 1.56%
Company/Issuer Rating % to NAV
AAA and Equivalent
AA and Equivalent
Sovereign Securi�es
TREPS & Current Assets
NAV (As on 30-Jul-21): Growth Option : Rs. 12.4329 IDCW Option : 12.4328 Direct Plan Growth Option : Rs. 12.9667 Direct Plan IDCW Option : 12.9665 `̀ `̀` `
`
Application Amount for fresh Subscription :Rs.5,000 (plus in multiple of Rs.1)
Min.Addl.Investment :Rs.1,000 (plus in multiple of Rs.1)
Average P/E :
35.31Average P/B :
6.47
Average Dividend Yield :
0.94
Annual Portfolio Turnover Ratio : Equity - 0.14 times
Company/Issuer Rating % to NAV
NABARD CRISIL AAA 1.53%
HDFC Ltd. CRISIL AAA 1.49%
Sikka Ports & Terminals Ltd. CRISIL AAA 1.49%
Cash, Call, TREPS & Term
Deposits 12.62%
Net Current Assets 1.42%
Total Net Assets 100.00%
Investors understand that their principal will be at Moderately High risk
26.82%
24.00%32.63%
16.55%

95
Tracking Error :
1.06%
Style Box
Notes:1. Different plans shall have different expense structure. The performance details provided herein are of ICICI Prudential Retirement Fund - Pure Debt Plan.2. The scheme is currently managed by Mr. Manish Banthia & Mr. Anuj Tagra. Mr. Manish Banthia has been managing this fund since Feb 2019. Total Schemes managed by the Fund Manager (Debt) is 23 (23 are jointly
managed. Mr. Anuj Tagra has been managing this fund since Feb 2019. Total Schemes managed by the Fund Manager is 9 (9 are jointly managed). Refer annexure from page no. 132 for performance of other schemes currently
managed by Mr. Manish Banthia & Mr. Anuj Tagra.3. Date of inception: 27-Feb-19.4. Past performance may or may not be sustained in future and the same may not necessarily provide the basis for comparison with other investment.5. As the Scheme has completed more than 1 year but less than 3 years, the performance details of only since inception and 1 year are provided herein.6. Load is not considered for computation of returns.7. In case, the start/end date of the concerned period is a nonbusiness date (NBD), the NAV of the previous date is considered for computation of returns. The NAV per unit shown in the table is as on the start date of the said
period8. NAV is adjusted to the extent of IDCW declared for computation of returns.9. The performance of the scheme is benchmarked to the Total Return variant of the Index.
Returns of ICICI Prudential Retirement Fund - Pure Debt Plan - Growth Option as on July 31, 2021
Fund Details
Riskometer
This Product is suitable for investors who are seeking*:
• All Duration Savings
• A Debt scheme that invests in Debt and money market instruments with the view to maximize optimum balance of yield, safety and liquidity.
*Investors should consult their financial advisers if in doubt about whether theproduct is suitable for them.
Monthly AAUM as on 30-Jun-21 : Rs. 376.17 crores
Closing AUM as on 30-Jun-21 : Rs. 361.56 crores `
Fund Managers** :Debt: Mr. Manish Banthia (managing this fund since Feb 2019, and has overall 16 years of experience)
Mr. Anuj Tagra (managing this fund since Feb 2019, and has overall 14 years of experience)
Indicative Investment Horizon: 5 years and above
Inception/Allotment date: 27-Feb-2019 Exit load for Redemption / Switch out :- Lumpsum & SIP / STP / SWP OptionNil
Total Expense Ratio @@ :Other : 2.08% p. a.Direct : 0.57% p. a.
Portfolio as on July 31, 2021
ICICI Prudential Retirement Fund - Pure Debt PlanAn open ended retirement solution oriented scheme having a lock-in of 5 years or till retirement age.(whichever is earlier)
Medium to Long
High Medium Low
Low
Short
Medium
Duration
Long
Credit Quality
Note : The Scheme will have a lock in period of at least five years or till the Retirement age, whichever is earlier. “Portfolio Beta, Standard Deviation, R Squared, Sharpe Ratio and Tracking Error of the Scheme is not computed owing to the short time frame since launch of the Scheme.” **In addition to the fund manager managing this fund, overseas investment is managed by Ms. Priyanka Khandelwal. @@ Total Expense Ratio is as on the last business day of the month. Refer page no 123 to 131 for details on option, entry load, SWP, STP/Flex STP/Value STP & minimum redemption amount pertaining to the scheme.For IDCW History : Refer page no. from 152 to 159, For SIP Returns : Refer page no. from 147 to 150, For Investment Objective : Refer page no. from 160 to 163$$$ - Please refer page 168 for details.
Benchmark
Nifty Composite Debt Index
$$$Quantitative Indicators
Average Maturity :
6.29 YearsModified Duration :
4.08 Years
Macaulay Duration :
4.26 YearsYield To Maturity :
6.30%
Rating Profile (as % of debt component)
Solution oriented scheme
Category
Government Securities 34.60%
Short Term 7.61%@
07.03% Telangana SDL 2027 SOV 2.82%
06.90% GOI 2026 SOV 1.78%
08.25% Gujarat SDL 2024 SOV 1.50%
08.31% Uttar Pradesh SDL 2025 SOV 1.50%
Long Term 26.99%@
• 06.64% GOI 2035 SOV 18.62%
• 07.19% Uttar Pradesh SDL 2031 SOV 4.20%
06.67% GOI 2050 SOV 2.60%
06.68% GOI 2031 SOV 1.56%
Corporate Securities 59.20%
• TMF Holdings Ltd. (backed by
put option on TATA Motors) CRISIL AA- 9.38%
• EMBASSY OFFICE PARKS REIT CRISIL AAA 8.58%
• Jamnagar Utilities & Power Pvt.
Ltd. CRISIL AAA 7.36%
• ICICI Bank Ltd. (Additional
Tier 1 - Basel III) CRISIL AA+ 5.13%
• Axis Bank Ltd. (Additional
Tier 1 - Basel III) CRISIL AA+ 3.36%
• Pipeline Infrastructure Pvt Ltd.
CRISIL AAA 3.28%(Sponsored by Brookfield)
• Coastal Gujarat Power Ltd. (guarantee
from Tata Power Company Limited) FITCH AA(CE) 2.98%
• Tata Power Company Ltd. FITCH AA 2.92%
JMC Projects (India) Ltd. CARE A+ 2.77%
State Bank Of India (Additional
Tier 1 - Basel III) CRISIL AA+ 2.41%
Sikka Ports & Terminals Ltd. CRISIL AAA 2.22%
Power Finance Corporation Ltd. CRISIL AAA 1.49%
Bharti Telecom Ltd. CRISIL AA+ 1.42%
IDFC First Bank Ltd. CARE AA 1.41%
Godrej Industries Ltd. CRISIL AA 1.39%
Company/Issuer Rating % to NAV
AAA and Equivalent
AA and Equivalent
A and Equivalent
Sovereign Securi�es
TREPS & Current Assets
NAV (As on 30-Jul-21): Growth Option : Rs. 12.1931 IDCW Option : 12.1932 Direct Plan Growth Option : Rs. 12.7255 Direct Plan IDCW Option : 12.7254 `̀ `̀` `
`
Application Amount for fresh Subscription :Rs.5,000 (plus in multiple of Rs.1)
Min.Addl.Investment :Rs.1,000 (plus in multiple of Rs.1)
• Top Ten HoldingsSecurities and the corresponding derivative exposure with less than 1% to NAV, have been clubbed together with a consolidated limit of 10%.@Short Term < 8 Years, Long Term > 8 Years.
Motilal Oswal Financial Services
Ltd. ICRA AA 1.38%
HDFC Ltd. CRISIL AAA 0.83%
Housing and Urban Development
Corporation Ltd. ICRA AAA 0.61%
Food Corporation Of India CRISIL AAA(CE) 0.29%
TREPS & Net Current Assets 6.20%
Total Net Assets 100.00%
Company/Issuer Rating % to NAV
Investors understand that their principal will be at Moderately High risk
1 Year 3 Years 5 Years Since inceptionParticulars
11.7269 -
Scheme
Nifty Composite Debt Index (Benchmark)
Nifty 50 TRI (Additional Benchmark)
CRISIL 10 Year Gilt Index (Additional Benchmark)
NAV (Rs.) Per Unit (as on July 30,2021 : 12.1931)
CAGR (%)
Current Value of
Investment of Rs. 10000
CAGR (%)
Current Value of
Investment of Rs. 10000
CAGR (%)
Current Value of
Investment of Rs. 10000
-
CAGR (%)
Current Value of
Investment of Rs. 10000
10.00
3.99 10397.55 - - - - 8.53 12193.104.90 10488.31 - - - - 10.19 12649.3744.30 14415.96 - - - - 18.36 15042.742.23 10222.59 - - - - 8.66 12226.76
24.65%
31.78%2.77%
34.60%
6.20%
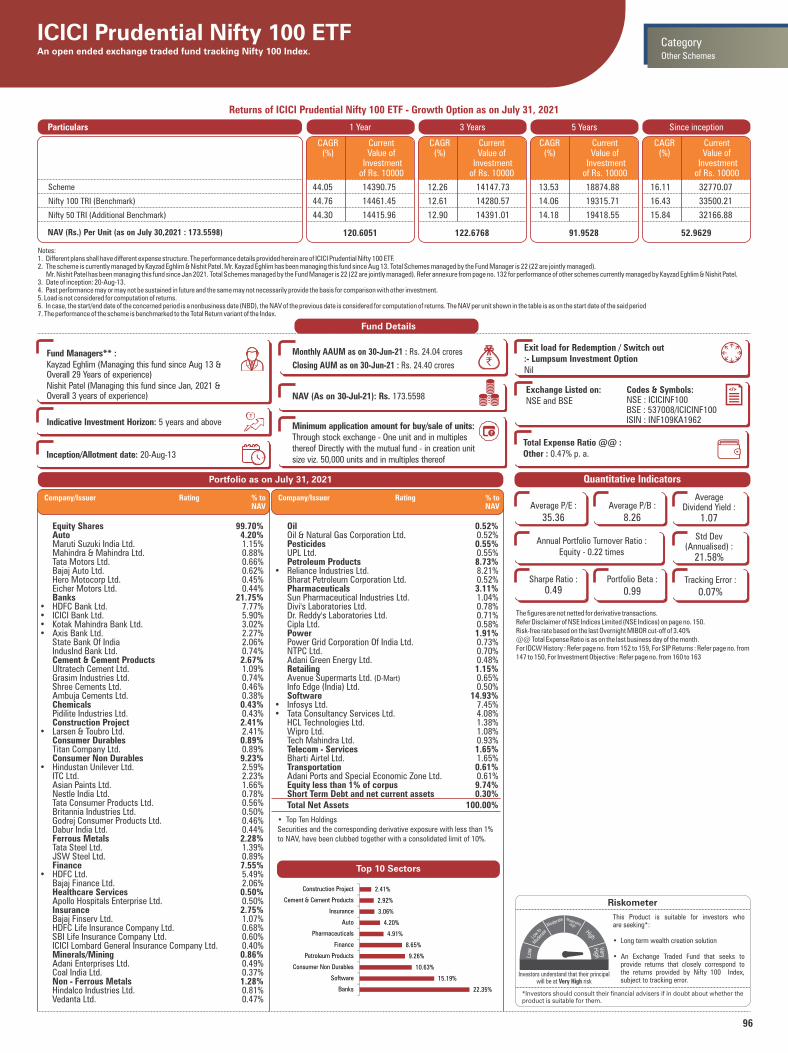
96
Notes:1. Different plans shall have different expense structure. The performance details provided herein are of ICICI Prudential Nifty 100 ETF.2. The scheme is currently managed by Kayzad Eghlim & Nishit Patel. Mr. Kayzad Eghlim has been managing this fund since Aug 13. Total Schemes managed by the Fund Manager is 22 (22 are jointly managed). Mr. Nishit Patel has been managing this fund since Jan 2021. Total Schemes managed by the Fund Manager is 22 (22 are jointly managed). Refer annexure from page no. 132 for performance of other schemes currently managed by Kayzad Eghlim & Nishit Patel.3. Date of inception: 20-Aug-13.4. Past performance may or may not be sustained in future and the same may not necessarily provide the basis for comparison with other investment.5. Load is not considered for computation of returns.6. In case, the start/end date of the concerned period is a nonbusiness date (NBD), the NAV of the previous date is considered for computation of returns. The NAV per unit shown in the table is as on the start date of the said period7. The performance of the scheme is benchmarked to the Total Return variant of the Index.
Returns of ICICI Prudential Nifty 100 ETF - Growth Option as on July 31, 2021
Portfolio as on July 31, 2021
Riskometer
This Product is suitable for investors who are seeking*:
• Long term wealth creation solution
• An Exchange Traded Fund that seeks to provide returns that closely correspond to the returns provided by Nifty 100 Index, subject to tracking error.
*Investors should consult their financial advisers if in doubt about whether theproduct is suitable for them.
Fund Details
Monthly AAUM as on 30-Jun-21 : Rs. 24.04 crores
Closing AUM as on 30-Jun-21 : Rs. 24.40 crores
NAV (As on 30-Jul-21): Rs. 173.5598
`
`̀ `̀` `
`
Fund Managers** :Kayzad Eghlim (Managing this fund since Aug 13 &Overall 29 Years of experience)Nishit Patel (Managing this fund since Jan, 2021 & Overall 3 years of experience)
Indicative Investment Horizon: 5 years and above
Exit load for Redemption / Switch out:- Lumpsum Investment OptionNil
Inception/Allotment date: 20-Aug-13
ICICI Prudential Nifty 100 ETFAn open ended exchange traded fund tracking Nifty 100 Index.
The figures are not netted for derivative transactions.Refer Disclaimer of NSE Indices Limited (NSE Indices) on page no. 150.Risk-free rate based on the last Overnight MIBOR cut-off of 3.40%@@ Total Expense Ratio is as on the last business day of the month.For IDCW History : Refer page no. from 152 to 159, For SIP Returns : Refer page no. from 147 to 150, For Investment Objective : Refer page no. from 160 to 163
Quantitative Indicators
1 Year 3 Years 5 Years Since inceptionParticulars
120.6051 122.6768
CAGR (%)
Current Value of
Investment of Rs. 10000
CAGR (%)
Current Value of
Investment of Rs. 10000
CAGR (%)
Current Value of
Investment of Rs. 10000
91.9528
CAGR (%)
Current Value of
Investment of Rs. 10000
52.9629
Scheme
Nifty 100 TRI (Benchmark)
Nifty 50 TRI (Additional Benchmark)
NAV (Rs.) Per Unit (as on July 30,2021 : 173.5598)
44.05 14390.75 12.26 14147.73 13.53 18874.88 16.11 32770.07
44.76 14461.45 12.61 14280.57 14.06 19315.71 16.43 33500.21
44.30 14415.96 12.90 14391.01 14.18 19418.55 15.84 32166.88
Other Schemes
Category
Equity Shares 99.70% Auto 4.20% Maruti Suzuki India Ltd. 1.15% Mahindra & Mahindra Ltd. 0.88% Tata Motors Ltd. 0.66% Bajaj Auto Ltd. 0.62% Hero Motocorp Ltd. 0.45% Eicher Motors Ltd. 0.44% Banks 21.75%• HDFC Bank Ltd. 7.77%• ICICI Bank Ltd. 5.90%• Kotak Mahindra Bank Ltd. 3.02%• Axis Bank Ltd. 2.27% State Bank Of India 2.06% IndusInd Bank Ltd. 0.74% Cement & Cement Products 2.67% Ultratech Cement Ltd. 1.09% Grasim Industries Ltd. 0.74% Shree Cements Ltd. 0.46% Ambuja Cements Ltd. 0.38% Chemicals 0.43% Pidilite Industries Ltd. 0.43% Construction Project 2.41%• Larsen & Toubro Ltd. 2.41% Consumer Durables 0.89% Titan Company Ltd. 0.89% Consumer Non Durables 9.23%• Hindustan Unilever Ltd. 2.59% ITC Ltd. 2.23% Asian Paints Ltd. 1.66% Nestle India Ltd. 0.78% Tata Consumer Products Ltd. 0.56% Britannia Industries Ltd. 0.50% Godrej Consumer Products Ltd. 0.46% Dabur India Ltd. 0.44% Ferrous Metals 2.28% Tata Steel Ltd. 1.39% JSW Steel Ltd. 0.89% Finance 7.55%• HDFC Ltd. 5.49% Bajaj Finance Ltd. 2.06% Healthcare Services 0.50% Apollo Hospitals Enterprise Ltd. 0.50% Insurance 2.75% Bajaj Finserv Ltd. 1.07% HDFC Life Insurance Company Ltd. 0.68% SBI Life Insurance Company Ltd. 0.60% ICICI Lombard General Insurance Company Ltd. 0.40% Minerals/Mining 0.86% Adani Enterprises Ltd. 0.49% Coal India Ltd. 0.37% Non - Ferrous Metals 1.28% Hindalco Industries Ltd. 0.81% Vedanta Ltd. 0.47%
Oil 0.52% Oil & Natural Gas Corporation Ltd. 0.52% Pesticides 0.55% UPL Ltd. 0.55% Petroleum Products 8.73%• Reliance Industries Ltd. 8.21% Bharat Petroleum Corporation Ltd. 0.52% Pharmaceuticals 3.11% Sun Pharmaceutical Industries Ltd. 1.04% Divi's Laboratories Ltd. 0.78% Dr. Reddy's Laboratories Ltd. 0.71% Cipla Ltd. 0.58% Power 1.91% Power Grid Corporation Of India Ltd. 0.73% NTPC Ltd. 0.70% Adani Green Energy Ltd. 0.48% Retailing 1.15% Avenue Supermarts Ltd. 0.65%(D-Mart) Info Edge (India) Ltd. 0.50% Software 14.93%• Infosys Ltd. 7.45%• Tata Consultancy Services Ltd. 4.08% HCL Technologies Ltd. 1.38% Wipro Ltd. 1.08% Tech Mahindra Ltd. 0.93% Telecom - Services 1.65% Bharti Airtel Ltd. 1.65% Transportation 0.61% Adani Ports and Special Economic Zone Ltd. 0.61% Equity less than 1% of corpus 9.74% Short Term Debt and net current assets 0.30% Total Net Assets 100.00%
Company/Issuer Rating % to NAV
Company/Issuer Rating % to NAV
• Top Ten HoldingsSecurities and the corresponding derivative exposure with less than 1% to NAV, have been clubbed together with a consolidated limit of 10%.
Top 10 Sectors
Total Expense Ratio @@ :Other : 0.47% p. a.
Minimum application amount for buy/sale of units:Through stock exchange - One unit and in multiples thereof Directly with the mutual fund - in creation unit size viz. 50,000 units and in multiples thereof
Exchange Listed on:NSE and BSE
Codes & Symbols:NSE : ICICINF100BSE : 537008/ICICINF100ISIN : INF109KA1962
Average P/E :
35.36Average P/B :
8.26
Average Dividend Yield :
1.07
Sharpe Ratio : 0.49
Portfolio Beta :
0.99Tracking Error :
0.07%
Annual Portfolio Turnover Ratio : Equity - 0.22 times
Std Dev (Annualised) :
21.58%
Investors understand that their principal will be at Very High risk
22.35%
15.19%
10.63%
9.26%
8.65%
4.91%
4.20%
3.06%
2.92%
2.41%
Banks
Software
Consumer Non Durables
Petroleum Products
Finance
Pharmaceuticals
Auto
Insurance
Cement & Cement Products
Construction Project
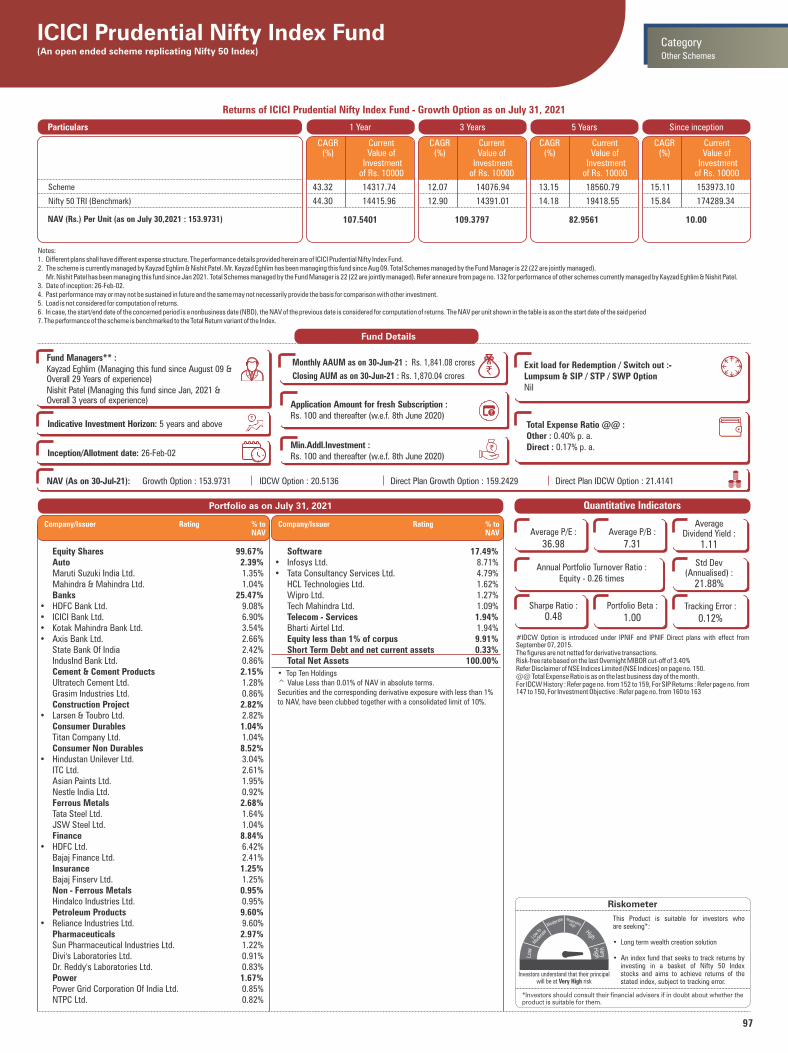
97
Notes:1. Different plans shall have different expense structure. The performance details provided herein are of ICICI Prudential Nifty Index Fund.2. The scheme is currently managed by Kayzad Eghlim & Nishit Patel. Mr. Kayzad Eghlim has been managing this fund since Aug 09. Total Schemes managed by the Fund Manager is 22 (22 are jointly managed). Mr. Nishit Patel has been managing this fund since Jan 2021. Total Schemes managed by the Fund Manager is 22 (22 are jointly managed). Refer annexure from page no. 132 for performance of other schemes currently managed by Kayzad Eghlim & Nishit Patel.3. Date of inception: 26-Feb-02.4. Past performance may or may not be sustained in future and the same may not necessarily provide the basis for comparison with other investment.5. Load is not considered for computation of returns.6. In case, the start/end date of the concerned period is a nonbusiness date (NBD), the NAV of the previous date is considered for computation of returns. The NAV per unit shown in the table is as on the start date of the said period7. The performance of the scheme is benchmarked to the Total Return variant of the Index.
Returns of ICICI Prudential Nifty Index Fund - Growth Option as on July 31, 2021
Riskometer
This Product is suitable for investors who are seeking*:
• Long term wealth creation solution
• An index fund that seeks to track returns by investing in a basket of Nifty 50 Index stocks and aims to achieve returns of the stated index, subject to tracking error.
*Investors should consult their financial advisers if in doubt about whether theproduct is suitable for them.
ICICI Prudential Nifty Index Fund(An open ended scheme replicating Nifty 50 Index)
#IDCW Option is introduced under IPNIF and IPNIF Direct plans with effect from September 07, 2015.The figures are not netted for derivative transactions.Risk-free rate based on the last Overnight MIBOR cut-off of 3.40%Refer Disclaimer of NSE Indices Limited (NSE Indices) on page no. 150.@@ Total Expense Ratio is as on the last business day of the month.For IDCW History : Refer page no. from 152 to 159, For SIP Returns : Refer page no. from 147 to 150, For Investment Objective : Refer page no. from 160 to 163
Quantitative Indicators
Other Schemes
Category
Equity Shares 99.67% Auto 2.39% Maruti Suzuki India Ltd. 1.35% Mahindra & Mahindra Ltd. 1.04% Banks 25.47%• HDFC Bank Ltd. 9.08%• ICICI Bank Ltd. 6.90%• Kotak Mahindra Bank Ltd. 3.54%• Axis Bank Ltd. 2.66% State Bank Of India 2.42% IndusInd Bank Ltd. 0.86% Cement & Cement Products 2.15% Ultratech Cement Ltd. 1.28% Grasim Industries Ltd. 0.86% Construction Project 2.82%• Larsen & Toubro Ltd. 2.82% Consumer Durables 1.04% Titan Company Ltd. 1.04% Consumer Non Durables 8.52%• Hindustan Unilever Ltd. 3.04% ITC Ltd. 2.61% Asian Paints Ltd. 1.95% Nestle India Ltd. 0.92% Ferrous Metals 2.68% Tata Steel Ltd. 1.64% JSW Steel Ltd. 1.04% Finance 8.84%• HDFC Ltd. 6.42% Bajaj Finance Ltd. 2.41% Insurance 1.25% Bajaj Finserv Ltd. 1.25% Non - Ferrous Metals 0.95% Hindalco Industries Ltd. 0.95% Petroleum Products 9.60%• Reliance Industries Ltd. 9.60% Pharmaceuticals 2.97% Sun Pharmaceutical Industries Ltd. 1.22% Divi's Laboratories Ltd. 0.91% Dr. Reddy's Laboratories Ltd. 0.83% Power 1.67% Power Grid Corporation Of India Ltd. 0.85% NTPC Ltd. 0.82%
Software 17.49%• Infosys Ltd. 8.71%• Tata Consultancy Services Ltd. 4.79% HCL Technologies Ltd. 1.62% Wipro Ltd. 1.27% Tech Mahindra Ltd. 1.09% Telecom - Services 1.94% Bharti Airtel Ltd. 1.94% Equity less than 1% of corpus 9.91% Short Term Debt and net current assets 0.33% Total Net Assets 100.00%
Portfolio as on July 31, 2021
Company/Issuer Rating % to NAV
Company/Issuer Rating % to NAV
• Top Ten Holdings^ Value Less than 0.01% of NAV in absolute terms.Securities and the corresponding derivative exposure with less than 1% to NAV, have been clubbed together with a consolidated limit of 10%.
Fund Details
Fund Managers** :Kayzad Eghlim (Managing this fund since August 09 &Overall 29 Years of experience)Nishit Patel (Managing this fund since Jan, 2021 & Overall 3 years of experience)
Total Expense Ratio @@ :Other : 0.40% p. a.Direct : 0.17% p. a.
Inception/Allotment date: 26-Feb-02
Exit load for Redemption / Switch out :- Lumpsum & SIP / STP / SWP OptionNil
Monthly AAUM as on 30-Jun-21 : Rs. 1,841.08 crores
Closing AUM as on 30-Jun-21 : Rs. 1,870.04 crores`
Application Amount for fresh Subscription :Rs. 100 and thereafter (w.e.f. 8th June 2020)
Min.Addl.Investment :Rs. 100 and thereafter (w.e.f. 8th June 2020)
NAV (As on 30-Jul-21): Growth Option : 153.9731 IDCW Option : 20.5136 Direct Plan Growth Option : 159.2429 Direct Plan IDCW Option : 21.4141 `̀ `̀` `
`
Average P/E :
36.98Average P/B :
7.31
Average Dividend Yield :
1.11
Sharpe Ratio : 0.48
Portfolio Beta :
1.00Tracking Error :
0.12%
Annual Portfolio Turnover Ratio : Equity - 0.26 times
Std Dev (Annualised) :
21.88%
Investors understand that their principal will be at Very High risk
Indicative Investment Horizon: 5 years and above
1 Year 3 Years 5 Years Since inceptionParticulars
107.5401 109.3797
CAGR (%)
Current Value of
Investment of Rs. 10000
CAGR (%)
Current Value of
Investment of Rs. 10000
CAGR (%)
Current Value of
Investment of Rs. 10000
82.9561
CAGR (%)
Current Value of
Investment of Rs. 10000
10.00
Scheme
Nifty 50 TRI (Benchmark)
NAV (Rs.) Per Unit (as on July 30,2021 : 153.9731)
43.32 14317.74 12.07 14076.94 13.15 18560.79 15.11 153973.10
44.30 14415.96 12.90 14391.01 14.18 19418.55 15.84 174289.34

98
Notes:1. Different plans shall have different expense structure. The performance details provided herein are of ICICI Prudential Nifty ETF.2. The scheme is currently managed by Kayzad Eghlim & Nishit Patel. Mr. Kayzad Eghlim has been managing this fund since March 13. Total Schemes managed by the Fund Manager is 22 (22 are jointly managed). Mr. Nishit Patel has been managing this fund since Jan 2021. Total Schemes managed by the Fund Manager is 22 (22 are jointly managed). Refer annexure from page no. 132 for performance of other schemes currently managed by Kayzad Eghlim & Nishit Patel.3. Date of inception: 20-Mar-13.4. Past performance may or may not be sustained in future and the same may not necessarily provide the basis for comparison with other investment.5. Load is not considered for computation of returns.6. In case, the start/end date of the concerned period is a nonbusiness date (NBD), the NAV of the previous date is considered for computation of returns. The NAV per unit shown in the table is as on the start date of the said period7. NAV is adjusted to the extent of IDCW declared for computation of returns.8. The performance of the scheme is benchmarked to the Total Return variant of the Index.
Returns of ICICI Prudential Nifty ETF - Growth Option as on July 31, 2021
Riskometer
This Product is suitable for investors who are seeking*:
• Long term wealth creation solution
• An Exchange Traded Fund that seeks to provide returns that closely correspond to the returns provided by Nifty 50 Index, subject to tracking error.
*Investors should consult their financial advisers if in doubt about whether theproduct is suitable for them.
ICICI Prudential Nifty ETFAn open ended exchange traded fund tracking Nifty 50 Index
The figures are not netted for derivative transactions.Refer Disclaimer of NSE Indices Limited (NSE Indices) on page no. 150.Risk-free rate based on the last Overnight MIBOR cut-off of 3.40%@@ Total Expense Ratio is as on the last business day of the month.For IDCW History : Refer page no. from 152 to 159, For SIP Returns : Refer page no. from 147 to 150, For Investment Objective : Refer page no. from 160 to 163
Quantitative Indicators
Other Schemes
Category
Equity Shares 99.73% Auto 2.39% Maruti Suzuki India Ltd. 1.35% Mahindra & Mahindra Ltd. 1.04% Banks 25.49%• HDFC Bank Ltd. 9.09%• ICICI Bank Ltd. 6.91%• Kotak Mahindra Bank Ltd. 3.54%• Axis Bank Ltd. 2.67% State Bank Of India 2.42% IndusInd Bank Ltd. 0.87% Cement & Cement Products 2.15% Ultratech Cement Ltd. 1.28% Grasim Industries Ltd. 0.87% Construction Project 2.82%• Larsen & Toubro Ltd. 2.82% Consumer Durables 1.05% Titan Company Ltd. 1.05% Consumer Non Durables 8.51%• Hindustan Unilever Ltd. 3.04% ITC Ltd. 2.61% Asian Paints Ltd. 1.95% Nestle India Ltd. 0.92% Ferrous Metals 2.67% Tata Steel Ltd. 1.63% JSW Steel Ltd. 1.04% Finance 8.84%• HDFC Ltd. 6.43% Bajaj Finance Ltd. 2.41% Insurance 1.25% Bajaj Finserv Ltd. 1.25% Non - Ferrous Metals 0.95% Hindalco Industries Ltd. 0.95% Petroleum Products 9.61%• Reliance Industries Ltd. 9.61% Pharmaceuticals 2.96% Sun Pharmaceutical Industries Ltd. 1.22% Divi's Laboratories Ltd. 0.91% Dr. Reddy's Laboratories Ltd. 0.83% Power 1.67% Power Grid Corporation Of India Ltd. 0.86% NTPC Ltd. 0.82%
Software 17.50%• Infosys Ltd. 8.72%• Tata Consultancy Services Ltd. 4.80% HCL Technologies Ltd. 1.62% Wipro Ltd. 1.27% Tech Mahindra Ltd. 1.09% Telecom - Services 1.94% Bharti Airtel Ltd. 1.94% Equity less than 1% of corpus 9.93% Short Term Debt and net current assets 0.27% Total Net Assets 100.00%
Portfolio as on July 31, 2021
Company/Issuer % to NAV
Company/Issuer % to NAV
• Top Ten HoldingsSecurities and the corresponding derivative exposure with less than 1% to NAV, have been clubbed together with a consolidated limit of 10%.
Top 10 Sectors
Fund Details
Monthly AAUM as on 30-Jun-21 : Rs. 2,611.24 crores
Closing AUM as on 30-Jun-21 : Rs. 2,587.88 crores
NAV (As on 30-Jul-21): Rs. 168.7369
`
`̀ `̀` `
`
Fund Managers** :Kayzad Eghlim (Managing this fund since March 13 &Overall 29 Years of experience)Nishit Patel (Managing this fund since Jan, 2021 & Overall 3 years of experience)
Indicative Investment Horizon: 5 years and above
Exit load for Redemption / Switch out :- Lumpsum & SIP / STP / SWP OptionNil
Inception/Allotment date : 20-Mar-13
Total Expense Ratio @@ :Other : 0.05% p. a.
Minimum application amount for buy/sale of units:Through Stock Exchange - One unit Directly with the mutual fund - in creation unit size viz. 50,000 units and in multiples thereof (w.e.f. 11-Jan-2021)
Exchange Listed on:NSE and BSE
Codes & Symbols:NSE : ICICINIFTYBSE : 537007/ICICINIFTYISIN : INF109K012R6
Average P/E :
36.97Average P/B :
7.31
Average Dividend Yield :
1.11
Sharpe Ratio : 0.51
Portfolio Beta :
1.00Tracking Error :
0.03%
Annual Portfolio Turnover Ratio : Equity - 1.98 times
Std Dev (Annualised) :
21.92%
Investors understand that their principal will be at Very High risk
1 Year 3 Years 5 Years Since inceptionParticulars
117.1620 117.7313
CAGR (%)
Current Value of
Investment of Rs. 10000
CAGR (%)
Current Value of
Investment of Rs. 10000
CAGR (%)
Current Value of
Investment of Rs. 10000
87.5278
CAGR (%)
Current Value of
Investment of Rs. 10000
57.027
Scheme
Nifty 50 TRI (Benchmark)
NAV (Rs.) Per Unit (as on July 30,2021 : 168.7369)
44.16 14402.02 12.75 14332.37 14.01 19278.09 14.22 30413.21
44.30 14415.96 12.90 14391.01 14.18 19418.55 14.38 30779.12
25.49%
17.50%
10.60%
9.76%
8.84%
4.92%
3.64%
2.82%
2.76%
2.70%
Banks
Software
Petroleum Products
Consumer Non Durables
Finance
Auto
Pharmaceuticals
Construction Project
Insurance
Cement & Cement Products

99
Notes:1. Different plans shall have different expense structure. The performance details provided herein are of ICICI Prudential Nifty Low Vol 30 ETF.2. The scheme is currently managed by Kayzad Eghlim & Nishit Patel. Mr. Kayzad Eghlim has been managing this fund since July 17. Total Schemes managed by the Fund Manager is 22 (22 are jointly managed). Mr. Nishit Patel has been managing this fund since Jan 2021. Total Schemes managed by the Fund Manager is 22 (22 are jointly managed). Refer annexure from page no. 132 for performance of other schemes currently managed by Kayzad Eghlim & Nishit Patel.3. Date of inception: 3-Jul-17.4. Past performance may or may not be sustained in future and the same may not necessarily provide the basis for comparison with other investment.5. As the Scheme has completed more than 3 year but less than 5 years, the performance details of since inception,1 year and 3 years are provided herein6. Load is not considered for computation of returns.7. In case, the start/end date of the concerned period is a nonbusiness date (NBD), the NAV of the previous date is considered for computation of returns. The NAV per unit shown in the table is as on the start date of the said period8. NAV is adjusted to the extent of IDCW declared for computation of returns.9. The performance of the scheme is benchmarked to the Total Return variant of the Index.
Returns of ICICI Prudential Nifty Low Vol 30 ETF - Growth Option as on July 31, 2021
Riskometer
This Product is suitable for investors who are seeking*:
• Long term wealth creation solution
• An Exchange Traded Fund that aims to provide returns that closely correspond to the returns provided by Nifty 100 Low Volatility 30 Index, subject to tracking error.
*Investors should consult their financial advisers if in doubt about whether theproduct is suitable for them.
ICICI Prudential Nifty Low Vol 30 ETF(An open ended exchange traded fund tracking Nifty 100 Low Volatility 30 Index)
The figures are not netted for derivative transactions.Refer Disclaimer of NSE Indices Limited (NSE Indices) on page no. 150.Risk-free rate based on the last Overnight MIBOR cut-off of 3.40%@@ Total Expense Ratio is as on the last business day of the month.For IDCW History : Refer page no. from 152 to 159, For SIP Returns : Refer page no. from 147 to 150, For Investment Objective : Refer page no. from 160 to 163
Quantitative Indicators
1 Year 3 Years 5 Years Since inceptionParticulars
93.20 88.86
CAGR (%)
Current Value of
Investment of Rs. 10000
CAGR (%)
Current Value of
Investment of Rs. 10000
CAGR (%)
Current Value of
Investment of Rs. 10000
-
CAGR (%)
Current Value of
Investment of Rs. 10000
73.05
Scheme
Nifty 100 Low Volatility 30 TRI (Benchmark)
Nifty 50 TRI (Additional Benchmark)
NAV (Rs.) Per Unit (as on July 30,2021 : 130.1415)
39.76 13963.68 13.56 14645.68 - - 15.22 17815.40
40.51 14037.78 13.98 14806.20 - - 15.54 18016.31
44.30 14415.96 12.90 14391.01 - - 14.34 17269.53
Benchmark
Nifty 100 Low Volatility 30 TRI
Other Schemes
Category
Equity Shares 99.73% Auto 6.15% Bajaj Auto Ltd. 3.20% Hero Motocorp Ltd. 2.95% Banks 5.77% HDFC Bank Ltd. 3.01% Kotak Mahindra Bank Ltd. 2.77% Cement & Cement Products 7.59%• ACC Ltd. 3.90%• Ultratech Cement Ltd. 3.68% Chemicals 3.20% Pidilite Industries Ltd. 3.20% Construction Project 3.44% Larsen & Toubro Ltd. 3.44% Consumer Non Durables 29.27%• Nestle India Ltd. 4.44%• Hindustan Unilever Ltd. 4.42%• Britannia Industries Ltd. 4.19%• ITC Ltd. 3.58% Asian Paints Ltd. 3.21% Marico Ltd. 3.20% Dabur India Ltd. 3.19% Colgate - Palmolive (India) Ltd. 3.05% Insurance 3.56%• HDFC Life Insurance Company Ltd. 3.56% Minerals/Mining 2.77% Coal India Ltd. 2.77% Petroleum Products 5.77% Reliance Industries Ltd. 2.95% Indian Oil Corporation Ltd. 2.82% Pharmaceuticals 9.26% Alkem Laboratories Ltd. 3.28% Cipla Ltd. 3.01% Dr. Reddy's Laboratories Ltd. 2.96% Power 6.07% NTPC Ltd. 3.05% Power Grid Corporation Of India Ltd. 3.02% Software 16.89%• Infosys Ltd. 3.58%• Tata Consultancy Services Ltd. 3.56%• Tech Mahindra Ltd. 3.51% HCL Technologies Ltd. 3.25%
Wipro Ltd. 2.98% Equity less than 1% of corpus Short Term Debt and net current assets 0.27% Total Net Assets 100.00%
Portfolio as on July 31, 2021
Company/Issuer Rating % to NAV
Company/Issuer Rating % to NAV
• Top Ten HoldingsSecurities and the corresponding derivative exposure with less than 1% to NAV, have been clubbed together with a consolidated limit of 10%.
Top 10 Sectors
Fund Details
Monthly AAUM as on 30-Jun-21 : Rs. 433.01 crores
Closing AUM as on 30-Jun-21 : Rs. 454.49 crores
NAV (As on 30-Jul-21): Rs. 130.1415
`
`̀ `̀` `
`
Fund Managers** :Kayzad Eghlim (Managing this fund since July 2017 &Overall 29 Years of experience)Nishit Patel (Managing this fund since Jan, 2021 & Overall 3 years of experience)
Indicative Investment Horizon: 5 years and above
Exit load for Redemption / Switch out :- Lumpsum & SIP / STP / SWP OptionNil
Inception/Allotment date: 3-Jul-17
Total Expense Ratio @@ :Other : 0.42% p. a.
Minimum application amount for buy/sale of units:Through Stock Exchange: One unit Directly with the Mutual Fund: In Creation unit size viz. 30,000 and in multiples thereof
Exchange Listed on:NSE and BSE
Codes & Symbols:NSE: ICICILOVOLBSE: ICICILOVOLISIN: INF109KB10T8
Average P/E :
37.85Average P/B :
12.33
Average Dividend Yield :
2.07
Sharpe Ratio : 0.65
Portfolio Beta :
0.99Tracking Error :
0.08%
Annual Portfolio Turnover Ratio : Equity - 0.42 times
Std Dev (Annualised) :
16.50%
Investors understand that their principal will be at Very High risk29.27%
16.89%
9.26%
7.59%
6.15%
6.07%
5.77%
5.77%
3.56%
3.44%
Consumer Non Durables
Software
Pharmaceuticals
Cement & Cement Products
Auto
Power
Banks
Petroleum Products
Insurance
Construction Project
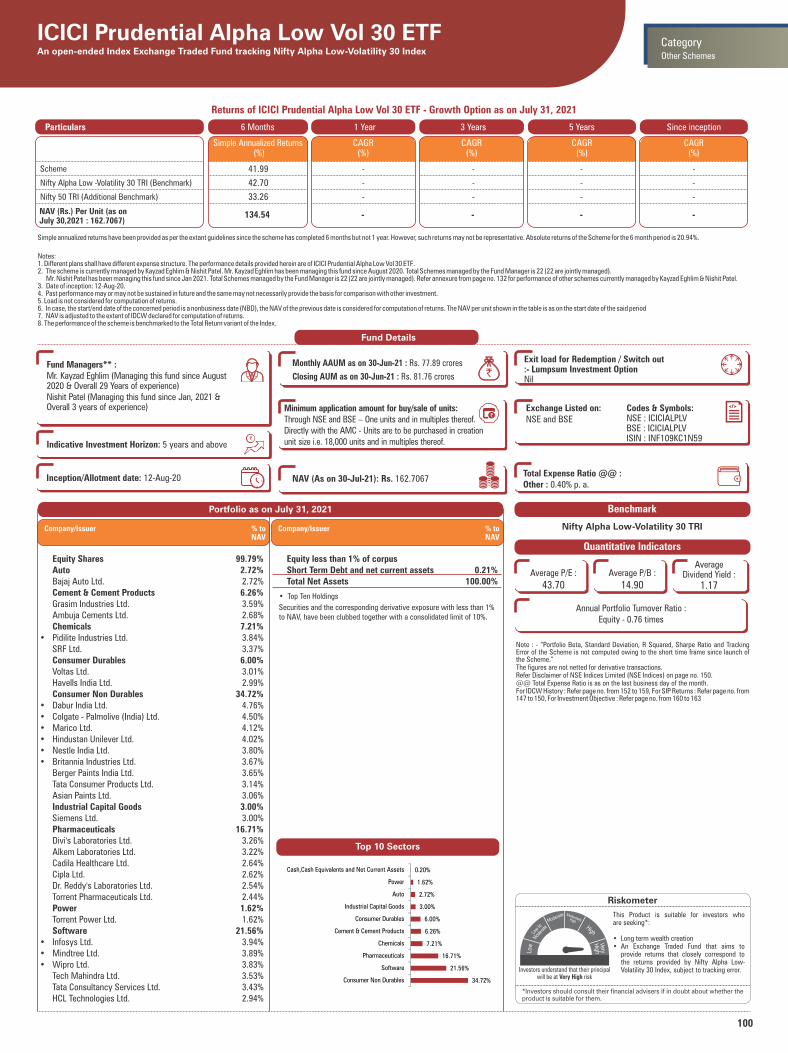
100
• Top Ten Holdings
Securities and the corresponding derivative exposure with less than 1% to NAV, have been clubbed together with a consolidated limit of 10%.
ICICI Prudential Alpha Low Vol 30 ETFAn open-ended Index Exchange Traded Fund tracking Nifty Alpha Low-Volatility 30 Index
Note : - “Portfolio Beta, Standard Deviation, R Squared, Sharpe Ratio and Tracking Error of the Scheme is not computed owing to the short time frame since launch of the Scheme.”The figures are not netted for derivative transactions.Refer Disclaimer of NSE Indices Limited (NSE Indices) on page no. 150.@@ Total Expense Ratio is as on the last business day of the month.For IDCW History : Refer page no. from 152 to 159, For SIP Returns : Refer page no. from 147 to 150, For Investment Objective : Refer page no. from 160 to 163
Quantitative Indicators
Benchmark
Nifty Alpha Low-Volatility 30 TRI
Other Schemes
Category
Equity Shares 99.79% Auto 2.72% Bajaj Auto Ltd. 2.72% Cement & Cement Products 6.26% Grasim Industries Ltd. 3.59% Ambuja Cements Ltd. 2.68% Chemicals 7.21%• Pidilite Industries Ltd. 3.84% SRF Ltd. 3.37% Consumer Durables 6.00% Voltas Ltd. 3.01% Havells India Ltd. 2.99% Consumer Non Durables 34.72%• Dabur India Ltd. 4.76%• Colgate - Palmolive (India) Ltd. 4.50%• Marico Ltd. 4.12%• Hindustan Unilever Ltd. 4.02%• Nestle India Ltd. 3.80%• Britannia Industries Ltd. 3.67% Berger Paints India Ltd. 3.65% Tata Consumer Products Ltd. 3.14% Asian Paints Ltd. 3.06% Industrial Capital Goods 3.00% Siemens Ltd. 3.00% Pharmaceuticals 16.71% Divi's Laboratories Ltd. 3.26% Alkem Laboratories Ltd. 3.22% Cadila Healthcare Ltd. 2.64% Cipla Ltd. 2.62% Dr. Reddy's Laboratories Ltd. 2.54% Torrent Pharmaceuticals Ltd. 2.44% Power 1.62% Torrent Power Ltd. 1.62% Software 21.56%• Infosys Ltd. 3.94%• Mindtree Ltd. 3.89%• Wipro Ltd. 3.83% Tech Mahindra Ltd. 3.53% Tata Consultancy Services Ltd. 3.43% HCL Technologies Ltd. 2.94%
Portfolio as on July 31, 2021
Company/Issuer % to NAV
Fund Details
Fund Managers** :Mr. Kayzad Eghlim (Managing this fund since August 2020 & Overall 29 Years of experience)Nishit Patel (Managing this fund since Jan, 2021 & Overall 3 years of experience)
Indicative Investment Horizon: 5 years and above
Inception/Allotment date: 12-Aug-20
Monthly AAUM as on 30-Jun-21 : Rs. 77.89 crores
Closing AUM as on 30-Jun-21 : Rs. 81.76 crores `
NAV (As on 30-Jul-21): Rs. 162.7067 `̀ `̀` `
`
Exit load for Redemption / Switch out:- Lumpsum Investment OptionNil
Total Expense Ratio @@ :Other : 0.40% p. a.
Exchange Listed on:NSE and BSE
Codes & Symbols:NSE : ICICIALPLVBSE : ICICIALPLVISIN : INF109KC1N59
Average P/E :
43.70Average P/B :
14.90
Average Dividend Yield :
1.17
Annual Portfolio Turnover Ratio : Equity - 0.76 times
Minimum application amount for buy/sale of units:Through NSE and BSE – One units and in multiples thereof.Directly with the AMC - Units are to be purchased in creationunit size i.e. 18,000 units and in multiples thereof.
Riskometer
This Product is suitable for investors who are seeking*:
• Long term wealth creation• An Exchange Traded Fund that aims to
provide returns that closely correspond to the returns provided by Nifty Alpha Low-Volatility 30 Index, subject to tracking error.
*Investors should consult their financial advisers if in doubt about whether theproduct is suitable for them.
Investors understand that their principal will be at Very High risk
Top 10 Sectors
Company/Issuer % to NAV
Equity less than 1% of corpus Short Term Debt and net current assets 0.21% Total Net Assets 100.00%
Notes:1. Different plans shall have different expense structure. The performance details provided herein are of ICICI Prudential Alpha Low Vol 30 ETF.2. The scheme is currently managed by Kayzad Eghlim & Nishit Patel. Mr. Kayzad Eghlim has been managing this fund since August 2020. Total Schemes managed by the Fund Manager is 22 (22 are jointly managed). Mr. Nishit Patel has been managing this fund since Jan 2021. Total Schemes managed by the Fund Manager is 22 (22 are jointly managed). Refer annexure from page no. 132 for performance of other schemes currently managed by Kayzad Eghlim & Nishit Patel.3. Date of inception: 12-Aug-20.4. Past performance may or may not be sustained in future and the same may not necessarily provide the basis for comparison with other investment.5. Load is not considered for computation of returns.6. In case, the start/end date of the concerned period is a nonbusiness date (NBD), the NAV of the previous date is considered for computation of returns. The NAV per unit shown in the table is as on the start date of the said period7. NAV is adjusted to the extent of IDCW declared for computation of returns.8. The performance of the scheme is benchmarked to the Total Return variant of the Index.
Returns of ICICI Prudential Alpha Low Vol 30 ETF - Growth Option as on July 31, 2021
1 Year 3 Years 5 Years Since inceptionParticulars
- -
CAGR (%)
CAGR (%)
CAGR (%)
- -
Scheme
Nifty Alpha Low -Volatility 30 TRI (Benchmark)
Nifty 50 TRI (Additional Benchmark)
NAV (Rs.) Per Unit (as on July 30,2021 : 162.7067)
6 Months
Simple Annualized Returns (%)
41.99 - - - -
42.70 - - - -
33.26 - - - -
134.54
CAGR (%)
Simple annualized returns have been provided as per the extant guidelines since the scheme has completed 6 months but not 1 year. However, such returns may not be representative. Absolute returns of the Scheme for the 6 month period is 20.94%.
34.72%
21.56%
16.71%
7.21%
6.26%
6.00%
3.00%
2.72%
1.62%
0.20%
Consumer Non Durables
Software
Pharmaceuticals
Chemicals
Cement & Cement Products
Consumer Durables
Industrial Capital Goods
Auto
Power
Cash,Cash Equivalents and Net Current Assets
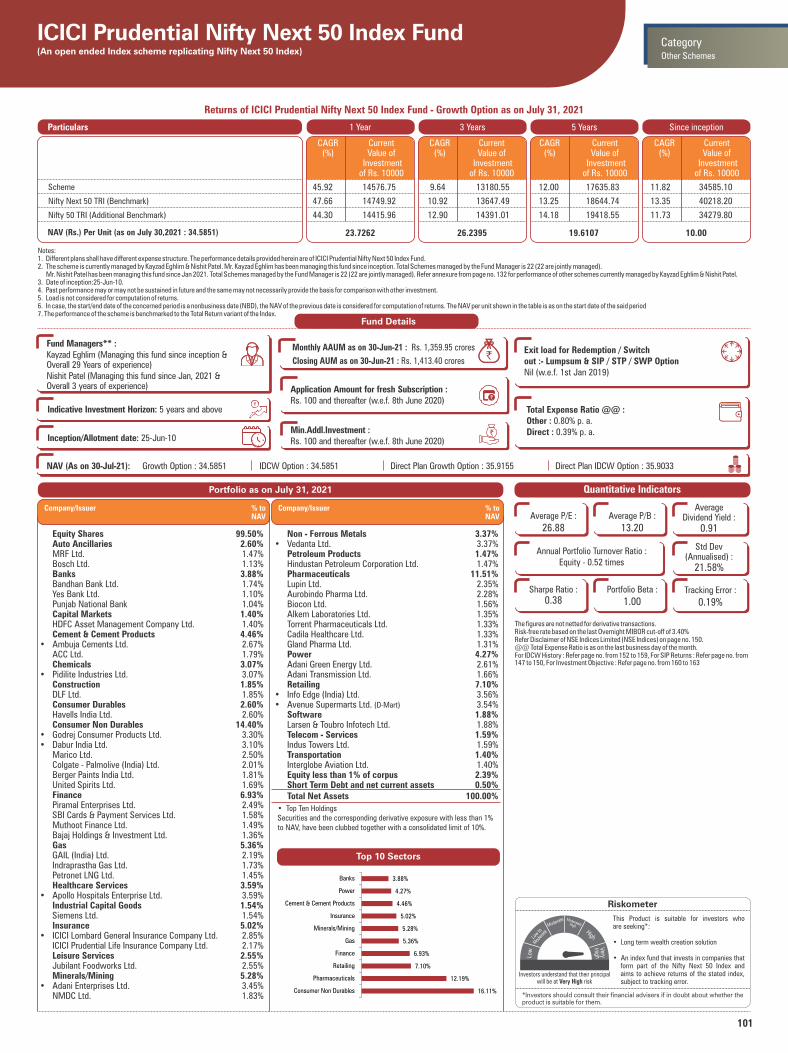
101
Notes:1. Different plans shall have different expense structure. The performance details provided herein are of ICICI Prudential Nifty Next 50 Index Fund.2. The scheme is currently managed by Kayzad Eghlim & Nishit Patel. Mr. Kayzad Eghlim has been managing this fund since inception. Total Schemes managed by the Fund Manager is 22 (22 are jointly managed). Mr. Nishit Patel has been managing this fund since Jan 2021. Total Schemes managed by the Fund Manager is 22 (22 are jointly managed). Refer annexure from page no. 132 for performance of other schemes currently managed by Kayzad Eghlim & Nishit Patel.3. Date of inception:25-Jun-10.4. Past performance may or may not be sustained in future and the same may not necessarily provide the basis for comparison with other investment.5. Load is not considered for computation of returns.6. In case, the start/end date of the concerned period is a nonbusiness date (NBD), the NAV of the previous date is considered for computation of returns. The NAV per unit shown in the table is as on the start date of the said period7. The performance of the scheme is benchmarked to the Total Return variant of the Index.
Returns of ICICI Prudential Nifty Next 50 Index Fund - Growth Option as on July 31, 2021
Riskometer
This Product is suitable for investors who are seeking*:
• Long term wealth creation solution
• An index fund that invests in companies that form part of the Nifty Next 50 Index and aims to achieve returns of the stated index, subject to tracking error.
*Investors should consult their financial advisers if in doubt about whether theproduct is suitable for them.
ICICI Prudential Nifty Next 50 Index Fund(An open ended Index scheme replicating Nifty Next 50 Index)
The figures are not netted for derivative transactions.Risk-free rate based on the last Overnight MIBOR cut-off of 3.40%Refer Disclaimer of NSE Indices Limited (NSE Indices) on page no. 150.@@ Total Expense Ratio is as on the last business day of the month.For IDCW History : Refer page no. from 152 to 159, For SIP Returns : Refer page no. from 147 to 150, For Investment Objective : Refer page no. from 160 to 163
1 Year 3 Years 5 Years Since inceptionParticulars
23.7262 26.2395
CAGR (%)
Current Value of
Investment of Rs. 10000
CAGR (%)
Current Value of
Investment of Rs. 10000
CAGR (%)
Current Value of
Investment of Rs. 10000
19.6107
CAGR (%)
Current Value of
Investment of Rs. 10000
10.00
Scheme
Nifty Next 50 TRI (Benchmark)
Nifty 50 TRI (Additional Benchmark)
NAV (Rs.) Per Unit (as on July 30,2021 : 34.5851)
45.92 14576.75 9.64 13180.55 12.00 17635.83 11.82 34585.10
47.66 14749.92 10.92 13647.49 13.25 18644.74 13.35 40218.20
44.30 14415.96 12.90 14391.01 14.18 19418.55 11.73 34279.80
Quantitative Indicators
Other Schemes
Category
Equity Shares 99.50% Auto Ancillaries 2.60% MRF Ltd. 1.47% Bosch Ltd. 1.13% Banks 3.88% Bandhan Bank Ltd. 1.74% Yes Bank Ltd. 1.10% Punjab National Bank 1.04% Capital Markets 1.40% HDFC Asset Management Company Ltd. 1.40% Cement & Cement Products 4.46%• Ambuja Cements Ltd. 2.67% ACC Ltd. 1.79% Chemicals 3.07%• Pidilite Industries Ltd. 3.07% Construction 1.85% DLF Ltd. 1.85% Consumer Durables 2.60% Havells India Ltd. 2.60% Consumer Non Durables 14.40%• Godrej Consumer Products Ltd. 3.30%• Dabur India Ltd. 3.10% Marico Ltd. 2.50% Colgate - Palmolive (India) Ltd. 2.01% Berger Paints India Ltd. 1.81% United Spirits Ltd. 1.69% Finance 6.93% Piramal Enterprises Ltd. 2.49% SBI Cards & Payment Services Ltd. 1.58% Muthoot Finance Ltd. 1.49% Bajaj Holdings & Investment Ltd. 1.36% Gas 5.36% GAIL (India) Ltd. 2.19% Indraprastha Gas Ltd. 1.73% Petronet LNG Ltd. 1.45% Healthcare Services 3.59%• Apollo Hospitals Enterprise Ltd. 3.59% Industrial Capital Goods 1.54% Siemens Ltd. 1.54% Insurance 5.02%• ICICI Lombard General Insurance Company Ltd. 2.85% ICICI Prudential Life Insurance Company Ltd. 2.17% Leisure Services 2.55% Jubilant Foodworks Ltd. 2.55% Minerals/Mining 5.28%• Adani Enterprises Ltd. 3.45% NMDC Ltd. 1.83%
Non - Ferrous Metals 3.37%• Vedanta Ltd. 3.37% Petroleum Products 1.47% Hindustan Petroleum Corporation Ltd. 1.47% Pharmaceuticals 11.51% Lupin Ltd. 2.35% Aurobindo Pharma Ltd. 2.28% Biocon Ltd. 1.56% Alkem Laboratories Ltd. 1.35% Torrent Pharmaceuticals Ltd. 1.33% Cadila Healthcare Ltd. 1.33% Gland Pharma Ltd. 1.31% Power 4.27% Adani Green Energy Ltd. 2.61% Adani Transmission Ltd. 1.66% Retailing 7.10%• Info Edge (India) Ltd. 3.56%• Avenue Supermarts Ltd. 3.54%(D-Mart)
Software 1.88% Larsen & Toubro Infotech Ltd. 1.88% Telecom - Services 1.59% Indus Towers Ltd. 1.59% Transportation 1.40% Interglobe Aviation Ltd. 1.40% Equity less than 1% of corpus 2.39% Short Term Debt and net current assets 0.50% Total Net Assets 100.00%
Portfolio as on July 31, 2021
Company/Issuer % to NAV
Company/Issuer % to NAV
• Top Ten HoldingsSecurities and the corresponding derivative exposure with less than 1% to NAV, have been clubbed together with a consolidated limit of 10%.
Top 10 Sectors
Fund Details
Fund Managers** :Kayzad Eghlim (Managing this fund since inception &Overall 29 Years of experience)Nishit Patel (Managing this fund since Jan, 2021 & Overall 3 years of experience)
Total Expense Ratio @@ :Other : 0.80% p. a.Direct : 0.39% p. a.
Inception/Allotment date: 25-Jun-10
Exit load for Redemption / Switchout :- Lumpsum & SIP / STP / SWP OptionNil (w.e.f. 1st Jan 2019)
Monthly AAUM as on 30-Jun-21 : Rs. 1,359.95 crores
Closing AUM as on 30-Jun-21 : Rs. 1,413.40 crores`
Application Amount for fresh Subscription :Rs. 100 and thereafter (w.e.f. 8th June 2020)
Min.Addl.Investment :Rs. 100 and thereafter (w.e.f. 8th June 2020)
NAV (As on 30-Jul-21): Growth Option : 34.5851 IDCW Option : 34.5851 Direct Plan Growth Option : 35.9155 Direct Plan IDCW Option : 35.9033 `̀ `̀` `
`
Average P/E :
26.88Average P/B :
13.20
Average Dividend Yield :
0.91
Sharpe Ratio : 0.38
Portfolio Beta :
1.00Tracking Error :
0.19%
Annual Portfolio Turnover Ratio : Equity - 0.52 times
Std Dev (Annualised) :
21.58%
Investors understand that their principal will be at Very High risk
Indicative Investment Horizon: 5 years and above
16.11%
12.19%
7.10%
6.93%
5.36%
5.28%
5.02%
4.46%
4.27%
3.88%
Consumer Non Durables
Pharmaceuticals
Retailing
Finance
Gas
Minerals/Mining
Insurance
Cement & Cement Products
Power
Banks
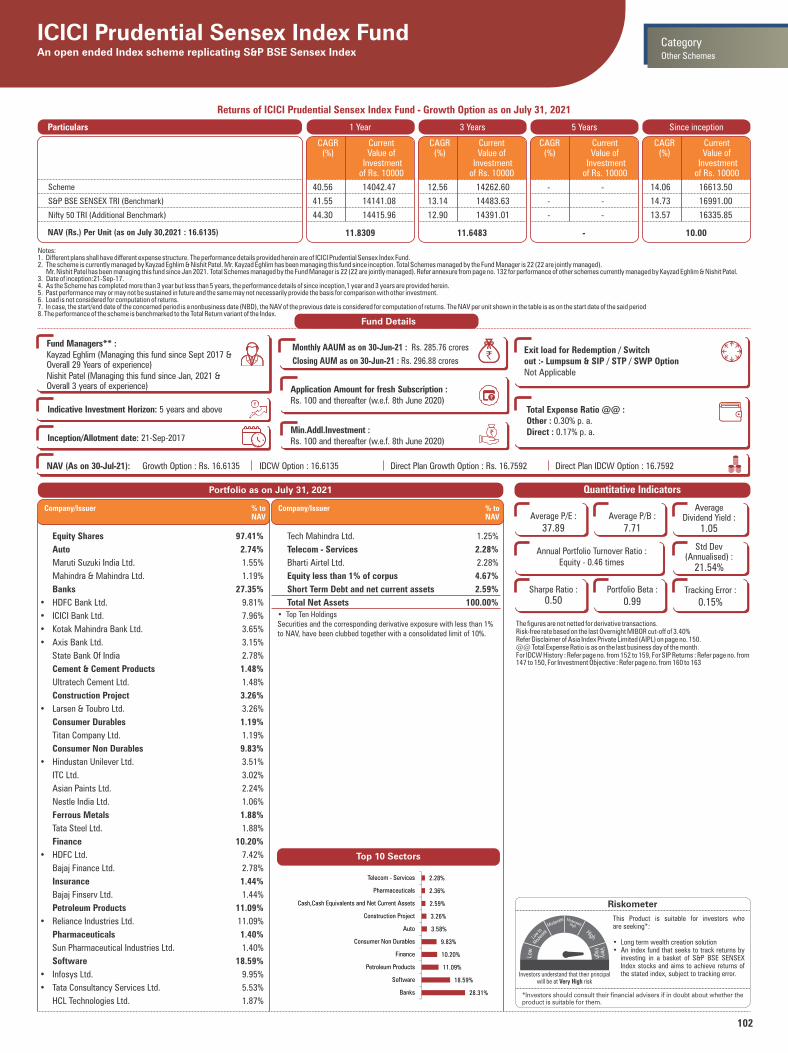
102
Notes:1. Different plans shall have different expense structure. The performance details provided herein are of ICICI Prudential Sensex Index Fund.2. The scheme is currently managed by Kayzad Eghlim & Nishit Patel. Mr. Kayzad Eghlim has been managing this fund since inception. Total Schemes managed by the Fund Manager is 22 (22 are jointly managed). Mr. Nishit Patel has been managing this fund since Jan 2021. Total Schemes managed by the Fund Manager is 22 (22 are jointly managed). Refer annexure from page no. 132 for performance of other schemes currently managed by Kayzad Eghlim & Nishit Patel.3. Date of inception:21-Sep-17.4. As the Scheme has completed more than 3 year but less than 5 years, the performance details of since inception,1 year and 3 years are provided herein.5. Past performance may or may not be sustained in future and the same may not necessarily provide the basis for comparison with other investment.6. Load is not considered for computation of returns.7. In case, the start/end date of the concerned period is a nonbusiness date (NBD), the NAV of the previous date is considered for computation of returns. The NAV per unit shown in the table is as on the start date of the said period8. The performance of the scheme is benchmarked to the Total Return variant of the Index.
Returns of ICICI Prudential Sensex Index Fund - Growth Option as on July 31, 2021
Riskometer
This Product is suitable for investors who are seeking*:
• Long term wealth creation solution• An index fund that seeks to track returns by
investing in a basket of S&P BSE SENSEX Index stocks and aims to achieve returns of the stated index, subject to tracking error.
*Investors should consult their financial advisers if in doubt about whether theproduct is suitable for them.
ICICI Prudential Sensex Index FundAn open ended Index scheme replicating S&P BSE Sensex Index
The figures are not netted for derivative transactions.Risk-free rate based on the last Overnight MIBOR cut-off of 3.40%Refer Disclaimer of Asia Index Private Limited (AIPL) on page no. 150.@@ Total Expense Ratio is as on the last business day of the month.For IDCW History : Refer page no. from 152 to 159, For SIP Returns : Refer page no. from 147 to 150, For Investment Objective : Refer page no. from 160 to 163
1 Year 3 Years 5 Years Since inceptionParticulars
11.8309 11.6483
CAGR (%)
Current Value of
Investment of Rs. 10000
CAGR (%)
Current Value of
Investment of Rs. 10000
CAGR (%)
Current Value of
Investment of Rs. 10000
-
CAGR (%)
Current Value of
Investment of Rs. 10000
10.00
Scheme
S&P BSE SENSEX TRI (Benchmark)
Nifty 50 TRI (Additional Benchmark)
NAV (Rs.) Per Unit (as on July 30,2021 : 16.6135)
40.56 14042.47 12.56 14262.60 - - 14.06 16613.50
41.55 14141.08 13.14 14483.63 - - 14.73 16991.00
44.30 14415.96 12.90 14391.01 - - 13.57 16335.85
Quantitative Indicators
Other Schemes
Category
Equity Shares 97.41%
Auto 2.74%
Maruti Suzuki India Ltd. 1.55%
Mahindra & Mahindra Ltd. 1.19%
Banks 27.35%
• HDFC Bank Ltd. 9.81%
• ICICI Bank Ltd. 7.96%
• Kotak Mahindra Bank Ltd. 3.65%
• Axis Bank Ltd. 3.15%
State Bank Of India 2.78%
Cement & Cement Products 1.48%
Ultratech Cement Ltd. 1.48%
Construction Project 3.26%
• Larsen & Toubro Ltd. 3.26%
Consumer Durables 1.19%
Titan Company Ltd. 1.19%
Consumer Non Durables 9.83%
• Hindustan Unilever Ltd. 3.51%
ITC Ltd. 3.02%
Asian Paints Ltd. 2.24%
Nestle India Ltd. 1.06%
Ferrous Metals 1.88%
Tata Steel Ltd. 1.88%
Finance 10.20%
• HDFC Ltd. 7.42%
Bajaj Finance Ltd. 2.78%
Insurance 1.44%
Bajaj Finserv Ltd. 1.44%
Petroleum Products 11.09%
• Reliance Industries Ltd. 11.09%
Pharmaceuticals 1.40%
Sun Pharmaceutical Industries Ltd. 1.40%
Software 18.59%
• Infosys Ltd. 9.95%
• Tata Consultancy Services Ltd. 5.53%
HCL Technologies Ltd. 1.87%
Tech Mahindra Ltd. 1.25%
Telecom - Services 2.28%
Bharti Airtel Ltd. 2.28%
Equity less than 1% of corpus 4.67%
Short Term Debt and net current assets 2.59%
Total Net Assets 100.00%
Portfolio as on July 31, 2021
Company/Issuer % to NAV
Company/Issuer % to NAV
• Top Ten HoldingsSecurities and the corresponding derivative exposure with less than 1% to NAV, have been clubbed together with a consolidated limit of 10%.
Top 10 Sectors
Fund Details
Fund Managers** :Kayzad Eghlim (Managing this fund since Sept 2017 & Overall 29 Years of experience)Nishit Patel (Managing this fund since Jan, 2021 & Overall 3 years of experience)
Total Expense Ratio @@ :Other : 0.30% p. a.Direct : 0.17% p. a.
Inception/Allotment date: 21-Sep-2017
Exit load for Redemption / Switchout :- Lumpsum & SIP / STP / SWP OptionNot Applicable
Monthly AAUM as on 30-Jun-21 : Rs. 285.76 crores
Closing AUM as on 30-Jun-21 : Rs. 296.88 crores`
Application Amount for fresh Subscription :Rs. 100 and thereafter (w.e.f. 8th June 2020)
Min.Addl.Investment :Rs. 100 and thereafter (w.e.f. 8th June 2020)
NAV (As on 30-Jul-21): Growth Option : Rs. 16.6135 IDCW Option : 16.6135 Direct Plan Growth Option : Rs. 16.7592 Direct Plan IDCW Option : 16.7592 `̀ `̀` `
`
Average P/E :
37.89Average P/B :
7.71
Average Dividend Yield :
1.05
Sharpe Ratio : 0.50
Portfolio Beta :
0.99Tracking Error :
0.15%
Annual Portfolio Turnover Ratio : Equity - 0.46 times
Std Dev (Annualised) :
21.54%
Investors understand that their principal will be at Very High risk
Indicative Investment Horizon: 5 years and above
28.31%
18.59%
11.09%
10.20%
9.83%
3.58%
3.26%
2.59%
2.36%
2.28%
Banks
Software
Petroleum Products
Finance
Consumer Non Durables
Auto
Construction Project
Cash,Cash Equivalents and Net Current Assets
Pharmaceuticals
Telecom - Services
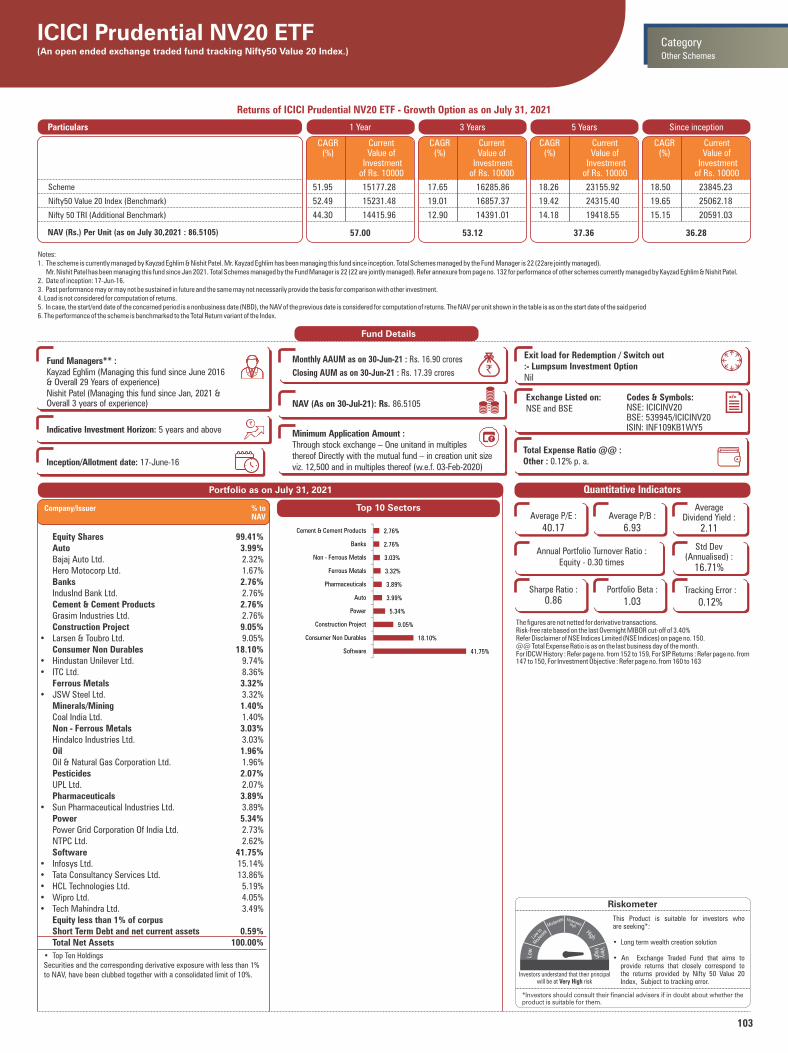
103
Notes:1. The scheme is currently managed by Kayzad Eghlim & Nishit Patel. Mr. Kayzad Eghlim has been managing this fund since inception. Total Schemes managed by the Fund Manager is 22 (22are jointly managed). Mr. Nishit Patel has been managing this fund since Jan 2021. Total Schemes managed by the Fund Manager is 22 (22 are jointly managed). Refer annexure from page no. 132 for performance of other schemes currently managed by Kayzad Eghlim & Nishit Patel.2. Date of inception: 17-Jun-16.3. Past performance may or may not be sustained in future and the same may not necessarily provide the basis for comparison with other investment.4. Load is not considered for computation of returns.5. In case, the start/end date of the concerned period is a nonbusiness date (NBD), the NAV of the previous date is considered for computation of returns. The NAV per unit shown in the table is as on the start date of the said period6. The performance of the scheme is benchmarked to the Total Return variant of the Index.
Returns of ICICI Prudential NV20 ETF - Growth Option as on July 31, 2021
Riskometer
This Product is suitable for investors who are seeking*:
• Long term wealth creation solution
• An Exchange Traded Fund that aims to provide returns that closely correspond to the returns provided by Nifty 50 Value 20 Index, Subject to tracking error.
*Investors should consult their financial advisers if in doubt about whether theproduct is suitable for them.
ICICI Prudential NV20 ETF(An open ended exchange traded fund tracking Nifty50 Value 20 Index.)
The figures are not netted for derivative transactions.Risk-free rate based on the last Overnight MIBOR cut-off of 3.40%Refer Disclaimer of NSE Indices Limited (NSE Indices) on page no. 150.@@ Total Expense Ratio is as on the last business day of the month.For IDCW History : Refer page no. from 152 to 159, For SIP Returns : Refer page no. from 147 to 150, For Investment Objective : Refer page no. from 160 to 163
1 Year 3 Years 5 Years Since inceptionParticulars
57.00 53.12
CAGR (%)
Current Value of
Investment of Rs. 10000
CAGR (%)
Current Value of
Investment of Rs. 10000
CAGR (%)
Current Value of
Investment of Rs. 10000
37.36
CAGR (%)
Current Value of
Investment of Rs. 10000
36.28
Scheme
Nifty50 Value 20 Index (Benchmark)
Nifty 50 TRI (Additional Benchmark)
NAV (Rs.) Per Unit (as on July 30,2021 : 86.5105)
51.95 15177.28 17.65 16285.86 18.26 23155.92 18.50 23845.23
52.49 15231.48 19.01 16857.37 19.42 24315.40 19.65 25062.18
44.30 14415.96 12.90 14391.01 14.18 19418.55 15.15 20591.03
Quantitative Indicators
Other Schemes
Category
• Top Ten HoldingsSecurities and the corresponding derivative exposure with less than 1% to NAV, have been clubbed together with a consolidated limit of 10%.
Equity Shares 99.41% Auto 3.99% Bajaj Auto Ltd. 2.32% Hero Motocorp Ltd. 1.67% Banks 2.76% IndusInd Bank Ltd. 2.76% Cement & Cement Products 2.76% Grasim Industries Ltd. 2.76% Construction Project 9.05%• Larsen & Toubro Ltd. 9.05% Consumer Non Durables 18.10%• Hindustan Unilever Ltd. 9.74%• ITC Ltd. 8.36% Ferrous Metals 3.32%• JSW Steel Ltd. 3.32% Minerals/Mining 1.40% Coal India Ltd. 1.40% Non - Ferrous Metals 3.03% Hindalco Industries Ltd. 3.03% Oil 1.96% Oil & Natural Gas Corporation Ltd. 1.96% Pesticides 2.07% UPL Ltd. 2.07% Pharmaceuticals 3.89%• Sun Pharmaceutical Industries Ltd. 3.89% Power 5.34% Power Grid Corporation Of India Ltd. 2.73% NTPC Ltd. 2.62% Software 41.75%• Infosys Ltd. 15.14%• Tata Consultancy Services Ltd. 13.86%• HCL Technologies Ltd. 5.19%• Wipro Ltd. 4.05%• Tech Mahindra Ltd. 3.49% Equity less than 1% of corpus Short Term Debt and net current assets 0.59% Total Net Assets 100.00%
Portfolio as on July 31, 2021
Company/Issuer % to NAV
Top 10 Sectors
Fund Details
Monthly AAUM as on 30-Jun-21 : Rs. 16.90 crores
Closing AUM as on 30-Jun-21 : Rs. 17.39 crores
NAV (As on 30-Jul-21): Rs. 86.5105
`
`̀ `̀` `
`
Fund Managers** :Kayzad Eghlim (Managing this fund since June 2016 & Overall 29 Years of experience)Nishit Patel (Managing this fund since Jan, 2021 & Overall 3 years of experience)
Indicative Investment Horizon: 5 years and above
Exit load for Redemption / Switch out:- Lumpsum Investment OptionNil
Inception/Allotment date: 17-June-16
Total Expense Ratio @@ :Other : 0.12% p. a.
Minimum Application Amount :Through stock exchange – One unitand in multiplesthereof Directly with the mutual fund – in creation unit size viz. 12,500 and in multiples thereof (w.e.f. 03-Feb-2020)
Exchange Listed on:NSE and BSE
Codes & Symbols:NSE: ICICINV20BSE: 539945/ICICINV20ISIN: INF109KB1WY5
Average P/E :
40.17Average P/B :
6.93
Average Dividend Yield :
2.11
Sharpe Ratio : 0.86
Portfolio Beta :
1.03Tracking Error :
0.12%
Annual Portfolio Turnover Ratio : Equity - 0.30 times
Std Dev (Annualised) :
16.71%
Investors understand that their principal will be at Very High risk
41.75%
18.10%
9.05%
5.34%
3.99%
3.89%
3.32%
3.03%
2.76%
2.76%
Software
Consumer Non Durables
Construction Project
Power
Auto
Pharmaceuticals
Ferrous Metals
Non - Ferrous Metals
Banks
Cement & Cement Products

104
Notes:1. The scheme is currently managed by Kayzad Eghlim & Nishit Patel. Mr. Kayzad Eghlim has been managing this fund since Aug 09. Total Schemes managed by the Fund Manager is 22 (22 are jointly managed). Mr. Nishit Patel has been managing this fund since Jan 2021. Total Schemes managed by the Fund Manager is 22 (22 are jointly managed). Refer annexure from page no. 132 for performance of other schemes currently managed by Kayzad Eghlim & Nishit Patel.2. Date of inception:10-Jan-03.3. Past performance may or may not be sustained in future and the same may not necessarily provide the basis for comparison with other investment.4. Load is not considered for computation of returns.5. In case, the start/end date of the concerned period is a nonbusiness date (NBD), the NAV of the previous date is considered for computation of returns. The NAV per unit shown in the table is as on the start date of the said period6. The performance of the scheme is benchmarked to the Total Return variant of the Index.
Returns of ICICI Prudential Sensex ETF - Growth Option as on July 31, 2021
Riskometer
This Product is suitable for investors who are seeking*:
• Long term wealth creation solution• An Exchange Traded Fund that aims to
provide returns that closely correspond to the returns of the securities represented by S&P BSE SENSEX Index, subject to tracking error.
*Investors should consult their financial advisers if in doubt about whether theproduct is suitable for them.
ICICI Prudential Sensex ETFAn open ended Exchange Traded Fund tracking S&P BSE Sensex Index.
1 Year 3 Years 5 Years Since inceptionParticulars
403.8572 394.4265
CAGR (%)
Current Value of
Investment of Rs. 10000
CAGR (%)
Current Value of
Investment of Rs. 10000
CAGR (%)
Current Value of
Investment of Rs. 10000
288.6663
CAGR (%)
Current Value of
Investment of Rs. 10000
33.59
Scheme
S&P BSE SENSEX TRI (Benchmark)
Nifty 50 TRI (Additional Benchmark)
NAV (Rs.) Per Unit (as on July 30,2021 : 570.1410)
41.31 14117.39 13.07 14454.94 14.57 19750.87 17.09 187222.11
41.55 14141.08 13.14 14483.63 14.73 19895.64 17.71 206220.86
44.30 14415.96 12.90 14391.01 14.18 19418.55 17.14 188429.52
* Exit Load : Investors, other than Authorised Participants, can sell units in less than Creation Unit Size of the Scheme directly to the Mutual Fund in the following cases:• if the traded price of the ETF units is at a discount of more than 3% to the NAV for continuous 30 days; or • if discount of bid price to applicable NAV is more than 3% over a period of 7 consecutive trading days; or• if no quotes are available on exchange for 3 consecutive trading days; or• when the total bid size on the exchange(s) is less than half of creation unit size daily, averaged over a period of 7 consecutive trading days.Under these circumstances, investors, as specified above, can redeem units of the Scheme directly with the fund house without any payment of exit load.The figures are not netted for derivative transactions.Risk-free rate based on the last Overnight MIBOR cut-off of 3.40%Refer Disclaimer of NSE and BSE on page no. 150.Refer Disclaimer of Asia Index Private Limited (AIPL) on page no. 150.@@ Total Expense Ratio is as on the last business day of the month.For IDCW History : Refer page no. from 152 to 159, For SIP Returns : Refer page no. from 147 to 150, For Investment Objective : Refer page no. from 160 to 163
Quantitative Indicators
Other Schemes
Category
Equity Shares 99.72%
Auto 2.82%
Maruti Suzuki India Ltd. 1.59%
Mahindra & Mahindra Ltd. 1.22%
Banks 27.98%
• HDFC Bank Ltd. 10.04%
• ICICI Bank Ltd. 8.14%
• Kotak Mahindra Bank Ltd. 3.74%
• Axis Bank Ltd. 3.21%
State Bank Of India 2.85%
Cement & Cement Products 1.51%
Ultratech Cement Ltd. 1.51%
Construction Project 3.34%
• Larsen & Toubro Ltd. 3.34%
Consumer Durables 1.23%
Titan Company Ltd. 1.23%
Consumer Non Durables 10.05%
• Hindustan Unilever Ltd. 3.60%
ITC Ltd. 3.08%
Asian Paints Ltd. 2.29%
Nestle India Ltd. 1.08%
Ferrous Metals 1.93%
Tata Steel Ltd. 1.93%
Finance 10.43%
• HDFC Ltd. 7.59%
Bajaj Finance Ltd. 2.84%
Insurance 1.48%
Bajaj Finserv Ltd. 1.48%
Petroleum Products 11.36%
• Reliance Industries Ltd. 11.36%
Pharmaceuticals 1.44%
Sun Pharmaceutical Industries Ltd. 1.44%
Power 1.00%
Power Grid Corporation Of India Ltd. 1.00%
Software 19.05%
• Infosys Ltd. 10.19%
• Tata Consultancy Services Ltd. 5.66%
HCL Technologies Ltd. 1.91%
Tech Mahindra Ltd. 1.29%
Telecom - Services 2.33%
Bharti Airtel Ltd. 2.33%
Equity less than 1% of corpus 3.78%
Short Term Debt and net current assets 0.28%
Total Net Assets 100.00%
Portfolio as on July 31, 2021
Company/Issuer % to NAV
Company/Issuer % to NAV
• Top Ten HoldingsSecurities and the corresponding derivative exposure with less than 1% to NAV, have been clubbed together with a consolidated limit of 10%.
Top 10 Sectors
Fund Details
Monthly AAUM as on 30-Jun-21 : Rs. 117.90 crores
Closing AUM as on 30-Jun-21 : Rs. 118.06 crores
NAV (As on 30-Jul-21): Rs. 570.1410
`
`̀ `̀` `
`
Fund Managers** :Kayzad Eghlim (Managing this fund since August 09 &Overall 29 Years of experience)Nishit Patel (Managing this fund since Jan, 2021 & Overall 3 years of experience)
Indicative Investment Horizon: 5 years and above
*Exit load for Redemption / Switch out:- Lumpsum Investment OptionNil
Inception/Allotment date: 10-Jan-03
Total Expense Ratio @@ :Other : 0.05% p. a.
Minimum application amount for buy/sale of units:Through Stock Exchange - One unit Directly with the mutual fund - in creation unit size viz. 10,000 units and in multiples thereof (w.e.f. 11-Jan-2021)
Exchange Listed on:NSE and BSE
Codes & Symbols:NSE : ICICISENSXBSE : 555555/ICICISENSXISIN : INF346A01034
Average P/E :
37.89Average P/B :
7.71
Average Dividend Yield :
1.05
Sharpe Ratio : 0.52
Portfolio Beta :
1.00Tracking Error :
0.04%
Annual Portfolio Turnover Ratio : Equity - 0.07 times
Std Dev (Annualised) :
21.76%
Investors understand that their principal will be at Very High risk
28.96%
19.05%
11.36%
10.43%
10.05%
3.67%
3.34%
2.42%
2.33%
1.97%
Banks
Software
Petroleum Products
Finance
Consumer Non Durables
Auto
Construction Project
Pharmaceuticals
Telecom - Services
Power
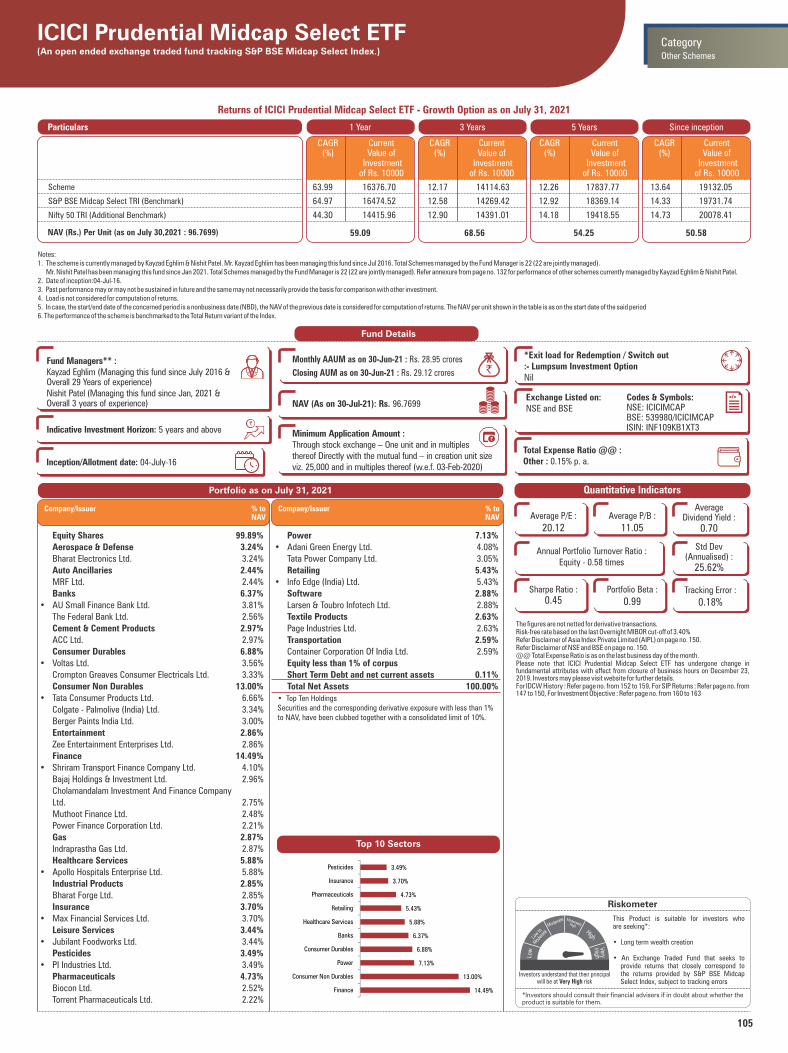
105
Notes:1. The scheme is currently managed by Kayzad Eghlim & Nishit Patel. Mr. Kayzad Eghlim has been managing this fund since Jul 2016. Total Schemes managed by the Fund Manager is 22 (22 are jointly managed). Mr. Nishit Patel has been managing this fund since Jan 2021. Total Schemes managed by the Fund Manager is 22 (22 are jointly managed). Refer annexure from page no. 132 for performance of other schemes currently managed by Kayzad Eghlim & Nishit Patel.2. Date of inception:04-Jul-16.3. Past performance may or may not be sustained in future and the same may not necessarily provide the basis for comparison with other investment.4. Load is not considered for computation of returns.5. In case, the start/end date of the concerned period is a nonbusiness date (NBD), the NAV of the previous date is considered for computation of returns. The NAV per unit shown in the table is as on the start date of the said period6. The performance of the scheme is benchmarked to the Total Return variant of the Index.
Returns of ICICI Prudential Midcap Select ETF - Growth Option as on July 31, 2021
Riskometer
This Product is suitable for investors who are seeking*:
• Long term wealth creation
• An Exchange Traded Fund that seeks to provide returns that closely correspond to the returns provided by S&P BSE Midcap Select Index, subject to tracking errors
*Investors should consult their financial advisers if in doubt about whether theproduct is suitable for them.
ICICI Prudential Midcap Select ETF(An open ended exchange traded fund tracking S&P BSE Midcap Select Index.)
The figures are not netted for derivative transactions.Risk-free rate based on the last Overnight MIBOR cut-off of 3.40%Refer Disclaimer of Asia Index Private Limited (AIPL) on page no. 150.Refer Disclaimer of NSE and BSE on page no. 150.@@ Total Expense Ratio is as on the last business day of the month.Please note that ICICI Prudential Midcap Select ETF has undergone change in fundamental attributes with effect from closure of business hours on December 23, 2019. Investors may please visit website for further details.For IDCW History : Refer page no. from 152 to 159, For SIP Returns : Refer page no. from 147 to 150, For Investment Objective : Refer page no. from 160 to 163
1 Year 3 Years 5 Years Since inceptionParticulars
59.09 68.56
CAGR (%)
Current Value of
Investment of Rs. 10000
CAGR (%)
Current Value of
Investment of Rs. 10000
CAGR (%)
Current Value of
Investment of Rs. 10000
54.25
CAGR (%)
Current Value of
Investment of Rs. 10000
50.58
Scheme
S&P BSE Midcap Select TRI (Benchmark)
Nifty 50 TRI (Additional Benchmark)
NAV (Rs.) Per Unit (as on July 30,2021 : 96.7699)
63.99 16376.70 12.17 14114.63 12.26 17837.77 13.64 19132.05
64.97 16474.52 12.58 14269.42 12.92 18369.14 14.33 19731.74
44.30 14415.96 12.90 14391.01 14.18 19418.55 14.73 20078.41
Quantitative Indicators
Other Schemes
Category
Equity Shares 99.89% Aerospace & Defense 3.24% Bharat Electronics Ltd. 3.24% Auto Ancillaries 2.44% MRF Ltd. 2.44% Banks 6.37%• AU Small Finance Bank Ltd. 3.81% The Federal Bank Ltd. 2.56% Cement & Cement Products 2.97% ACC Ltd. 2.97% Consumer Durables 6.88%• Voltas Ltd. 3.56% Crompton Greaves Consumer Electricals Ltd. 3.33% Consumer Non Durables 13.00%• Tata Consumer Products Ltd. 6.66% Colgate - Palmolive (India) Ltd. 3.34% Berger Paints India Ltd. 3.00% Entertainment 2.86% Zee Entertainment Enterprises Ltd. 2.86% Finance 14.49%• Shriram Transport Finance Company Ltd. 4.10% Bajaj Holdings & Investment Ltd. 2.96% Cholamandalam Investment And Finance Company Ltd. 2.75% Muthoot Finance Ltd. 2.48% Power Finance Corporation Ltd. 2.21% Gas 2.87% Indraprastha Gas Ltd. 2.87% Healthcare Services 5.88%• Apollo Hospitals Enterprise Ltd. 5.88% Industrial Products 2.85% Bharat Forge Ltd. 2.85% Insurance 3.70%• Max Financial Services Ltd. 3.70% Leisure Services 3.44%• Jubilant Foodworks Ltd. 3.44% Pesticides 3.49%• PI Industries Ltd. 3.49% Pharmaceuticals 4.73% Biocon Ltd. 2.52% Torrent Pharmaceuticals Ltd. 2.22%
Power 7.13%• Adani Green Energy Ltd. 4.08% Tata Power Company Ltd. 3.05% Retailing 5.43%• Info Edge (India) Ltd. 5.43% Software 2.88% Larsen & Toubro Infotech Ltd. 2.88% Textile Products 2.63% Page Industries Ltd. 2.63% Transportation 2.59% Container Corporation Of India Ltd. 2.59% Equity less than 1% of corpus Short Term Debt and net current assets 0.11% Total Net Assets 100.00%• Top Ten HoldingsSecurities and the corresponding derivative exposure with less than 1% to NAV, have been clubbed together with a consolidated limit of 10%.
Portfolio as on July 31, 2021
Company/Issuer % to NAV
Company/Issuer % to NAV
Top 10 Sectors
Fund Details
Monthly AAUM as on 30-Jun-21 : Rs. 28.95 crores
Closing AUM as on 30-Jun-21 : Rs. 29.12 crores
NAV (As on 30-Jul-21): Rs. 96.7699
`
`̀ `̀` `
`
Fund Managers** :Kayzad Eghlim (Managing this fund since July 2016 & Overall 29 Years of experience)Nishit Patel (Managing this fund since Jan, 2021 & Overall 3 years of experience)
Indicative Investment Horizon: 5 years and above
*Exit load for Redemption / Switch out:- Lumpsum Investment OptionNil
Inception/Allotment date: 04-July-16
Total Expense Ratio @@ :Other : 0.15% p. a.
Minimum Application Amount :Through stock exchange – One unit and in multiples thereof Directly with the mutual fund – in creation unit size viz. 25,000 and in multiples thereof (w.e.f. 03-Feb-2020)
Exchange Listed on:NSE and BSE
Codes & Symbols:NSE: ICICIMCAPBSE: 539980/ICICIMCAPISIN: INF109KB1XT3
Average P/E :
20.12Average P/B :
11.05
Average Dividend Yield :
0.70
Sharpe Ratio : 0.45
Portfolio Beta :
0.99Tracking Error :
0.18%
Annual Portfolio Turnover Ratio : Equity - 0.58 times
Std Dev (Annualised) :
25.62%
Investors understand that their principal will be at Very High risk
14.49%
13.00%
7.13%
6.88%
6.37%
5.88%
5.43%
4.73%
3.70%
3.49%
Finance
Consumer Non Durables
Power
Consumer Durables
Banks
Healthcare Services
Retailing
Pharmaceuticals
Insurance
Pesticides
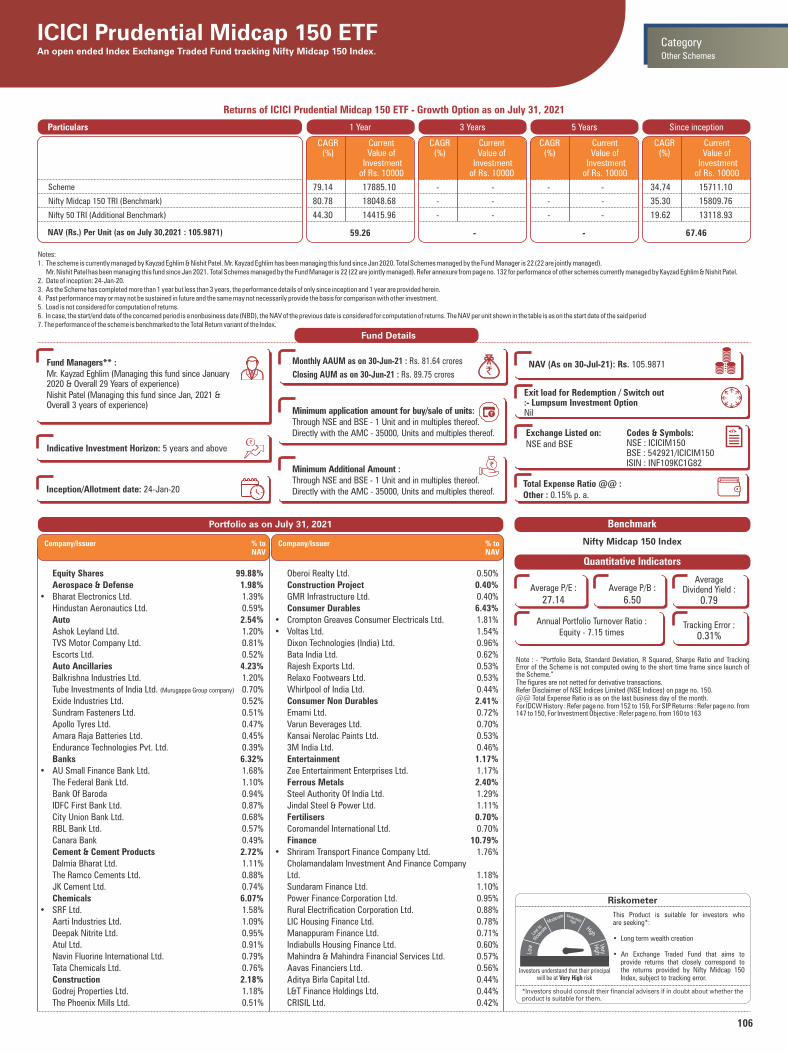
106
Riskometer
This Product is suitable for investors who are seeking*:
• Long term wealth creation
• An Exchange Traded Fund that aims to provide returns that closely correspond to the returns provided by Nifty Midcap 150 Index, subject to tracking error.
*Investors should consult their financial advisers if in doubt about whether theproduct is suitable for them.
ICICI Prudential Midcap 150 ETFAn open ended Index Exchange Traded Fund tracking Nifty Midcap 150 Index.
Note : - “Portfolio Beta, Standard Deviation, R Squared, Sharpe Ratio and Tracking Error of the Scheme is not computed owing to the short time frame since launch of the Scheme.”The figures are not netted for derivative transactions.Refer Disclaimer of NSE Indices Limited (NSE Indices) on page no. 150.@@ Total Expense Ratio is as on the last business day of the month.For IDCW History : Refer page no. from 152 to 159, For SIP Returns : Refer page no. from 147 to 150, For Investment Objective : Refer page no. from 160 to 163
Quantitative Indicators
Benchmark
Nifty Midcap 150 Index
Other Schemes
Category
Equity Shares 99.88% Aerospace & Defense 1.98%• Bharat Electronics Ltd. 1.39% Hindustan Aeronautics Ltd. 0.59% Auto 2.54% Ashok Leyland Ltd. 1.20% TVS Motor Company Ltd. 0.81% Escorts Ltd. 0.52% Auto Ancillaries 4.23% Balkrishna Industries Ltd. 1.20% Tube Investments of India Ltd. (Murugappa Group company) 0.70% Exide Industries Ltd. 0.52% Sundram Fasteners Ltd. 0.51% Apollo Tyres Ltd. 0.47% Amara Raja Batteries Ltd. 0.45% Endurance Technologies Pvt. Ltd. 0.39% Banks 6.32%• AU Small Finance Bank Ltd. 1.68% The Federal Bank Ltd. 1.10% Bank Of Baroda 0.94% IDFC First Bank Ltd. 0.87% City Union Bank Ltd. 0.68% RBL Bank Ltd. 0.57% Canara Bank 0.49% Cement & Cement Products 2.72% Dalmia Bharat Ltd. 1.11% The Ramco Cements Ltd. 0.88% JK Cement Ltd. 0.74% Chemicals 6.07%• SRF Ltd. 1.58% Aarti Industries Ltd. 1.09% Deepak Nitrite Ltd. 0.95% Atul Ltd. 0.91% Navin Fluorine International Ltd. 0.79% Tata Chemicals Ltd. 0.76% Construction 2.18% Godrej Properties Ltd. 1.18% The Phoenix Mills Ltd. 0.51%
Oberoi Realty Ltd. 0.50% Construction Project 0.40% GMR Infrastructure Ltd. 0.40% Consumer Durables 6.43%• Crompton Greaves Consumer Electricals Ltd. 1.81%• Voltas Ltd. 1.54% Dixon Technologies (India) Ltd. 0.96% Bata India Ltd. 0.62% Rajesh Exports Ltd. 0.53% Relaxo Footwears Ltd. 0.53% Whirlpool of India Ltd. 0.44% Consumer Non Durables 2.41% Emami Ltd. 0.72% Varun Beverages Ltd. 0.70% Kansai Nerolac Paints Ltd. 0.53% 3M India Ltd. 0.46% Entertainment 1.17% Zee Entertainment Enterprises Ltd. 1.17% Ferrous Metals 2.40% Steel Authority Of India Ltd. 1.29% Jindal Steel & Power Ltd. 1.11% Fertilisers 0.70% Coromandel International Ltd. 0.70% Finance 10.79%• Shriram Transport Finance Company Ltd. 1.76% Cholamandalam Investment And Finance Company Ltd. 1.18% Sundaram Finance Ltd. 1.10% Power Finance Corporation Ltd. 0.95% Rural Electrification Corporation Ltd. 0.88% LIC Housing Finance Ltd. 0.78% Manappuram Finance Ltd. 0.71% Indiabulls Housing Finance Ltd. 0.60% Mahindra & Mahindra Financial Services Ltd. 0.57% Aavas Financiers Ltd. 0.56% Aditya Birla Capital Ltd. 0.44% L&T Finance Holdings Ltd. 0.44% CRISIL Ltd. 0.42%
Portfolio as on July 31, 2021
Company/Issuer % to NAV
Company/Issuer % to NAV
Fund Details
Fund Managers** :Mr. Kayzad Eghlim (Managing this fund since January 2020 & Overall 29 Years of experience)Nishit Patel (Managing this fund since Jan, 2021 & Overall 3 years of experience)
Indicative Investment Horizon: 5 years and above
Inception/Allotment date: 24-Jan-20
Monthly AAUM as on 30-Jun-21 : Rs. 81.64 crores
Closing AUM as on 30-Jun-21 : Rs. 89.75 crores `NAV (As on 30-Jul-21): Rs. 105.9871 `̀ `̀` `
`
Minimum application amount for buy/sale of units:Through NSE and BSE - 1 Unit and in multiples thereof.Directly with the AMC - 35000, Units and multiples thereof.
Exit load for Redemption / Switch out:- Lumpsum Investment OptionNil
Total Expense Ratio @@ :Other : 0.15% p. a.
Exchange Listed on:NSE and BSE
Codes & Symbols:NSE : ICICIM150BSE : 542921/ICICIM150ISIN : INF109KC1G82
Minimum Additional Amount :Through NSE and BSE - 1 Unit and in multiples thereof.Directly with the AMC - 35000, Units and multiples thereof.
Average P/E :
27.14Average P/B :
6.50
Average Dividend Yield :
0.79
Investors understand that their principal will be at Very High risk
Notes:1. The scheme is currently managed by Kayzad Eghlim & Nishit Patel. Mr. Kayzad Eghlim has been managing this fund since Jan 2020. Total Schemes managed by the Fund Manager is 22 (22 are jointly managed). Mr. Nishit Patel has been managing this fund since Jan 2021. Total Schemes managed by the Fund Manager is 22 (22 are jointly managed). Refer annexure from page no. 132 for performance of other schemes currently managed by Kayzad Eghlim & Nishit Patel.2. Date of inception: 24-Jan-20.3. As the Scheme has completed more than 1 year but less than 3 years, the performance details of only since inception and 1 year are provided herein.4. Past performance may or may not be sustained in future and the same may not necessarily provide the basis for comparison with other investment.5. Load is not considered for computation of returns.6. In case, the start/end date of the concerned period is a nonbusiness date (NBD), the NAV of the previous date is considered for computation of returns. The NAV per unit shown in the table is as on the start date of the said period7. The performance of the scheme is benchmarked to the Total Return variant of the Index.
Returns of ICICI Prudential Midcap 150 ETF - Growth Option as on July 31, 2021
1 Year 3 Years 5 Years Since inceptionParticulars
59.26 -
CAGR (%)
Current Value of
Investment of Rs. 10000
CAGR (%)
Current Value of
Investment of Rs. 10000
CAGR (%)
Current Value of
Investment of Rs. 10000
-
CAGR (%)
Current Value of
Investment of Rs. 10000
67.46
Scheme
Nifty Midcap 150 TRI (Benchmark)
Nifty 50 TRI (Additional Benchmark)
NAV (Rs.) Per Unit (as on July 30,2021 : 105.9871)
79.14 17885.10 - - - - 34.74 15711.10
80.78 18048.68 - - - - 35.30 15809.76
44.30 14415.96 - - - - 19.62 13118.93
Annual Portfolio Turnover Ratio : Equity - 7.15 times
Tracking Error : 0.31%
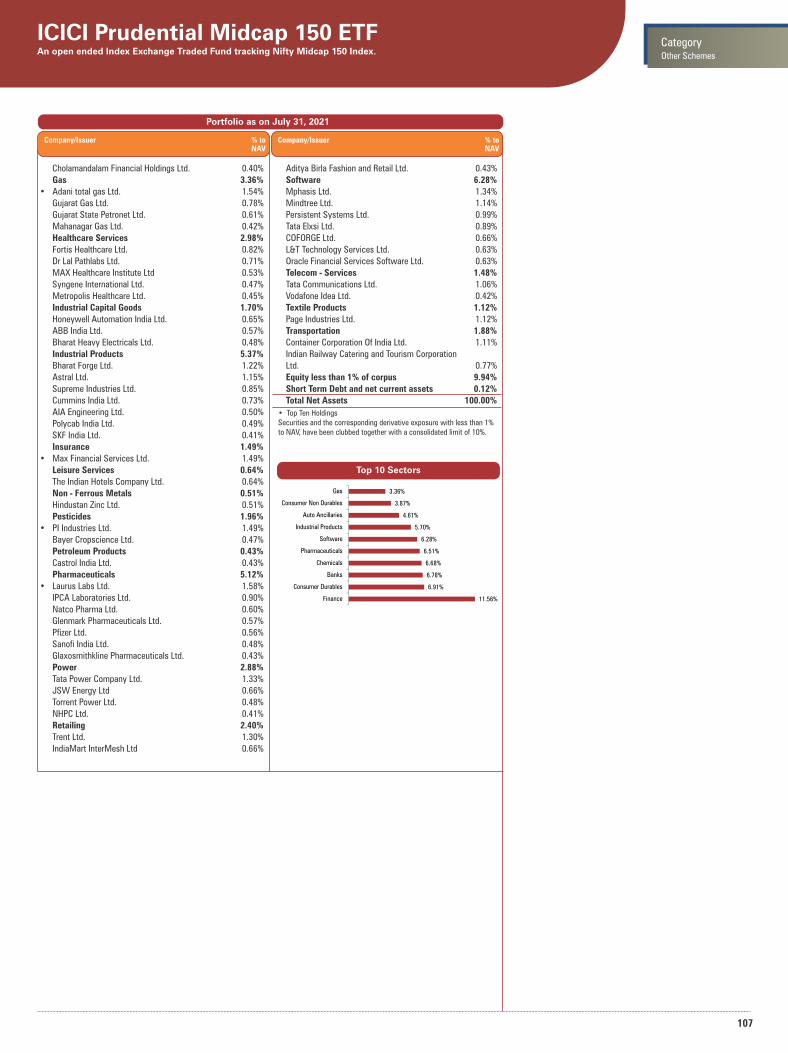
107
• Top Ten HoldingsSecurities and the corresponding derivative exposure with less than 1% to NAV, have been clubbed together with a consolidated limit of 10%.
Portfolio as on July 31, 2021
ICICI Prudential Midcap 150 ETFAn open ended Index Exchange Traded Fund tracking Nifty Midcap 150 Index. Other Schemes
Category
Cholamandalam Financial Holdings Ltd. 0.40% Gas 3.36%• Adani total gas Ltd. 1.54% Gujarat Gas Ltd. 0.78% Gujarat State Petronet Ltd. 0.61% Mahanagar Gas Ltd. 0.42% Healthcare Services 2.98% Fortis Healthcare Ltd. 0.82% Dr Lal Pathlabs Ltd. 0.71% MAX Healthcare Institute Ltd 0.53% Syngene International Ltd. 0.47% Metropolis Healthcare Ltd. 0.45% Industrial Capital Goods 1.70% Honeywell Automation India Ltd. 0.65% ABB India Ltd. 0.57% Bharat Heavy Electricals Ltd. 0.48% Industrial Products 5.37% Bharat Forge Ltd. 1.22% Astral Ltd. 1.15% Supreme Industries Ltd. 0.85% Cummins India Ltd. 0.73% AIA Engineering Ltd. 0.50% Polycab India Ltd. 0.49% SKF India Ltd. 0.41% Insurance 1.49%• Max Financial Services Ltd. 1.49% Leisure Services 0.64% The Indian Hotels Company Ltd. 0.64% Non - Ferrous Metals 0.51% Hindustan Zinc Ltd. 0.51% Pesticides 1.96%• PI Industries Ltd. 1.49% Bayer Cropscience Ltd. 0.47% Petroleum Products 0.43% Castrol India Ltd. 0.43% Pharmaceuticals 5.12%• Laurus Labs Ltd. 1.58% IPCA Laboratories Ltd. 0.90% Natco Pharma Ltd. 0.60% Glenmark Pharmaceuticals Ltd. 0.57% Pfizer Ltd. 0.56% Sanofi India Ltd. 0.48% Glaxosmithkline Pharmaceuticals Ltd. 0.43% Power 2.88% Tata Power Company Ltd. 1.33% JSW Energy Ltd 0.66% Torrent Power Ltd. 0.48% NHPC Ltd. 0.41% Retailing 2.40% Trent Ltd. 1.30% IndiaMart InterMesh Ltd 0.66%
Company/Issuer % to NAV
Top 10 Sectors
Aditya Birla Fashion and Retail Ltd. 0.43% Software 6.28% Mphasis Ltd. 1.34% Mindtree Ltd. 1.14% Persistent Systems Ltd. 0.99% Tata Elxsi Ltd. 0.89% COFORGE Ltd. 0.66% L&T Technology Services Ltd. 0.63% Oracle Financial Services Software Ltd. 0.63% Telecom - Services 1.48% Tata Communications Ltd. 1.06% Vodafone Idea Ltd. 0.42% Textile Products 1.12% Page Industries Ltd. 1.12% Transportation 1.88% Container Corporation Of India Ltd. 1.11% Indian Railway Catering and Tourism Corporation Ltd. 0.77% Equity less than 1% of corpus 9.94% Short Term Debt and net current assets 0.12% Total Net Assets 100.00%
Company/Issuer % to NAV
11.56%
6.91%
6.78%
6.68%
6.51%
6.28%
5.70%
4.61%
3.87%
3.36%
Finance
Consumer Durables
Banks
Chemicals
Pharmaceuticals
Software
Industrial Products
Auto Ancillaries
Consumer Non Durables
Gas
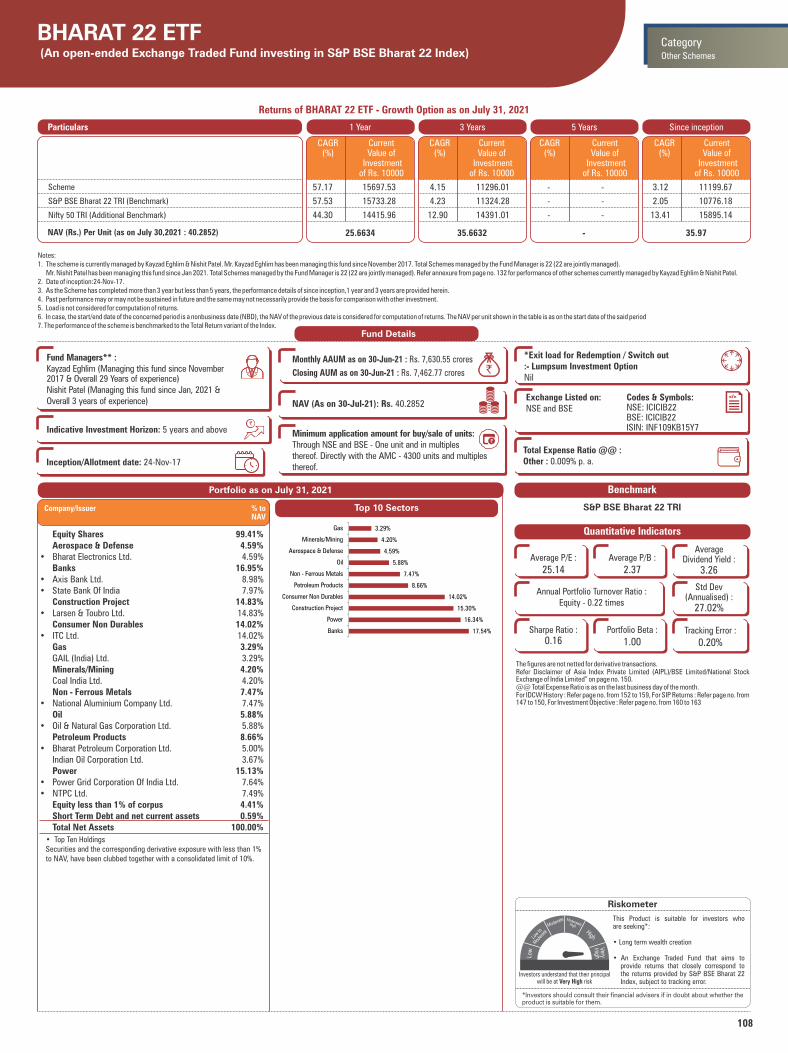
108
Returns of BHARAT 22 ETF - Growth Option as on July 31, 2021
Notes:1. The scheme is currently managed by Kayzad Eghlim & Nishit Patel. Mr. Kayzad Eghlim has been managing this fund since November 2017. Total Schemes managed by the Fund Manager is 22 (22 are jointly managed). Mr. Nishit Patel has been managing this fund since Jan 2021. Total Schemes managed by the Fund Manager is 22 (22 are jointly managed). Refer annexure from page no. 132 for performance of other schemes currently managed by Kayzad Eghlim & Nishit Patel.2. Date of inception:24-Nov-17.3. As the Scheme has completed more than 3 year but less than 5 years, the performance details of since inception,1 year and 3 years are provided herein.4. Past performance may or may not be sustained in future and the same may not necessarily provide the basis for comparison with other investment.5. Load is not considered for computation of returns.6. In case, the start/end date of the concerned period is a nonbusiness date (NBD), the NAV of the previous date is considered for computation of returns. The NAV per unit shown in the table is as on the start date of the said period7. The performance of the scheme is benchmarked to the Total Return variant of the Index.
Riskometer
This Product is suitable for investors who are seeking*:
• Long term wealth creation
• An Exchange Traded Fund that aims to provide returns that closely correspond to the returns provided by S&P BSE Bharat 22 Index, subject to tracking error.
*Investors should consult their financial advisers if in doubt about whether theproduct is suitable for them.
BHARAT 22 ETF (An open-ended Exchange Traded Fund investing in S&P BSE Bharat 22 Index)
1 Year 3 Years 5 Years Since inceptionParticulars
25.6634 35.6632
CAGR (%)
Current Value of
Investment of Rs. 10000
CAGR (%)
Current Value of
Investment of Rs. 10000
CAGR (%)
Current Value of
Investment of Rs. 10000
-
CAGR (%)
Current Value of
Investment of Rs. 10000
35.97
Scheme
S&P BSE Bharat 22 TRI (Benchmark)
Nifty 50 TRI (Additional Benchmark)
NAV (Rs.) Per Unit (as on July 30,2021 : 40.2852)
57.17 15697.53 4.15 11296.01 - - 3.12 11199.67
57.53 15733.28 4.23 11324.28 - - 2.05 10776.18
44.30 14415.96 12.90 14391.01 - - 13.41 15895.14
Quantitative Indicators
Benchmark
S&P BSE Bharat 22 TRI
Other Schemes
Category
• Top Ten HoldingsSecurities and the corresponding derivative exposure with less than 1% to NAV, have been clubbed together with a consolidated limit of 10%.
Equity Shares 99.41% Aerospace & Defense 4.59%• Bharat Electronics Ltd. 4.59% Banks 16.95%• Axis Bank Ltd. 8.98%• State Bank Of India 7.97% Construction Project 14.83%• Larsen & Toubro Ltd. 14.83% Consumer Non Durables 14.02%• ITC Ltd. 14.02% Gas 3.29% GAIL (India) Ltd. 3.29% Minerals/Mining 4.20% Coal India Ltd. 4.20% Non - Ferrous Metals 7.47%• National Aluminium Company Ltd. 7.47% Oil 5.88%• Oil & Natural Gas Corporation Ltd. 5.88% Petroleum Products 8.66%• Bharat Petroleum Corporation Ltd. 5.00% Indian Oil Corporation Ltd. 3.67% Power 15.13%• Power Grid Corporation Of India Ltd. 7.64%• NTPC Ltd. 7.49% Equity less than 1% of corpus 4.41% Short Term Debt and net current assets 0.59% Total Net Assets 100.00%
Portfolio as on July 31, 2021Portfolio as on July 31, 2021
Company/Issuer % to NAV
Top 10 Sectors
Fund Details
Monthly AAUM as on 30-Jun-21 : Rs. 7,630.55 crores
Closing AUM as on 30-Jun-21 : Rs. 7,462.77 crores
NAV (As on 30-Jul-21): Rs. 40.2852
`
`̀ `̀` `
`
Fund Managers** :Kayzad Eghlim (Managing this fund since November 2017 & Overall 29 Years of experience)Nishit Patel (Managing this fund since Jan, 2021 &Overall 3 years of experience)
Indicative Investment Horizon: 5 years and above
*Exit load for Redemption / Switch out:- Lumpsum Investment OptionNil
Inception/Allotment date: 24-Nov-17
Total Expense Ratio @@ :Other : 0.009% p. a.
Minimum application amount for buy/sale of units:Through NSE and BSE - One unit and in multiples thereof. Directly with the AMC - 4300 units and multiples thereof.
Exchange Listed on:NSE and BSE
Codes & Symbols:NSE: ICICIB22BSE: ICICIB22ISIN: INF109KB15Y7
Average P/E :
25.14Average P/B :
2.37
Average Dividend Yield :
3.26
Sharpe Ratio : 0.16
Portfolio Beta :
1.00Tracking Error :
0.20%
Annual Portfolio Turnover Ratio : Equity - 0.22 times
Std Dev (Annualised) :
27.02%
The figures are not netted for derivative transactions.Refer Disclaimer of Asia Index Private Limited (AIPL)/BSE Limited/National Stock Exchange of India Limited” on page no. 150.@@ Total Expense Ratio is as on the last business day of the month.For IDCW History : Refer page no. from 152 to 159, For SIP Returns : Refer page no. from 147 to 150, For Investment Objective : Refer page no. from 160 to 163
Investors understand that their principal will be at Very High risk
17.54%
16.34%
15.30%
14.02%
8.66%
7.47%
5.88%
4.59%
4.20%
3.29%
Banks
Power
Construction Project
Consumer Non Durables
Petroleum Products
Non - Ferrous Metals
Oil
Aerospace & Defense
Minerals/Mining
Gas
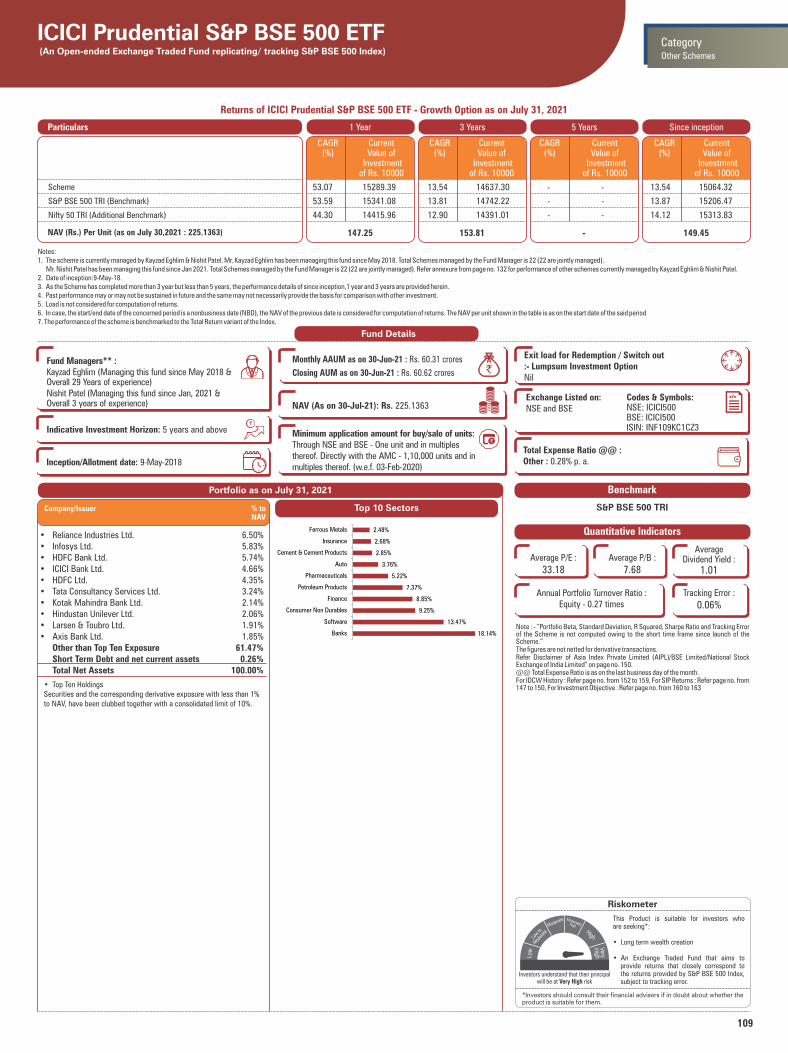
109
Notes:1. The scheme is currently managed by Kayzad Eghlim & Nishit Patel. Mr. Kayzad Eghlim has been managing this fund since May 2018. Total Schemes managed by the Fund Manager is 22 (22 are jointly managed). Mr. Nishit Patel has been managing this fund since Jan 2021. Total Schemes managed by the Fund Manager is 22 (22 are jointly managed). Refer annexure from page no. 132 for performance of other schemes currently managed by Kayzad Eghlim & Nishit Patel.2. Date of inception:9-May-18.3. As the Scheme has completed more than 3 year but less than 5 years, the performance details of since inception,1 year and 3 years are provided herein.4. Past performance may or may not be sustained in future and the same may not necessarily provide the basis for comparison with other investment.5. Load is not considered for computation of returns.6. In case, the start/end date of the concerned period is a nonbusiness date (NBD), the NAV of the previous date is considered for computation of returns. The NAV per unit shown in the table is as on the start date of the said period7. The performance of the scheme is benchmarked to the Total Return variant of the Index.
Returns of ICICI Prudential S&P BSE 500 ETF - Growth Option as on July 31, 2021
Riskometer
This Product is suitable for investors who are seeking*:
• Long term wealth creation
• An Exchange Traded Fund that aims to provide returns that closely correspond to the returns provided by S&P BSE 500 Index, subject to tracking error.
*Investors should consult their financial advisers if in doubt about whether theproduct is suitable for them.
ICICI Prudential S&P BSE 500 ETF (An Open-ended Exchange Traded Fund replicating/ tracking S&P BSE 500 Index)
Note : - “Portfolio Beta, Standard Deviation, R Squared, Sharpe Ratio and Tracking Error of the Scheme is not computed owing to the short time frame since launch of the Scheme.”The figures are not netted for derivative transactions.Refer Disclaimer of Asia Index Private Limited (AIPL)/BSE Limited/National Stock Exchange of India Limited” on page no. 150.@@ Total Expense Ratio is as on the last business day of the month.For IDCW History : Refer page no. from 152 to 159, For SIP Returns : Refer page no. from 147 to 150, For Investment Objective : Refer page no. from 160 to 163
1 Year 3 Years 5 Years Since inceptionParticulars
147.25 153.81
CAGR (%)
Current Value of
Investment of Rs. 10000
CAGR (%)
Current Value of
Investment of Rs. 10000
CAGR (%)
Current Value of
Investment of Rs. 10000
-
CAGR (%)
Current Value of
Investment of Rs. 10000
149.45
Scheme
S&P BSE 500 TRI (Benchmark)
Nifty 50 TRI (Additional Benchmark)
NAV (Rs.) Per Unit (as on July 30,2021 : 225.1363)
53.07 15289.39 13.54 14637.30 - - 13.54 15064.32
53.59 15341.08 13.81 14742.22 - - 13.87 15206.47
44.30 14415.96 12.90 14391.01 - - 14.12 15313.83
Quantitative Indicators
Benchmark
S&P BSE 500 TRI
Other Schemes
Category
• Top Ten HoldingsSecurities and the corresponding derivative exposure with less than 1% to NAV, have been clubbed together with a consolidated limit of 10%.
• Reliance Industries Ltd. 6.50%• Infosys Ltd. 5.83%• HDFC Bank Ltd. 5.74%• ICICI Bank Ltd. 4.66%• HDFC Ltd. 4.35%• Tata Consultancy Services Ltd. 3.24%• Kotak Mahindra Bank Ltd. 2.14%• Hindustan Unilever Ltd. 2.06%• Larsen & Toubro Ltd. 1.91%• Axis Bank Ltd. 1.85% Other than Top Ten Exposure 61.47% Short Term Debt and net current assets 0.26% Total Net Assets 100.00%
Portfolio as on July 31, 2021
Company/Issuer % to NAV
Top 10 Sectors
Fund Details
Monthly AAUM as on 30-Jun-21 : Rs. 60.31 crores
Closing AUM as on 30-Jun-21 : Rs. 60.62 crores
NAV (As on 30-Jul-21): Rs. 225.1363
`
`̀ `̀` `
`
Fund Managers** :Kayzad Eghlim (Managing this fund since May 2018 & Overall 29 Years of experience)Nishit Patel (Managing this fund since Jan, 2021 & Overall 3 years of experience)
Indicative Investment Horizon: 5 years and above
Exit load for Redemption / Switch out:- Lumpsum Investment OptionNil
Inception/Allotment date: 9-May-2018
Total Expense Ratio @@ :Other : 0.28% p. a.
Minimum application amount for buy/sale of units:Through NSE and BSE - One unit and in multiples thereof. Directly with the AMC - 1,10,000 units and in multiples thereof. (w.e.f. 03-Feb-2020)
Exchange Listed on:NSE and BSE
Codes & Symbols:NSE: ICICI500BSE: ICICI500ISIN: INF109KC1CZ3
Average P/E :
33.18Average P/B :
7.68
Average Dividend Yield :
1.01
Annual Portfolio Turnover Ratio : Equity - 0.27 times
Tracking Error :
0.06%
Investors understand that their principal will be at Very High risk
18.14%
13.47%
9.25%
8.85%
7.37%
5.22%
3.76%
2.85%
2.68%
2.48%
Banks
Software
Consumer Non Durables
Finance
Petroleum Products
Pharmaceuticals
Auto
Cement & Cement Products
Insurance
Ferrous Metals
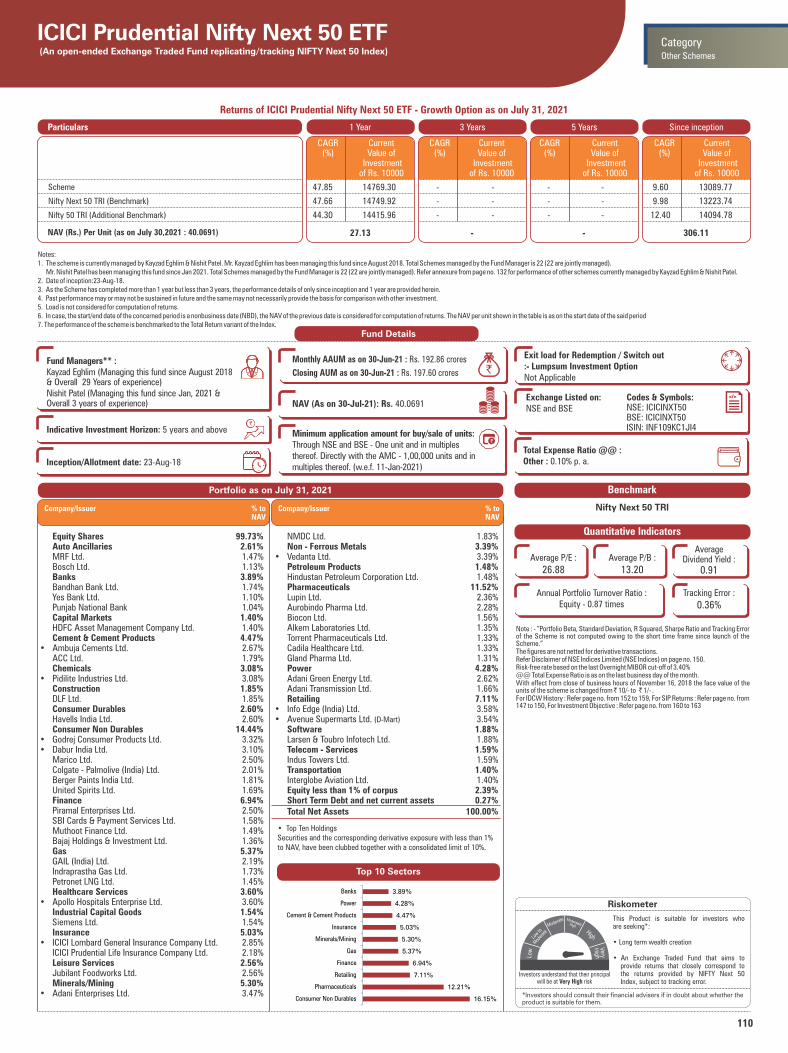
110
Notes:1. The scheme is currently managed by Kayzad Eghlim & Nishit Patel. Mr. Kayzad Eghlim has been managing this fund since August 2018. Total Schemes managed by the Fund Manager is 22 (22 are jointly managed). Mr. Nishit Patel has been managing this fund since Jan 2021. Total Schemes managed by the Fund Manager is 22 (22 are jointly managed). Refer annexure from page no. 132 for performance of other schemes currently managed by Kayzad Eghlim & Nishit Patel.2. Date of inception:23-Aug-18.3. As the Scheme has completed more than 1 year but less than 3 years, the performance details of only since inception and 1 year are provided herein.4. Past performance may or may not be sustained in future and the same may not necessarily provide the basis for comparison with other investment.5. Load is not considered for computation of returns.6. In case, the start/end date of the concerned period is a nonbusiness date (NBD), the NAV of the previous date is considered for computation of returns. The NAV per unit shown in the table is as on the start date of the said period7. The performance of the scheme is benchmarked to the Total Return variant of the Index.
Returns of ICICI Prudential Nifty Next 50 ETF - Growth Option as on July 31, 2021
Riskometer
This Product is suitable for investors who are seeking*:
• Long term wealth creation
• An Exchange Traded Fund that aims to provide returns that closely correspond to the returns provided by NIFTY Next 50 Index, subject to tracking error.
*Investors should consult their financial advisers if in doubt about whether theproduct is suitable for them.
ICICI Prudential Nifty Next 50 ETF (An open-ended Exchange Traded Fund replicating/tracking NIFTY Next 50 Index)
Note : - “Portfolio Beta, Standard Deviation, R Squared, Sharpe Ratio and Tracking Error of the Scheme is not computed owing to the short time frame since launch of the Scheme.”The figures are not netted for derivative transactions.Refer Disclaimer of NSE Indices Limited (NSE Indices) on page no. 150.Risk-free rate based on the last Overnight MIBOR cut-off of 3.40%@@ Total Expense Ratio is as on the last business day of the month.With effect from close of business hours of November 16, 2018 the face value of the units of the scheme is changed from ̀ 10/- to ̀ 1/- . For IDCW History : Refer page no. from 152 to 159, For SIP Returns : Refer page no. from 147 to 150, For Investment Objective : Refer page no. from 160 to 163
1 Year 3 Years 5 Years Since inceptionParticulars
27.13 -
CAGR (%)
Current Value of
Investment of Rs. 10000
CAGR (%)
Current Value of
Investment of Rs. 10000
CAGR (%)
Current Value of
Investment of Rs. 10000
-
CAGR (%)
Current Value of
Investment of Rs. 10000
306.11
Scheme
Nifty Next 50 TRI (Benchmark)
Nifty 50 TRI (Additional Benchmark)
NAV (Rs.) Per Unit (as on July 30,2021 : 40.0691)
47.85 14769.30 - - - - 9.60 13089.77
47.66 14749.92 - - - - 9.98 13223.74
44.30 14415.96 - - - - 12.40 14094.78
Quantitative Indicators
Benchmark
Nifty Next 50 TRI
Other Schemes
Category
Equity Shares 99.73% Auto Ancillaries 2.61% MRF Ltd. 1.47% Bosch Ltd. 1.13% Banks 3.89% Bandhan Bank Ltd. 1.74% Yes Bank Ltd. 1.10% Punjab National Bank 1.04% Capital Markets 1.40% HDFC Asset Management Company Ltd. 1.40% Cement & Cement Products 4.47%• Ambuja Cements Ltd. 2.67% ACC Ltd. 1.79% Chemicals 3.08%• Pidilite Industries Ltd. 3.08% Construction 1.85% DLF Ltd. 1.85% Consumer Durables 2.60% Havells India Ltd. 2.60% Consumer Non Durables 14.44%• Godrej Consumer Products Ltd. 3.32%• Dabur India Ltd. 3.10% Marico Ltd. 2.50% Colgate - Palmolive (India) Ltd. 2.01% Berger Paints India Ltd. 1.81% United Spirits Ltd. 1.69% Finance 6.94% Piramal Enterprises Ltd. 2.50% SBI Cards & Payment Services Ltd. 1.58% Muthoot Finance Ltd. 1.49% Bajaj Holdings & Investment Ltd. 1.36% Gas 5.37% GAIL (India) Ltd. 2.19% Indraprastha Gas Ltd. 1.73% Petronet LNG Ltd. 1.45% Healthcare Services 3.60%• Apollo Hospitals Enterprise Ltd. 3.60% Industrial Capital Goods 1.54% Siemens Ltd. 1.54% Insurance 5.03%• ICICI Lombard General Insurance Company Ltd. 2.85% ICICI Prudential Life Insurance Company Ltd. 2.18% Leisure Services 2.56% Jubilant Foodworks Ltd. 2.56% Minerals/Mining 5.30%• Adani Enterprises Ltd. 3.47%
NMDC Ltd. 1.83% Non - Ferrous Metals 3.39%• Vedanta Ltd. 3.39% Petroleum Products 1.48% Hindustan Petroleum Corporation Ltd. 1.48% Pharmaceuticals 11.52% Lupin Ltd. 2.36% Aurobindo Pharma Ltd. 2.28% Biocon Ltd. 1.56% Alkem Laboratories Ltd. 1.35% Torrent Pharmaceuticals Ltd. 1.33% Cadila Healthcare Ltd. 1.33% Gland Pharma Ltd. 1.31% Power 4.28% Adani Green Energy Ltd. 2.62% Adani Transmission Ltd. 1.66% Retailing 7.11%• Info Edge (India) Ltd. 3.58%• Avenue Supermarts Ltd. (D-Mart) 3.54% Software 1.88% Larsen & Toubro Infotech Ltd. 1.88% Telecom - Services 1.59% Indus Towers Ltd. 1.59% Transportation 1.40% Interglobe Aviation Ltd. 1.40% Equity less than 1% of corpus 2.39% Short Term Debt and net current assets 0.27% Total Net Assets 100.00%
Portfolio as on July 31, 2021
Company/Issuer % to NAV
Company/Issuer % to NAV
• Top Ten HoldingsSecurities and the corresponding derivative exposure with less than 1% to NAV, have been clubbed together with a consolidated limit of 10%.
Top 10 Sectors
Fund Details
Monthly AAUM as on 30-Jun-21 : Rs. 192.86 crores
Closing AUM as on 30-Jun-21 : Rs. 197.60 crores
NAV (As on 30-Jul-21): Rs. 40.0691
`
`̀ `̀` `
`
Fund Managers** :Kayzad Eghlim (Managing this fund since August 2018& Overall 29 Years of experience)Nishit Patel (Managing this fund since Jan, 2021 & Overall 3 years of experience)
Indicative Investment Horizon: 5 years and above
Exit load for Redemption / Switch out:- Lumpsum Investment OptionNot Applicable
Inception/Allotment date: 23-Aug-18
Total Expense Ratio @@ :Other : 0.10% p. a.
Minimum application amount for buy/sale of units:Through NSE and BSE - One unit and in multiples thereof. Directly with the AMC - 1,00,000 units and in multiples thereof. (w.e.f. 11-Jan-2021)
Exchange Listed on:NSE and BSE
Codes & Symbols:NSE: ICICINXT50BSE: ICICINXT50ISIN: INF109KC1JI4
Average P/E :
26.88Average P/B :
13.20
Average Dividend Yield :
0.91
Annual Portfolio Turnover Ratio : Equity - 0.87 times
Tracking Error :
0.36%
Investors understand that their principal will be at Very High risk
16.15%
12.21%
7.11%
6.94%
5.37%
5.30%
5.03%
4.47%
4.28%
3.89%
Consumer Non Durables
Pharmaceuticals
Retailing
Finance
Gas
Minerals/Mining
Insurance
Cement & Cement Products
Power
Banks

111
Riskometer
This Product is suitable for investors who are seeking*:
• Long term wealth creation
• An exchange traded fund that aims to provide returns that closely correspond to the returns provided by Nifty Bank Index, subject to tracking error.
*Investors should consult their financial advisers if in doubt about whether theproduct is suitable for them.
ICICI Prudential Bank ETF (An open-ended Exchange Traded Fund tracking Nifty Bank Index)
@@ Total Expense Ratio is as on the last business day of the month.Refer Disclaimer of Asia Index Private Limited (AIPL)/BSE Limited/National Stock Exchange of India Limited” on page no. 150.Tracking error of the Scheme is not computed owing to the short time frame since launch of the Scheme.For IDCW History : Refer page no. from 152 to 159, For SIP Returns : Refer page no. from 147 to 150, For Investment Objective : Refer page no. from 160 to 163
Quantitative Indicators
Benchmark
Nifty Bank Index
Other Schemes
Category
Portfolio as on July 31, 2021
Equity Shares 99.82%
Banks 99.03%
• HDFC Bank Ltd. 27.53%
• ICICI Bank Ltd. 22.86%
• State Bank Of India 12.40%
• Kotak Mahindra Bank Ltd. 11.74%
• Axis Bank Ltd. 11.46%
• IndusInd Bank Ltd. 5.19%
• AU Small Finance Bank Ltd. 2.34%
• Bandhan Bank Ltd. 1.73%
• The Federal Bank Ltd. 1.53%
• IDFC First Bank Ltd. 1.21%
Punjab National Bank 1.03%
Equity less than 1% of corpus 0.79%
Short Term Debt and net current assets 0.18%
Total Net Assets 100.00%
Company/Issuer % to NAV
• Top Ten HoldingsSecurities and the corresponding derivative exposure with less than 1% to NAV, have been clubbed together with a consolidated limit of 10%.
Fund Details
Monthly AAUM as on 30-Jun-21 : Rs. 2,487.08 crores
Closing AUM as on 30-Jun-21 : Rs. 2,445.72 crores
NAV (As on 30-Jul-21): Rs. 344.6434
`
`̀ `̀` `
`
Fund Managers** :Mr. Kayzad Eghlim (Managing this fund since July 2019 & Overall 29 Years of experience) Nishit Patel (Managing this fund since Jan, 2021 & Overall 3 years of experience)
Indicative Investment Horizon: 5 years and above
Exit load for Redemption / Switch out:- Lumpsum Investment OptionNot Applicable
Inception/Allotment date: 10-Jul-19
Total Expense Ratio @@ :Other : 0.15% p. a.
Minimum application amount for buy/sale of units:Through NSE and BSE - One unit and in multiples thereof.Directly with the AMC - Units are to be purchased in creation unit size i.e., 5,000 units and in multiples thereof. (w.e.f. 03-Feb-2020)
Exchange Listed on:NSE and BSE
Codes & Symbols:NSE: ICICIBANKNBSE: ICICIBANKNISIN: INF109KC1E27
Average P/E :
28.29Average P/B :
3.13
Average Dividend Yield :
0.36
Notes:1. The scheme is currently managed by Kayzad Eghlim & Nishit Patel. Mr. Kayzad Eghlim has been managing this fund since July 2019. Total Schemes managed by the Fund Manager is 22 (22 are jointly managed). Mr. Nishit Patel has been managing this fund since Jan 2021. Total Schemes managed by the Fund Manager is 22 (22 are jointly managed). Refer annexure from page no. 132 for performance of other schemes currently managed by Kayzad Eghlim & Nishit Patel.2. Date of inception:10-Jul-19.3. As the Scheme has completed more than 1 year but less than 3 years, the performance details of only since inception and 1 year are provided herein.4. Past performance may or may not be sustained in future and the same may not necessarily provide the basis for comparison with other investment.5. Load is not considered for computation of returns.6. In case, the start/end date of the concerned period is a nonbusiness date (NBD), the NAV of the previous date is considered for computation of returns. The NAV per unit shown in the table is as on the start date of the said period7. The performance of the scheme is benchmarked to the Total Return variant of the Index.
Returns of ICICI Prudential Bank ETF - Growth Option as on July 31, 2021
1 Year 3 Years 5 Years Since inceptionParticulars
215.15 -
CAGR (%)
Current Value of
Investment of Rs. 10000
CAGR (%)
Current Value of
Investment of Rs. 10000
CAGR (%)
Current Value of
Investment of Rs. 10000
-
CAGR (%)
Current Value of
Investment of Rs. 10000
305.49
Scheme
Nifty Bank Index (Benchmark)
Nifty 50 TRI (Additional Benchmark)
NAV (Rs.) Per Unit (as on July 30,2021 : 344.6434)
60.39 16018.75 - - - - 6.04 11281.66
60.54 16033.28 - - - - 6.53 11389.46
44.30 14415.96 - - - - 18.03 14065.26
Annual Portfolio Turnover Ratio : Equity - 0.70 times
Tracking Error :
0.09%
Investors understand that their principal will be at Very High risk
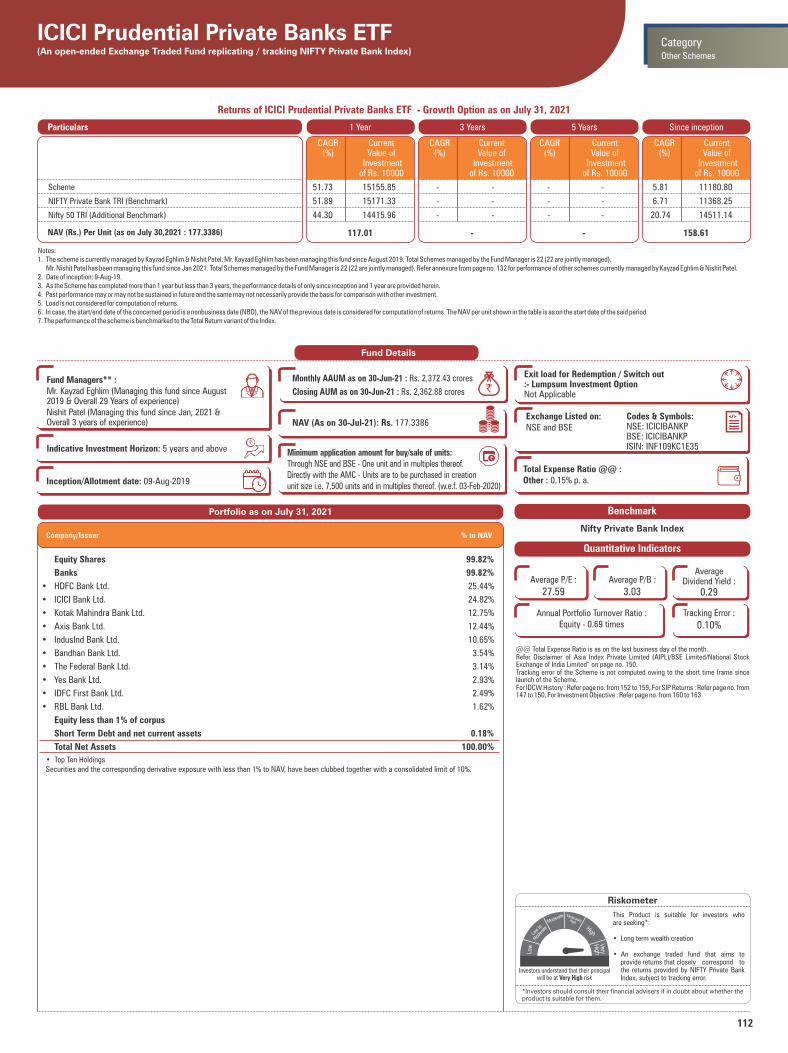
112
Riskometer
This Product is suitable for investors who are seeking*:
• Long term wealth creation
• An exchange traded fund that aims to provide returns that closely correspond to the returns provided by NIFTY Private Bank Index, subject to tracking error.
*Investors should consult their financial advisers if in doubt about whether theproduct is suitable for them.
ICICI Prudential Private Banks ETF (An open-ended Exchange Traded Fund replicating / tracking NIFTY Private Bank Index)
@@ Total Expense Ratio is as on the last business day of the month.Refer Disclaimer of Asia Index Private Limited (AIPL)/BSE Limited/National Stock Exchange of India Limited” on page no. 150.Tracking error of the Scheme is not computed owing to the short time frame since launch of the Scheme.For IDCW History : Refer page no. from 152 to 159, For SIP Returns : Refer page no. from 147 to 150, For Investment Objective : Refer page no. from 160 to 163
Quantitative Indicators
Benchmark
Nifty Private Bank Index
Other Schemes
Category
Portfolio as on July 31, 2021
Equity Shares 99.82%
Banks 99.82%
• HDFC Bank Ltd. 25.44%
• ICICI Bank Ltd. 24.82%
• Kotak Mahindra Bank Ltd. 12.75%
• Axis Bank Ltd. 12.44%
• IndusInd Bank Ltd. 10.65%
• Bandhan Bank Ltd. 3.54%
• The Federal Bank Ltd. 3.14%
• Yes Bank Ltd. 2.93%
• IDFC First Bank Ltd. 2.49%
• RBL Bank Ltd. 1.62%
Equity less than 1% of corpus
Short Term Debt and net current assets 0.18%
Total Net Assets 100.00%
Company/Issuer % to NAV
• Top Ten HoldingsSecurities and the corresponding derivative exposure with less than 1% to NAV, have been clubbed together with a consolidated limit of 10%.
Fund Details
Monthly AAUM as on 30-Jun-21 : Rs. 2,372.43 crores
Closing AUM as on 30-Jun-21 : Rs. 2,362.88 crores
NAV (As on 30-Jul-21): Rs. 177.3386
`
`̀ `̀` `
`
Fund Managers** :Mr. Kayzad Eghlim (Managing this fund since August 2019 & Overall 29 Years of experience) Nishit Patel (Managing this fund since Jan, 2021 & Overall 3 years of experience)
Indicative Investment Horizon: 5 years and above
Exit load for Redemption / Switch out:- Lumpsum Investment OptionNot Applicable
Inception/Allotment date: 09-Aug-2019
Total Expense Ratio @@ :Other : 0.15% p. a.
Minimum application amount for buy/sale of units:Through NSE and BSE - One unit and in multiples thereof.Directly with the AMC - Units are to be purchased in creation unit size i.e. 7,500 units and in multiples thereof. (w.e.f. 03-Feb-2020)
Exchange Listed on:NSE and BSE
Codes & Symbols:NSE: ICICIBANKPBSE: ICICIBANKPISIN: INF109KC1E35
Average P/E :
27.59Average P/B :
3.03
Average Dividend Yield :
0.29
Notes:1. The scheme is currently managed by Kayzad Eghlim & Nishit Patel. Mr. Kayzad Eghlim has been managing this fund since August 2019. Total Schemes managed by the Fund Manager is 22 (22 are jointly managed). Mr. Nishit Patel has been managing this fund since Jan 2021. Total Schemes managed by the Fund Manager is 22 (22 are jointly managed). Refer annexure from page no. 132 for performance of other schemes currently managed by Kayzad Eghlim & Nishit Patel.2. Date of inception: 9-Aug-19.3. As the Scheme has completed more than 1 year but less than 3 years, the performance details of only since inception and 1 year are provided herein.4. Past performance may or may not be sustained in future and the same may not necessarily provide the basis for comparison with other investment.5. Load is not considered for computation of returns.6. In case, the start/end date of the concerned period is a nonbusiness date (NBD), the NAV of the previous date is considered for computation of returns. The NAV per unit shown in the table is as on the start date of the said period7. The performance of the scheme is benchmarked to the Total Return variant of the Index.
Returns of ICICI Prudential Private Banks ETF - Growth Option as on July 31, 2021
1 Year 3 Years 5 Years Since inceptionParticulars
117.01 -
CAGR (%)
Current Value of
Investment of Rs. 10000
CAGR (%)
Current Value of
Investment of Rs. 10000
CAGR (%)
Current Value of
Investment of Rs. 10000
-
CAGR (%)
Current Value of
Investment of Rs. 10000
158.61
Scheme
NIFTY Private Bank TRI (Benchmark)
Nifty 50 TRI (Additional Benchmark)
NAV (Rs.) Per Unit (as on July 30,2021 : 177.3386)
51.73 15155.85 - - - - 5.81 11180.80
51.89 15171.33 - - - - 6.71 11368.25
44.30 14415.96 - - - - 20.74 14511.14
Annual Portfolio Turnover Ratio : Equity - 0.69 times
Tracking Error :
0.10%
Investors understand that their principal will be at Very High risk
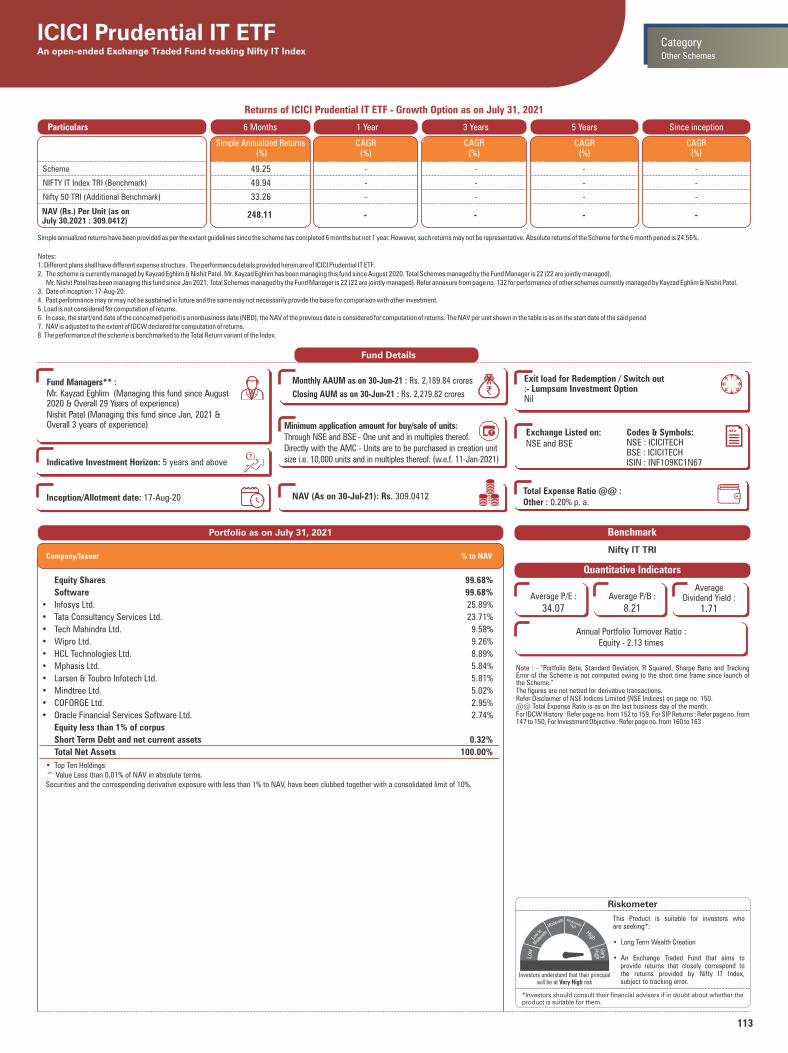
113
ICICI Prudential IT ETFAn open-ended Exchange Traded Fund tracking Nifty IT Index
Note : - “Portfolio Beta, Standard Deviation, R Squared, Sharpe Ratio and Tracking Error of the Scheme is not computed owing to the short time frame since launch of the Scheme.”The figures are not netted for derivative transactions.Refer Disclaimer of NSE Indices Limited (NSE Indices) on page no. 150.@@ Total Expense Ratio is as on the last business day of the month.For IDCW History : Refer page no. from 152 to 159, For SIP Returns : Refer page no. from 147 to 150, For Investment Objective : Refer page no. from 160 to 163
Quantitative Indicators
Benchmark
Nifty IT TRI
Other Schemes
Category
Portfolio as on July 31, 2021
Fund Details
Fund Managers** :Mr. Kayzad Eghlim (Managing this fund since August 2020 & Overall 29 Years of experience)Nishit Patel (Managing this fund since Jan, 2021 & Overall 3 years of experience)
Indicative Investment Horizon: 5 years and above
Inception/Allotment date: 17-Aug-20
Monthly AAUM as on 30-Jun-21 : Rs. 2,189.84 crores
Closing AUM as on 30-Jun-21 : Rs. 2,279.82 crores `Exit load for Redemption / Switch out:- Lumpsum Investment OptionNil
Total Expense Ratio @@ :Other : 0.20% p. a.
Exchange Listed on:NSE and BSE
Codes & Symbols:NSE : ICICITECHBSE : ICICITECHISIN : INF109KC1N67
Average P/E :
34.07Average P/B :
8.21
Average Dividend Yield :
1.71
Annual Portfolio Turnover Ratio : Equity - 2.13 times
NAV (As on 30-Jul-21): Rs. 309.0412 `̀ `̀` `
`
Minimum application amount for buy/sale of units:Through NSE and BSE - One unit and in multiples thereof.Directly with the AMC - Units are to be purchased in creation unit size i.e. 10,000 units and in multiples thereof. (w.e.f. 11-Jan-2021)
Riskometer
This Product is suitable for investors who are seeking*:
• Long Term Wealth Creation
• An Exchange Traded Fund that aims to provide returns that closely correspond to the returns provided by Nifty IT Index, subject to tracking error.
*Investors should consult their financial advisers if in doubt about whether theproduct is suitable for them.
Equity Shares 99.68%
Software 99.68%
• Infosys Ltd. 25.89%
• Tata Consultancy Services Ltd. 23.71%
• Tech Mahindra Ltd. 9.58%
• Wipro Ltd. 9.26%
• HCL Technologies Ltd. 8.89%
• Mphasis Ltd. 5.84%
• Larsen & Toubro Infotech Ltd. 5.81%
• Mindtree Ltd. 5.02%
• COFORGE Ltd. 2.95%
• Oracle Financial Services Software Ltd. 2.74%
Equity less than 1% of corpus
Short Term Debt and net current assets 0.32%
Total Net Assets 100.00%
Company/Issuer % to NAV
• Top Ten Holdings^ Value Less than 0.01% of NAV in absolute terms.Securities and the corresponding derivative exposure with less than 1% to NAV, have been clubbed together with a consolidated limit of 10%.
Investors understand that their principal will be at Very High risk
Notes:1. Different plans shall have different expense structure. The performance details provided herein are of ICICI Prudential IT ETF.2. The scheme is currently managed by Kayzad Eghlim & Nishit Patel. Mr. Kayzad Eghlim has been managing this fund since August 2020. Total Schemes managed by the Fund Manager is 22 (22 are jointly managed). Mr. Nishit Patel has been managing this fund since Jan 2021. Total Schemes managed by the Fund Manager is 22 (22 are jointly managed). Refer annexure from page no. 132 for performance of other schemes currently managed by Kayzad Eghlim & Nishit Patel.3. Date of inception: 17-Aug-20.4. Past performance may or may not be sustained in future and the same may not necessarily provide the basis for comparison with other investment.5. Load is not considered for computation of returns.6. In case, the start/end date of the concerned period is a nonbusiness date (NBD), the NAV of the previous date is considered for computation of returns. The NAV per unit shown in the table is as on the start date of the said period7. NAV is adjusted to the extent of IDCW declared for computation of returns.8. The performance of the scheme is benchmarked to the Total Return variant of the Index.
Returns of ICICI Prudential IT ETF - Growth Option as on July 31, 2021
1 Year 3 Years 5 Years Since inceptionParticulars
- -
CAGR (%)
CAGR (%)
CAGR (%)
- -
Scheme
NIFTY IT Index TRI (Benchmark)
Nifty 50 TRI (Additional Benchmark)
NAV (Rs.) Per Unit (as on July 30,2021 : 309.0412)
6 Months
Simple Annualized Returns (%)
49.25 - - - -
49.94 - - - -
33.26 - - - -
248.11
CAGR (%)
Simple annualized returns have been provided as per the extant guidelines since the scheme has completed 6 months but not 1 year. However, such returns may not be representative. Absolute returns of the Scheme for the 6 month period is 24.56%.
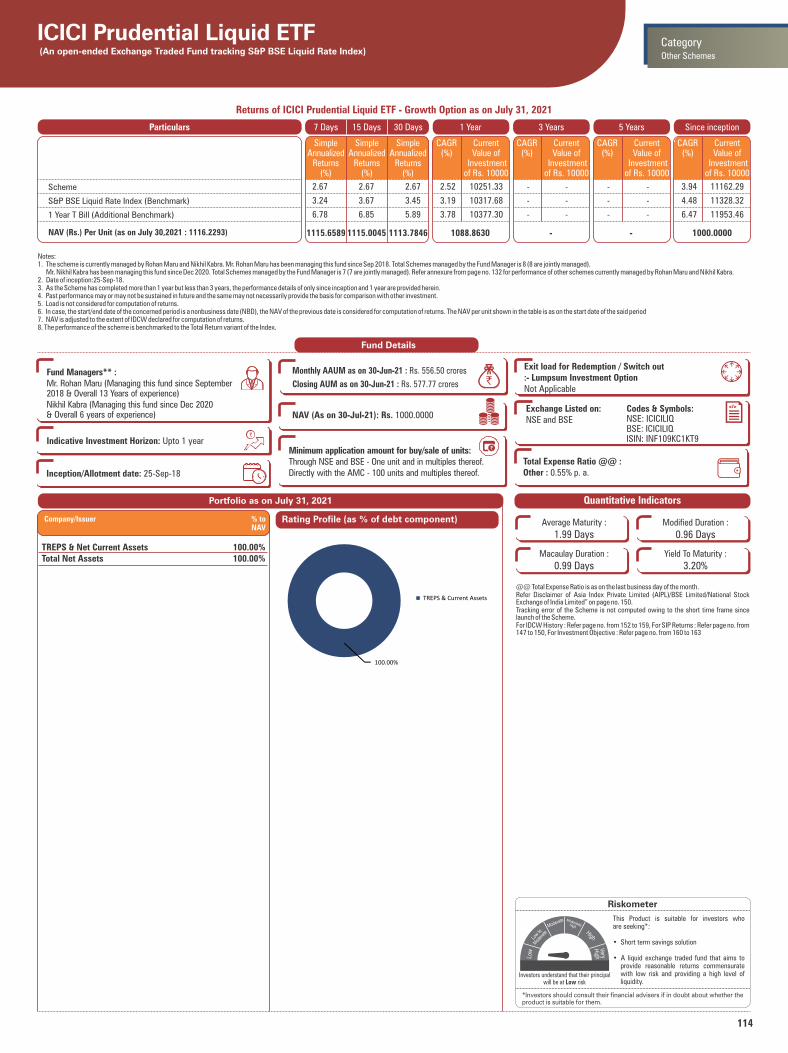
114
Notes:1. The scheme is currently managed by Rohan Maru and Nikhil Kabra. Mr. Rohan Maru has been managing this fund since Sep 2018. Total Schemes managed by the Fund Manager is 8 (8 are jointly managed). Mr. Nikhil Kabra has been managing this fund since Dec 2020. Total Schemes managed by the Fund Manager is 7 (7 are jointly managed). Refer annexure from page no. 132 for performance of other schemes currently managed by Rohan Maru and Nikhil Kabra.2. Date of inception:25-Sep-18.3. As the Scheme has completed more than 1 year but less than 3 years, the performance details of only since inception and 1 year are provided herein.4. Past performance may or may not be sustained in future and the same may not necessarily provide the basis for comparison with other investment.5. Load is not considered for computation of returns.6. In case, the start/end date of the concerned period is a nonbusiness date (NBD), the NAV of the previous date is considered for computation of returns. The NAV per unit shown in the table is as on the start date of the said period7. NAV is adjusted to the extent of IDCW declared for computation of returns.8. The performance of the scheme is benchmarked to the Total Return variant of the Index.
Returns of ICICI Prudential Liquid ETF - Growth Option as on July 31, 2021
Riskometer
This Product is suitable for investors who are seeking*:
• Short term savings solution
• A liquid exchange traded fund that aims to provide reasonable returns commensurate with low risk and providing a high level of liquidity.
*Investors should consult their financial advisers if in doubt about whether theproduct is suitable for them.
ICICI Prudential Liquid ETF (An open-ended Exchange Traded Fund tracking S&P BSE Liquid Rate Index)
@@ Total Expense Ratio is as on the last business day of the month.Refer Disclaimer of Asia Index Private Limited (AIPL)/BSE Limited/National Stock Exchange of India Limited” on page no. 150.Tracking error of the Scheme is not computed owing to the short time frame since launch of the Scheme.For IDCW History : Refer page no. from 152 to 159, For SIP Returns : Refer page no. from 147 to 150, For Investment Objective : Refer page no. from 160 to 163
Quantitative Indicators
Average Maturity :
1.99 DaysModified Duration :
0.96 Days
Macaulay Duration :
0.99 DaysYield To Maturity :
3.20%
1 Year 3 Years 5 Years Since inceptionParticulars
1088.8630 -
Scheme
S&P BSE Liquid Rate Index (Benchmark)
1 Year T Bill (Additional Benchmark)
NAV (Rs.) Per Unit (as on July 30,2021 : 1116.2293)
CAGR (%)
Current Value of
Investment of Rs. 10000
CAGR (%)
Current Value of
Investment of Rs. 10000
CAGR (%)
Current Value of
Investment of Rs. 10000
-
CAGR (%)
Current Value of
Investment of Rs. 10000
1000.0000
7 Days
1115.00451115.6589 1113.7846
15 Days 30 Days
Other Schemes
Category
Portfolio as on July 31, 2021
TREPS & Net Current Assets 100.00%Total Net Assets 100.00%
Company/Issuer % to NAV
Rating Profile (as % of debt component)
100.00%
TREPS & Current Assets
Fund Details
Monthly AAUM as on 30-Jun-21 : Rs. 556.50 crores
Closing AUM as on 30-Jun-21 : Rs. 577.77 crores
NAV (As on 30-Jul-21): Rs. 1000.0000
`
`̀ `̀` `
`
Fund Managers** :Mr. Rohan Maru (Managing this fund since September 2018 & Overall 13 Years of experience)Nikhil Kabra (Managing this fund since Dec 2020& Overall 6 years of experience)
Indicative Investment Horizon: Upto 1 year
Exit load for Redemption / Switch out:- Lumpsum Investment OptionNot Applicable
Inception/Allotment date: 25-Sep-18
Total Expense Ratio @@ :Other : 0.55% p. a.
Minimum application amount for buy/sale of units:Through NSE and BSE - One unit and in multiples thereof.Directly with the AMC - 100 units and multiples thereof.
Exchange Listed on:NSE and BSE
Codes & Symbols:NSE: ICICILIQBSE: ICICILIQISIN: INF109KC1KT9
2.67 2.67 2.67 2.52 10251.33 - - - - 3.94 11162.29
3.24 3.67 3.45 3.19 10317.68 - - - - 4.48 11328.32
6.78 6.85 5.89 3.78 10377.30 - - - - 6.47 11953.46
Investors understand that their principal will be at Low risk
SimpleAnnualized
Returns(%)
SimpleAnnualized
Returns(%)
SimpleAnnualized
Returns(%)
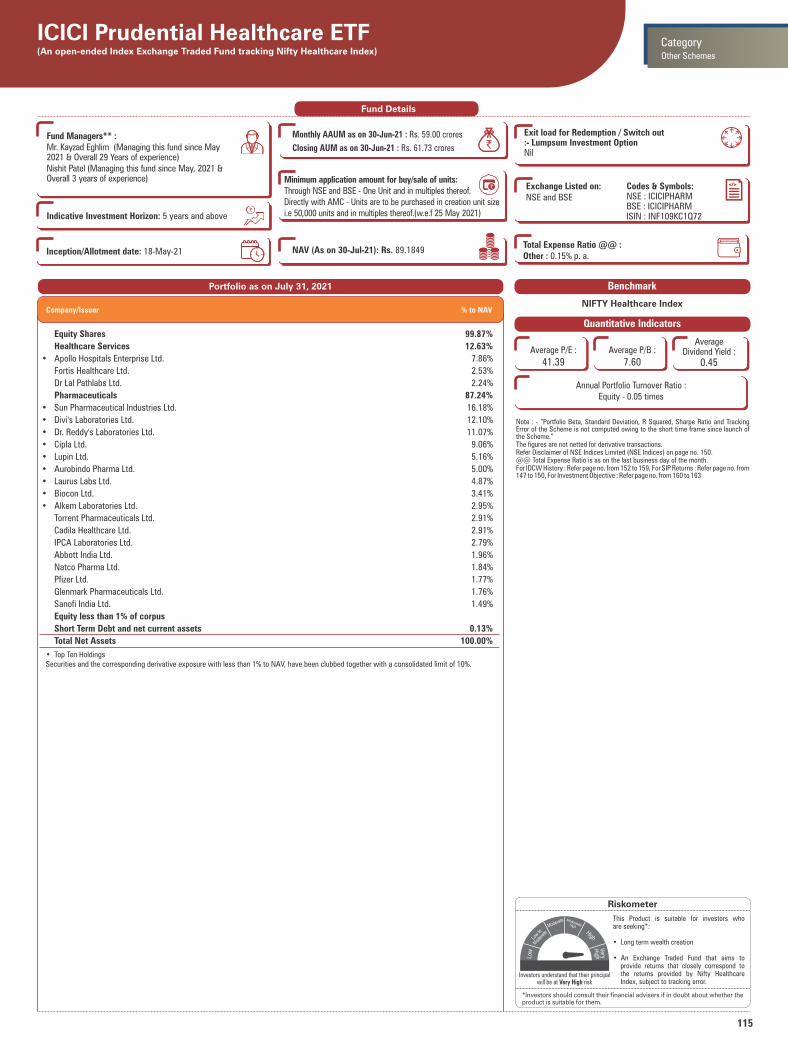
115
ICICI Prudential Healthcare ETF(An open-ended Index Exchange Traded Fund tracking Nifty Healthcare Index)
Note : - “Portfolio Beta, Standard Deviation, R Squared, Sharpe Ratio and Tracking Error of the Scheme is not computed owing to the short time frame since launch of the Scheme.”The figures are not netted for derivative transactions.Refer Disclaimer of NSE Indices Limited (NSE Indices) on page no. 150.@@ Total Expense Ratio is as on the last business day of the month.For IDCW History : Refer page no. from 152 to 159, For SIP Returns : Refer page no. from 147 to 150, For Investment Objective : Refer page no. from 160 to 163
Quantitative Indicators
Benchmark
NIFTY Healthcare Index
Other Schemes
Category
Portfolio as on July 31, 2021
Fund Details
Fund Managers** :Mr. Kayzad Eghlim (Managing this fund since May 2021 & Overall 29 Years of experience)Nishit Patel (Managing this fund since May, 2021 & Overall 3 years of experience)
Indicative Investment Horizon: 5 years and above
Inception/Allotment date: 18-May-21
Monthly AAUM as on 30-Jun-21 : Rs. 59.00 crores
Closing AUM as on 30-Jun-21 : Rs. 61.73 crores `Exit load for Redemption / Switch out:- Lumpsum Investment OptionNil
Total Expense Ratio @@ :Other : 0.15% p. a.
Exchange Listed on:NSE and BSE
Codes & Symbols:NSE : ICICIPHARMBSE : ICICIPHARMISIN : INF109KC1Q72
Average P/E :
41.39Average P/B :
7.60
Average Dividend Yield :
0.45
Annual Portfolio Turnover Ratio : Equity - 0.05 times
NAV (As on 30-Jul-21): Rs. 89.1849 `̀ `̀` `
`
Minimum application amount for buy/sale of units:Through NSE and BSE - One Unit and in multiples thereof.Directly with AMC - Units are to be purchased in creation unit size i.e 50,000 units and in multiples thereof.(w.e.f 25 May 2021)
Equity Shares 99.87%
Healthcare Services 12.63%
• Apollo Hospitals Enterprise Ltd. 7.86%
Fortis Healthcare Ltd. 2.53%
Dr Lal Pathlabs Ltd. 2.24%
Pharmaceuticals 87.24%
• Sun Pharmaceutical Industries Ltd. 16.18%
• Divi's Laboratories Ltd. 12.10%
• Dr. Reddy's Laboratories Ltd. 11.07%
• Cipla Ltd. 9.06%
• Lupin Ltd. 5.16%
• Aurobindo Pharma Ltd. 5.00%
• Laurus Labs Ltd. 4.87%
• Biocon Ltd. 3.41%
• Alkem Laboratories Ltd. 2.95%
Torrent Pharmaceuticals Ltd. 2.91%
Cadila Healthcare Ltd. 2.91%
IPCA Laboratories Ltd. 2.79%
Abbott India Ltd. 1.96%
Natco Pharma Ltd. 1.84%
Pfizer Ltd. 1.77%
Glenmark Pharmaceuticals Ltd. 1.76%
Sanofi India Ltd. 1.49%
Equity less than 1% of corpus
Short Term Debt and net current assets 0.13%
Total Net Assets 100.00%
Company/Issuer % to NAV
• Top Ten HoldingsSecurities and the corresponding derivative exposure with less than 1% to NAV, have been clubbed together with a consolidated limit of 10%.
Riskometer
This Product is suitable for investors who are seeking*:
• Long term wealth creation
• An Exchange Traded Fund that aims to provide returns that closely correspond to the returns provided by Nifty Healthcare Index, subject to tracking error.
*Investors should consult their financial advisers if in doubt about whether theproduct is suitable for them.
Investors understand that their principal will be at Very High risk
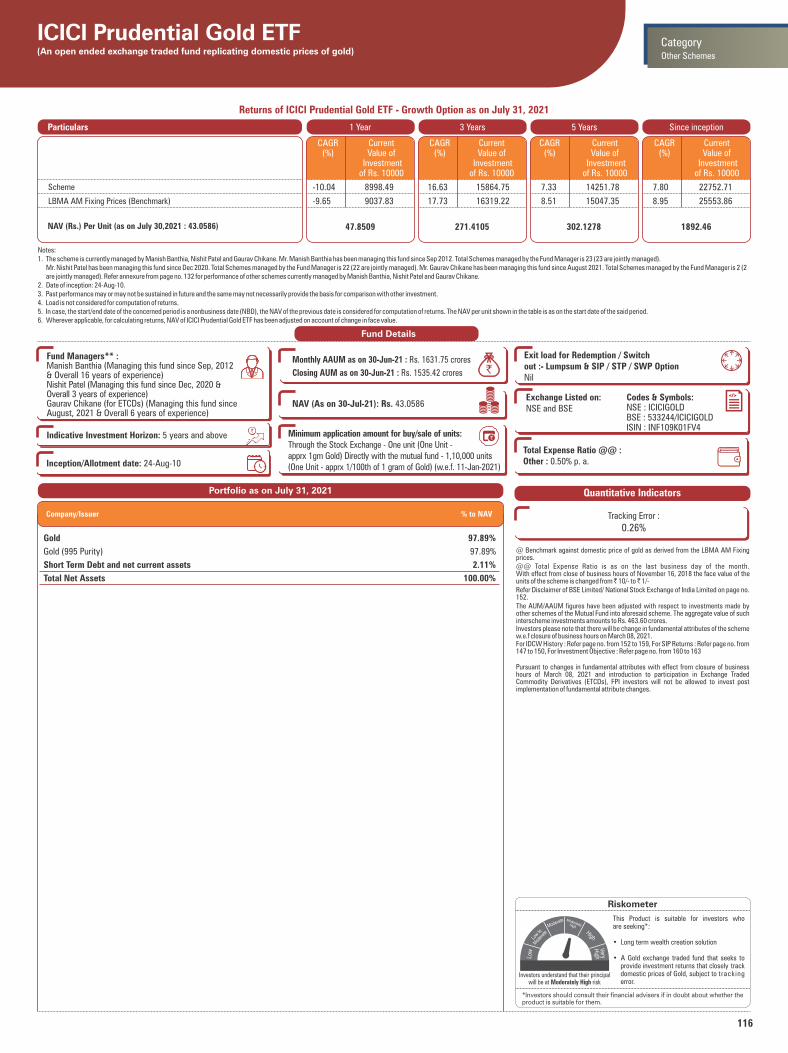
116
Notes:1. The scheme is currently managed by Manish Banthia, Nishit Patel and Gaurav Chikane. Mr. Manish Banthia has been managing this fund since Sep 2012. Total Schemes managed by the Fund Manager is 23 (23 are jointly managed). Mr. Nishit Patel has been managing this fund since Dec 2020. Total Schemes managed by the Fund Manager is 22 (22 are jointly managed). Mr. Gaurav Chikane has been managing this fund since August 2021. Total Schemes managed by the Fund Manager is 2 (2
are jointly managed). Refer annexure from page no. 132 for performance of other schemes currently managed by Manish Banthia, Nishit Patel and Gaurav Chikane.2. Date of inception: 24-Aug-10.3. Past performance may or may not be sustained in future and the same may not necessarily provide the basis for comparison with other investment.4. Load is not considered for computation of returns.5. In case, the start/end date of the concerned period is a nonbusiness date (NBD), the NAV of the previous date is considered for computation of returns. The NAV per unit shown in the table is as on the start date of the said period.6. Wherever applicable, for calculating returns, NAV of ICICI Prudential Gold ETF has been adjusted on account of change in face value.
Returns of ICICI Prudential Gold ETF - Growth Option as on July 31, 2021
Riskometer
This Product is suitable for investors who are seeking*:
• Long term wealth creation solution
• A Gold exchange traded fund that seeks to provide investment returns that closely track domestic prices of Gold, subject to tracking error.
*Investors should consult their financial advisers if in doubt about whether theproduct is suitable for them.
ICICI Prudential Gold ETF(An open ended exchange traded fund replicating domestic prices of gold)
@ Benchmark against domestic price of gold as derived from the LBMA AM Fixing prices.@@ Total Expense Ratio is as on the last business day of the month.With effect from close of business hours of November 16, 2018 the face value of the units of the scheme is changed from ̀ 10/- to ̀ 1/-Refer Disclaimer of BSE Limited/ National Stock Exchange of India Limited on page no. 152.The AUM/AAUM figures have been adjusted with respect to investments made by other schemes of the Mutual Fund into aforesaid scheme. The aggregate value of such interscheme investments amounts to Rs. 463.60 crores.Investors please note that there will be change in fundamental attributes of the scheme w.e.f closure of business hours on March 08, 2021.For IDCW History : Refer page no. from 152 to 159, For SIP Returns : Refer page no. from 147 to 150, For Investment Objective : Refer page no. from 160 to 163
Pursuant to changes in fundamental attributes with effect from closure of business hours of March 08, 2021 and introduction to participation in Exchange Traded Commodity Derivatives (ETCDs), FPI investors will not be allowed to invest post implementation of fundamental attribute changes.
Other Schemes
Category
Portfolio as on July 31, 2021
Gold 97.89%
Gold (995 Purity) 97.89%
Short Term Debt and net current assets 2.11%
Total Net Assets 100.00%
Company/Issuer % to NAV
Fund Details
Monthly AAUM as on 30-Jun-21 : Rs. 1631.75 crores
Closing AUM as on 30-Jun-21 : Rs. 1535.42 crores
NAV (As on 30-Jul-21): Rs. 43.0586
`
`̀ `̀` `
`
Fund Managers** :Manish Banthia (Managing this fund since Sep, 2012 & Overall 16 years of experience)Nishit Patel (Managing this fund since Dec, 2020 & Overall 3 years of experience)
Indicative Investment Horizon: 5 years and above
Exit load for Redemption / Switchout :- Lumpsum & SIP / STP / SWP OptionNil
Inception/Allotment date: 24-Aug-10
Total Expense Ratio @@ :Other : 0.50% p. a.
Minimum application amount for buy/sale of units:Through the Stock Exchange - One unit (One Unit - apprx 1gm Gold) Directly with the mutual fund - 1,10,000 units (One Unit - apprx 1/100th of 1 gram of Gold) (w.e.f. 11-Jan-2021)
Exchange Listed on:NSE and BSE
Codes & Symbols:NSE : ICICIGOLDBSE : 533244/ICICIGOLDISIN : INF109K01FV4
Quantitative Indicators
Tracking Error :
0.26%
Investors understand that their principal will be at Moderately High risk
1 Year 3 Years 5 Years Since inceptionParticulars
47.8509 271.4105
CAGR (%)
Current Value of
Investment of Rs. 10000
CAGR (%)
Current Value of
Investment of Rs. 10000
CAGR (%)
Current Value of
Investment of Rs. 10000
302.1278
CAGR (%)
Current Value of
Investment of Rs. 10000
1892.46
Scheme
LBMA AM Fixing Prices (Benchmark)
NAV (Rs.) Per Unit (as on July 30,2021 : 43.0586)
-10.04 8998.49 16.63 15864.75 7.33 14251.78 7.80 22752.71
-9.65 9037.83 17.73 16319.22 8.51 15047.35 8.95 25553.86
Gaurav Chikane (for ETCDs) (Managing this fund since August, 2021 & Overall 6 years of experience)
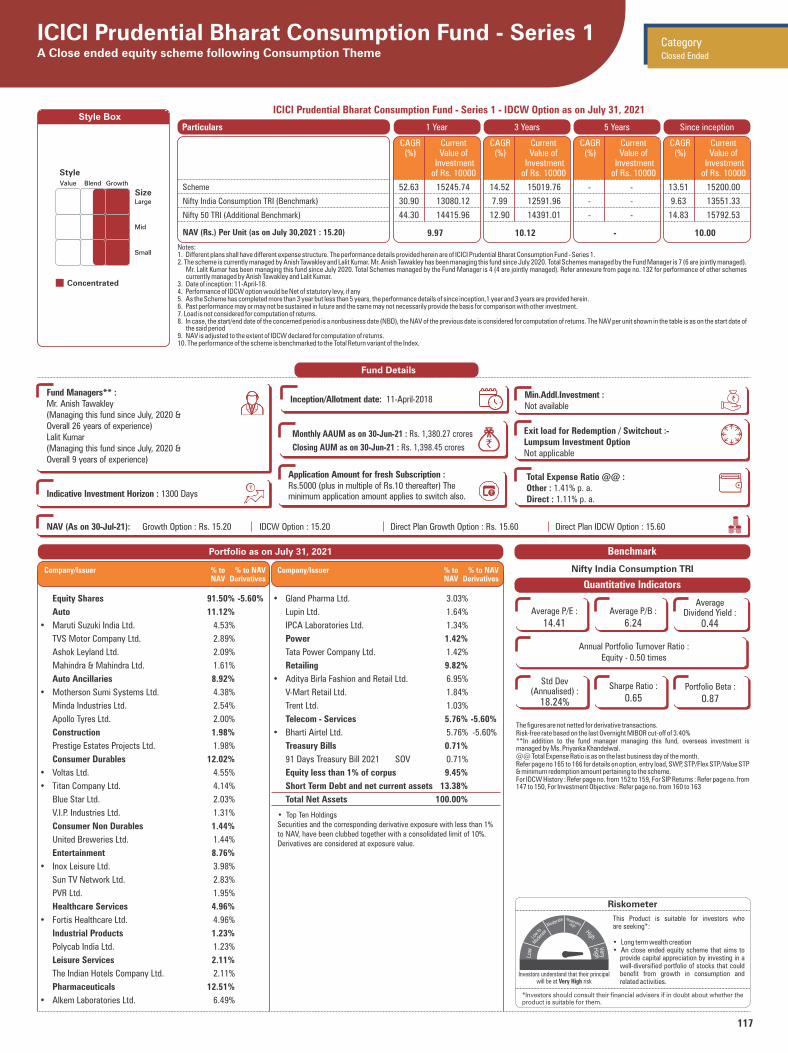
117
Style Box
Notes:1. Different plans shall have different expense structure. The performance details provided herein are of ICICI Prudential Bharat Consumption Fund - Series 1.2. The scheme is currently managed by Anish Tawakley and Lalit Kumar. Mr. Anish Tawakley has been managing this fund since July 2020. Total Schemes managed by the Fund Manager is 7 (6 are jointly managed). Mr. Lalit Kumar has been managing this fund since July 2020. Total Schemes managed by the Fund Manager is 4 (4 are jointly managed). Refer annexure from page no. 132 for performance of other schemes
currently managed by Anish Tawakley and Lalit Kumar.3. Date of inception: 11-April-18.4. Performance of IDCW option would be Net of statutory levy, if any5. As the Scheme has completed more than 3 year but less than 5 years, the performance details of since inception,1 year and 3 years are provided herein.6. Past performance may or may not be sustained in future and the same may not necessarily provide the basis for comparison with other investment.7. Load is not considered for computation of returns.8. In case, the start/end date of the concerned period is a nonbusiness date (NBD), the NAV of the previous date is considered for computation of returns. The NAV per unit shown in the table is as on the start date of
the said period9. NAV is adjusted to the extent of IDCW declared for computation of returns.10. The performance of the scheme is benchmarked to the Total Return variant of the Index.
ICICI Prudential Bharat Consumption Fund - Series 1 - IDCW Option as on July 31, 2021
1 Year 3 Years 5 Years Since inceptionParticulars
9.97 10.12
Scheme
Nifty India Consumption TRI (Benchmark)
Nifty 50 TRI (Additional Benchmark)
NAV (Rs.) Per Unit (as on July 30,2021 : 15.20)
CAGR (%)
Current Value of
Investment of Rs. 10000
CAGR (%)
Current Value of
Investment of Rs. 10000
CAGR (%)
Current Value of
Investment of Rs. 10000
-
CAGR (%)
Current Value of
Investment of Rs. 10000
10.00
Portfolio as on July 31, 2021
Riskometer
This Product is suitable for investors who are seeking*:
• Long term wealth creation • An close ended equity scheme that aims to
provide capital appreciation by investing in a well-diversified portfolio of stocks that could benefit from growth in consumption and related activities.
*Investors should consult their financial advisers if in doubt about whether theproduct is suitable for them.
52.63 15245.74 14.52 15019.76 - - 13.51 15200.00
30.90 13080.12 7.99 12591.96 - - 9.63 13551.33
44.30 14415.96 12.90 14391.01 - - 14.83 15792.53
ICICI Prudential Bharat Consumption Fund - Series 1A Close ended equity scheme following Consumption Theme
Value Blend Growth
Large
Mid
Small
Concentrated
Style
Size
The figures are not netted for derivative transactions.Risk-free rate based on the last Overnight MIBOR cut-off of 3.40%**In addition to the fund manager managing this fund, overseas investment is managed by Ms. Priyanka Khandelwal.@@ Total Expense Ratio is as on the last business day of the month. Refer page no 165 to 166 for details on option, entry load, SWP, STP/Flex STP/Value STP & minimum redemption amount pertaining to the scheme. For IDCW History : Refer page no. from 152 to 159, For SIP Returns : Refer page no. from 147 to 150, For Investment Objective : Refer page no. from 160 to 163
Quantitative Indicators
Benchmark
Nifty India Consumption TRI
• Top Ten HoldingsSecurities and the corresponding derivative exposure with less than 1% to NAV, have been clubbed together with a consolidated limit of 10%.Derivatives are considered at exposure value.
Fund Details
Monthly AAUM as on 30-Jun-21 : Rs. 1,380.27 crores
Closing AUM as on 30-Jun-21 : Rs. 1,398.45 crores `
Fund Managers** :Mr. Anish Tawakley(Managing this fund since July, 2020 &Overall 26 years of experience)Lalit Kumar(Managing this fund since July, 2020 &Overall 9 years of experience)
Indicative Investment Horizon : 1300 Days
Exit load for Redemption / Switchout :- Lumpsum Investment OptionNot applicable
Inception/Allotment date: 11-April-2018
Total Expense Ratio @@ :Other : 1.41% p. a.Direct : 1.11% p. a.
Application Amount for fresh Subscription :Rs.5000 (plus in multiple of Rs.10 thereafter) The minimum application amount applies to switch also.
Min.Addl.Investment :Not available
NAV (As on 30-Jul-21): Growth Option : Rs. 15.20 IDCW Option : 15.20 Direct Plan Growth Option : Rs. 15.60 Direct Plan IDCW Option : 15.60 `̀ `̀` `
`
Average P/E :
14.41Average P/B :
6.24
Average Dividend Yield :
0.44
Annual Portfolio Turnover Ratio : Equity - 0.50 times
Investors understand that their principal will be at Very High risk
Closed Ended
Category
Std Dev (Annualised) :
18.24%
Sharpe Ratio :
0.65Portfolio Beta :
0.87
Equity Shares 91.50% -5.60%
Auto 11.12%
• Maruti Suzuki India Ltd. 4.53%
TVS Motor Company Ltd. 2.89%
Ashok Leyland Ltd. 2.09%
Mahindra & Mahindra Ltd. 1.61%
Auto Ancillaries 8.92%
• Motherson Sumi Systems Ltd. 4.38%
Minda Industries Ltd. 2.54%
Apollo Tyres Ltd. 2.00%
Construction 1.98%
Prestige Estates Projects Ltd. 1.98%
Consumer Durables 12.02%
• Voltas Ltd. 4.55%
• Titan Company Ltd. 4.14%
Blue Star Ltd. 2.03%
V.I.P. Industries Ltd. 1.31%
Consumer Non Durables 1.44%
United Breweries Ltd. 1.44%
Entertainment 8.76%
• Inox Leisure Ltd. 3.98%
Sun TV Network Ltd. 2.83%
PVR Ltd. 1.95%
Healthcare Services 4.96%
• Fortis Healthcare Ltd. 4.96%
Industrial Products 1.23%
Polycab India Ltd. 1.23%
Leisure Services 2.11%
The Indian Hotels Company Ltd. 2.11%
Pharmaceuticals 12.51%
• Alkem Laboratories Ltd. 6.49%
Company/Issuer % to % to NAV NAV Derivatives
• Gland Pharma Ltd. 3.03%
Lupin Ltd. 1.64%
IPCA Laboratories Ltd. 1.34%
Power 1.42%
Tata Power Company Ltd. 1.42%
Retailing 9.82%
• Aditya Birla Fashion and Retail Ltd. 6.95%
V-Mart Retail Ltd. 1.84%
Trent Ltd. 1.03%
Telecom - Services 5.76% -5.60%
• Bharti Airtel Ltd. 5.76% -5.60%
Treasury Bills 0.71%
91 Days Treasury Bill 2021 SOV 0.71%
Equity less than 1% of corpus 9.45%
Short Term Debt and net current assets 13.38%
Total Net Assets 100.00%
Company/Issuer % to % to NAV NAV Derivatives

118
Style Box
Notes:1. Different plans shall have different expense structure. The performance details provided herein are of ICICI Prudential Bharat Consumption Fund - Series 2.2. The scheme is currently managed by Roshan Chutkey. Mr. Roshan Chutkey has been managing this fund since Jan 2021. Total Schemes managed by the Fund Manager is 6 (3 are jointly managed). Refer
annexure from page no. 132 for performance of other schemes currently managed by Roshan Chutkey.3. Date of inception: 04-May-18.4. Performance of IDCW option would be Net of statutory levy, if any5. As the Scheme has completed more than 3 year but less than 5 years, the performance details of since inception,1 year and 3 years are provided herein.6. Past performance may or may not be sustained in future and the same may not necessarily provide the basis for comparison with other investment.7. Load is not considered for computation of returns.8. In case, the start/end date of the concerned period is a nonbusiness date (NBD), the NAV of the previous date is considered for computation of returns. The NAV per unit shown in the table is as on the start date of
the said period9. NAV is adjusted to the extent of IDCW declared for computation of returns.10. The performance of the scheme is benchmarked to the Total Return variant of the Index.
ICICI Prudential Bharat Consumption Fund - Series 2 - IDCW Option as on July 31, 2021
1 Year 3 Years 5 Years Since inceptionParticulars
10.50 10.00
Scheme
Nifty India Consumption TRI (Benchmark)
Nifty 50 TRI (Additional Benchmark)
NAV (Rs.) Per Unit (as on July 30,2021 : 14.41)
CAGR (%)
Current Value of
Investment of Rs. 10000
CAGR (%)
Current Value of
Investment of Rs. 10000
CAGR (%)
Current Value of
Investment of Rs. 10000
-
CAGR (%)
Current Value of
Investment of Rs. 10000
10.00
Portfolio as on July 31, 2021
Riskometer
This Product is suitable for investors who are seeking*:
• Long term wealth creation • An close ended equity scheme that aims to
provide capital appreciation by investing in a well-diversified portfolio of stocks that could benefit from growth in consumption and related activities.
*Investors should consult their financial advisers if in doubt about whether theproduct is suitable for them.
37.36 13723.81 12.95 14410.00 - - 11.93 14410.00
30.90 13080.12 7.99 12591.96 - - 9.42 13387.41
44.30 14415.96 12.90 14391.01 - - 14.46 15492.24
ICICI Prudential Bharat Consumption Fund - Series 2A Close ended equity scheme following Consumption Theme
Value Blend Growth
Large
Mid
Small
Concentrated
Style
Size
The figures are not netted for derivative transactions.Risk-free rate based on the last Overnight MIBOR cut-off of 3.40%**In addition to the fund manager managing this fund, overseas investment is managed by Ms. Priyanka Khandelwal.@@ Total Expense Ratio is as on the last business day of the month. Refer page no 123 to 131 for details on option, entry load, SWP, STP/Flex STP/Value STP & minimum redemption amount pertaining to the scheme. For IDCW History : Refer page no. from 152 to 159, For SIP Returns : Refer page no. from 147 to 150, For Investment Objective : Refer page no. from 160 to 163
Quantitative Indicators
Benchmark
Nifty India Consumption TRI.
• Top Ten HoldingsSecurities and the corresponding derivative exposure with less than 1% to NAV, have been clubbed together with a consolidated limit of 10%.
Fund Details
Monthly AAUM as on 30-Jun-21 : Rs. 396.28 crores
Closing AUM as on 30-Jun-21 : Rs. 401.82 crores `
Fund Managers** :Mr. Roshan Chutkey(Managing this fund since January 2021& Overall 14 years of experience)
Indicative Investment Horizon : 1300 Days
Exit load for Redemption / Switchout :- Lumpsum Investment OptionNot applicable
Inception/Allotment date: 04-May-2018
Total Expense Ratio @@ :Other : 1.41% p. a.Direct : 1.12% p. a.
Application Amount for fresh Subscription :Rs.5000 (plus in multiple of Rs.10 thereafter) The minimum application amount applies to switch also.
Min.Addl.Investment :Not available
NAV (As on 30-Jul-21): Growth Option : Rs. 14.41 IDCW Option : 14.41 Direct Plan Growth Option : Rs. 14.73 Direct Plan IDCW Option : 14.73 `̀ `̀` `
`
Average P/E :
26.17Average P/B :
6.98
Average Dividend Yield :
1.24
Annual Portfolio Turnover Ratio : Equity - 0.47 times
Investors understand that their principal will be at Very High risk
Closed Ended
Category
Equity Shares 89.58%
Auto 14.83%
• Mahindra & Mahindra Ltd. 7.90%
• Maruti Suzuki India Ltd. 5.14%
Bajaj Auto Ltd. 1.79%
Auto Ancillaries 4.91%
• Exide Industries Ltd. 3.75%
Apollo Tyres Ltd. 1.16%
Construction 1.36%
G R Infraprojects Ltd. 1.36%
Consumer Durables 2.98%
Titan Company Ltd. 2.98%
Consumer Non Durables 33.23%
• ITC Ltd. 6.63%
• Britannia Industries Ltd. 5.87%
• CCL Products (India) Ltd. 5.69%
• United Spirits Ltd. 5.26%
• Jyothy Laboratories Ltd. 4.22%
Hindustan Unilever Ltd. 2.48%
Dabur India Ltd. 1.97%
Bajaj Consumer Care Ltd. 1.11%
Entertainment 1.15%
Sun TV Network Ltd. 1.15%
Finance 1.48%
Cholamandalam Financial Holdings Ltd. 1.48%
Leisure Services 2.81%
Barbeque Nation Hospitality 1.77%
The Indian Hotels Company Ltd. 1.04%
Pharmaceuticals 7.68%
• Sun Pharmaceutical Industries Ltd. 7.68%
Power 1.93%
NTPC Ltd. 1.93%
Company/Issuer Rating % to NAV
Telecom - Services 12.05%
• Bharti Airtel Ltd. 10.20%
RailTel Corporation of India Ltd. 1.85%
Equity less than 1% of corpus 5.16%
Short Term Debt and net current assets 10.42%
Total Net Assets 100.00%
Company/Issuer Rating % to NAV
Std Dev (Annualised) :
15.17%
Sharpe Ratio :
0.66Portfolio Beta :
0.67

119
Style Box
Notes:1. Different plans shall have different expense structure. The performance details provided herein are of ICICI Prudential Bharat Consumption Fund - Series 3.2. The scheme is currently managed by Anish Tawakley and Lalit Kumar. Mr. Anish Tawakley has been managing this fund since July 2020. Total Schemes managed by the Fund Manager is 7 (6 are jointly
managed). Mr. Lalit Kumar has been managing this fund since July 2020. Total Schemes managed by the Fund Manager is 4 (4 are jointly managed). Refer annexure from page no. 132 for performance of other schemes
currently managed by Anish Tawakley and Lalit Kumar.3. Date of inception: 17-Jul-18.4. Performance of IDCW option would be Net of statutory levy, if any5. As the Scheme has completed more than 3 year but less than 5 years, the performance details of since inception,1 year and 3 years are provided herein.6. Past performance may or may not be sustained in future and the same may not necessarily provide the basis for comparison with other investment.7. Load is not considered for computation of returns.8. In case, the start/end date of the concerned period is a nonbusiness date (NBD), the NAV of the previous date is considered for computation of returns. The NAV per unit shown in the table is as on the start date of
the said period9. NAV is adjusted to the extent of IDCW declared for computation of returns.10. The performance of the scheme is benchmarked to the Total Return variant of the Index.
ICICI Prudential Bharat Consumption Fund - Series 3 - IDCW Option as on July 31, 2021
1 Year 3 Years 5 Years Since inceptionParticulars
10.01 10.15
Scheme
Nifty India Consumption TRI (Benchmark)
Nifty 50 TRI (Additional Benchmark)
NAV (Rs.) Per Unit (as on July 30,2021 : 16.00)
CAGR (%)
Current Value of
Investment of Rs. 10000
CAGR (%)
Current Value of
Investment of Rs. 10000
CAGR (%)
Current Value of
Investment of Rs. 10000
-
CAGR (%)
Current Value of
Investment of Rs. 10000
10.00
Portfolio as on July 31, 2021
Riskometer
This Product is suitable for investors who are seeking*:
• Long term wealth creation• An close ended equity scheme that aims to
provide capital appreciation by investing in a well-diversified portfolio of stocks that could benefit from growth in consumption and related activities.
*Investors should consult their financial advisers if in doubt about whether theproduct is suitable for them.
60.05 15984.02 16.38 15763.55 - - 16.73 16000.00
30.90 13080.12 7.99 12591.96 - - 8.93 12969.21
44.30 14415.96 12.90 14391.01 - - 13.94 14865.41
ICICI Prudential Bharat Consumption Fund - Series 3A Close ended equity scheme following Consumption Theme
Value Blend Growth
Large
Mid
Small
Concentrated
Style
Size
The figures are not netted for derivative transactions.Risk-free rate based on the last Overnight MIBOR cut-off of 3.40%**In addition to the fund manager managing this fund, overseas investment is managed by Ms. Priyanka Khandelwal.@@ Total Expense Ratio is as on the last business day of the month. Refer page no 165 to 166 for details on option, entry load, SWP, STP/Flex STP/Value STP & minimum redemption amount pertaining to the scheme.For IDCW History : Refer page no. from 152 to 159, For SIP Returns : Refer page no. from 147 to 150, For Investment Objective : Refer page no. from 160 to 163
Quantitative Indicators
Benchmark
Nifty India Consumption TRI.
• Top Ten HoldingsSecurities and the corresponding derivative exposure with less than 1% to NAV, have been clubbed together with a consolidated limit of 10%.Derivatives are considered at exposure value.
Fund Details
Monthly AAUM as on 30-Jun-21 : Rs. 192.24 crores
Closing AUM as on 30-Jun-21 : Rs. 195.33 crores `
Fund Managers** :Mr. Anish Tawakley(Managing this fund since July, 2020 &Overall 26 years of experience)Lalit Kumar(Managing this fund since July, 2020 &Overall 9 years of experience)
Indicative Investment Horizon : 1300 Days
Exit load for Redemption / Switchout :- Lumpsum Investment OptionNot applicable
Inception/Allotment date: 17-Jul-2018
Total Expense Ratio @@ :Other : 1.38% p. a.Direct : 0.93% p. a.
Application Amount for fresh Subscription :Rs.5,000 (plus in multiple of Rs.10)
Min.Addl.Investment :Not available
NAV (As on 30-Jul-21): Growth Option : Rs. 16.00 IDCW Option : 16.00 Direct Plan Growth Option : Rs. 16.41 Direct Plan IDCW Option : 16.41 `̀ `̀` `
`
Average P/E :
12.33Average P/B :
6.19
Average Dividend Yield :
0.38
Annual Portfolio Turnover Ratio : Equity - 0.54 times
Investors understand that their principal will be at Very High risk
Closed Ended
Category
Equity Shares 91.11% -5.44%
Auto 8.82%
Maruti Suzuki India Ltd. 3.36%
TVS Motor Company Ltd. 2.36%
Ashok Leyland Ltd. 1.56%
Mahindra & Mahindra Ltd. 1.54%
Auto Ancillaries 10.22%
• Motherson Sumi Systems Ltd. 4.55%
• Minda Industries Ltd. 3.76%
Apollo Tyres Ltd. 1.91%
Consumer Durables 10.83%
• Titan Company Ltd. 4.51%
• Voltas Ltd. 4.47%
Blue Star Ltd. 1.84%
Consumer Non Durables 4.45%
United Breweries Ltd. 1.76%
Bajaj Consumer Care Ltd. 1.60%
CCL Products (India) Ltd. 1.10%
Entertainment 7.69%
• Inox Leisure Ltd. 4.10%
Sun TV Network Ltd. 1.86%
PVR Ltd. 1.73%
Healthcare Services 7.56%
• Healthcare Global Enterprises Ltd. 4.26%
Fortis Healthcare Ltd. 3.30%
Industrial Products 1.20%
Polycab India Ltd. 1.20%
Leisure Services 3.17%
EIH Ltd. 1.83%
The Indian Hotels Company Ltd. 1.35%
Paper 2.68%
Andhra Paper Ltd 2.68%
Pharmaceuticals 15.54%
• Alkem Laboratories Ltd. 5.65%
Company/Issuer % to % to NAV NAV Derivatives
• Gland Pharma Ltd. 4.57%
Lupin Ltd. 1.56%
IPCA Laboratories Ltd. 1.33%
Indoco Remedies Ltd. 1.32%
Ajanta Pharma Ltd. 1.11%
Retailing 6.10%
• Aditya Birla Fashion and Retail Ltd. 4.48%
V-Mart Retail Ltd. 1.62%
Telecom - Services 5.57% -5.44%
• Bharti Airtel Ltd. 5.57% -5.44%
Equity less than 1% of corpus 7.28%
Short Term Debt and net current assets 14.33%
Total Net Assets 100.00%
Company/Issuer % to % to NAV NAV Derivatives
Std Dev (Annualised) :
18.55%
Sharpe Ratio :
0.73Portfolio Beta :
0.88
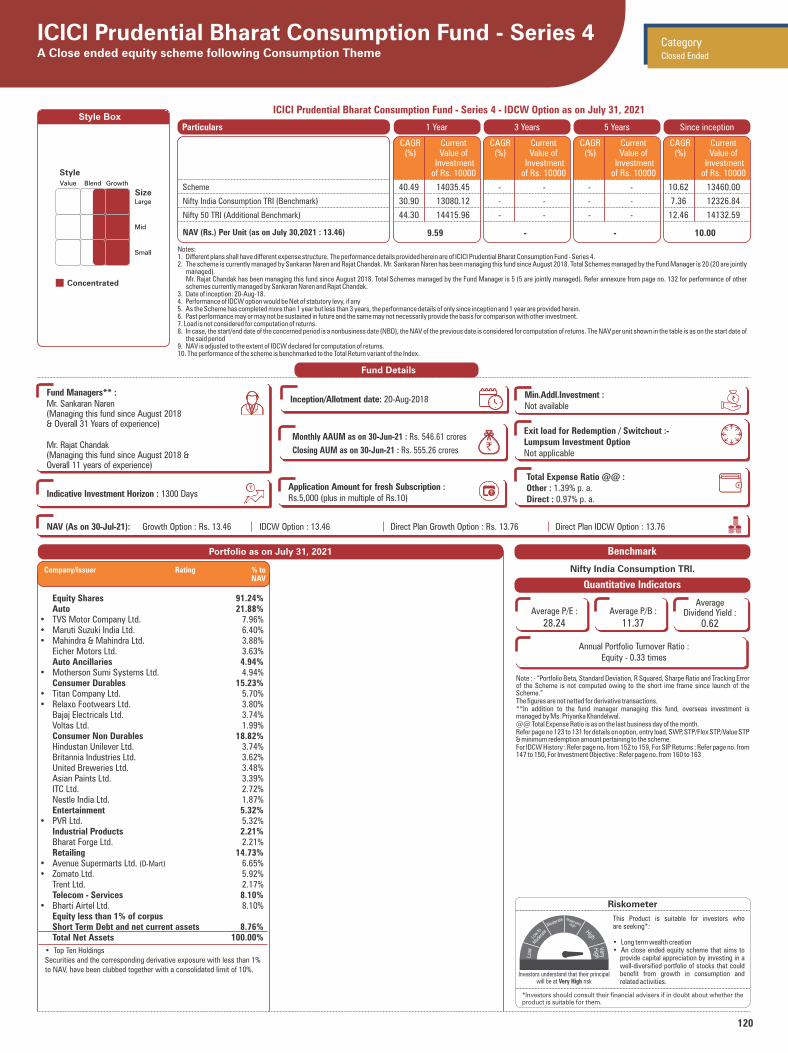
120
Style Box
Notes:1. Different plans shall have different expense structure. The performance details provided herein are of ICICI Prudential Bharat Consumption Fund - Series 4.2. The scheme is currently managed by Sankaran Naren and Rajat Chandak. Mr. Sankaran Naren has been managing this fund since August 2018. Total Schemes managed by the Fund Manager is 20 (20 are jointly
managed). Mr. Rajat Chandak has been managing this fund since August 2018. Total Schemes managed by the Fund Manager is 5 (5 are jointly managed). Refer annexure from page no. 132 for performance of other
schemes currently managed by Sankaran Naren and Rajat Chandak.3. Date of inception: 20-Aug-18.4. Performance of IDCW option would be Net of statutory levy, if any5. As the Scheme has completed more than 1 year but less than 3 years, the performance details of only since inception and 1 year are provided herein.6. Past performance may or may not be sustained in future and the same may not necessarily provide the basis for comparison with other investment.7. Load is not considered for computation of returns.8. In case, the start/end date of the concerned period is a nonbusiness date (NBD), the NAV of the previous date is considered for computation of returns. The NAV per unit shown in the table is as on the start date of
the said period9. NAV is adjusted to the extent of IDCW declared for computation of returns.10. The performance of the scheme is benchmarked to the Total Return variant of the Index.
ICICI Prudential Bharat Consumption Fund - Series 4 - IDCW Option as on July 31, 2021
1 Year 3 Years 5 Years Since inceptionParticulars
9.59 -
Scheme
Nifty India Consumption TRI (Benchmark)
Nifty 50 TRI (Additional Benchmark)
NAV (Rs.) Per Unit (as on July 30,2021 : 13.46)
CAGR (%)
Current Value of
Investment of Rs. 10000
CAGR (%)
Current Value of
Investment of Rs. 10000
CAGR (%)
Current Value of
Investment of Rs. 10000
-
CAGR (%)
Current Value of
Investment of Rs. 10000
10.00
Portfolio as on July 31, 2021
Riskometer
This Product is suitable for investors who are seeking*:
• Long term wealth creation • An close ended equity scheme that aims to
provide capital appreciation by investing in a well-diversified portfolio of stocks that could benefit from growth in consumption and related activities.
*Investors should consult their financial advisers if in doubt about whether theproduct is suitable for them.
40.49 14035.45 - - - - 10.62 13460.00
30.90 13080.12 - - - - 7.36 12326.84
44.30 14415.96 - - - - 12.46 14132.59
ICICI Prudential Bharat Consumption Fund - Series 4A Close ended equity scheme following Consumption Theme
Value Blend Growth
Large
Mid
Small
Concentrated
Style
Size
Note : - “Portfolio Beta, Standard Deviation, R Squared, Sharpe Ratio and Tracking Error of the Scheme is not computed owing to the short ime frame since launch of the Scheme.”The figures are not netted for derivative transactions.**In addition to the fund manager managing this fund, overseas investment is managed by Ms. Priyanka Khandelwal.@@ Total Expense Ratio is as on the last business day of the month. Refer page no 123 to 131 for details on option, entry load, SWP, STP/Flex STP/Value STP & minimum redemption amount pertaining to the scheme. For IDCW History : Refer page no. from 152 to 159, For SIP Returns : Refer page no. from 147 to 150, For Investment Objective : Refer page no. from 160 to 163
Quantitative Indicators
Benchmark
Nifty India Consumption TRI.
• Top Ten HoldingsSecurities and the corresponding derivative exposure with less than 1% to NAV, have been clubbed together with a consolidated limit of 10%.
Equity Shares 91.24% Auto 21.88%• TVS Motor Company Ltd. 7.96%• Maruti Suzuki India Ltd. 6.40%• Mahindra & Mahindra Ltd. 3.88% Eicher Motors Ltd. 3.63% Auto Ancillaries 4.94%• Motherson Sumi Systems Ltd. 4.94% Consumer Durables 15.23%• Titan Company Ltd. 5.70%• Relaxo Footwears Ltd. 3.80% Bajaj Electricals Ltd. 3.74% Voltas Ltd. 1.99% Consumer Non Durables 18.82% Hindustan Unilever Ltd. 3.74% Britannia Industries Ltd. 3.62% United Breweries Ltd. 3.48% Asian Paints Ltd. 3.39% ITC Ltd. 2.72% Nestle India Ltd. 1.87% Entertainment 5.32%• PVR Ltd. 5.32% Industrial Products 2.21% Bharat Forge Ltd. 2.21% Retailing 14.73%• Avenue Supermarts Ltd. (D-Mart) 6.65%• Zomato Ltd. 5.92% Trent Ltd. 2.17% Telecom - Services 8.10%• Bharti Airtel Ltd. 8.10% Equity less than 1% of corpus Short Term Debt and net current assets 8.76% Total Net Assets 100.00%
Company/Issuer Rating % to NAV
Fund Details
Monthly AAUM as on 30-Jun-21 : Rs. 546.61 crores
Closing AUM as on 30-Jun-21 : Rs. 555.26 crores `
Fund Managers** :Mr. Sankaran Naren (Managing this fund since August 2018 & Overall 31 Years of experience)
Mr. Rajat Chandak (Managing this fund since August 2018 & Overall 11 years of experience)
Indicative Investment Horizon : 1300 Days
Exit load for Redemption / Switchout :- Lumpsum Investment OptionNot applicable
Inception/Allotment date: 20-Aug-2018
Total Expense Ratio @@ :Other : 1.39% p. a.Direct : 0.97% p. a.
Application Amount for fresh Subscription :Rs.5,000 (plus in multiple of Rs.10)
Min.Addl.Investment :Not available
NAV (As on 30-Jul-21): Growth Option : Rs. 13.46 IDCW Option : 13.46 Direct Plan Growth Option : Rs. 13.76 Direct Plan IDCW Option : 13.76 `̀ `̀` `
`
Average P/E :
28.24Average P/B :
11.37
Average Dividend Yield :
0.62
Annual Portfolio Turnover Ratio : Equity - 0.33 times
Investors understand that their principal will be at Very High risk
Closed Ended
Category
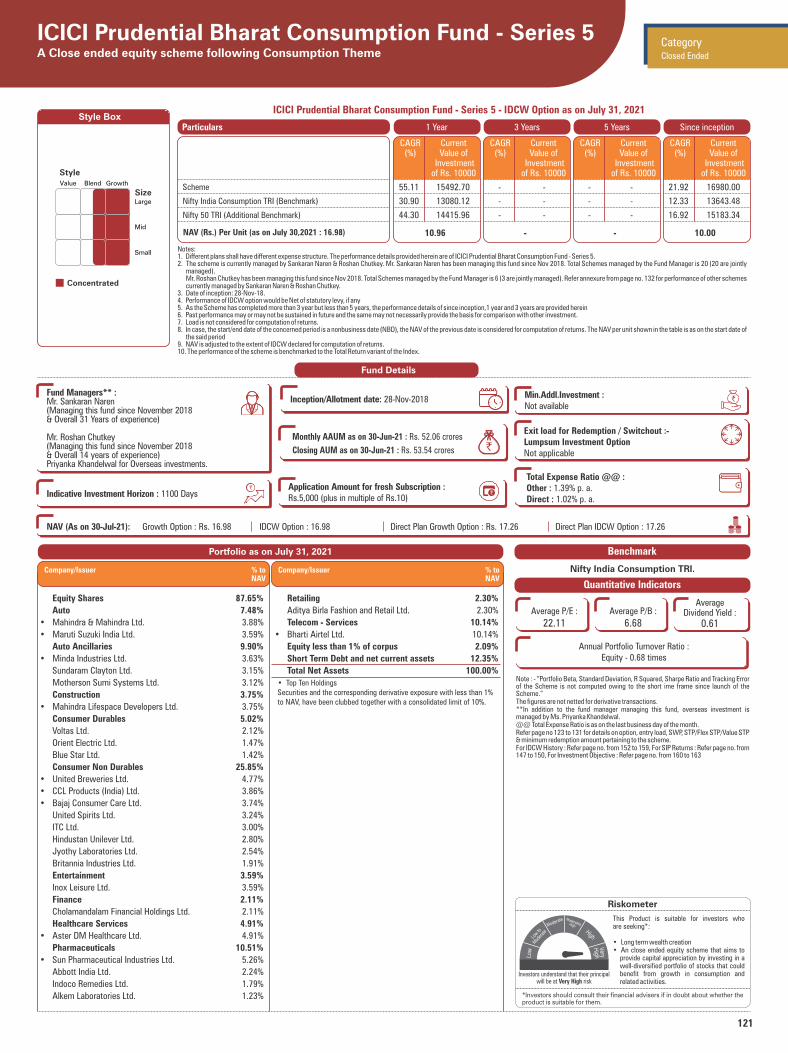
121
Style Box
Notes:1. Different plans shall have different expense structure. The performance details provided herein are of ICICI Prudential Bharat Consumption Fund - Series 5.2. The scheme is currently managed by Sankaran Naren & Roshan Chutkey. Mr. Sankaran Naren has been managing this fund since Nov 2018. Total Schemes managed by the Fund Manager is 20 (20 are jointly
managed). Mr. Roshan Chutkey has been managing this fund since Nov 2018. Total Schemes managed by the Fund Manager is 6 (3 are jointly managed). Refer annexure from page no. 132 for performance of other schemes
currently managed by Sankaran Naren & Roshan Chutkey.3. Date of inception: 28-Nov-18.4. Performance of IDCW option would be Net of statutory levy, if any5. As the Scheme has completed more than 3 year but less than 5 years, the performance details of since inception,1 year and 3 years are provided herein6. Past performance may or may not be sustained in future and the same may not necessarily provide the basis for comparison with other investment.7. Load is not considered for computation of returns.8. In case, the start/end date of the concerned period is a nonbusiness date (NBD), the NAV of the previous date is considered for computation of returns. The NAV per unit shown in the table is as on the start date of
the said period9. NAV is adjusted to the extent of IDCW declared for computation of returns.10. The performance of the scheme is benchmarked to the Total Return variant of the Index.
ICICI Prudential Bharat Consumption Fund - Series 5 - IDCW Option as on July 31, 2021
1 Year 3 Years 5 Years Since inceptionParticulars
10.96 -
Scheme
Nifty India Consumption TRI (Benchmark)
Nifty 50 TRI (Additional Benchmark)
NAV (Rs.) Per Unit (as on July 30,2021 : 16.98)
CAGR (%)
Current Value of
Investment of Rs. 10000
CAGR (%)
Current Value of
Investment of Rs. 10000
CAGR (%)
Current Value of
Investment of Rs. 10000
-
CAGR (%)
Current Value of
Investment of Rs. 10000
10.00
Portfolio as on July 31, 2021
Riskometer
This Product is suitable for investors who are seeking*:
• Long term wealth creation • An close ended equity scheme that aims to
provide capital appreciation by investing in a well-diversified portfolio of stocks that could benefit from growth in consumption and related activities.
*Investors should consult their financial advisers if in doubt about whether theproduct is suitable for them.
55.11 15492.70 - - - - 21.92 16980.00
30.90 13080.12 - - - - 12.33 13643.48
44.30 14415.96 - - - - 16.92 15183.34
ICICI Prudential Bharat Consumption Fund - Series 5A Close ended equity scheme following Consumption Theme
Value Blend Growth
Large
Mid
Small
Concentrated
Style
Size
Note : - “Portfolio Beta, Standard Deviation, R Squared, Sharpe Ratio and Tracking Error of the Scheme is not computed owing to the short ime frame since launch of the Scheme.”The figures are not netted for derivative transactions.**In addition to the fund manager managing this fund, overseas investment is managed by Ms. Priyanka Khandelwal.@@ Total Expense Ratio is as on the last business day of the month. Refer page no 123 to 131 for details on option, entry load, SWP, STP/Flex STP/Value STP & minimum redemption amount pertaining to the scheme.For IDCW History : Refer page no. from 152 to 159, For SIP Returns : Refer page no. from 147 to 150, For Investment Objective : Refer page no. from 160 to 163
Quantitative Indicators
Benchmark
Nifty India Consumption TRI.
• Top Ten HoldingsSecurities and the corresponding derivative exposure with less than 1% to NAV, have been clubbed together with a consolidated limit of 10%.
Equity Shares 87.65%
Auto 7.48%
• Mahindra & Mahindra Ltd. 3.88%
• Maruti Suzuki India Ltd. 3.59%
Auto Ancillaries 9.90%
• Minda Industries Ltd. 3.63%
Sundaram Clayton Ltd. 3.15%
Motherson Sumi Systems Ltd. 3.12%
Construction 3.75%
• Mahindra Lifespace Developers Ltd. 3.75%
Consumer Durables 5.02%
Voltas Ltd. 2.12%
Orient Electric Ltd. 1.47%
Blue Star Ltd. 1.42%
Consumer Non Durables 25.85%
• United Breweries Ltd. 4.77%
• CCL Products (India) Ltd. 3.86%
• Bajaj Consumer Care Ltd. 3.74%
United Spirits Ltd. 3.24%
ITC Ltd. 3.00%
Hindustan Unilever Ltd. 2.80%
Jyothy Laboratories Ltd. 2.54%
Britannia Industries Ltd. 1.91%
Entertainment 3.59%
Inox Leisure Ltd. 3.59%
Finance 2.11%
Cholamandalam Financial Holdings Ltd. 2.11%
Healthcare Services 4.91%
• Aster DM Healthcare Ltd. 4.91%
Pharmaceuticals 10.51%
• Sun Pharmaceutical Industries Ltd. 5.26%
Abbott India Ltd. 2.24%
Indoco Remedies Ltd. 1.79%
Alkem Laboratories Ltd. 1.23%
Retailing 2.30%
Aditya Birla Fashion and Retail Ltd. 2.30%
Telecom - Services 10.14%
• Bharti Airtel Ltd. 10.14%
Equity less than 1% of corpus 2.09%
Short Term Debt and net current assets 12.35%
Total Net Assets 100.00%
Company/Issuer % to NAV
Company/Issuer % to NAV
Fund Details
Monthly AAUM as on 30-Jun-21 : Rs. 52.06 crores
Closing AUM as on 30-Jun-21 : Rs. 53.54 crores `
Fund Managers** :Mr. Sankaran Naren (Managing this fund since November 2018 & Overall 31 Years of experience)
Mr. Roshan Chutkey (Managing this fund since November 2018 & Overall 14 years of experience)Priyanka Khandelwal for Overseas investments.
Indicative Investment Horizon : 1100 Days
Exit load for Redemption / Switchout :- Lumpsum Investment OptionNot applicable
Inception/Allotment date: 28-Nov-2018
Total Expense Ratio @@ :Other : 1.39% p. a.Direct : 1.02% p. a.
Application Amount for fresh Subscription :Rs.5,000 (plus in multiple of Rs.10)
Min.Addl.Investment :Not available
NAV (As on 30-Jul-21): Growth Option : Rs. 16.98 IDCW Option : 16.98 Direct Plan Growth Option : Rs. 17.26 Direct Plan IDCW Option : 17.26 `̀ `̀` `
`
Average P/E :
22.11Average P/B :
6.68
Average Dividend Yield :
0.61
Annual Portfolio Turnover Ratio : Equity - 0.68 times
Investors understand that their principal will be at Very High risk
Closed Ended
Category

122
Style Box
Notes:1. Different plans shall have different expense structure. The performance details provided herein are of ICICI Prudential Long Term Wealth Enhancement Fund.2. The scheme is currently managed by Sankaran Naren and Rajat Chandak. Mr. Sankaran Naren has been managing this fund since March 2018. Total Schemes managed by the Fund Manager is 20 (20 are jointly
managed). Mr. Rajat Chandak has been managing this fund since March 2018. Total Schemes managed by the Fund Manager is 5 (5 are jointly managed). Refer annexure from page no. 132 for performance of other
schemes currently managed by Sankaran Naren and Rajat Chandak.3. Date of inception: 22-Mar-18.4. As the Scheme has completed more than 1 year but less than 3 years, the performance details of only since inception and 1 year are provided herein.5. Past performance may or may not be sustained in future and the same may not necessarily provide the basis for comparison with other investment.6. Load is not considered for computation of returns.7. In case, the start/end date of the concerned period is a nonbusiness date (NBD), the NAV of the previous date is considered for computation of returns. The NAV per unit shown in the table is as on the start date of
the said period8. The performance of the scheme is benchmarked to the Total Return variant of the Index.
Returns of ICICI Prudential Long Term Wealth Enhancement Fund - Growth Option as on July 31, 2021
1 Year 3 Years 5 Years Since inceptionParticulars
9.31 10.74
Scheme
Nifty LargeMidcap 250 TRI (Benchmark)
Nifty 50 TRI (Additional Benchmark)
NAV (Rs.) Per Unit (as on July 30,2021 : 14.29)
CAGR (%)
Current Value of
Investment of Rs. 10000
CAGR (%)
Current Value of
Investment of Rs. 10000
CAGR (%)
Current Value of
Investment of Rs. 10000
-
CAGR (%)
Current Value of
Investment of Rs. 10000
10.00
Portfolio as on July 31, 2021
53.67 15349.09 9.99 13305.40 - - 11.21 14290.00
61.99 16177.85 15.05 15228.84 - - 15.62 16283.37
44.30 14415.96 12.90 14391.01 - - 15.58 16264.69
ICICI Prudential Long Term Wealth Enhancement FundA Close ended equity scheme (ELSS) with a statutory lock in of 3 years and tax benefit
Value Blend Growth
Large
Mid
Small
Diversified
Style
Size
The figures are not netted for derivative transactions.Risk-free rate based on the last Overnight MIBOR cut-off of 3.40%The figures are not netted for derivative transactions.**In addition to the fund manager managing this fund, overseas investment is managed by Ms. Priyanka Khandelwal.@@ Total Expense Ratio is as on the last business day of the month.Refer page no 123 to 131 for details on option, entry load, SWP, STP/Flex STP/Value STP & minimum redemption amount pertaining to the scheme.For IDCW History : Refer page no. from 152 to 159, For SIP Returns : Refer page no. from 147 to 150, For Investment Objective : Refer page no. from 160 to 163
Quantitative Indicators
Benchmark
Nifty LargeMidcap 250 TRI.
Riskometer
This Product is suitable for investors who are seeking*:
• Long term wealth creation
• A close ended equity linked Savings scheme (ELSS) with a Statutory lock in of 3 years and tax benefit.
*Investors should consult their financial advisers if in doubt about whether theproduct is suitable for them.
Top 10 Sectors
• Top Ten HoldingsSecurities and the corresponding derivative exposure with less than 1% to NAV, have been clubbed together with a consolidated limit of 10%.
Equity Shares 92.26%
Auto 17.60%
• TVS Motor Company Ltd. 7.04%
• Eicher Motors Ltd. 6.05%
• Mahindra & Mahindra Ltd. 4.51%
Auto Ancillaries 4.78%
• Motherson Sumi Systems Ltd. 4.78%
Banks 26.61%
• HDFC Bank Ltd. 9.89%
• ICICI Bank Ltd. 8.22%
• State Bank Of India 4.95%
Axis Bank Ltd. 3.54%
Cement & Cement Products 4.48%
• Shree Cements Ltd. 4.48%
Chemicals 1.49%
Pidilite Industries Ltd. 1.49%
Construction 3.82%
KNR Constructions Ltd. 3.82%
Consumer Durables 2.10%
Titan Company Ltd. 2.10%
Consumer Non Durables 3.32%
United Breweries Ltd. 2.11%
Britannia Industries Ltd. 1.22%
Entertainment 3.16%
PVR Ltd. 3.16%
Finance 2.39%
CreditAccess Grameen Ltd. 2.39%
Industrial Products 3.76%
Bharat Forge Ltd. 3.76%
Leisure Services 3.42%
The Indian Hotels Company Ltd. 3.42%
Petroleum Products 3.04%
Reliance Industries Ltd. 3.04%
Retailing 8.07%
• Avenue Supermarts Ltd. (D-Mart) 5.99%
Trent Ltd. 2.08%
Telecom - Services 4.23%
• Bharti Airtel Ltd. 4.23%
Equity less than 1% of corpus
Short Term Debt and net current assets 7.74%
Total Net Assets 100.00%
Company/Issuer Rating % to NAV
Company/Issuer Rating % to NAV
Fund Details
Fund Managers** :Mr. Sankaran Naren (Managing this fund since Mar 2018 & Overall 31 Years of experience)
Mr. Rajat Chandak(Managing this fund since Mar 2018 & Overall 11 years of experience)
Indicative Investment Horizon : 10 Years
Exit load for Redemption / Switchout :- Lumpsum Investment OptionNot applicable
Inception/Allotment date: 22-Mar-2018
Total Expense Ratio @@ :Other : 1.40% p. a.Direct : 1.04% p. a.
Monthly AAUM as on 30-Jun-21 : Rs. 41.04 crores
Closing AUM as on 30-Jun-21 : Rs. 37.62 crores `
Application Amount for fresh Subscription :Rs.500 (plus in multiple of Rs.500)
Min.Addl.Investment :Not available
NAV (As on 30-Jul-21): Growth Option : Rs. 14.29 IDCW Option : 14.29 Direct Plan Growth Option : Rs. 14.69 Direct Plan IDCW Option : 14.69 `̀ `̀` `
`
Average P/E :
21.03Average P/B :
6.78
Average Dividend Yield :
0.42
Annual Portfolio Turnover Ratio : Equity - 0.15 times
Investors understand that their principal will be at Very High risk
Closed Ended
Category
Std Dev (Annualised) :
25.44%
Sharpe Ratio :
0.38Portfolio Beta :
1.02
26.61%
17.60%
8.07%
7.73%
4.78%
4.48%
4.23%
3.82%
3.76%
3.42%
Banks
Auto
Retailing
Cash,Cash Equivalents and Net Current Assets
Auto Ancillaries
Cement & Cement Products
Telecom - Services
Construction
Industrial Products
Leisure Services

123
FUND DETAILS ANNEXURE FOR OPEN ENDED FUND
ICICI Prudential Bluechip Fund ü ü ü
Not Applicable
Any Amount
Daily Frequency: Rs. 250/- and in multiples of Rs. 1/- Weekly, Monthly and Quarterly Frequency: Rs. 1,000/- and in multiples of Rs. 1/-
#Any Amount
Daily, Weekly, Fortnightly & Monthly Frequency: Rs. 100/- and in multiple of Rs. 1/- Quarterly Frequency: Rs. 5,000/- and in multiple of Rs. 1/-
ICICI Prudential Large & Mid Cap Fund
ü üNot Applicable
Any Amount
Daily Frequency: Rs. 250/- and in multiples of Rs. 1/-Weekly, Monthly and Quarterly Frequency: Rs. 1,000/- and in multiples of Rs. 1/-
Any Amount
Daily, Weekly, Fortnightly &Monthly Frequency: Rs. 100/- and in multiple of Rs. 1/-Quarterly Frequency: Rs. 5,000/- and in multiple of Rs. 1/-
ü
SCHEME NAME
GROWTH/ GROWTH
AEP (Regular and Appreciation)
IDCW
REINVEST
ENTRY LOAD
Minimum Redemption
Amount
&&SWP STP/FLEX STP/Value STP*##SIPPAYOUT***
ICICI Prudential India Opportunities Fund
üNot Applicable
Any Amount
Daily Frequency: Rs. 250/- and in multiples of Rs. 1/-Weekly, Monthly and Quarterly Frequency: Rs. 1,000/- and in multiples of Rs. 1/-
Any Amountü ü
Daily, Weekly, Fortnightly &Monthly Frequency: Rs.100/- and in multiple of Re. 1/-Quarterly Frequency: Rs.5,000/- and in multiple of Re. 1/-
ICICI Prudential Value Discovery Fund
ü ü üNot Applicable
Any Amount
Daily Frequency: Rs. 250/- and in multiples of Rs. 1/-Weekly, Monthly and Quarterly Frequency: Rs. 1,000/- and in multiples of Rs. 1/-
Any Amount
Daily, Weekly, Fortnightly &Monthly Frequency: Rs. 100/- and in multiple of Rs. 1/-Quarterly Frequency: Rs. 5,000/- and in multiple of Rs. 1/-
ICICI Prudential Long Term Equity Fund (Tax Saving)
ü ü Not Applicable
Any Amount(SWP - Out facility shall be availableunder the scheme only post completionof lock-in period of 3 years.)
#Any Amount
Daily, Weekly, Fortnightly &Monthly Frequency: Rs. 500/- and in multiple of Rs. 1/-Quarterly Frequency: Rs. 500/- and in multiple of Rs. 1/-
Daily Frequency: Rs. 250/- and inmultiple of Rs. 1/-Weekly, Monthly and QuarterlyFrequency: Rs. 1000/- and in multiple of Rs. 1/-(STP - Out facility shall be available under the scheme only post completion of lock-in period of 3 years.)
ICICI Prudential Focused Equity Fund
ü üNot Applicable
Any Amount
Daily Frequency: Rs. 250/- and in multiples of Rs. 1/-Weekly, Monthly and Quarterly Frequency: Rs. 1,000/- and in multiples of Rs. 1/-
Any Amount
Daily, Weekly, Fortnightly &Monthly Frequency: Rs. 100/- and in multiple of Rs. 1/-Quarterly Frequency: Rs. 5,000/- and in multiple of Rs. 1/-
ü
ICICI Prudential Dividend Yield Equity Fund
üNot Applicable
Any Amount
Daily Frequency: Rs. 250/- and in multiples of Rs. 1/-Weekly, Monthly and Quarterly Frequency: Rs. 1,000/- and in multiples of Rs. 1/-
Any Amount
Daily, Weekly, Fortnightly &Monthly Frequency: Rs.100/- and in multiple of Re. 1/-Quarterly Frequency: Rs.5,000/- and in multiple of Re. 1/-
ü ü
ICICI Prudential Midcap Fund ü
Not Applicable
Any Amount
Daily Frequency: Rs. 250/- and in multiples of Rs. 1/-Weekly, Monthly and Quarterly Frequency: Rs. 1,000/- and in multiples of Rs. 1/-
Any Amountü ü
Daily, Weekly, Fortnightly &Monthly Frequency: Rs. 100/- and in multiple of Rs. 1/-Quarterly Frequency: Rs. 5,000/- and in multiple of Rs. 1/-
ICICI Prudential Multicap Fund ü ü ü
Not Applicable
Daily Frequency: Rs. 250/- and in multiples of Rs. 1/-Weekly, Monthly and Quarterly Frequency: Rs. 1,000/- and in multiples of Rs. 1/-
Any Amount
Daily, Weekly, Fortnightly &Monthly Frequency: Rs. 100/- and in multiple of Rs. 1/-Quarterly Frequency: Rs. 5,000/- and in multiple of Rs. 1/-
Any Amount
Not Applicable

124
ICICI Prudential Manufacturein India Fund
üNot Applicable
Any Amount
Daily Frequency: Rs. 250/- and in multiples of Rs. 1/-Weekly, Monthly and Quarterly Frequency: Rs. 1,000/- and in multiples of Rs. 1/-
Any Amount
Daily, Weekly, Fortnightly &Monthly Frequency: Rs.100/- and in multiple of Re. 1/-Quarterly Frequency: Rs.5,000/- and in multiple of Re. 1/-
ü ü
ICICI Prudential Pharma Healthcare and Diagnostics (P.H.D) Fund
üNot Applicable
Any Amount
Daily Frequency: Rs. 250/- and in multiples of Rs. 1/-Weekly, Monthly and Quarterly Frequency: Rs. 1,000/- and in multiples of Rs. 1/-
Any Amount
Daily, Weekly, Fortnightly &Monthly Frequency: Rs.100/- and in multiple of Re. 1/-Quarterly Frequency: Rs.5,000/- and in multiple of Re. 1/-
ü ü
ICICI Prudential Exports and Services Fund
üNot Applicable
Any Amount
Daily Frequency: Rs. 250/- and in multiples of Rs. 1/-Weekly, Monthly and Quarterly Frequency: Rs. 1,000/- and in multiples of Rs. 1/-
Any Amount
Daily, Weekly, Fortnightly &Monthly Frequency: Rs. 100/- and in multiple of Rs. 1/-Quarterly Frequency: Rs. 5,000/- and in multiple of Rs. 1/-
ü ü
ICICI Prudential Infrastructure Fund
ü üNot Applicable
Any Amount
Daily Frequency: Rs. 250/- and in multiples of Rs. 1/-Weekly, Monthly and Quarterly Frequency: Rs. 1,000/- and in multiples of Rs. 1/-
Any Amount
Daily, Weekly, Fortnightly &Monthly Frequency: Rs. 100/- and in multiple of Rs. 1/-Quarterly Frequency: Rs. 5,000/- and in multiple of Rs. 1/-
ü
FUND DETAILS ANNEXURE FOR OPEN ENDED FUND
SCHEME NAME
GROWTH/ GROWTH
AEP (Regular and Appreciation)
IDCW
REINVEST
ENTRY LOAD
Minimum Redemption
Amount
&&SWP STP/FLEX STP/Value STP*##SIPPAYOUT***
ICICI Prudential Smallcap Fund ü ü ü
Not Applicable
Any Amount
Daily Frequency: Rs. 250/- and in multiples of Rs. 1/-Weekly, Monthly and Quarterly Frequency: Rs. 1,000/- and in multiples of Rs. 1/-
Any Amount
Daily, Weekly, Fortnightly &Monthly Frequency: Rs. 100/- and in multiple of Rs. 1/-Quarterly Frequency: Rs. 5,000/- and in multiple of Rs. 1/-
ICICI Prudential Banking & Financial Services Fund
üNot Applicable
Any Amount
Daily Frequency: Rs. 250/- and in multiples of Rs. 1/-Weekly, Monthly and Quarterly Frequency: Rs. 1,000/- and in multiples of Rs. 1/-
Any Amountü ü
Daily, Weekly, Fortnightly &Monthly Frequency: Rs. 100/- and in multiple of Rs. 1/-Quarterly Frequency: Rs. 5,000/- and in multiple of Rs. 1/-
ICICI Prudential FMCG Fund ü ü ü
Not Applicable
Any Amount
Daily Frequency: Rs. 250/- and in multiples of Rs. 1/-Weekly, Monthly and Quarterly Frequency: Rs. 1,000/- and in multiples of Rs. 1/-
Any Amount
Daily, Weekly, Fortnightly &Monthly Frequency: Rs. 100/- and in multiple of Rs. 1/-Quarterly Frequency: Rs. 5,000/- and in multiple of Rs. 1/-
ICICI Prudential Technology Fund ü
Not Applicable
Any Amount
Daily Frequency: Rs. 250/- and in multiples of Rs. 1/-Weekly, Monthly and Quarterly Frequency: Rs. 1,000/- and in multiples of Rs. 1/-
Any Amount
Daily, Weekly, Fortnightly &Monthly Frequency: Rs. 100/- and in multiple of Rs. 1/-Quarterly Frequency: Rs. 5,000/- and in multiple of Rs. 1/-
ü ü
ICICI Prudential ESG Fund ü ü ü
Not Applicable
Available.The minimum amount of transfer for daily frequency in STP, Flex STP and Value STP is Rs.250/- and in multiples of Re.1/-The minimum amount of transfer for weekly, monthly and quarterly frequency in STP, Flex STP and Value STP is Rs.1000/- and in multiples of Rs.1/- (Minimum no. of instalments for daily, weekly and monthly frequency will be 6 and for quarterly frequency will be 4)
Any Amount
Daily, Weekly, Fortnightly, Monthly SIP$: Rs.100/- (plus in multiple of Re. 1/-) Minimum installments: 6Quarterly SIP : Rs.5,000/- (plus in multiple of Re. 1/-) Minimum installments – 4$ The applicability of the minimum amount of installment mentioned is at the time of registration only.
Available.Monthly, Quarterly, Half Yearly and Annual frequencies are available in Systematic Withdrawal Plan (SWP). The minimum number of instalments for all the frequencies will be 2.

125
FUND DETAILS ANNEXURE FOR OPEN ENDED FUND
SCHEME NAME
GROWTH/ GROWTH
AEP (Regular and Appreciation)
IDCW
REINVEST
ENTRY LOAD
Minimum Redemption
Amount
&&SWP STP/FLEX STP/Value STP*##SIPPAYOUT***
ICICI Prudential Commodities Fund
ü ü üNot Applicable
Any Amount
Daily Frequency: Rs. 250/- and in multiples of Rs. 1/-Weekly, Monthly and Quarterly Frequency: Rs. 1,000/- and in multiples of Rs. 1/-
Any Amount
Daily, Weekly, Fortnightly &Monthly Frequency: Rs.100/- and in multiple of Re. 1/-Quarterly Frequency: Rs.5,000/- and in multiple of Re. 1/-
ICICI Prudential US Bluechip Equity Fund
üNot Applicable
Any Amount
Daily Frequency: Rs. 250/- and in multiples of Rs. 1/-Weekly, Monthly and Quarterly Frequency: Rs. 1,000/- and in multiples of Rs. 1/-
Any Amountü ü
Daily, Weekly, Fortnightly &Monthly Frequency: Rs.100/- and in multiple of Re. 1/-Quarterly Frequency: Rs.5,000/- and in multiple of Re. 1/-
ICICI Prudential Equity & Debt Fund
üNot Applicable
Any Amount
Daily Frequency: Rs. 250/- and in multiples of Rs. 1/-Weekly, Monthly and Quarterly Frequency: Rs. 1,000/- and in multiples of Rs. 1/-
Any Amount
Daily, Weekly, Fortnightly &Monthly Frequency: Rs. 100/- and in multiple of Rs. 1/-Quarterly Frequency:Rs. 5,000/- and in multiple of Rs. 1/-
(Frequencies - Monthly & Annual)
ICICI Prudential Equity - Arbitrage Fund
üNot Applicable
Any Amount
Daily Frequency: Rs. 250/- and in multiples of Rs. 1/-Weekly, Monthly and Quarterly Frequency: Rs. 1,000/- and in multiples of Rs. 1/-
Any Amount
Daily, Weekly, Fortnightly &Monthly Frequency: Rs. 1,000/- and in multiple of Rs. 1/-Quarterly Frequency: Rs. 5,000/- and in multiple of Rs. 1/-
ü ü
ICICI Prudential Balanced Advantage Fund
Not Applicable
Any Amount
Daily Frequency: Rs. 250/- and in multiples of Rs. 1/-Weekly, Monthly and Quarterly Frequency: Rs. 1,000/- and in multiples of Rs. 1/-
Any Amount
Daily, Weekly, Fortnightly &Monthly Frequency: Rs. 100/- and in multiple of Rs. 1/-Quarterly Frequency: Rs. 5,000/- and in multiple of Rs. 1/-
ü(Frequencies -
Monthly)
ICICI Prudential Equity Savings Fund
ü üNot Applicable
Any Amount
Daily Frequency: Rs. 250/- and in multiples of Rs. 1/-Weekly, Monthly and Quarterly Frequency: Rs. 1,000/- and in multiples of Rs. 1/-
Any Amount
Daily, Weekly, Fortnightly &Monthly Frequency: Rs. 100/- and in multiple of Rs. 1/-Quarterly Frequency: Rs. 5,000/- and in multiple of Rs. 1/-
ü
ICICI Prudential Regular Savings Fund
Not Applicable
Any Amount
Daily Frequency: Rs. 250/- and in multiples of Rs. 1/-Weekly, Monthly and Quarterly Frequency: Rs. 1,000/- and in multiples of Rs. 1/-
Any Amount
Daily, Weekly, Fortnightly &Monthly Frequency: Rs. 100/- and in multiple of Rs. 1/-Quarterly Frequency: Rs. 5,000/- and in multiple of Rs. 1/-
ü(Frequencies -
Monthly, Quarterly and Half yearly)
ICICI Prudential Multi-Asset Fund
üNot Applicable
Any Amount
Daily Frequency: Rs. 250/- and in multiples of Rs. 1/-Weekly, Monthly and Quarterly Frequency: Rs. 1,000/- and in multiples of Rs. 1/-
Any Amount
Daily, Weekly, Fortnightly &Monthly Frequency: Rs. 100/- and in multiple of Rs. 1/-Quarterly Frequency: Rs. 5,000/- and in multiple of Rs. 1/-
ü ü
ICICI Prudential MNC Fund ü
Not Applicable
Any Amount
Daily Frequency: Rs. 250/- and in multiples of Rs. 1/-Weekly, Monthly and Quarterly Frequency: Rs. 1,000/- and in multiples of Rs. 1/-
Any Amount
Daily, Weekly, Fortnightly &Monthly Frequency: Rs.100/- and in multiple of Re. 1/-Quarterly Frequency: Rs.5,000/- and in multiple of Re. 1/-
ü ü
ICICI Prudential Bharat Consumption Fund
üNot Applicable
Any Amount
Daily Frequency: Rs. 250/- and in multiples of Rs. 1/-Weekly, Monthly and Quarterly Frequency: Rs. 1,000/- and in multiples of Rs. 1/-
Any Amount
Daily, Weekly, Fortnightly &Monthly Frequency: Rs.100/- and in multiple of Re. 1/-Quarterly Frequency: Rs.5,000/- and in multiple of Re. 1/-
ü ü
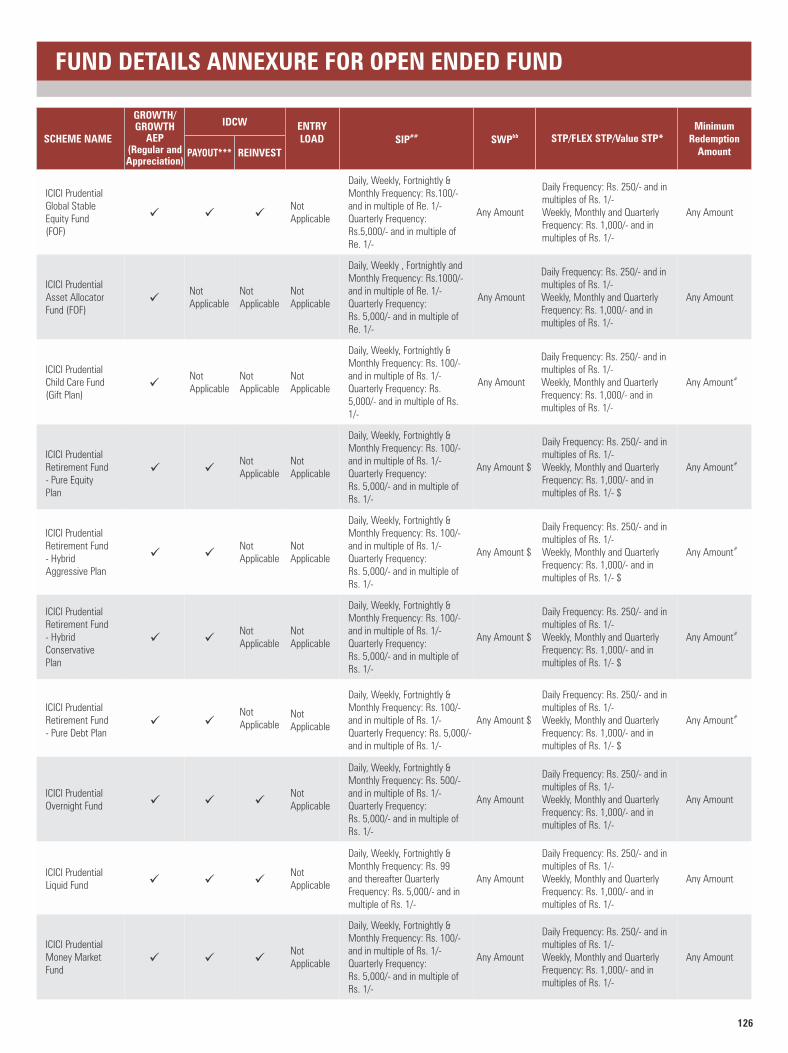
126
ICICI Prudential Global Stable Equity Fund (FOF)
ü ü üNot Applicable
Any Amount
Daily Frequency: Rs. 250/- and in multiples of Rs. 1/-Weekly, Monthly and Quarterly Frequency: Rs. 1,000/- and in multiples of Rs. 1/-
Any Amount
Daily, Weekly, Fortnightly &Monthly Frequency: Rs.100/- and in multiple of Re. 1/-Quarterly Frequency: Rs.5,000/- and in multiple of Re. 1/-
ICICI Prudential Asset Allocator Fund (FOF)
üNot Applicable
Any Amount
Daily Frequency: Rs. 250/- and in multiples of Rs. 1/-Weekly, Monthly and Quarterly Frequency: Rs. 1,000/- and in multiples of Rs. 1/-
Any Amount
Daily, Weekly , Fortnightly and Monthly Frequency: Rs.1000/- and in multiple of Re. 1/-Quarterly Frequency: Rs. 5,000/- and in multiple of Re. 1/-
Not Applicable
Not Applicable
FUND DETAILS ANNEXURE FOR OPEN ENDED FUND
SCHEME NAME
GROWTH/ GROWTH
AEP (Regular and Appreciation)
IDCW
REINVEST
ENTRY LOAD
Minimum Redemption
Amount
&&SWP STP/FLEX STP/Value STP*##SIPPAYOUT***
ICICI Prudential Child Care Fund (Gift Plan)
üNot Applicable
Any Amount
Daily Frequency: Rs. 250/- and in multiples of Rs. 1/-Weekly, Monthly and Quarterly Frequency: Rs. 1,000/- and in multiples of Rs. 1/-
#Any Amount
Daily, Weekly, Fortnightly &Monthly Frequency: Rs. 100/- and in multiple of Rs. 1/-Quarterly Frequency: Rs. 5,000/- and in multiple of Rs. 1/-
ICICI Prudential Retirement Fund - Pure Equity Plan
üNot Applicable
Any Amount $
Daily Frequency: Rs. 250/- and in multiples of Rs. 1/-Weekly, Monthly and Quarterly Frequency: Rs. 1,000/- and in multiples of Rs. 1/- $
#Any Amountü
Daily, Weekly, Fortnightly &Monthly Frequency: Rs. 100/- and in multiple of Rs. 1/-Quarterly Frequency: Rs. 5,000/- and in multiple of Rs. 1/-
ICICI Prudential Retirement Fund - Hybrid Conservative Plan
üNot Applicable
Any Amount $
Daily Frequency: Rs. 250/- and in multiples of Rs. 1/-Weekly, Monthly and Quarterly Frequency: Rs. 1,000/- and in multiples of Rs. 1/- $
#Any Amount
Daily, Weekly, Fortnightly &Monthly Frequency: Rs. 100/- and in multiple of Rs. 1/-Quarterly Frequency: Rs. 5,000/- and in multiple of Rs. 1/-
ü
ICICI Prudential Retirement Fund - Hybrid Aggressive Plan
üNot Applicable
Any Amount $
Daily Frequency: Rs. 250/- and in multiples of Rs. 1/-Weekly, Monthly and Quarterly Frequency: Rs. 1,000/- and in multiples of Rs. 1/- $
#Any Amount
Daily, Weekly, Fortnightly &Monthly Frequency: Rs. 100/- and in multiple of Rs. 1/-Quarterly Frequency: Rs. 5,000/- and in multiple of Rs. 1/-
ü
ICICI Prudential Retirement Fund - Pure Debt Plan
üNot Applicable
Any Amount $
Daily Frequency: Rs. 250/- and in multiples of Rs. 1/-Weekly, Monthly and Quarterly Frequency: Rs. 1,000/- and in multiples of Rs. 1/- $
#Any Amount
Daily, Weekly, Fortnightly &Monthly Frequency: Rs. 100/- and in multiple of Rs. 1/-Quarterly Frequency: Rs. 5,000/- and in multiple of Rs. 1/-
ü
ICICI Prudential Overnight Fund ü
Not Applicable
Any Amount
Daily Frequency: Rs. 250/- and in multiples of Rs. 1/-Weekly, Monthly and Quarterly Frequency: Rs. 1,000/- and in multiples of Rs. 1/-
Any Amount
Daily, Weekly, Fortnightly &Monthly Frequency: Rs. 500/- and in multiple of Rs. 1/-Quarterly Frequency: Rs. 5,000/- and in multiple of Rs. 1/-
ü ü
ICICI Prudential Liquid Fund ü
Not Applicable
Any Amount
Daily Frequency: Rs. 250/- and in multiples of Rs. 1/-Weekly, Monthly and Quarterly Frequency: Rs. 1,000/- and in multiples of Rs. 1/-
Any Amount
Daily, Weekly, Fortnightly &Monthly Frequency: Rs. 99 and thereafter Quarterly Frequency: Rs. 5,000/- and inmultiple of Rs. 1/-
ü ü
ICICI Prudential Money Market Fund
üNot Applicable
Any Amount
Daily Frequency: Rs. 250/- and in multiples of Rs. 1/-Weekly, Monthly and Quarterly Frequency: Rs. 1,000/- and in multiples of Rs. 1/-
Any Amount
Daily, Weekly, Fortnightly &Monthly Frequency: Rs. 100/- and in multiple of Rs. 1/-Quarterly Frequency: Rs. 5,000/- and in multiple of Rs. 1/-
ü ü
Not Applicable
Not Applicable
Not Applicable
Not Applicable
Not Applicable
Not Applicable
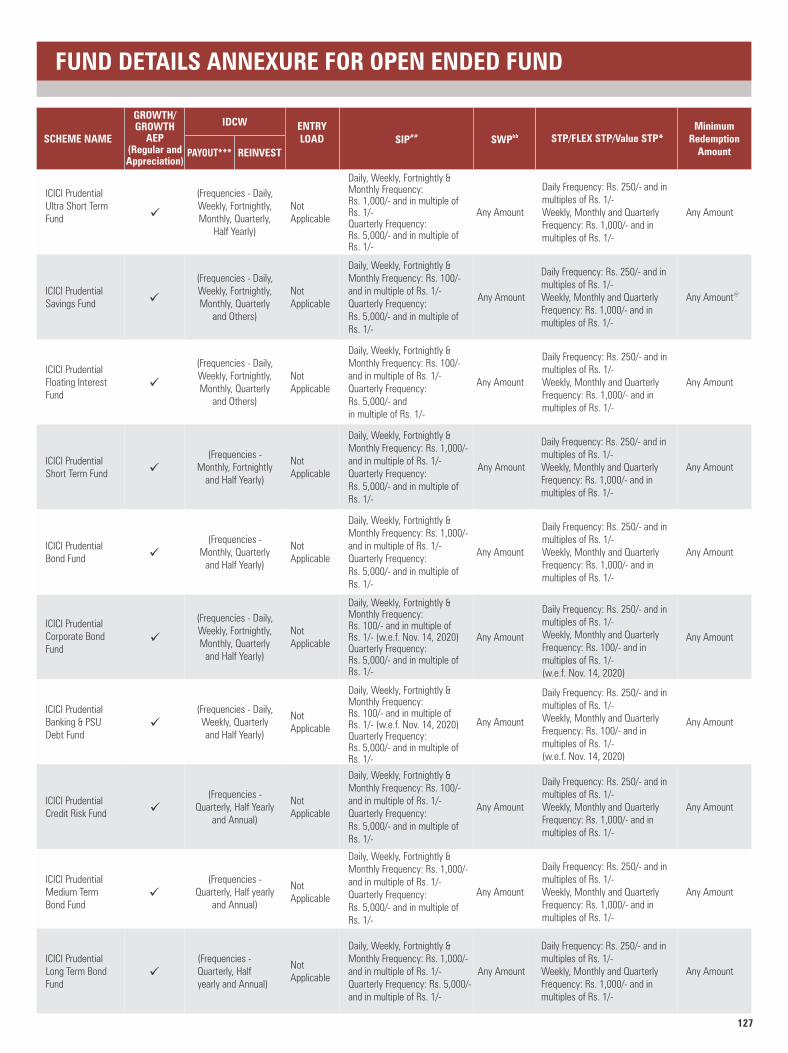
127
ICICI Prudential Ultra Short Term Fund
Not Applicable
Any Amount
Daily Frequency: Rs. 250/- and in multiples of Rs. 1/-Weekly, Monthly and Quarterly Frequency: Rs. 1,000/- and in multiples of Rs. 1/-
Any Amount
Daily, Weekly, Fortnightly &Monthly Frequency: Rs. 1,000/- and in multiple of Rs. 1/-Quarterly Frequency: Rs. 5,000/- and in multiple of Rs. 1/-
ü
(Frequencies - Daily, Weekly, Fortnightly, Monthly, Quarterly,
Half Yearly)
ICICI Prudential Savings Fund ü
Not Applicable
Any Amount
Daily Frequency: Rs. 250/- and in multiples of Rs. 1/-Weekly, Monthly and Quarterly Frequency: Rs. 1,000/- and in multiples of Rs. 1/-
@Any Amount
Daily, Weekly, Fortnightly &Monthly Frequency: Rs. 100/- and in multiple of Rs. 1/-Quarterly Frequency: Rs. 5,000/- and in multiple of Rs. 1/-
(Frequencies - Daily, Weekly, Fortnightly, Monthly, Quarterly
and Others)
FUND DETAILS ANNEXURE FOR OPEN ENDED FUND
SCHEME NAME
GROWTH/ GROWTH
AEP (Regular and Appreciation)
IDCW
REINVEST
ENTRY LOAD
Minimum Redemption
Amount
&&SWP STP/FLEX STP/Value STP*##SIPPAYOUT***
ICICI Prudential Corporate Bond Fund
üNot Applicable
Any Amount
Daily Frequency: Rs. 250/- and in multiples of Rs. 1/-Weekly, Monthly and Quarterly Frequency: Rs. 100/- and in multiples of Rs. 1/-(w.e.f. Nov. 14, 2020)
Any Amount
Daily, Weekly, Fortnightly &Monthly Frequency: Rs. 100/- and in multiple of Rs. 1/- (w.e.f. Nov. 14, 2020)Quarterly Frequency: Rs. 5,000/- and in multiple of Rs. 1/-
(Frequencies - Daily, Weekly, Fortnightly, Monthly, Quarterly
and Half Yearly)
ICICI Prudential Banking & PSU Debt Fund
üNot Applicable
Any Amount
Daily Frequency: Rs. 250/- and in multiples of Rs. 1/-Weekly, Monthly and Quarterly Frequency: Rs. 100/- and in multiples of Rs. 1/- (w.e.f. Nov. 14, 2020)
Any Amount
Daily, Weekly, Fortnightly &Monthly Frequency: Rs. 100/- and in multiple of Rs. 1/- (w.e.f. Nov. 14, 2020)Quarterly Frequency: Rs. 5,000/- and in multiple of Rs. 1/-
(Frequencies - Daily, Weekly, Quarterly and Half Yearly)
ICICI Prudential Credit Risk Fund ü
Not Applicable
Any Amount
Daily Frequency: Rs. 250/- and in multiples of Rs. 1/-Weekly, Monthly and Quarterly Frequency: Rs. 1,000/- and in multiples of Rs. 1/-
Any Amount
Daily, Weekly, Fortnightly &Monthly Frequency: Rs. 100/- and in multiple of Rs. 1/-Quarterly Frequency: Rs. 5,000/- and in multiple of Rs. 1/-
(Frequencies - Quarterly, Half Yearly
and Annual)
ICICI Prudential Floating Interest Fund
üNot Applicable
Any Amount
Daily Frequency: Rs. 250/- and in multiples of Rs. 1/-Weekly, Monthly and Quarterly Frequency: Rs. 1,000/- and in multiples of Rs. 1/-
Any Amount
Daily, Weekly, Fortnightly &Monthly Frequency: Rs. 100/- and in multiple of Rs. 1/-Quarterly Frequency: Rs. 5,000/- andin multiple of Rs. 1/-
(Frequencies - Daily, Weekly, Fortnightly, Monthly, Quarterly
and Others)
ICICI Prudential Short Term Fund ü
Not Applicable
Any Amount
Daily Frequency: Rs. 250/- and in multiples of Rs. 1/-Weekly, Monthly and Quarterly Frequency: Rs. 1,000/- and in multiples of Rs. 1/-
Any Amount
Daily, Weekly, Fortnightly &Monthly Frequency: Rs. 1,000/- and in multiple of Rs. 1/-Quarterly Frequency: Rs. 5,000/- and in multiple of Rs. 1/-
(Frequencies - Monthly, Fortnightly
and Half Yearly)
ICICI Prudential Bond Fund ü
Not Applicable
Any Amount
Daily Frequency: Rs. 250/- and in multiples of Rs. 1/-Weekly, Monthly and Quarterly Frequency: Rs. 1,000/- and in multiples of Rs. 1/-
Any Amount
Daily, Weekly, Fortnightly &Monthly Frequency: Rs. 1,000/- and in multiple of Rs. 1/-Quarterly Frequency: Rs. 5,000/- and in multiple of Rs. 1/-
(Frequencies - Monthly, Quarterly
and Half Yearly)
ICICI Prudential Medium Term Bond Fund
üNot Applicable
Any Amount
Daily Frequency: Rs. 250/- and in multiples of Rs. 1/-Weekly, Monthly and Quarterly Frequency: Rs. 1,000/- and in multiples of Rs. 1/-
Any Amount
Daily, Weekly, Fortnightly &Monthly Frequency: Rs. 1,000/- and in multiple of Rs. 1/-Quarterly Frequency: Rs. 5,000/- and in multiple of Rs. 1/-
(Frequencies - Quarterly, Half yearly
and Annual)
ICICI Prudential Long Term Bond Fund
üNot Applicable
Any Amount
Daily Frequency: Rs. 250/- and in multiples of Rs. 1/-Weekly, Monthly and Quarterly Frequency: Rs. 1,000/- and in multiples of Rs. 1/-
Any Amount
Daily, Weekly, Fortnightly &Monthly Frequency: Rs. 1,000/- and in multiple of Rs. 1/-Quarterly Frequency: Rs. 5,000/- and in multiple of Rs. 1/-
(Frequencies - Quarterly, Half yearly and Annual)
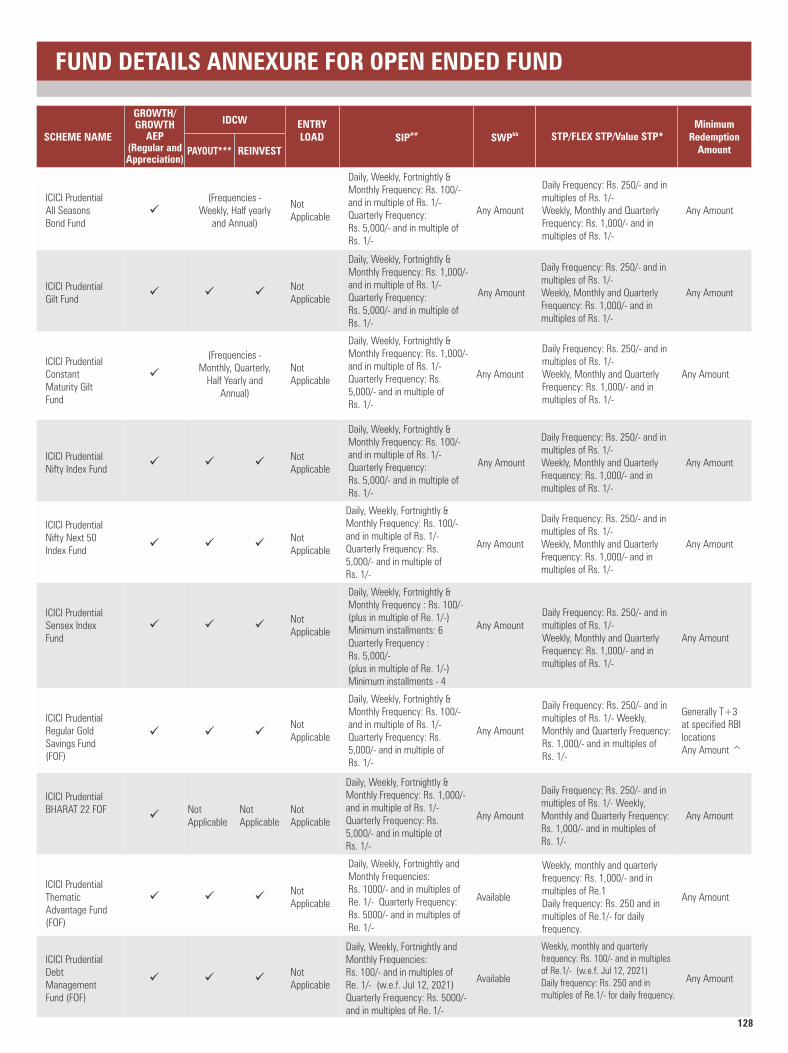
128
FUND DETAILS ANNEXURE FOR OPEN ENDED FUND
SCHEME NAME
GROWTH/ GROWTH
AEP (Regular and Appreciation)
IDCW
REINVEST
ENTRY LOAD
Minimum Redemption
Amount
&&SWP STP/FLEX STP/Value STP*##SIPPAYOUT***
ICICI Prudential BHARAT 22 FOF
üNot Applicable
Any Amount
Daily Frequency: Rs. 250/- and in multiples of Rs. 1/- Weekly, Monthly and Quarterly Frequency: Rs. 1,000/- and in multiples of Rs. 1/-
Any Amount
Daily, Weekly, Fortnightly &Monthly Frequency: Rs. 1,000/- and in multiple of Rs. 1/-Quarterly Frequency: Rs. 5,000/- and in multiple of Rs. 1/-
ICICI Prudential Regular Gold Savings Fund (FOF)
üNot Applicable
Any Amount
Daily Frequency: Rs. 250/- and in multiples of Rs. 1/- Weekly, Monthly and Quarterly Frequency: Rs. 1,000/- and in multiples of Rs. 1/-
Generally T+3 at specified RBI locations Any Amount ^
ü
Daily, Weekly, Fortnightly &Monthly Frequency: Rs. 100/- and in multiple of Rs. 1/-Quarterly Frequency: Rs. 5,000/- and in multiple of Rs. 1/-
ü
ICICI Prudential Sensex Index Fund
üNot Applicable
Any Amount Daily Frequency: Rs. 250/- and inmultiples of Rs. 1/-Weekly, Monthly and Quarterly Frequency: Rs. 1,000/- and in multiples of Rs. 1/-
Any Amountü
Daily, Weekly, Fortnightly &Monthly Frequency : Rs. 100/-(plus in multiple of Re. 1/-)Minimum installments: 6Quarterly Frequency : Rs. 5,000/-(plus in multiple of Re. 1/-)Minimum installments - 4
ü
ICICI Prudential Nifty Next 50 Index Fund
üNot Applicable
Any Amount
Daily Frequency: Rs. 250/- and in multiples of Rs. 1/-Weekly, Monthly and Quarterly Frequency: Rs. 1,000/- and in multiples of Rs. 1/-
Any Amount
Daily, Weekly, Fortnightly &Monthly Frequency: Rs. 100/- and in multiple of Rs. 1/-Quarterly Frequency: Rs. 5,000/- and in multiple of Rs. 1/-
ü ü
ICICI Prudential Constant Maturity Gilt Fund
üNot Applicable
Any Amount
Daily Frequency: Rs. 250/- and in multiples of Rs. 1/-Weekly, Monthly and Quarterly Frequency: Rs. 1,000/- and in multiples of Rs. 1/-
Any Amount
Daily, Weekly, Fortnightly &Monthly Frequency: Rs. 1,000/- and in multiple of Rs. 1/-Quarterly Frequency: Rs. 5,000/- and in multiple of Rs. 1/-
(Frequencies - Monthly, Quarterly,
Half Yearly and Annual)
ICICI Prudential Nifty Index Fund
üNot Applicable
Any Amount
Daily Frequency: Rs. 250/- and in multiples of Rs. 1/-Weekly, Monthly and Quarterly Frequency: Rs. 1,000/- and in multiples of Rs. 1/-
Any Amount
Daily, Weekly, Fortnightly &Monthly Frequency: Rs. 100/- and in multiple of Rs. 1/-Quarterly Frequency: Rs. 5,000/- and in multiple of Rs. 1/-
ü ü
Not Applicable
Not Applicable
ICICI Prudential Thematic Advantage Fund (FOF)
üNot Applicable
Available
Weekly, monthly and quarterly frequency: Rs. 1,000/- and in multiples of Re.1 Daily frequency: Rs. 250 and in multiples of Re.1/- for daily frequency.
Any Amountü
Daily, Weekly, Fortnightly and Monthly Frequencies: Rs. 1000/- and in multiples of Re. 1/- Quarterly Frequency: Rs. 5000/- and in multiples of Re. 1/-
ü
ICICI Prudential All Seasons Bond Fund
üNot Applicable
Any Amount
Daily Frequency: Rs. 250/- and in multiples of Rs. 1/-Weekly, Monthly and Quarterly Frequency: Rs. 1,000/- and in multiples of Rs. 1/-
Any Amount
Daily, Weekly, Fortnightly &Monthly Frequency: Rs. 100/- and in multiple of Rs. 1/-Quarterly Frequency: Rs. 5,000/- and in multiple of Rs. 1/-
(Frequencies - Weekly, Half yearly
and Annual)
ICICI Prudential Gilt Fund
ü üNot Applicable
Any Amount
Daily Frequency: Rs. 250/- and in multiples of Rs. 1/-Weekly, Monthly and Quarterly Frequency: Rs. 1,000/- and in multiples of Rs. 1/-
Any Amount
Daily, Weekly, Fortnightly &Monthly Frequency: Rs. 1,000/- and in multiple of Rs. 1/-Quarterly Frequency: Rs. 5,000/- and in multiple of Rs. 1/-
ü
ICICI Prudential Debt Management Fund (FOF)
üNot Applicable
Available
Weekly, monthly and quarterly frequency: Rs. 100/- and in multiples of Re.1/- (w.e.f. Jul 12, 2021)Daily frequency: Rs. 250 and in multiples of Re.1/- for daily frequency.
Any Amount
Daily, Weekly, Fortnightly and Monthly Frequencies: Rs. 100/- and in multiples of Re. 1/- (w.e.f. Jul 12, 2021)Quarterly Frequency: Rs. 5000/- and in multiples of Re. 1/-
ü ü
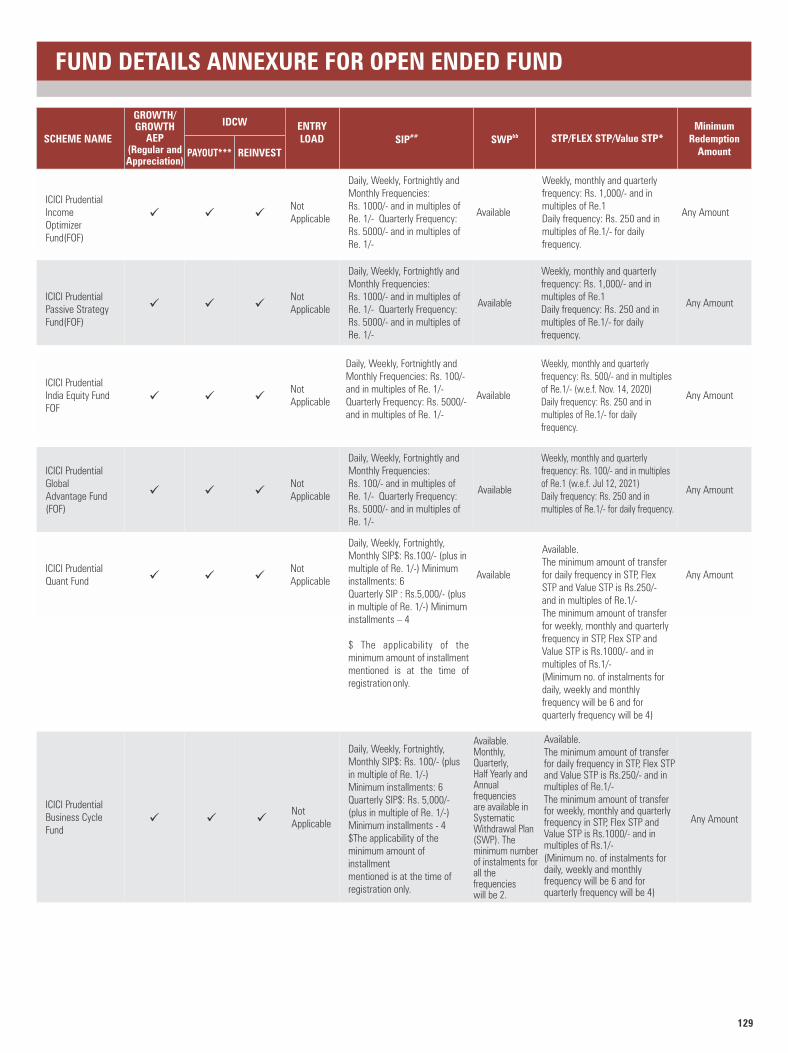
129
FUND DETAILS ANNEXURE FOR OPEN ENDED FUND
SCHEME NAME
GROWTH/ GROWTH
AEP (Regular and Appreciation)
IDCW
REINVEST
ENTRY LOAD
Minimum Redemption
Amount
&&SWP STP/FLEX STP/Value STP*##SIPPAYOUT***
ICICI Prudential Passive Strategy Fund(FOF)
üNot Applicable
Available
Weekly, monthly and quarterly frequency: Rs. 1,000/- and in multiples of Re.1 Daily frequency: Rs. 250 and in multiples of Re.1/- for daily frequency.
Any Amount
Daily, Weekly, Fortnightly and Monthly Frequencies: Rs. 1000/- and in multiples of Re. 1/- Quarterly Frequency: Rs. 5000/- and in multiples of Re. 1/-
ü ü
ICICI Prudential India Equity Fund FOF
üNot Applicable
Available
Weekly, monthly and quarterly frequency: Rs. 500/- and in multiples of Re.1/- (w.e.f. Nov. 14, 2020) Daily frequency: Rs. 250 and in multiples of Re.1/- for daily frequency.
Any Amount
Daily, Weekly, Fortnightly and Monthly Frequencies: Rs. 100/- and in multiples of Re. 1/- Quarterly Frequency: Rs. 5000/- and in multiples of Re. 1/-
ü ü
ICICI Prudential Global Advantage Fund (FOF)
üNot Applicable
Available Any Amount
Daily, Weekly, Fortnightly and Monthly Frequencies: Rs. 100/- and in multiples of Re. 1/- Quarterly Frequency: Rs. 5000/- and in multiples of Re. 1/-
ü ü
ICICI Prudential Income Optimizer Fund(FOF)
üNot Applicable
Available
Weekly, monthly and quarterly frequency: Rs. 1,000/- and in multiples of Re.1 Daily frequency: Rs. 250 and in multiples of Re.1/- for daily frequency.
Any Amountü
Daily, Weekly, Fortnightly and Monthly Frequencies: Rs. 1000/- and in multiples of Re. 1/- Quarterly Frequency: Rs. 5000/- and in multiples of Re. 1/-
ü
ICICI Prudential Quant Fund ü ü ü
Not Applicable
Available
Available.The minimum amount of transfer for daily frequency in STP, Flex STP and Value STP is Rs.250/- and in multiples of Re.1/-The minimum amount of transfer for weekly, monthly and quarterly frequency in STP, Flex STP and Value STP is Rs.1000/- and in multiples of Rs.1/- (Minimum no. of instalments for daily, weekly and monthly frequency will be 6 and for quarterly frequency will be 4)
Any Amount
Daily, Weekly, Fortnightly, Monthly SIP$: Rs.100/- (plus in multiple of Re. 1/-) Minimum installments: 6Quarterly SIP : Rs.5,000/- (plus in multiple of Re. 1/-) Minimum installments – 4
$ The applicability of the minimum amount of installment mentioned is at the time of registration only.
ICICI Prudential Business Cycle Fund
ü ü üNot Applicable Any Amount
Daily, Weekly, Fortnightly, Monthly SIP$: Rs. 100/- (plus in multiple of Re. 1/-) Minimum installments: 6Quarterly SIP$: Rs. 5,000/- (plus in multiple of Re. 1/-)Minimum installments - 4$The applicability of the minimum amount of installmentmentioned is at the time of registration only.
Available.The minimum amount of transfer for daily frequency in STP, Flex STP and Value STP is Rs.250/- and in multiples of Re.1/-The minimum amount of transfer for weekly, monthly and quarterly frequency in STP, Flex STP and Value STP is Rs.1000/- and in multiples of Rs.1/- (Minimum no. of instalments for daily, weekly and monthly frequency will be 6 and for quarterly frequency will be 4)
Available.Monthly, Quarterly, Half Yearly and Annual frequencies are available in Systematic Withdrawal Plan (SWP). The minimum number of instalments for all the frequencies will be 2.
Weekly, monthly and quarterly frequency: Rs. 100/- and in multiples of Re.1 (w.e.f. Jul 12, 2021) Daily frequency: Rs. 250 and in multiples of Re.1/- for daily frequency.
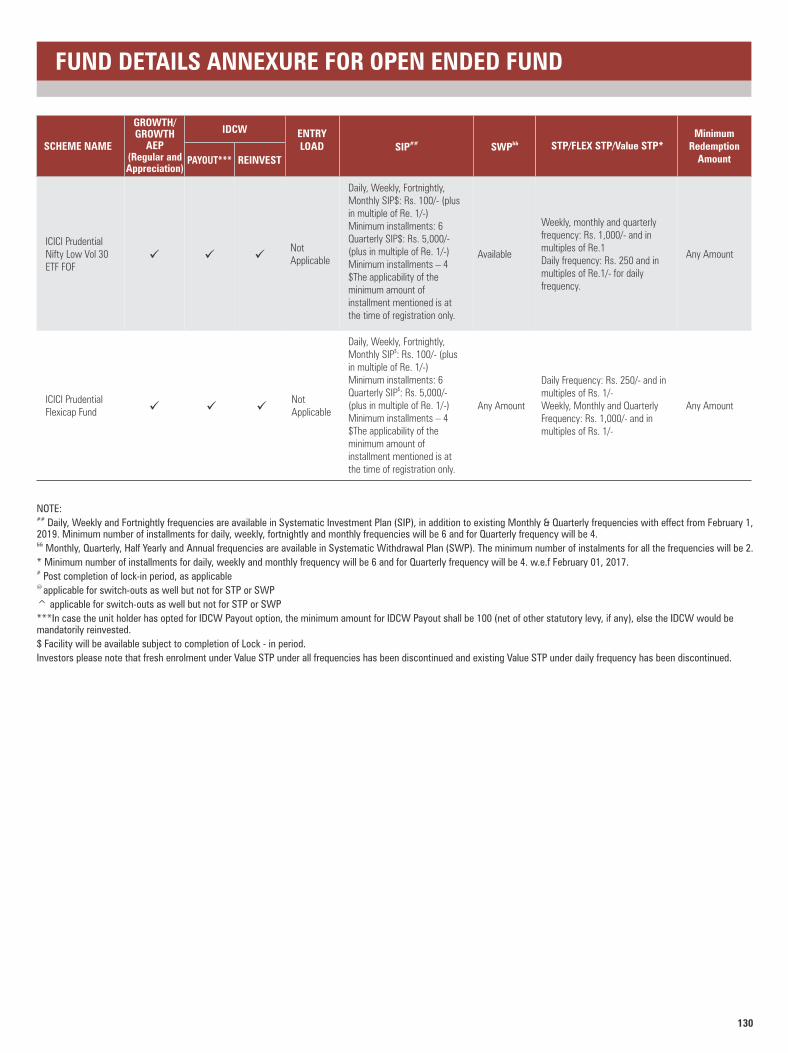
130
FUND DETAILS ANNEXURE FOR OPEN ENDED FUND
NOTE:## Daily, Weekly and Fortnightly frequencies are available in Systematic Investment Plan (SIP), in addition to existing Monthly & Quarterly frequencies with effect from February 1, 2019. Minimum number of installments for daily, weekly, fortnightly and monthly frequencies will be 6 and for Quarterly frequency will be 4.&& Monthly, Quarterly, Half Yearly and Annual frequencies are available in Systematic Withdrawal Plan (SWP). The minimum number of instalments for all the frequencies will be 2.
* Minimum number of installments for daily, weekly and monthly frequency will be 6 and for Quarterly frequency will be 4. w.e.f February 01, 2017.# Post completion of lock-in period, as applicable@ applicable for switch-outs as well but not for STP or SWP
^ applicable for switch-outs as well but not for STP or SWP
***In case the unit holder has opted for IDCW Payout option, the minimum amount for IDCW Payout shall be 100 (net of other statutory levy, if any), else the IDCW would be mandatorily reinvested.
$ Facility will be available subject to completion of Lock - in period.
Investors please note that fresh enrolment under Value STP under all frequencies has been discontinued and existing Value STP under daily frequency has been discontinued.
ICICI Prudential Nifty Low Vol 30 ETF FOF
üNot Applicable
Available
Weekly, monthly and quarterly frequency: Rs. 1,000/- and in multiples of Re.1 Daily frequency: Rs. 250 and in multiples of Re.1/- for daily frequency.
Any Amount
Daily, Weekly, Fortnightly, Monthly SIP$: Rs. 100/- (plus in multiple of Re. 1/-) Minimum installments: 6 Quarterly SIP$: Rs. 5,000/- (plus in multiple of Re. 1/-) Minimum installments – 4 $The applicability of the minimum amount of installment mentioned is at the time of registration only.
ü ü
SCHEME NAME
GROWTH/ GROWTH
AEP (Regular and Appreciation)
IDCW
REINVEST
ENTRY LOAD
Minimum Redemption
Amount
&&SWP STP/FLEX STP/Value STP*##SIPPAYOUT***
ICICI Prudential Flexicap Fund ü ü ü
Not Applicable
Any Amount
Daily Frequency: Rs. 250/- and in multiples of Rs. 1/- Weekly, Monthly and Quarterly Frequency: Rs. 1,000/- and in multiples of Rs. 1/-
Any Amount
Daily, Weekly, Fortnightly, $Monthly SIP : Rs. 100/- (plus
in multiple of Re. 1/-) Minimum installments: 6
$Quarterly SIP : Rs. 5,000/- (plus in multiple of Re. 1/-) Minimum installments – 4 $The applicability of the minimum amount of installment mentioned is at the time of registration only.
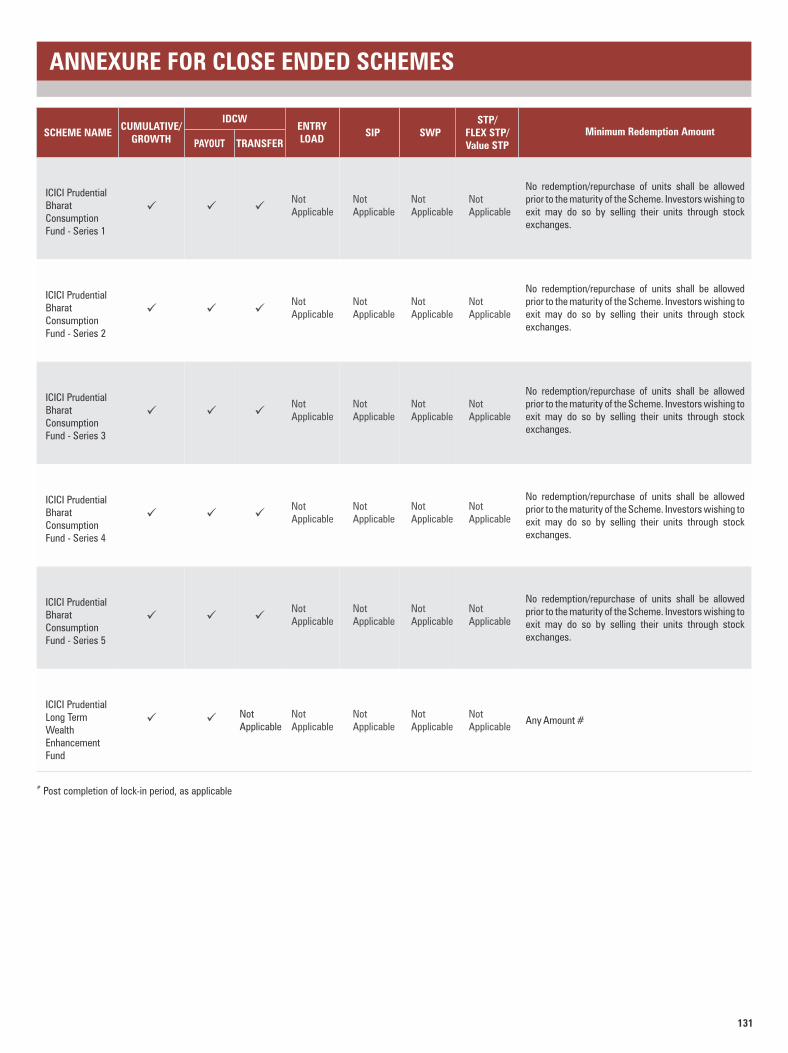
131
ANNEXURE FOR CLOSE ENDED SCHEMES
ICICI Prudential Bharat Consumption Fund - Series 1
üNot Applicable
No redemption/repurchase of units shall be allowed prior to the maturity of the Scheme. Investors wishing to exit may do so by selling their units through stock exchanges.
Not Applicable
Not Applicable
Not Applicableü ü
ICICI Prudential Bharat Consumption Fund - Series 2
üNot Applicable
No redemption/repurchase of units shall be allowed prior to the maturity of the Scheme. Investors wishing to exit may do so by selling their units through stock exchanges.
Not Applicable
Not Applicable
Not Applicableü ü
ICICI Prudential Bharat Consumption Fund - Series 3
üNot Applicable
No redemption/repurchase of units shall be allowed prior to the maturity of the Scheme. Investors wishing to exit may do so by selling their units through stock exchanges.
Not Applicable
Not Applicable
Not Applicableü ü
ICICI Prudential Bharat Consumption Fund - Series 4
üNot Applicable
No redemption/repurchase of units shall be allowed prior to the maturity of the Scheme. Investors wishing to exit may do so by selling their units through stock exchanges.
Not Applicable
Not Applicable
Not Applicableü ü
SCHEME NAMECUMULATIVE/
GROWTH
IDCW
TRANSFER
ENTRY LOAD
Minimum Redemption AmountSWPSTP/
FLEX STP/Value STP
SIPPAYOUT
ICICI Prudential Bharat Consumption Fund - Series 5
üNot Applicable
No redemption/repurchase of units shall be allowed prior to the maturity of the Scheme. Investors wishing to exit may do so by selling their units through stock exchanges.
Not Applicable
Not Applicable
Not Applicableü ü
ICICI Prudential Long Term Wealth Enhancement Fund
ü Not Applicable
Any Amount #Not Applicable
Not Applicable
Not Applicable
ü
# Post completion of lock-in period, as applicable
Not Applicable

132
ANNEXURE FOR RETURNS OF ALL THE SCHEMESReturns shown for Growth/IDCW Option wherever applicable as on 31 July, 2021
Scheme Name Inception Date^1 Year (CAGR%) 3 Year (CAGR%) 5 Year (CAGR%)
Nifty 200 TRI (65%) + Nifty Composite Debt Index (25%) + LBMA AM Fixing Prices (10%) (Benchmark)
Funds Managed by Manish Banthia & Akhil Kakkar
ICICI Prudential Credit Risk Fund 7.82 8.69 8.17 03-Dec-10
CRISIL Short Term Credit Risk Index (Benchmark) 8.34 9.54 8.77
CRISIL 10 Year Gilt Index (Additional Benchmark) 2.23 8.71 6.50
Funds Managed by Anish Tawakley, Ihab Dalwai, Manish Banthia & Lalit Kumar
ICICI Prudential Business Cycle Fund - - - 18-Jan-21
Nifty 500 TRI (Benchmark) - - -
Nifty 50 TRI (Additional Benchmark) - - -
Funds Managed by Anish Tawakley & Lalit Kumar
ICICI Prudential Bharat Consumption Fund - Series 1 52.63 14.52 - 11-Apr-18
Nifty India Consumption TRI (Benchmark) 30.90 7.99 -
Nifty 50 TRI (Additional Benchmark) 44.30 12.90 -
ICICI Prudential Bharat Consumption Fund - Series 3 60.05 16.38 - 17-Jul-18
Nifty India Consumption TRI (Benchmark) 30.90 7.99 -
Nifty 50 TRI (Additional Benchmark) 44.30 12.90 -
ICICI Prudential Manufacture in India Fund 64.69 - - 11-Oct-18
S&P BSE INDIA MANUFACTURING TRI (Benchmark) 38.78 - -
Nifty 50 TRI (Additional Benchmark) 44.30 - -
Funds Managed by Anish Tawakley, Rajat Chandak & Vaibhav Dusad
ICICI Prudential Bluechip Fund 46.28 12.29 13.21 23-May-08
Nifty 100 TRI (Benchmark) 44.76 12.61 14.06
Nifty 50 TRI (Additional Benchmark) 44.30 12.90 14.18
Funds Managed by Anish Tawakley & Vaibhav Dusad
ICICI Prudential MNC Fund 61.50 - - 17-Jun-19
Nifty MNC TRI (Benchmark) 33.03 - -
Nifty 50 TRI (Additional Benchmark) 44.30 - -
Funds Managed by Ashwin Jain, Manish Banthia & Anuj Tagra
ICICI Prudential Retirement Fund - Hybrid Conservative Plan 10.45 - - 27-Feb-19
Nifty 50 Hybrid Composite Debt 15:85 Index (Benchmark) 10.24 - -
Nifty 50 TRI (Additional Benchmark) 44.30 - -
CRISIL 10 Year Gilt Index (Additional Benchmark) 2.23 - -
ICICI Prudential Retirement Fund - Pure Equity Plan 50.48 - - 27-Feb-19
Nifty 500 TRI (Benchmark) 53.07 - -
Nifty 50 TRI (Additional Benchmark) 44.30 - -
ICICI Prudential Retirement Fund - Hybrid Aggressive Plan 36.78 - - 27-Feb-19
CRISIL Hybrid 35+65 - Aggressive Index (Benchmark) 32.19 - -
Nifty 50 TRI (Additional Benchmark) 44.30 - -
Funds Managed by Anuj Tagra, Chandni Gupta & Rahul Goswami
ICICI Prudential Corporate Bond Fund 4.86 8.50 7.77 05-Apr-11
CRISIL AAA Short Term Bond Index (Benchmark) 5.70 8.94 8.16
CRISIL 10 Year Gilt Index (Additional Benchmark) 2.23 8.71 6.50
Funds Managed by Sankaran Naren, Ihab Dalwai, Anuj Tagra & Gaurav Chikane
ICICI Prudential Multi-Asset Fund 42.83 13.52 13.28 31-Oct-02
30.16 13.31 13.56
Nifty 50 TRI (Additional Benchmark) 44.30 12.90 14.18
Funds Managed by Manish Banthia & Anuj Tagra
ICICI Prudential All Seasons Bond Fund 5.28 9.17 8.35 20-Jan-10
Nifty Composite Debt Index (Benchmark) 4.90 9.85 7.99
CRISIL 10 Year Gilt Index (Additional Benchmark) 2.23 8.71 6.50
ICICI Prudential Retirement Fund - Pure Debt Plan 3.99 - - 27-Feb-19
Nifty Composite Debt Index (Benchmark) 4.90 - -
Nifty 50 TRI (Additional Benchmark) 44.30 - -
CRISIL 10 Year Gilt Index (Additional Benchmark) 2.23 - -
ICICI Prudential Long Term Bond Fund 0.49 9.03 7.59 09-Jul-98
Nifty Long Duration Debt Index (Benchmark) 3.10 10.35 7.82
CRISIL 10 Year Gilt Index (Additional Benchmark) 2.23 8.71 6.50
Funds Managed by Rahul Goswami & Anuj Tagra
ICICI Prudential Constant Maturity Gilt Fund 3.39 11.21 8.98 12-Sep-14
CRISIL 10 Year Gilt Index (Benchmark) 2.23 8.71 6.50
ICICI Prudential Gilt Fund 2.99 9.37 8.01 19-Aug-99
CRISIL Dynamic Gilt Index (Benchmark) 3.21 9.53 7.51
CRISIL 10 Year Gilt Index (Additional Benchmark) 2.23 8.71 6.50
Funds Managed by Ashwin Jain, Manish Banthia & Ritesh lunawat
ICICI Prudential Child Care Fund (Gift Plan) 34.67 9.76 9.62 31-Aug-01
NIFTY 50 Hybrid Composite Debt 65:35 Index (Benchmark) 29.47 12.64 12.55
Nifty 50 TRI (Additional Benchmark) 44.30 12.90 14.18
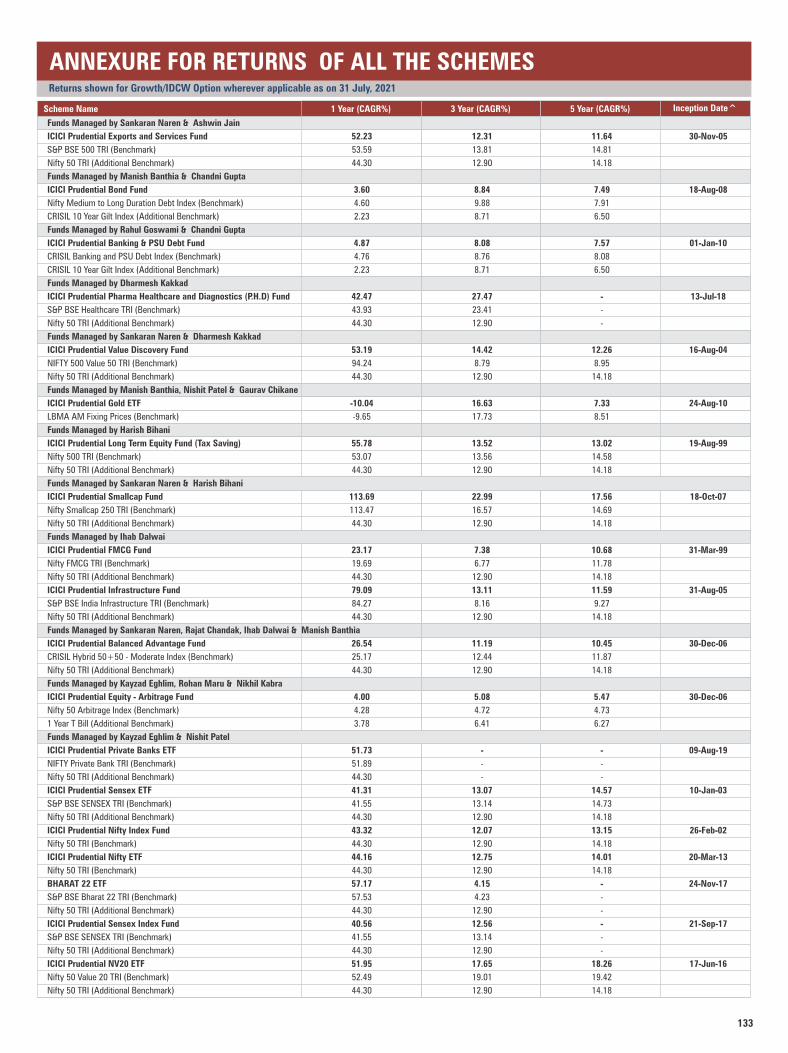
133
ANNEXURE FOR RETURNS OF ALL THE SCHEMESReturns shown for Growth/IDCW Option wherever applicable as on 31 July, 2021
Scheme Name Inception Date^1 Year (CAGR%) 3 Year (CAGR%) 5 Year (CAGR%)
Funds Managed by Sankaran Naren & Ashwin Jain
ICICI Prudential Exports and Services Fund 52.23 12.31 11.64 30-Nov-05
S&P BSE 500 TRI (Benchmark) 53.59 13.81 14.81
Nifty 50 TRI (Additional Benchmark) 44.30 12.90 14.18
Funds Managed by Manish Banthia & Chandni Gupta
ICICI Prudential Bond Fund 3.60 8.84 7.49 18-Aug-08
Nifty Medium to Long Duration Debt Index (Benchmark) 4.60 9.88 7.91
CRISIL 10 Year Gilt Index (Additional Benchmark) 2.23 8.71 6.50
Funds Managed by Rahul Goswami & Chandni Gupta
ICICI Prudential Banking & PSU Debt Fund 4.87 8.08 7.57 01-Jan-10
CRISIL Banking and PSU Debt Index (Benchmark) 4.76 8.76 8.08
CRISIL 10 Year Gilt Index (Additional Benchmark) 2.23 8.71 6.50
Funds Managed by Dharmesh Kakkad
ICICI Prudential Pharma Healthcare and Diagnostics (P.H.D) Fund 42.47 27.47 - 13-Jul-18
S&P BSE Healthcare TRI (Benchmark) 43.93 23.41 -
Nifty 50 TRI (Additional Benchmark) 44.30 12.90 -
Funds Managed by Sankaran Naren & Dharmesh Kakkad
ICICI Prudential Value Discovery Fund 53.19 14.42 12.26 16-Aug-04
NIFTY 500 Value 50 TRI (Benchmark) 94.24 8.79 8.95
Nifty 50 TRI (Additional Benchmark) 44.30 12.90 14.18
Funds Managed by Manish Banthia, Nishit Patel & Gaurav Chikane
ICICI Prudential Gold ETF -10.04 16.63 7.33 24-Aug-10
LBMA AM Fixing Prices (Benchmark) -9.65 17.73 8.51
Funds Managed by Harish Bihani
ICICI Prudential Long Term Equity Fund (Tax Saving) 55.78 13.52 13.02 19-Aug-99
Nifty 500 TRI (Benchmark) 53.07 13.56 14.58
Nifty 50 TRI (Additional Benchmark) 44.30 12.90 14.18
Funds Managed by Sankaran Naren & Harish Bihani
ICICI Prudential Smallcap Fund 113.69 22.99 17.56 18-Oct-07
Nifty Smallcap 250 TRI (Benchmark) 113.47 16.57 14.69
Nifty 50 TRI (Additional Benchmark) 44.30 12.90 14.18
Funds Managed by Ihab Dalwai
ICICI Prudential FMCG Fund 23.17 7.38 10.68 31-Mar-99
Nifty FMCG TRI (Benchmark) 19.69 6.77 11.78
Nifty 50 TRI (Additional Benchmark) 44.30 12.90 14.18
ICICI Prudential Infrastructure Fund 79.09 13.11 11.59 31-Aug-05
S&P BSE India Infrastructure TRI (Benchmark) 84.27 8.16 9.27
Nifty 50 TRI (Additional Benchmark) 44.30 12.90 14.18
Funds Managed by Sankaran Naren, Rajat Chandak, Ihab Dalwai & Manish Banthia
ICICI Prudential Balanced Advantage Fund 26.54 11.19 10.45 30-Dec-06
CRISIL Hybrid 50+50 - Moderate Index (Benchmark) 25.17 12.44 11.87
Nifty 50 TRI (Additional Benchmark) 44.30 12.90 14.18
Funds Managed by Kayzad Eghlim, Rohan Maru & Nikhil Kabra
ICICI Prudential Equity - Arbitrage Fund 4.00 5.08 5.47 30-Dec-06
Nifty 50 Arbitrage Index (Benchmark) 4.28 4.72 4.73
1 Year T Bill (Additional Benchmark) 3.78 6.41 6.27
Funds Managed by Kayzad Eghlim & Nishit Patel
ICICI Prudential Private Banks ETF 51.73 - - 09-Aug-19
NIFTY Private Bank TRI (Benchmark) 51.89 - -
Nifty 50 TRI (Additional Benchmark) 44.30 - -
ICICI Prudential Sensex ETF 41.31 13.07 14.57 10-Jan-03
S&P BSE SENSEX TRI (Benchmark) 41.55 13.14 14.73
Nifty 50 TRI (Additional Benchmark) 44.30 12.90 14.18
ICICI Prudential Nifty Index Fund 43.32 12.07 13.15 26-Feb-02
Nifty 50 TRI (Benchmark) 44.30 12.90 14.18
ICICI Prudential Nifty ETF 44.16 12.75 14.01 20-Mar-13
Nifty 50 TRI (Benchmark) 44.30 12.90 14.18
BHARAT 22 ETF 57.17 4.15 - 24-Nov-17
S&P BSE Bharat 22 TRI (Benchmark) 57.53 4.23 -
Nifty 50 TRI (Additional Benchmark) 44.30 12.90 -
ICICI Prudential Sensex Index Fund 40.56 12.56 - 21-Sep-17
S&P BSE SENSEX TRI (Benchmark) 41.55 13.14 -
Nifty 50 TRI (Additional Benchmark) 44.30 12.90 -
ICICI Prudential NV20 ETF 51.95 17.65 18.26 17-Jun-16
Nifty 50 Value 20 TRI (Benchmark) 52.49 19.01 19.42
Nifty 50 TRI (Additional Benchmark) 44.30 12.90 14.18
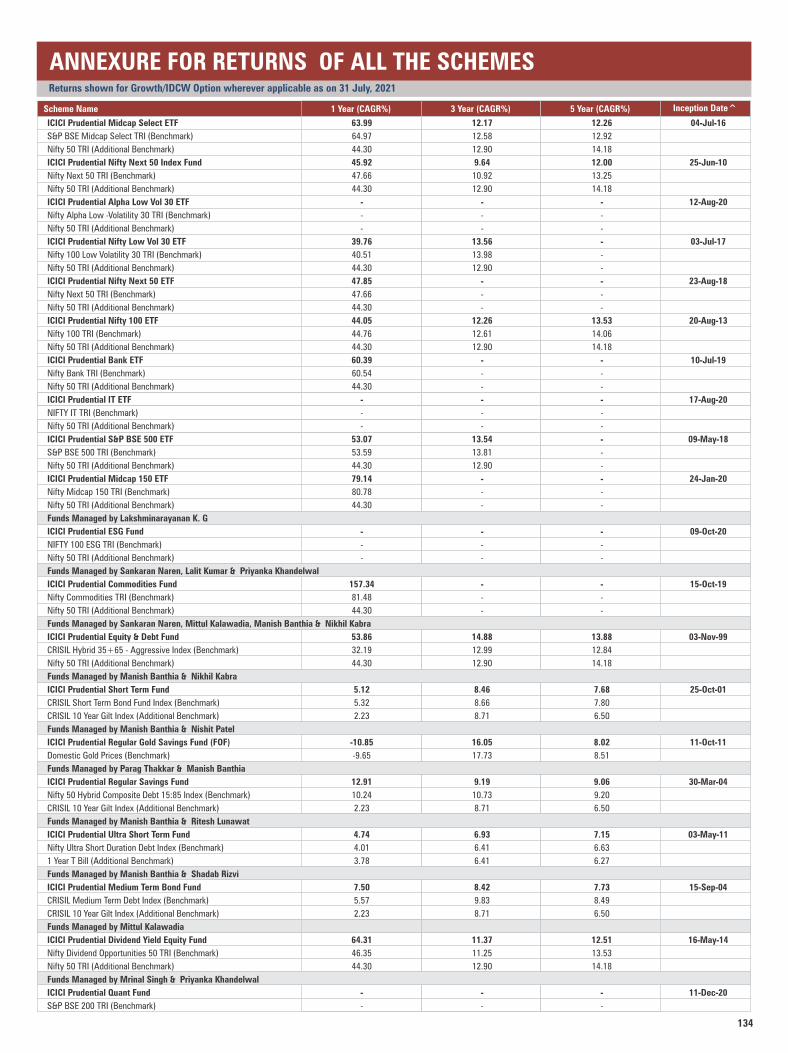
134
ANNEXURE FOR RETURNS OF ALL THE SCHEMESReturns shown for Growth/IDCW Option wherever applicable as on 31 July, 2021
Scheme Name Inception Date^1 Year (CAGR%) 3 Year (CAGR%) 5 Year (CAGR%)
ICICI Prudential Midcap Select ETF 63.99 12.17 12.26 04-Jul-16
S&P BSE Midcap Select TRI (Benchmark) 64.97 12.58 12.92
Nifty 50 TRI (Additional Benchmark) 44.30 12.90 14.18
ICICI Prudential Nifty Next 50 Index Fund 45.92 9.64 12.00 25-Jun-10
Nifty Next 50 TRI (Benchmark) 47.66 10.92 13.25
Nifty 50 TRI (Additional Benchmark) 44.30 12.90 14.18
ICICI Prudential Alpha Low Vol 30 ETF - - - 12-Aug-20
Nifty Alpha Low -Volatility 30 TRI (Benchmark) - - -
Nifty 50 TRI (Additional Benchmark) - - -
ICICI Prudential Nifty Low Vol 30 ETF 39.76 13.56 - 03-Jul-17
Nifty 100 Low Volatility 30 TRI (Benchmark) 40.51 13.98 -
Nifty 50 TRI (Additional Benchmark) 44.30 12.90 -
ICICI Prudential Nifty Next 50 ETF 47.85 - - 23-Aug-18
Nifty Next 50 TRI (Benchmark) 47.66 - -
Nifty 50 TRI (Additional Benchmark) 44.30 - -
ICICI Prudential Nifty 100 ETF 44.05 12.26 13.53 20-Aug-13
Nifty 100 TRI (Benchmark) 44.76 12.61 14.06
Nifty 50 TRI (Additional Benchmark) 44.30 12.90 14.18
ICICI Prudential Bank ETF 60.39 - - 10-Jul-19
Nifty Bank TRI (Benchmark) 60.54 - -
Nifty 50 TRI (Additional Benchmark) 44.30 - -
ICICI Prudential IT ETF - - - 17-Aug-20
NIFTY IT TRI (Benchmark) - - -
Nifty 50 TRI (Additional Benchmark) - - -
ICICI Prudential S&P BSE 500 ETF 53.07 13.54 - 09-May-18
S&P BSE 500 TRI (Benchmark) 53.59 13.81 -
Nifty 50 TRI (Additional Benchmark) 44.30 12.90 -
ICICI Prudential Midcap 150 ETF 79.14 - - 24-Jan-20
Nifty Midcap 150 TRI (Benchmark) 80.78 - -
Nifty 50 TRI (Additional Benchmark) 44.30 - -
Funds Managed by Lakshminarayanan K. G
ICICI Prudential ESG Fund - - - 09-Oct-20
NIFTY 100 ESG TRI (Benchmark) - - -
Nifty 50 TRI (Additional Benchmark) - - -
Funds Managed by Sankaran Naren, Lalit Kumar & Priyanka Khandelwal
ICICI Prudential Commodities Fund 157.34 - - 15-Oct-19
Nifty Commodities TRI (Benchmark) 81.48 - -
Nifty 50 TRI (Additional Benchmark) 44.30 - -
Funds Managed by Sankaran Naren, Mittul Kalawadia, Manish Banthia & Nikhil Kabra
ICICI Prudential Equity & Debt Fund 53.86 14.88 13.88 03-Nov-99
CRISIL Hybrid 35+65 - Aggressive Index (Benchmark) 32.19 12.99 12.84
Nifty 50 TRI (Additional Benchmark) 44.30 12.90 14.18
Funds Managed by Manish Banthia & Nikhil Kabra
ICICI Prudential Short Term Fund 5.12 8.46 7.68 25-Oct-01
CRISIL Short Term Bond Fund Index (Benchmark) 5.32 8.66 7.80
CRISIL 10 Year Gilt Index (Additional Benchmark) 2.23 8.71 6.50
Funds Managed by Manish Banthia & Nishit Patel
ICICI Prudential Regular Gold Savings Fund (FOF) -10.85 16.05 8.02 11-Oct-11
Domestic Gold Prices (Benchmark) -9.65 17.73 8.51
Funds Managed by Parag Thakkar & Manish Banthia
ICICI Prudential Regular Savings Fund 12.91 9.19 9.06 30-Mar-04
Nifty 50 Hybrid Composite Debt 15:85 Index (Benchmark) 10.24 10.73 9.20
CRISIL 10 Year Gilt Index (Additional Benchmark) 2.23 8.71 6.50
Funds Managed by Manish Banthia & Ritesh Lunawat
ICICI Prudential Ultra Short Term Fund 4.74 6.93 7.15 03-May-11
Nifty Ultra Short Duration Debt Index (Benchmark) 4.01 6.41 6.63
1 Year T Bill (Additional Benchmark) 3.78 6.41 6.27
Funds Managed by Manish Banthia & Shadab Rizvi
ICICI Prudential Medium Term Bond Fund 7.50 8.42 7.73 15-Sep-04
CRISIL Medium Term Debt Index (Benchmark) 5.57 9.83 8.49
CRISIL 10 Year Gilt Index (Additional Benchmark) 2.23 8.71 6.50
Funds Managed by Mittul Kalawadia
ICICI Prudential Dividend Yield Equity Fund 64.31 11.37 12.51 16-May-14
Nifty Dividend Opportunities 50 TRI (Benchmark) 46.35 11.25 13.53
Nifty 50 TRI (Additional Benchmark) 44.30 12.90 14.18
Funds Managed by Mrinal Singh & Priyanka Khandelwal
ICICI Prudential Quant Fund - - - 11-Dec-20
S&P BSE 200 TRI (Benchmark) - - -
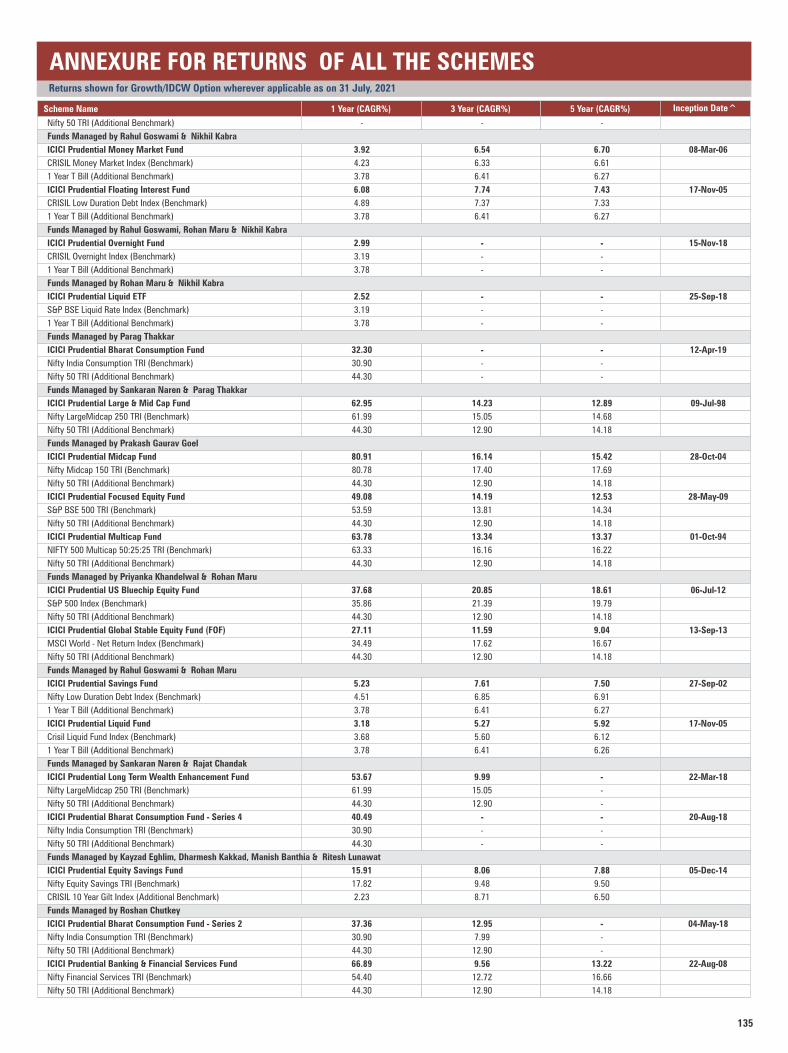
135
ANNEXURE FOR RETURNS OF ALL THE SCHEMESReturns shown for Growth/IDCW Option wherever applicable as on 31 July, 2021
Scheme Name Inception Date^1 Year (CAGR%) 3 Year (CAGR%) 5 Year (CAGR%)
Nifty 50 TRI (Additional Benchmark) - - -
Funds Managed by Rahul Goswami & Nikhil Kabra
ICICI Prudential Money Market Fund 3.92 6.54 6.70 08-Mar-06
CRISIL Money Market Index (Benchmark) 4.23 6.33 6.61
1 Year T Bill (Additional Benchmark) 3.78 6.41 6.27
ICICI Prudential Floating Interest Fund 6.08 7.74 7.43 17-Nov-05
CRISIL Low Duration Debt Index (Benchmark) 4.89 7.37 7.33
1 Year T Bill (Additional Benchmark) 3.78 6.41 6.27
Funds Managed by Rahul Goswami, Rohan Maru & Nikhil Kabra
ICICI Prudential Overnight Fund 2.99 - - 15-Nov-18
CRISIL Overnight Index (Benchmark) 3.19 - -
1 Year T Bill (Additional Benchmark) 3.78 - -
Funds Managed by Rohan Maru & Nikhil Kabra
ICICI Prudential Liquid ETF 2.52 - - 25-Sep-18
S&P BSE Liquid Rate Index (Benchmark) 3.19 - -
1 Year T Bill (Additional Benchmark) 3.78 - -
Funds Managed by Parag Thakkar
ICICI Prudential Bharat Consumption Fund 32.30 - - 12-Apr-19
Nifty India Consumption TRI (Benchmark) 30.90 - -
Nifty 50 TRI (Additional Benchmark) 44.30 - -
Funds Managed by Sankaran Naren & Parag Thakkar
ICICI Prudential Large & Mid Cap Fund 62.95 14.23 12.89 09-Jul-98
Nifty LargeMidcap 250 TRI (Benchmark) 61.99 15.05 14.68
Nifty 50 TRI (Additional Benchmark) 44.30 12.90 14.18
Funds Managed by Prakash Gaurav Goel
ICICI Prudential Midcap Fund 80.91 16.14 15.42 28-Oct-04
Nifty Midcap 150 TRI (Benchmark) 80.78 17.40 17.69
Nifty 50 TRI (Additional Benchmark) 44.30 12.90 14.18
ICICI Prudential Focused Equity Fund 49.08 14.19 12.53 28-May-09
S&P BSE 500 TRI (Benchmark) 53.59 13.81 14.34
Nifty 50 TRI (Additional Benchmark) 44.30 12.90 14.18
ICICI Prudential Multicap Fund 63.78 13.34 13.37 01-Oct-94
NIFTY 500 Multicap 50:25:25 TRI (Benchmark) 63.33 16.16 16.22
Nifty 50 TRI (Additional Benchmark) 44.30 12.90 14.18
Funds Managed by Priyanka Khandelwal & Rohan Maru
ICICI Prudential US Bluechip Equity Fund 37.68 20.85 18.61 06-Jul-12
S&P 500 Index (Benchmark) 35.86 21.39 19.79
Nifty 50 TRI (Additional Benchmark) 44.30 12.90 14.18
ICICI Prudential Global Stable Equity Fund (FOF) 27.11 11.59 9.04 13-Sep-13
MSCI World - Net Return Index (Benchmark) 34.49 17.62 16.67
Nifty 50 TRI (Additional Benchmark) 44.30 12.90 14.18
Funds Managed by Rahul Goswami & Rohan Maru
ICICI Prudential Savings Fund 5.23 7.61 7.50 27-Sep-02
Nifty Low Duration Debt Index (Benchmark) 4.51 6.85 6.91
1 Year T Bill (Additional Benchmark) 3.78 6.41 6.27
ICICI Prudential Liquid Fund 3.18 5.27 5.92 17-Nov-05
Crisil Liquid Fund Index (Benchmark) 3.68 5.60 6.12
1 Year T Bill (Additional Benchmark) 3.78 6.41 6.26
Funds Managed by Sankaran Naren & Rajat Chandak
ICICI Prudential Long Term Wealth Enhancement Fund 53.67 9.99 - 22-Mar-18
Nifty LargeMidcap 250 TRI (Benchmark) 61.99 15.05 -
Nifty 50 TRI (Additional Benchmark) 44.30 12.90 -
ICICI Prudential Bharat Consumption Fund - Series 4 40.49 - - 20-Aug-18
Nifty India Consumption TRI (Benchmark) 30.90 - -
Nifty 50 TRI (Additional Benchmark) 44.30 - -
Funds Managed by Kayzad Eghlim, Dharmesh Kakkad, Manish Banthia & Ritesh Lunawat
ICICI Prudential Equity Savings Fund 15.91 8.06 7.88 05-Dec-14
Nifty Equity Savings TRI (Benchmark) 17.82 9.48 9.50
CRISIL 10 Year Gilt Index (Additional Benchmark) 2.23 8.71 6.50
Funds Managed by Roshan Chutkey
ICICI Prudential Bharat Consumption Fund - Series 2 37.36 12.95 - 04-May-18
Nifty India Consumption TRI (Benchmark) 30.90 7.99 -
Nifty 50 TRI (Additional Benchmark) 44.30 12.90 -
ICICI Prudential Banking & Financial Services Fund 66.89 9.56 13.22 22-Aug-08
Nifty Financial Services TRI (Benchmark) 54.40 12.72 16.66
Nifty 50 TRI (Additional Benchmark) 44.30 12.90 14.18
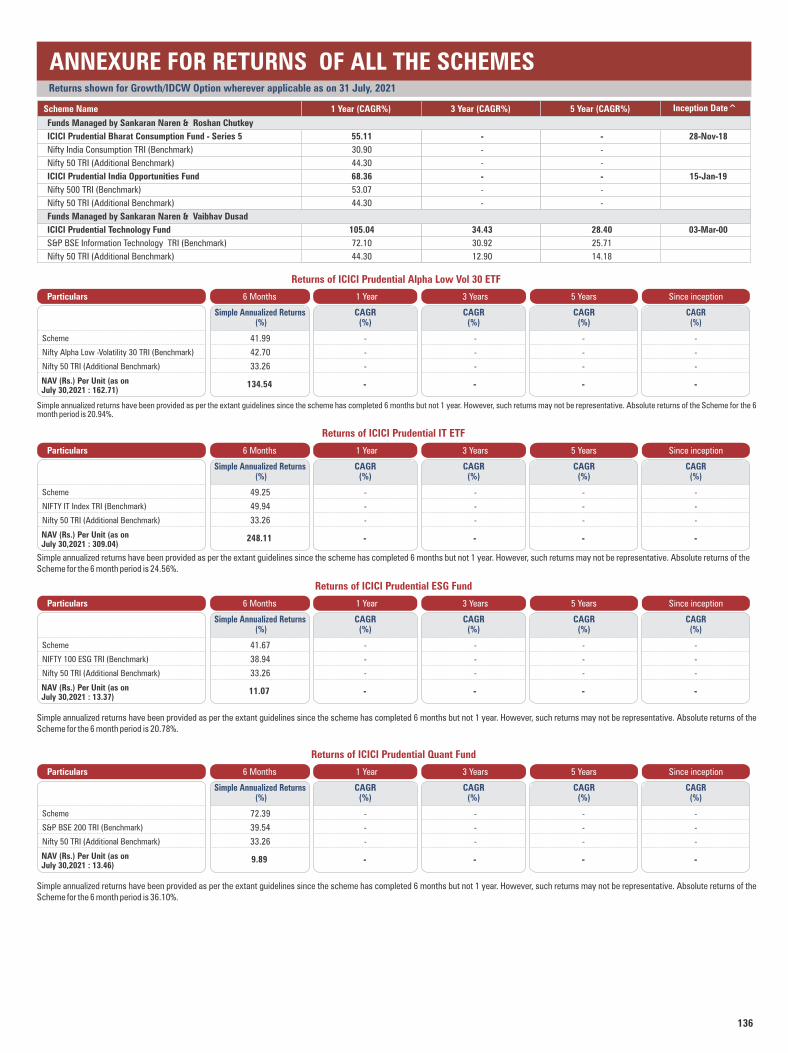
136
ANNEXURE FOR RETURNS OF ALL THE SCHEMES
Scheme Name Inception Date^1 Year (CAGR%) 3 Year (CAGR%) 5 Year (CAGR%)
Returns shown for Growth/IDCW Option wherever applicable as on 31 July, 2021
Returns of ICICI Prudential Alpha Low Vol 30 ETF
1 Year 3 Years 5 Years Since inceptionParticulars
- -
CAGR (%)
CAGR (%)
CAGR (%)
- -
Scheme
Nifty Alpha Low -Volatility 30 TRI (Benchmark)
Nifty 50 TRI (Additional Benchmark)
NAV (Rs.) Per Unit (as on July 30,2021 : 162.71)
6 Months
Simple Annualized Returns (%)
41.99 - - - -
42.70 - - - -
33.26 - - - -
134.54
CAGR (%)
Returns of ICICI Prudential IT ETF
1 Year 3 Years 5 Years Since inceptionParticulars
- -
CAGR (%)
CAGR (%)
CAGR (%)
- -
Scheme
NIFTY IT Index TRI (Benchmark)
Nifty 50 TRI (Additional Benchmark)
NAV (Rs.) Per Unit (as on July 30,2021 : 309.04)
6 Months
Simple Annualized Returns (%)
49.25 - - - -
49.94 - - - -
33.26 - - - -
248.11
CAGR (%)
Simple annualized returns have been provided as per the extant guidelines since the scheme has completed 6 months but not 1 year. However, such returns may not be representative. Absolute returns of the Scheme for the 6 month period is 20.94%.
Simple annualized returns have been provided as per the extant guidelines since the scheme has completed 6 months but not 1 year. However, such returns may not be representative. Absolute returns of the Scheme for the 6 month period is 20.78%.
Returns of ICICI Prudential ESG Fund
1 Year 3 Years 5 Years Since inceptionParticulars
- -
CAGR (%)
CAGR (%)
CAGR (%)
- -
Scheme
NIFTY 100 ESG TRI (Benchmark)
Nifty 50 TRI (Additional Benchmark)
NAV (Rs.) Per Unit (as on July 30,2021 : 13.37)
6 Months
Simple Annualized Returns (%)
41.67 - - - -
38.94 - - - -
33.26 - - - -
11.07
CAGR (%)
Simple annualized returns have been provided as per the extant guidelines since the scheme has completed 6 months but not 1 year. However, such returns may not be representative. Absolute returns of the Scheme for the 6 month period is 24.56%.
Simple annualized returns have been provided as per the extant guidelines since the scheme has completed 6 months but not 1 year. However, such returns may not be representative. Absolute returns of the Scheme for the 6 month period is 36.10%.
Returns of ICICI Prudential Quant Fund
1 Year 3 Years 5 Years Since inceptionParticulars
- -
CAGR (%)
CAGR (%)
CAGR (%)
- -
Scheme
S&P BSE 200 TRI (Benchmark)
Nifty 50 TRI (Additional Benchmark)
NAV (Rs.) Per Unit (as on July 30,2021 : 13.46)
6 Months
Simple Annualized Returns (%)
72.39 - - - -
39.54 - - - -
33.26 - - - -
9.89
CAGR (%)
Funds Managed by Sankaran Naren & Roshan Chutkey
ICICI Prudential Bharat Consumption Fund - Series 5 55.11 - - 28-Nov-18
Nifty India Consumption TRI (Benchmark) 30.90 - -
Nifty 50 TRI (Additional Benchmark) 44.30 - -
ICICI Prudential India Opportunities Fund 68.36 - - 15-Jan-19
Nifty 500 TRI (Benchmark) 53.07 - -
Nifty 50 TRI (Additional Benchmark) 44.30 - -
Funds Managed by Sankaran Naren & Vaibhav Dusad
ICICI Prudential Technology Fund 105.04 34.43 28.40 03-Mar-00
S&P BSE Information Technology TRI (Benchmark) 72.10 30.92 25.71
Nifty 50 TRI (Additional Benchmark) 44.30 12.90 14.18
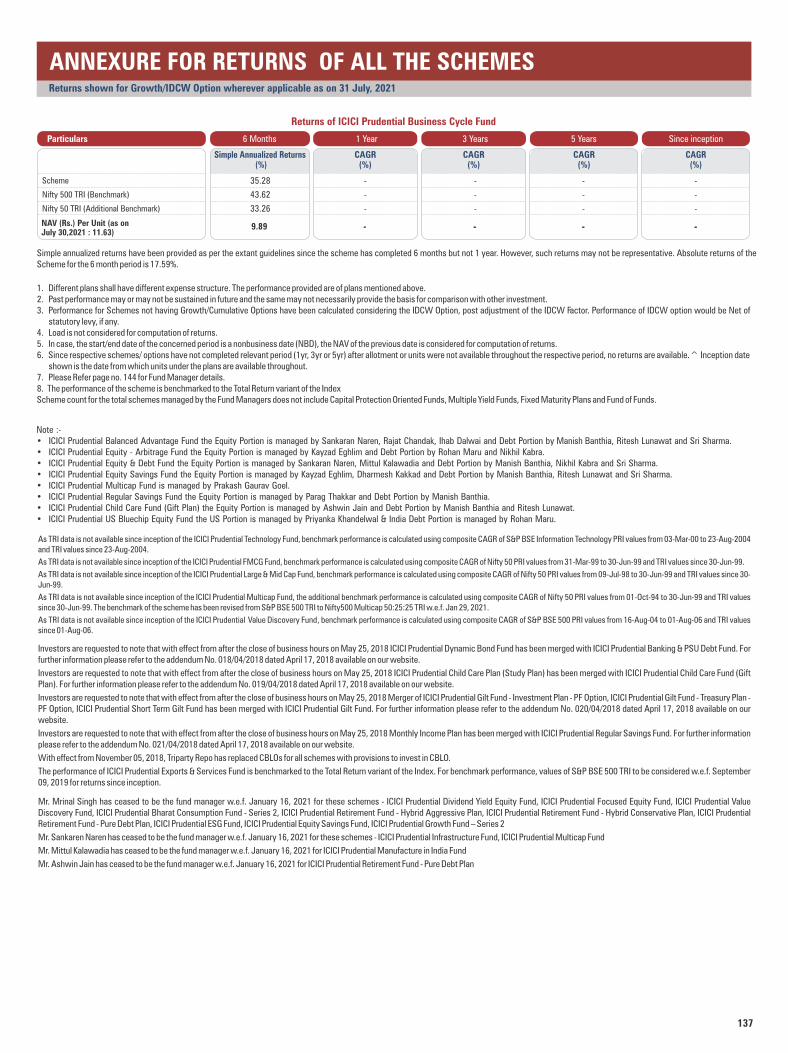
137
Investors are requested to note that with effect from after the close of business hours on May 25, 2018 ICICI Prudential Dynamic Bond Fund has been merged with ICICI Prudential Banking & PSU Debt Fund. For further information please refer to the addendum No. 018/04/2018 dated April 17, 2018 available on our website.
Investors are requested to note that with effect from after the close of business hours on May 25, 2018 ICICI Prudential Child Care Plan (Study Plan) has been merged with ICICI Prudential Child Care Fund (Gift Plan). For further information please refer to the addendum No. 019/04/2018 dated April 17, 2018 available on our website.
Investors are requested to note that with effect from after the close of business hours on May 25, 2018 Merger of ICICI Prudential Gilt Fund - Investment Plan - PF Option, ICICI Prudential Gilt Fund - Treasury Plan - PF Option, ICICI Prudential Short Term Gilt Fund has been merged with ICICI Prudential Gilt Fund. For further information please refer to the addendum No. 020/04/2018 dated April 17, 2018 available on our website.
Investors are requested to note that with effect from after the close of business hours on May 25, 2018 Monthly Income Plan has been merged with ICICI Prudential Regular Savings Fund. For further information please refer to the addendum No. 021/04/2018 dated April 17, 2018 available on our website.
With effect from November 05, 2018, Triparty Repo has replaced CBLOs for all schemes with provisions to invest in CBLO.
The performance of ICICI Prudential Exports & Services Fund is benchmarked to the Total Return variant of the Index. For benchmark performance, values of S&P BSE 500 TRI to be considered w.e.f. September 09, 2019 for returns since inception.
Mr. Mrinal Singh has ceased to be the fund manager w.e.f. January 16, 2021 for these schemes - ICICI Prudential Dividend Yield Equity Fund, ICICI Prudential Focused Equity Fund, ICICI Prudential Value Discovery Fund, ICICI Prudential Bharat Consumption Fund - Series 2, ICICI Prudential Retirement Fund - Hybrid Aggressive Plan, ICICI Prudential Retirement Fund - Hybrid Conservative Plan, ICICI Prudential Retirement Fund - Pure Debt Plan, ICICI Prudential ESG Fund, ICICI Prudential Equity Savings Fund, ICICI Prudential Growth Fund – Series 2
Mr. Sankaren Naren has ceased to be the fund manager w.e.f. January 16, 2021 for these schemes - ICICI Prudential Infrastructure Fund, ICICI Prudential Multicap Fund
Mr. Mittul Kalawadia has ceased to be the fund manager w.e.f. January 16, 2021 for ICICI Prudential Manufacture in India Fund
Mr. Ashwin Jain has ceased to be the fund manager w.e.f. January 16, 2021 for ICICI Prudential Retirement Fund - Pure Debt Plan
ANNEXURE FOR RETURNS OF ALL THE SCHEMESReturns shown for Growth/IDCW Option wherever applicable as on 31 July, 2021
As TRI data is not available since inception of the ICICI Prudential Technology Fund, benchmark performance is calculated using composite CAGR of S&P BSE Information Technology PRI values from 03-Mar-00 to 23-Aug-2004 and TRI values since 23-Aug-2004.
As TRI data is not available since inception of the ICICI Prudential FMCG Fund, benchmark performance is calculated using composite CAGR of Nifty 50 PRI values from 31-Mar-99 to 30-Jun-99 and TRI values since 30-Jun-99.
As TRI data is not available since inception of the ICICI Prudential Large & Mid Cap Fund, benchmark performance is calculated using composite CAGR of Nifty 50 PRI values from 09-Jul-98 to 30-Jun-99 and TRI values since 30-Jun-99.
As TRI data is not available since inception of the ICICI Prudential Multicap Fund, the additional benchmark performance is calculated using composite CAGR of Nifty 50 PRI values from 01-Oct-94 to 30-Jun-99 and TRI values since 30-Jun-99. The benchmark of the scheme has been revised from S&P BSE 500 TRI to Nifty500 Multicap 50:25:25 TRI w.e.f. Jan 29, 2021.
As TRI data is not available since inception of the ICICI Prudential Value Discovery Fund, benchmark performance is calculated using composite CAGR of S&P BSE 500 PRI values from 16-Aug-04 to 01-Aug-06 and TRI values since 01-Aug-06.
Note :-• ICICI Prudential Balanced Advantage Fund the Equity Portion is managed by Sankaran Naren, Rajat Chandak, Ihab Dalwai and Debt Portion by Manish Banthia, Ritesh Lunawat and Sri Sharma.• ICICI Prudential Equity - Arbitrage Fund the Equity Portion is managed by Kayzad Eghlim and Debt Portion by Rohan Maru and Nikhil Kabra.• ICICI Prudential Equity & Debt Fund the Equity Portion is managed by Sankaran Naren, Mittul Kalawadia and Debt Portion by Manish Banthia, Nikhil Kabra and Sri Sharma.• ICICI Prudential Equity Savings Fund the Equity Portion is managed by , Dharmesh Kakkad and Debt Portion by Manish Banthia, Ritesh Lunawat and Sri Sharma.Kayzad Eghlim• ICICI Prudential Multicap Fund is managed by Prakash Gaurav Goel.• ICICI Prudential Regular Savings Fund the Equity Portion is managed by Parag Thakkar and Debt Portion by Manish Banthia.• ICICI Prudential Child Care Fund (Gift Plan) the Equity Portion is managed by Ashwin Jain and Debt Portion by Manish Banthia and Ritesh Lunawat.• ICICI Prudential US Bluechip Equity Fund the US Portion is managed by Priyanka Khandelwal & India Debt Portion is managed by Rohan Maru.
1. Different plans shall have different expense structure. The performance provided are of plans mentioned above. 2. Past performance may or may not be sustained in future and the same may not necessarily provide the basis for comparison with other investment. 3. Performance for Schemes not having Growth/Cumulative Options have been calculated considering the IDCW Option, post adjustment of the IDCW Factor. Performance of IDCW option would be Net of
statutory levy, if any.4. Load is not considered for computation of returns. 5. In case, the start/end date of the concerned period is a nonbusiness date (NBD), the NAV of the previous date is considered for computation of returns. 6. Since respective schemes/ options have not completed relevant period (1yr, 3yr or 5yr) after allotment or units were not available throughout the respective period, no returns are available.^ Inception date
shown is the date from which units under the plans are available throughout. 7. Please Refer page no. 144 for Fund Manager details.8. The performance of the scheme is benchmarked to the Total Return variant of the IndexScheme count for the total schemes managed by the Fund Managers does not include Capital Protection Oriented Funds, Multiple Yield Funds, Fixed Maturity Plans and Fund of Funds.
Simple annualized returns have been provided as per the extant guidelines since the scheme has completed 6 months but not 1 year. However, such returns may not be representative. Absolute returns of the Scheme for the 6 month period is 17.59%.
Returns of ICICI Prudential Business Cycle Fund
1 Year 3 Years 5 Years Since inceptionParticulars
- -
CAGR (%)
CAGR (%)
CAGR (%)
- -
Scheme
Nifty 500 TRI (Benchmark)
Nifty 50 TRI (Additional Benchmark)
NAV (Rs.) Per Unit (as on July 30,2021 : 11.63)
6 Months
Simple Annualized Returns (%)
35.28 - - - -
43.62 - - - -
33.26 - - - -
9.89
CAGR (%)
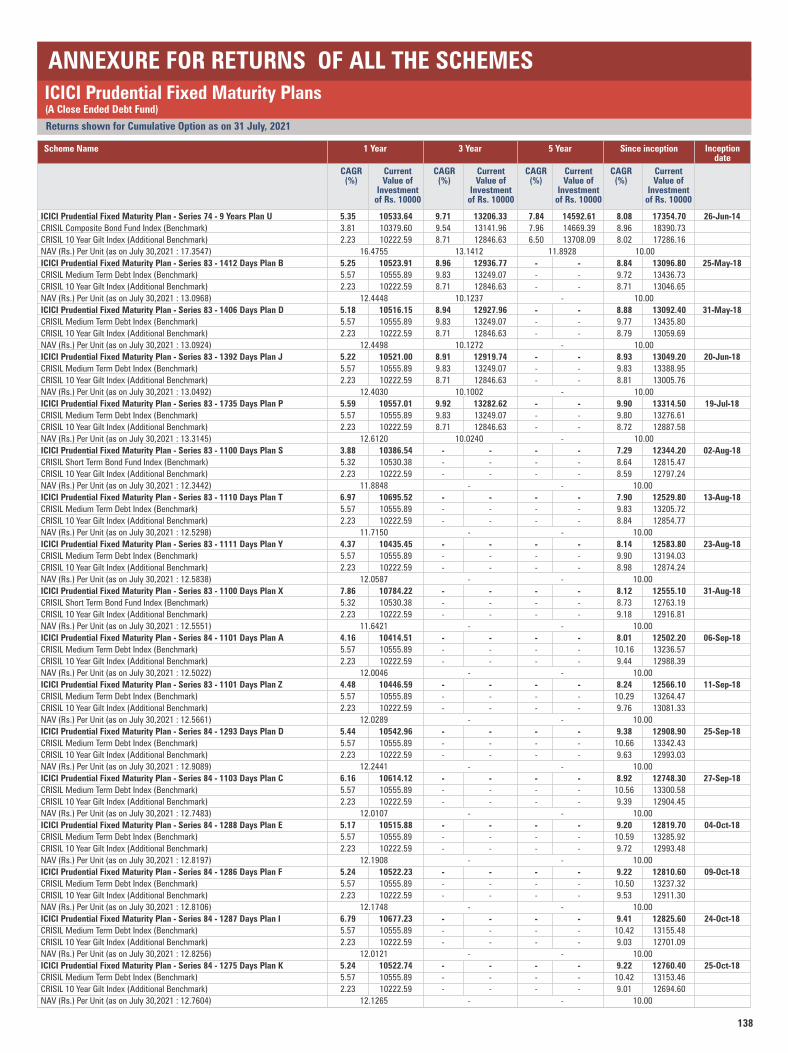
138
Returns shown for Cumulative Option as on 31 July, 2021
ICICI Prudential Fixed Maturity Plans(A Close Ended Debt Fund)
ANNEXURE FOR RETURNS OF ALL THE SCHEMES
1 Year
CAGR (%)
Current Value of
Investment of Rs. 10000
Scheme Name 3 Year
CAGR (%)
Current Value of
Investment of Rs. 10000
5 Year
CAGR (%)
Current Value of
Investment of Rs. 10000
Since inception
CAGR (%)
Current Value of
Investment of Rs. 10000
Inception date
ICICI Prudential Fixed Maturity Plan - Series 74 - 9 Years Plan U 5.35 10533.64 9.71 13206.33 7.84 14592.61 8.08 17354.70 26-Jun-14
CRISIL Composite Bond Fund Index (Benchmark) 3.81 10379.60 9.54 13141.96 7.96 14669.39 8.96 18390.73
CRISIL 10 Year Gilt Index (Additional Benchmark) 2.23 10222.59 8.71 12846.63 6.50 13708.09 8.02 17286.16
NAV (Rs.) Per Unit (as on July 30,2021 : 17.3547) 16.4755 13.1412 11.8928 10.00
ICICI Prudential Fixed Maturity Plan - Series 83 - 1412 Days Plan B 5.25 10523.91 8.96 12936.77 - - 8.84 13096.80 25-May-18
CRISIL Medium Term Debt Index (Benchmark) 5.57 10555.89 9.83 13249.07 - - 9.72 13436.73
CRISIL 10 Year Gilt Index (Additional Benchmark) 2.23 10222.59 8.71 12846.63 - - 8.71 13046.65
NAV (Rs.) Per Unit (as on July 30,2021 : 13.0968) 12.4448 10.1237 - 10.00
ICICI Prudential Fixed Maturity Plan - Series 83 - 1406 Days Plan D 5.18 10516.15 8.94 12927.96 - - 8.88 13092.40 31-May-18
CRISIL Medium Term Debt Index (Benchmark) 5.57 10555.89 9.83 13249.07 - - 9.77 13435.80
CRISIL 10 Year Gilt Index (Additional Benchmark) 2.23 10222.59 8.71 12846.63 - - 8.79 13059.69
NAV (Rs.) Per Unit (as on July 30,2021 : 13.0924) 12.4498 10.1272 - 10.00
ICICI Prudential Fixed Maturity Plan - Series 83 - 1392 Days Plan J 5.22 10521.00 8.91 12919.74 - - 8.93 13049.20 20-Jun-18
CRISIL Medium Term Debt Index (Benchmark) 5.57 10555.89 9.83 13249.07 - - 9.83 13388.95
CRISIL 10 Year Gilt Index (Additional Benchmark) 2.23 10222.59 8.71 12846.63 - - 8.81 13005.76
NAV (Rs.) Per Unit (as on July 30,2021 : 13.0492) 12.4030 10.1002 - 10.00
ICICI Prudential Fixed Maturity Plan - Series 83 - 1735 Days Plan P 5.59 10557.01 9.92 13282.62 - - 9.90 13314.50 19-Jul-18
CRISIL Medium Term Debt Index (Benchmark) 5.57 10555.89 9.83 13249.07 - - 9.80 13276.61
CRISIL 10 Year Gilt Index (Additional Benchmark) 2.23 10222.59 8.71 12846.63 - - 8.72 12887.58
NAV (Rs.) Per Unit (as on July 30,2021 : 13.3145) 12.6120 10.0240 - 10.00
ICICI Prudential Fixed Maturity Plan - Series 83 - 1100 Days Plan S 3.88 10386.54 - - - - 7.29 12344.20 02-Aug-18
CRISIL Short Term Bond Fund Index (Benchmark) 5.32 10530.38 - - - - 8.64 12815.47
CRISIL 10 Year Gilt Index (Additional Benchmark) 2.23 10222.59 - - - - 8.59 12797.24
NAV (Rs.) Per Unit (as on July 30,2021 : 12.3442) 11.8848 - - 10.00
ICICI Prudential Fixed Maturity Plan - Series 83 - 1110 Days Plan T 6.97 10695.52 - - - - 7.90 12529.80 13-Aug-18
CRISIL Medium Term Debt Index (Benchmark) 5.57 10555.89 - - - - 9.83 13205.72
CRISIL 10 Year Gilt Index (Additional Benchmark) 2.23 10222.59 - - - - 8.84 12854.77
NAV (Rs.) Per Unit (as on July 30,2021 : 12.5298) 11.7150 - - 10.00
ICICI Prudential Fixed Maturity Plan - Series 83 - 1111 Days Plan Y 4.37 10435.45 - - - - 8.14 12583.80 23-Aug-18
CRISIL Medium Term Debt Index (Benchmark) 5.57 10555.89 - - - - 9.90 13194.03
CRISIL 10 Year Gilt Index (Additional Benchmark) 2.23 10222.59 - - - - 8.98 12874.24
NAV (Rs.) Per Unit (as on July 30,2021 : 12.5838) 12.0587 - - 10.00
ICICI Prudential Fixed Maturity Plan - Series 83 - 1100 Days Plan X 7.86 10784.22 - - - - 8.12 12555.10 31-Aug-18
CRISIL Short Term Bond Fund Index (Benchmark) 5.32 10530.38 - - - - 8.73 12763.19
CRISIL 10 Year Gilt Index (Additional Benchmark) 2.23 10222.59 - - - - 9.18 12916.81
NAV (Rs.) Per Unit (as on July 30,2021 : 12.5551) 11.6421 - - 10.00
ICICI Prudential Fixed Maturity Plan - Series 84 - 1101 Days Plan A 4.16 10414.51 - - - - 8.01 12502.20 06-Sep-18
CRISIL Medium Term Debt Index (Benchmark) 5.57 10555.89 - - - - 10.16 13236.57
CRISIL 10 Year Gilt Index (Additional Benchmark) 2.23 10222.59 - - - - 9.44 12988.39
NAV (Rs.) Per Unit (as on July 30,2021 : 12.5022) 12.0046 - - 10.00
ICICI Prudential Fixed Maturity Plan - Series 83 - 1101 Days Plan Z 4.48 10446.59 - - - - 8.24 12566.10 11-Sep-18
CRISIL Medium Term Debt Index (Benchmark) 5.57 10555.89 - - - - 10.29 13264.47
CRISIL 10 Year Gilt Index (Additional Benchmark) 2.23 10222.59 - - - - 9.76 13081.33
NAV (Rs.) Per Unit (as on July 30,2021 : 12.5661) 12.0289 - - 10.00
ICICI Prudential Fixed Maturity Plan - Series 84 - 1293 Days Plan D 5.44 10542.96 - - - - 9.38 12908.90 25-Sep-18
CRISIL Medium Term Debt Index (Benchmark) 5.57 10555.89 - - - - 10.66 13342.43
CRISIL 10 Year Gilt Index (Additional Benchmark) 2.23 10222.59 - - - - 9.63 12993.03
NAV (Rs.) Per Unit (as on July 30,2021 : 12.9089) 12.2441 - - 10.00
ICICI Prudential Fixed Maturity Plan - Series 84 - 1103 Days Plan C 6.16 10614.12 - - - - 8.92 12748.30 27-Sep-18
CRISIL Medium Term Debt Index (Benchmark) 5.57 10555.89 - - - - 10.56 13300.58
CRISIL 10 Year Gilt Index (Additional Benchmark) 2.23 10222.59 - - - - 9.39 12904.45
NAV (Rs.) Per Unit (as on July 30,2021 : 12.7483) 12.0107 - - 10.00
ICICI Prudential Fixed Maturity Plan - Series 84 - 1288 Days Plan E 5.17 10515.88 - - - - 9.20 12819.70 04-Oct-18
CRISIL Medium Term Debt Index (Benchmark) 5.57 10555.89 - - - - 10.59 13285.92
CRISIL 10 Year Gilt Index (Additional Benchmark) 2.23 10222.59 - - - - 9.72 12993.48
NAV (Rs.) Per Unit (as on July 30,2021 : 12.8197) 12.1908 - - 10.00
ICICI Prudential Fixed Maturity Plan - Series 84 - 1286 Days Plan F 5.24 10522.23 - - - - 9.22 12810.60 09-Oct-18
CRISIL Medium Term Debt Index (Benchmark) 5.57 10555.89 - - - - 10.50 13237.32
CRISIL 10 Year Gilt Index (Additional Benchmark) 2.23 10222.59 - - - - 9.53 12911.30
NAV (Rs.) Per Unit (as on July 30,2021 : 12.8106) 12.1748 - - 10.00
ICICI Prudential Fixed Maturity Plan - Series 84 - 1287 Days Plan I 6.79 10677.23 - - - - 9.41 12825.60 24-Oct-18
CRISIL Medium Term Debt Index (Benchmark) 5.57 10555.89 - - - - 10.42 13155.48
CRISIL 10 Year Gilt Index (Additional Benchmark) 2.23 10222.59 - - - - 9.03 12701.09
NAV (Rs.) Per Unit (as on July 30,2021 : 12.8256) 12.0121 - - 10.00
ICICI Prudential Fixed Maturity Plan - Series 84 - 1275 Days Plan K 5.24 10522.74 - - - - 9.22 12760.40 25-Oct-18
CRISIL Medium Term Debt Index (Benchmark) 5.57 10555.89 - - - - 10.42 13153.46
CRISIL 10 Year Gilt Index (Additional Benchmark) 2.23 10222.59 - - - - 9.01 12694.60
NAV (Rs.) Per Unit (as on July 30,2021 : 12.7604) 12.1265 - - 10.00
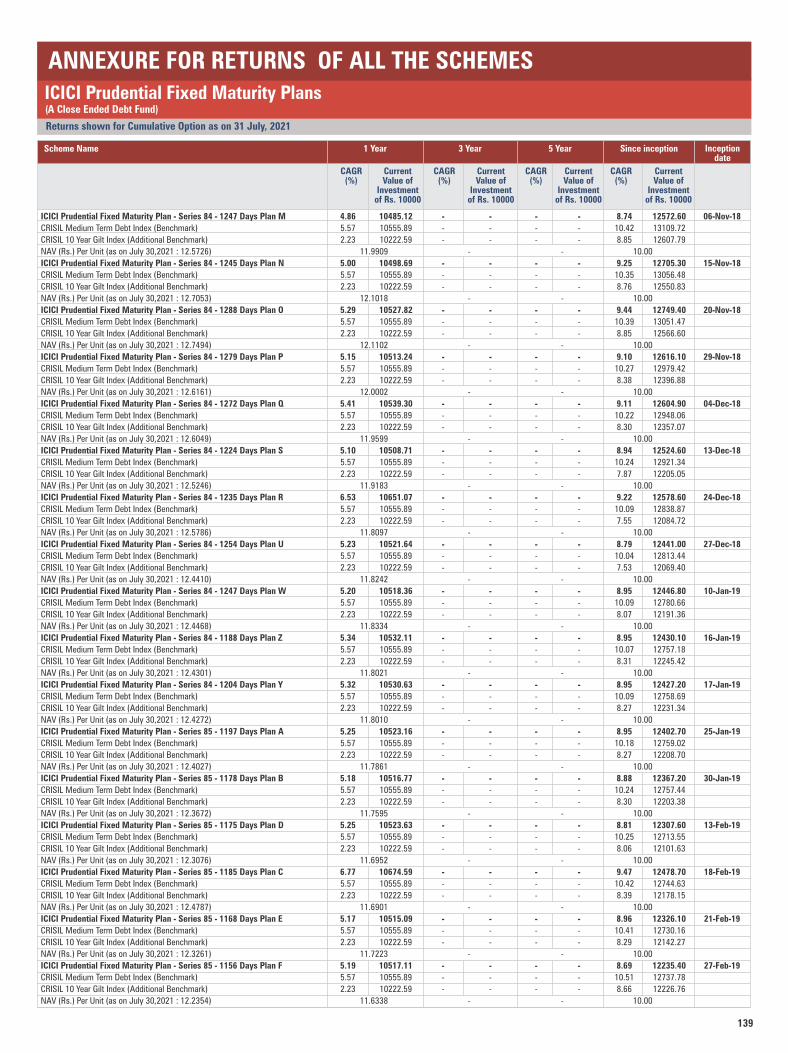
139
Returns shown for Cumulative Option as on 31 July, 2021
ICICI Prudential Fixed Maturity Plans(A Close Ended Debt Fund)
ANNEXURE FOR RETURNS OF ALL THE SCHEMES
1 Year
CAGR (%)
Current Value of
Investment of Rs. 10000
Scheme Name 3 Year
CAGR (%)
Current Value of
Investment of Rs. 10000
5 Year
CAGR (%)
Current Value of
Investment of Rs. 10000
Since inception
CAGR (%)
Current Value of
Investment of Rs. 10000
Inception date
ICICI Prudential Fixed Maturity Plan - Series 84 - 1247 Days Plan M 4.86 10485.12 - - - - 8.74 12572.60 06-Nov-18
CRISIL Medium Term Debt Index (Benchmark) 5.57 10555.89 - - - - 10.42 13109.72
CRISIL 10 Year Gilt Index (Additional Benchmark) 2.23 10222.59 - - - - 8.85 12607.79
NAV (Rs.) Per Unit (as on July 30,2021 : 12.5726) 11.9909 - - 10.00
ICICI Prudential Fixed Maturity Plan - Series 84 - 1245 Days Plan N 5.00 10498.69 - - - - 9.25 12705.30 15-Nov-18
CRISIL Medium Term Debt Index (Benchmark) 5.57 10555.89 - - - - 10.35 13056.48
CRISIL 10 Year Gilt Index (Additional Benchmark) 2.23 10222.59 - - - - 8.76 12550.83
NAV (Rs.) Per Unit (as on July 30,2021 : 12.7053) 12.1018 - - 10.00
ICICI Prudential Fixed Maturity Plan - Series 84 - 1288 Days Plan O 5.29 10527.82 - - - - 9.44 12749.40 20-Nov-18
CRISIL Medium Term Debt Index (Benchmark) 5.57 10555.89 - - - - 10.39 13051.47
CRISIL 10 Year Gilt Index (Additional Benchmark) 2.23 10222.59 - - - - 8.85 12566.60
NAV (Rs.) Per Unit (as on July 30,2021 : 12.7494) 12.1102 - - 10.00
ICICI Prudential Fixed Maturity Plan - Series 84 - 1279 Days Plan P 5.15 10513.24 - - - - 9.10 12616.10 29-Nov-18
CRISIL Medium Term Debt Index (Benchmark) 5.57 10555.89 - - - - 10.27 12979.42
CRISIL 10 Year Gilt Index (Additional Benchmark) 2.23 10222.59 - - - - 8.38 12396.88
NAV (Rs.) Per Unit (as on July 30,2021 : 12.6161) 12.0002 - - 10.00
ICICI Prudential Fixed Maturity Plan - Series 84 - 1272 Days Plan Q 5.41 10539.30 - - - - 9.11 12604.90 04-Dec-18
CRISIL Medium Term Debt Index (Benchmark) 5.57 10555.89 - - - - 10.22 12948.06
CRISIL 10 Year Gilt Index (Additional Benchmark) 2.23 10222.59 - - - - 8.30 12357.07
NAV (Rs.) Per Unit (as on July 30,2021 : 12.6049) 11.9599 - - 10.00
ICICI Prudential Fixed Maturity Plan - Series 84 - 1224 Days Plan S 5.10 10508.71 - - - - 8.94 12524.60 13-Dec-18
CRISIL Medium Term Debt Index (Benchmark) 5.57 10555.89 - - - - 10.24 12921.34
CRISIL 10 Year Gilt Index (Additional Benchmark) 2.23 10222.59 - - - - 7.87 12205.05
NAV (Rs.) Per Unit (as on July 30,2021 : 12.5246) 11.9183 - - 10.00
ICICI Prudential Fixed Maturity Plan - Series 84 - 1235 Days Plan R 6.53 10651.07 - - - - 9.22 12578.60 24-Dec-18
CRISIL Medium Term Debt Index (Benchmark) 5.57 10555.89 - - - - 10.09 12838.87
CRISIL 10 Year Gilt Index (Additional Benchmark) 2.23 10222.59 - - - - 7.55 12084.72
NAV (Rs.) Per Unit (as on July 30,2021 : 12.5786) 11.8097 - - 10.00
ICICI Prudential Fixed Maturity Plan - Series 84 - 1254 Days Plan U 5.23 10521.64 - - - - 8.79 12441.00 27-Dec-18
CRISIL Medium Term Debt Index (Benchmark) 5.57 10555.89 - - - - 10.04 12813.44
CRISIL 10 Year Gilt Index (Additional Benchmark) 2.23 10222.59 - - - - 7.53 12069.40
NAV (Rs.) Per Unit (as on July 30,2021 : 12.4410) 11.8242 - - 10.00
ICICI Prudential Fixed Maturity Plan - Series 84 - 1247 Days Plan W 5.20 10518.36 - - - - 8.95 12446.80 10-Jan-19
CRISIL Medium Term Debt Index (Benchmark) 5.57 10555.89 - - - - 10.09 12780.66
CRISIL 10 Year Gilt Index (Additional Benchmark) 2.23 10222.59 - - - - 8.07 12191.36
NAV (Rs.) Per Unit (as on July 30,2021 : 12.4468) 11.8334 - - 10.00
ICICI Prudential Fixed Maturity Plan - Series 84 - 1188 Days Plan Z 5.34 10532.11 - - - - 8.95 12430.10 16-Jan-19
CRISIL Medium Term Debt Index (Benchmark) 5.57 10555.89 - - - - 10.07 12757.18
CRISIL 10 Year Gilt Index (Additional Benchmark) 2.23 10222.59 - - - - 8.31 12245.42
NAV (Rs.) Per Unit (as on July 30,2021 : 12.4301) 11.8021 - - 10.00
ICICI Prudential Fixed Maturity Plan - Series 84 - 1204 Days Plan Y 5.32 10530.63 - - - - 8.95 12427.20 17-Jan-19
CRISIL Medium Term Debt Index (Benchmark) 5.57 10555.89 - - - - 10.09 12758.69
CRISIL 10 Year Gilt Index (Additional Benchmark) 2.23 10222.59 - - - - 8.27 12231.34
NAV (Rs.) Per Unit (as on July 30,2021 : 12.4272) 11.8010 - - 10.00
ICICI Prudential Fixed Maturity Plan - Series 85 - 1197 Days Plan A 5.25 10523.16 - - - - 8.95 12402.70 25-Jan-19
CRISIL Medium Term Debt Index (Benchmark) 5.57 10555.89 - - - - 10.18 12759.02
CRISIL 10 Year Gilt Index (Additional Benchmark) 2.23 10222.59 - - - - 8.27 12208.70
NAV (Rs.) Per Unit (as on July 30,2021 : 12.4027) 11.7861 - - 10.00
ICICI Prudential Fixed Maturity Plan - Series 85 - 1178 Days Plan B 5.18 10516.77 - - - - 8.88 12367.20 30-Jan-19
CRISIL Medium Term Debt Index (Benchmark) 5.57 10555.89 - - - - 10.24 12757.44
CRISIL 10 Year Gilt Index (Additional Benchmark) 2.23 10222.59 - - - - 8.30 12203.38
NAV (Rs.) Per Unit (as on July 30,2021 : 12.3672) 11.7595 - - 10.00
ICICI Prudential Fixed Maturity Plan - Series 85 - 1175 Days Plan D 5.25 10523.63 - - - - 8.81 12307.60 13-Feb-19
CRISIL Medium Term Debt Index (Benchmark) 5.57 10555.89 - - - - 10.25 12713.55
CRISIL 10 Year Gilt Index (Additional Benchmark) 2.23 10222.59 - - - - 8.06 12101.63
NAV (Rs.) Per Unit (as on July 30,2021 : 12.3076) 11.6952 - - 10.00
ICICI Prudential Fixed Maturity Plan - Series 85 - 1185 Days Plan C 6.77 10674.59 - - - - 9.47 12478.70 18-Feb-19
CRISIL Medium Term Debt Index (Benchmark) 5.57 10555.89 - - - - 10.42 12744.63
CRISIL 10 Year Gilt Index (Additional Benchmark) 2.23 10222.59 - - - - 8.39 12178.15
NAV (Rs.) Per Unit (as on July 30,2021 : 12.4787) 11.6901 - - 10.00
ICICI Prudential Fixed Maturity Plan - Series 85 - 1168 Days Plan E 5.17 10515.09 - - - - 8.96 12326.10 21-Feb-19
CRISIL Medium Term Debt Index (Benchmark) 5.57 10555.89 - - - - 10.41 12730.16
CRISIL 10 Year Gilt Index (Additional Benchmark) 2.23 10222.59 - - - - 8.29 12142.27
NAV (Rs.) Per Unit (as on July 30,2021 : 12.3261) 11.7223 - - 10.00
ICICI Prudential Fixed Maturity Plan - Series 85 - 1156 Days Plan F 5.19 10517.11 - - - - 8.69 12235.40 27-Feb-19
CRISIL Medium Term Debt Index (Benchmark) 5.57 10555.89 - - - - 10.51 12737.78
CRISIL 10 Year Gilt Index (Additional Benchmark) 2.23 10222.59 - - - - 8.66 12226.76
NAV (Rs.) Per Unit (as on July 30,2021 : 12.2354) 11.6338 - - 10.00
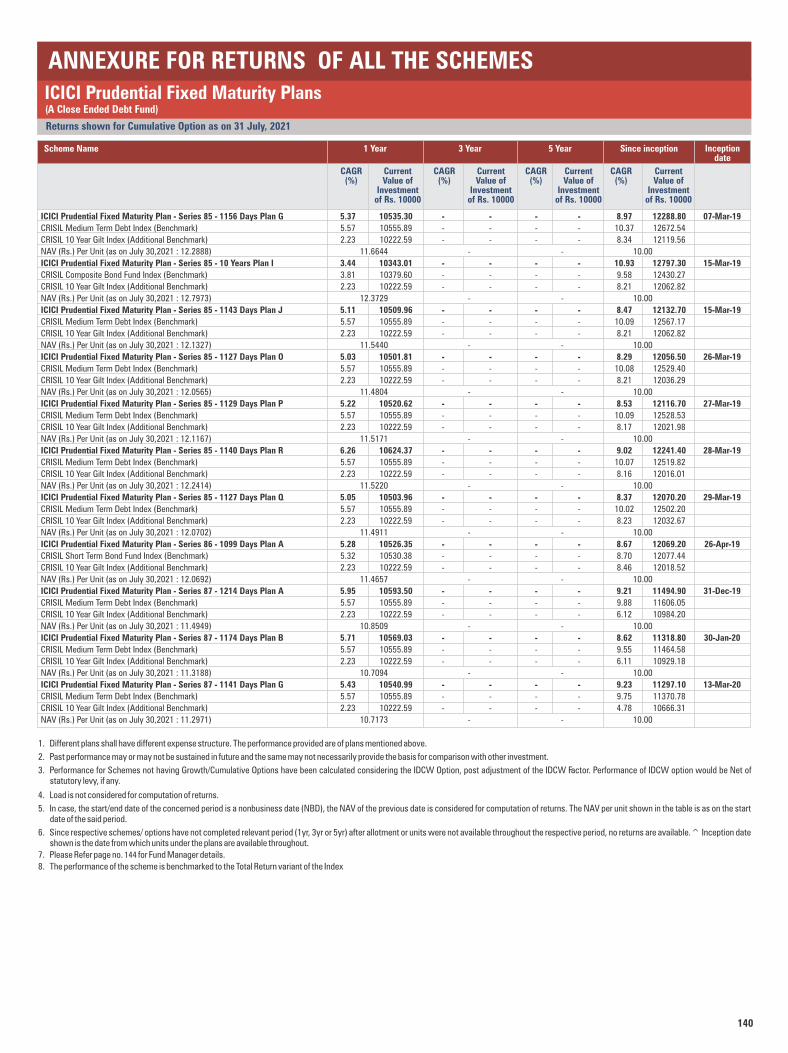
140
Returns shown for Cumulative Option as on 31 July, 2021
ICICI Prudential Fixed Maturity Plans(A Close Ended Debt Fund)
ANNEXURE FOR RETURNS OF ALL THE SCHEMES
1 Year
CAGR (%)
Current Value of
Investment of Rs. 10000
Scheme Name 3 Year
CAGR (%)
Current Value of
Investment of Rs. 10000
5 Year
CAGR (%)
Current Value of
Investment of Rs. 10000
Since inception
CAGR (%)
Current Value of
Investment of Rs. 10000
Inception date
ICICI Prudential Fixed Maturity Plan - Series 85 - 1156 Days Plan G 5.37 10535.30 - - - - 8.97 12288.80 07-Mar-19
CRISIL Medium Term Debt Index (Benchmark) 5.57 10555.89 - - - - 10.37 12672.54
CRISIL 10 Year Gilt Index (Additional Benchmark) 2.23 10222.59 - - - - 8.34 12119.56
NAV (Rs.) Per Unit (as on July 30,2021 : 12.2888) 11.6644 - - 10.00
ICICI Prudential Fixed Maturity Plan - Series 85 - 10 Years Plan I 3.44 10343.01 - - - - 10.93 12797.30 15-Mar-19
CRISIL Composite Bond Fund Index (Benchmark) 3.81 10379.60 - - - - 9.58 12430.27
CRISIL 10 Year Gilt Index (Additional Benchmark) 2.23 10222.59 - - - - 8.21 12062.82
NAV (Rs.) Per Unit (as on July 30,2021 : 12.7973) 12.3729 - - 10.00
ICICI Prudential Fixed Maturity Plan - Series 85 - 1143 Days Plan J 5.11 10509.96 - - - - 8.47 12132.70 15-Mar-19
CRISIL Medium Term Debt Index (Benchmark) 5.57 10555.89 - - - - 10.09 12567.17
CRISIL 10 Year Gilt Index (Additional Benchmark) 2.23 10222.59 - - - - 8.21 12062.82
NAV (Rs.) Per Unit (as on July 30,2021 : 12.1327) 11.5440 - - 10.00
ICICI Prudential Fixed Maturity Plan - Series 85 - 1127 Days Plan O 5.03 10501.81 - - - - 8.29 12056.50 26-Mar-19
CRISIL Medium Term Debt Index (Benchmark) 5.57 10555.89 - - - - 10.08 12529.40
CRISIL 10 Year Gilt Index (Additional Benchmark) 2.23 10222.59 - - - - 8.21 12036.29
NAV (Rs.) Per Unit (as on July 30,2021 : 12.0565) 11.4804 - - 10.00
ICICI Prudential Fixed Maturity Plan - Series 85 - 1129 Days Plan P 5.22 10520.62 - - - - 8.53 12116.70 27-Mar-19
CRISIL Medium Term Debt Index (Benchmark) 5.57 10555.89 - - - - 10.09 12528.53
CRISIL 10 Year Gilt Index (Additional Benchmark) 2.23 10222.59 - - - - 8.17 12021.98
NAV (Rs.) Per Unit (as on July 30,2021 : 12.1167) 11.5171 - - 10.00
ICICI Prudential Fixed Maturity Plan - Series 85 - 1140 Days Plan R 6.26 10624.37 - - - - 9.02 12241.40 28-Mar-19
CRISIL Medium Term Debt Index (Benchmark) 5.57 10555.89 - - - - 10.07 12519.82
CRISIL 10 Year Gilt Index (Additional Benchmark) 2.23 10222.59 - - - - 8.16 12016.01
NAV (Rs.) Per Unit (as on July 30,2021 : 12.2414) 11.5220 - - 10.00
ICICI Prudential Fixed Maturity Plan - Series 85 - 1127 Days Plan Q 5.05 10503.96 - - - - 8.37 12070.20 29-Mar-19
CRISIL Medium Term Debt Index (Benchmark) 5.57 10555.89 - - - - 10.02 12502.20
CRISIL 10 Year Gilt Index (Additional Benchmark) 2.23 10222.59 - - - - 8.23 12032.67
NAV (Rs.) Per Unit (as on July 30,2021 : 12.0702) 11.4911 - - 10.00
ICICI Prudential Fixed Maturity Plan - Series 86 - 1099 Days Plan A 5.28 10526.35 - - - - 8.67 12069.20 26-Apr-19
CRISIL Short Term Bond Fund Index (Benchmark) 5.32 10530.38 - - - - 8.70 12077.44
CRISIL 10 Year Gilt Index (Additional Benchmark) 2.23 10222.59 - - - - 8.46 12018.52
NAV (Rs.) Per Unit (as on July 30,2021 : 12.0692) 11.4657 - - 10.00
ICICI Prudential Fixed Maturity Plan - Series 87 - 1214 Days Plan A 5.95 10593.50 - - - - 9.21 11494.90 31-Dec-19
CRISIL Medium Term Debt Index (Benchmark) 5.57 10555.89 - - - - 9.88 11606.05
CRISIL 10 Year Gilt Index (Additional Benchmark) 2.23 10222.59 - - - - 6.12 10984.20
NAV (Rs.) Per Unit (as on July 30,2021 : 11.4949) 10.8509 - - 10.00
ICICI Prudential Fixed Maturity Plan - Series 87 - 1174 Days Plan B 5.71 10569.03 - - - - 8.62 11318.80 30-Jan-20
CRISIL Medium Term Debt Index (Benchmark) 5.57 10555.89 - - - - 9.55 11464.58
CRISIL 10 Year Gilt Index (Additional Benchmark) 2.23 10222.59 - - - - 6.11 10929.18
NAV (Rs.) Per Unit (as on July 30,2021 : 11.3188) 10.7094 - - 10.00
ICICI Prudential Fixed Maturity Plan - Series 87 - 1141 Days Plan G 5.43 10540.99 - - - - 9.23 11297.10 13-Mar-20
CRISIL Medium Term Debt Index (Benchmark) 5.57 10555.89 - - - - 9.75 11370.78
CRISIL 10 Year Gilt Index (Additional Benchmark) 2.23 10222.59 - - - - 4.78 10666.31
NAV (Rs.) Per Unit (as on July 30,2021 : 11.2971) 10.7173 - - 10.00
1. Different plans shall have different expense structure. The performance provided are of plans mentioned above.
2. Past performance may or may not be sustained in future and the same may not necessarily provide the basis for comparison with other investment.
3. Performance for Schemes not having Growth/Cumulative Options have been calculated considering the IDCW Option, post adjustment of the IDCW Factor. Performance of IDCW option would be Net of statutory levy, if any.
4. Load is not considered for computation of returns.
5. In case, the start/end date of the concerned period is a nonbusiness date (NBD), the NAV of the previous date is considered for computation of returns. The NAV per unit shown in the table is as on the start date of the said period.
6. Since respective schemes/ options have not completed relevant period (1yr, 3yr or 5yr) after allotment or units were not available throughout the respective period, no returns are available.^ Inception date shown is the date from which units under the plans are available throughout.
7. Please Refer page no. 144 for Fund Manager details.
8. The performance of the scheme is benchmarked to the Total Return variant of the Index

141
Returns shown for Cumulative Option as on 31 July, 2021
ANNEXURE FOR RETURNS OF ALL THE SCHEMES
ICICI Prudential Capital Protection Oriented Funds(A Close ended Capital Protection Oriented Fund)
1 Year
CAGR (%)
Current Value of
Investment of Rs. 10000
Scheme Name 3 Year
CAGR (%)
Current Value of
Investment of Rs. 10000
5 Year
CAGR (%)
Current Value of
Investment of Rs. 10000
Since inception
CAGR (%)
Current Value of
Investment of Rs. 10000
Inception date
ICICI Prudential Capital Protection Oriented Fund - Series XI - Plan A 2056 Days 12.72 11268.79 9.41 13096.82 - - 8.43 14543.50 14-Dec-16
CRISIL Composite Bond Fund Index (80%) + Nifty 50 TRI (20%) (Benchmark) 11.13 11109.31 10.62 13535.19 - - 9.48 15208.30
CRISIL 10 Year Gilt Index (Additional Benchmark) 2.23 10222.59 8.71 12846.63 - - 5.48 12799.96
NAV (Rs.) Per Unit (as on July 30,2021 : 14.5435) 12.9060 11.1046 - 10.00
ICICI Prudential Capital Protection Oriented Fund - Series XIV - Plan A 1275 Days 11.43 11139.28 - - - - 10.71 13101.80 04-Dec-18
CRISIL Composite Bond Fund Index (85%) + Nifty 50 TRI (15%) (Benchmark) 9.26 10923.36 - - - - 10.98 13186.60
CRISIL 10 Year Gilt Index (Additional Benchmark) 2.23 10222.59 - - - - 8.30 12357.07
NAV (Rs.) Per Unit (as on July 30,2021 : 13.1018) 11.7618 - - 10.00
1. Different plans shall have different expense structure. The performance provided are of plans mentioned above.
2. Past performance may or may not be sustained in future and the same may not necessarily provide the basis for comparison with other investment.
3. Performance for Schemes not having Growth/Cumulative Options have been calculated considering the IDCW Option, post adjustment of the IDCW Factor. Performance of IDCW option would be Net of statutory levy, if any.
4. Load is not considered for computation of returns.
5. In case, the start/end date of the concerned period is a nonbusiness date (NBD), the NAV of the previous date is considered for computation of returns. The NAV per unit shown in the table is as on the start date of the said period.
6. Since respective schemes/ options have not completed relevant period (1yr, 3yr or 5yr) after allotment or units were not available throughout the respective period, no returns are available.^ Inception date shown is the date from which units under the plans are available throughout.
7. Please Refer page no. 144 for Fund Manager details.
8. The performance of the scheme is benchmarked to the Total Return variant of the Index
“The Scheme offered is “oriented towards protection of capital” and “not with guaranteed returns”.The orientation towards protection of the capital originates from the portfolio structure of the Scheme and not from any bank guarantee, insurance cover etc. The ability of the portfolio to meet capital protection on maturity to the investors can be impacted in certain circumstances including changes in government policies, interest rate movements in the market, credit defaults by bonds, expenses, reinvestment risk and risk associated with trading volumes, liquidity and settlement systems in equity and debt markets. Accordingly, investors may lose part or all of their investment (including original amount invested) in the Scheme. No guarantee or assurance, express or implied, is given that investors will receive the capital protected value at maturity or any other returns. Investors in the Scheme are not being offered any guaranteed / assured returns.”

142
Returns shown for Cumulative Option as on 31 July, 2021
ANNEXURE FOR RETURNS OF ALL THE SCHEMES
ICICI Prudential Fund of Fund Series(Open ended fund of funds scheme investing in Domestic Mutual Fund schemes)
WHY SHOULD ONE INVEST?Customised investment solutions to match risk return profile.
1 Year
CAGR (%)
Current Value of
Investment of Rs. 10000
Scheme Name 3 Year
CAGR (%)
Current Value of
Investment of Rs. 10000
5 Year
CAGR (%)
Current Value of
Investment of Rs. 10000
Since inception
CAGR (%)
Current Value of
Investment of Rs. 10000
Inception date
1. Different plans shall have different expense structure. The performance provided are of plans mentioned above.
2. Past performance may or may not be sustained in future and the same may not necessarily provide the basis for comparison with other investment.
3. Performance for Schemes not having Growth/Cumulative Options have been calculated considering the IDCW Option, post adjustment of the IDCW Factor. Performance of IDCW option would be Net of statutory levy, if any.
4. Load is not considered for computation of returns.
5. In case, the start/end date of the concerned period is a nonbusiness date (NBD), the NAV of the previous date is considered for computation of returns. The NAV per unit shown in the table is as on the start date of the said period.
6. Since respective schemes/ options have not completed relevant period (1yr, 3yr or 5yr) after allotment or units were not available throughout the respective period, no returns are available.^ Inception date shown is the date from which units under the plans are available throughout.
7. Please Refer page no. 144 for Fund Manager details.
8. The performance of the scheme is benchmarked to the Total Return variant of the Index
9. The name of "ICICI Prudential Moderate Fund (FOF)" is changed to "ICICI Prudential Income Optimizer Fund (FOF)" w.e.f. February 03, 2020.
ICICI Prudential Passive Strategy Fund (FOF) 51.44 15126.68 10.70 13566.90 11.95 17598.55 13.28 90108.10 18-Dec-03
Nifty 200 TRI (Benchmark) 48.73 14856.84 13.51 14625.36 12.81 18279.93 13.11 87744.56
Nifty 50 TRI (Additional Benchmark) 44.30 14415.96 12.90 14391.01 14.18 19418.55 14.74 112851.42
NAV (Rs.) Per Unit (as on July 30,2021 : 90.1081) 59.5690 66.4176 51.2020 10.00
ICICI Prudential Debt Management Fund (FOF) 5.90 10588.00 7.87 12552.93 7.57 14408.83 7.36 34947.60 18-Dec-03
CRISIL Composite Bond Fund Index (Benchmark) 3.81 10379.60 9.54 13141.96 8.12 14778.21 7.28 34489.66
CRISIL 10 Year Gilt Index (Additional Benchmark) 2.23 10222.59 8.71 12846.63 6.50 13708.09 5.79 26988.53
NAV (Rs.) Per Unit (as on July 30,2021 : 34.9476) 33.0068 27.8402 24.2543 10.00
ICICI Prudential Thematic Advantage Fund (FOF) 68.73 16848.54 17.31 16144.86 15.96 20985.97 15.10 119293.90 18-Dec-03
Nifty 200 TRI (Benchmark) 48.73 14856.84 13.51 14625.36 13.52 18868.80 14.31 105691.40
Nifty 50 TRI (Additional Benchmark) 44.30 14415.96 12.90 14391.01 14.18 19418.55 14.74 112851.42
NAV (Rs.) Per Unit (as on July 30,2021 : 119.2939) 70.8037 73.8897 56.8446 10.00
ICICI Prudential Asset Allocator Fund (FOF) 29.04 12895.48 13.08 14460.00 12.40 17955.86 12.12 75167.00 18-Dec-03
CRISIL Hybrid 50 + 50 - Moderate Index (Benchmark) 25.17 12509.06 13.00 14427.73 11.55 17284.59 10.98 62756.21
Nifty 50 TRI (Additional Benchmark) 44.30 14415.96 12.90 14391.01 14.18 19418.55 14.74 112851.42
NAV (Rs.) Per Unit (as on July 30,2021 : 75.1670) 58.2894 51.9827 41.8621 10.00
ICICI Prudential Income Optimizer Fund (FOF) 17.92 11786.96 9.57 13156.02 8.44 15000.33 8.60 42811.40 18-Dec-03
NIFTY 50 TRI (35%) + CRISIL Composite Bond Fund Index (65%) (Benchmark) 16.86 11681.46 11.97 14039.67 10.00 16116.66 8.78 44110.71
CRISIL 10 Year Gilt Index (Additional Benchmark) 2.23 10222.59 8.71 12846.63 6.50 13708.09 5.79 26988.53
NAV (Rs.) Per Unit (as on July 30,2021 : 42.8114) 36.3210 32.5413 28.5403 10.00
ICICI Prudential BHARAT 22 FOF 56.56 15636.46 4.16 11301.71 - - 5.77 11892.00 29-Jun-18
S&P BSE Bharat 22 TRI (Benchmark) 57.53 15733.28 4.23 11324.28 - - 5.88 11928.54
Nifty 50 TRI (Additional Benchmark) 44.30 14415.96 12.90 14391.01 - - 14.74 15286.97
NAV (Rs.) Per Unit (as on July 30,2021 : 11.8920) 7.6053 10.5223 - 10.00
ICICI Prudential Global Advantage Fund (FOF) 20.27 12020.83 - - - - 19.49 13812.90 07-Oct-19
S&P Global 1200 Index (80%) + S&P BSE Sensex TRI (20%) (Benchmark) 35.70 13558.72 - - - - 26.18 15246.83
Nifty 50 TRI (Additional Benchmark) 44.30 14415.96 - - - - 22.60 14471.83
NAV (Rs.) Per Unit (as on July 30,2021 : 13.8129) 11.4908 - - 10.00
ICICI Prudential India Equity (FOF) 66.02 16579.28 - - - - 34.53 15272.00 25-Feb-20
S&P BSE 500 TRI (Benchmark) 53.59 15341.08 - - - - 29.08 14396.00
Nifty 50 TRI (Additional Benchmark) 44.30 14415.96 - - - - 24.14 13616.51
NAV (Rs.) Per Unit (as on July 30,2021 : 15.2720) 9.2115 - - 10.00
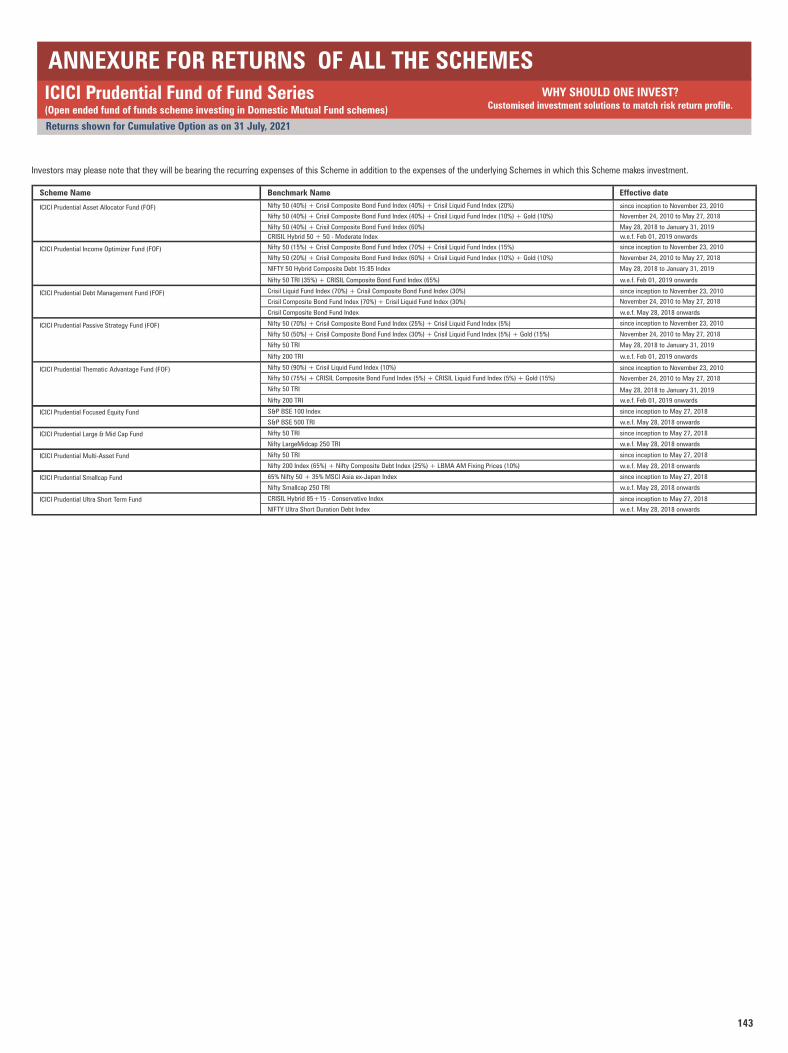
143
Returns shown for Cumulative Option as on 31 July, 2021
ANNEXURE FOR RETURNS OF ALL THE SCHEMES
ICICI Prudential Fund of Fund Series(Open ended fund of funds scheme investing in Domestic Mutual Fund schemes)
WHY SHOULD ONE INVEST?Customised investment solutions to match risk return profile.
Investors may please note that they will be bearing the recurring expenses of this Scheme in addition to the expenses of the underlying Schemes in which this Scheme makes investment.
Scheme Name
Nifty 50 (40%) + Crisil Composite Bond Fund Index (40%) + Crisil Liquid Fund Index (20%)
Nifty 50 (40%) + Crisil Composite Bond Fund Index (40%) + Crisil Liquid Fund Index (10%) + Gold (10%)
Nifty 50 (40%) + Crisil Composite Bond Fund Index (60%)
Nifty 50 (15%) + Crisil Composite Bond Fund Index (70%) + Crisil Liquid Fund Index (15%)
Nifty 50 (20%) + Crisil Composite Bond Fund Index (60%) + Crisil Liquid Fund Index (10%) + Gold (10%)
NIFTY 50 Hybrid Composite Debt 15:85 Index
Nifty 50 TRI (35%) + CRISIL Composite Bond Fund Index (65%)
Crisil Liquid Fund Index (70%) + Crisil Composite Bond Fund Index (30%)
Crisil Composite Bond Fund Index (70%) + Crisil Liquid Fund Index (30%)
Crisil Composite Bond Fund Index w.e.f. May 28, 2018 onwards
Nifty 50 (70%) + Crisil Composite Bond Fund Index (25%) + Crisil Liquid Fund Index (5%)
Nifty 50 (50%) + Crisil Composite Bond Fund Index (30%) + Crisil Liquid Fund Index (5%) + Gold (15%)
Nifty 50 TRI
Nifty 200 TRI
May 28, 2018 to January 31, 2019
w.e.f. Feb 01, 2019 onwards
Nifty 50 (90%) + Crisil Liquid Fund Index (10%)
Nifty 50 (75%) + CRISIL Composite Bond Fund Index (5%) + CRISIL Liquid Fund Index (5%) + Gold (15%)
Nifty 50 TRI
Nifty 200 TRI w.e.f. Feb 01, 2019 onwards
S&P BSE 100 Index since inception to May 27, 2018
S&P BSE 500 TRI w.e.f. May 28, 2018 onwards
Nifty 50 TRI since inception to May 27, 2018
Nifty LargeMidcap 250 TRI w.e.f. May 28, 2018 onwards
Nifty 50 TRI since inception to May 27, 2018
Nifty 200 Index (65%) + Nifty Composite Debt Index (25%) + LBMA AM Fixing Prices (10%)
65% Nifty 50 + 35% MSCI Asia ex-Japan Index
Nifty Smallcap 250 TRI w.e.f. May 28, 2018 onwards
CRISIL Hybrid 85+15 - Conservative Index
NIFTY Ultra Short Duration Debt Index w.e.f. May 28, 2018 onwards
ICICI Prudential Asset Allocator Fund (FOF)
ICICI Prudential Income Optimizer Fund (FOF)
ICICI Prudential Debt Management Fund (FOF)
ICICI Prudential Passive Strategy Fund (FOF)
ICICI Prudential Thematic Advantage Fund (FOF)
ICICI Prudential Smallcap Fund
ICICI Prudential Ultra Short Term Fund
ICICI Prudential Large & Mid Cap Fund
ICICI Prudential Multi-Asset Fund
ICICI Prudential Focused Equity Fund
May 28, 2018 to January 31, 2019
w.e.f. Feb 01, 2019 onwards
CRISIL Hybrid 50 + 50 - Moderate Index
May 28, 2018 to January 31, 2019
May 28, 2018 to January 31, 2019
November 24, 2010 to May 27, 2018
since inception to November 23, 2010
w.e.f. Feb 01, 2019 onwards
November 24, 2010 to May 27, 2018
since inception to November 23, 2010
Effective dateBenchmark Name
since inception to November 23, 2010
November 24, 2010 to May 27, 2018
since inception to November 23, 2010
November 24, 2010 to May 27, 2018
since inception to November 23, 2010
November 24, 2010 to May 27, 2018
w.e.f. May 28, 2018 onwards
since inception to May 27, 2018
since inception to May 27, 2018
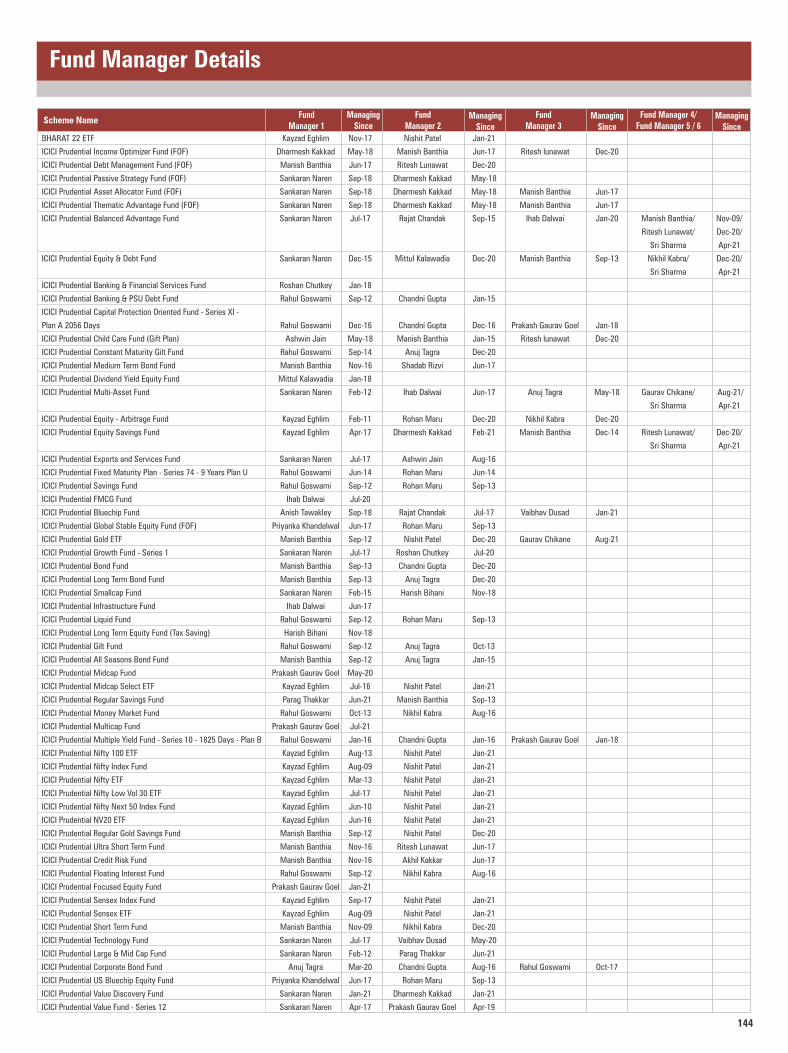
144
Fund Manager Details
Scheme NameFund
Manager 1Managing
SinceFund
Manager 2Managing
Since
Fund Manager 3
Managing Since
Fund Manager 4/Fund Manager 5 / 6
Managing Since
BHARAT 22 ETF Kayzad Eghlim Nov-17 Nishit Patel Jan-21
ICICI Prudential Income Optimizer Fund (FOF) Dharmesh Kakkad May-18 Manish Banthia Jun-17 Ritesh lunawat Dec-20
ICICI Prudential Debt Management Fund (FOF) Manish Banthia Jun-17 Ritesh Lunawat Dec-20
ICICI Prudential Passive Strategy Fund (FOF) Sankaran Naren Sep-18 Dharmesh Kakkad May-18
ICICI Prudential Asset Allocator Fund (FOF) Sankaran Naren Sep-18 Dharmesh Kakkad May-18 Manish Banthia Jun-17
ICICI Prudential Thematic Advantage Fund (FOF) Sankaran Naren Sep-18 Dharmesh Kakkad May-18 Manish Banthia Jun-17
ICICI Prudential Balanced Advantage Fund Sankaran Naren Jul-17 Rajat Chandak Sep-15 Ihab Dalwai Jan-20 Manish Banthia/ Nov-09/
Ritesh Lunawat/ Dec-20/
Sri Sharma Apr-21
ICICI Prudential Equity & Debt Fund Sankaran Naren Dec-15 Mittul Kalawadia Dec-20 Manish Banthia Sep-13 Nikhil Kabra/ Dec-20/
Sri Sharma Apr-21
ICICI Prudential Banking & Financial Services Fund Roshan Chutkey Jan-18
ICICI Prudential Banking & PSU Debt Fund Rahul Goswami Sep-12 Chandni Gupta Jan-15
ICICI Prudential Capital Protection Oriented Fund - Series XI -
Plan A 2056 Days Rahul Goswami Dec-16 Chandni Gupta Dec-16 Prakash Gaurav Goel Jan-18
ICICI Prudential Child Care Fund (Gift Plan) Ashwin Jain May-18 Manish Banthia Jan-15 Ritesh lunawat Dec-20
ICICI Prudential Constant Maturity Gilt Fund Rahul Goswami Sep-14 Anuj Tagra Dec-20
ICICI Prudential Medium Term Bond Fund Manish Banthia Nov-16 Shadab Rizvi Jun-17
ICICI Prudential Dividend Yield Equity Fund Mittul Kalawadia Jan-18
ICICI Prudential Multi-Asset Fund Sankaran Naren Feb-12 Ihab Dalwai Jun-17 Anuj Tagra May-18 Gaurav Chikane/ Aug-21 /
Sri Sharma Apr-21
ICICI Prudential Equity - Arbitrage Fund Kayzad Eghlim Feb-11 Rohan Maru Dec-20 Nikhil Kabra Dec-20
ICICI Prudential Equity Savings Fund Kayzad Eghlim Apr-17 Dharmesh Kakkad Feb-21 Manish Banthia Dec-14 Ritesh Lunawat/ Dec-20/
Sri Sharma Apr-21
ICICI Prudential Exports and Services Fund Sankaran Naren Jul-17 Ashwin Jain Aug-16
ICICI Prudential Fixed Maturity Plan - Series 74 - 9 Years Plan U Rahul Goswami Jun-14 Rohan Maru Jun-14
ICICI Prudential Savings Fund Rahul Goswami Sep-12 Rohan Maru Sep-13
ICICI Prudential FMCG Fund Ihab Dalwai Jul-20
ICICI Prudential Bluechip Fund Anish Tawakley Sep-18 Rajat Chandak Jul-17 Vaibhav Dusad Jan-21
ICICI Prudential Global Stable Equity Fund (FOF) Priyanka Khandelwal Jun-17 Rohan Maru Sep-13
ICICI Prudential Gold ETF Manish Banthia Sep-12 Nishit Patel Dec-20 Gaurav Chikane Aug-21
ICICI Prudential Growth Fund - Series 1 Sankaran Naren Jul-17 Roshan Chutkey Jul-20
ICICI Prudential Bond Fund Manish Banthia Sep-13 Chandni Gupta Dec-20
ICICI Prudential Long Term Bond Fund Manish Banthia Sep-13 Anuj Tagra Dec-20
ICICI Prudential Smallcap Fund Sankaran Naren Feb-15 Harish Bihani Nov-18
ICICI Prudential Infrastructure Fund Ihab Dalwai Jun-17
ICICI Prudential Liquid Fund Rahul Goswami Sep-12 Rohan Maru Sep-13
ICICI Prudential Long Term Equity Fund (Tax Saving) Harish Bihani Nov-18
ICICI Prudential Gilt Fund Rahul Goswami Sep-12 Anuj Tagra Oct-13
ICICI Prudential All Seasons Bond Fund Manish Banthia Sep-12 Anuj Tagra Jan-15
ICICI Prudential Midcap Fund Prakash Gaurav Goel May-20
ICICI Prudential Midcap Select ETF Kayzad Eghlim Jul-16 Nishit Patel Jan-21
ICICI Prudential Regular Savings Fund Parag Thakkar Jun-21 Manish Banthia Sep-13
ICICI Prudential Money Market Fund Rahul Goswami Oct-13 Nikhil Kabra Aug-16
ICICI Prudential Multicap Fund Prakash Gaurav Goel Jul-21
ICICI Prudential Multiple Yield Fund - Series 10 - 1825 Days - Plan B Rahul Goswami Jan-16 Chandni Gupta Jan-16 Prakash Gaurav Goel Jan-18
ICICI Prudential Nifty 100 ETF Kayzad Eghlim Aug-13 Nishit Patel Jan-21
ICICI Prudential Nifty Index Fund Kayzad Eghlim Aug-09 Nishit Patel Jan-21
ICICI Prudential Nifty ETF Kayzad Eghlim Mar-13 Nishit Patel Jan-21
ICICI Prudential Nifty Low Vol 30 ETF Kayzad Eghlim Jul-17 Nishit Patel Jan-21
ICICI Prudential Nifty Next 50 Index Fund Kayzad Eghlim Jun-10 Nishit Patel Jan-21
ICICI Prudential NV20 ETF Kayzad Eghlim Jun-16 Nishit Patel Jan-21
ICICI Prudential Regular Gold Savings Fund Manish Banthia Sep-12 Nishit Patel Dec-20
ICICI Prudential Ultra Short Term Fund Manish Banthia Nov-16 Ritesh Lunawat Jun-17
ICICI Prudential Credit Risk Fund Manish Banthia Nov-16 Akhil Kakkar Jun-17
ICICI Prudential Floating Interest Fund Rahul Goswami Sep-12 Nikhil Kabra Aug-16
ICICI Prudential Focused Equity Fund Prakash Gaurav Goel Jan-21
ICICI Prudential Sensex Index Fund Kayzad Eghlim Sep-17 Nishit Patel Jan-21
ICICI Prudential Sensex ETF Kayzad Eghlim Aug-09 Nishit Patel Jan-21
ICICI Prudential Short Term Fund Manish Banthia Nov-09 Nikhil Kabra Dec-20
ICICI Prudential Technology Fund Sankaran Naren Jul-17 Vaibhav Dusad May-20
ICICI Prudential Large & Mid Cap Fund Sankaran Naren Feb-12 Parag Thakkar Jun-21
ICICI Prudential Corporate Bond Fund Anuj Tagra Mar-20 Chandni Gupta Aug-16 Rahul Goswami Oct-17
ICICI Prudential US Bluechip Equity Fund Priyanka Khandelwal Jun-17 Rohan Maru Sep-13
ICICI Prudential Value Discovery Fund Sankaran Naren Jan-21 Dharmesh Kakkad Jan-21
ICICI Prudential Value Fund - Series 12 Sankaran Naren Apr-17 Prakash Gaurav Goel Apr-19
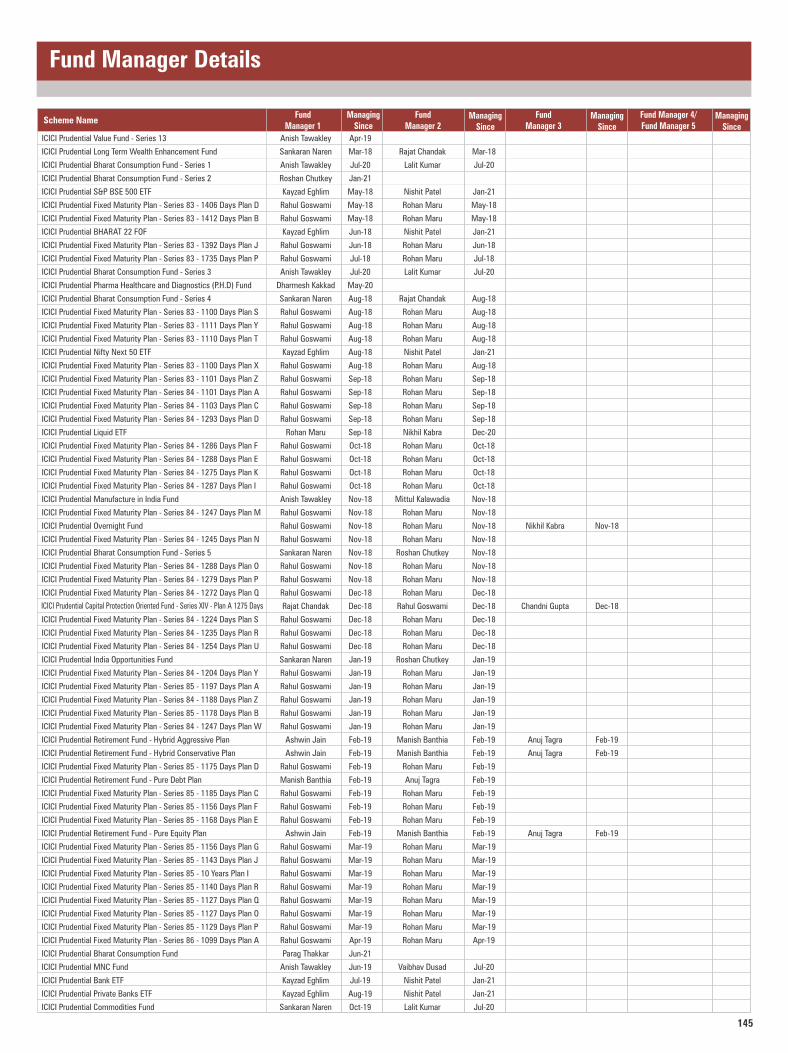
145
Fund Manager Details
Scheme NameFund
Manager 1Managing
SinceFund
Manager 2Managing
Since
Fund Manager 3
Managing Since
Fund Manager 4/Fund Manager 5
Managing Since
ICICI Prudential Value Fund - Series 13 Anish Tawakley Apr-19
ICICI Prudential Long Term Wealth Enhancement Fund Sankaran Naren Mar-18 Rajat Chandak Mar-18
ICICI Prudential Bharat Consumption Fund - Series 1 Anish Tawakley Jul-20 Lalit Kumar Jul-20
ICICI Prudential Bharat Consumption Fund - Series 2 Roshan Chutkey Jan-21
ICICI Prudential S&P BSE 500 ETF Kayzad Eghlim May-18 Nishit Patel Jan-21
ICICI Prudential Fixed Maturity Plan - Series 83 - 1406 Days Plan D Rahul Goswami May-18 Rohan Maru May-18
ICICI Prudential Fixed Maturity Plan - Series 83 - 1412 Days Plan B Rahul Goswami May-18 Rohan Maru May-18
ICICI Prudential BHARAT 22 FOF Kayzad Eghlim Jun-18 Nishit Patel Jan-21
ICICI Prudential Fixed Maturity Plan - Series 83 - 1392 Days Plan J Rahul Goswami Jun-18 Rohan Maru Jun-18
ICICI Prudential Fixed Maturity Plan - Series 83 - 1735 Days Plan P Rahul Goswami Jul-18 Rohan Maru Jul-18
ICICI Prudential Bharat Consumption Fund - Series 3 Anish Tawakley Jul-20 Lalit Kumar Jul-20
ICICI Prudential Pharma Healthcare and Diagnostics (P.H.D) Fund Dharmesh Kakkad May-20
ICICI Prudential Bharat Consumption Fund - Series 4 Sankaran Naren Aug-18 Rajat Chandak Aug-18
ICICI Prudential Fixed Maturity Plan - Series 83 - 1100 Days Plan S Rahul Goswami Aug-18 Rohan Maru Aug-18
ICICI Prudential Fixed Maturity Plan - Series 83 - 1111 Days Plan Y Rahul Goswami Aug-18 Rohan Maru Aug-18
ICICI Prudential Fixed Maturity Plan - Series 83 - 1110 Days Plan T Rahul Goswami Aug-18 Rohan Maru Aug-18
ICICI Prudential Nifty Next 50 ETF Kayzad Eghlim Aug-18 Nishit Patel Jan-21
ICICI Prudential Fixed Maturity Plan - Series 83 - 1100 Days Plan X Rahul Goswami Aug-18 Rohan Maru Aug-18
ICICI Prudential Fixed Maturity Plan - Series 83 - 1101 Days Plan Z Rahul Goswami Sep-18 Rohan Maru Sep-18
ICICI Prudential Fixed Maturity Plan - Series 84 - 1101 Days Plan A Rahul Goswami Sep-18 Rohan Maru Sep-18
ICICI Prudential Fixed Maturity Plan - Series 84 - 1103 Days Plan C Rahul Goswami Sep-18 Rohan Maru Sep-18
ICICI Prudential Fixed Maturity Plan - Series 84 - 1293 Days Plan D Rahul Goswami Sep-18 Rohan Maru Sep-18
ICICI Prudential Liquid ETF Rohan Maru Sep-18 Nikhil Kabra Dec-20
ICICI Prudential Fixed Maturity Plan - Series 84 - 1286 Days Plan F Rahul Goswami Oct-18 Rohan Maru Oct-18
ICICI Prudential Fixed Maturity Plan - Series 84 - 1288 Days Plan E Rahul Goswami Oct-18 Rohan Maru Oct-18
ICICI Prudential Fixed Maturity Plan - Series 84 - 1275 Days Plan K Rahul Goswami Oct-18 Rohan Maru Oct-18
ICICI Prudential Fixed Maturity Plan - Series 84 - 1287 Days Plan I Rahul Goswami Oct-18 Rohan Maru Oct-18
ICICI Prudential Manufacture in India Fund Anish Tawakley Nov-18 Mittul Kalawadia Nov-18
ICICI Prudential Fixed Maturity Plan - Series 84 - 1247 Days Plan M Rahul Goswami Nov-18 Rohan Maru Nov-18
ICICI Prudential Overnight Fund Rahul Goswami Nov-18 Rohan Maru Nov-18 Nikhil Kabra Nov-18
ICICI Prudential Fixed Maturity Plan - Series 84 - 1245 Days Plan N Rahul Goswami Nov-18 Rohan Maru Nov-18
ICICI Prudential Bharat Consumption Fund - Series 5 Sankaran Naren Nov-18 Roshan Chutkey Nov-18
ICICI Prudential Fixed Maturity Plan - Series 84 - 1288 Days Plan O Rahul Goswami Nov-18 Rohan Maru Nov-18
ICICI Prudential Fixed Maturity Plan - Series 84 - 1279 Days Plan P Rahul Goswami Nov-18 Rohan Maru Nov-18
ICICI Prudential Fixed Maturity Plan - Series 84 - 1272 Days Plan Q Rahul Goswami Dec-18 Rohan Maru Dec-18
Rajat Chandak Dec-18 Rahul Goswami Dec-18 Chandni Gupta Dec-18
ICICI Prudential Fixed Maturity Plan - Series 84 - 1224 Days Plan S Rahul Goswami Dec-18 Rohan Maru Dec-18
ICICI Prudential Fixed Maturity Plan - Series 84 - 1235 Days Plan R Rahul Goswami Dec-18 Rohan Maru Dec-18
ICICI Prudential Fixed Maturity Plan - Series 84 - 1254 Days Plan U Rahul Goswami Dec-18 Rohan Maru Dec-18
ICICI Prudential India Opportunities Fund Sankaran Naren Jan-19 Roshan Chutkey Jan-19
ICICI Prudential Fixed Maturity Plan - Series 84 - 1204 Days Plan Y Rahul Goswami Jan-19 Rohan Maru Jan-19
ICICI Prudential Fixed Maturity Plan - Series 85 - 1197 Days Plan A Rahul Goswami Jan-19 Rohan Maru Jan-19
ICICI Prudential Fixed Maturity Plan - Series 84 - 1188 Days Plan Z Rahul Goswami Jan-19 Rohan Maru Jan-19
ICICI Prudential Fixed Maturity Plan - Series 85 - 1178 Days Plan B Rahul Goswami Jan-19 Rohan Maru Jan-19
ICICI Prudential Fixed Maturity Plan - Series 84 - 1247 Days Plan W Rahul Goswami Jan-19 Rohan Maru Jan-19
ICICI Prudential Retirement Fund - Hybrid Aggressive Plan Ashwin Jain Feb-19 Manish Banthia Feb-19 Anuj Tagra Feb-19
ICICI Prudential Retirement Fund - Hybrid Conservative Plan Ashwin Jain Feb-19 Manish Banthia Feb-19 Anuj Tagra Feb-19
ICICI Prudential Fixed Maturity Plan - Series 85 - 1175 Days Plan D Rahul Goswami Feb-19 Rohan Maru Feb-19
ICICI Prudential Retirement Fund - Pure Debt Plan Manish Banthia Feb-19 Anuj Tagra Feb-19
ICICI Prudential Fixed Maturity Plan - Series 85 - 1185 Days Plan C Rahul Goswami Feb-19 Rohan Maru Feb-19
ICICI Prudential Fixed Maturity Plan - Series 85 - 1156 Days Plan F Rahul Goswami Feb-19 Rohan Maru Feb-19
ICICI Prudential Fixed Maturity Plan - Series 85 - 1168 Days Plan E Rahul Goswami Feb-19 Rohan Maru Feb-19
ICICI Prudential Retirement Fund - Pure Equity Plan Ashwin Jain Feb-19 Manish Banthia Feb-19 Anuj Tagra Feb-19
ICICI Prudential Fixed Maturity Plan - Series 85 - 1156 Days Plan G Rahul Goswami Mar-19 Rohan Maru Mar-19
ICICI Prudential Fixed Maturity Plan - Series 85 - 1143 Days Plan J Rahul Goswami Mar-19 Rohan Maru Mar-19
ICICI Prudential Fixed Maturity Plan - Series 85 - 10 Years Plan I Rahul Goswami Mar-19 Rohan Maru Mar-19
ICICI Prudential Fixed Maturity Plan - Series 85 - 1140 Days Plan R Rahul Goswami Mar-19 Rohan Maru Mar-19
ICICI Prudential Fixed Maturity Plan - Series 85 - 1127 Days Plan Q Rahul Goswami Mar-19 Rohan Maru Mar-19
ICICI Prudential Fixed Maturity Plan - Series 85 - 1127 Days Plan O Rahul Goswami Mar-19 Rohan Maru Mar-19
ICICI Prudential Fixed Maturity Plan - Series 85 - 1129 Days Plan P Rahul Goswami Mar-19 Rohan Maru Mar-19
ICICI Prudential Fixed Maturity Plan - Series 86 - 1099 Days Plan A Rahul Goswami Apr-19 Rohan Maru Apr-19
ICICI Prudential Bharat Consumption Fund Parag Thakkar Jun-21
ICICI Prudential MNC Fund Anish Tawakley Jun-19 Vaibhav Dusad Jul-20
ICICI Prudential Bank ETF Kayzad Eghlim Jul-19 Nishit Patel Jan-21
ICICI Prudential Private Banks ETF Kayzad Eghlim Aug-19 Nishit Patel Jan-21
ICICI Prudential Commodities Fund Sankaran Naren Oct-19 Lalit Kumar Jul-20
ICICI Prudential Capital Protection Oriented Fund - Series XIV - Plan A 1275 Days

146
Fund Manager Details
Scheme NameFund
Manager 1Managing
SinceFund
Manager 2Managing
Since
Fund Manager 3
Managing Since
Fund Manager 4/Fund Manager 5
Managing Since
ICICI Prudential Global Advantage Fund (FOF) Sankaran Naren Oct-19 Dharmesh Kakkad Oct-19
ICICI Prudential Fixed Maturity Plan - Series 87 - 1214 Days Plan A Rahul Goswami Dec-19 Rohan Maru Dec-19
ICICI Prudential Fixed Maturity Plan - Series 87 - 1174 Days Plan B Rahul Goswami Jan-20 Rohan Maru Jan-20
ICICI Prudential Midcap 150 ETF Kayzad Eghlim Jan-20 Nishit Patel Jan-21
ICICI Prudential India Equity (FOF) Dharmesh Kakkad Feb-20
ICICI Prudential FMP - Series 87 - 1141 Days Plan G Rahul Goswami Mar-20 Rohan Maru Mar-20
ICICI Prudential Alpha Low Vol 30 ETF Kayzad Eghlim Aug-20 Nishit Patel Jan-21
ICICI Prudential IT ETF Kayzad Eghlim Aug-20 Nishit Patel Jan-21
ICICI Prudential ESG Fund Lakshminarayanan K.G Jan-21
ICICI Prudential Quant Fund Roshan Chutkey Dec-20
ICICI Prudential Business Cycle Fund Anish Tawakley Jan-21 Ihab Dalwai Jan-21 Manish Banthia Jan-21 Lalit Kumar Jan-21
ICICI Prudential Nifty Low Vol 30 ETF FOF Kayzad Eghlim Apr-21 Nishit Patel Apr-21
ICICI Prudential Healthcare ETF Kayzad Eghlim May-21 Nishit Patel May-21
ICICI Prudential Flexicap Fund Rajat Chandak Jul-21 Priyanka Khandelwal Jul-21
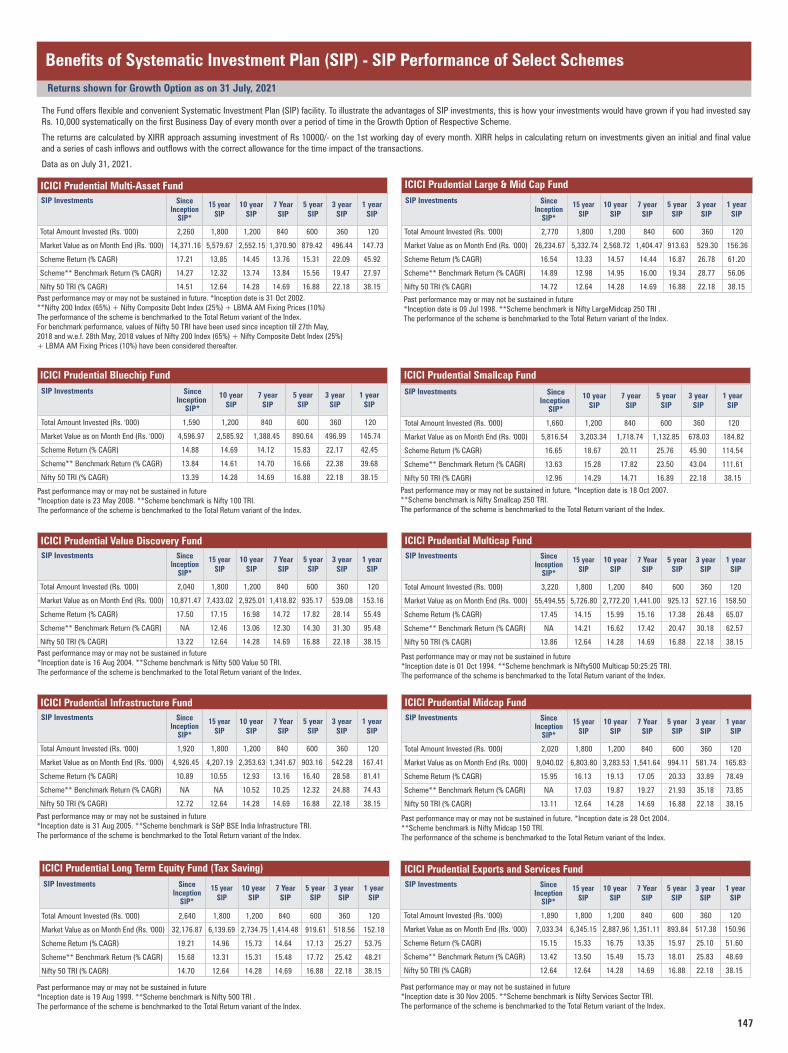
147
Past performance may or may not be sustained in future*Inception date is 31 Aug 2005. **Scheme benchmark is S&P BSE India Infrastructure TRI.The performance of the scheme is benchmarked to the Total Return variant of the Index.
Past performance may or may not be sustained in future*Inception date is 30 Nov 2005. **Scheme benchmark is Nifty Services Sector TRI.The performance of the scheme is benchmarked to the Total Return variant of the Index.
Benefits of Systematic Investment Plan (SIP) - SIP Performance of Select Schemes
The Fund offers flexible and convenient Systematic Investment Plan (SIP) facility. To illustrate the advantages of SIP investments, this is how your investments would have grown if you had invested say Rs. 10,000 systematically on the first Business Day of every month over a period of time in the Growth Option of Respective Scheme.
The returns are calculated by XIRR approach assuming investment of Rs 10000/- on the 1st working day of every month. XIRR helps in calculating return on investments given an initial and final value and a series of cash inflows and outflows with the correct allowance for the time impact of the transactions.
Data as on July 31, 2021.
Returns shown for Growth Option as on 31 July, 2021
10 year SIP
5 year SIP
3 year SIP
1 year SIP
Since Inception
SIP*
SIP Investments15 year
SIP7 Year
SIP
ICICI Prudential Infrastructure Fund
Total Amount Invested (Rs. '000) 1,920 1,800 1,200 840 600 360 120
Market Value as on Month End (Rs. '000) 4,926.45 4,207.19 2,353.63 1,341.67 903.16 542.28 167.41
Scheme Return (% CAGR) 10.89 10.55 12.93 13.16 16.40 28.58 81.41
Scheme** Benchmark Return (% CAGR) NA NA 10.52 10.25 12.32 24.88 74.43
Nifty 50 TRI (% CAGR) 12.72 12.64 14.28 14.69 16.88 22.18 38.15
ICICI Prudential Exports and Services Fund
10 year SIP
5 year SIP
3 year SIP
1 year SIP
Since Inception
SIP*
SIP Investments15 year
SIP7 Year
SIP
Total Amount Invested (Rs. '000) 1,890 1,800 1,200 840 600 360 120
Market Value as on Month End (Rs. '000) 7,033.34 6,345.15 2,887.96 1,351.11 893.84 517.38 150.96
Scheme Return (% CAGR) 15.15 15.33 16.75 13.35 15.97 25.10 51.60
Scheme** Benchmark Return (% CAGR) 13.42 13.50 15.49 15.73 18.01 25.83 48.69
Nifty 50 TRI (% CAGR) 12.64 12.64 14.28 14.69 16.88 22.18 38.15
Past performance may or may not be sustained in future. *Inception date is 31 Oct 2002. **Nifty 200 Index (65%) + Nifty Composite Debt Index (25%) + LBMA AM Fixing Prices (10%)The performance of the scheme is benchmarked to the Total Return variant of the Index. For benchmark performance, values of Nifty 50 TRI have been used since inception till 27th May, 2018 and w.e.f. 28th May, 2018 values of Nifty 200 Index (65%) + Nifty Composite Debt Index (25%) + LBMA AM Fixing Prices (10%) have been considered thereafter.
10 year SIP
5 year SIP
3 year SIP
1 year SIP
Since Inception
SIP*
SIP Investments15 year
SIP7 Year
SIP
ICICI Prudential Multi-Asset Fund
Total Amount Invested (Rs. '000) 2,260 1,800 1,200 840 600 360 120
Market Value as on Month End (Rs. '000) 14,371.16 5,579.67 2,552.15 1,370.90 879.42 496.44 147.73
Scheme Return (% CAGR) 17.21 13.85 14.45 13.76 15.31 22.09 45.92
Scheme** Benchmark Return (% CAGR) 14.27 12.32 13.74 13.84 15.56 19.47 27.97
Nifty 50 TRI (% CAGR) 14.51 12.64 14.28 14.69 16.88 22.18 38.15
ICICI Prudential Large & Mid Cap Fund
Past performance may or may not be sustained in future*Inception date is 09 Jul 1998. **Scheme benchmark is Nifty LargeMidcap 250 TRI .The performance of the scheme is benchmarked to the Total Return variant of the Index.
10 year SIP
5 year SIP
3 year SIP
Since Inception
SIP*
SIP Investments15 year
SIP7 year
SIP
Total Amount Invested (Rs. '000) 2,770 1,800 1,200 840 600 360 120
Market Value as on Month End (Rs. '000) 26,234.67 5,332.74 2,568.72 1,404.47 913.63 529.30 156.36
Scheme Return (% CAGR) 16.54 13.33 14.57 14.44 16.87 26.78 61.20
Scheme** Benchmark Return (% CAGR) 14.89 12.98 14.95 16.00 19.34 28.77 56.06
Nifty 50 TRI (% CAGR) 14.72 12.64 14.28 14.69 16.88 22.18 38.15
1 year SIP
Past performance may or may not be sustained in future*Inception date is 23 May 2008. **Scheme benchmark is Nifty 100 TRI.The performance of the scheme is benchmarked to the Total Return variant of the Index.
10 year SIP
5 year SIP
3 year SIP
1 year SIP
SIP Investments Since Inception
SIP*
7 yearSIP
ICICI Prudential Bluechip Fund
Total Amount Invested (Rs. '000) 1,590 1,200 840 600 360 120
Market Value as on Month End (Rs. '000) 4,596.97 2,585.92 1,388.45 890.64 496.99 145.74
Scheme Return (% CAGR) 14.88 14.69 14.12 15.83 22.17 42.45
Scheme** Benchmark Return (% CAGR) 13.84 14.61 14.70 16.66 22.38 39.68
Nifty 50 TRI (% CAGR) 13.39 14.28 14.69 16.88 22.18 38.15
Past performance may or may not be sustained in future. *Inception date is 18 Oct 2007. **Scheme benchmark is Nifty Smallcap 250 TRI.The performance of the scheme is benchmarked to the Total Return variant of the Index.
10 year SIP
5 year SIP
3 year SIP
1 year SIP
SIP Investments Since Inception
SIP*
7 yearSIP
ICICI Prudential Smallcap Fund
Total Amount Invested (Rs. '000) 1,660 1,200 840 600 360 120
Market Value as on Month End (Rs. '000) 5,816.54 3,203.34 1,718.74 1,132.85 678.03 184.82
Scheme Return (% CAGR) 16.65 18.67 20.11 25.76 45.90 114.54
Scheme** Benchmark Return (% CAGR) 13.63 15.28 17.82 23.50 43.04 111.61
Nifty 50 TRI (% CAGR) 12.96 14.29 14.71 16.89 22.18 38.15
Past performance may or may not be sustained in future*Inception date is 16 Aug 2004. **Scheme benchmark is Nifty 500 Value 50 TRI.The performance of the scheme is benchmarked to the Total Return variant of the Index.
10 year SIP
5 year SIP
3 year SIP
1 year SIP
Since Inception
SIP*
SIP Investments15 year
SIP7 Year
SIP
ICICI Prudential Value Discovery Fund
Total Amount Invested (Rs. '000) 2,040 1,800 1,200 840 600 360 120
Market Value as on Month End (Rs. '000) 10,871.47 7,433.02 2,925.01 1,418.82 935.17 539.08 153.16
Scheme Return (% CAGR) 17.50 17.15 16.98 14.72 17.82 28.14 55.49
Scheme** Benchmark Return (% CAGR) NA 12.46 13.06 12.30 14.30 31.30 95.48
Nifty 50 TRI (% CAGR) 13.22 12.64 14.28 14.69 16.88 22.18 38.15
ICICI Prudential Multicap Fund
Past performance may or may not be sustained in future*Inception date is 01 Oct 1994. **Scheme benchmark is Nifty500 Multicap 50:25:25 TRI.The performance of the scheme is benchmarked to the Total Return variant of the Index.
10 year SIP
5 year SIP
3 year SIP
1 year SIP
Since Inception
SIP*
SIP Investments15 year
SIP7 Year
SIP
Total Amount Invested (Rs. '000) 3,220 1,800 1,200 840 600 360 120
Market Value as on Month End (Rs. '000) 55,494.55 5,726.80 2,772.20 1,441.00 925.13 527.16 158.50
Scheme Return (% CAGR) 17.45 14.15 15.99 15.16 17.38 26.48 65.07
Scheme** Benchmark Return (% CAGR) NA 14.21 16.62 17.42 20.47 30.18 62.57
Nifty 50 TRI (% CAGR) 13.86 12.64 14.28 14.69 16.88 22.18 38.15
ICICI Prudential Midcap Fund
Past performance may or may not be sustained in future. *Inception date is 28 Oct 2004. **Scheme benchmark is Nifty Midcap 150 TRI.The performance of the scheme is benchmarked to the Total Return variant of the Index.
10 year SIP
5 year SIP
3 year SIP
1 year SIP
Since Inception
SIP*
SIP Investments15 year
SIP7 Year
SIP
Total Amount Invested (Rs. '000) 2,020 1,800 1,200 840 600 360 120
Market Value as on Month End (Rs. '000) 9,040.02 6,803.80 3,283.53 1,541.64 994.11 581.74 165.83
Scheme Return (% CAGR) 15.95 16.13 19.13 17.05 20.33 33.89 78.49
Scheme** Benchmark Return (% CAGR) NA 17.03 19.87 19.27 21.93 35.18 73.85
Nifty 50 TRI (% CAGR) 13.11 12.64 14.28 14.69 16.88 22.18 38.15
Past performance may or may not be sustained in future*Inception date is 19 Aug 1999. **Scheme benchmark is Nifty 500 TRI .The performance of the scheme is benchmarked to the Total Return variant of the Index.
10 year SIP
5 year SIP
3 year SIP
1 year SIP
Since Inception
SIP*
SIP Investments15 year
SIP7 Year
SIP
ICICI Prudential Long Term Equity Fund (Tax Saving)
Total Amount Invested (Rs. '000) 2,640 1,800 1,200 840 600 360 120
Market Value as on Month End (Rs. '000) 32,176.87 6,139.69 2,734.75 1,414.48 919.61 518.56 152.18
Scheme Return (% CAGR) 19.21 14.96 15.73 14.64 17.13 25.27 53.75
Scheme** Benchmark Return (% CAGR) 15.68 13.31 15.31 15.48 17.72 25.42 48.21
Nifty 50 TRI (% CAGR) 14.70 12.64 14.28 14.69 16.88 22.18 38.15
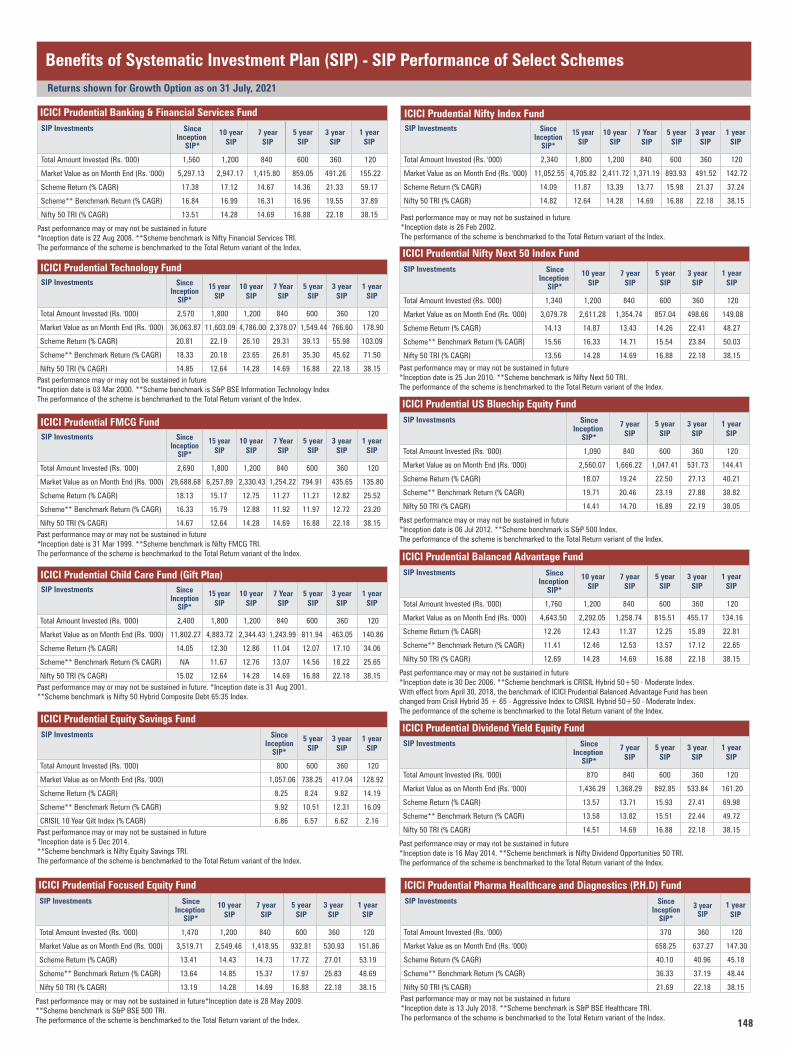
148
Benefits of Systematic Investment Plan (SIP) - SIP Performance of Select Schemes
Returns shown for Growth Option as on 31 July, 2021
Past performance may or may not be sustained in future*Inception date is 22 Aug 2008. **Scheme benchmark is Nifty Financial Services TRI.The performance of the scheme is benchmarked to the Total Return variant of the Index.
10 year SIP
5 year SIP
3 year SIP
1 year SIP
SIP Investments Since Inception
SIP*
7 yearSIP
ICICI Prudential Banking & Financial Services Fund
Total Amount Invested (Rs. '000) 1,560 1,200 840 600 360 120
Market Value as on Month End (Rs. '000) 5,297.13 2,947.17 1,415.80 859.05 491.26 155.22
Scheme Return (% CAGR) 17.38 17.12 14.67 14.36 21.33 59.17
Scheme** Benchmark Return (% CAGR) 16.84 16.99 16.31 16.96 19.55 37.89
Nifty 50 TRI (% CAGR) 13.51 14.28 14.69 16.88 22.18 38.15
Past performance may or may not be sustained in future*Inception date is 03 Mar 2000. **Scheme benchmark is S&P BSE Information Technology IndexThe performance of the scheme is benchmarked to the Total Return variant of the Index.
10 year SIP
5 year SIP
3 year SIP
1 year SIP
Since Inception
SIP*
SIP Investments15 year
SIP7 Year
SIP
ICICI Prudential Technology Fund
Total Amount Invested (Rs. '000) 2,570 1,800 1,200 840 600 360 120
Market Value as on Month End (Rs. '000) 36,063.87 11,603.09 4,786.00 2,378.07 1,549.44 766.60 178.90
Scheme Return (% CAGR) 20.81 22.19 26.10 29.31 39.13 55.98 103.09
Scheme** Benchmark Return (% CAGR) 18.33 20.18 23.65 26.81 35.30 45.62 71.50
Nifty 50 TRI (% CAGR) 14.85 12.64 14.28 14.69 16.88 22.18 38.15
Past performance may or may not be sustained in future*Inception date is 31 Mar 1999. **Scheme benchmark is Nifty FMCG TRI.The performance of the scheme is benchmarked to the Total Return variant of the Index.
10 year SIP
5 year SIP
3 year SIP
1 year SIP
Since Inception
SIP*
SIP Investments15 year
SIP7 Year
SIP
ICICI Prudential FMCG Fund
Total Amount Invested (Rs. '000) 2,690 1,800 1,200 840 600 360 120
Market Value as on Month End (Rs. '000) 29,688.68 6,257.89 2,330.43 1,254.22 794.91 435.65 135.80
Scheme Return (% CAGR) 18.13 15.17 12.75 11.27 11.21 12.82 25.52
Scheme** Benchmark Return (% CAGR) 16.33 15.79 12.88 11.92 11.97 12.72 23.20
Nifty 50 TRI (% CAGR) 14.67 12.64 14.28 14.69 16.88 22.18 38.15
Past performance may or may not be sustained in future. *Inception date is 31 Aug 2001. **Scheme benchmark is Nifty 50 Hybrid Composite Debt 65:35 Index.
10 year SIP
5 year SIP
3 year SIP
1 year SIP
Since Inception
SIP*
SIP Investments15 year
SIP7 Year
SIP
ICICI Prudential Child Care Fund (Gift Plan)
Total Amount Invested (Rs. '000) 2,400 1,800 1,200 840 600 360 120
Market Value as on Month End (Rs. '000) 11,802.27 4,883.72 2,344.43 1,243.99 811.94 463.05 140.86
Scheme Return (% CAGR) 14.05 12.30 12.86 11.04 12.07 17.10 34.06
Scheme** Benchmark Return (% CAGR) NA 11.67 12.76 13.07 14.56 18.22 25.65
Nifty 50 TRI (% CAGR) 15.02 12.64 14.28 14.69 16.88 22.18 38.15
Past performance may or may not be sustained in future*Inception date is 26 Feb 2002.The performance of the scheme is benchmarked to the Total Return variant of the Index.
10 year SIP
5 year SIP
3 year SIP
1 year SIP
Since Inception
SIP*
SIP Investments15 year
SIP7 Year
SIP
ICICI Prudential Nifty Index Fund
Total Amount Invested (Rs. '000) 2,340 1,800 1,200 840 600 360 120
Market Value as on Month End (Rs. '000) 11,052.55 4,705.82 2,411.72 1,371.19 893.93 491.52 142.72
Scheme Return (% CAGR) 14.09 11.87 13.39 13.77 15.98 21.37 37.24
Nifty 50 TRI (% CAGR) 14.82 12.64 14.28 14.69 16.88 22.18 38.15
Past performance may or may not be sustained in future*Inception date is 06 Jul 2012. **Scheme benchmark is S&P 500 Index.The performance of the scheme is benchmarked to the Total Return variant of the Index.
5 year SIP
3 year SIP
1 year SIP
SIP Investments Since Inception
SIP*
7 yearSIP
ICICI Prudential US Bluechip Equity Fund
Total Amount Invested (Rs. '000) 1,090 840 600 360 120
Market Value as on Month End (Rs. '000) 2,560.07 1,666.22 1,047.41 531.73 144.41
Scheme Return (% CAGR) 18.07 19.24 22.50 27.13 40.21
Scheme** Benchmark Return (% CAGR) 19.71 20.46 23.19 27.88 38.82
Nifty 50 TRI (% CAGR) 14.41 14.70 16.89 22.19 38.05
Past performance may or may not be sustained in future*Inception date is 5 Dec 2014. **Scheme benchmark is Nifty Equity Savings TRI.The performance of the scheme is benchmarked to the Total Return variant of the Index.
5 year SIP
3 year SIP
1 year SIP
Since Inception
SIP*
SIP Investments
ICICI Prudential Equity Savings Fund
Total Amount Invested (Rs. '000) 800 600 360 120
Market Value as on Month End (Rs. '000) 1,057.06 738.25 417.04 128.92
Scheme Return (% CAGR) 8.25 8.24 9.82 14.19
Scheme** Benchmark Return (% CAGR) 9.92 10.51 12.31 16.09
CRISIL 10 Year Gilt Index (% CAGR) 6.86 6.57 6.62 2.16
Past performance may or may not be sustained in future*Inception date is 25 Jun 2010. **Scheme benchmark is Nifty Next 50 TRI.The performance of the scheme is benchmarked to the Total Return variant of the Index.
10 year SIP
5 year SIP
3 year SIP
1 year SIP
SIP Investments Since Inception
SIP*
7 yearSIP
ICICI Prudential Nifty Next 50 Index Fund
Total Amount Invested (Rs. '000) 1,340 1,200 840 600 360 120
Market Value as on Month End (Rs. '000) 3,079.78 2,611.28 1,354.74 857.04 498.66 149.08
Scheme Return (% CAGR) 14.13 14.87 13.43 14.26 22.41 48.27
Scheme** Benchmark Return (% CAGR) 15.56 16.33 14.71 15.54 23.84 50.03
Nifty 50 TRI (% CAGR) 13.56 14.28 14.69 16.88 22.18 38.15
Past performance may or may not be sustained in future*Inception date is 30 Dec 2006. **Scheme benchmark is CRISIL Hybrid 50+50 - Moderate Index.With effect from April 30, 2018, the benchmark of ICICI Prudential Balanced Advantage Fund has been changed from Crisil Hybrid 35 + 65 - Aggressive Index to CRISIL Hybrid 50+50 - Moderate Index.The performance of the scheme is benchmarked to the Total Return variant of the Index.
10 year SIP
5 year SIP
3 year SIP
1 year SIP
SIP Investments Since Inception
SIP*
7 yearSIP
ICICI Prudential Balanced Advantage Fund
Total Amount Invested (Rs. '000) 1,760 1,200 840 600 360 120
Market Value as on Month End (Rs. '000) 4,643.50 2,292.05 1,258.74 815.51 455.17 134.16
Scheme Return (% CAGR) 12.26 12.43 11.37 12.25 15.89 22.81
Scheme** Benchmark Return (% CAGR) 11.41 12.46 12.53 13.57 17.12 22.65
Nifty 50 TRI (% CAGR) 12.69 14.28 14.69 16.88 22.18 38.15
Past performance may or may not be sustained in future*Inception date is 16 May 2014. **Scheme benchmark is Nifty Dividend Opportunities 50 TRI.The performance of the scheme is benchmarked to the Total Return variant of the Index.
5 year SIP
3 year SIP
1 year SIP
SIP Investments Since Inception
SIP*
7 yearSIP
ICICI Prudential Dividend Yield Equity Fund
Total Amount Invested (Rs. '000) 870 840 600 360 120
Market Value as on Month End (Rs. '000) 1,436.29 1,368.29 892.85 533.84 161.20
Scheme Return (% CAGR) 13.57 13.71 15.93 27.41 69.98
Scheme** Benchmark Return (% CAGR) 13.58 13.82 15.51 22.44 49.72
Nifty 50 TRI (% CAGR) 14.51 14.69 16.88 22.18 38.15
Past performance may or may not be sustained in future*Inception date is 28 May 2009. **Scheme benchmark is S&P BSE 500 TRI.The performance of the scheme is benchmarked to the Total Return variant of the Index.
10 year SIP
5 year SIP
3 year SIP
1 year SIP
SIP Investments Since Inception
SIP*
7 yearSIP
ICICI Prudential Focused Equity Fund
Total Amount Invested (Rs. '000) 1,470 1,200 840 600 360 120
Market Value as on Month End (Rs. '000) 3,519.71 2,549.46 1,418.95 932.81 530.93 151.86
Scheme Return (% CAGR) 13.41 14.43 14.73 17.72 27.01 53.19
Scheme** Benchmark Return (% CAGR) 13.64 14.85 15.37 17.97 25.83 48.69
Nifty 50 TRI (% CAGR) 13.19 14.28 14.69 16.88 22.18 38.15
Past performance may or may not be sustained in future*Inception date is 13 July 2018. **Scheme benchmark is S&P BSE Healthcare TRI.The performance of the scheme is benchmarked to the Total Return variant of the Index.
1 year SIP
3 year SIP
SIP Investments
ICICI Prudential Pharma Healthcare and Diagnostics (P.H.D) Fund
Since Inception
SIP*
Total Amount Invested (Rs. '000) 370 360 120
Market Value as on Month End (Rs. '000) 658.25 637.27 147.30
Scheme Return (% CAGR) 40.10 40.96 45.18
Scheme** Benchmark Return (% CAGR) 36.33 37.19 48.44
Nifty 50 TRI (% CAGR) 21.69 22.18 38.15
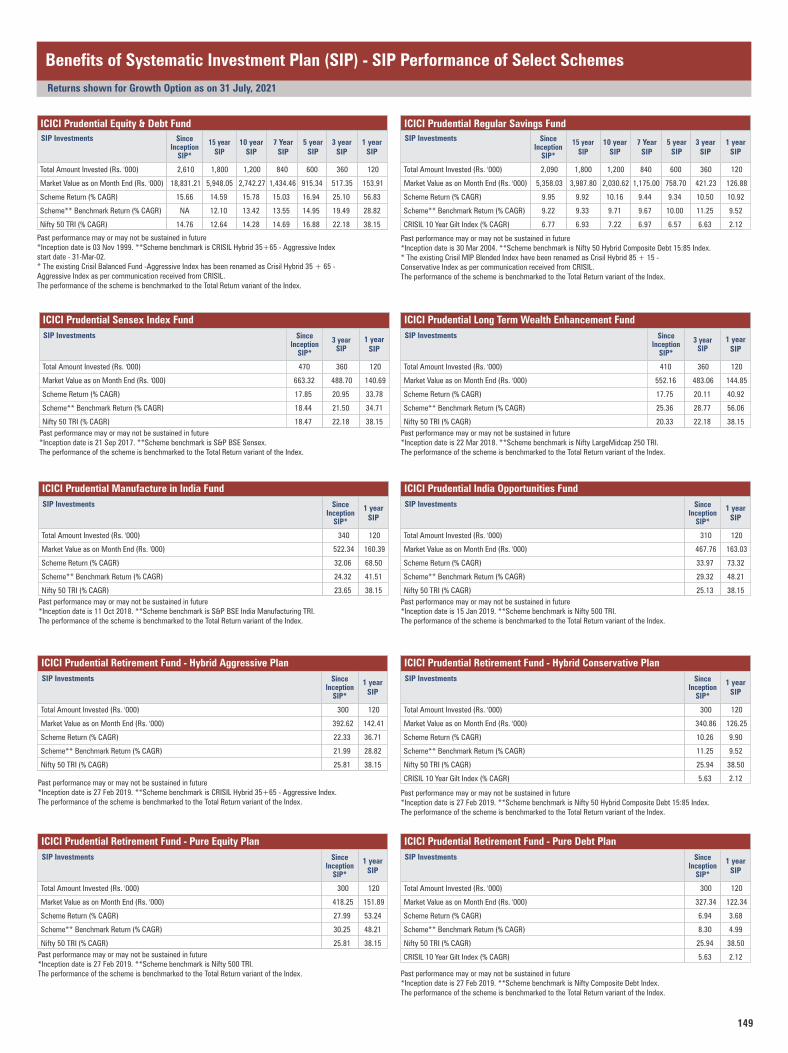
149
Past performance may or may not be sustained in future*Inception date is 11 Oct 2018. **Scheme benchmark is S&P BSE India Manufacturing TRI.The performance of the scheme is benchmarked to the Total Return variant of the Index.
1 year SIP
Since Inception
SIP*
SIP Investments
ICICI Prudential Manufacture in India Fund
Total Amount Invested (Rs. '000) 340 120
Market Value as on Month End (Rs. '000) 522.34 160.39
Scheme Return (% CAGR) 32.06 68.50
Scheme** Benchmark Return (% CAGR) 24.32 41.51
Nifty 50 TRI (% CAGR) 23.65 38.15
Past performance may or may not be sustained in future*Inception date is 27 Feb 2019. **Scheme benchmark is CRISIL Hybrid 35+65 - Aggressive Index.The performance of the scheme is benchmarked to the Total Return variant of the Index.
1 year SIP
Since Inception
SIP*
SIP Investments
ICICI Prudential Retirement Fund - Hybrid Aggressive Plan
Total Amount Invested (Rs. '000) 300 120
Market Value as on Month End (Rs. '000) 392.62 142.41
Scheme Return (% CAGR) 22.33 36.71
Scheme** Benchmark Return (% CAGR) 21.99 28.82
Nifty 50 TRI (% CAGR) 25.81 38.15
Past performance may or may not be sustained in future*Inception date is 15 Jan 2019. **Scheme benchmark is Nifty 500 TRI.The performance of the scheme is benchmarked to the Total Return variant of the Index.
1 year SIP
Since Inception
SIP*
SIP Investments
ICICI Prudential India Opportunities Fund
Total Amount Invested (Rs. '000) 310 120
Market Value as on Month End (Rs. '000) 467.76 163.03
Scheme Return (% CAGR) 33.97 73.32
Scheme** Benchmark Return (% CAGR) 29.32 48.21
Nifty 50 TRI (% CAGR) 25.13 38.15
Benefits of Systematic Investment Plan (SIP) - SIP Performance of Select Schemes
Returns shown for Growth Option as on 31 July, 2021
Past performance may or may not be sustained in future*Inception date is 27 Feb 2019. **Scheme benchmark is Nifty 50 Hybrid Composite Debt 15:85 Index.The performance of the scheme is benchmarked to the Total Return variant of the Index.
1 year SIP
Since Inception
SIP*
SIP Investments
ICICI Prudential Retirement Fund - Hybrid Conservative Plan
Total Amount Invested (Rs. '000) 300 120
Market Value as on Month End (Rs. '000) 340.86 126.25
Scheme Return (% CAGR) 10.26 9.90
Scheme** Benchmark Return (% CAGR) 11.25 9.52
Nifty 50 TRI (% CAGR) 25.94 38.50
CRISIL 10 Year Gilt Index (% CAGR) 5.63 2.12
Past performance may or may not be sustained in future*Inception date is 21 Sep 2017. **Scheme benchmark is S&P BSE Sensex.The performance of the scheme is benchmarked to the Total Return variant of the Index.
1 year SIP
3 year SIP
SIP Investments
ICICI Prudential Sensex Index Fund
Since Inception
SIP*
Total Amount Invested (Rs. '000) 470 360 120
Market Value as on Month End (Rs. '000) 663.32 488.70 140.69
Scheme Return (% CAGR) 17.85 20.95 33.78
Scheme** Benchmark Return (% CAGR) 18.44 21.50 34.71
Nifty 50 TRI (% CAGR) 18.47 22.18 38.15
Past performance may or may not be sustained in future*Inception date is 03 Nov 1999. **Scheme benchmark is CRISIL Hybrid 35+65 - Aggressive Index start date - 31-Mar-02.* The existing Crisil Balanced Fund -Aggressive Index has been renamed as Crisil Hybrid 35 + 65 - Aggressive Index as per communication received from CRISIL.The performance of the scheme is benchmarked to the Total Return variant of the Index.
10 year SIP
5 year SIP
3 year SIP
1 year SIP
Since Inception
SIP*
SIP Investments15 year
SIP7 Year
SIP
ICICI Prudential Equity & Debt Fund
Total Amount Invested (Rs. '000) 2,610 1,800 1,200 840 600 360 120
Market Value as on Month End (Rs. '000) 18,831.21 5,948.05 2,742.27 1,434.46 915.34 517.35 153.91
Scheme Return (% CAGR) 15.66 14.59 15.78 15.03 16.94 25.10 56.83
Scheme** Benchmark Return (% CAGR) NA 12.10 13.42 13.55 14.95 19.49 28.82
Nifty 50 TRI (% CAGR) 14.76 12.64 14.28 14.69 16.88 22.18 38.15
Past performance may or may not be sustained in future*Inception date is 30 Mar 2004. **Scheme benchmark is Nifty 50 Hybrid Composite Debt 15:85 Index.* The existing Crisil MIP Blended Index have been renamed as Crisil Hybrid 85 + 15 - Conservative Index as per communication received from CRISIL.The performance of the scheme is benchmarked to the Total Return variant of the Index.
10 year SIP
5 year SIP
3 year SIP
1 year SIP
Since Inception
SIP*
SIP Investments15 year
SIP7 Year
SIP
ICICI Prudential Regular Savings Fund
Total Amount Invested (Rs. '000) 2,090 1,800 1,200 840 600 360 120
Market Value as on Month End (Rs. '000) 5,358.03 3,987.80 2,030.62 1,175.00 758.70 421.23 126.88
Scheme Return (% CAGR) 9.95 9.92 10.16 9.44 9.34 10.50 10.92
Scheme** Benchmark Return (% CAGR) 9.22 9.33 9.71 9.67 10.00 11.25 9.52
CRISIL 10 Year Gilt Index (% CAGR) 6.77 6.93 7.22 6.97 6.57 6.63 2.12
Past performance may or may not be sustained in future*Inception date is 22 Mar 2018. **Scheme benchmark is Nifty LargeMidcap 250 TRI.The performance of the scheme is benchmarked to the Total Return variant of the Index.
1 year SIP
3 year SIP
SIP Investments
ICICI Prudential Long Term Wealth Enhancement Fund
Since Inception
SIP*
Total Amount Invested (Rs. '000) 410 360 120
Market Value as on Month End (Rs. '000) 552.16 483.06 144.85
Scheme Return (% CAGR) 17.75 20.11 40.92
Scheme** Benchmark Return (% CAGR) 25.36 28.77 56.06
Nifty 50 TRI (% CAGR) 20.33 22.18 38.15
Past performance may or may not be sustained in future*Inception date is 27 Feb 2019. **Scheme benchmark is Nifty Composite Debt Index.The performance of the scheme is benchmarked to the Total Return variant of the Index.
1 year SIP
Since Inception
SIP*
SIP Investments
ICICI Prudential Retirement Fund - Pure Debt Plan
Total Amount Invested (Rs. '000) 300 120
Market Value as on Month End (Rs. '000) 327.34 122.34
Scheme Return (% CAGR) 6.94 3.68
Scheme** Benchmark Return (% CAGR) 8.30 4.99
Nifty 50 TRI (% CAGR) 25.94 38.50
CRISIL 10 Year Gilt Index (% CAGR) 5.63 2.12Past performance may or may not be sustained in future*Inception date is 27 Feb 2019. **Scheme benchmark is Nifty 500 TRI.The performance of the scheme is benchmarked to the Total Return variant of the Index.
1 year SIP
Since Inception
SIP*
SIP Investments
ICICI Prudential Retirement Fund - Pure Equity Plan
Total Amount Invested (Rs. '000) 300 120
Market Value as on Month End (Rs. '000) 418.25 151.89
Scheme Return (% CAGR) 27.99 53.24
Scheme** Benchmark Return (% CAGR) 30.25 48.21
Nifty 50 TRI (% CAGR) 25.81 38.15

150
Note Pertaining to Direct Plan ,which was introduced w.e.f. 1st Jan 2013 :Direct Plan is only for investors who purchase /subscribe Units in a Scheme directly with the Fund. Direct Plan shall be the default Plan. Thus, if the Purchase/ Switch application does not specifically state the details of the plan then the same shall be processed under the Direct Plan if no distributor code is mentioned in the application. Otherwise it shall be processed under the Other than Direct plan.
Single plan structure for the schemes of the Fund:W.e.f. October 1, 2012 fresh subscriptions/switch-ins are accepted only under a single plan for all the schemes. Fresh subscriptions / switch-ins in other plans of the schemes shall not be accepted w.e.f. October 1, 2012. However, such plans will continue till the existing investors remain invested in the plan.
Disclaimer of NSE Indices Limited: The “ICICI Prudential Nifty Index Fund/ICICI Prudential Nifty ETF/ICICI Prudential Nifty Next 50 TRI Fund/ICICI Prudential Midcap 150 ETF /ICICI Prudential Nifty 100 ETF/ICICI Prudential NV20 ETF/ICICI Prudential Nifty Low Vol 30 ETF/ICICI Prudential Nifty Next 50 ETF/ICICI Prudential Bank ETF/ ICICI Prudential Private Banks ETF/ICICI Prudential Alpha Low Vol 30 ETF/ICICI Prudential IT ETF/ICICI Prudential Healthcare ETF” offered by “ICICI Prudential Mutual Fund/ICICI Prudential Asset Management Company Limited” or its affiliates is not sponsored, endorsed, sold or promoted by NSE Indices Limited (NSE Indices) and its affiliates. NSE Indices and its affiliates do not make any representation or warranty, express or implied (including warranties of merchantability or fitness for particular purpose or use) to the owners of “ICICI Prudential Nifty Index Fund/ICICI Prudential Nifty ETF/ICICI Prudential Nifty Next 50 TRI Fund/ICICI Prudential Midcap 150 ETF /ICICI Prudential Nifty 100 ETF/ICICI Prudential NV20 ETF/ICICI Prudential Nifty Low Vol 30 ETF/ICICI Prudential Nifty Next 50 ETF/ICICI Prudential Bank ETF/ ICICI Prudential Private Banks ETF/ICICI Prudential Alpha Low Vol 30 ETF/ICICI Prudential IT ETF” or any member of the public regarding the advisability of investing in securities generally or in the ”ICICI Prudential Nifty Index Fund/ICICI Prudential Nifty ETF/ICICI Prudential Nifty Next 50 TRI Fund/ICICI Prudential Midcap 150 ETF /ICICI Prudential Nifty 100 ETF/ICICI Prudential NV20 ETF/ICICI Prudential Nifty Low Vol 30 ETF/ICICI Prudential Nifty Next 50 ETF/ICICI Prudential Bank ETF/ ICICI Prudential Private Banks ETF/ICICI Prudential Alpha Low Vol 30 ETF/ICICI Prudential IT ETF/ICICI Healthcare ETF” linked to Nifty 50 TRI/Nifty Next 50 TRI/Nifty Midcap 150 TRI/Nifty 100 TRI/Nifty50 Value 20 Index/Nifty100 Low Volatility 30 Index/Nifty Bank Index/Nifty Private Bank Index/Nifty Alpha Low-Voliatility 30 Index/Nifty IT Index/Nifty Healthcare Index or particularly in the ability of the Nifty 50 TRI/Nifty Next 50 TRI/Nifty Midcap 150 TRI/ Nifty 100 TRI/Nifty50 Value 20 Index/Nifty100 Low Volitility 30 Index/Nifty Bank Index/Nifty Private Bank Index to track general stock market performance in India. Please read the full Disclaimers in relation to the Nifty 50 TRI/Nifty Next 50 TRI/Nifty Midcap 100 Index/Nifty 100 TRI/Nifty 50 Value 20 TRI/Nifty 100 Low Volitility 30 Index/Nifty Bank Index/Nifty Private Bank Index/Nifty Alpha Low-Voliatility 30 Index/Nifty IT Index/Nifty Healthcare Index in the respective Scheme Information Document.
Disclaimer by the National Stock Exchange of India Limited : It is to be distinctly understood that the permission given by National Stock Exchange of India Limited (NSE) should not in any way be deemed or construed that the Scheme Information Document has been cleared or approved by NSE nor does it certify the correctness or completeness of any of the contents of the Scheme Information Document. The investors are advised to refer to the Scheme Information Document for the full text of the ‘Disclaimer Clause of NSE’.
Disclaimer by the BSE Limited: It is to be distinctly understood that the permission given by BSE Limited should not in any way be deemed or construed that the SID has been cleared or approved by BSE Limited nor does it certify the correctness or completeness of any of the contents of the SID. The investors are advised to refer to the SID for the full text of the Disclaimer Clause of the BSE Limited.
Disclaimer by AIPL for ICICI Prudential Sensex ETF, ICICI Prudential Sensex Index Fund, ICICI Prudential Midcap Select ETF, BHARAT 22 ETF, ICICI Prudential S&P BSE 500 ETF and ICICI Prudential Liquid ETF :“The "S&P BSE Sensex, S&P BSE Midcap Select TRI, S&P BSE Bharat 22 TRI, S&P BSE 500 TRI and S&P BSE Liquid Rate Index" is a product of AIPL, a joint venture among affiliates of S&P Dow Jones Indices LLC (“SPDJI”) and BSE Limited (“BSE”), and has been licensed for use by ICICI Prudential Asset Management Company Limited. Standard & Poor's® and S&P® are registered trademarks of Standard & Poor's Financial Services LLC (“S&P”); BSE® and SENSEX® are registered trademarks of BSE Limited; Dow Jones® is a registered trademark of Dow Jones Trademark Holdings LLC (“Dow Jones”); and these trademarks have been licensed for use by AIPL and sublicensed for certain purposes by ICICI Prudential Asset Management Company Limited. ICICI Prudential Sensex ETF, ICICI Prudential Sensex Index Fund, ICICI Prudential Midcap Select ETF, BHARAT 22 ETF, ICICI Prudential S&P BSE 500 ETF and ICICI Prudential Liquid ETF is not sponsored, endorsed, sold or promoted by SPDJI, BSE, Dow Jones, S&P or their respective affiliates and none of such parties make any representation regarding the advisability of investing in such product(s) nor do they have any liability for any errors, omissions, or interruptions of the SENSEX.”
“The "S&P BSE Sensex, S&P BSE Midcap Select TRI, S&P BSE Bharat 22 TRI, S&P BSE 500 TRI and S&P BSE Liquid Rate Index" (the “Index”) is published by Asia Index Private Limited (“AIPL”), which is a joint venture among affiliates of S&P Dow Jones Indices LLC (“SPDJI”) and BSE Limited (“BSE”), and has been licensed for use by ICICI Prudential Asset Management Company Limited (“Licensee”). Standard & Poor's® and S&P® are registered trademarks of Standard & Poor's Financial Services LLC (“S&P”) and Dow Jones® is a registered trademark of Dow Jones Trademark Holdings LLC (“Dow Jones”). BSE® and SENSEX® are registered trademarks of BSE. The trademarks have been licensed to AIPL and have been sublicensed for use for certain purposes by Licensee. Licensee's ICICI Prudential Sensex ETF, ICICI Prudential Sensex Index Fund, ICICI Prudential Midcap Select ETF, BHARAT 22 ETF, ICICI Prudential S&P BSE 500 ETF and ICICI Prudential Liquid ETF” (the “Product”) is/are not sponsored, endorsed, sold or promoted by AIPL, SPDJI, Dow Jones, S&P, any of their respective affiliates (collectively, “S&P Dow Jones Indices”) or BSE. None of AIPL, S&P Dow Jones Indices or BSE makes any representation or warranty, express or implied, to the owners of the Product or any member of the public regarding the advisability of investing in securities generally or in the Product particularly or the ability of the Index to track general market performance. AIPL's, S&P Dow Jones Indices' and BSE's only relationship to Licensee with respect to the Index is the licensing of the Index and certain trademarks, service marks and/or trade names of AIPL, S&P Dow Jones Indices, BSE and/or their licensors. The "S&P BSE Sensex, S&P BSE Midcap Select TRI, S&P BSE Bharat 22 TRI, S&P BSE 500 TRI and S&P BSE Liquid Rate Index" is determined, composed and calculated by AIPL or its agent without regard to Licensee or the Product. None of AIPL, S&P Dow Jones Indices or BSE are responsible for and have not participated in the determination of the prices, and amount of the P roduct or the timing of the issuance or sale of the Product or in the determination or calculation of the equation by which the Product is to be converted into cash, surrendered or redeemed, as the case may be. AIPL, S&P Dow Jones Indices and BSE have no obligation or liability in connection with the administration, marketing or trading of the Product. There is no assurance that investment products based on the Index will accurately track index performance or provide positive investment returns. AIPL and S&P Dow Jones Indices LLC are not investment advisors. Inclusion of a security within an index is not a recommendation by AIPL, S&P Dow Jones Indices or BSE to buy, sell, or hold such security, nor is it considered to be investment advice.
Benefits of Systematic Investment Plan (SIP) - SIP Performance of Select Schemes
Returns shown for Growth Option as on 31 July, 2021
India Index Services & Products Limited (IISL) has changed its name to NSE Indices Limited, as per communication received from IISL.
With effect from April 01, 2020, there has been an amalgamation of various PSU banks. The details of the same have been given below. For the purpose of disclosure, the securities (ISINs) of the transferor banks are disclosed under the respective transferee banks.
Sr. No. ISIN Transferor Bank Transferee Bank
1 INE141A16ZX1 Oriental Bank of Commerce Punjab National Bank
2 INE434A16QW1 Andhra Bank Union Bank of India
3 INE141A16ZM4 Oriental Bank of Commerce Punjab National Bank
4 INE667A16GW7 Syndicate Bank Canara Bank
5 INE141A16ZZ6 Oriental Bank of Commerce Punjab National Bank
6 INE141A16A52 Oriental Bank of Commerce Punjab National Bank
7 INE434A16RE7 Andhra Bank Union Bank of India
Past performance may or may not be sustained in future*Inception date is 12 Apr 2019. **Scheme benchmark is Nifty India Consumption TRI.The performance of the scheme is benchmarked to the Total Return variant of the Index.
1 year SIP
Since Inception
SIP*
SIP Investments
ICICI Prudential Bharat Consumption Fund
Total Amount Invested (Rs. '000) 280 120
Market Value as on Month End (Rs. '000) 345.62 136.14
Scheme Return (% CAGR) 18.52 26.10
Scheme** Benchmark Return (% CAGR) 21.78 28.80
Nifty 50 TRI (% CAGR) 27.10 38.15
Past performance may or may not be sustained in future*Inception date is 17 Jun 2019. **Scheme benchmark is Nifty MNC TRI.The performance of the scheme is benchmarked to the Total Return variant of the Index.
1 year SIP
Since Inception
SIP*
SIP Investments
ICICI Prudential MNC Fund
Total Amount Invested (Rs. '000) 260 120
Market Value as on Month End (Rs. '000) 403.32 156.40
Scheme Return (% CAGR) 44.70 61.28
Scheme** Benchmark Return (% CAGR) 25.47 33.21
Nifty 50 TRI (% CAGR) 29.33 38.15
Past performance may or may not be sustained in future*Inception date is 15 Oct 2019. **Scheme benchmark is Nifty Commodities TRI.The performance of the scheme is benchmarked to the Total Return variant of the Index.
1 year SIP
Since Inception
SIP*
SIP Investments
ICICI Prudential Commodities Fund
Total Amount Invested (Rs. '000) 220 120
Market Value as on Month End (Rs. '000) 501.27 216.21
Scheme Return (% CAGR) 118.14 177.81
Scheme** Benchmark Return (% CAGR) 60.58 85.59
Nifty 50 TRI (% CAGR) 33.93 38.15
AIPL, S&P DOW JONES INDICES, BSE AND THEIR THIRD PARTY LICENSORS DO NOT GUARANTEE THE ADEQUACY, ACCURACY, TIMELINESS AND/OR THE COMPLETENESS OF THE INDEX OR ANY DATA RELATED THERETO. AIPL, S&P DOW JONES INDICES, BSE AND THEIR THIRD PARTY LICENSORS SHALL NOT BE SUBJECT TO ANY DAMAGES OR LIABILITY FOR ANY ERRORS, OMISSIONS, OR DELAYS THEREIN. AIPL, S&P DOW JONES INDICES, BSE AND THEIR THIRD PARTY LICENSORS MAKE NO EXPRESS OR IMPLIED WARRANTIES, AND EXPRESSLY DISCLAIM ALL WARRANTIES, OF MERCHANTABILITY OR FITNESS FOR A PARTICULAR PURPOSE OR USE OR AS TO RESULTS TO BE OBTAINED BY LICENSEE, OWNERS OF THE PRODUCT, OR ANY OTHER PERSON OR ENTITY FROM THE USE OF THE INDEX OR WITH RESPECT TO ANY DATA RELATED THERETO. WITHOUT LIMITING ANY OF THE FOREGOING, IN NO EVENT WHATSOEVER SHALL AIPL, S&P DOW JONES INDICES, BSE OR THEIR THIRD PARTY LICENSORS BE LIABLE FOR ANY INDIRECT, SPECIAL, INCIDENTAL, PUNITIVE, OR CONSEQUENTIAL DAMAGES INCLUDING BUT NOT LIMITED TO, LOSS OF PROFITS, TRADING LOSSES, LOST TIME OR GOODWILL, EVEN IF THEY HAVE BEEN ADVISED OF THE POSSIBLITY OF SUCH DAMAGES, WHETHER IN CONTRACT, TORT, STRICT LIABILITY, OR OTHERWISE. THERE ARE NO THIRD PARTY BENEFICIARIES OF ANY AGREEMENTS OR ARRANGEMENTS BETWEEN AIPL AND LICENSEE, OTHER THAN THE LICENSORS OF AIPL (INCLUDING S&P DOW JONES INDICES AND/OR BSE).”

151
ANNEXURE - I
% of exposure to Total Debt AUMIssuer Name
Details of exposure across all Debt Funds of ICICI Prudential Mutual Fund as on 31-Jul-2021 i.e as a % of total debt holdings
INDUSTRY/SECTOR % of exposure to Total Debt AUM
Aadhar Housing Finance Ltd. 0.13%Aavas Financiers Ltd. (Erstwhile Au Housing Finance Limited) 0.06%Adani Ports and Special Economic Zone Ltd. 0.59%Adarsh Advisory Services Pvt. Ltd. (Secured by pledge of Equity Shares of JSW Steel Ltd. and JSW Energy Ltd.) 0.08%Aditya Birla Fashion and Retail Ltd. 0.21%Aditya Birla Finance Ltd. 0.61%Aditya Birla Housing Finance Ltd. 0.07%APL Apollo Tubes Ltd. 0.07%Apollo Tyres Ltd. 0.01%Ashiana Housing Ltd. 0.01%AU Small Finance Bank Ltd. (Tier II) 0.25%Avanse Financial Services Ltd 0.06%Axis Bank Ltd. 1.32%Axis Finance Ltd. 0.22%Bahadur Chand Investments Pvt. Ltd. 0.19%Bajaj Finance Ltd. 0.91%Bajaj Housing Finance Ltd. 0.08%Bangalore Airport Hotel Ltd. (Guarantee from Bangalore International Airport Limited) 0.14%Bank Of Baroda (Additional Tier 1 - Basel III) 0.19%Barclays Bank 0.19%Barclays Investments & Loans (India) Ltd. 0.11%Bharat Heavy Electricals Ltd. 0.70%Bharat Sanchar Nigam Ltd. 0.43%Bharti Airtel Ltd. 0.02%Bharti Telecom Ltd. 0.29%Birla Group Holdings Pvt. Ltd. 0.28%Blue Star Ltd. 0.01%Bombay Burmah Trading Corporation Ltd. 0.05%Britannia Industries Ltd. 0.06%Cadila Healthcare Ltd. 0.29%Can Fin Homes Ltd. 0.19%Canara Bank (Additional Tier 1 - Basel III) 0.05%Carat Lane Trading Pvt Ltd 0.06%CBLO 10.71%Reverse Repo 1.97%CEAT Ltd. 0.05%Chambal Fertilisers & Chemicals Ltd. 0.12%Chennai Petroleum Corporation Ltd. 0.65%Cholamandalam Investment And Finance Company Ltd. 0.20%Citicorp Finance (India) Ltd. 0.19%Coastal Gujarat Power Ltd. (guarantee from Tata Power Company Limited) 0.29%Creamline Dairy Products Ltd 0.01%Daimler Financial Services India Pvt. Ltd. 0.07%DCM Shriram Ltd. 0.02%DLF Ltd. 0.11%EMBASSY OFFICE PARKS REIT 1.09%Export-Import Bank Of India 0.56%FIRST BUSINESS RECEIVABLES TRUST - TRANCHE 17 0.15%Flometallic India Pvt. Ltd. 0.23%Food Corporation Of India 0.66%Fullerton India Credit Company Ltd. 0.09%GAIL (India) Ltd. 0.04%GIC Housing Finance Ltd. 0.07%GMR Air Cargo and Aerospace Engineering Ltd 0.13%Godrej Agrovet Ltd. 0.06%Godrej Industries Ltd. 0.48%Godrej Properties Ltd. 0.27%Government Securities 29.48%G R Infraprojects Ltd. 0.11%Grasim Industries Ltd. 0.27%HDB Financial Services Ltd. 0.53%HDFC Bank Ltd. 0.36%HDFC Credila Financial Services Pvt. Ltd. 0.10%HDFC Securities Ltd 0.15%Hindalco Industries Ltd. 0.27%Hindustan Petroleum Corporation Ltd. 0.19%Housing and Urban Development Corporation Ltd. 0.22%HDFC Ltd. 1.84%HPCL - Mittal Pipelines Ltd. 0.01%ICICI Bank Ltd. 0.85%IDBI Bank Ltd. (Tier II) 0.04%IDFC First Bank Ltd. 0.24%IIERT June 2018 II 0.00%IIERT Oct 2018 II 0.00%IIFL Facilities Services Ltd. 0.24%IIFL Finance Ltd 0.24%IIFL Wealth Prime Ltd. 0.24%India Grid Trust 0.24%Indian Oil Corporation Ltd. 0.10%Indian Railway Finance Corporation Ltd. 0.47%IndusInd Bank Ltd. 0.12%Infina Finance Pvt. Ltd. 0.23%Jamnagar Utilities & Power Pvt. Ltd. 0.43%Jhajjar Power Ltd. (CLP Group) 0.15%JM Financial Capital Ltd. 0.10%JM Financial Credit Solution Ltd. 0.15%JM Financial Home Loans 0.02%JM Financial Products Ltd. 0.15%JM Financial Services Ltd. 0.07%JMC Projects (India) Ltd. 0.09%Jodhpur Wind Farms Pvt. Ltd. 0.14%John Deere Financial India Pvt. Ltd. 0.36%JSW Energy Ltd 0.05%Julius Baer Capital (India) Pvt. Ltd. 0.16%KEC International Ltd. 0.09%Kotak Mahindra Investments Ltd. 0.16%Kotak Mahindra Prime Ltd. 0.02%Kotak Securities Ltd. 0.09%KRIBHCO Fertilizers Ltd. 0.08%Larsen & Toubro Ltd. 0.70%LIC Housing Finance Ltd. 0.97%Mahanagar Telephone Nigam Ltd. 0.46%Mahindra & Mahindra Financial Services Ltd. 0.41%
Issuer Name% of exposure to Total Debt AUM
BANKS 9.89%CASH (CBLO & REVERSE REPO) 12.68%CORPORATES 20.90%FINANCIAL SERVICES 7.96%GOI & TBILLS 34.76%NBFC 12.75%REAL ESTATE 1.06%
Mahindra & Mahindra Ltd. 0.02%Mahindra Integrated Township Ltd. 0.02%Mahindra Rural Housing Finance Ltd. 0.19%Manappuram Finance Ltd. 0.35%Mangalore Refinery and Petrochemicals Ltd. 0.12%Motherson Sumi Systems Ltd. 0.36%Motilal Oswal Financial Services Ltd. 0.14%Motilal Oswal Home Finance Ltd 0.12%Muthoot Finance Ltd. 0.61%NABHA Power Ltd. 0.41%NABARD 2.90%National Highways Authority of India 0.52%National Housing Bank 0.34%Navneet Education Ltd. 0.01%Network18 Media & Investments Ltd. 0.05%NLC India Ltd. 0.09%NHPC Ltd. 0.04%Nirma Ltd. 0.12%NTPC Ltd. 0.12%NTPC SAIL Power Co Ltd 0.04%Nuclear Power Corporation of India Ltd. 0.00%Nuvoco Vistas Corporation Ltd. (Nirma Group) 0.11%Oberoi Realty Ltd. 0.11%ONGC Petro additions Ltd. 0.24%ONGC Tripura Power Co Ltd. 0.07%Oriental Nagpur Betul Highway Ltd. (NHAI Annuity) 0.14%Panatone Finvest Ltd. 0.87%Patel KNR Heavy Infrastructures Ltd. (NHAI Annuity) 0.01%Phoenix ARC Pvt Ltd 0.02%Pipeline Infrastructure Pvt Ltd. 0.68%Power Finance Corporation Ltd. 1.57%Power Grid Corporation Of India Ltd. 0.08%Prestige Estates Projects Ltd. 0.16%Prism Johnson Ltd. 0.08%Pune Solapur Expressway Pvt. Ltd. (Sponsored by Tata Realty & Infrastructure Limited (TRIL) and Atlantia SPA ) 0.15%PVR Ltd. 0.01%The Ramco Cements Ltd. 0.09%Ramco Industries Ltd. 0.02%RBL Bank Ltd. (Tier II - Basel III) 0.07%Reliable Devices Trust 11 0.09%Reliance Industries Ltd. 2.33%Reliance Jio Infocomm Ltd. 0.16%Reliance Retail Ventures Ltd 0.26%Rural Electrification Corporation Ltd. 2.01%Sadbhav Engineering Ltd. 0.04%Sansar Trust November 2018 A1 0.03%SBI Global Factors Ltd. 0.03%SBM Bank (India) Ltd. 0.05%Sharekhan BNP Paribas Financial Services Ltd 0.35%Sharekhan Ltd 0.14%Shriram Transport Finance Company Ltd. 0.14%Sikka Ports & Terminals Ltd. 0.66%Silica Ceramica Pvt. Ltd. (Guarantee from Prism Johnson Ltd.) 0.02%SIS Ltd. 0.09%Small Industries Development Bank Of India 0.10%SP Jammu Udhampur Highway Ltd. 0.06%SRF Ltd. 0.21%Standard Chartered Investment & Loan (India) Ltd. 0.02%State Bank Of India 2.24%State Devlopment Loan 5.28%Sundaram Finance Ltd. 0.04%Sundaram Home Finance Ltd. 0.01%Surya Roshni Ltd. 0.01%Tata Capital Financial Services Ltd. 0.44%Tata Capital Housing Finance Ltd. 0.19%Tata Capital Ltd. 0.14%Tata Housing Development Company Ltd. 0.16%Tata Motors Finance Ltd. 0.37%Tata Motors Finance Solutions Pvt. Ltd. 0.28%Tata Motors Ltd. 0.52%Tata Power Company Ltd. 0.71%TATA POWER DELHI DISTRI LTD 0.07%Tata Power Renewable Energy Ltd. 0.27%Tata Projects Ltd. 0.14%Tata Realty & Infrastructure Ltd. 0.34%Tata Sons Ltd. 0.07%Tata Steel Ltd. 0.07%Tata Teleservices (Maharashtra) Ltd. 0.45%Tata Teleservices Ltd. 0.41%Tata Value Homes Ltd. 0.09%The Great Eastern Shipping Company Ltd. 0.31%The Indian Hotels Company Ltd. 0.02%TMF Holdings Ltd. (Subsidiary of Tata Motors Limited) 0.61%Torrent Power Ltd. 0.14%TV18 Broadcast Ltd. 0.02%TVS Credit Services Ltd. 0.24%Ultratech Cement Ltd. 0.14%Union Bank Of India 0.11%Varanasi Sangam Expressway Pvt. Ltd. 0.23%Vardhman Special Steels Ltd. 0.06%Vedanta Ltd. 0.31%Walwhan Renewables Energy Ltd. (guarantee from Tata Power Co. Ltd.) 0.07%Writers And Publishers Pvt. Ltd. (secured by pledge of equity shares of DB Corp Ltd.) 0.04%
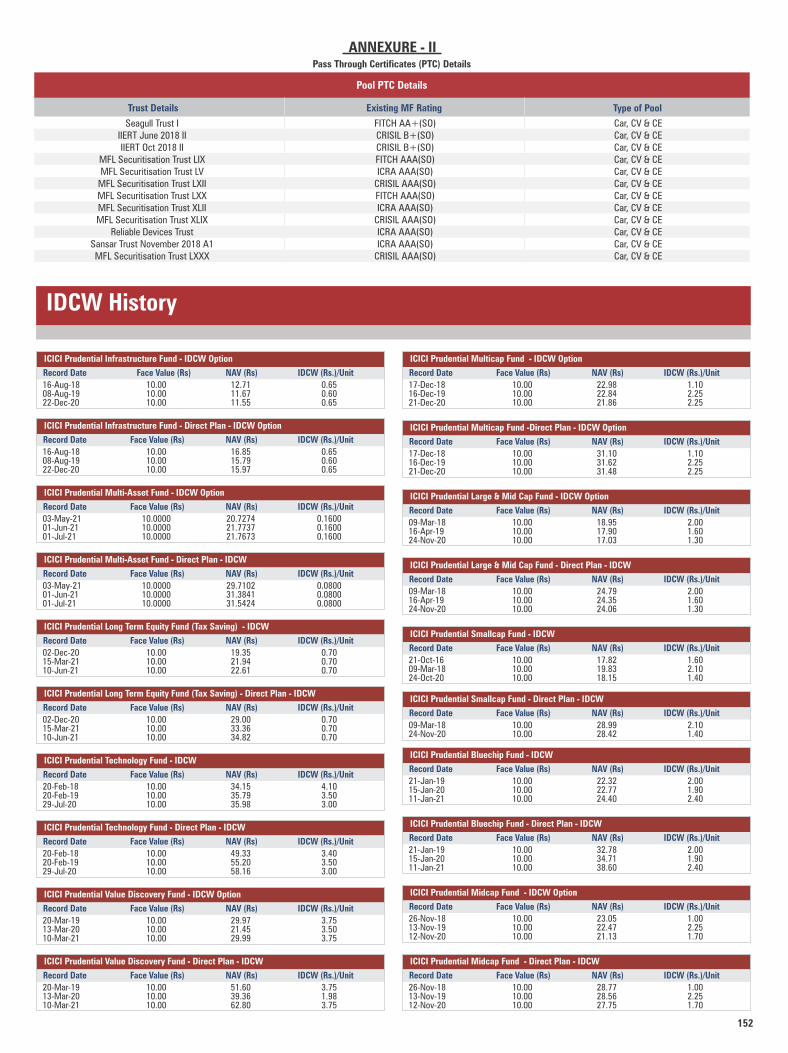
152
ANNEXURE - IIPass Through Certificates (PTC) Details
Pool PTC Details
Trust Details Existing MF Rating Type of Pool
Seagull Trust I FITCH AA+(SO) Car, CV & CE IIERT June 2018 II CRISIL B+(SO) Car, CV & CE IIERT Oct 2018 II CRISIL B+(SO) Car, CV & CE MFL Securitisation Trust LIX FITCH AAA(SO) Car, CV & CE MFL Securitisation Trust LV ICRA AAA(SO) Car, CV & CE MFL Securitisation Trust LXII CRISIL AAA(SO) Car, CV & CE MFL Securitisation Trust LXX FITCH AAA(SO) Car, CV & CE MFL Securitisation Trust XLII ICRA AAA(SO) Car, CV & CE MFL Securitisation Trust XLIX CRISIL AAA(SO) Car, CV & CE Reliable Devices Trust ICRA AAA(SO) Car, CV & CE Sansar Trust November 2018 A1 ICRA AAA(SO) Car, CV & CE MFL Securitisation Trust LXXX CRISIL AAA(SO) Car, CV & CE
IDCW History
ICICI Prudential Infrastructure Fund - IDCW Option
Record Date Face Value (Rs) NAV (Rs) IDCW (Rs.)/Unit
16-Aug-18 10.00 12.71 0.6508-Aug-19 10.00 11.67 0.6022-Dec-20 10.00 11.55 0.65
ICICI Prudential Infrastructure Fund - Direct Plan - IDCW Option
Record Date Face Value (Rs) NAV (Rs) IDCW (Rs.)/Unit
16-Aug-18 10.00 16.85 0.6508-Aug-19 10.00 15.79 0.6022-Dec-20 10.00 15.97 0.65
ICICI Prudential Multi-Asset Fund - IDCW Option
Record Date Face Value (Rs) NAV (Rs) IDCW (Rs.)/Unit
03-May-21 10.0000 20.7274 0.160001-Jun-21 10.0000 21.7737 0.160001-Jul-21 10.0000 21.7673 0.1600
ICICI Prudential Multi-Asset Fund - Direct Plan - IDCW
Record Date Face Value (Rs) NAV (Rs) IDCW (Rs.)/Unit
03-May-21 10.0000 29.7102 0.080001-Jun-21 10.0000 31.3841 0.080001-Jul-21 10.0000 31.5424 0.0800
ICICI Prudential Long Term Equity Fund (Tax Saving) - Direct Plan - IDCW
Record Date Face Value (Rs) NAV (Rs) IDCW (Rs.)/Unit
02-Dec-20 10.00 29.00 0.7015-Mar-21 10.00 33.36 0.7010-Jun-21 10.00 34.82 0.70
ICICI Prudential Technology Fund - IDCW
Record Date Face Value (Rs) NAV (Rs) IDCW (Rs.)/Unit
20-Feb-18 10.00 34.15 4.1020-Feb-19 10.00 35.79 3.5029-Jul-20 10.00 35.98 3.00
ICICI Prudential Technology Fund - Direct Plan - IDCW
Record Date Face Value (Rs) NAV (Rs) IDCW (Rs.)/Unit
20-Feb-18 10.00 49.33 3.4020-Feb-19 10.00 55.20 3.5029-Jul-20 10.00 58.16 3.00
ICICI Prudential Value Discovery Fund - IDCW Option
Record Date Face Value (Rs) NAV (Rs) IDCW (Rs.)/Unit
20-Mar-19 10.00 29.97 3.7513-Mar-20 10.00 21.45 3.5010-Mar-21 10.00 29.99 3.75
ICICI Prudential Value Discovery Fund - Direct Plan - IDCW
Record Date Face Value (Rs) NAV (Rs) IDCW (Rs.)/Unit
20-Mar-19 10.00 51.60 3.7513-Mar-20 10.00 39.36 1.9810-Mar-21 10.00 62.80 3.75
ICICI Prudential Multicap Fund -Direct Plan - IDCW Option
Record Date Face Value (Rs) NAV (Rs) IDCW (Rs.)/Unit
17-Dec-18 10.00 31.10 1.1016-Dec-19 10.00 31.62 2.2521-Dec-20 10.00 31.48 2.25
ICICI Prudential Large & Mid Cap Fund - IDCW Option
Record Date Face Value (Rs) NAV (Rs) IDCW (Rs.)/Unit
09-Mar-18 10.00 18.95 2.0016-Apr-19 10.00 17.90 1.6024-Nov-20 10.00 17.03 1.30
ICICI Prudential Large & Mid Cap Fund - Direct Plan - IDCW
Record Date Face Value (Rs) NAV (Rs) IDCW (Rs.)/Unit
09-Mar-18 10.00 24.79 2.0016-Apr-19 10.00 24.35 1.6024-Nov-20 10.00 24.06 1.30
ICICI Prudential Smallcap Fund - IDCW
Record Date Face Value (Rs) NAV (Rs) IDCW (Rs.)/Unit
21-Oct-16 10.00 17.82 1.6009-Mar-18 10.00 19.83 2.1024-Oct-20 10.00 18.15 1.40
ICICI Prudential Smallcap Fund - Direct Plan - IDCW
Record Date Face Value (Rs) NAV (Rs) IDCW (Rs.)/Unit
09-Mar-18 10.00 28.99 2.1024-Nov-20 10.00 28.42 1.40
ICICI Prudential Bluechip Fund - IDCW
Record Date Face Value (Rs) NAV (Rs) IDCW (Rs.)/Unit
21-Jan-19 10.00 22.32 2.0015-Jan-20 10.00 22.77 1.9011-Jan-21 10.00 24.40 2.40
ICICI Prudential Bluechip Fund - Direct Plan - IDCW
Record Date Face Value (Rs) NAV (Rs) IDCW (Rs.)/Unit
21-Jan-19 10.00 32.78 2.0015-Jan-20 10.00 34.71 1.9011-Jan-21 10.00 38.60 2.40
ICICI Prudential Midcap Fund - IDCW Option
Record Date Face Value (Rs) NAV (Rs) IDCW (Rs.)/Unit
26-Nov-18 10.00 23.05 1.0013-Nov-19 10.00 22.47 2.2512-Nov-20 10.00 21.13 1.70
ICICI Prudential Midcap Fund - Direct Plan - IDCW
Record Date Face Value (Rs) NAV (Rs) IDCW (Rs.)/Unit
26-Nov-18 10.00 28.77 1.0013-Nov-19 10.00 28.56 2.2512-Nov-20 10.00 27.75 1.70
ICICI Prudential Multicap Fund - IDCW Option
Record Date Face Value (Rs) NAV (Rs) IDCW (Rs.)/Unit
17-Dec-18 10.00 22.98 1.1016-Dec-19 10.00 22.84 2.2521-Dec-20 10.00 21.86 2.25
ICICI Prudential Long Term Equity Fund (Tax Saving) - IDCW
Record Date Face Value (Rs) NAV (Rs) IDCW (Rs.)/Unit
02-Dec-20 10.00 19.35 0.7015-Mar-21 10.00 21.94 0.7010-Jun-21 10.00 22.61 0.70
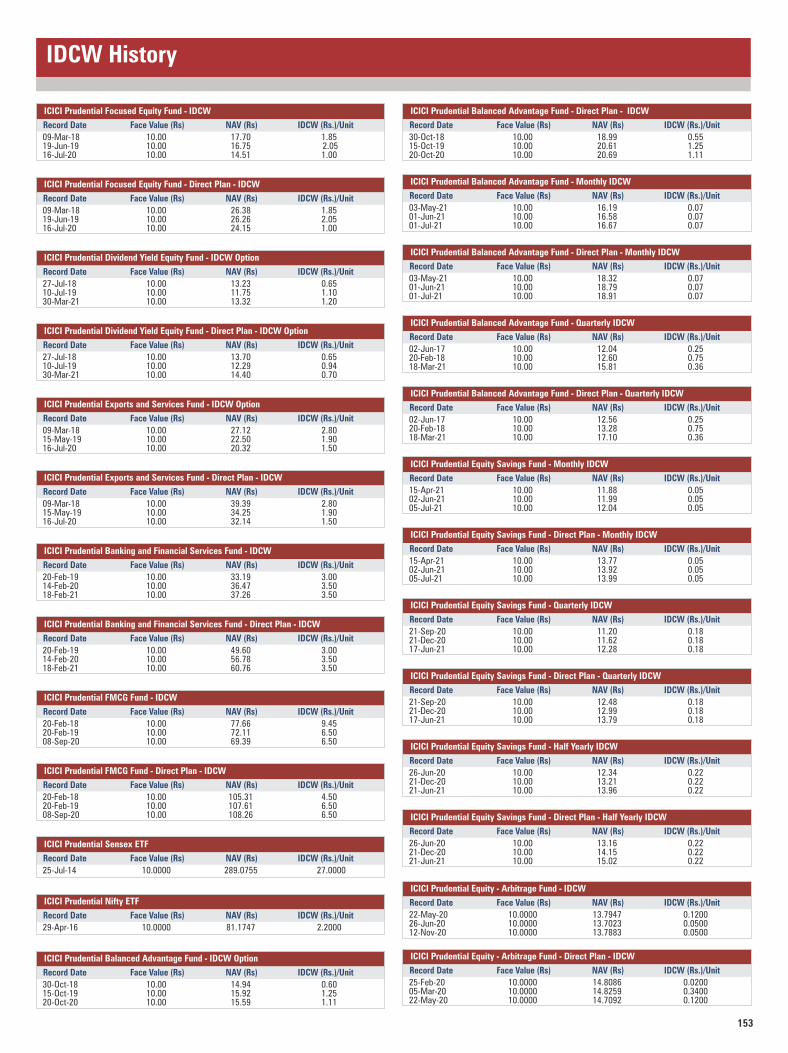
153
ICICI Prudential Dividend Yield Equity Fund - IDCW Option
Record Date Face Value (Rs) NAV (Rs) IDCW (Rs.)/Unit
27-Jul-18 10.00 13.23 0.6510-Jul-19 10.00 11.75 1.1030-Mar-21 10.00 13.32 1.20
ICICI Prudential Dividend Yield Equity Fund - Direct Plan - IDCW Option
Record Date Face Value (Rs) NAV (Rs) IDCW (Rs.)/Unit
27-Jul-18 10.00 13.70 0.6510-Jul-19 10.00 12.29 0.9430-Mar-21 10.00 14.40 0.70
ICICI Prudential Exports and Services Fund - IDCW Option
Record Date Face Value (Rs) NAV (Rs) IDCW (Rs.)/Unit
09-Mar-18 10.00 27.12 2.8015-May-19 10.00 22.50 1.9016-Jul-20 10.00 20.32 1.50
ICICI Prudential Exports and Services Fund - Direct Plan - IDCW
Record Date Face Value (Rs) NAV (Rs) IDCW (Rs.)/Unit
09-Mar-18 10.00 39.39 2.8015-May-19 10.00 34.25 1.9016-Jul-20 10.00 32.14 1.50
ICICI Prudential Banking and Financial Services Fund - IDCW
Record Date Face Value (Rs) NAV (Rs) IDCW (Rs.)/Unit
20-Feb-19 10.00 33.19 3.0014-Feb-20 10.00 36.47 3.5018-Feb-21 10.00 37.26 3.50
ICICI Prudential Banking and Financial Services Fund - Direct Plan - IDCW
Record Date Face Value (Rs) NAV (Rs) IDCW (Rs.)/Unit
20-Feb-19 10.00 49.60 3.0014-Feb-20 10.00 56.78 3.5018-Feb-21 10.00 60.76 3.50
ICICI Prudential FMCG Fund - IDCW
Record Date Face Value (Rs) NAV (Rs) IDCW (Rs.)/Unit
20-Feb-18 10.00 77.66 9.4520-Feb-19 10.00 72.11 6.5008-Sep-20 10.00 69.39 6.50
ICICI Prudential FMCG Fund - Direct Plan - IDCW
Record Date Face Value (Rs) NAV (Rs) IDCW (Rs.)/Unit
20-Feb-18 10.00 105.31 4.5020-Feb-19 10.00 107.61 6.5008-Sep-20 10.00 108.26 6.50
ICICI Prudential Sensex ETF
Record Date Face Value (Rs) NAV (Rs) IDCW (Rs.)/Unit
25-Jul-14 10.0000 289.0755 27.0000
ICICI Prudential Balanced Advantage Fund - IDCW Option
Record Date Face Value (Rs) NAV (Rs) IDCW (Rs.)/Unit
30-Oct-18 10.00 14.94 0.6015-Oct-19 10.00 15.92 1.2520-Oct-20 10.00 15.59 1.11
ICICI Prudential Balanced Advantage Fund - Direct Plan - IDCW
Record Date Face Value (Rs) NAV (Rs) IDCW (Rs.)/Unit
30-Oct-18 10.00 18.99 0.5515-Oct-19 10.00 20.61 1.2520-Oct-20 10.00 20.69 1.11
ICICI Prudential Balanced Advantage Fund - Monthly IDCW
Record Date Face Value (Rs) NAV (Rs) IDCW (Rs.)/Unit
03-May-21 10.00 16.19 0.0701-Jun-21 10.00 16.58 0.0701-Jul-21 10.00 16.67 0.07
ICICI Prudential Balanced Advantage Fund - Direct Plan - Monthly IDCW
Record Date Face Value (Rs) NAV (Rs) IDCW (Rs.)/Unit
03-May-21 10.00 18.32 0.0701-Jun-21 10.00 18.79 0.0701-Jul-21 10.00 18.91 0.07
ICICI Prudential Balanced Advantage Fund - Quarterly IDCW
Record Date Face Value (Rs) NAV (Rs) IDCW (Rs.)/Unit
02-Jun-17 10.00 12.04 0.2520-Feb-18 10.00 12.60 0.7518-Mar-21 10.00 15.81 0.36
ICICI Prudential Balanced Advantage Fund - Direct Plan - Quarterly IDCW
Record Date Face Value (Rs) NAV (Rs) IDCW (Rs.)/Unit
02-Jun-17 10.00 12.56 0.2520-Feb-18 10.00 13.28 0.7518-Mar-21 10.00 17.10 0.36
ICICI Prudential Equity Savings Fund - Monthly IDCW
Record Date Face Value (Rs) NAV (Rs) IDCW (Rs.)/Unit
15-Apr-21 10.00 11.88 0.0502-Jun-21 10.00 11.99 0.0505-Jul-21 10.00 12.04 0.05
ICICI Prudential Equity Savings Fund - Direct Plan - Monthly IDCW
Record Date Face Value (Rs) NAV (Rs) IDCW (Rs.)/Unit
15-Apr-21 10.00 13.77 0.0502-Jun-21 10.00 13.92 0.0505-Jul-21 10.00 13.99 0.05
ICICI Prudential Equity Savings Fund - Quarterly IDCW
Record Date Face Value (Rs) NAV (Rs) IDCW (Rs.)/Unit
21-Sep-20 10.00 11.20 0.1821-Dec-20 10.00 11.62 0.1817-Jun-21 10.00 12.28 0.18
ICICI Prudential Equity Savings Fund - Direct Plan - Quarterly IDCW
Record Date Face Value (Rs) NAV (Rs) IDCW (Rs.)/Unit
21-Sep-20 10.00 12.48 0.1821-Dec-20 10.00 12.99 0.1817-Jun-21 10.00 13.79 0.18
ICICI Prudential Equity Savings Fund - Half Yearly IDCW
Record Date Face Value (Rs) NAV (Rs) IDCW (Rs.)/Unit
26-Jun-20 10.00 12.34 0.2221-Dec-20 10.00 13.21 0.2221-Jun-21 10.00 13.96 0.22
ICICI Prudential Equity Savings Fund - Direct Plan - Half Yearly IDCW
Record Date Face Value (Rs) NAV (Rs) IDCW (Rs.)/Unit
26-Jun-20 10.00 13.16 0.2221-Dec-20 10.00 14.15 0.2221-Jun-21 10.00 15.02 0.22
ICICI Prudential Nifty ETF
Record Date Face Value (Rs) NAV (Rs) IDCW (Rs.)/Unit
29-Apr-16 10.0000 81.1747 2.2000
IDCW History
ICICI Prudential Focused Equity Fund - Direct Plan - IDCW
Record Date Face Value (Rs) NAV (Rs) IDCW (Rs.)/Unit
09-Mar-18 10.00 26.38 1.8519-Jun-19 10.00 26.26 2.0516-Jul-20 10.00 24.15 1.00
ICICI Prudential Focused Equity Fund - IDCW
Record Date Face Value (Rs) NAV (Rs) IDCW (Rs.)/Unit
09-Mar-18 10.00 17.70 1.8519-Jun-19 10.00 16.75 2.0516-Jul-20 10.00 14.51 1.00
ICICI Prudential Equity - Arbitrage Fund - IDCW
Record Date Face Value (Rs) NAV (Rs) IDCW (Rs.)/Unit
22-May-20 10.0000 13.7947 0.120026-Jun-20 10.0000 13.7023 0.050012-Nov-20 10.0000 13.7883 0.0500
ICICI Prudential Equity - Arbitrage Fund - Direct Plan - IDCW
Record Date Face Value (Rs) NAV (Rs) IDCW (Rs.)/Unit
25-Feb-20 10.0000 14.8086 0.020005-Mar-20 10.0000 14.8259 0.340022-May-20 10.0000 14.7092 0.1200
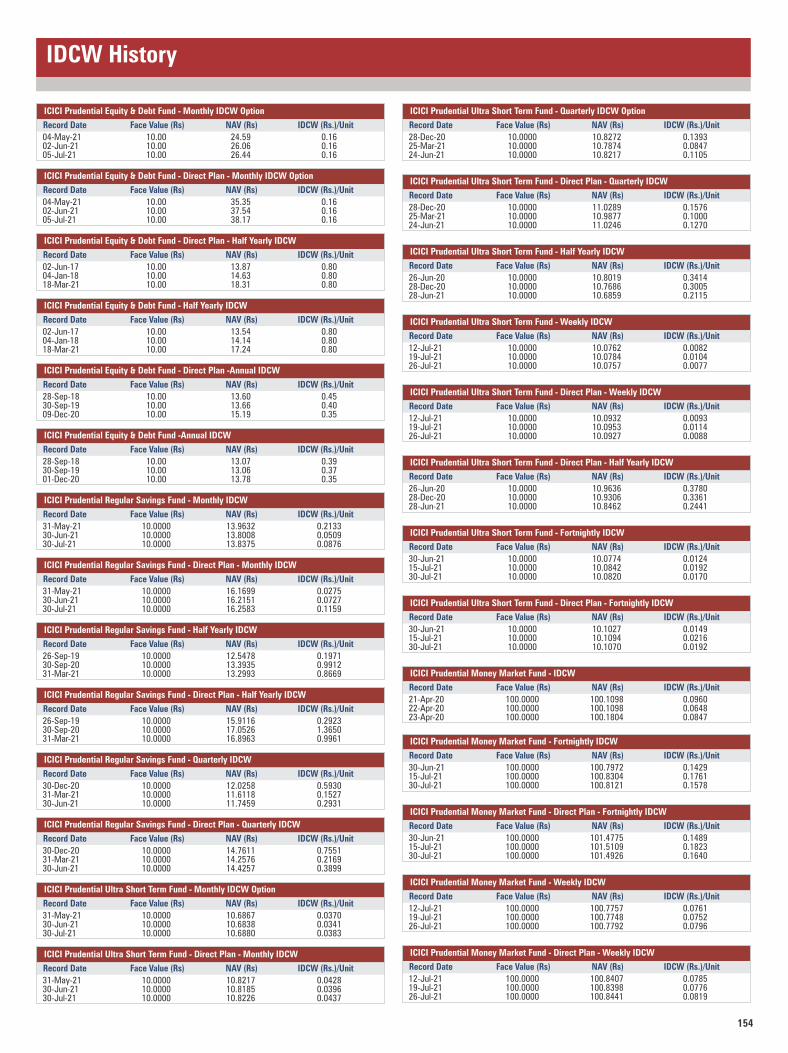
154
IDCW History
ICICI Prudential Equity & Debt Fund - Direct Plan - Monthly IDCW Option
Record Date Face Value (Rs) NAV (Rs) IDCW (Rs.)/Unit
04-May-21 10.00 35.35 0.1602-Jun-21 10.00 37.54 0.1605-Jul-21 10.00 38.17 0.16
ICICI Prudential Equity & Debt Fund - Direct Plan - Half Yearly IDCW
Record Date Face Value (Rs) NAV (Rs) IDCW (Rs.)/Unit
02-Jun-17 10.00 13.87 0.8004-Jan-18 10.00 14.63 0.8018-Mar-21 10.00 18.31 0.80
ICICI Prudential Equity & Debt Fund - Half Yearly IDCW
Record Date Face Value (Rs) NAV (Rs) IDCW (Rs.)/Unit
02-Jun-17 10.00 13.54 0.8004-Jan-18 10.00 14.14 0.8018-Mar-21 10.00 17.24 0.80
ICICI Prudential Equity & Debt Fund - Direct Plan -Annual IDCW
Record Date Face Value (Rs) NAV (Rs) IDCW (Rs.)/Unit
28-Sep-18 10.00 13.60 0.4530-Sep-19 10.00 13.66 0.4009-Dec-20 10.00 15.19 0.35
ICICI Prudential Equity & Debt Fund - Monthly IDCW Option
Record Date Face Value (Rs) NAV (Rs) IDCW (Rs.)/Unit
04-May-21 10.00 24.59 0.1602-Jun-21 10.00 26.06 0.1605-Jul-21 10.00 26.44 0.16
ICICI Prudential Equity & Debt Fund -Annual IDCW
Record Date Face Value (Rs) NAV (Rs) IDCW (Rs.)/Unit
28-Sep-18 10.00 13.07 0.3930-Sep-19 10.00 13.06 0.3701-Dec-20 10.00 13.78 0.35
ICICI Prudential Regular Savings Fund - Half Yearly IDCW
Record Date Face Value (Rs) NAV (Rs) IDCW (Rs.)/Unit
26-Sep-19 10.0000 12.5478 0.197130-Sep-20 10.0000 13.3935 0.991231-Mar-21 10.0000 13.2993 0.8669
ICICI Prudential Regular Savings Fund - Direct Plan - Half Yearly IDCW
Record Date Face Value (Rs) NAV (Rs) IDCW (Rs.)/Unit
26-Sep-19 10.0000 15.9116 0.292330-Sep-20 10.0000 17.0526 1.365031-Mar-21 10.0000 16.8963 0.9961
ICICI Prudential Ultra Short Term Fund - Quarterly IDCW Option
Record Date Face Value (Rs) NAV (Rs) IDCW (Rs.)/Unit
28-Dec-20 10.0000 10.8272 0.139325-Mar-21 10.0000 10.7874 0.084724-Jun-21 10.0000 10.8217 0.1105
ICICI Prudential Ultra Short Term Fund - Direct Plan - Quarterly IDCW
Record Date Face Value (Rs) NAV (Rs) IDCW (Rs.)/Unit
28-Dec-20 10.0000 11.0289 0.157625-Mar-21 10.0000 10.9877 0.100024-Jun-21 10.0000 11.0246 0.1270
ICICI Prudential Ultra Short Term Fund - Half Yearly IDCW
Record Date Face Value (Rs) NAV (Rs) IDCW (Rs.)/Unit
26-Jun-20 10.0000 10.8019 0.341428-Dec-20 10.0000 10.7686 0.300528-Jun-21 10.0000 10.6859 0.2115
ICICI Prudential Ultra Short Term Fund - Weekly IDCW
Record Date Face Value (Rs) NAV (Rs) IDCW (Rs.)/Unit
12-Jul-21 10.0000 10.0762 0.008219-Jul-21 10.0000 10.0784 0.010426-Jul-21 10.0000 10.0757 0.0077
ICICI Prudential Ultra Short Term Fund - Direct Plan - Weekly IDCW
Record Date Face Value (Rs) NAV (Rs) IDCW (Rs.)/Unit
12-Jul-21 10.0000 10.0932 0.009319-Jul-21 10.0000 10.0953 0.011426-Jul-21 10.0000 10.0927 0.0088
ICICI Prudential Ultra Short Term Fund - Direct Plan - Half Yearly IDCW
Record Date Face Value (Rs) NAV (Rs) IDCW (Rs.)/Unit
26-Jun-20 10.0000 10.9636 0.378028-Dec-20 10.0000 10.9306 0.336128-Jun-21 10.0000 10.8462 0.2441
ICICI Prudential Money Market Fund - IDCW
Record Date Face Value (Rs) NAV (Rs) IDCW (Rs.)/Unit
21-Apr-20 100.0000 100.1098 0.096022-Apr-20 100.0000 100.1098 0.064823-Apr-20 100.0000 100.1804 0.0847
ICICI Prudential Money Market Fund - Weekly IDCW
Record Date Face Value (Rs) NAV (Rs) IDCW (Rs.)/Unit
12-Jul-21 100.0000 100.7757 0.076119-Jul-21 100.0000 100.7748 0.075226-Jul-21 100.0000 100.7792 0.0796
ICICI Prudential Money Market Fund - Direct Plan - Weekly IDCW
Record Date Face Value (Rs) NAV (Rs) IDCW (Rs.)/Unit
12-Jul-21 100.0000 100.8407 0.078519-Jul-21 100.0000 100.8398 0.077626-Jul-21 100.0000 100.8441 0.0819
ICICI Prudential Regular Savings Fund - Monthly IDCW
Record Date Face Value (Rs) NAV (Rs) IDCW (Rs.)/Unit
31-May-21 10.0000 13.9632 0.213330-Jun-21 10.0000 13.8008 0.050930-Jul-21 10.0000 13.8375 0.0876
ICICI Prudential Regular Savings Fund - Direct Plan - Monthly IDCW
Record Date Face Value (Rs) NAV (Rs) IDCW (Rs.)/Unit
31-May-21 10.0000 16.1699 0.027530-Jun-21 10.0000 16.2151 0.072730-Jul-21 10.0000 16.2583 0.1159
ICICI Prudential Regular Savings Fund - Quarterly IDCW
Record Date Face Value (Rs) NAV (Rs) IDCW (Rs.)/Unit
30-Dec-20 10.0000 12.0258 0.593031-Mar-21 10.0000 11.6118 0.152730-Jun-21 10.0000 11.7459 0.2931
ICICI Prudential Regular Savings Fund - Direct Plan - Quarterly IDCW
Record Date Face Value (Rs) NAV (Rs) IDCW (Rs.)/Unit
30-Dec-20 10.0000 14.7611 0.755131-Mar-21 10.0000 14.2576 0.216930-Jun-21 10.0000 14.4257 0.3899
ICICI Prudential Ultra Short Term Fund - Monthly IDCW Option
Record Date Face Value (Rs) NAV (Rs) IDCW (Rs.)/Unit
31-May-21 10.0000 10.6867 0.037030-Jun-21 10.0000 10.6838 0.034130-Jul-21 10.0000 10.6880 0.0383
ICICI Prudential Ultra Short Term Fund - Direct Plan - Monthly IDCW
Record Date Face Value (Rs) NAV (Rs) IDCW (Rs.)/Unit
31-May-21 10.0000 10.8217 0.042830-Jun-21 10.0000 10.8185 0.039630-Jul-21 10.0000 10.8226 0.0437
ICICI Prudential Ultra Short Term Fund - Fortnightly IDCW
Record Date Face Value (Rs) NAV (Rs) IDCW (Rs.)/Unit
30-Jun-21 10.0000 10.0774 0.012415-Jul-21 10.0000 10.0842 0.019230-Jul-21 10.0000 10.0820 0.0170
ICICI Prudential Ultra Short Term Fund - Direct Plan - Fortnightly IDCW
Record Date Face Value (Rs) NAV (Rs) IDCW (Rs.)/Unit
30-Jun-21 10.0000 10.1027 0.014915-Jul-21 10.0000 10.1094 0.021630-Jul-21 10.0000 10.1070 0.0192
ICICI Prudential Money Market Fund - Fortnightly IDCW
Record Date Face Value (Rs) NAV (Rs) IDCW (Rs.)/Unit
30-Jun-21 100.0000 100.7972 0.142915-Jul-21 100.0000 100.8304 0.176130-Jul-21 100.0000 100.8121 0.1578
ICICI Prudential Money Market Fund - Direct Plan - Fortnightly IDCW
Record Date Face Value (Rs) NAV (Rs) IDCW (Rs.)/Unit
30-Jun-21 100.0000 101.4775 0.148915-Jul-21 100.0000 101.5109 0.182330-Jul-21 100.0000 101.4926 0.1640
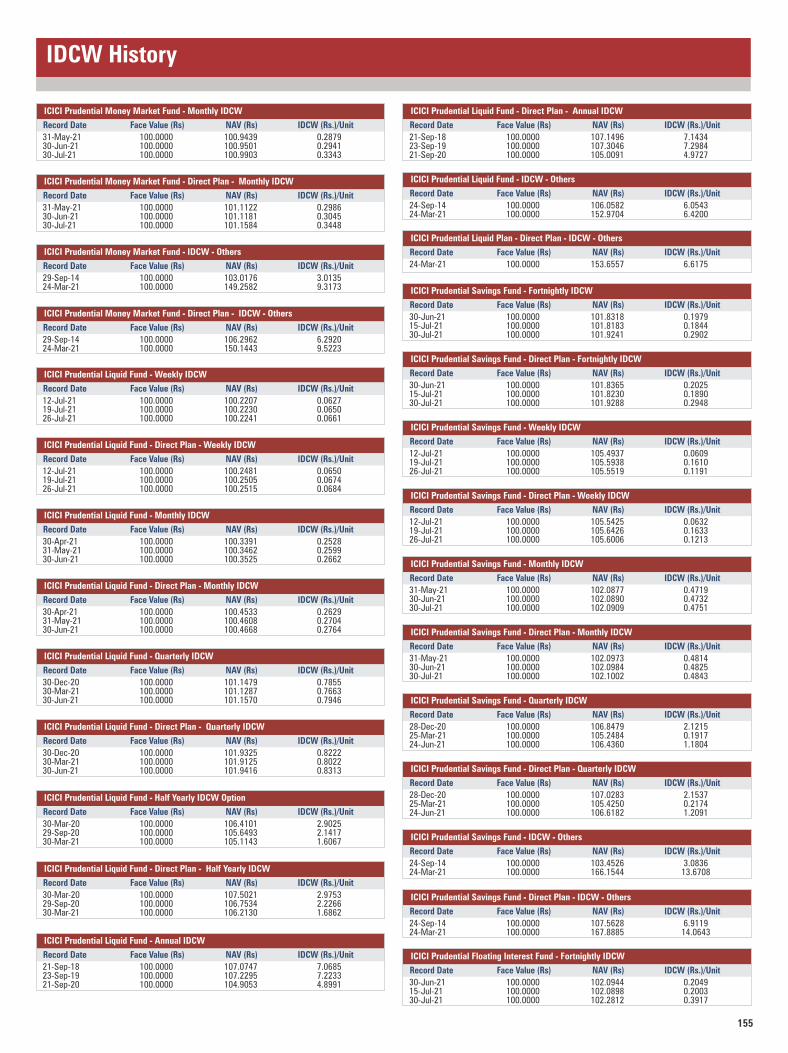
155
IDCW History
ICICI Prudential Money Market Fund - IDCW - Others
Record Date Face Value (Rs) NAV (Rs) IDCW (Rs.)/Unit
29-Sep-14 100.0000 103.0176 3.013524-Mar-21 100.0000 149.2582 9.3173
ICICI Prudential Money Market Fund - Direct Plan - IDCW - Others
Record Date Face Value (Rs) NAV (Rs) IDCW (Rs.)/Unit
29-Sep-14 100.0000 106.2962 6.292024-Mar-21 100.0000 150.1443 9.5223
ICICI Prudential Savings Fund - Weekly IDCW
Record Date Face Value (Rs) NAV (Rs) IDCW (Rs.)/Unit
12-Jul-21 100.0000 105.4937 0.060919-Jul-21 100.0000 105.5938 0.161026-Jul-21 100.0000 105.5519 0.1191
ICICI Prudential Savings Fund - Direct Plan - Weekly IDCW
Record Date Face Value (Rs) NAV (Rs) IDCW (Rs.)/Unit
12-Jul-21 100.0000 105.5425 0.063219-Jul-21 100.0000 105.6426 0.163326-Jul-21 100.0000 105.6006 0.1213
ICICI Prudential Savings Fund - Quarterly IDCW
Record Date Face Value (Rs) NAV (Rs) IDCW (Rs.)/Unit
28-Dec-20 100.0000 106.8479 2.121525-Mar-21 100.0000 105.2484 0.191724-Jun-21 100.0000 106.4360 1.1804
ICICI Prudential Savings Fund - Direct Plan - Quarterly IDCW
Record Date Face Value (Rs) NAV (Rs) IDCW (Rs.)/Unit
28-Dec-20 100.0000 107.0283 2.153725-Mar-21 100.0000 105.4250 0.217424-Jun-21 100.0000 106.6182 1.2091
ICICI Prudential Savings Fund - IDCW - Others
Record Date Face Value (Rs) NAV (Rs) IDCW (Rs.)/Unit
24-Sep-14 100.0000 103.4526 3.083624-Mar-21 100.0000 166.1544 13.6708
ICICI Prudential Savings Fund - Direct Plan - IDCW - Others
Record Date Face Value (Rs) NAV (Rs) IDCW (Rs.)/Unit
24-Sep-14 100.0000 107.5628 6.911924-Mar-21 100.0000 167.8885 14.0643
ICICI Prudential Money Market Fund - Monthly IDCW
Record Date Face Value (Rs) NAV (Rs) IDCW (Rs.)/Unit
31-May-21 100.0000 100.9439 0.287930-Jun-21 100.0000 100.9501 0.294130-Jul-21 100.0000 100.9903 0.3343
ICICI Prudential Money Market Fund - Direct Plan - Monthly IDCW
Record Date Face Value (Rs) NAV (Rs) IDCW (Rs.)/Unit
31-May-21 100.0000 101.1122 0.298630-Jun-21 100.0000 101.1181 0.304530-Jul-21 100.0000 101.1584 0.3448
ICICI Prudential Savings Fund - Fortnightly IDCW
Record Date Face Value (Rs) NAV (Rs) IDCW (Rs.)/Unit
30-Jun-21 100.0000 101.8318 0.197915-Jul-21 100.0000 101.8183 0.184430-Jul-21 100.0000 101.9241 0.2902
ICICI Prudential Savings Fund - Direct Plan - Fortnightly IDCW
Record Date Face Value (Rs) NAV (Rs) IDCW (Rs.)/Unit
30-Jun-21 100.0000 101.8365 0.202515-Jul-21 100.0000 101.8230 0.189030-Jul-21 100.0000 101.9288 0.2948
ICICI Prudential Savings Fund - Monthly IDCW
Record Date Face Value (Rs) NAV (Rs) IDCW (Rs.)/Unit
31-May-21 100.0000 102.0877 0.471930-Jun-21 100.0000 102.0890 0.473230-Jul-21 100.0000 102.0909 0.4751
ICICI Prudential Savings Fund - Direct Plan - Monthly IDCW
Record Date Face Value (Rs) NAV (Rs) IDCW (Rs.)/Unit
31-May-21 100.0000 102.0973 0.481430-Jun-21 100.0000 102.0984 0.482530-Jul-21 100.0000 102.1002 0.4843
ICICI Prudential Floating Interest Fund - Fortnightly IDCW
Record Date Face Value (Rs) NAV (Rs) IDCW (Rs.)/Unit
30-Jun-21 100.0000 102.0944 0.204915-Jul-21 100.0000 102.0898 0.200330-Jul-21 100.0000 102.2812 0.3917
ICICI Prudential Liquid Fund - Weekly IDCW
Record Date Face Value (Rs) NAV (Rs) IDCW (Rs.)/Unit
12-Jul-21 100.0000 100.2207 0.062719-Jul-21 100.0000 100.2230 0.065026-Jul-21 100.0000 100.2241 0.0661
ICICI Prudential Liquid Fund - Direct Plan - Weekly IDCW
Record Date Face Value (Rs) NAV (Rs) IDCW (Rs.)/Unit
12-Jul-21 100.0000 100.2481 0.065019-Jul-21 100.0000 100.2505 0.067426-Jul-21 100.0000 100.2515 0.0684
ICICI Prudential Liquid Fund - Monthly IDCW
Record Date Face Value (Rs) NAV (Rs) IDCW (Rs.)/Unit
30-Apr-21 100.0000 100.3391 0.252831-May-21 100.0000 100.3462 0.259930-Jun-21 100.0000 100.3525 0.2662
ICICI Prudential Liquid Fund - Direct Plan - Monthly IDCW
Record Date Face Value (Rs) NAV (Rs) IDCW (Rs.)/Unit
30-Apr-21 100.0000 100.4533 0.262931-May-21 100.0000 100.4608 0.270430-Jun-21 100.0000 100.4668 0.2764
ICICI Prudential Liquid Fund - Quarterly IDCW
Record Date Face Value (Rs) NAV (Rs) IDCW (Rs.)/Unit
30-Dec-20 100.0000 101.1479 0.785530-Mar-21 100.0000 101.1287 0.766330-Jun-21 100.0000 101.1570 0.7946
ICICI Prudential Liquid Fund - Direct Plan - Quarterly IDCW
Record Date Face Value (Rs) NAV (Rs) IDCW (Rs.)/Unit
30-Dec-20 100.0000 101.9325 0.822230-Mar-21 100.0000 101.9125 0.802230-Jun-21 100.0000 101.9416 0.8313
ICICI Prudential Liquid Fund - Half Yearly IDCW Option
Record Date Face Value (Rs) NAV (Rs) IDCW (Rs.)/Unit
30-Mar-20 100.0000 106.4101 2.902529-Sep-20 100.0000 105.6493 2.141730-Mar-21 100.0000 105.1143 1.6067
ICICI Prudential Liquid Fund - Direct Plan - Half Yearly IDCW
Record Date Face Value (Rs) NAV (Rs) IDCW (Rs.)/Unit
30-Mar-20 100.0000 107.5021 2.975329-Sep-20 100.0000 106.7534 2.226630-Mar-21 100.0000 106.2130 1.6862
ICICI Prudential Liquid Fund - Annual IDCW
Record Date Face Value (Rs) NAV (Rs) IDCW (Rs.)/Unit
21-Sep-18 100.0000 107.0747 7.068523-Sep-19 100.0000 107.2295 7.223321-Sep-20 100.0000 104.9053 4.8991
ICICI Prudential Liquid Fund - Direct Plan - Annual IDCW
Record Date Face Value (Rs) NAV (Rs) IDCW (Rs.)/Unit
21-Sep-18 100.0000 107.1496 7.143423-Sep-19 100.0000 107.3046 7.298421-Sep-20 100.0000 105.0091 4.9727
ICICI Prudential Liquid Fund - IDCW - Others
Record Date Face Value (Rs) NAV (Rs) IDCW (Rs.)/Unit
24-Sep-14 100.0000 106.0582 6.054324-Mar-21 100.0000 152.9704 6.4200
ICICI Prudential Liquid Plan - Direct Plan - IDCW - Others
Record Date Face Value (Rs) NAV (Rs) IDCW (Rs.)/Unit
24-Mar-21 100.0000 153.6557 6.6175

156
IDCW History
ICICI Prudential Corporate Bond Fund - Fortnightly IDCW
Record Date Face Value (Rs) NAV (Rs) IDCW (Rs.)/Unit
15-Jun-21 10.0000 10.2593 0.031415-Jul-21 10.0000 10.2332 0.005330-Jul-21 10.0000 10.2557 0.0278
ICICI Prudential Corporate Bond Fund - Direct Plan - Fortnightly IDCW
Record Date Face Value (Rs) NAV (Rs) IDCW (Rs.)/Unit
15-Jun-21 10.0000 12.2103 0.039215-Jul-21 10.0000 12.1806 0.009530-Jul-21 10.0000 12.2057 0.0346
ICICI Prudential Corporate Bond Fund - Weekly IDCW
Record Date Face Value (Rs) NAV (Rs) IDCW (Rs.)/Unit
14-Jun-21 10.0000 10.3273 0.023019-Jul-21 10.0000 10.3141 0.009826-Jul-21 10.0000 10.3159 0.0116
ICICI Prudential Corporate Bond Fund - Direct Plan - Weekly IDCW
Record Date Face Value (Rs) NAV (Rs) IDCW (Rs.)/Unit
14-Jun-21 10.0000 10.2566 0.023419-Jul-21 10.0000 10.2460 0.012826-Jul-21 10.0000 10.2453 0.0121
ICICI Prudential Floating Interest Fund - Weekly IDCW
Record Date Face Value (Rs) NAV (Rs) IDCW (Rs.)/Unit
12-Jul-21 100.0000 101.9202 0.031019-Jul-21 100.0000 102.0959 0.206726-Jul-21 100.0000 102.0505 0.1613
ICICI Prudential Floating Interest Fund - Direct Plan - Weekly IDCW
Record Date Face Value (Rs) NAV (Rs) IDCW (Rs.)/Unit
12-Jul-21 100.0000 101.9345 0.045119-Jul-21 100.0000 102.1102 0.220826-Jul-21 100.0000 102.0648 0.1754
ICICI Prudential Floating Interest Fund - Quarterly IDCW
Record Date Face Value (Rs) NAV (Rs) IDCW (Rs.)/Unit
28-Dec-20 100.0000 106.5996 2.518725-Mar-21 100.0000 104.5694 0.064824-Jun-21 100.0000 106.0262 1.2235
ICICI Prudential Floating Interest Fund - Direct Plan - Quarterly IDCW
Record Date Face Value (Rs) NAV (Rs) IDCW (Rs.)/Unit
28-Dec-20 100.0000 107.9668 2.739425-Mar-21 100.0000 105.9033 0.232324-Jun-21 100.0000 107.4022 1.4144
ICICI Prudential Floating Interest Fund - IDCW - Others
Record Date Face Value (Rs) NAV (Rs) IDCW (Rs.)/Unit
29-Sep-14 100.0000 117.9792 17.615924-Mar-21 100.0000 163.8260 14.5377
ICICI Prudential Floating Interest Fund - Direct Plan - IDCW Others
Record Date Face Value (Rs) NAV (Rs) IDCW (Rs.)/Unit
24-Mar-21 100.0000 169.5519 16.3114
ICICI Prudential Corporate Bond Fund - Quarterly IDCW
Record Date Face Value (Rs) NAV (Rs) IDCW (Rs.)/Unit
21-Sep-20 10.0000 10.8726 0.161824-Dec-20 10.0000 10.9591 0.236924-Jun-21 10.0000 10.9366 0.2006
ICICI Prudential Corporate Bond Fund - Direct Plan - Quarterly IDCW
Record Date Face Value (Rs) NAV (Rs) IDCW (Rs.)/Unit
21-Sep-20 10.0000 15.0269 0.233824-Dec-20 10.0000 15.1482 0.338524-Jun-21 10.0000 15.1294 0.2998
ICICI Prudential Corporate Bond Fund - Half Yearly IDCW Option
Record Date Face Value (Rs) NAV (Rs) IDCW (Rs.)/Unit
20-Feb-20 10.0000 13.0853 0.580817-Aug-20 10.0000 13.2374 0.732122-Feb-21 10.0000 12.8154 0.3129
ICICI Prudential Corporate Bond Fund - Direct Plan - Half Yearly IDCW Option
Record Date Face Value (Rs) NAV (Rs) IDCW (Rs.)/Unit
20-Feb-20 10.0000 13.3322 0.610817-Aug-20 10.0000 13.4875 0.764522-Feb-21 10.0000 13.0598 0.3388
ICICI Prudential Medium Term Bond Fund - Monthly IDCW Option
Record Date Face Value (Rs) NAV (Rs) IDCW (Rs.)/Unit
25-Jan-12 10.0000 10.3582 0.060815-Feb-12 10.0000 10.3402 0.0428
ICICI Prudential Medium Term Bond Fund - Half Yearly IDCW
Record Date Face Value (Rs) NAV (Rs) IDCW (Rs.)/Unit
20-Mar-20 10.0000 10.9521 0.557314-Sep-20 10.0000 11.0531 0.658518-Mar-21 10.0000 10.7507 0.3683
ICICI Prudential Medium Term Bond Fund - Direct Plan - Half Yearly IDCW
Record Date Face Value (Rs) NAV (Rs) IDCW (Rs.)/Unit
20-Mar-20 10.0000 11.4219 0.608314-Sep-20 10.0000 11.5336 0.718718-Mar-21 10.0000 11.2266 0.4226
ICICI Prudential Medium Term Bond Fund - Quarterly IDCW
Record Date Face Value (Rs) NAV (Rs) IDCW (Rs.)/Unit
28-Jan-21 10.0000 10.6252 0.177930-Apr-21 10.0000 10.6217 0.142329-Jul-21 10.0000 10.6333 0.1505
ICICI Prudential Medium Term Bond Fund - Direct Plan - Quarterly IDCW
Record Date Face Value (Rs) NAV (Rs) IDCW (Rs.)/Unit
28-Jan-21 10.0000 11.1870 0.207630-Apr-21 10.0000 11.1834 0.168829-Jul-21 10.0000 11.1946 0.1750
ICICI Prudential Medium Term Bond Fund - Annual IDCW
Record Date Face Value (Rs) NAV (Rs) IDCW (Rs.)/Unit
03-Nov-16 10.0000 12.0015 1.023103-Nov-17 10.0000 11.8574 0.875818-Mar-21 10.0000 13.8939 1.2519
ICICI Prudential Medium Term Bond Fund - Direct Plan - Annual IDCW
Record Date Face Value (Rs) NAV (Rs) IDCW (Rs.)/Unit
03-Nov-16 10.0000 12.1250 0.379203-Nov-17 10.0000 12.8013 1.049618-Mar-21 10.0000 15.2245 1.2519
ICICI Prudential Short Term Fund - IDCW Reinvestment Fortnightly
Record Date Face Value (Rs) NAV (Rs) IDCW (Rs.)/Unit
15-Jun-21 10.0000 12.2777 0.032215-Jul-21 10.0000 12.2566 0.011130-Jul-21 10.0000 12.2738 0.0283
ICICI Prudential Short Term Fund - Direct Plan - IDCW Reinvestment Fortnightly
Record Date Face Value (Rs) NAV (Rs) IDCW (Rs.)/Unit
15-Jun-21 10.0000 12.8662 0.038615-Jul-21 10.0000 12.8472 0.019630-Jul-21 10.0000 12.8613 0.0337
ICICI Prudential Floating Interest Fund - Monthly IDCW
Record Date Face Value (Rs) NAV (Rs) IDCW (Rs.)/Unit
31-May-21 100.0000 103.1899 0.688530-Jun-21 100.0000 103.1155 0.614130-Jul-21 100.0000 103.0978 0.5964
ICICI Prudential Floating Interest Fund - Direct Plan - Monthly IDCW
Record Date Face Value (Rs) NAV (Rs) IDCW (Rs.)/Unit
31-May-21 100.0000 102.5493 0.746530-Jun-21 100.0000 102.4735 0.670730-Jul-21 100.0000 102.4557 0.6529
ICICI Prudential Floating Interest Fund - Direct Plan - Fortnightly IDCW
Record Date Face Value (Rs) NAV (Rs) IDCW (Rs.)/Unit
30-Jun-21 100.0000 102.1251 0.235015-Jul-21 100.0000 102.1206 0.230530-Jul-21 100.0000 102.3121 0.4220
ICICI Prudential Corporate Bond Fund - Monthly IDCW
Record Date Face Value (Rs) NAV (Rs) IDCW (Rs.)/Unit
31-May-21 10.0000 10.4208 0.045130-Jun-21 10.0000 10.4062 0.030530-Jul-21 10.0000 10.4121 0.0364
ICICI Prudential Corporate Bond Fund - Direct Plan - Monthly IDCW
Record Date Face Value (Rs) NAV (Rs) IDCW (Rs.)/Unit
31-May-21 10.0000 10.2682 0.047230-Jun-21 10.0000 10.2537 0.032730-Jul-21 10.0000 10.2595 0.0385

157
IDCW History
ICICI Prudential Short Term Fund - Half Yearly IDCW
Record Date Face Value (Rs) NAV (Rs) IDCW (Rs.)/Unit
26-Mar-20 10.0000 13.4210 0.310129-Sep-20 10.0000 14.1769 1.068325-Mar-21 10.0000 13.4805 0.3046
ICICI Prudential Short Term Fund - Direct Plan - Half Yearly IDCW
Record Date Face Value (Rs) NAV (Rs) IDCW (Rs.)/Unit
26-Mar-20 10.0000 13.6897 0.364229-Sep-20 10.0000 14.4658 1.140625-Mar-21 10.0000 13.7539 0.3580
ICICI Prudential Banking and PSU Debt Fund - Weekly IDCW
Record Date Face Value (Rs) NAV (Rs) IDCW (Rs.)/Unit
14-Jun-21 10.0000 10.2739 0.021719-Jul-21 10.0000 10.2616 0.009426-Jul-21 10.0000 10.2617 0.0095
ICICI Prudential Banking and PSU Debt Fund - Direct Plan - Weekly IDCW
Record Date Face Value (Rs) NAV (Rs) IDCW (Rs.)/Unit
14-Jun-21 10.0000 10.4028 0.022919-Jul-21 10.0000 10.3939 0.014026-Jul-21 10.0000 10.3904 0.0105
ICICI Prudential Banking and PSU Debt Fund - Quarterly IDCW
Record Date Face Value (Rs) NAV (Rs) IDCW (Rs.)/Unit
21-Sep-20 10.0000 11.2643 0.701728-Dec-20 10.0000 10.8312 0.254128-Jun-21 10.0000 10.7749 0.1900
ICICI Prudential Banking and PSU Debt Fund - Direct Plan - Quarterly IDCW
Record Date Face Value (Rs) NAV (Rs) IDCW (Rs.)/Unit
21-Sep-20 10.0000 13.3151 0.870028-Dec-20 10.0000 12.7772 0.313828-Jun-21 10.0000 12.7251 0.2514
ICICI Prudential Banking and PSU Debt Fund - Half Yearly IDCW Option
Record Date Face Value (Rs) NAV (Rs) IDCW (Rs.)/Unit
20-Feb-20 10.0000 13.3829 0.610717-Aug-20 10.0000 13.3504 0.577822-Feb-21 10.0000 13.0933 0.3277
ICICI Prudential Banking and PSU Debt Fund - Direct Plan - Half Yearly IDCW
Record Date Face Value (Rs) NAV (Rs) IDCW (Rs.)/Unit
20-Feb-20 10.0000 13.5913 0.648417-Aug-20 10.0000 13.5587 0.614322-Feb-21 10.0000 13.3008 0.3623
ICICI Prudential All Seasons Bond Fund - Quarterly IDCW
Record Date Face Value (Rs) NAV (Rs) IDCW (Rs.)/Unit
25-Jan-21 10.0000 11.5277 0.179829-Apr-21 10.0000 11.4812 0.101322-Jul-21 10.0000 11.5015 0.1046
ICICI Prudential All Seasons Bond Fund - Weekly IDCW
Record Date Face Value (Rs) NAV (Rs) IDCW (Rs.)/Unit
07-Jun-21 10.0000 10.8772 0.009114-Jun-21 10.0000 10.9010 0.032926-Jul-21 10.0000 10.8754 0.0073
ICICI Prudential All Seasons Bond Fund - Direct Plan - Weekly IDCW
Record Date Face Value (Rs) NAV (Rs) IDCW (Rs.)/Unit
14-Jun-21 10.0000 10.5915 0.033619-Jul-21 10.0000 10.5610 0.003126-Jul-21 10.0000 10.5715 0.0136
ICICI Prudential All Seasons Bond Fund - Direct Plan - Quarterly IDCW
Record Date Face Value (Rs) NAV (Rs) IDCW (Rs.)/Unit
25-Jan-21 10.0000 11.8022 0.205529-Apr-21 10.0000 11.7567 0.125522-Jul-21 10.0000 11.7769 0.1265
ICICI Prudential All Seasons Bond Fund - Annual IDCW
Record Date Face Value (Rs) NAV (Rs) IDCW (Rs.)/Unit
28-Sep-18 10.0000 11.2361 0.290327-Sep-19 10.0000 12.0304 1.132429-Sep-20 10.0000 12.1902 1.3069
ICICI Prudential All Seasons Bond Fund - Direct Plan - Annual IDCW
Record Date Face Value (Rs) NAV (Rs) IDCW (Rs.)/Unit
28-Sep-18 10.0000 11.2747 0.370327-Sep-19 10.0000 12.0672 1.208929-Sep-20 10.0000 12.2264 1.3812
ICICI Prudential All Seasons Bond Fund - IDCW
Record Date Face Value (Rs) NAV (Rs) IDCW (Rs.)/Unit
26-Sep-14 10.0000 12.1619 1.8708
ICICI Prudential All Seasons Bond Fund - Direct Plan - IDCW
Record Date Face Value (Rs) NAV (Rs) IDCW (Rs.)/Unit
26-Sep-14 10.0000 12.1670 1.4968
ICICI Prudential Credit Risk Fund - Half Yearly IDCW
Record Date Face Value (Rs) NAV (Rs) IDCW (Rs.)/Unit
26-Mar-20 10.0000 10.6687 0.346630-Sep-20 10.0000 11.0241 0.680725-Mar-21 10.0000 10.7065 0.3319
ICICI Prudential Credit Risk Fund - Direct Plan - Half Yearly IDCW
Record Date Face Value (Rs) NAV (Rs) IDCW (Rs.)/Unit
26-Mar-20 10.0000 11.0455 0.386330-Sep-20 10.0000 11.4213 0.738625-Mar-21 10.0000 11.0956 0.3792
ICICI Prudential Credit Risk Fund - Annual IDCW
Record Date Face Value (Rs) NAV (Rs) IDCW (Rs.)/Unit
20-Mar-19 10.0000 10.8078 0.671220-Mar-20 10.0000 10.9720 0.965618-Mar-21 10.0000 10.9781 0.9327
ICICI Prudential Credit Risk Fund - Direct Plan - Annual IDCW
Record Date Face Value (Rs) NAV (Rs) IDCW (Rs.)/Unit
20-Mar-19 10.0000 11.1500 0.790320-Mar-20 10.0000 11.2769 1.049518-Mar-21 10.0000 11.2948 1.0742
ICICI Prudential Bond Fund - Monthly IDCW
Record Date Face Value (Rs) NAV (Rs) IDCW (Rs.)/Unit
31-May-21 10.0000 11.3483 0.044230-Jun-21 10.0000 11.3061 0.002030-Jul-21 10.0000 11.3228 0.0187
ICICI Prudential Bond Fund - Direct Plan - Monthly IDCW
Record Date Face Value (Rs) NAV (Rs) IDCW (Rs.)/Unit
31-May-21 10.0000 11.5629 0.051230-Jun-21 10.0000 11.5198 0.008130-Jul-21 10.0000 11.5369 0.0252
ICICI Prudential Bond Fund - Quarterly IDCW
Record Date Face Value (Rs) NAV (Rs) IDCW (Rs.)/Unit
17-Aug-20 10.0000 11.3691 0.320423-Nov-20 10.0000 11.3104 0.239024-May-21 10.0000 11.2304 0.1381
ICICI Prudential Short Term Fund - Monthly IDCW
Record Date Face Value (Rs) NAV (Rs) IDCW (Rs.)/Unit
31-May-21 10.0000 12.1184 0.055830-Jun-21 10.0000 12.0949 0.032330-Jul-21 10.0000 12.1084 0.0458
ICICI Prudential Short Term Fund - Direct Plan - Monthly IDCW
Record Date Face Value (Rs) NAV (Rs) IDCW (Rs.)/Unit
31-May-21 10.0000 12.7412 0.066730-Jun-21 10.0000 12.7164 0.041930-Jul-21 10.0000 12.7306 0.0561
ICICI Prudential Credit Risk Fund - Quarterly IDCW
Record Date Face Value (Rs) NAV (Rs) IDCW (Rs.)/Unit
30-Dec-20 10.0000 11.0134 0.276325-Mar-21 10.0000 10.8253 0.056730-Jun-21 10.0000 11.0460 0.2671
ICICI Prudential Credit Risk Fund - Direct Plan - Quarterly IDCW
Record Date Face Value (Rs) NAV (Rs) IDCW (Rs.)/Unit
30-Dec-20 10.0000 11.6568 0.311425-Mar-21 10.0000 11.4569 0.076730-Jun-21 10.0000 11.6939 0.3014
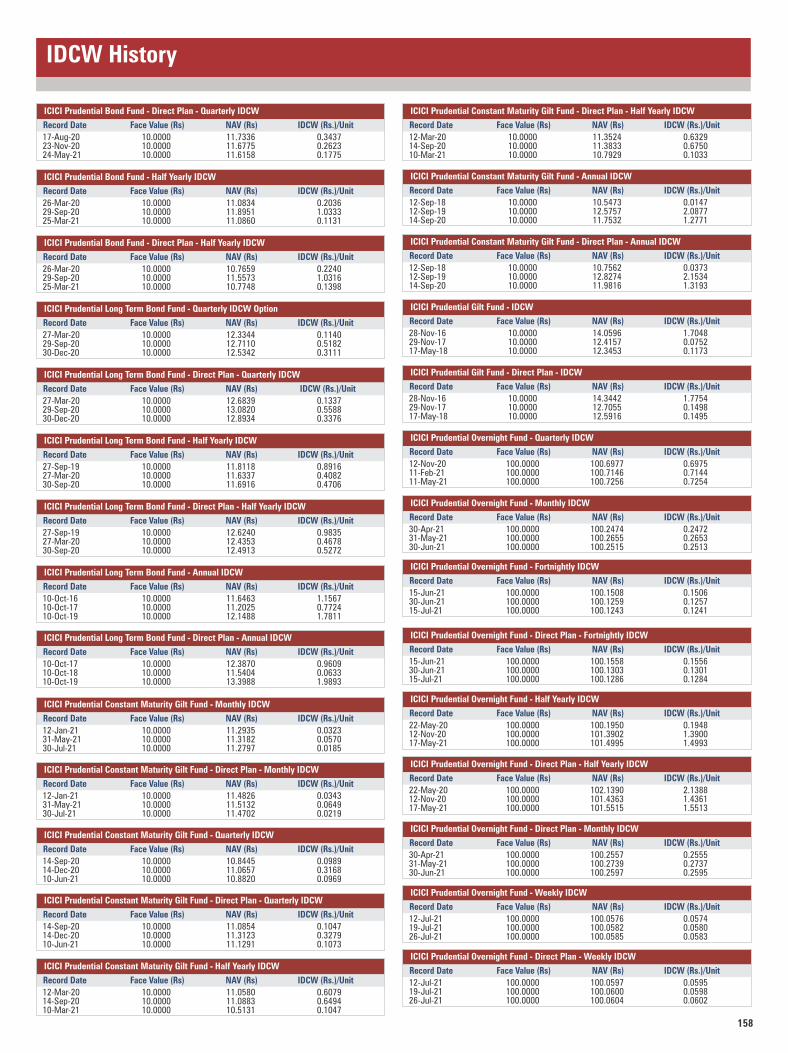
158
IDCW History
ICICI Prudential Bond Fund - Direct Plan - Quarterly IDCW
Record Date Face Value (Rs) NAV (Rs) IDCW (Rs.)/Unit
17-Aug-20 10.0000 11.7336 0.343723-Nov-20 10.0000 11.6775 0.262324-May-21 10.0000 11.6158 0.1775
ICICI Prudential Bond Fund - Half Yearly IDCW
Record Date Face Value (Rs) NAV (Rs) IDCW (Rs.)/Unit
26-Mar-20 10.0000 11.0834 0.203629-Sep-20 10.0000 11.8951 1.033325-Mar-21 10.0000 11.0860 0.1131
ICICI Prudential Bond Fund - Direct Plan - Half Yearly IDCW
Record Date Face Value (Rs) NAV (Rs) IDCW (Rs.)/Unit
26-Mar-20 10.0000 10.7659 0.224029-Sep-20 10.0000 11.5573 1.031625-Mar-21 10.0000 10.7748 0.1398
ICICI Prudential Long Term Bond Fund - Quarterly IDCW Option
Record Date Face Value (Rs) NAV (Rs) IDCW (Rs.)/Unit
27-Mar-20 10.0000 12.3344 0.114029-Sep-20 10.0000 12.7110 0.518230-Dec-20 10.0000 12.5342 0.3111
ICICI Prudential Long Term Bond Fund - Direct Plan - Quarterly IDCW
Record Date Face Value (Rs) NAV (Rs) IDCW (Rs.)/Unit
27-Mar-20 10.0000 12.6839 0.133729-Sep-20 10.0000 13.0820 0.558830-Dec-20 10.0000 12.8934 0.3376
ICICI Prudential Long Term Bond Fund - Half Yearly IDCW
Record Date Face Value (Rs) NAV (Rs) IDCW (Rs.)/Unit
27-Sep-19 10.0000 11.8118 0.891627-Mar-20 10.0000 11.6337 0.408230-Sep-20 10.0000 11.6916 0.4706
ICICI Prudential Long Term Bond Fund - Direct Plan - Half Yearly IDCW
Record Date Face Value (Rs) NAV (Rs) IDCW (Rs.)/Unit
27-Sep-19 10.0000 12.6240 0.983527-Mar-20 10.0000 12.4353 0.467830-Sep-20 10.0000 12.4913 0.5272
ICICI Prudential Long Term Bond Fund - Annual IDCW
Record Date Face Value (Rs) NAV (Rs) IDCW (Rs.)/Unit
10-Oct-16 10.0000 11.6463 1.156710-Oct-17 10.0000 11.2025 0.772410-Oct-19 10.0000 12.1488 1.7811
ICICI Prudential Long Term Bond Fund - Direct Plan - Annual IDCW Record Date Face Value (Rs) NAV (Rs) IDCW (Rs.)/Unit
10-Oct-17 10.0000 12.3870 0.960910-Oct-18 10.0000 11.5404 0.063310-Oct-19 10.0000 13.3988 1.9893
ICICI Prudential Constant Maturity Gilt Fund - Monthly IDCW
Record Date Face Value (Rs) NAV (Rs) IDCW (Rs.)/Unit
12-Jan-21 10.0000 11.2935 0.032331-May-21 10.0000 11.3182 0.057030-Jul-21 10.0000 11.2797 0.0185
ICICI Prudential Constant Maturity Gilt Fund - Direct Plan - Monthly IDCW
Record Date Face Value (Rs) NAV (Rs) IDCW (Rs.)/Unit
12-Jan-21 10.0000 11.4826 0.034331-May-21 10.0000 11.5132 0.064930-Jul-21 10.0000 11.4702 0.0219
ICICI Prudential Constant Maturity Gilt Fund - Quarterly IDCW
Record Date Face Value (Rs) NAV (Rs) IDCW (Rs.)/Unit
14-Sep-20 10.0000 10.8445 0.098914-Dec-20 10.0000 11.0657 0.316810-Jun-21 10.0000 10.8820 0.0969
ICICI Prudential Constant Maturity Gilt Fund - Direct Plan - Quarterly IDCW
Record Date Face Value (Rs) NAV (Rs) IDCW (Rs.)/Unit
14-Sep-20 10.0000 11.0854 0.104714-Dec-20 10.0000 11.3123 0.327910-Jun-21 10.0000 11.1291 0.1073
ICICI Prudential Constant Maturity Gilt Fund - Half Yearly IDCW
Record Date Face Value (Rs) NAV (Rs) IDCW (Rs.)/Unit
12-Mar-20 10.0000 11.0580 0.607914-Sep-20 10.0000 11.0883 0.649410-Mar-21 10.0000 10.5131 0.1047
ICICI Prudential Constant Maturity Gilt Fund - Direct Plan - Half Yearly IDCW
Record Date Face Value (Rs) NAV (Rs) IDCW (Rs.)/Unit
12-Mar-20 10.0000 11.3524 0.632914-Sep-20 10.0000 11.3833 0.675010-Mar-21 10.0000 10.7929 0.1033
ICICI Prudential Constant Maturity Gilt Fund - Annual IDCW
Record Date Face Value (Rs) NAV (Rs) IDCW (Rs.)/Unit
12-Sep-18 10.0000 10.5473 0.014712-Sep-19 10.0000 12.5757 2.087714-Sep-20 10.0000 11.7532 1.2771
ICICI Prudential Constant Maturity Gilt Fund - Direct Plan - Annual IDCW
Record Date Face Value (Rs) NAV (Rs) IDCW (Rs.)/Unit
12-Sep-18 10.0000 10.7562 0.037312-Sep-19 10.0000 12.8274 2.153414-Sep-20 10.0000 11.9816 1.3193
ICICI Prudential Gilt Fund - IDCW
Record Date Face Value (Rs) NAV (Rs) IDCW (Rs.)/Unit
28-Nov-16 10.0000 14.0596 1.704829-Nov-17 10.0000 12.4157 0.075217-May-18 10.0000 12.3453 0.1173
ICICI Prudential Gilt Fund - Direct Plan - IDCW
Record Date Face Value (Rs) NAV (Rs) IDCW (Rs.)/Unit
28-Nov-16 10.0000 14.3442 1.775429-Nov-17 10.0000 12.7055 0.149817-May-18 10.0000 12.5916 0.1495
ICICI Prudential Overnight Fund - Quarterly IDCW
Record Date Face Value (Rs) NAV (Rs) IDCW (Rs.)/Unit
12-Nov-20 100.0000 100.6977 0.697511-Feb-21 100.0000 100.7146 0.714411-May-21 100.0000 100.7256 0.7254
ICICI Prudential Overnight Fund - Monthly IDCW
Record Date Face Value (Rs) NAV (Rs) IDCW (Rs.)/Unit
30-Apr-21 100.0000 100.2474 0.247231-May-21 100.0000 100.2655 0.265330-Jun-21 100.0000 100.2515 0.2513
ICICI Prudential Overnight Fund - Direct Plan - Fortnightly IDCW
Record Date Face Value (Rs) NAV (Rs) IDCW (Rs.)/Unit
15-Jun-21 100.0000 100.1558 0.155630-Jun-21 100.0000 100.1303 0.130115-Jul-21 100.0000 100.1286 0.1284
ICICI Prudential Overnight Fund - Fortnightly IDCW
Record Date Face Value (Rs) NAV (Rs) IDCW (Rs.)/Unit
15-Jun-21 100.0000 100.1508 0.150630-Jun-21 100.0000 100.1259 0.125715-Jul-21 100.0000 100.1243 0.1241
ICICI Prudential Overnight Fund - Direct Plan - Half Yearly IDCW
Record Date Face Value (Rs) NAV (Rs) IDCW (Rs.)/Unit
22-May-20 100.0000 102.1390 2.138812-Nov-20 100.0000 101.4363 1.436117-May-21 100.0000 101.5515 1.5513
ICICI Prudential Overnight Fund - Direct Plan - Monthly IDCW
Record Date Face Value (Rs) NAV (Rs) IDCW (Rs.)/Unit
30-Apr-21 100.0000 100.2557 0.255531-May-21 100.0000 100.2739 0.273730-Jun-21 100.0000 100.2597 0.2595
ICICI Prudential Overnight Fund - Weekly IDCW
Record Date Face Value (Rs) NAV (Rs) IDCW (Rs.)/Unit
12-Jul-21 100.0000 100.0576 0.057419-Jul-21 100.0000 100.0582 0.058026-Jul-21 100.0000 100.0585 0.0583
ICICI Prudential Overnight Fund - Half Yearly IDCW
Record Date Face Value (Rs) NAV (Rs) IDCW (Rs.)/Unit
22-May-20 100.0000 100.1950 0.194812-Nov-20 100.0000 101.3902 1.390017-May-21 100.0000 101.4995 1.4993
ICICI Prudential Overnight Fund - Direct Plan - Weekly IDCW
Record Date Face Value (Rs) NAV (Rs) IDCW (Rs.)/Unit
12-Jul-21 100.0000 100.0597 0.059519-Jul-21 100.0000 100.0600 0.059826-Jul-21 100.0000 100.0604 0.0602
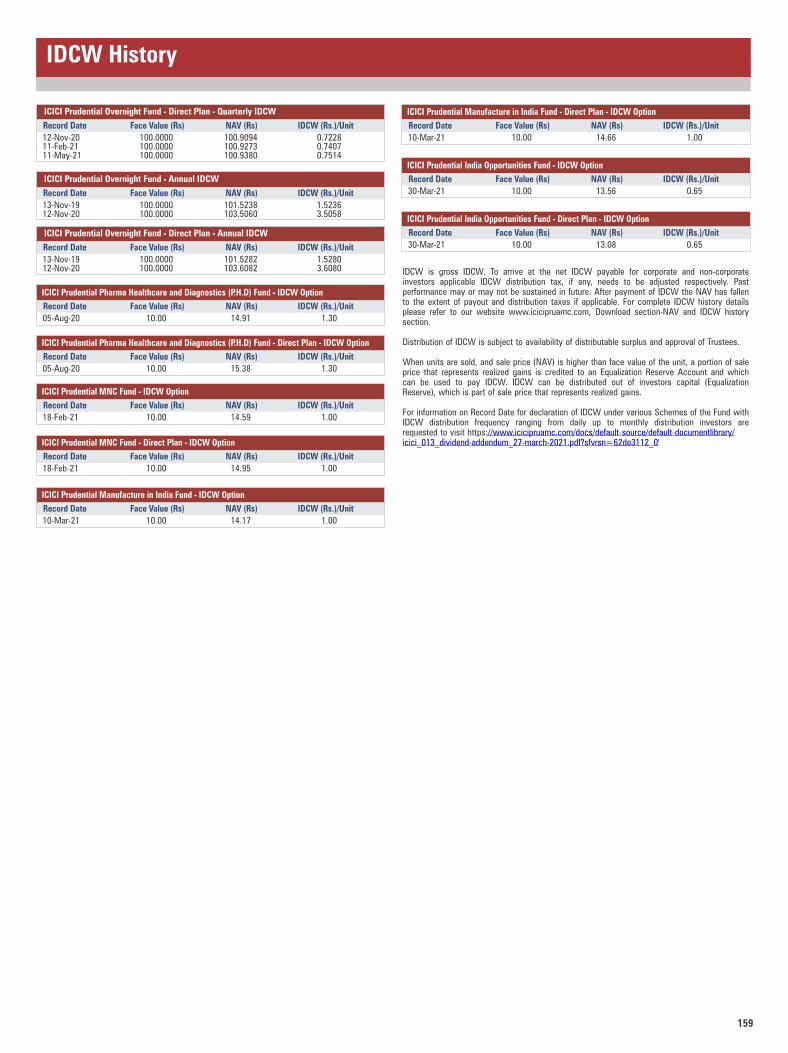
159
IDCW History
ICICI Prudential Overnight Fund - Annual IDCW
Record Date Face Value (Rs) NAV (Rs) IDCW (Rs.)/Unit
13-Nov-19 100.0000 101.5238 1.523612-Nov-20 100.0000 103.5060 3.5058
ICICI Prudential Overnight Fund - Direct Plan - Quarterly IDCW
Record Date Face Value (Rs) NAV (Rs) IDCW (Rs.)/Unit
12-Nov-20 100.0000 100.9094 0.722811-Feb-21 100.0000 100.9273 0.740711-May-21 100.0000 100.9380 0.7514
ICICI Prudential Overnight Fund - Direct Plan - Annual IDCW
Record Date Face Value (Rs) NAV (Rs) IDCW (Rs.)/Unit
13-Nov-19 100.0000 101.5282 1.528012-Nov-20 100.0000 103.6082 3.6080
ICICI Prudential Pharma Healthcare and Diagnostics (P.H.D) Fund - Direct Plan - IDCW Option
Record Date Face Value (Rs) NAV (Rs) IDCW (Rs.)/Unit
05-Aug-20 10.00 15.38 1.30
ICICI Prudential Pharma Healthcare and Diagnostics (P.H.D) Fund - IDCW Option
Record Date Face Value (Rs) NAV (Rs) IDCW (Rs.)/Unit
05-Aug-20 10.00 14.91 1.30
ICICI Prudential MNC Fund - IDCW Option
Record Date Face Value (Rs) NAV (Rs) IDCW (Rs.)/Unit
18-Feb-21 10.00 14.59 1.00
ICICI Prudential MNC Fund - Direct Plan - IDCW Option
Record Date Face Value (Rs) NAV (Rs) IDCW (Rs.)/Unit
18-Feb-21 10.00 14.95 1.00
ICICI Prudential Manufacture in India Fund - Direct Plan - IDCW Option
Record Date Face Value (Rs) NAV (Rs) IDCW (Rs.)/Unit
10-Mar-21 10.00 14.66 1.00
ICICI Prudential Manufacture in India Fund - IDCW Option
Record Date Face Value (Rs) NAV (Rs) IDCW (Rs.)/Unit
10-Mar-21 10.00 14.17 1.00
IDCW is gross IDCW. To arrive at the net IDCW payable for corporate and non-corporate investors applicable IDCW distribution tax, if any, needs to be adjusted respectively. Past performance may or may not be sustained in future. After payment of IDCW the NAV has fallen to the extent of payout and distribution taxes if applicable. For complete IDCW history details please refer to our website www.icicipruamc.com, Download section-NAV and IDCW history section.
Distribution of IDCW is subject to availability of distributable surplus and approval of Trustees.
When units are sold, and sale price (NAV) is higher than face value of the unit, a portion of sale price that represents realized gains is credited to an Equalization Reserve Account and which can be used to pay IDCW. IDCW can be distributed out of investors capital (Equalization Reserve), which is part of sale price that represents realized gains.
For information on Record Date for declaration of IDCW under various Schemes of the Fund with IDCW distribution frequency ranging from daily up to monthly distribution investors are requested to visit https://www.icicipruamc.com/docs/default-source/default-documentlibrary/icici_013_dividend-addendum_27-march-2021.pdf?sfvrsn=62de3112_0'
ICICI Prudential India Opportunities Fund - Direct Plan - IDCW Option
Record Date Face Value (Rs) NAV (Rs) IDCW (Rs.)/Unit
30-Mar-21 10.00 13.08 0.65
ICICI Prudential India Opportunities Fund - IDCW Option
Record Date Face Value (Rs) NAV (Rs) IDCW (Rs.)/Unit
30-Mar-21 10.00 13.56 0.65
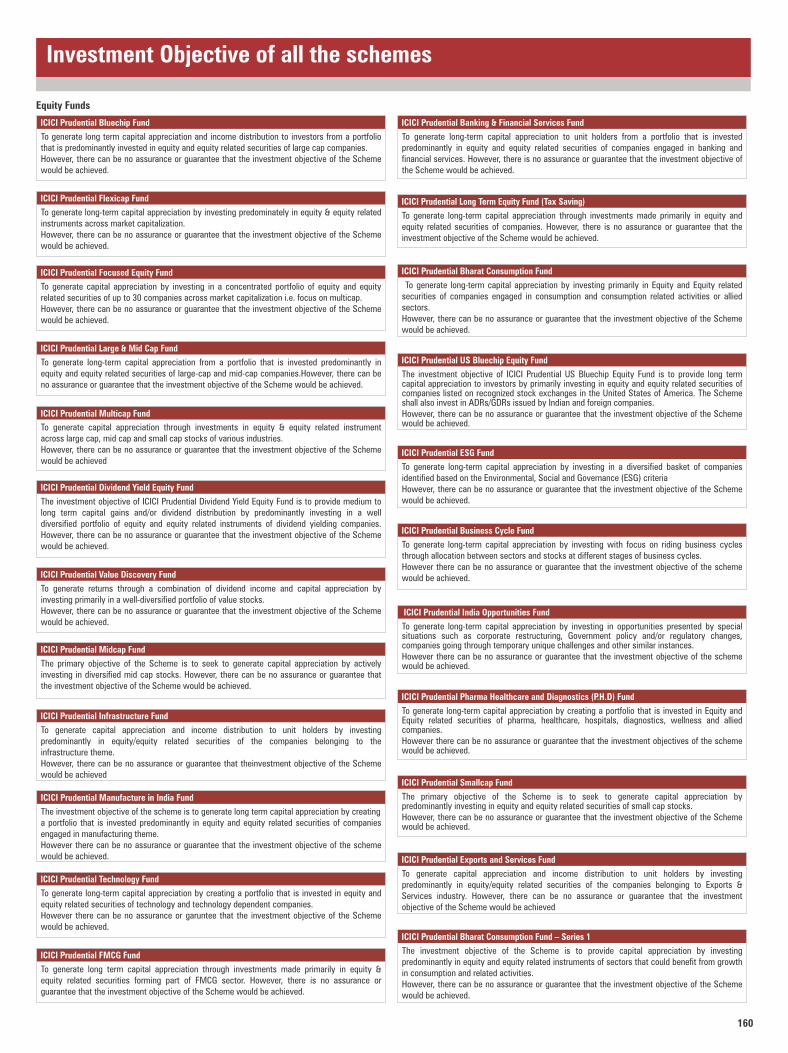
160
ICICI Prudential Bluechip Fund
To generate long term capital appreciation and income distribution to investors from a portfolio that is predominantly invested in equity and equity related securities of large cap companies. However, there can be no assurance or guarantee that the investment objective of the Scheme would be achieved.
ICICI Prudential Focused Equity Fund
To generate capital appreciation by investing in a concentrated portfolio of equity and equity related securities of up to 30 companies across market capitalization i.e. focus on multicap.However, there can be no assurance or guarantee that the investment objective of the Scheme would be achieved.
ICICI Prudential Large & Mid Cap Fund
To generate long-term capital appreciation from a portfolio that is invested predominantly in equity and equity related securities of large-cap and mid-cap companies.However, there can be no assurance or guarantee that the investment objective of the Scheme would be achieved.
ICICI Prudential Multicap Fund
To generate capital appreciation through investments in equity & equity related instrument across large cap, mid cap and small cap stocks of various industries.However, there can be no assurance or guarantee that the investment objective of the Scheme would be achieved
ICICI Prudential Dividend Yield Equity Fund
The investment objective of ICICI Prudential Dividend Yield Equity Fund is to provide medium to long term capital gains and/or dividend distribution by predominantly investing in a well diversified portfolio of equity and equity related instruments of dividend yielding companies. However, there can be no assurance or guarantee that the investment objective of the Scheme would be achieved.
ICICI Prudential Value Discovery Fund
To generate returns through a combination of dividend income and capital appreciation by investing primarily in a well-diversified portfolio of value stocks.However, there can be no assurance or guarantee that the investment objective of the Scheme would be achieved.
ICICI Prudential Midcap Fund
The primary objective of the Scheme is to seek to generate capital appreciation by actively investing in diversified mid cap stocks. However, there can be no assurance or guarantee that the investment objective of the Scheme would be achieved.
ICICI Prudential Infrastructure Fund
To generate capital appreciation and income distribution to unit holders by investing predominantly in equity/equity related securities of the companies belonging to the infrastructure theme.However, there can be no assurance or guarantee that theinvestment objective of the Scheme would be achieved
ICICI Prudential Technology Fund
To generate long-term capital appreciation by creating a portfolio that is invested in equity and equity related securities of technology and technology dependent companies. However there can be no assurance or garuntee that the investment objective of the Scheme would be achieved.
ICICI Prudential FMCG Fund
To generate long term capital appreciation through investments made primarily in equity & equity related securities forming part of FMCG sector. However, there is no assurance or guarantee that the investment objective of the Scheme would be achieved.
Equity Funds
ICICI Prudential Long Term Equity Fund (Tax Saving)
To generate long-term capital appreciation through investments made primarily in equity and equity related securities of companies. However, there is no assurance or guarantee that the investment objective of the Scheme would be achieved.
ICICI Prudential Manufacture in India Fund
The investment objective of the scheme is to generate long term capital appreciation by creating a portfolio that is invested predominantly in equity and equity related securities of companies engaged in manufacturing theme. However there can be no assurance or guarantee that the investment objective of the scheme would be achieved.
ICICI Prudential Banking & Financial Services Fund
To generate long-term capital appreciation to unit holders from a portfolio that is invested predominantly in equity and equity related securities of companies engaged in banking and financial services. However, there is no assurance or guarantee that the investment objective of the Scheme would be achieved.
Investment Objective of all the schemes
ICICI Prudential Exports and Services Fund
To generate capital appreciation and income distribution to unit holders by investing predominantly in equity/equity related securities of the companies belonging to Exports & Services industry. However, there can be no assurance or guarantee that the investment objective of the Scheme would be achieved
ICICI Prudential Smallcap Fund
The primary objective of the Scheme is to seek to generate capital appreciation by predominantly investing in equity and equity related securities of small cap stocks.However, there can be no assurance or guarantee that the investment objective of the Scheme would be achieved.
ICICI Prudential Pharma Healthcare and Diagnostics (P.H.D) Fund
To generate long-term capital appreciation by creating a portfolio that is invested in Equity and Equity related securities of pharma, healthcare, hospitals, diagnostics, wellness and allied companies. However there can be no assurance or guarantee that the investment objectives of the scheme would be achieved.
ICICI Prudential India Opportunities Fund
To generate long-term capital appreciation by investing in opportunities presented by special situations such as corporate restructuring, Government policy and/or regulatory changes, companies going through temporary unique challenges and other similar instances. However there can be no assurance or guarantee that the investment objective of the scheme would be achieved.
ICICI Prudential US Bluechip Equity Fund
The investment objective of ICICI Prudential US Bluechip Equity Fund is to provide long term capital appreciation to investors by primarily investing in equity and equity related securities of companies listed on recognized stock exchanges in the United States of America. The Scheme shall also invest in ADRs/GDRs issued by Indian and foreign companies.However, there can be no assurance or guarantee that the investment objective of the Scheme would be achieved.
ICICI Prudential Bharat Consumption Fund
To generate long-term capital appreciation by investing primarily in Equity and Equity related securities of companies engaged in consumption and consumption related activities or allied sectors. However, there can be no assurance or guarantee that the investment objective of the Scheme would be achieved.
ICICI Prudential ESG Fund
To generate long-term capital appreciation by investing in a diversified basket of companies identified based on the Environmental, Social and Governance (ESG) criteria However, there can be no assurance or guarantee that the investment objective of the Scheme would be achieved.
ICICI Prudential Business Cycle Fund
To generate long-term capital appreciation by investing with focus on riding business cycles through allocation between sectors and stocks at different stages of business cycles.However there can be no assurance or guarantee that the investment objective of the scheme would be achieved.
ICICI Prudential Bharat Consumption Fund – Series 1
The investment objective of the Scheme is to provide capital appreciation by investing predominantly in equity and equity related instruments of sectors that could benefit from growth in consumption and related activities. However, there can be no assurance or guarantee that the investment objective of the Scheme would be achieved.
ICICI Prudential Flexicap Fund
To generate long-term capital appreciation by investing predominately in equity & equity related instruments across market capitalization. However, there can be no assurance or guarantee that the investment objective of the Scheme would be achieved.
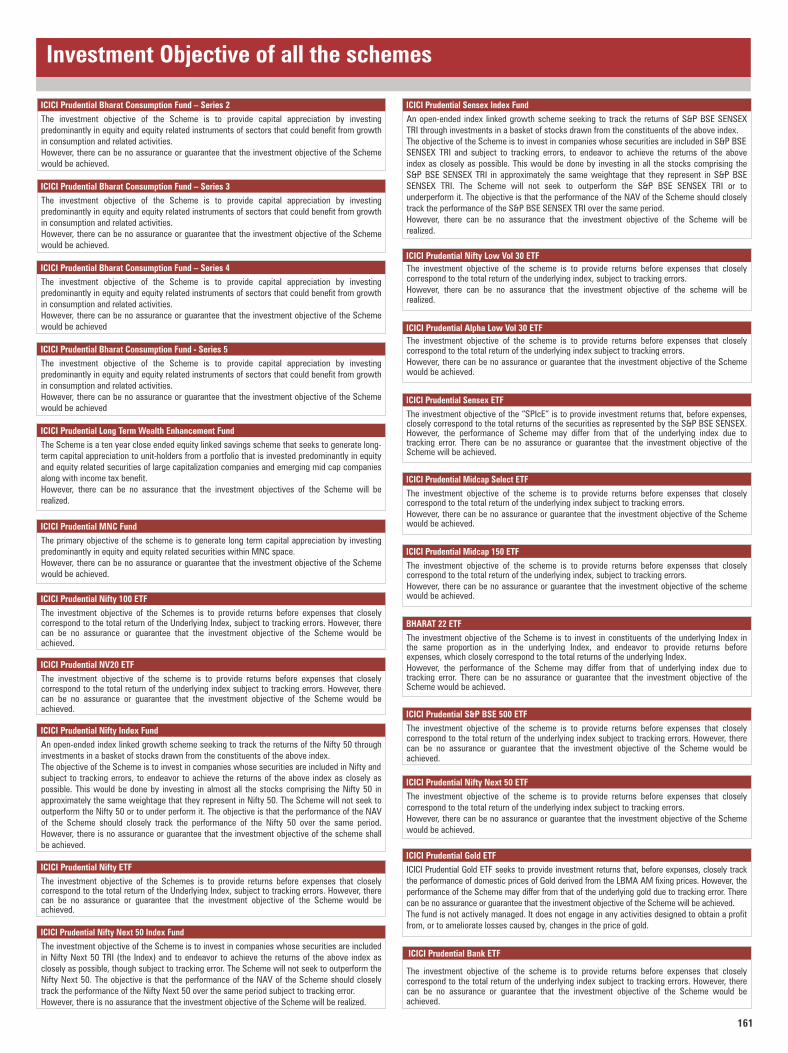
161
Investment Objective of all the schemes
ICICI Prudential Bharat Consumption Fund – Series 2
The investment objective of the Scheme is to provide capital appreciation by investing predominantly in equity and equity related instruments of sectors that could benefit from growth in consumption and related activities. However, there can be no assurance or guarantee that the investment objective of the Scheme would be achieved.
ICICI Prudential Bharat Consumption Fund – Series 3
The investment objective of the Scheme is to provide capital appreciation by investing predominantly in equity and equity related instruments of sectors that could benefit from growth in consumption and related activities. However, there can be no assurance or guarantee that the investment objective of the Scheme would be achieved.
ICICI Prudential Bharat Consumption Fund – Series 4
The investment objective of the Scheme is to provide capital appreciation by investing predominantly in equity and equity related instruments of sectors that could benefit from growth in consumption and related activities. However, there can be no assurance or guarantee that the investment objective of the Scheme would be achieved
ICICI Prudential Bharat Consumption Fund - Series 5
The investment objective of the Scheme is to provide capital appreciation by investing predominantly in equity and equity related instruments of sectors that could benefit from growth in consumption and related activities. However, there can be no assurance or guarantee that the investment objective of the Scheme would be achieved
ICICI Prudential Long Term Wealth Enhancement Fund
The Scheme is a ten year close ended equity linked savings scheme that seeks to generate long-term capital appreciation to unit-holders from a portfolio that is invested predominantly in equity and equity related securities of large capitalization companies and emerging mid cap companies along with income tax benefit. However, there can be no assurance that the investment objectives of the Scheme will be realized.
ICICI Prudential MNC Fund
The primary objective of the scheme is to generate long term capital appreciation by investing predominantly in equity and equity related securities within MNC space.However, there can be no assurance or guarantee that the investment objective of the Scheme would be achieved.
ICICI Prudential NV20 ETF
The investment objective of the scheme is to provide returns before expenses that closely correspond to the total return of the underlying index subject to tracking errors. However, there can be no assurance or guarantee that the investment objective of the Scheme would be achieved.
ICICI Prudential Nifty 100 ETF
The investment objective of the Schemes is to provide returns before expenses that closely correspond to the total return of the Underlying Index, subject to tracking errors. However, there can be no assurance or guarantee that the investment objective of the Scheme would be achieved.
ICICI Prudential Nifty Index Fund
An open-ended index linked growth scheme seeking to track the returns of the Nifty 50 through investments in a basket of stocks drawn from the constituents of the above index.The objective of the Scheme is to invest in companies whose securities are included in Nifty and subject to tracking errors, to endeavor to achieve the returns of the above index as closely as possible. This would be done by investing in almost all the stocks comprising the Nifty 50 in approximately the same weightage that they represent in Nifty 50. The Scheme will not seek to outperform the Nifty 50 or to under perform it. The objective is that the performance of the NAV of the Scheme should closely track the performance of the Nifty 50 over the same period. However, there is no assurance or guarantee that the investment objective of the scheme shall be achieved.
ICICI Prudential Nifty ETF
The investment objective of the Schemes is to provide returns before expenses that closely correspond to the total return of the Underlying Index, subject to tracking errors. However, there can be no assurance or guarantee that the investment objective of the Scheme would be achieved.
ICICI Prudential Nifty Next 50 Index Fund
The investment objective of the Scheme is to invest in companies whose securities are included in Nifty Next 50 TRI (the Index) and to endeavor to achieve the returns of the above index as closely as possible, though subject to tracking error. The Scheme will not seek to outperform the Nifty Next 50. The objective is that the performance of the NAV of the Scheme should closely track the performance of the Nifty Next 50 over the same period subject to tracking error. However, there is no assurance that the investment objective of the Scheme will be realized.
ICICI Prudential Sensex Index Fund
An open-ended index linked growth scheme seeking to track the returns of S&P BSE SENSEX TRI through investments in a basket of stocks drawn from the constituents of the above index.The objective of the Scheme is to invest in companies whose securities are included in S&P BSE SENSEX TRI and subject to tracking errors, to endeavor to achieve the returns of the above index as closely as possible. This would be done by investing in all the stocks comprising the S&P BSE SENSEX TRI in approximately the same weightage that they represent in S&P BSE SENSEX TRI. The Scheme will not seek to outperform the S&P BSE SENSEX TRI or to underperform it. The objective is that the performance of the NAV of the Scheme should closely track the performance of the S&P BSE SENSEX TRI over the same period. However, there can be no assurance that the investment objective of the Scheme will be realized.
ICICI Prudential Nifty Low Vol 30 ETF
The investment objective of the scheme is to provide returns before expenses that closely correspond to the total return of the underlying index, subject to tracking errors.However, there can be no assurance that the investment objective of the scheme will be realized.
ICICI Prudential Sensex ETF
The investment objective of the “SPIcE” is to provide investment returns that, before expenses, closely correspond to the total returns of the securities as represented by the S&P BSE SENSEX. However, the performance of Scheme may differ from that of the underlying index due to tracking error. There can be no assurance or guarantee that the investment objective of the Scheme will be achieved.
ICICI Prudential Midcap Select ETF
The investment objective of the scheme is to provide returns before expenses that closely correspond to the total return of the underlying index subject to tracking errors.However, there can be no assurance or guarantee that the investment objective of the Scheme would be achieved.
ICICI Prudential Alpha Low Vol 30 ETF
The investment objective of the scheme is to provide returns before expenses that closely correspond to the total return of the underlying index subject to tracking errors.However, there can be no assurance or guarantee that the investment objective of the Scheme would be achieved.
ICICI Prudential Midcap 150 ETF
The investment objective of the scheme is to provide returns before expenses that closely correspond to the total return of the underlying index, subject to tracking errors.However, there can be no assurance or guarantee that the investment objective of the scheme would be achieved.
BHARAT 22 ETF
The investment objective of the Scheme is to invest in constituents of the underlying Index in the same proportion as in the underlying Index, and endeavor to provide returns before expenses, which closely correspond to the total returns of the underlying Index.However, the performance of the Scheme may differ from that of underlying index due to tracking error. There can be no assurance or guarantee that the investment objective of the Scheme would be achieved.
ICICI Prudential S&P BSE 500 ETF
The investment objective of the scheme is to provide returns before expenses that closely correspond to the total return of the underlying index subject to tracking errors. However, there can be no assurance or guarantee that the investment objective of the Scheme would be achieved.
ICICI Prudential Nifty Next 50 ETF
The investment objective of the scheme is to provide returns before expenses that closely correspond to the total return of the underlying index subject to tracking errors. However, there can be no assurance or guarantee that the investment objective of the Scheme would be achieved.
ICICI Prudential Gold ETF
ICICI Prudential Gold ETF seeks to provide investment returns that, before expenses, closely track the performance of domestic prices of Gold derived from the LBMA AM fixing prices. However, the performance of the Scheme may differ from that of the underlying gold due to tracking error. There can be no assurance or guarantee that the investment objective of the Scheme will be achieved. The fund is not actively managed. It does not engage in any activities designed to obtain a profit from, or to ameliorate losses caused by, changes in the price of gold.
ICICI Prudential Bank ETF
The investment objective of the scheme is to provide returns before expenses that closely correspond to the total return of the underlying index subject to tracking errors. However, there can be no assurance or guarantee that the investment objective of the Scheme would be achieved.
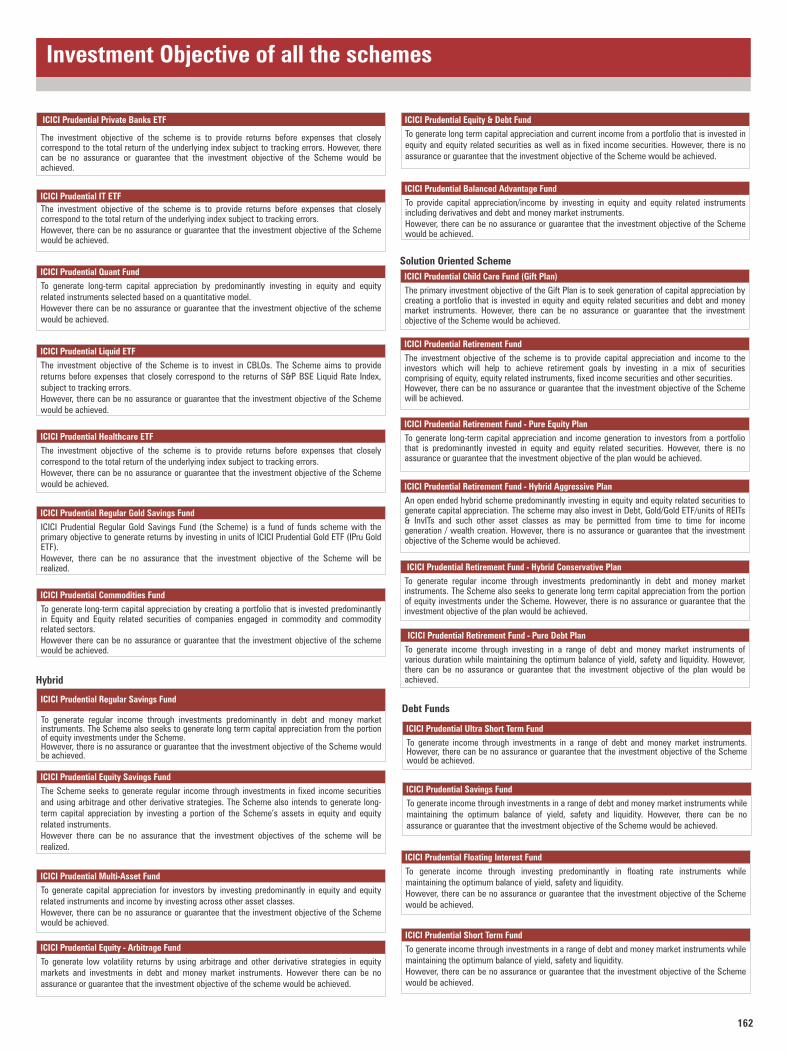
162
Investment Objective of all the schemes
ICICI Prudential Multi-Asset Fund
To generate capital appreciation for investors by investing predominantly in equity and equity related instruments and income by investing across other asset classes.However, there can be no assurance or guarantee that the investment objective of the Scheme would be achieved.
ICICI Prudential Equity - Arbitrage Fund
To generate low volatility returns by using arbitrage and other derivative strategies in equity markets and investments in debt and money market instruments. However there can be no assurance or guarantee that the investment objective of the scheme would be achieved.
ICICI Prudential Regular Savings Fund
To generate regular income through investments predominantly in debt and money market instruments. The Scheme also seeks to generate long term capital appreciation from the portion of equity investments under the Scheme.However, there is no assurance or guarantee that the investment objective of the Scheme would be achieved.
Hybrid
ICICI Prudential Equity Savings Fund
The Scheme seeks to generate regular income through investments in fixed income securities and using arbitrage and other derivative strategies. The Scheme also intends to generate long-term capital appreciation by investing a portion of the Scheme’s assets in equity and equity related instruments. However there can be no assurance that the investment objectives of the scheme will be realized.
ICICI Prudential Regular Gold Savings Fund
ICICI Prudential Regular Gold Savings Fund (the Scheme) is a fund of funds scheme with the primary objective to generate returns by investing in units of ICICI Prudential Gold ETF (IPru Gold ETF). However, there can be no assurance that the investment objective of the Scheme will be realized.
ICICI Prudential Commodities Fund
To generate long-term capital appreciation by creating a portfolio that is invested predominantly in Equity and Equity related securities of companies engaged in commodity and commodity related sectors.However there can be no assurance or guarantee that the investment objective of the scheme would be achieved.
ICICI Prudential Liquid ETF
The investment objective of the Scheme is to invest in CBLOs. The Scheme aims to provide returns before expenses that closely correspond to the returns of S&P BSE Liquid Rate Index, subject to tracking errors.However, there can be no assurance or guarantee that the investment objective of the Scheme would be achieved.
ICICI Prudential Private Banks ETF
The investment objective of the scheme is to provide returns before expenses that closely correspond to the total return of the underlying index subject to tracking errors. However, there can be no assurance or guarantee that the investment objective of the Scheme would be achieved.
ICICI Prudential IT ETF
The investment objective of the scheme is to provide returns before expenses that closely correspond to the total return of the underlying index subject to tracking errors.However, there can be no assurance or guarantee that the investment objective of the Scheme would be achieved.
ICICI Prudential Quant Fund
To generate long-term capital appreciation by predominantly investing in equity and equity related instruments selected based on a quantitative model. However there can be no assurance or guarantee that the investment objective of the scheme would be achieved.
ICICI Prudential Equity & Debt Fund
To generate long term capital appreciation and current income from a portfolio that is invested in equity and equity related securities as well as in fixed income securities. However, there is no assurance or guarantee that the investment objective of the Scheme would be achieved.
ICICI Prudential Child Care Fund (Gift Plan)
The primary investment objective of the Gift Plan is to seek generation of capital appreciation by creating a portfolio that is invested in equity and equity related securities and debt and money market instruments. However, there can be no assurance or guarantee that the investment objective of the Scheme would be achieved.
Solution Oriented Scheme
ICICI Prudential Retirement Fund
The investment objective of the scheme is to provide capital appreciation and income to the investors which will help to achieve retirement goals by investing in a mix of securities comprising of equity, equity related instruments, fixed income securities and other securities.However, there can be no assurance or guarantee that the investment objective of the Scheme will be achieved.
ICICI Prudential Retirement Fund - Pure Equity Plan
To generate long-term capital appreciation and income generation to investors from a portfolio that is predominantly invested in equity and equity related securities. However, there is no assurance or guarantee that the investment objective of the plan would be achieved.
ICICI Prudential Retirement Fund - Hybrid Aggressive Plan
An open ended hybrid scheme predominantly investing in equity and equity related securities to generate capital appreciation. The scheme may also invest in Debt, Gold/Gold ETF/units of REITs & InvITs and such other asset classes as may be permitted from time to time for income generation / wealth creation. However, there is no assurance or guarantee that the investment objective of the Scheme would be achieved.
ICICI Prudential Retirement Fund - Hybrid Conservative Plan
To generate regular income through investments predominantly in debt and money market instruments. The Scheme also seeks to generate long term capital appreciation from the portion of equity investments under the Scheme. However, there is no assurance or guarantee that the investment objective of the plan would be achieved.
ICICI Prudential Retirement Fund - Pure Debt Plan
To generate income through investing in a range of debt and money market instruments of various duration while maintaining the optimum balance of yield, safety and liquidity. However, there can be no assurance or guarantee that the investment objective of the plan would be achieved.
Debt Funds
ICICI Prudential Savings Fund
To generate income through investments in a range of debt and money market instruments while maintaining the optimum balance of yield, safety and liquidity. However, there can be no assurance or guarantee that the investment objective of the Scheme would be achieved.
ICICI Prudential Ultra Short Term Fund
To generate income through investments in a range of debt and money market instruments. However, there can be no assurance or guarantee that the investment objective of the Scheme would be achieved.
ICICI Prudential Balanced Advantage Fund
To provide capital appreciation/income by investing in equity and equity related instruments including derivatives and debt and money market instruments.However, there can be no assurance or guarantee that the investment objective of the Scheme would be achieved.
ICICI Prudential Short Term Fund
To generate income through investments in a range of debt and money market instruments while maintaining the optimum balance of yield, safety and liquidity.However, there can be no assurance or guarantee that the investment objective of the Scheme would be achieved.
ICICI Prudential Floating Interest Fund
To generate income through investing predominantly in floating rate instruments while maintaining the optimum balance of yield, safety and liquidity.However, there can be no assurance or guarantee that the investment objective of the Scheme would be achieved.
ICICI Prudential Healthcare ETF
The investment objective of the scheme is to provide returns before expenses that closely correspond to the total return of the underlying index subject to tracking errors.However, there can be no assurance or guarantee that the investment objective of the Scheme would be achieved.
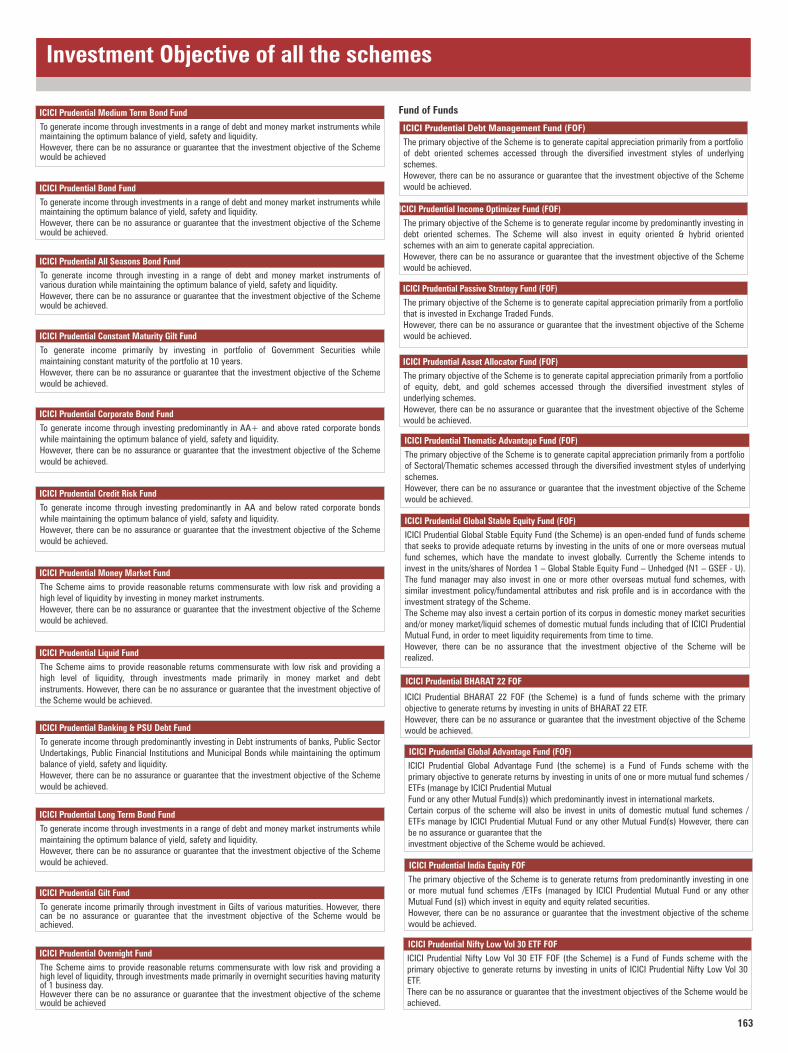
163
ICICI Prudential Long Term Bond Fund
To generate income through investments in a range of debt and money market instruments while maintaining the optimum balance of yield, safety and liquidity.However, there can be no assurance or guarantee that the investment objective of the Scheme would be achieved.
Investment Objective of all the schemes
ICICI Prudential Banking & PSU Debt Fund
To generate income through predominantly investing in Debt instruments of banks, Public Sector Undertakings, Public Financial Institutions and Municipal Bonds while maintaining the optimum balance of yield, safety and liquidity.However, there can be no assurance or guarantee that the investment objective of the Scheme would be achieved.
ICICI Prudential Corporate Bond Fund
To generate income through investing predominantly in AA+ and above rated corporate bonds while maintaining the optimum balance of yield, safety and liquidity.However, there can be no assurance or guarantee that the investment objective of the Scheme would be achieved.
ICICI Prudential Constant Maturity Gilt Fund
To generate income primarily by investing in portfolio of Government Securities while maintaining constant maturity of the portfolio at 10 years.However, there can be no assurance or guarantee that the investment objective of the Scheme would be achieved.
ICICI Prudential Money Market Fund
The Scheme aims to provide reasonable returns commensurate with low risk and providing a high level of liquidity by investing in money market instruments.However, there can be no assurance or guarantee that the investment objective of the Scheme would be achieved.
ICICI Prudential Credit Risk Fund
To generate income through investing predominantly in AA and below rated corporate bonds while maintaining the optimum balance of yield, safety and liquidity.However, there can be no assurance or guarantee that the investment objective of the Scheme would be achieved.
ICICI Prudential Liquid Fund
The Scheme aims to provide reasonable returns commensurate with low risk and providing a high level of liquidity, through investments made primarily in money market and debt instruments. However, there can be no assurance or guarantee that the investment objective of the Scheme would be achieved.
ICICI Prudential Medium Term Bond Fund
To generate income through investments in a range of debt and money market instruments while maintaining the optimum balance of yield, safety and liquidity.However, there can be no assurance or guarantee that the investment objective of the Scheme would be achieved
ICICI Prudential All Seasons Bond Fund
To generate income through investing in a range of debt and money market instruments of various duration while maintaining the optimum balance of yield, safety and liquidity. However, there can be no assurance or guarantee that the investment objective of the Scheme would be achieved.
ICICI Prudential Bond Fund
To generate income through investments in a range of debt and money market instruments while maintaining the optimum balance of yield, safety and liquidity.However, there can be no assurance or guarantee that the investment objective of the Scheme would be achieved.
ICICI Prudential Gilt Fund
To generate income primarily through investment in Gilts of various maturities. However, there can be no assurance or guarantee that the investment objective of the Scheme would be achieved.
ICICI Prudential Overnight Fund
The Scheme aims to provide reasonable returns commensurate with low risk and providing a high level of liquidity, through investments made primarily in overnight securities having maturity of 1 business day.However there can be no assurance or guarantee that the investment objective of the scheme would be achieved
ICICI Prudential Income Optimizer Fund (FOF)
The primary objective of the Scheme is to generate regular income by predominantly investing in debt oriented schemes. The Scheme will also invest in equity oriented & hybrid oriented schemes with an aim to generate capital appreciation.However, there can be no assurance or guarantee that the investment objective of the Scheme would be achieved.
Fund of Funds
ICICI Prudential Debt Management Fund (FOF)
The primary objective of the Scheme is to generate capital appreciation primarily from a portfolio of debt oriented schemes accessed through the diversified investment styles of underlying schemes.However, there can be no assurance or guarantee that the investment objective of the Scheme would be achieved.
ICICI Prudential Passive Strategy Fund (FOF)
The primary objective of the Scheme is to generate capital appreciation primarily from a portfolio that is invested in Exchange Traded Funds.However, there can be no assurance or guarantee that the investment objective of the Scheme would be achieved.
ICICI Prudential Asset Allocator Fund (FOF)
The primary objective of the Scheme is to generate capital appreciation primarily from a portfolio of equity, debt, and gold schemes accessed through the diversified investment styles of underlying schemes.However, there can be no assurance or guarantee that the investment objective of the Scheme would be achieved.
ICICI Prudential Global Stable Equity Fund (FOF)
ICICI Prudential Global Stable Equity Fund (the Scheme) is an open-ended fund of funds scheme that seeks to provide adequate returns by investing in the units of one or more overseas mutual fund schemes, which have the mandate to invest globally. Currently the Scheme intends to invest in the units/shares of Nordea 1 – Global Stable Equity Fund – Unhedged (N1 – GSEF - U). The fund manager may also invest in one or more other overseas mutual fund schemes, with similar investment policy/fundamental attributes and risk profile and is in accordance with the investment strategy of the Scheme. The Scheme may also invest a certain portion of its corpus in domestic money market securities and/or money market/liquid schemes of domestic mutual funds including that of ICICI Prudential Mutual Fund, in order to meet liquidity requirements from time to time. However, there can be no assurance that the investment objective of the Scheme will be realized.
ICICI Prudential Thematic Advantage Fund (FOF)
The primary objective of the Scheme is to generate capital appreciation primarily from a portfolio of Sectoral/Thematic schemes accessed through the diversified investment styles of underlying schemes.However, there can be no assurance or guarantee that the investment objective of the Scheme would be achieved.
ICICI Prudential BHARAT 22 FOF
ICICI Prudential BHARAT 22 FOF (the Scheme) is a fund of funds scheme with the primary objective to generate returns by investing in units of BHARAT 22 ETF. However, there can be no assurance or guarantee that the investment objective of the Scheme would be achieved.
ICICI Prudential Global Advantage Fund (FOF)
ICICI Prudential Global Advantage Fund (the scheme) is a Fund of Funds scheme with the primary objective to generate returns by investing in units of one or more mutual fund schemes / ETFs (manage by ICICI Prudential MutualFund or any other Mutual Fund(s)) which predominantly invest in international markets.Certain corpus of the scheme will also be invest in units of domestic mutual fund schemes / ETFs manage by ICICI Prudential Mutual Fund or any other Mutual Fund(s) However, there can be no assurance or guarantee that theinvestment objective of the Scheme would be achieved.
ICICI Prudential India Equity FOF
The primary objective of the Scheme is to generate returns from predominantly investing in one or more mutual fund schemes /ETFs (managed by ICICI Prudential Mutual Fund or any other Mutual Fund (s)) which invest in equity and equity related securities.However, there can be no assurance or guarantee that the investment objective of the scheme would be achieved.
ICICI Prudential Nifty Low Vol 30 ETF FOF
ICICI Prudential Nifty Low Vol 30 ETF FOF (the Scheme) is a Fund of Funds scheme with the primary objective to generate returns by investing in units of ICICI Prudential Nifty Low Vol 30 ETF. There can be no assurance or guarantee that the investment objectives of the Scheme would be achieved.
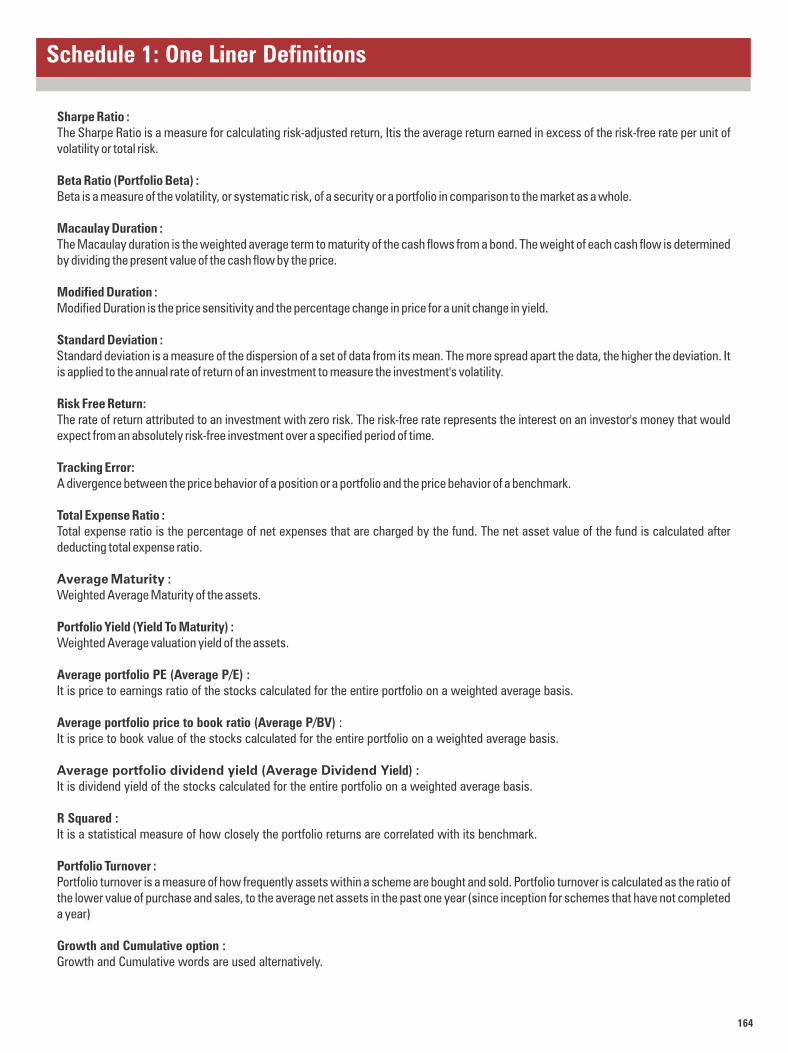
164
Sharpe Ratio :The Sharpe Ratio is a measure for calculating risk-adjusted return, Itis the average return earned in excess of the risk-free rate per unit of volatility or total risk.
Beta Ratio (Portfolio Beta) :Beta is a measure of the volatility, or systematic risk, of a security or a portfolio in comparison to the market as a whole.
Macaulay Duration :The Macaulay duration is the weighted average term to maturity of the cash flows from a bond. The weight of each cash flow is determined by dividing the present value of the cash flow by the price.
Modified Duration :Modified Duration is the price sensitivity and the percentage change in price for a unit change in yield.
Standard Deviation :Standard deviation is a measure of the dispersion of a set of data from its mean. The more spread apart the data, the higher the deviation. It is applied to the annual rate of return of an investment to measure the investment's volatility.
Risk Free Return:The rate of return attributed to an investment with zero risk. The risk-free rate represents the interest on an investor's money that would expect from an absolutely risk-free investment over a specified period of time.
Tracking Error:A divergence between the price behavior of a position or a portfolio and the price behavior of a benchmark.
Total Expense Ratio : Total expense ratio is the percentage of net expenses that are charged by the fund. The net asset value of the fund is calculated after deducting total expense ratio.
Average Maturity : Weighted Average Maturity of the assets.
Portfolio Yield (Yield To Maturity) : Weighted Average valuation yield of the assets.
Average portfolio PE (Average P/E) :It is price to earnings ratio of the stocks calculated for the entire portfolio on a weighted average basis.
Average portfolio price to book ratio (Average P/BV) : It is price to book value of the stocks calculated for the entire portfolio on a weighted average basis.
Average portfolio dividend yield (Average Dividend Yield) :It is dividend yield of the stocks calculated for the entire portfolio on a weighted average basis.
R Squared : It is a statistical measure of how closely the portfolio returns are correlated with its benchmark.
Portfolio Turnover :Portfolio turnover is a measure of how frequently assets within a scheme are bought and sold. Portfolio turnover is calculated as the ratio of the lower value of purchase and sales, to the average net assets in the past one year (since inception for schemes that have not completed a year)
Growth and Cumulative option :Growth and Cumulative words are used alternatively.
Schedule 1: One Liner Definitions

165
Fund Manager :An employee of the asset management company such as a mutual fund or life insurer, who manages investments of the scheme. He is usually part of a larger team of fund managers and research analysts.
Application Amount for Fresh Subscription :This is the minimum investment amount for a new investor in a mutual fund scheme.
Minimum Additional Amount :This is the minimum investment amount for an existing investor in a mutual fund scheme.
Yield to Maturity :The Yield to Maturity or the YTM is the rate of return anticipated on a bond if held until maturity. YTM is expressed as an annual rate. The YTM factors in the bond's current market price, par value, coupon interest rate and time to maturity.
SIP :SIP or systematic investment plan works on the principle of making periodic investments of a fixed sum. It works similar to a recurring bank deposit. For instance, an investor may opt for an SIP that invests Rs 500 every 15th of the month in an equity fund for a period of three years.
NAV :The NAV or the net asset value is the total asset value per unit of the mutual fund after deducting all related and permissible expenses. The NAV is calculated at the end of every business day. It is the value at which the investor enters or exits the mutual fund.
Benchmark :A group of securities, usually a market index, whose performance is used as a standard or benchmark to measure investment performance of mutual funds, among other investments. Some typical benchmarks include the Nifty, Sensex, BSE200, BSE500, 10-Year Gsec.
Entry Load :A mutual fund may have a sales charge or load at the time of entry and/or exit to compensate the distributor/agent. Entry load is charged at the time an investor purchases the units of a mutual fund. The entry load is added to the prevailing NAV at the time of investment. For instance, if the NAV is Rs. 100 and the entry load is 1 %, the investor will enter the fund at Rs. 101. Note: SEBI, vide circular dated June 30, 2009 has abolished entry load and mandated that the upfront commission to distributors will be paid by the investor directly to the distributor, based on his assessment of various factors including the service rendered by the distributor.
Exit Load :Exit load is charged at the time an investor redeems the units of a mutual fund. The exit load is reduced from the prevailing NAV at the time of redemption. The investor will receive redemption proceed at net value of NAV less Exit Load. For instance if the NAV is Rs.100and the exit load is 1%, the investor will receive Rs.99
Macaulay Duration :The Macaulay duration is the weighted average term to maturity of the cash flows from a bond. The weight of each cash flow is determined by dividing the present value of the cash flow by the price.
Standard Deviation :Standard deviation is a statistical measure of the range of an investment's performance. When a mutual fund has a high standard deviation, its means its range of performance is wide, implying greater volatility.
Sharpe Ratio :The Sharpe Ratio, named after its founder, the Nobel Laureate William Sharpe, is a measure of risk-adjusted returns. It is calculated using standard deviation and excess return to determine reward per unit of risk.
Beta Ratio (Portfolio Beta) :Beta is a measure of an investment's volatility vis-a-vis the market. Beta of less than 1 means that the security will be less volatile than the market. A beta of greater than 1 implies that the security's price will be more volatile than the market.
Schedule 2: How To Read Factsheet
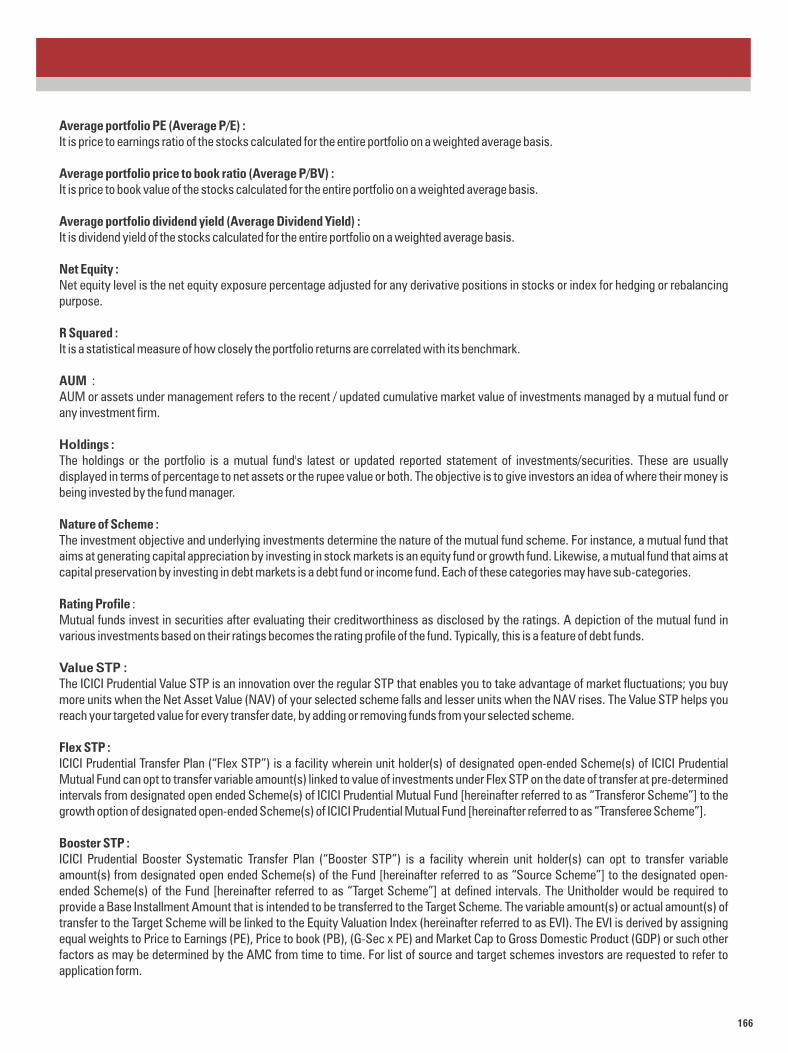
166
Average portfolio PE (Average P/E) :It is price to earnings ratio of the stocks calculated for the entire portfolio on a weighted average basis.
Average portfolio price to book ratio (Average P/BV) : It is price to book value of the stocks calculated for the entire portfolio on a weighted average basis.
Average portfolio dividend yield (Average Dividend Yield) :It is dividend yield of the stocks calculated for the entire portfolio on a weighted average basis.
Net Equity : Net equity level is the net equity exposure percentage adjusted for any derivative positions in stocks or index for hedging or rebalancing purpose.
R Squared : It is a statistical measure of how closely the portfolio returns are correlated with its benchmark.
AUM :AUM or assets under management refers to the recent / updated cumulative market value of investments managed by a mutual fund or any investment firm.
Holdings :The holdings or the portfolio is a mutual fund's latest or updated reported statement of investments/securities. These are usually displayed in terms of percentage to net assets or the rupee value or both. The objective is to give investors an idea of where their money is being invested by the fund manager.
Nature of Scheme :The investment objective and underlying investments determine the nature of the mutual fund scheme. For instance, a mutual fund that aims at generating capital appreciation by investing in stock markets is an equity fund or growth fund. Likewise, a mutual fund that aims at capital preservation by investing in debt markets is a debt fund or income fund. Each of these categories may have sub-categories.
Rating Profile :Mutual funds invest in securities after evaluating their creditworthiness as disclosed by the ratings. A depiction of the mutual fund in various investments based on their ratings becomes the rating profile of the fund. Typically, this is a feature of debt funds.
Value STP : The ICICI Prudential Value STP is an innovation over the regular STP that enables you to take advantage of market fluctuations; you buy more units when the Net Asset Value (NAV) of your selected scheme falls and lesser units when the NAV rises. The Value STP helps you reach your targeted value for every transfer date, by adding or removing funds from your selected scheme.
Flex STP :ICICI Prudential Transfer Plan (“Flex STP”) is a facility wherein unit holder(s) of designated open-ended Scheme(s) of ICICI Prudential Mutual Fund can opt to transfer variable amount(s) linked to value of investments under Flex STP on the date of transfer at pre-determined intervals from designated open ended Scheme(s) of ICICI Prudential Mutual Fund [hereinafter referred to as “Transferor Scheme”] to the growth option of designated open-ended Scheme(s) of ICICI Prudential Mutual Fund [hereinafter referred to as “Transferee Scheme”].
Booster STP :ICICI Prudential Booster Systematic Transfer Plan (“Booster STP”) is a facility wherein unit holder(s) can opt to transfer variable amount(s) from designated open ended Scheme(s) of the Fund [hereinafter referred to as “Source Scheme”] to the designated open-ended Scheme(s) of the Fund [hereinafter referred to as “Target Scheme”] at defined intervals. The Unitholder would be required to provide a Base Installment Amount that is intended to be transferred to the Target Scheme. The variable amount(s) or actual amount(s) of transfer to the Target Scheme will be linked to the Equity Valuation Index (hereinafter referred to as EVI). The EVI is derived by assigning equal weights to Price to Earnings (PE), Price to book (PB), (G-Sec x PE) and Market Cap to Gross Domestic Product (GDP) or such other factors as may be determined by the AMC from time to time. For list of source and target schemes investors are requested to refer to application form.
167
Source Schemes: ICICI Prudential All Seasons Bond Fund, ICICI Prudential Banking & PSU Debt Fund, ICICI Prudential Bond Fund, ICICI Prudential Constant Maturity Gilt Fund, ICICI Prudential Corporate Bond Fund, ICICI Prudential Credit Risk Fund, ICICI Prudential Floating Interest Fund, ICICI Prudential Gilt Fund, ICICI Prudential Liquid Fund, ICICI Prudential Long Term Bond Fund, ICICI Prudential Medium Term Bond Fund, ICICI Prudential Money Market Fund, ICICI Prudential Overnight Fund, ICICI Prudential Savings Fund, ICICI Prudential Short Term Fund, ICICI Prudential Ultra Short Term Fund, ICICI Prudential Equity - Arbitrage Fund, ICICI Prudential Equity Savings Fund, ICICI Prudential Regular Savings Fund, ICICI Prudential Debt Management Fund (FOF) .
Target Schemes: ICICI Prudential Balanced Advantage Fund, ICICI Prudential Equity & Debt Fund, ICICI Prudential Multi-Asset Fund, ICICI Prudential Asset Allocator Fund (FOF), ICICI Prudential Banking and Financial Services Fund, ICICI Prudential Bharat Consumption Fund, ICICI Prudential Bluechip Fund, ICICI Prudential Business Cycle Fund, ICICI Prudential Commodities Fund, ICICI Prudential Dividend Yield Equity Fund, ICICI Prudential ESG Fund, ICICI Prudential Exports and Services Fund, ICICI Prudential FMCG, ICICI Prudential Focused Equity Fund, ICICI Prudential India Opportunities Fund, ICICI Prudential Infrastructure Fund, ICICI Prudential Large & Mid Cap Fund, ICICI Prudential Long Term Equity Fund (Tax Saving), ICICI Prudential Manufacture in India Fund, ICICI Prudential MidCap Fund, ICICI Prudential MNC Fund, ICICI Prudential Multicap Fund, ICICI Prudential Pharma Healthcare and Diagnostics (P.H.D.) Fund, ICICI Prudential Quant Fund, ICICI Prudential Smallcap Fund, ICICI Prudential Technology Fund, ICICI Prudential Value Discovery Fund, ICICI Prudential Thematic Advantage Fund (FOF), ICICI Prudential Passive Strategy Fund (FOF), ICICI Prudential India Equity Fund (FOF), ICICI Prudential BHARAT 22 FOF, ICICI Prudential Nifty Low Vol 30 ETF FOF, ICICI Prudential Nifty Index Fund, ICICI Prudential Nifty Next 50 Index Fund, ICICI Prudential Sensex Index Fund.
Freedom SWP :ICICI Prudential Freedom SWP enables investors to withdraw the investment corpus in systematic and timely manner. Investors can choose the Top Up % for withdrawals to meet their recurring and future expenses.
Freedom SIP :ICICI Prudential Freedom SIP is an optional feature that allows initial investments through SIP, switch to another scheme after a pre-defined tenure and SWP post that.
*Note : IDCW = Income Distribution cum capital withdrawal option. IDCW Payout = Payout of Income Distribution cum capital withdrawal option. IDCW Reinvestment = Reinvestment of Income Distribution cum capital withdrawal option. IDCW Transfer = Transferof Income Distribution cum capital withdrawal Plan.
Investors are requested to note that nomenclature of 'Dividend' and has been changed to 'IDCW' pursuant to SEBI circular effective from April 01, 2021.
168
ICICI Prudential Mutual Fund Corporate Office
ONE BKC, A - Wing, 13th Floor, Bandra-Kurla Complex, Mumbai 400 051, India.
Tel: 022 - 26525000 Fax: 022 - 26528100, website: www.icicipruamc.com, email id: [email protected]
Statutory Details & Risk Factors
Mutual Fund investments are subject to market risks, read all scheme related documents carefully.
Disclaimer: In the preparation of the material contained in this document, the Asset Management Company (AMC) has used information that is publicly available, including information developed in-house. Some of the material used in the document may have been obtained from members/persons other than the AMC and/or its affiliates and which may have been made available to the AMC and/or to its affiliates. Information gathered and material used in this document is believed to be from reliable sources. The AMC however does not warrant the accuracy, reasonableness and / or completeness of any information. We have included statements / opinions / recommendations in this document, which contain words, or phrases such as “will”, “expect”, “should”, “believe” and similar expressions or variations of such expressions that are “forward looking statements”. Actual results may differ materially from those suggested by the forward looking statements due to risk or uncertainties associated with our expectations with respect to, but not limited to, exposure to market risks, general economic and political conditions in India and other countries globally, which have an impact on our services and / or investments, the monetary and interest policies of India, inflation, deflation, unanticipated turbulence in interest rates, foreign exchange rates, equity prices or other rates or prices etc.
The AMC (including its affiliates), the Mutual Fund, the trust and any of its officers, directors, personnel and employees, shall not be liable for any loss, damage of any nature, including but not limited to direct, indirect, punitive, special, exemplary, consequential, as also any loss of profit in any way arising from the use of this material in any manner. The recipient alone shall be fully responsible/are liable for any decision taken on this material.
Please note that the Risk-o-meter(s) specified above will be evaluated and updated on a monthly basis as per SEBI circular dated October 05, 2020 on Product Labeling in Mutual Fund schemes - Risk-o-meter. Please refer to https://www.icicipruamc.com/news-and-updates/all-newsfor more details.
$$$ - Yield to Maturity for Schemes holding Additional Tier 1 Bonds and Tier 2 Bonds issued by Banks is computed based on Yield used for valuation for such Securities.

169