6th University of Kansas International Conference on XBRL Transparency, Assurance, and Analysis...
55
6th University of Kansas International Conference on XBRL Transparency, Assurance, and Analysis April 26, 2013 J. Louis Matherne Chief of Taxonomy Development [email protected]
-
Upload
dominick-walton -
Category
Documents
-
view
214 -
download
0
Transcript of 6th University of Kansas International Conference on XBRL Transparency, Assurance, and Analysis...

6th University of Kansas International Conference on XBRL
Transparency, Assurance, and Analysis
April 26, 2013
J. Louis MatherneChief of Taxonomy [email protected]
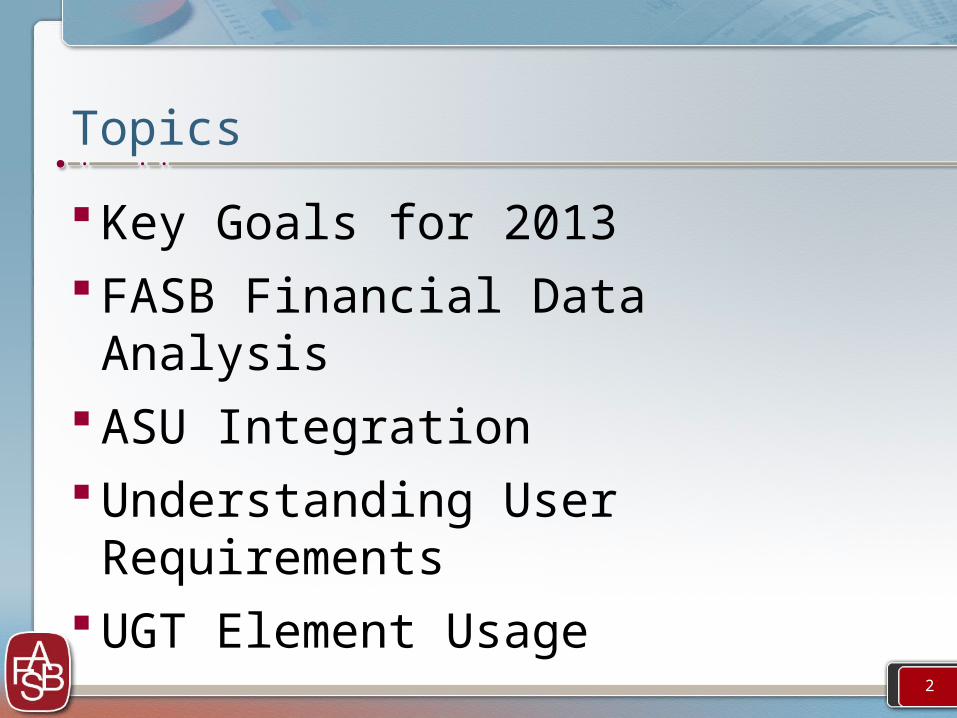
Key Goals for 2013 FASB Financial Data Analysis ASU Integration Understanding User Requirements UGT Element Usage
Topics
2

Concurrent Taxonomy Exposure Drafts (TED)
/Implementation Guides (IG) with Accounting Standards
Updates Exposure Drafts
Help drive improvements in data quality
Promote a stable taxonomy
XBRL Implementation Guides
Increase input from data aggregators / users
Establish banking / financial services industry group
Support change management for all constituents
Key Goals for 2013
3

FASB Financial Data Analysis
4
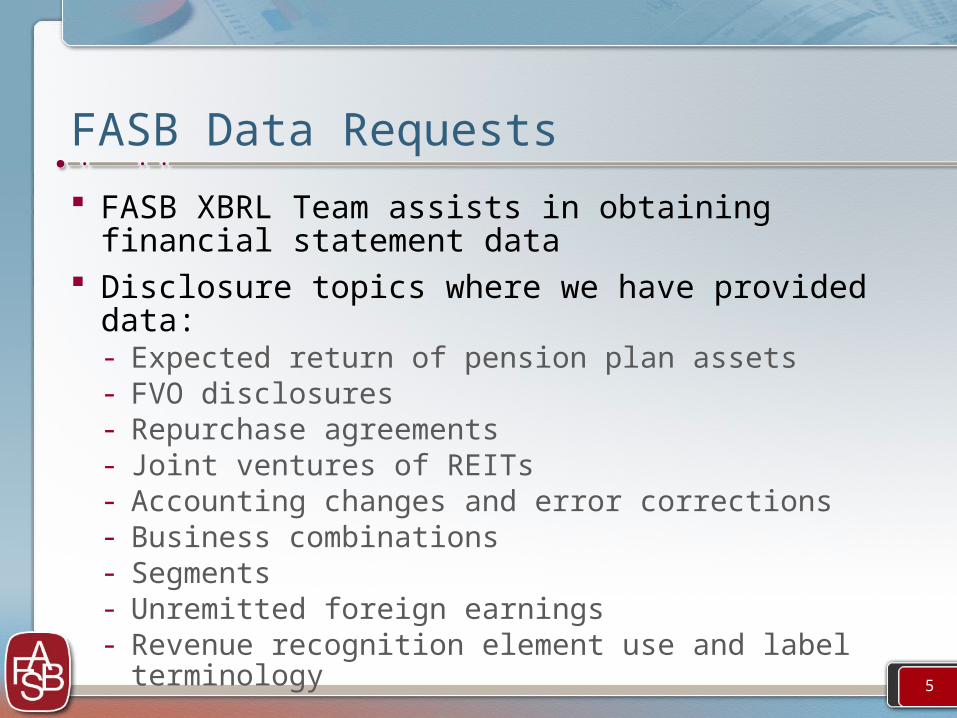
FASB XBRL Team assists in obtaining financial statement data
Disclosure topics where we have provided data:- Expected return of pension plan assets- FVO disclosures- Repurchase agreements- Joint ventures of REITs- Accounting changes and error corrections- Business combinations- Segments- Unremitted foreign earnings- Revenue recognition element use and label terminology
FASB Data Requests
5

Query: Identify trend in expected return on plan assets
Can this be obtained through XBRL data?
XBRL DataExample 3 – FASB Data Request
6

XBRL DataExample 3 – FASB Data Request
Key: Element Name
7

XBRL DataExample 3 – FASB Data RequestRun query
8

XBRL DataExample 3 – FASB Data Request
Results Exported to Excel
9

XBRL DataExample 3 – FASB Data Request
2008 2009 2010 2011 2012Average 7.74% 7.49% 7.34% 7.08% 7.23%
Median 8.00% 8.00% 7.75% 7.50% 7.50%
Mode 8.00% 8.00% 8.00% 8.00% 7.50%
Max 12.30% 12.30% 15.00% 14.25% 9.20%
Min 2.50% 1.40% 0.40% 0.24% 3.00%
Count 379 1126 1309 1288 57
Results - Table
10

ASU Integration
11

12
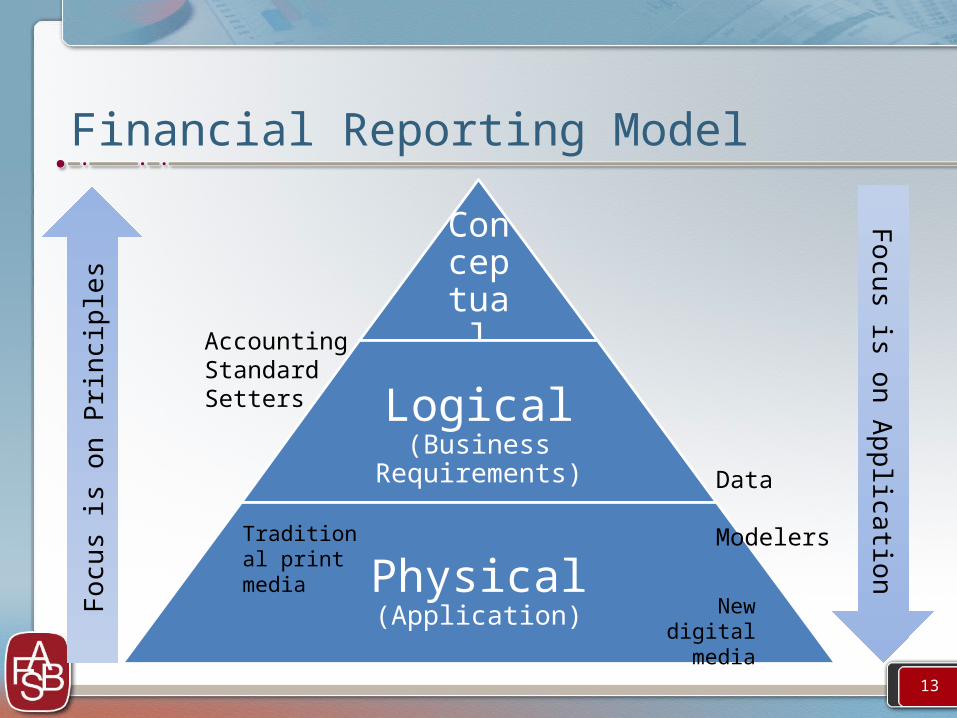
Financial Reporting Model
Conceptual(Principles)
Logical(Business Requirements)
Physical(Application)
Accounting Standard Setters
Data Modelers
Fo
cus
is o
n P
rin
cipl
es
Fo
cus is o
n A
pplica
tionTraditional
print media
New digital media
13

On FASB AgendaDeliberate
BallotExposureDraft Deliberate Ballot Final
WatchEngage
ModelDisclosure
Expose Taxonomy Fragment
Revise Revise Final
Accounting Standards Update (ASU) Exposure Process
• Create example disclosure with ASU Project Team
• Create elements & modeling
• Create instance document
• Expose TED concurrent with ASU ED
• Revise based on public feedback and Board deliberations
• Release in base taxonomy as complete
Steps
Taxonomy Exposure Draft (TED) Process
Taxonomy Exposure Draft Process
14

XBRL team member assigned to project team based on topic area
Participation/presence at Board discussions Links on website between exposure documents
and XBRL ASU Taxonomy change page Benefits of earlier integration in the process
Inform standard setting process Conceptually align approach Consider implications of data model Assist with research
Accounting Standards Updates
15

Recent Projects Reclassifications from AOCI
- Discussions with project team influenced modeling - users wanted effect of reclassification adjustments on Income Statement line items
- XBRL Team prepared memo to Board on impact to UGT of presentation considerations
- Participated in Board meeting to discuss memo
- Follow up with Board member individually for further discussion
- Resulted in ASU containing XBRL team recommendation (parenthetical requirement)
Repurchase Agreements- Discussions with project team on differences in definition of
repurchase agreements between ASUs (Balance Sheet Offsetting and Repurchase Agreements)
- Identified need for additional element to reconcile 16

Recent Projects Revenue Recognition
- Discussions with project team regarding impact to UGT of changes to presentation and disclosure requirements from original ED
- Identified area in which XBRL data could assist project team with research
- Clarified intent regarding contract assets/liabilities resulting in potential less impact to UGT
Discontinued Operations- Discussions with project team on appearance of redundancy in
disclosure requirements, inconsistency in implementation guidance and reversion of definition
- Result is clarification of disclosure, removal of inconsistencies in exposure draft and update of NTS for change in definition
17
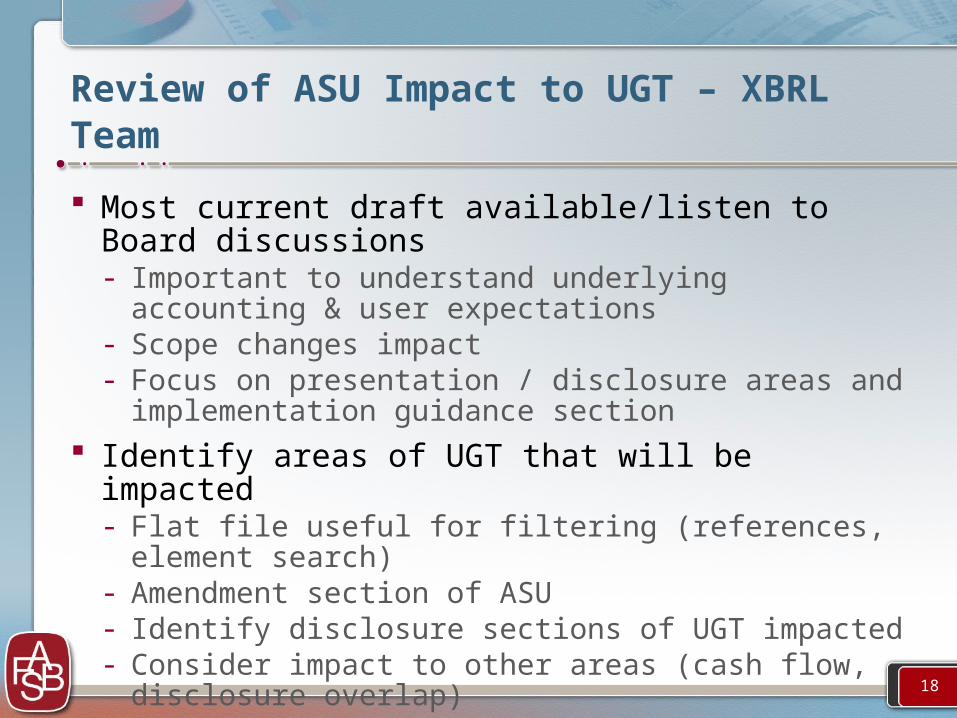
Review of ASU Impact to UGT – XBRL Team
Most current draft available/listen to Board discussions- Important to understand underlying accounting & user
expectations- Scope changes impact- Focus on presentation / disclosure areas and
implementation guidance section
Identify areas of UGT that will be impacted- Flat file useful for filtering (references, element search)- Amendment section of ASU- Identify disclosure sections of UGT impacted- Consider impact to other areas (cash flow, disclosure
overlap)
18
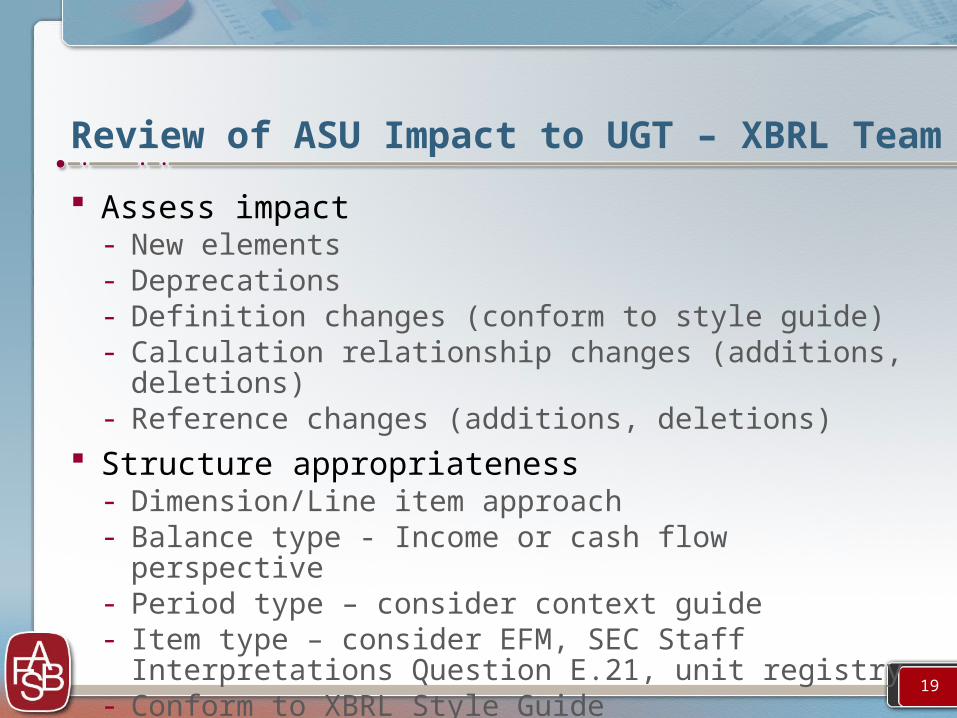
Review of ASU Impact to UGT – XBRL Team
Assess impact- New elements- Deprecations- Definition changes (conform to style guide)- Calculation relationship changes (additions, deletions)- Reference changes (additions, deletions)
Structure appropriateness- Dimension/Line item approach- Balance type - Income or cash flow perspective- Period type – consider context guide- Item type – consider EFM, SEC Staff Interpretations
Question E.21, unit registry- Conform to XBRL Style Guide
19
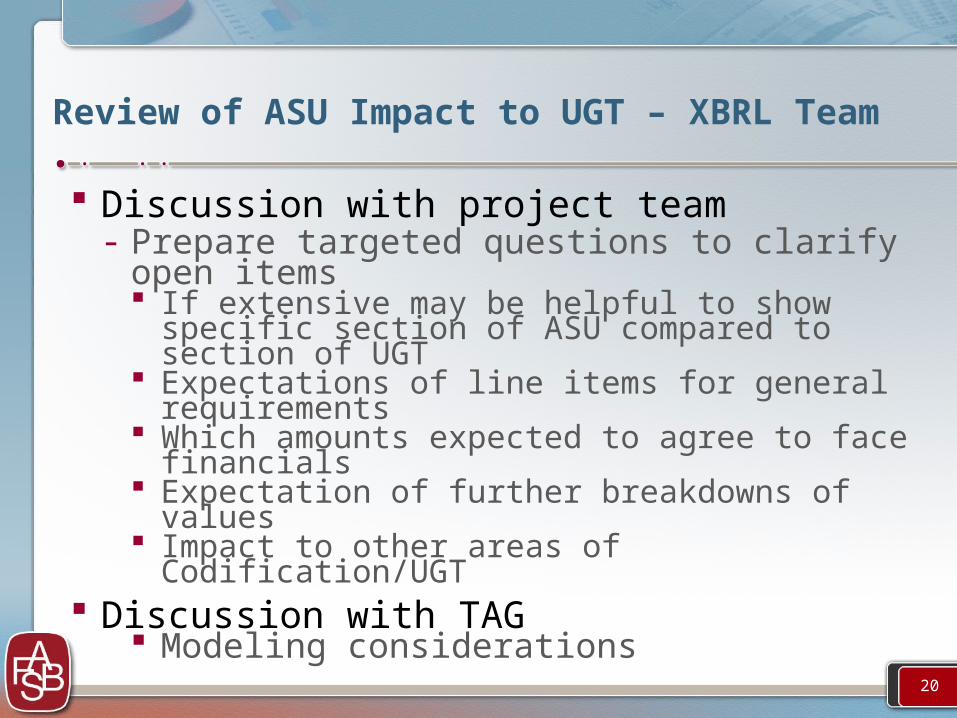
Review of ASU Impact to UGT – XBRL Team
Discussion with project team- Prepare targeted questions to clarify open items
If extensive may be helpful to show specific section of ASU compared to section of UGT
Expectations of line items for general requirements Which amounts expected to agree to face financials Expectation of further breakdowns of values Impact to other areas of Codification/UGT
Discussion with TAG Modeling considerations
20

Meeting Data Provider Requirements
21

• Data quality and assurance• Extensions are a concern but can be manageable• Tagged earnings release• Greater coverage of the 10K and 10Q• Reported fact value relationships matter• Much analysis is performed based on topic• How to identify changes from filing to filing and
taxonomy to taxonomy• Prefer tabular information over narrative• Expressed concern that service providers are providing
conflicting guidance• Looking forward to inline XBRL
What we know so far about data provider expectations
22

• Revised, streamlined, and stable calculation hierarchy• Stabilize taxonomy but XBRL taxonomy and instances
will continue to change
Need to focus on better change management from a data provider perspective
FASB – Addressing data provider requirements
23

UGT Element Usage
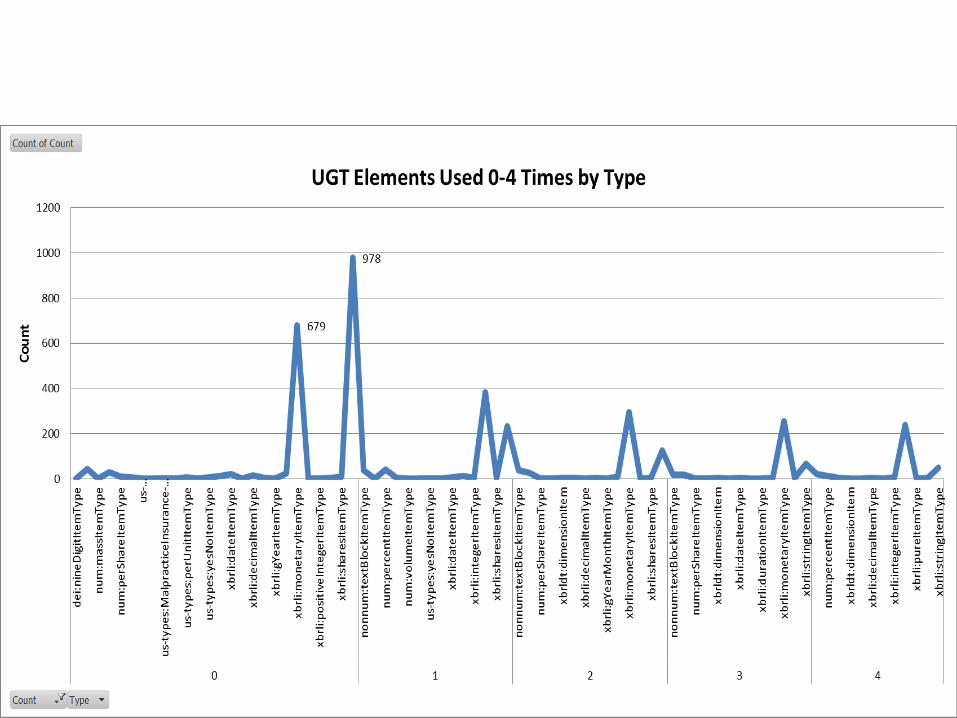
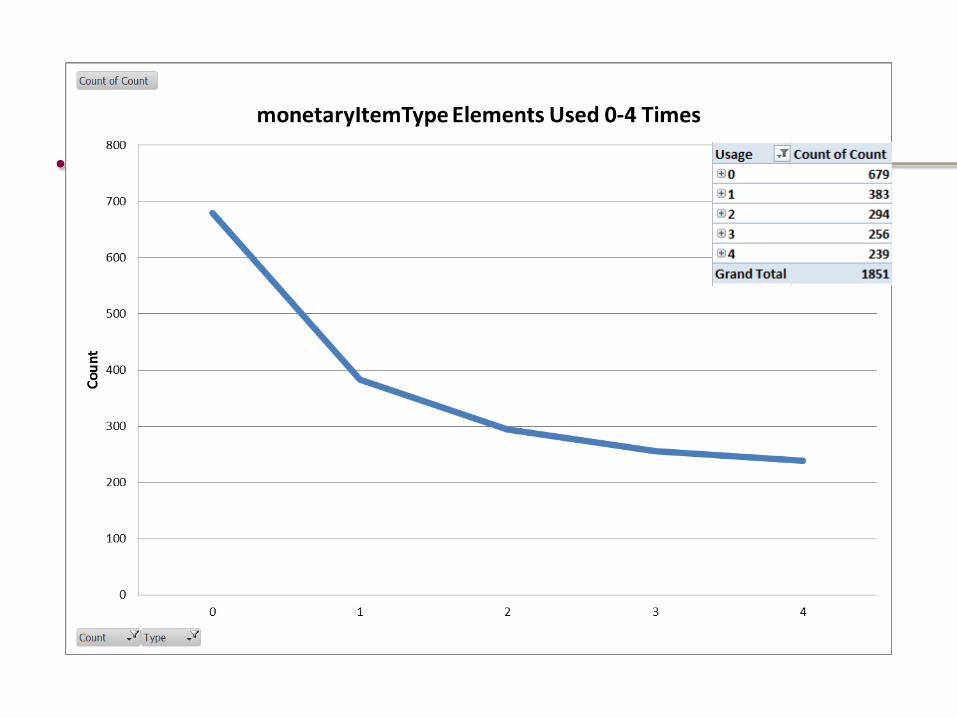
24
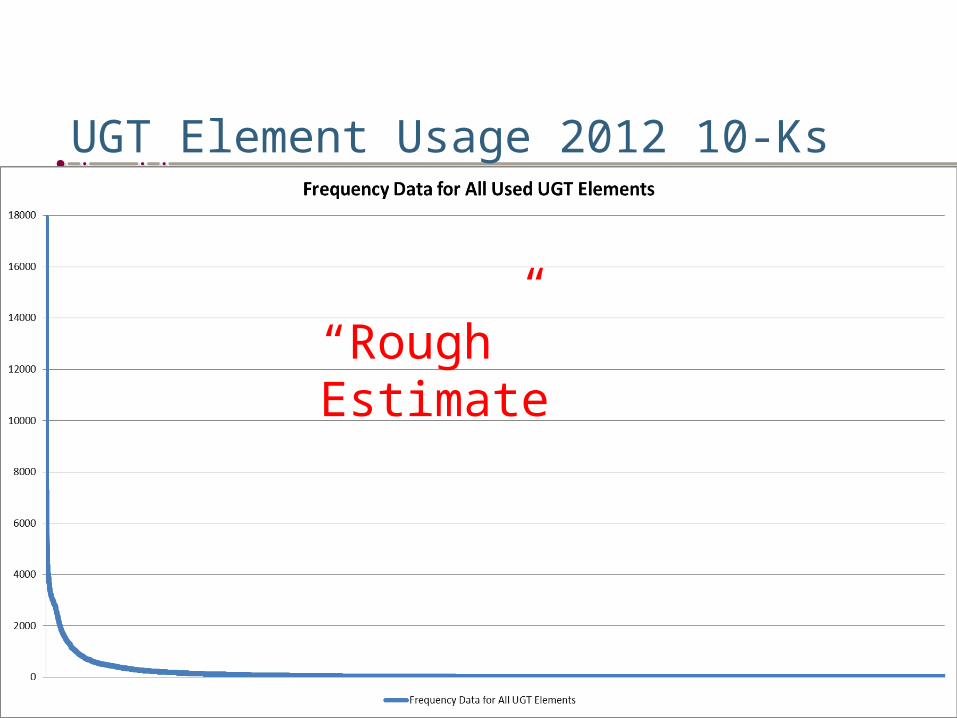
UGT Element Usage 2012 10-Ks
25
“Rough” Estimate
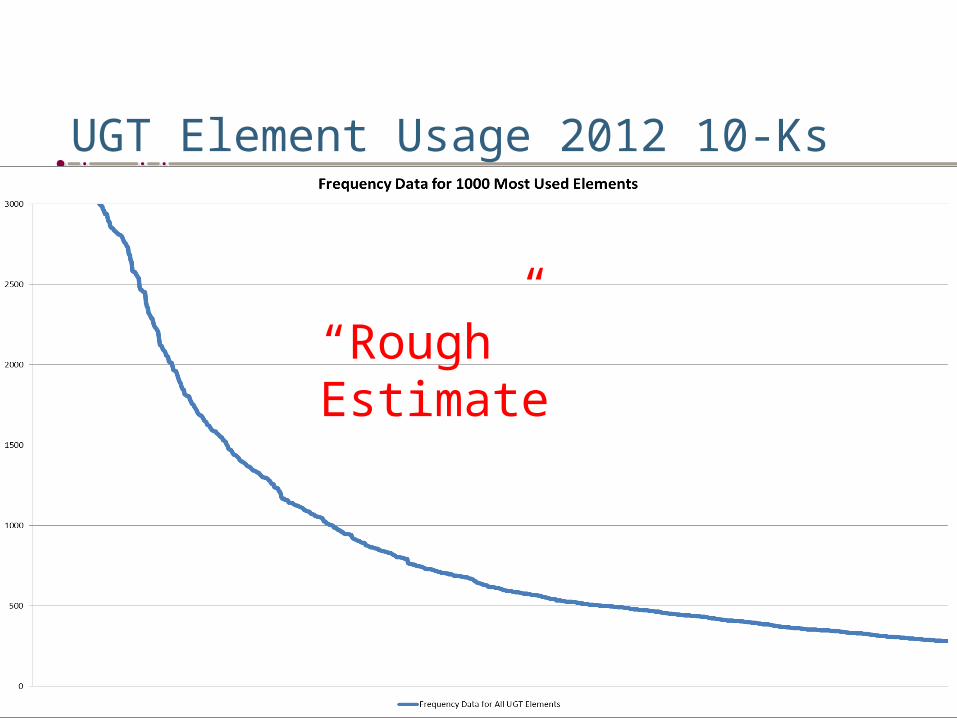
UGT Element Usage 2012 10-Ks
26
“Rough” Estimate

27
28

29
30

31

32
UGT Element UsageAssume All Used Equally
Normalized?

33
UGT Element Usage Target?
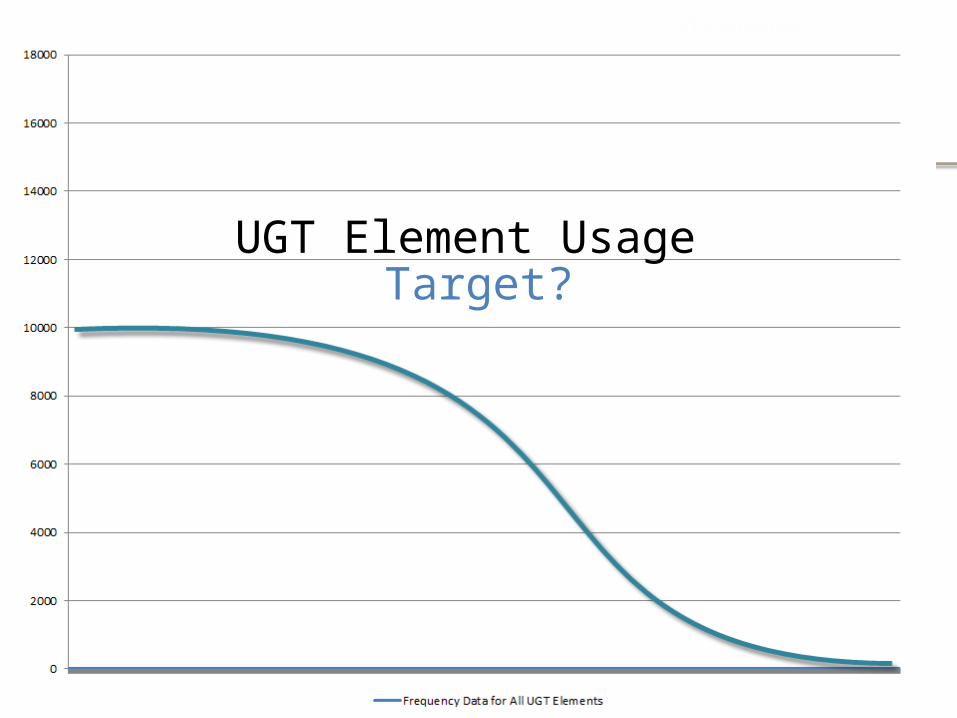
UGT Element Usage – Ideal?
34
UGT Element Usage Target?

Questions
?
35

Bonus Slides
36

Data Modeling in the Standard Setting Process
37

Modeling ASU Presentation and Disclosure Requirements
Shift from modeling based on:- Paper-based financial reports presentations
- COD/ASU descriptions and related implementation
presentations
Shift modeling to:- Consideration of underlying relationships among fact
values
- Contemplation of data consumption
38

Questions we need to ask1. WHAT is the underlying relationships of reported fact values based on common or unique disclosure structures?
2. WHAT is the best way to capture the underlying relationship - through a calculation or dimensional model?
3. WHAT is the most effective way to provide the information to data consumers?
39

The General Principles Behind Our “Data Modeling” Approach
General Principles: Recognize Primary Domain - Primary Line Items
For example, Balance Sheet items, or “Revenue” etc.
Identify Secondary Attributes or Disaggregation – Dimension Each disclosure is a further description of face statement fact value attributes
40

Connect Financial Reports Analysis with Data Modeling
Other Considerations: Same Facts Should be Modeled in the Same Way
Users’ Perspective/Business Objective- Example Reclassification from AOCI ASU
The Board received requests from financial statement users looking for the effect of reclassification adjustments on INCOME STATEMENT LINE ITEMS; AOCI and reclassification components are two fact value attributes of the primary domain and are modeled as dimensions.
41

7 “What” Questions We Should Ask During the Data Modeling Process
WHAT statutory requirements does the model need to capture?
WHAT common practice requirements does the model need to capture based on traditional paper-based financial reports? *
WHAT is the underlying relationships of reported fact values based on common or unique disclosure structures?
WHAT is the best way to capture the underlying relationship - through a calculation or dimensional model?
WHAT is the most effective way to provide data users the information?
WHAT is the common, flexible data model - “the template”?
WHAT taxonomy structural requirements (EFM, style guide, etc.) does the template need to meet?
* Subject to circumstance where no actual financial reports available
42
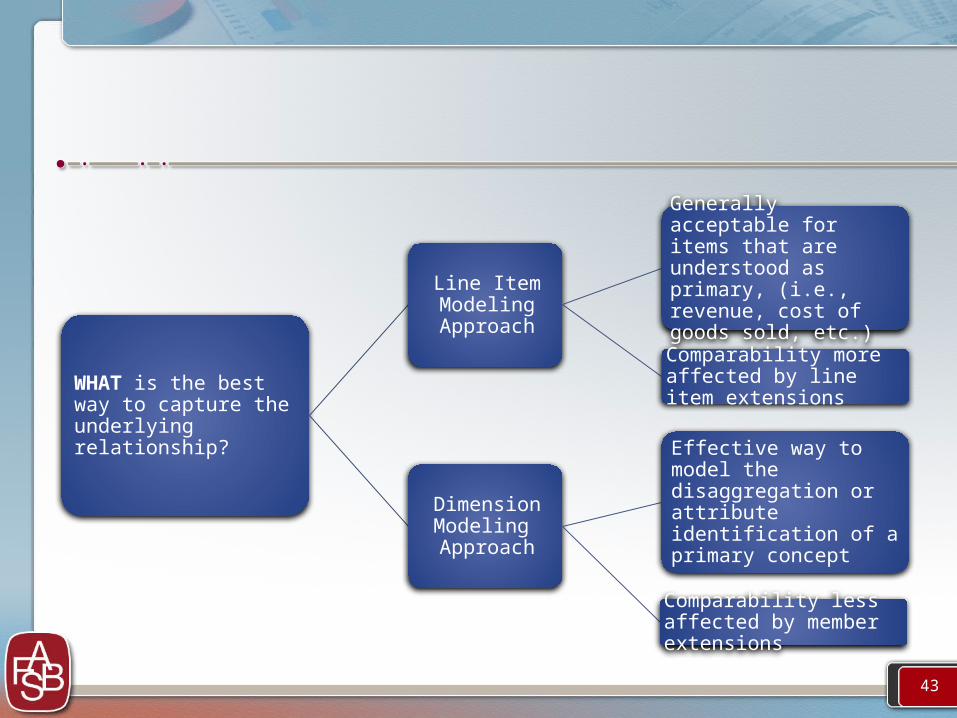
WHAT is the best way to capture the underlying relationship?
Line Item Modeling Approach
Generally acceptable for items that are understood as primary, (i.e., revenue, cost of goods sold, etc.)
Comparability more affected by line item extensions
Dimension Modeling Approach
Effective way to model the disaggregation or attribute identification of a primary concept
Comparability less affected by member extensions
43

WHAT is the most effective way to provide data users the information?
Calculation Relationship
All fact value attributes will be contained within the line item as one concept.
All of the line items available would have to be known that relate to this information and then searched for within the data to see if it exists.
Dimensional Relationship
Allows the data to be “sliced and diced” as needed by the users of the information.
Depending on what the users of the information are looking for, they can extract the attributes that are important to them.
44

Organize the Disclosures in the “Template”
45
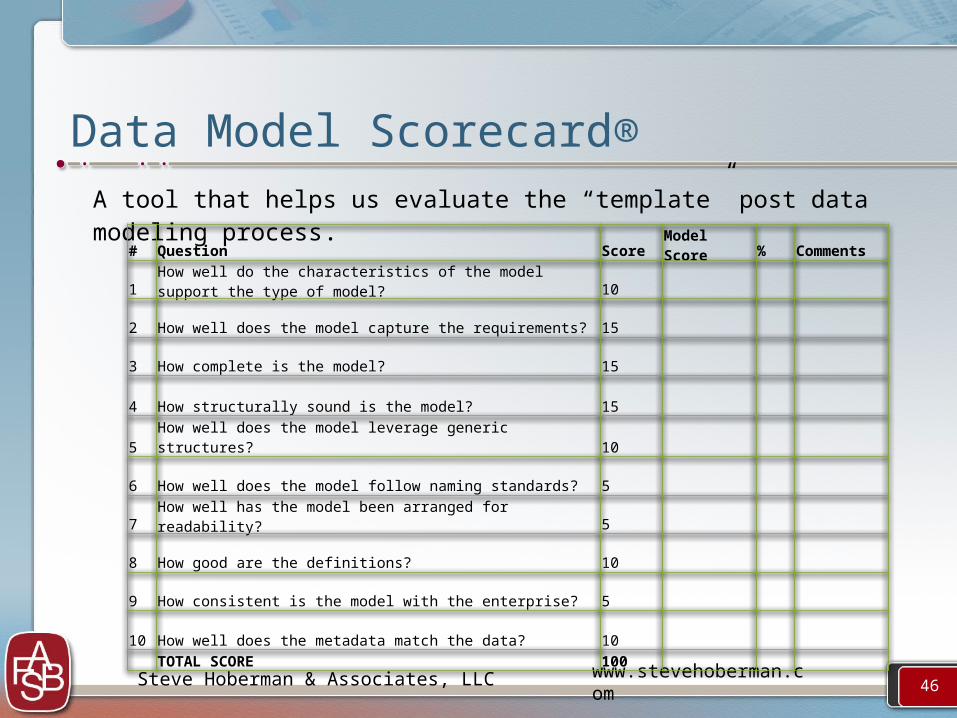
Data Model Scorecard® A tool that helps us evaluate the “template” post data modeling process.
Steve Hoberman & Associates, LLC www.stevehoberman.com
# Question ScoreModel Score % Comments
1How well do the characteristics of the model support the type of model? 10
2 How well does the model capture the requirements? 15
3 How complete is the model? 15
4 How structurally sound is the model? 15
5 How well does the model leverage generic structures? 10
6 How well does the model follow naming standards? 5
7 How well has the model been arranged for readability? 5
8 How good are the definitions? 10
9 How consistent is the model with the enterprise? 5
10 How well does the metadata match the data? 10 TOTAL SCORE 100
46

Example – Other Comprehensive Income
47
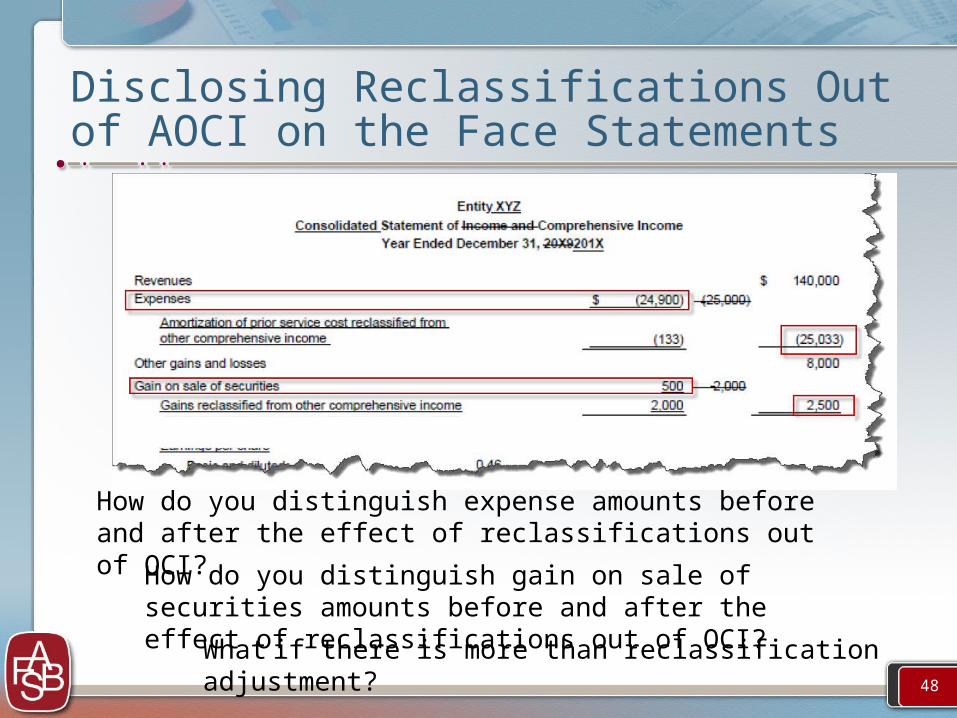
Disclosing Reclassifications Out of AOCI on the Face Statements
How do you distinguish expense amounts before and after the effect of reclassifications out of OCI?
How do you distinguish gain on sale of securities amounts before and after the effect of reclassifications out of OCI?
What if there is more than reclassification adjustment?48
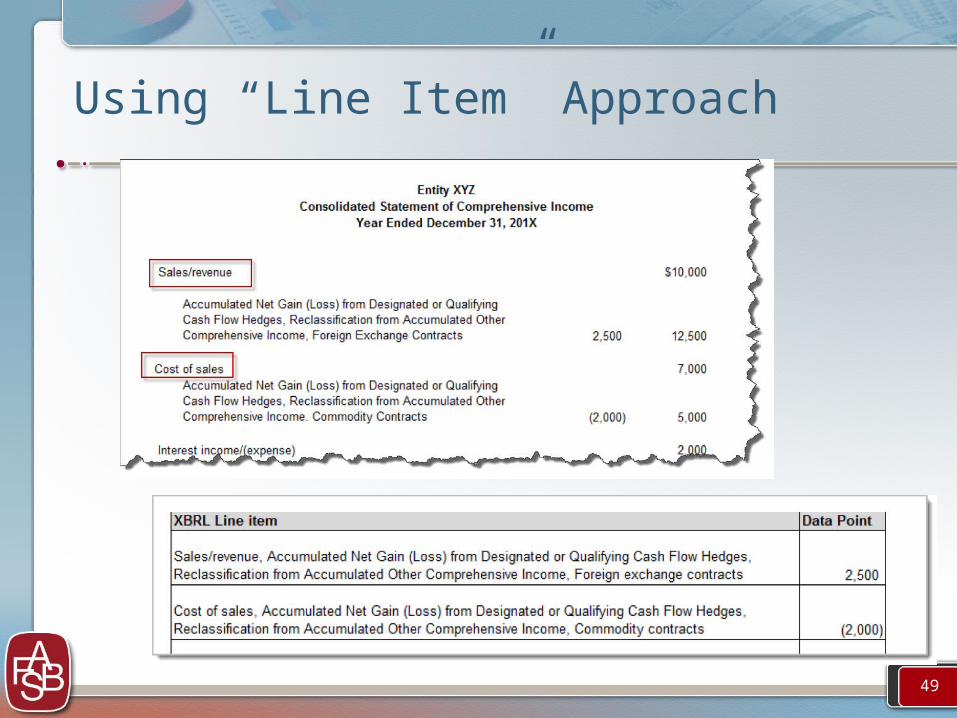
Using “Line Item” Approach
49
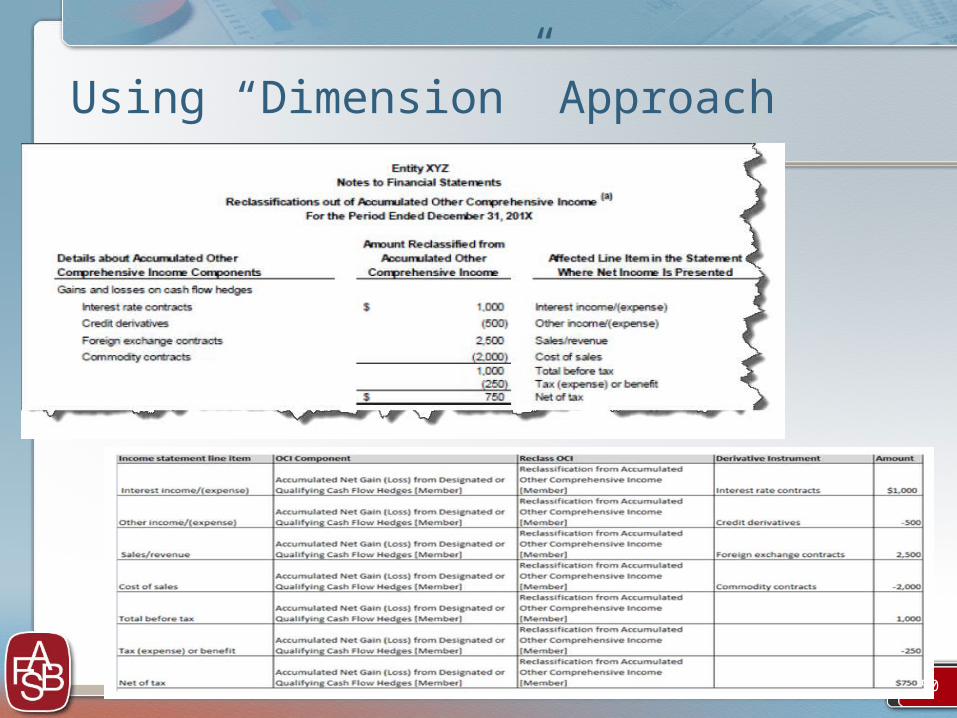
Using “Dimension” Approach
50

OCI - Template
New AxisNew Member
Accumulated Net Unrealized Investment Gain (Loss) [Member]
Accumulated Defined Benefit Plans Adjustment [Member]
Interest Rate Contract [Member]
Credit Risk Contract [Member]
Foreign Exchange Contract [Member]
Commodity Contract [Member]
Gains and losses on cash flow hedgesInterest and Dividend Income, Operating 1,000Interest Expense, Other (500)
Revenues 2,500Cost of Goods Sold (2,000)
Unrealized gains and losses on available-for-sale securities
2,300
(285)Interest Expense, Other (15)
Amortization of defined benefit pension items
(2,000)
(2,500)
(1,500)
1,000 2,000 (6,000)
(250) (500) 1,500
750 1,500 (4,500) (2,250)
For the Period Ended December 31, 201XReclassifications out of Accumulated Other Comprehensive Income(a)
Notes to Financial StatementsEntity XYZ
Income (Loss), Including Portion Attributable to Noncontrolling Interest
Reclassification from Accumulated Other Comprehensive Income [Axis]
Income Tax Expense (Benefit), Continuing Operations, Discontinued Operations, Extraordinary ItemsNet Income (Loss), Including Portion Attributable to Noncontrolling Interest
Equity Components [Axis]
Accumulated Net Gain (Loss) from Designated or Qualifying Cash Flow Hedges [Member]
Reclassification from Accumulated Other Comprehensive Income [Member]
Derivative Instrument Risk [Axis]
OCI, Reclassification, Pension and Other Postretirement Benefit Plans, Net Gain (Loss) Recognized in Net Periodic Benefit Cost, before TaxOCI, Reclassification, Pension and Other Postretirement Benefit Plans, Net Transition Asset (Obligation), Recognized in Net Periodic Benefit Cost, before TaxOCI, Amortization, Pension and Other Postretirement Benefit Plans, Net Prior Service Cost (Credit) Recognized in Net Periodic Benefit Cost, before Tax
Available-for-sale Securities, Gross Realized Gain (Loss), Excluding Other than Temporary ImpairmentsOther than Temporary Impairment Losses, Investments, Portion Recognized in Earnings, Net
51

Example - Revenue Recognition
52
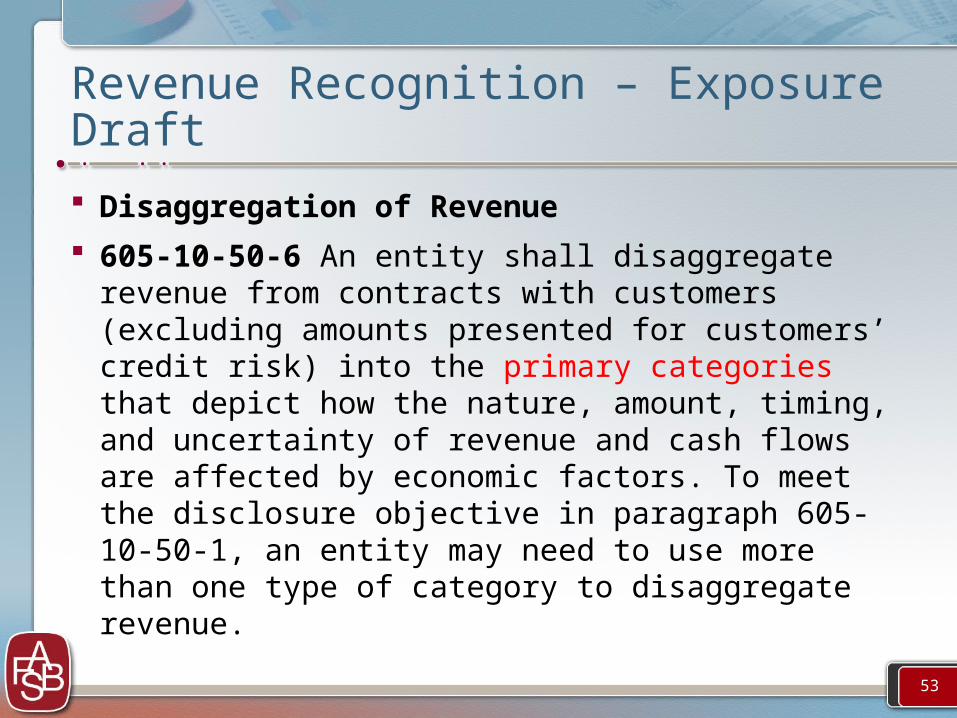
Disaggregation of Revenue
605-10-50-6 An entity shall disaggregate revenue from contracts with customers (excluding amounts presented for customers’ credit risk) into the primary categories that depict how the nature, amount, timing, and uncertainty of revenue and cash flows are affected by economic factors. To meet the disclosure objective in paragraph 605-10-50-1, an entity may need to use more than one type of category to disaggregate revenue.
Revenue Recognition – Exposure Draft
53

605-10-50-7 Examples of categories that might be appropriate include all of the following:
- a. Type of good or service (for example, major product lines) - b. Geography (for example, country or region) - c. Market or type of customer (for example, government and
nongovernment customers) - d. Type of contract (for example, fixed-price and time-and-materials
contracts) - e. Contract duration (for example, short-term and long-term contracts) - f. Timing of transfer of goods or services (for example, revenue from
goods or services transferred to customers at a point in time and revenue from
- g. Sales channels (for example, goods sold directly to consumers and goods sold through intermediaries).
Revenue Recognition – Exposure Draft
54

Revenue Recognition - Template
55
Preliminary Data Model of 605-10-50-7