6th Grade - NJCTLcontent.njctl.org/courses/math/6th-grade-math/dependent/...Slide 1 / 65 6th Grade...
22
Slide 1 / 65 6th Grade Dependent & Independent Variables 2015-11-25 www.njctl.org Slide 2 / 65 Table of Contents Graphing Equations Equations and Tables Click on a topic to go to that section. Dependent and Independent Variables Translating to Equations Glossary Slide 3 / 65
Transcript of 6th Grade - NJCTLcontent.njctl.org/courses/math/6th-grade-math/dependent/...Slide 1 / 65 6th Grade...

Slide 1 / 65
6th Grade
Dependent & Independent Variables
2015-11-25
www.njctl.org
Slide 2 / 65
Table of Contents
Graphing Equations
Equations and Tables
Click on a topicto go to that section.
Dependent and Independent Variables
Translating to Equations
Glossary
Slide 3 / 65

Translating to Equations
Return to Table of Contents
Slide 4 / 65
An equation is a statement that shows that two
When writing equations, you want to pull the pieces of important information from the problem, and turn them into mathematical expressions.
mathematical expressions are equal.
These are examples of equations:
12 + a = 15 x / 5 = 10 y = 3x
Equation
Slide 5 / 65
Mrs. Smith bought pencils for her class and spent $5.50 total. If each pencil costs $0.15, how many students are in the class? This tells us one pencil costs $0.15.This tells us the equation must equal $5.50.
Do we know how many students are in the class? No, so this will be our variable, so let s = students in the class.
Now, think about how you would calculate the total price of the pencils. You would multiply the cost of one pencil by the number of students in the class and get the total, so that is how you must set up your equation.
$0.15s = $5.50
Example
Slide 6 / 65

Kristin is three years older than her sister, Sarah. If Kristin is 13 years old, how old is Sarah?
Try This:
Slide 7 / 65
1 The Dolphins scored 9 more points than the Jets. The Jets scored 34 points. Which equation could be used to find the number of points p that the Dolphins scored during the game?
A p + 9 = 34B p + 34 = 9C p - 9 = 34D p - 34 = 9
Slide 8 / 65
2 Frank earns $8.50 per hour for mowing his neighbors' yards. Last weekend Frank earned $51. Which equation can be used to determine the number of hours h Frank worked last weekend?A 8.5h = 51B 51h = 8.5C 8.5/h = 51D h/51 = 8.5
Slide 9 / 65

3 Scott is working at a local restaurant. He earns $45 for each shift plus the tips he receives from his customers. Last night, he earned $73 for his shift. Which equation can be used to determine how much Scott earned in tips, t, last night?
A 45 + t = 73 B 73 + t = 45 C 73 - t = 45 D 45 - t = 73
Slide 10 / 65
4 Gabby was trying to pay off her credit card bill. After her payment of $75, her credit card balance was $263. Which equation can be used to determine the initial balance, b, on Gabby's credit card?
A b - 263 = 75 B b - 75 = 263 C b + 75 = 263 D b + 263 = 75
Slide 11 / 65
5 Melinda and her friends went to the theater and purchased 3 adult tickets and one large popcorn. One adult ticket costs $9, and they spent $33.75 at the theater. Which equation could be used to determine the cost c of the popcorn?
A 9c - 3 = 33.75B 33.75-9 = cC 3c + 9 = 33.75D 3(9) + c = 33.75
Slide 12 / 65

Dependent and Independent Variables
Return to Table of Contents
Slide 13 / 65
An independent variable is the variable that is subject to choice, or one that is not influenced by another variable.
Vocabulary
The value of a dependent variable relies on the values of the independent variable.
Slide 14 / 65
Frank earns $8 per hour mowing his neighbors' lawns.
The amount of money he earns, m, depends on how many hours he works, h.
The more hours he works, the more money he earns.
Therefore the dependent variable is money, m,and the independent variable is hours, h.
The amount of hours he works does not rely on the money he earns.
Example
Slide 15 / 65
Independent Dependent
how far you drive how much gas you use
weight of a sick child dosage of medicine given
your test score how you study for the test
Try to guess the missing variable.
With your group, try to think of at least three examples of independent and dependent variables.
Independent Dependent
Try This:
Mat
h Pr
actic
e
Slide 16 / 65
6 The number of tickets I can buy depends on how much money I have.
True
False
Slide 17 / 65
7 So which value is the independent variable?
A amount of moneyB number of tickets
The number of tickets I can buy depends on how much money I have.
Click for Question
Slide 18 / 65

8 It costs $4.25 to rent a movie. The amount of money I spend depends on how many movies I rent. So the dependent variable is the number of movies I rent.
True
False
Slide 19 / 65
9 The older I get, the taller I am. My height is the...
A Independent Variable
B Dependent Variable
Slide 20 / 65
10 The more people I have at my party, the more brownies I need to bake. The number of people at my party is the...
A Independent Variable
B Dependent Variable
Slide 21 / 65

Equations and Tables
Return to Table of Contents
Slide 22 / 65
The relationship between dependent and independent variables can be
represented with a table.
Independent Dependent
Input Output
The independent variable is always in the left column, and the dependent variable is
always in the right column.
The relationship between independent & dependent variables and input & output works like a machine.
Tables
Slide 23 / 65
The value of the output relies on Input
Output
Rule
The rule is the relationship between the input and the output.
It says what happens to the input inside the machine.
The value of the output always depends on the value of the input.
1. The value of the input
2. The rule
Rule Machine
Slide 24 / 65

Let's Practice figuring out the rule.
Step 1. Assign a value to the input.
Step 2. Hit Enter to see the output.
The input and output
values will show
on this table.
Step 3. Once you have enough input/output values to figure out the rule, select + or * and the addend or factor.
Step 4. Check Your Rule
Click here for online practice.
Practice
Slide 25 / 65
n 2n
20
40
100 200
80
40click
click
click
The value of n is the input.Given the value for n, find the output using the given rule.
Input Output
Practice
Slide 26 / 65
x + 15
$53
$70
$115
The manager of the department store raised the price $15 on each video game. Can you find an expression (rule) that will satisfy the total
cost of the video game if given the original price?
$100
$38
x
Price after mark up
$55
Original price
click
click
click
click
Practice
Slide 27 / 65
g - 2
Kindergarten
8th grade
4th grade
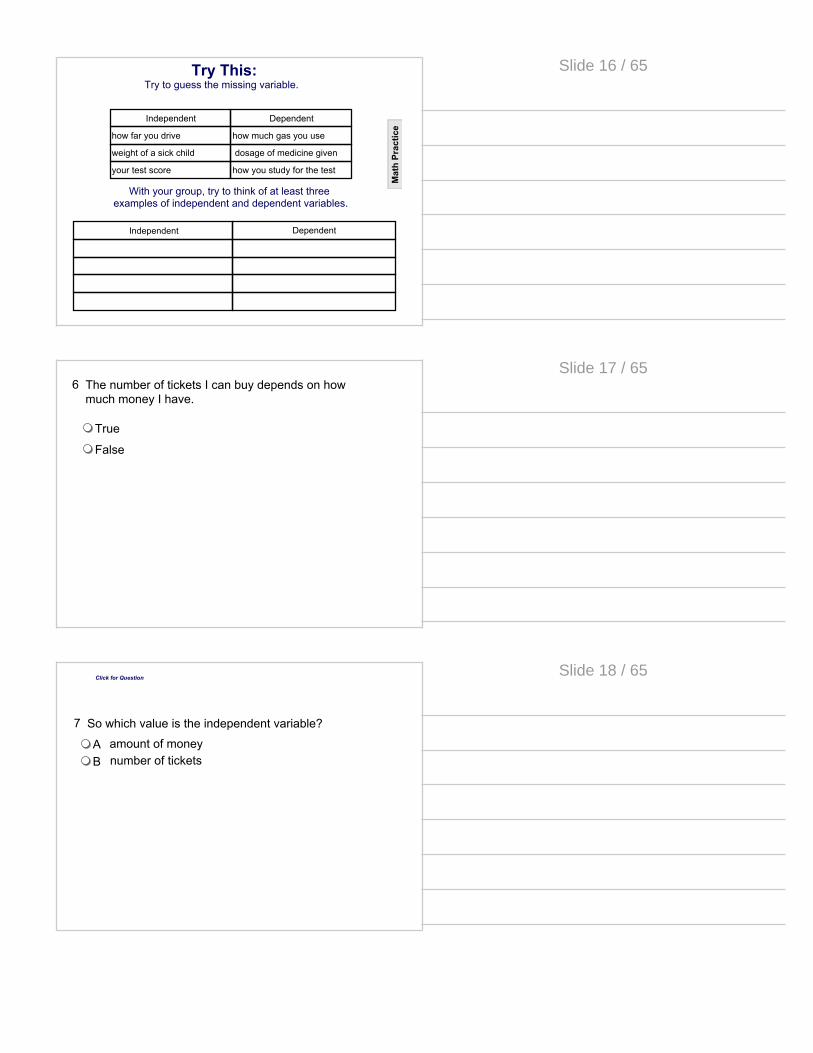
A parent wants to figure out the differences in grade level of her two sons. The younger son is two years behind the older one in terms of grade level. Write an expression (rule) containing a variable which satisfies the difference in grade level of the two boys.
older son's grade level
younger son's grade level
6
10
2
g
click
click
click
click
Practice
Slide 28 / 65
Tables can be used to represent equations.
The table below represents the equation y = x + 3.
x y
3 6
4 7
6 9
The output (y) depends on the input (x).
So x is the independent variable, on the left,and y is the dependent variable, on the right.
TablesM
ath
Prac
tice
Slide 29 / 65
51
39
21tn
10
28
40
click
click
click
This table represents the equationt = n + 11
Find the values for t, given the values for n.
Practice
Slide 30 / 65
120
60
20
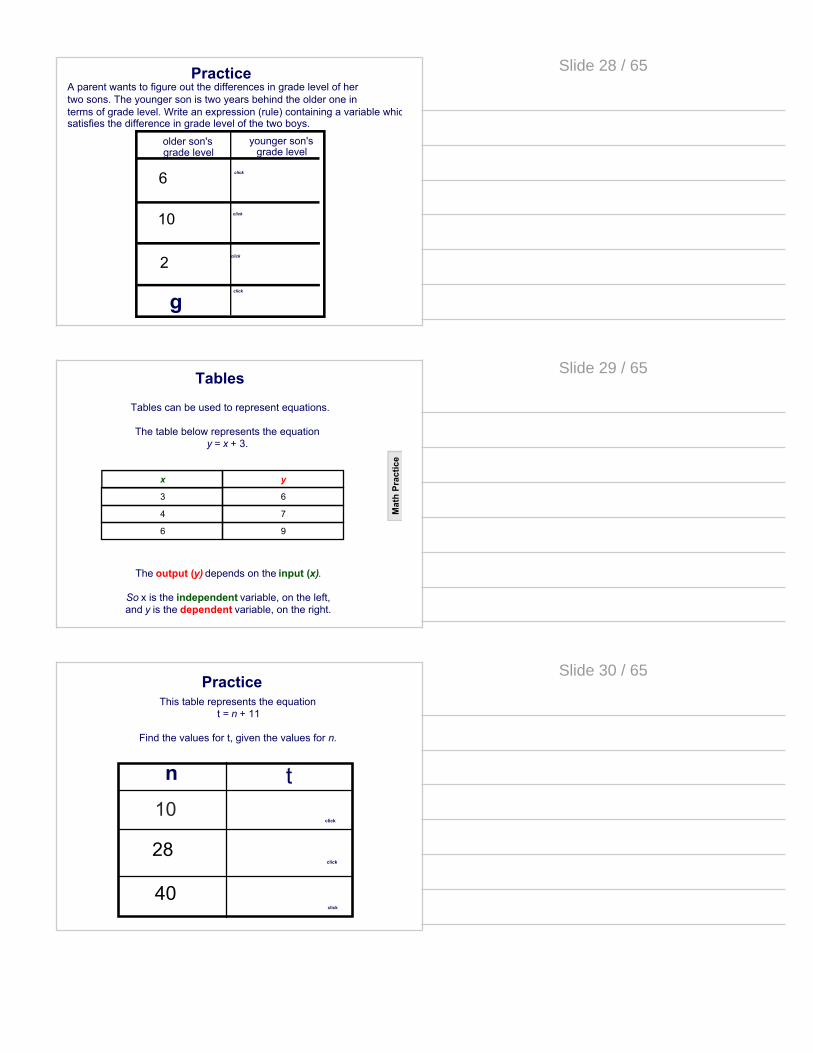
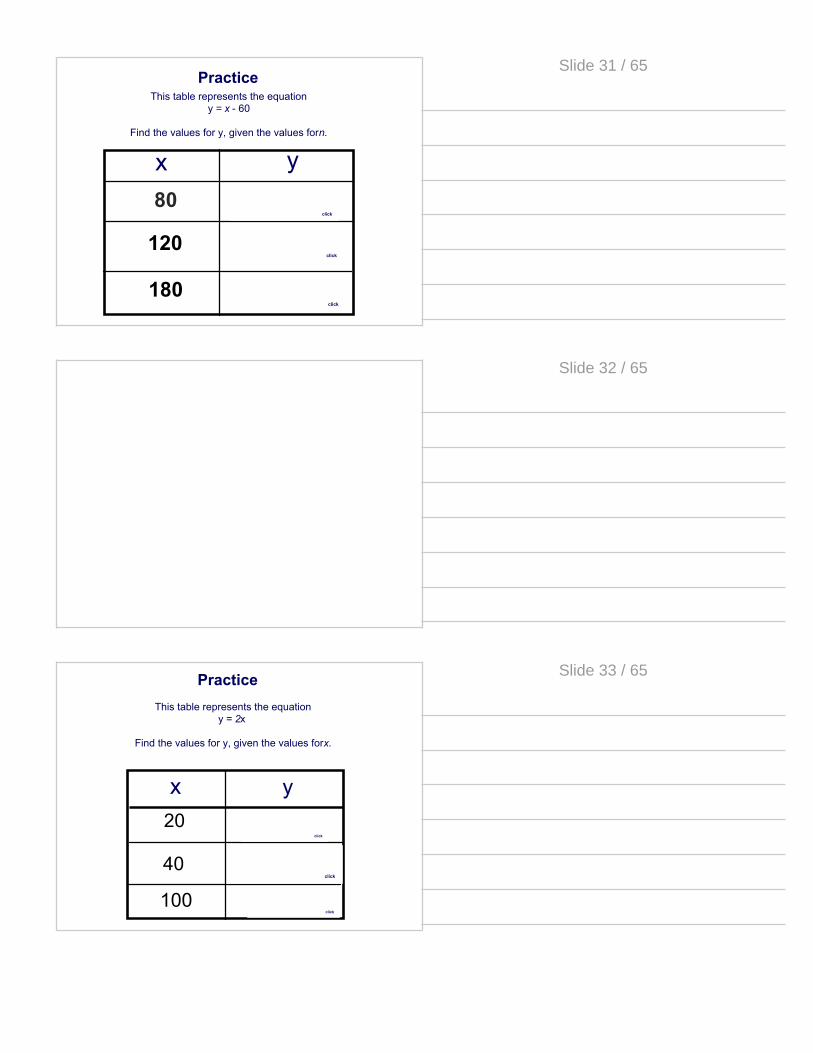
yx 80
120
180
click
click
click
This table represents the equationy = x - 60
Find the values for y, given the values for n.
Practice
Slide 31 / 65
Slide 32 / 65
x y20
40
100 200
80
40
click
click
click
This table represents the equationy = 2x
Find the values for y, given the values for x.
Practice
Slide 33 / 65

Equations and tables can also be used to represent real-life information mathematically.
Natalie is going ice skating. The skating rink charges $6.25 per hour of skating.
We will let h represent the number of hours of skating and c represent the total cost.
Equation: c = 6.25 h
hours (h) cost (c)
1 $6.25
2 $12.50
3 $18.75
Real Life Example
Teac
her N
otes
&
Mat
h Pr
actic
e
Slide 34 / 65
2j = m
48
28
24
Mary's age is twice the age of Jack.
Jack's Age
12
14
24
j
Mary's Age
Can you think of an algebraic equation which determines Mary's age (m), given Jack's age (j)?
click
click
click
click
Real Life Example
Slide 35 / 65
11 Henry downloads songs into iTunes. The amount of time it takes him to download a song depends on the song's file size.Which is the independent variable?
A Download time
B File size
Slide 36 / 65
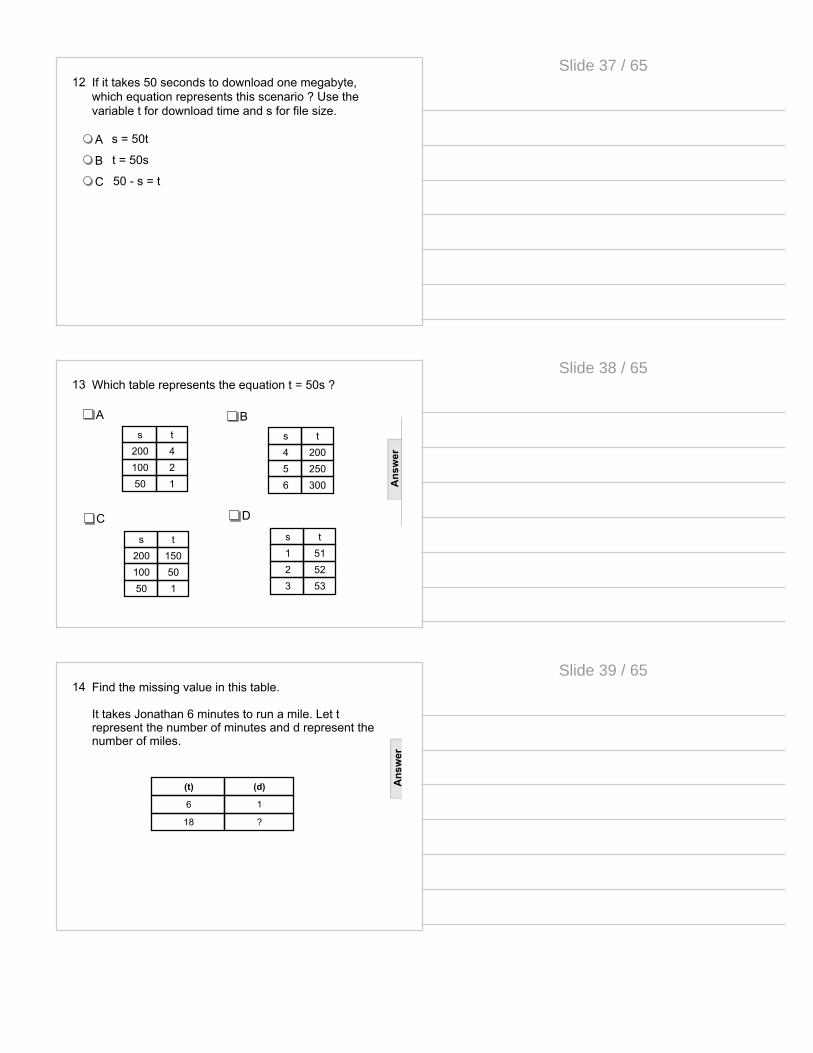
12 If it takes 50 seconds to download one megabyte, which equation represents this scenario ? Use the variable t for download time and s for file size.
A s = 50t
B t = 50s
C 50 - s = t
Slide 37 / 65
13 Which table represents the equation t = 50s ?
A B
C D
s t200 4100 250 1
s t4 2005 2506 300
s t200 150100 5050 1
s t1 512 523 53
Ans
wer
Slide 38 / 65
14 Find the missing value in this table.
It takes Jonathan 6 minutes to run a mile. Let t represent the number of minutes and d represent the number of miles.
(t) (d)
6 1
18 ?
Ans
wer
Slide 39 / 65

15 Use the equation y = 5x to complete the table.
A
B
C
D
x y
20 ?
? 150
50 ?
?= 4 ?= 30 ?= 250
?= 4 ?= 30 ?= 10
?= 100 ?= 30 ?= 250
?= 100 ?= 3 ?= 10
Ans
wer
Slide 40 / 65
Graphing Equations
Return to Table of Contents
Slide 41 / 65
You have learned that equations and tables are two ways to represent real-life scenarios.
Equations and tables can also be graphed to represent a real-life scenario.
Example:
A cafeteria has an automatic waffle-making machine. The table shows the relationship between the time in hours (x) and the number of waffles the machine can make (y).
(x) (y)
1 50
2 1003 1504 2005 250
Tables to Graphs
Slide 42 / 65

(x) (y)
1 502 1003 1504 2005 250
The equation for this scenario is y = 50x
Each hour, 50 waffles are made.
The value of y depends on the value of x.
y is dependent x is independent
Tables to Equation
Slide 43 / 65
This scenario can be represented with a graph.When graphing:The independent variable is always across the x axis.The dependent variable is always up the y axis.
0 1 2 3 4 5 6 7 8
400
350
300
250
200
150
100
50
y axis
(dependent)
x axis (independent)
Variables on Graphs
Slide 44 / 65
0 1 2 3 4 5 6 7 8
400
350
300
250
200
150
100
50
Once you have represented the equation in a function table, you can utilize the independent and dependent variable values as coordinates.
Plot the coordinates from the table below to graph the scenario.
Time (x) Waffles Made (y)
Coordinate (x,y)
1 50 (1, 50)
2 100 (2, 100)
3 150 (3, 150)
4 200 (4, 200)
5 250 (5, 250)
Function Table
Mat
h Pr
actic
e
Slide 45 / 65

A bookstore is running a special and is charging $5 for any childrens' book.
1. Write an equation to represent the scenario. 2. Complete the table to represent the scenario. 3. Graph the function.
0 1 2 3 4 5 6 7 8
40
35
30
25
20
15
10
5
Number of Books
(x)
Total Cost (y)
Coordinate (x,y)
1 5 (1, 5)
2 10 (2, 10)
3 15 (3, 15)
4 20 (4, 20)
5 25 (5, 25)
Tables to Graphs
Ans
wer
&
Mat
h Pr
actic
e
Slide 46 / 65
16 A plane descends at a rate of 50 feet per minute. Which graph represents this scenario?
A B
C
0 1 2 3 4 5 6 7 8
400
350
300
250
200
150
100
50
0 1 2 3 4 5 6 7 8
400
350
300
250
200
150
100
50
0 1 2 3 4 5 6 7 8
400
350
300
250
200
150
100
50
Slide 47 / 65
17 Which scenario does the graph represent?A Mia earns $12 per hour.
B The river rose at a steady rate of 15 feet per hour.
C The stock value decreased by $.50 per minute
D The plane traveled 300 miles per hour.
0 1 2 3 4 5 6 7 8
80
70
60
50
40
30
20
10
Slide 48 / 65

18 Which scenario does the graph represent?A Tia starts out with $30. Every hour Tia earns an additional $20.B Tia starts out with $50. Every minute she spends $5.C Tia runs a mile every 20 minutes.
0 1 2 3 4 5 6 7 8
80
70
60
50
40
30
20
10
Slide 49 / 65
19 A dogwood tree grew at the rate of 4 feet per year. Which table represents the relationship between the height of the tree (h) and the number of years (t)?
A B
C D
t h
1 4
2 5
3 6
t ht ht h
1 4
3 12
5 20
t h
5 1
10 2
15 3
t h
4 1
8 2
12 3
Ans
wer
Slide 50 / 65
20 The table and graph represent which equation?
A y = 50x
B 50y = x
C y = x -50
D y = x + 50
minutes (x) 1 3 4 7
# of words typed (y)
50 150 200 350
0 1 2 3 4 5 6 7 8
400
350
300
250
200
150
100
50
Ans
wer
Slide 51 / 65

21 Which equation represents the relationship between x and y shown in the graph?
A y = 3x
B y = x - 3
C y = 1/3x
D y = x + 3
From PARCC PBA sample test calculator #5
The graph shows the number of teaspoons of water, y, that have dripped from a leaky faucet at the end of x minutes.
Slide 52 / 65
22 Based on the relationship in the graph, how many teaspoons of water will have dripped from the faucet at the end of 21 minutes?
From PARCC PBA sample test calculator #5
The graph shows the number of teaspoons of water, y, that have dripped from a leaky faucet at the end of x minutes.
Slide 53 / 65
Glossary
Return toTable ofContents
Slide 54 / 65

Back to
Instruction
Coordinates
A pair of values that show an exact position on a coordinate plane.
(x,y)(0,0)
x
y
(2,3)
Slide 55 / 65
Back to
Instruction
Dependent Variable
The variable whose value varies based on the value of another variable.
The dependent variable is always along the y axis.y = x2
The value of y is determined by the value of x.
(x) (y)1 12 43 9
The dependent variable is always the output (y).
Function Tables
Equations Graphing
0 1 2 3 4 5 6 7 8
87654321
Slide 56 / 65
Back to
Instruction
Equation
Two expressions that are equivalent to each other. Equivalence is shown with an equal sign.
4x=8equivalent expressions
4 =x3
equivalent expressions
no equivalence
x3
Slide 57 / 65

Back to
Instruction
ExpressionNumbers, symbols and operations
grouped together that show the value of something.
2 x 3 = 6 Expressions DO NOT have
equal signs.
3 2 + 12An
expression is one side of an equation.
Slide 58 / 65
Back to
Instruction
Function Table
Organizes the special relationship between x and y values. Each of its input values gives
back exactly one output value.
The output (y) depends
on the input (x).
(x) (y)1 12 43 9
x is the independent variable, on the left,
and y is the dependent variable,
on the right.
Slide 59 / 65
Back to
Instruction
The variable that holds its value and is not influenced by another variable.
Independent Variable
The independent variable is always across the x axis.y = x2
x holds its value, regardless of
what y is.
(x) (y)1 12 43 9
The independent variable is always the input (x).
Function TablesEquations Graphing
87654321
0 1 2 3 4 5 6 7 8
Slide 60 / 65

Back to
Instruction
Input
The input is the independent variable in a function (y).
The output (y) depends on the
input (x).
(x) (y)1 12 43 9
y = x2
The value of y is determined by the value of x.
Input
Input
Rule
y = x2
3
Output
9
Slide 61 / 65
Back to
Instruction
Output
The output is the dependent variable in a function (y).
The output (y) depends on the
input (x).
(x) (y)1 12 43 9
y = x2
The value of y is determined by the value of x.
Output
Input
Output
Ruley = x2
3
9
Slide 62 / 65
Back to
Instruction
RuleDefines the relationship between the input and the output, using an algebraic equation. It says
what happens to the input in a function.Input3
Output
9
Rule:y = x2
(x) (y)1 32 63 9
Rule: y = 3x
(x) (y)1 62 103 14
Rule: y = 4x+2
Slide 63 / 65

Back to
Instruction
VariableA letter or symbol that
represents a changeable or unknown value.
4x + 2variable
x = ?2x = 6x x
Slide 64 / 65
Standards for Mathematical Practice
MP1: Making sense of problems & persevere in solving them.MP2: Reason abstractly & quantitatively.MP3: Construct viable arguments and critique the reasoning of others. MP4: Model with mathematics.MP5: Use appropriate tools strategically.MP6: Attend to precision.MP7: Look for & make use of structure.MP8: Look for & express regularity in repeated reasoning.
Additional questions are included on the slides using the "Math Practice" Pull-tabs (e.g. a blank one is shown to the right on this slide) with a reference to the standards used.
If questions already exist on a slide, then the specific MPs that the questions address are listed in the Pull-tab.
Slide 65 / 65