
'6810 JLGGC
30
Functional Metagenomic Profiling of Nine Biomes Elizabeth A. Dinsdale 1,2* , Robert A. Edwards 1,3,4,5 , Dana Hall 1 , Florent Angly 1,6 , Mya Breitbart 7 , Jennifer M. Brulc 8, , Mike Furlan 1 , Christelle Desnues 1,9 , Matthew Haynes 1 , Linlin Li 1 , Lauren McDaniel 7 , Mary Ann Moran 10 , Karen E. Nelson 11 , Christina Nilsson 12 , Robert Olson 5 , John Paul 7 , Beltran Rodriguez Brito 1,6 , Yijun Ruan 12, Brandon K. Swan 13 , Rick Stevens 5 , David L. Valentine 13 , Rebecca Vega Thurber 1 , Linda Wegley 1 , Bryan A. White 8,14 , and Forest Rohwer 1,3 1 Department of Biology, San Diego State University, San Diego, CA 92182 USA 2 School of Biological Sciences, Flinders University, Adelaide, SA 5042, Australia 3 Center for Microbial Sciences, San Diego State University, San Diego, CA 92182 USA 4 Department of Computer Sciences, San Diego State University, San Diego, CA 92182 USA 5 Mathematics and Computer Science Division, Argonne National Laboratory, Argonne, IL 60439 USA 6 Computational Science Research Centre, San Diego State University, San Diego, CA 92182-1245 USA 7 University of South Florida, College of Marine Science 140 7th Avenue S., St. Petersburg, FL 33701 USA 8 Department of Animal Sciences, University of Illinois, Urbana, IL 61801, USA SUPPLEMENTARY INFORMATION doi: 10.1038/nature06810 www.nature.com/nature 1
Transcript of '6810 JLGGC
Functional Metagenomic Profiling of Nine Biomes
Elizabeth A. Dinsdale1,2*, Robert A. Edwards1,3,4,5, Dana Hall1, Florent Angly1,6, Mya
Breitbart7, Jennifer M. Brulc 8,, Mike Furlan1, Christelle Desnues1,9, Matthew Haynes1,
Linlin Li1, Lauren McDaniel7, Mary Ann Moran10, Karen E. Nelson11, Christina
Nilsson12, Robert Olson5, John Paul7, Beltran Rodriguez Brito1,6, Yijun Ruan12, Brandon
K. Swan13, Rick Stevens5, David L. Valentine13, Rebecca Vega Thurber1, Linda
Wegley1, Bryan A. White8,14, and Forest Rohwer1,3
1Department of Biology, San Diego State University, San Diego, CA 92182 USA
2School of Biological Sciences, Flinders University, Adelaide, SA 5042, Australia
3Center for Microbial Sciences, San Diego State University, San Diego, CA 92182 USA
4Department of Computer Sciences, San Diego State University, San Diego, CA 92182
USA
5Mathematics and Computer Science Division, Argonne National Laboratory, Argonne,
IL 60439 USA
6Computational Science Research Centre, San Diego State University, San Diego, CA
92182-1245 USA
7University of South Florida, College of Marine Science 140 7th Avenue S., St.
Petersburg, FL 33701 USA 8 Department of Animal Sciences, University of Illinois, Urbana, IL 61801, USA
SUPPLEMENTARY INFORMATION
doi: 10.1038/nature06810
www.nature.com/nature 1
9Current address: Unité des Rickettsies, CNRS-UMR 6020, Faculté de médecine,
13385 Marseille, France
10 Department of Marine Sciences, University of Georgia, Athens, GA, USA
30602.
11 The J. Craig Venter Institute, 9712 Medical Center Drive, Rockville, MD, 20850, USA
12 Genome Institute of Singapore, 60 Biopolis Street, #02-01, Genome, Singapore
138672
13 Department of Earth Science, University of California Santa Barbara, Santa
Barbara, CA 93106, USA 14 The Institute for Genomic Biology, University of Illinois, Urbana, IL 61801, USA
doi: 10.1038/nature06810 SUPPLEMENTARY INFORMATION
www.nature.com/nature 2
Supplementary information includes four tables presenting accession numbers and
descriptions of metagenomes, phage and prophage content of each metagenome, the
motility proteins present in the microbial and viral metagenomes and statistical
comparisons of the proportions of metabolic processes across the nine biomes. Six
figures provide information about the geographic separation of samples, diversity versus
sequences number, comparison of diversity between metagenomes and sequenced
whole bacterial genomes, the fine-scale details about the sulfur metabolic processes, and
two experiments that show the strength of the CDA across multiple groupings.
doi: 10.1038/nature06810 SUPPLEMENTARY INFORMATION
www.nature.com/nature 3
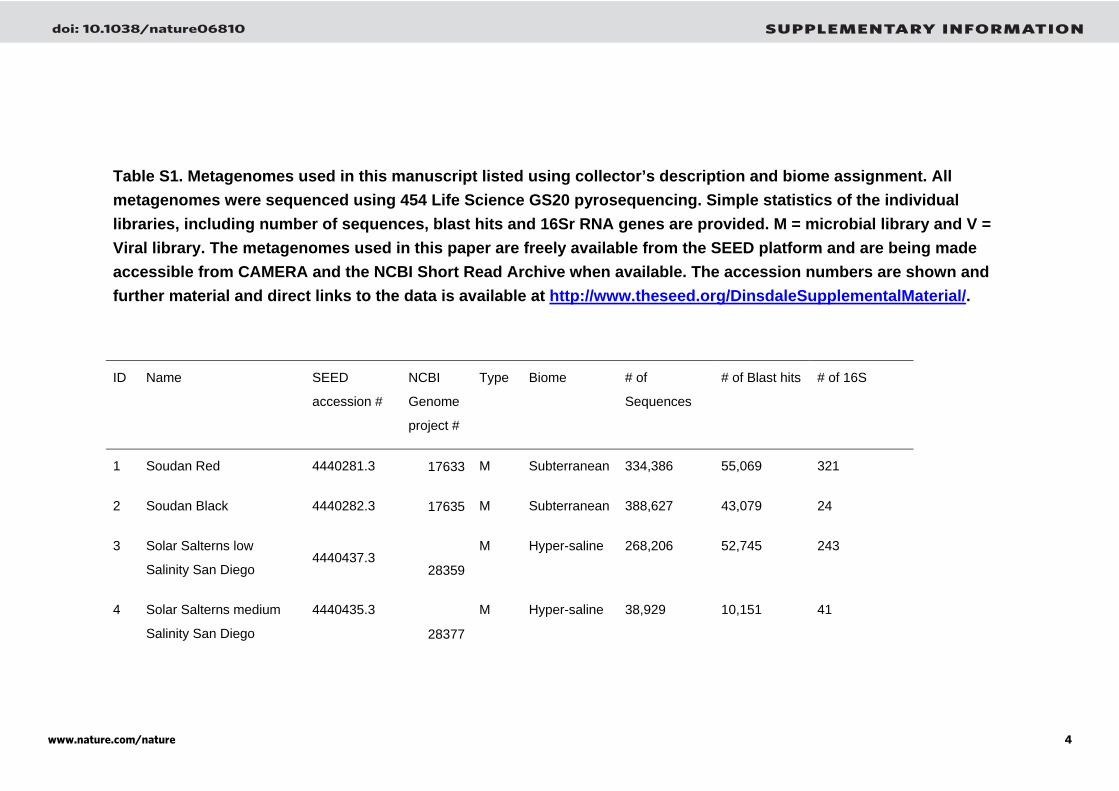
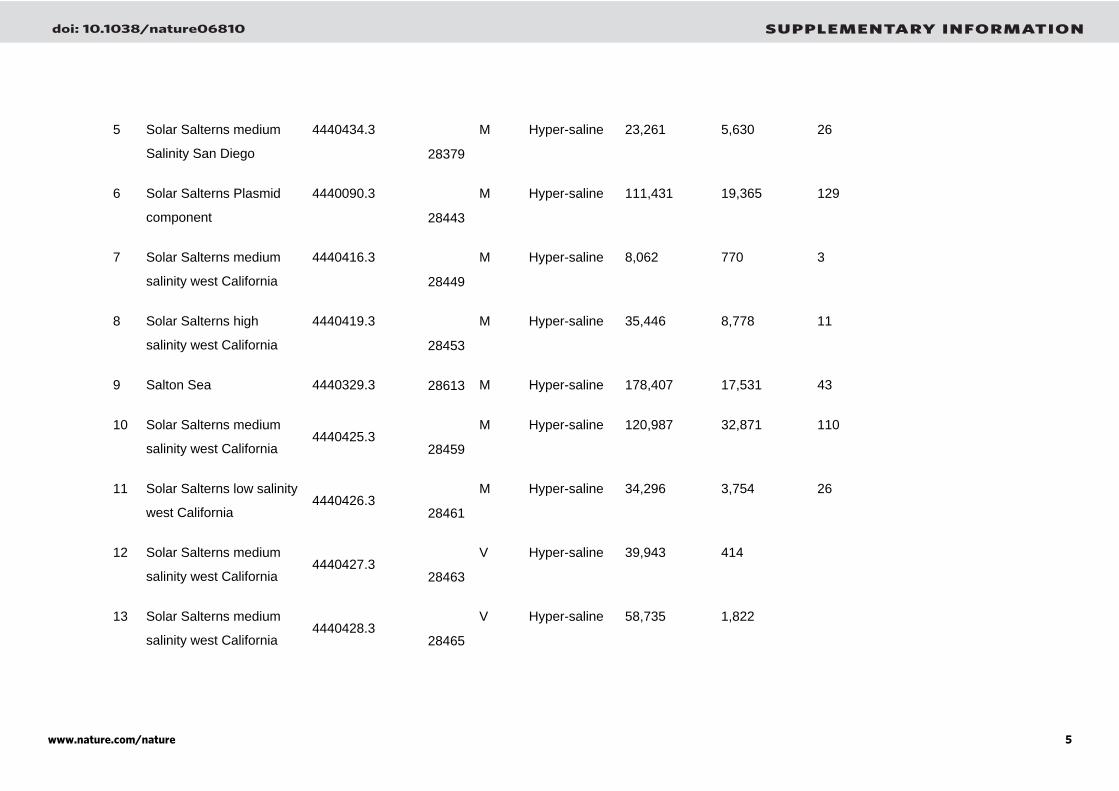
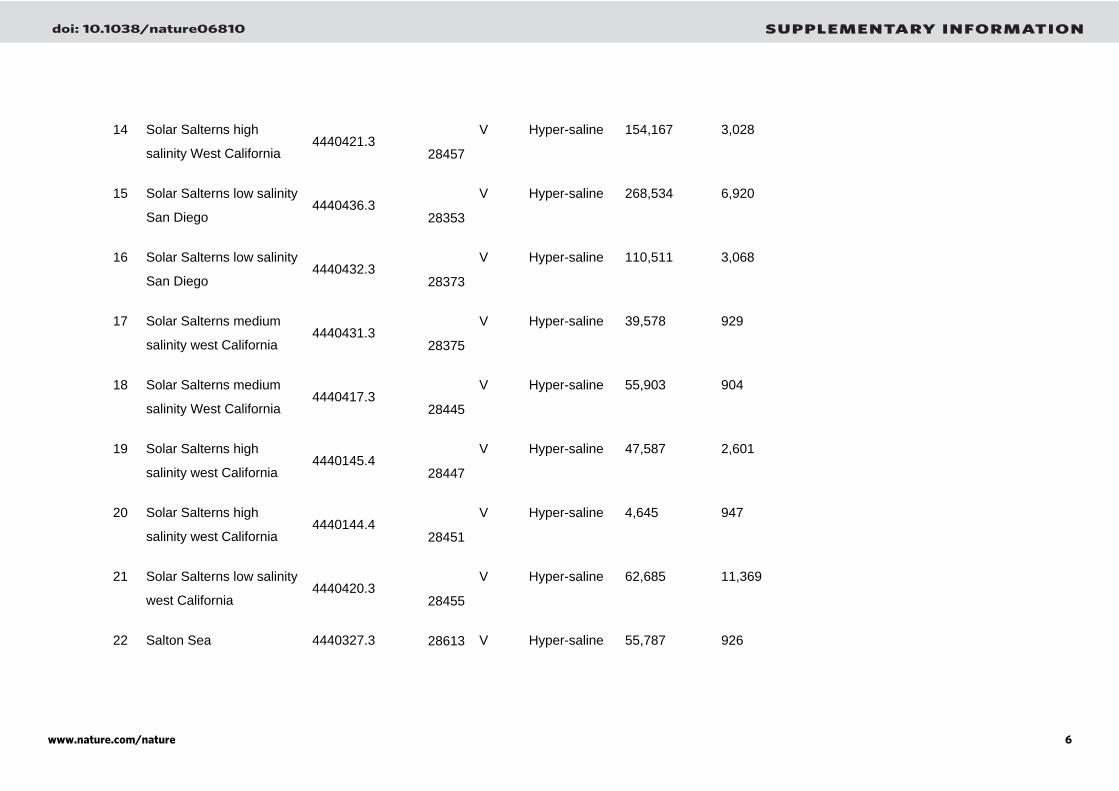
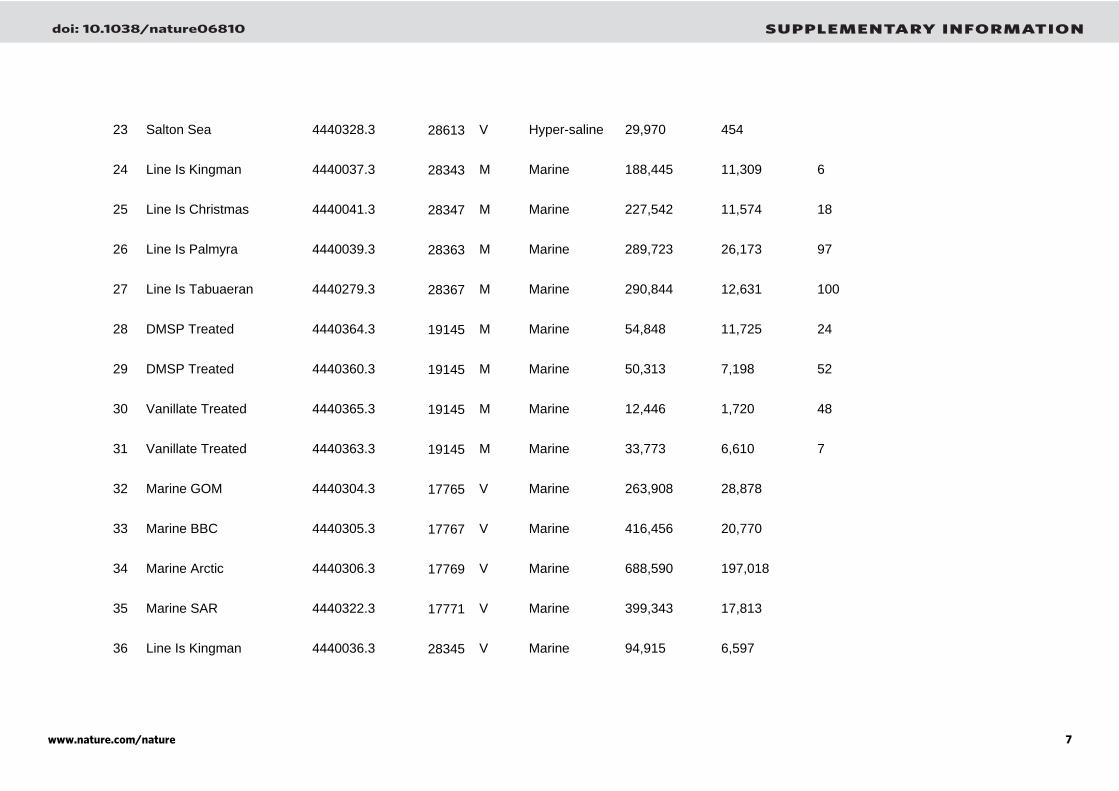
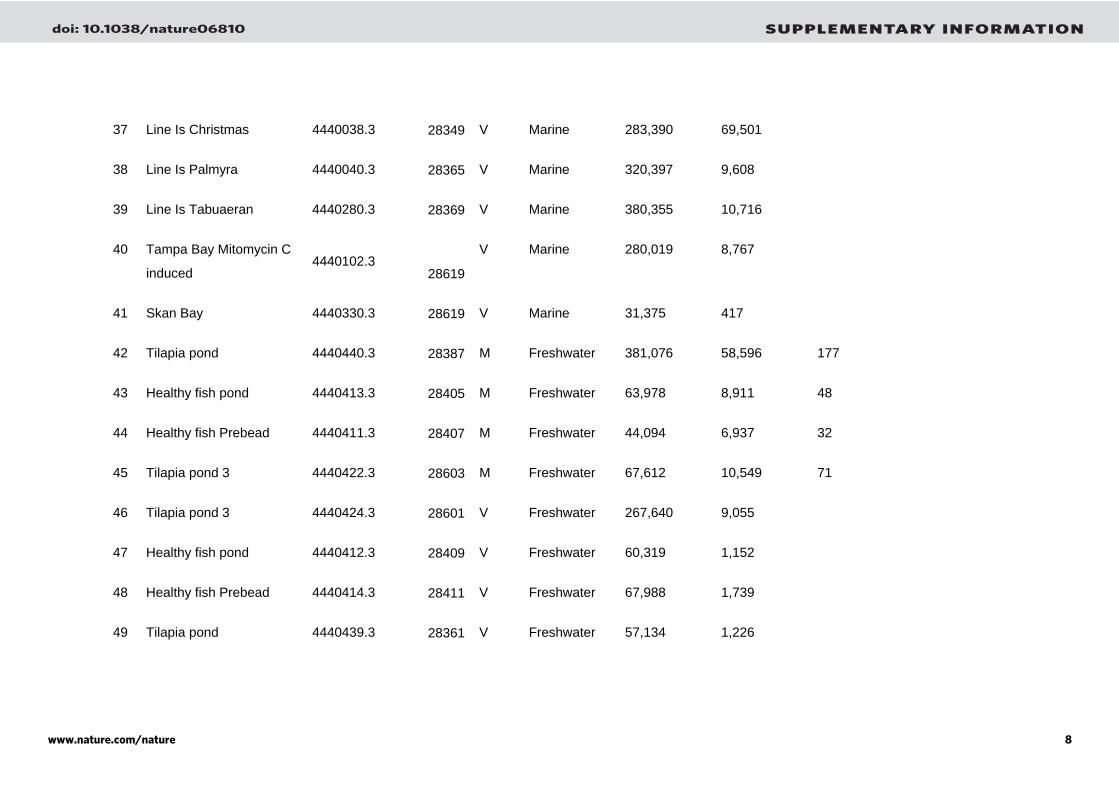
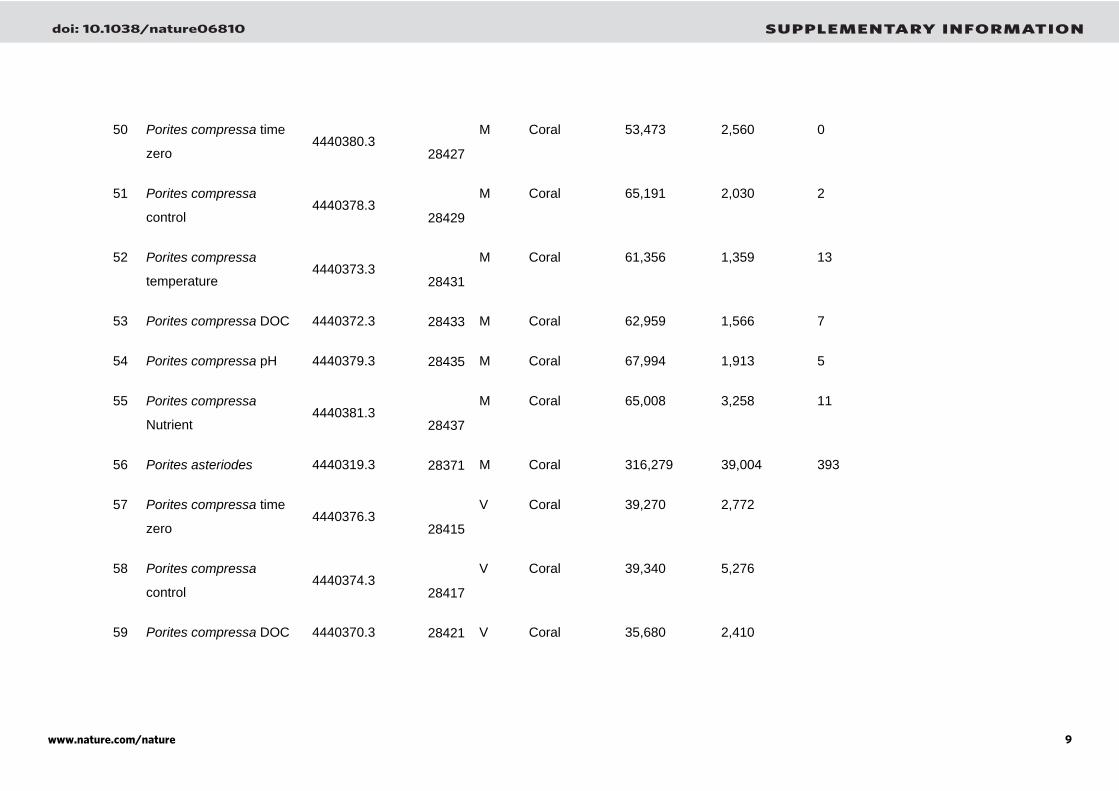
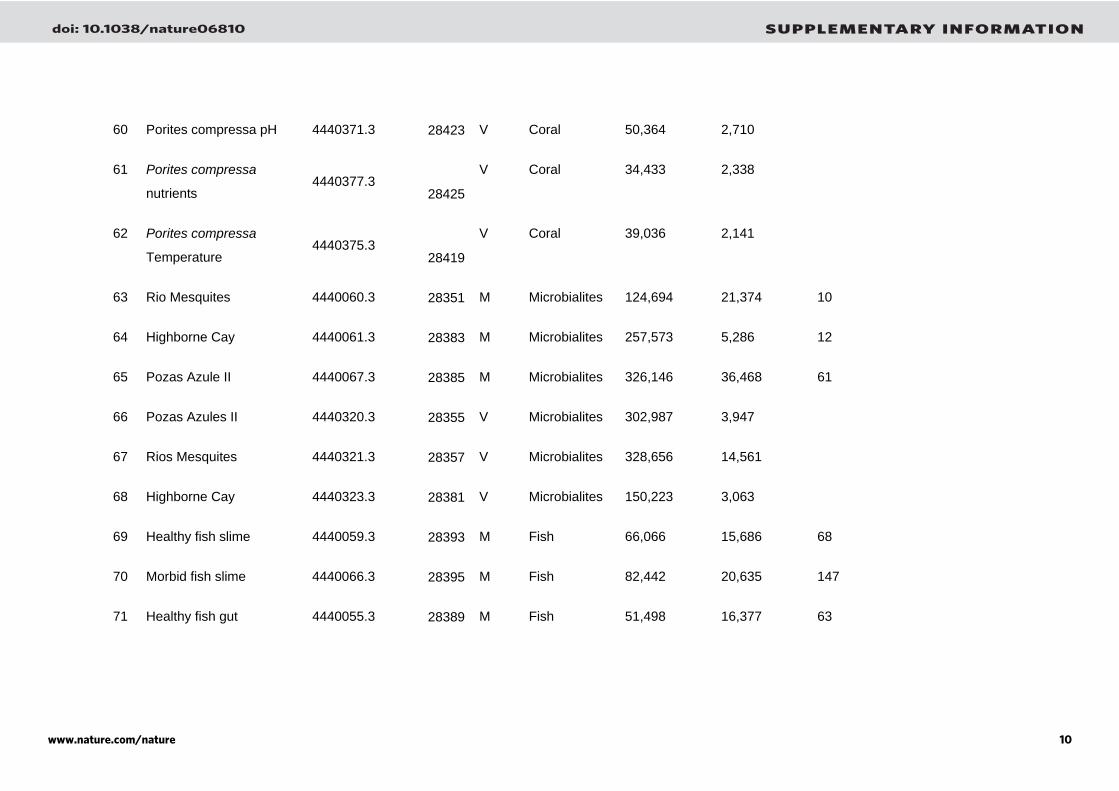
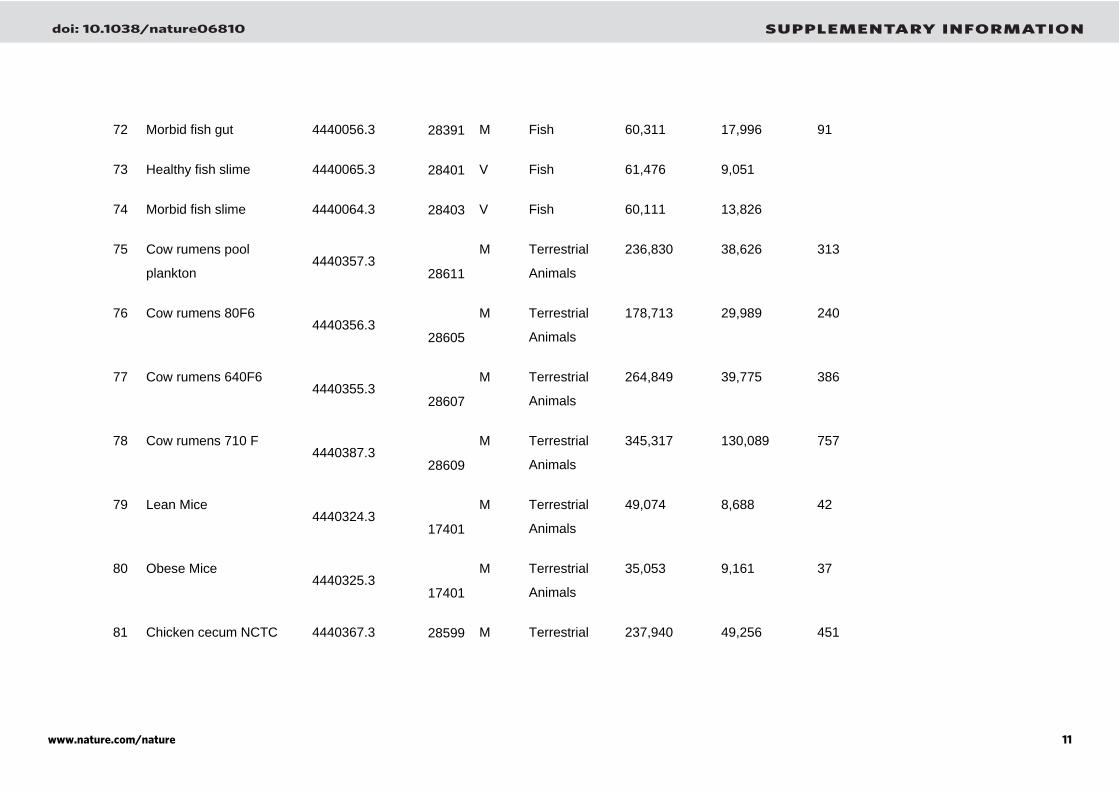
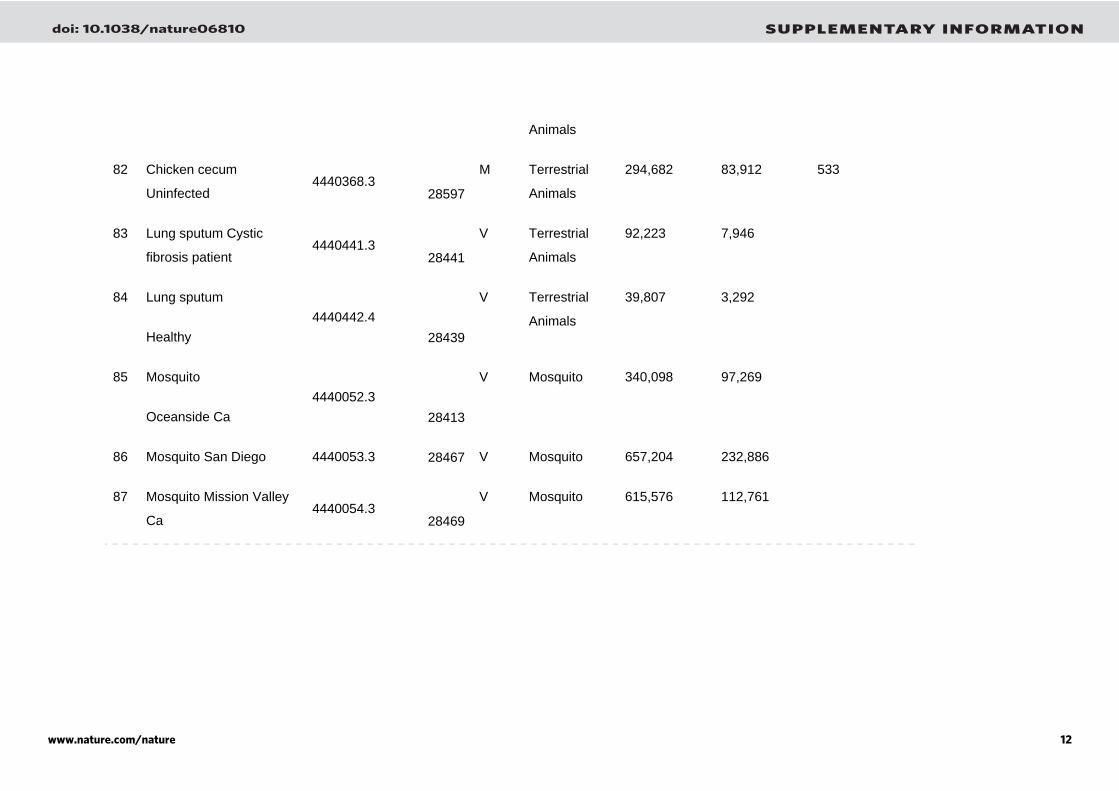
Table S1. Metagenomes used in this manuscript listed using collector’s description and biome assignment. All metagenomes were sequenced using 454 Life Science GS20 pyrosequencing. Simple statistics of the individual libraries, including number of sequences, blast hits and 16Sr RNA genes are provided. M = microbial library and V = Viral library. The metagenomes used in this paper are freely available from the SEED platform and are being made accessible from CAMERA and the NCBI Short Read Archive when available. The accession numbers are shown and further material and direct links to the data is available at http://www.theseed.org/DinsdaleSupplementalMaterial/.
ID Name SEED
accession #
NCBI
Genome
project #
Type Biome # of
Sequences
# of Blast hits # of 16S
1 Soudan Red 4440281.3 17633 M Subterranean 334,386 55,069 321
2 Soudan Black 4440282.3 17635 M Subterranean 388,627 43,079 24
3 Solar Salterns low
Salinity San Diego 4440437.3
28359
M Hyper-saline 268,206 52,745 243
4 Solar Salterns medium
Salinity San Diego
4440435.3
28377
M Hyper-saline 38,929 10,151 41
doi: 10.1038/nature06810 SUPPLEMENTARY INFORMATION
www.nature.com/nature 4
5 Solar Salterns medium
Salinity San Diego
4440434.3
28379
M Hyper-saline 23,261 5,630 26
6 Solar Salterns Plasmid
component
4440090.3
28443
M Hyper-saline 111,431 19,365 129
7 Solar Salterns medium
salinity west California
4440416.3
28449
M Hyper-saline 8,062 770 3
8 Solar Salterns high
salinity west California
4440419.3
28453
M Hyper-saline 35,446 8,778 11
9 Salton Sea 4440329.3 28613 M Hyper-saline 178,407 17,531 43
10 Solar Salterns medium
salinity west California 4440425.3
28459
M Hyper-saline 120,987 32,871 110
11 Solar Salterns low salinity
west California 4440426.3
28461
M Hyper-saline 34,296 3,754 26
12 Solar Salterns medium
salinity west California 4440427.3
28463
V Hyper-saline 39,943 414
13 Solar Salterns medium
salinity west California 4440428.3
28465
V Hyper-saline 58,735 1,822
doi: 10.1038/nature06810 SUPPLEMENTARY INFORMATION
www.nature.com/nature 5
14 Solar Salterns high
salinity West California 4440421.3
28457
V Hyper-saline 154,167 3,028
15 Solar Salterns low salinity
San Diego 4440436.3
28353
V Hyper-saline 268,534 6,920
16 Solar Salterns low salinity
San Diego 4440432.3
28373
V Hyper-saline 110,511 3,068
17 Solar Salterns medium
salinity west California 4440431.3
28375
V Hyper-saline 39,578 929
18 Solar Salterns medium
salinity West California 4440417.3
28445
V Hyper-saline 55,903 904
19 Solar Salterns high
salinity west California 4440145.4
28447
V Hyper-saline 47,587 2,601
20 Solar Salterns high
salinity west California 4440144.4
28451
V Hyper-saline 4,645 947
21 Solar Salterns low salinity
west California 4440420.3
28455
V Hyper-saline 62,685 11,369
22 Salton Sea 4440327.3 28613 V Hyper-saline 55,787 926
doi: 10.1038/nature06810 SUPPLEMENTARY INFORMATION
www.nature.com/nature 6
23 Salton Sea 4440328.3 28613 V Hyper-saline 29,970 454
24 Line Is Kingman 4440037.3 28343 M Marine 188,445 11,309 6
25 Line Is Christmas 4440041.3 28347 M Marine 227,542 11,574 18
26 Line Is Palmyra 4440039.3 28363 M Marine 289,723 26,173 97
27 Line Is Tabuaeran 4440279.3 28367 M Marine 290,844 12,631 100
28 DMSP Treated 4440364.3 19145 M Marine 54,848 11,725 24
29 DMSP Treated 4440360.3 19145 M Marine 50,313 7,198 52
30 Vanillate Treated 4440365.3 19145 M Marine 12,446 1,720 48
31 Vanillate Treated 4440363.3 19145 M Marine 33,773 6,610 7
32 Marine GOM 4440304.3 17765 V Marine 263,908 28,878
33 Marine BBC 4440305.3 17767 V Marine 416,456 20,770
34 Marine Arctic 4440306.3 17769 V Marine 688,590 197,018
35 Marine SAR 4440322.3 17771 V Marine 399,343 17,813
36 Line Is Kingman 4440036.3 28345 V Marine 94,915 6,597
doi: 10.1038/nature06810 SUPPLEMENTARY INFORMATION
www.nature.com/nature 7
37 Line Is Christmas 4440038.3 28349 V Marine 283,390 69,501
38 Line Is Palmyra 4440040.3 28365 V Marine 320,397 9,608
39 Line Is Tabuaeran 4440280.3 28369 V Marine 380,355 10,716
40 Tampa Bay Mitomycin C
induced 4440102.3
28619
V Marine 280,019 8,767
41 Skan Bay 4440330.3 28619 V Marine 31,375 417
42 Tilapia pond 4440440.3 28387 M Freshwater 381,076 58,596 177
43 Healthy fish pond 4440413.3 28405 M Freshwater 63,978 8,911 48
44 Healthy fish Prebead 4440411.3 28407 M Freshwater 44,094 6,937 32
45 Tilapia pond 3 4440422.3 28603 M Freshwater 67,612 10,549 71
46 Tilapia pond 3 4440424.3 28601 V Freshwater 267,640 9,055
47 Healthy fish pond 4440412.3 28409 V Freshwater 60,319 1,152
48 Healthy fish Prebead 4440414.3 28411 V Freshwater 67,988 1,739
49 Tilapia pond 4440439.3 28361 V Freshwater 57,134 1,226
doi: 10.1038/nature06810 SUPPLEMENTARY INFORMATION
www.nature.com/nature 8
50 Porites compressa time
zero 4440380.3
28427
M Coral 53,473 2,560 0
51 Porites compressa
control 4440378.3
28429
M Coral 65,191 2,030 2
52 Porites compressa
temperature 4440373.3
28431
M Coral 61,356 1,359 13
53 Porites compressa DOC 4440372.3 28433 M Coral 62,959 1,566 7
54 Porites compressa pH 4440379.3 28435 M Coral 67,994 1,913 5
55 Porites compressa
Nutrient 4440381.3
28437
M Coral 65,008 3,258 11
56 Porites asteriodes 4440319.3 28371 M Coral 316,279 39,004 393
57 Porites compressa time
zero 4440376.3
28415
V Coral 39,270 2,772
58 Porites compressa
control 4440374.3
28417
V Coral 39,340 5,276
59 Porites compressa DOC 4440370.3 28421 V Coral 35,680 2,410
doi: 10.1038/nature06810 SUPPLEMENTARY INFORMATION
www.nature.com/nature 9
60 Porites compressa pH 4440371.3 28423 V Coral 50,364 2,710
61 Porites compressa
nutrients 4440377.3
28425
V Coral 34,433 2,338
62 Porites compressa
Temperature 4440375.3
28419
V Coral 39,036 2,141
63 Rio Mesquites 4440060.3 28351 M Microbialites 124,694 21,374 10
64 Highborne Cay 4440061.3 28383 M Microbialites 257,573 5,286 12
65 Pozas Azule II 4440067.3 28385 M Microbialites 326,146 36,468 61
66 Pozas Azules II 4440320.3 28355 V Microbialites 302,987 3,947
67 Rios Mesquites 4440321.3 28357 V Microbialites 328,656 14,561
68 Highborne Cay 4440323.3 28381 V Microbialites 150,223 3,063
69 Healthy fish slime 4440059.3 28393 M Fish 66,066 15,686 68
70 Morbid fish slime 4440066.3 28395 M Fish 82,442 20,635 147
71 Healthy fish gut 4440055.3 28389 M Fish 51,498 16,377 63
doi: 10.1038/nature06810 SUPPLEMENTARY INFORMATION
www.nature.com/nature 10
72 Morbid fish gut 4440056.3 28391 M Fish 60,311 17,996 91
73 Healthy fish slime 4440065.3 28401 V Fish 61,476 9,051
74 Morbid fish slime 4440064.3 28403 V Fish 60,111 13,826
75 Cow rumens pool
plankton 4440357.3
28611
M Terrestrial
Animals
236,830 38,626 313
76 Cow rumens 80F6 4440356.3
28605
M Terrestrial
Animals
178,713 29,989 240
77 Cow rumens 640F6 4440355.3
28607
M Terrestrial
Animals
264,849 39,775 386
78 Cow rumens 710 F 4440387.3
28609
M Terrestrial
Animals
345,317 130,089 757
79 Lean Mice 4440324.3
17401
M Terrestrial
Animals
49,074 8,688 42
80 Obese Mice 4440325.3
17401
M Terrestrial
Animals
35,053 9,161 37
81 Chicken cecum NCTC 4440367.3 28599 M Terrestrial 237,940 49,256 451
doi: 10.1038/nature06810 SUPPLEMENTARY INFORMATION
www.nature.com/nature 11
Animals
82 Chicken cecum
Uninfected 4440368.3
28597
M Terrestrial
Animals
294,682 83,912 533
83 Lung sputum Cystic
fibrosis patient 4440441.3
28441
V Terrestrial
Animals
92,223 7,946
84 Lung sputum
Healthy 4440442.4
28439
V Terrestrial
Animals
39,807 3,292
85 Mosquito
Oceanside Ca 4440052.3
28413
V Mosquito 340,098 97,269
86 Mosquito San Diego 4440053.3 28467 V Mosquito 657,204 232,886
87 Mosquito Mission Valley
Ca 4440054.3
28469
V Mosquito 615,576 112,761
doi: 10.1038/nature06810 SUPPLEMENTARY INFORMATION
www.nature.com/nature 12
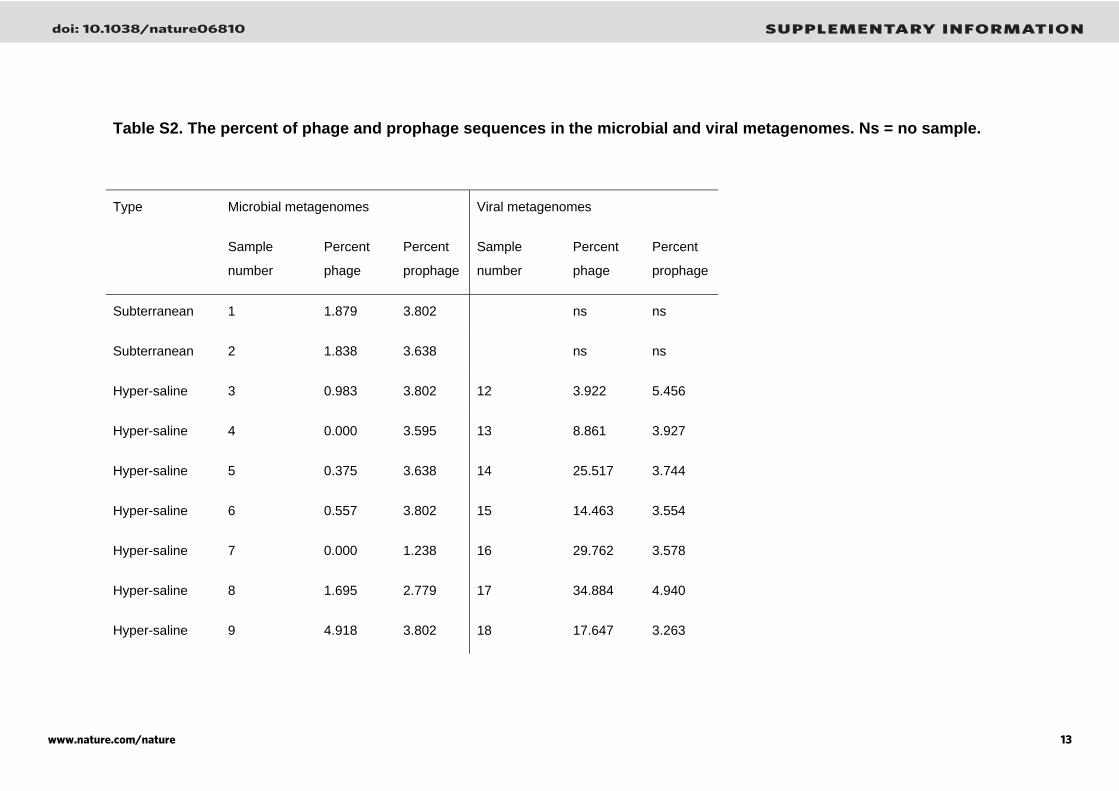
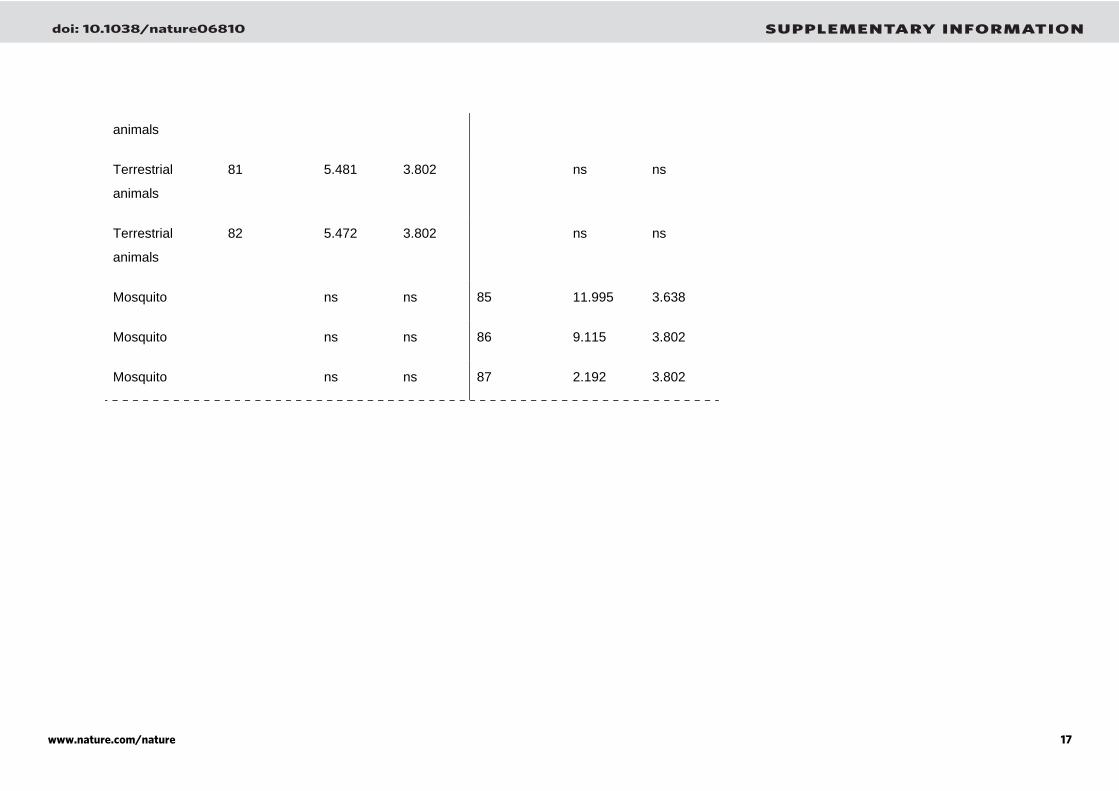
Table S2. The percent of phage and prophage sequences in the microbial and viral metagenomes. Ns = no sample.
Type Microbial metagenomes Viral metagenomes
Sample
number
Percent
phage
Percent
prophage
Sample
number
Percent
phage
Percent
prophage
Subterranean 1 1.879 3.802 ns ns
Subterranean 2 1.838 3.638 ns ns
Hyper-saline 3 0.983 3.802 12 3.922 5.456
Hyper-saline 4 0.000 3.595 13 8.861 3.927
Hyper-saline 5 0.375 3.638 14 25.517 3.744
Hyper-saline 6 0.557 3.802 15 14.463 3.554
Hyper-saline 7 0.000 1.238 16 29.762 3.578
Hyper-saline 8 1.695 2.779 17 34.884 4.940
Hyper-saline 9 4.918 3.802 18 17.647 3.263
doi: 10.1038/nature06810 SUPPLEMENTARY INFORMATION
www.nature.com/nature 13
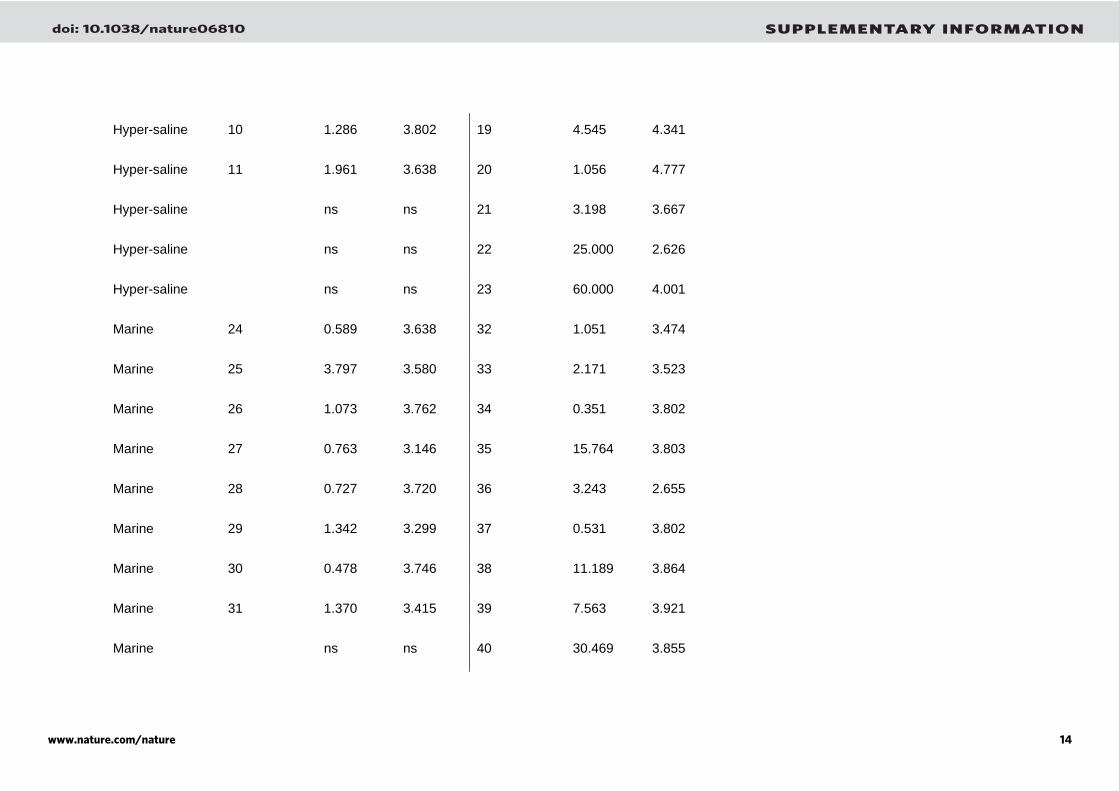
Hyper-saline 10 1.286 3.802 19 4.545 4.341
Hyper-saline 11 1.961 3.638 20 1.056 4.777
Hyper-saline ns ns 21 3.198 3.667
Hyper-saline ns ns 22 25.000 2.626
Hyper-saline ns ns 23 60.000 4.001
Marine 24 0.589 3.638 32 1.051 3.474
Marine 25 3.797 3.580 33 2.171 3.523
Marine 26 1.073 3.762 34 0.351 3.802
Marine 27 0.763 3.146 35 15.764 3.803
Marine 28 0.727 3.720 36 3.243 2.655
Marine 29 1.342 3.299 37 0.531 3.802
Marine 30 0.478 3.746 38 11.189 3.864
Marine 31 1.370 3.415 39 7.563 3.921
Marine ns ns 40 30.469 3.855
doi: 10.1038/nature06810 SUPPLEMENTARY INFORMATION
www.nature.com/nature 14
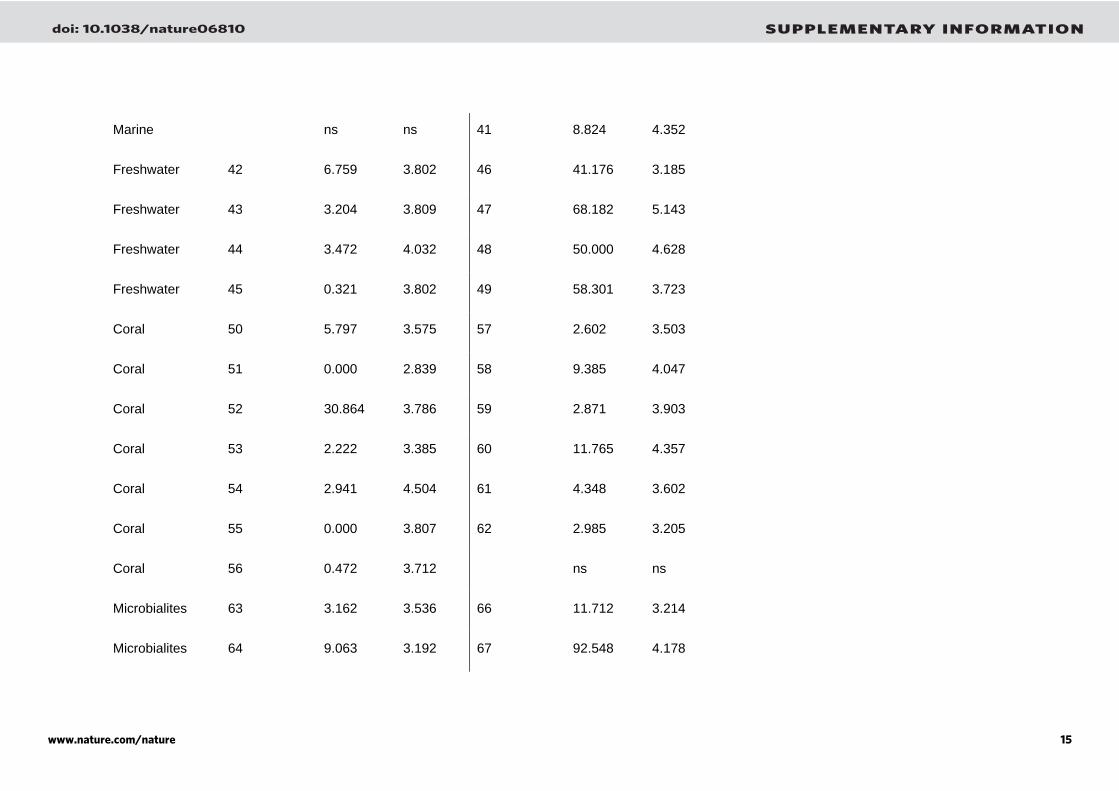
Marine ns ns 41 8.824 4.352
Freshwater 42 6.759 3.802 46 41.176 3.185
Freshwater 43 3.204 3.809 47 68.182 5.143
Freshwater 44 3.472 4.032 48 50.000 4.628
Freshwater 45 0.321 3.802 49 58.301 3.723
Coral 50 5.797 3.575 57 2.602 3.503
Coral 51 0.000 2.839 58 9.385 4.047
Coral 52 30.864 3.786 59 2.871 3.903
Coral 53 2.222 3.385 60 11.765 4.357
Coral 54 2.941 4.504 61 4.348 3.602
Coral 55 0.000 3.807 62 2.985 3.205
Coral 56 0.472 3.712 ns ns
Microbialites 63 3.162 3.536 66 11.712 3.214
Microbialites 64 9.063 3.192 67 92.548 4.178
doi: 10.1038/nature06810 SUPPLEMENTARY INFORMATION
www.nature.com/nature 15
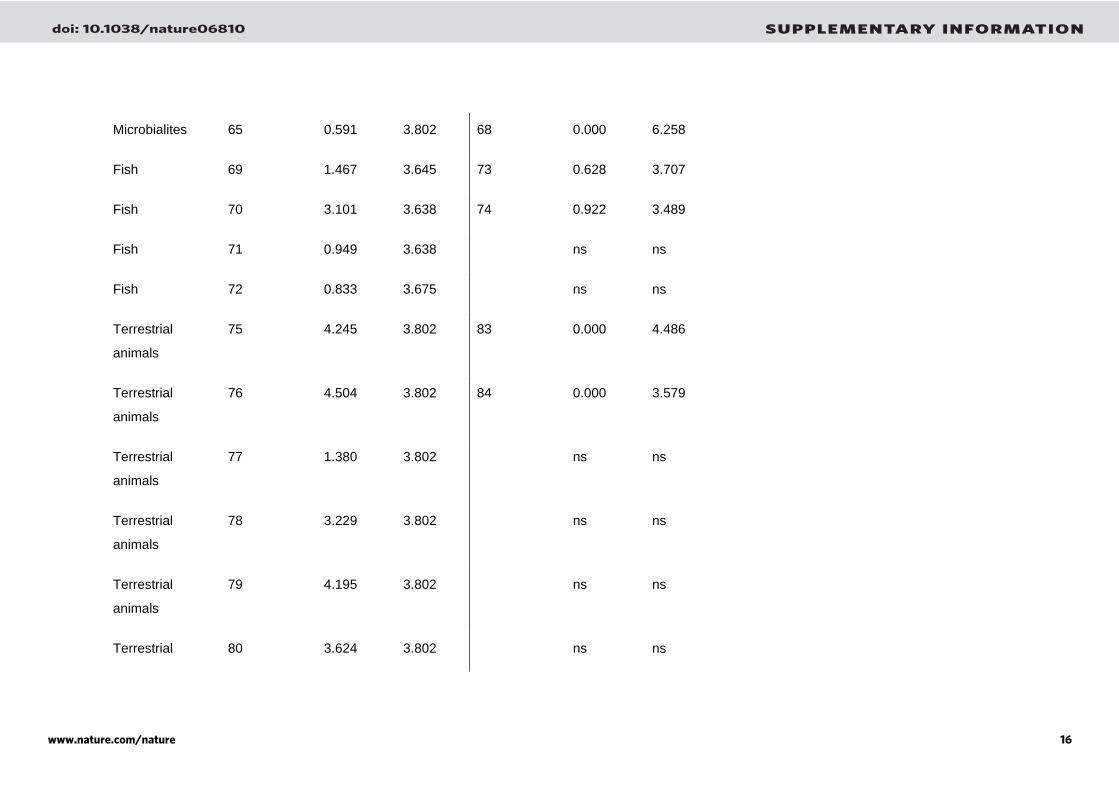
Microbialites 65 0.591 3.802 68 0.000 6.258
Fish 69 1.467 3.645 73 0.628 3.707
Fish 70 3.101 3.638 74 0.922 3.489
Fish 71 0.949 3.638 ns ns
Fish 72 0.833 3.675 ns ns
Terrestrial
animals
75 4.245 3.802 83 0.000 4.486
Terrestrial
animals
76 4.504 3.802 84 0.000 3.579
Terrestrial
animals
77 1.380 3.802 ns ns
Terrestrial
animals
78 3.229 3.802 ns ns
Terrestrial
animals
79 4.195 3.802 ns ns
Terrestrial 80 3.624 3.802 ns ns
doi: 10.1038/nature06810 SUPPLEMENTARY INFORMATION
www.nature.com/nature 16
animals
Terrestrial
animals
81 5.481 3.802 ns ns
Terrestrial
animals
82 5.472 3.802 ns ns
Mosquito ns ns 85 11.995 3.638
Mosquito ns ns 86 9.115 3.802
Mosquito ns ns 87 2.192 3.802
doi: 10.1038/nature06810 SUPPLEMENTARY INFORMATION
www.nature.com/nature 17

Table S3. The thirty most abundant motility and chemotaxis protein sequences found within the metagenomes, ordered with respect to the microbial metagenomes.
Motility proteins Microbial
metagenomes
Viral
metagenomes
Twitching motility protein PilT 0.033 0.023
Methyl-accepting chemotaxis protein I 0.029 0.033
Flagellar biosynthesis protein flhA 0.025 0.089
Chemotaxis protein CheA 0.018 0.059
Dipeptide-binding ABC transporter 0.018 0.064
Type II secretory pathway 0.017 0.008
Chemotaxis protein methyltransferase CheR 0.016 0.026
GldJ 0.015 0.005
Acetylornithine deacetylases 0.015 0.076
Flagellum-specific ATP synthase fliI 0.014 0.032
doi: 10.1038/nature06810 SUPPLEMENTARY INFORMATION
www.nature.com/nature 18
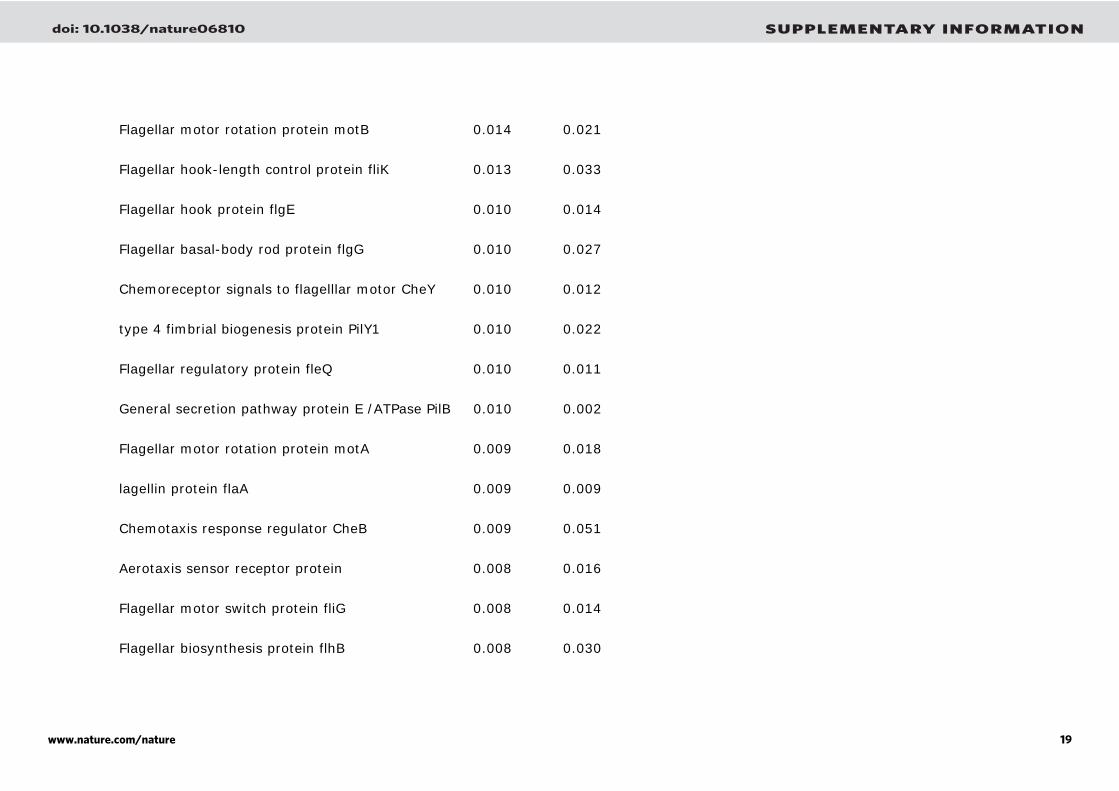
Flagellar motor rotation protein motB 0.014 0.021
Flagellar hook-length control protein fliK 0.013 0.033
Flagellar hook protein flgE 0.010 0.014
Flagellar basal-body rod protein flgG 0.010 0.027
Chemoreceptor signals to flagelllar motor CheY 0.010 0.012
type 4 fimbrial biogenesis protein PilY1 0.010 0.022
Flagellar regulatory protein fleQ 0.010 0.011
General secretion pathway protein E /ATPase PilB 0.010 0.002
Flagellar motor rotation protein motA 0.009 0.018
lagellin protein flaA 0.009 0.009
Chemotaxis response regulator CheB 0.009 0.051
Aerotaxis sensor receptor protein 0.008 0.016
Flagellar motor switch protein fliG 0.008 0.014
Flagellar biosynthesis protein flhB 0.008 0.030
doi: 10.1038/nature06810 SUPPLEMENTARY INFORMATION
www.nature.com/nature 19
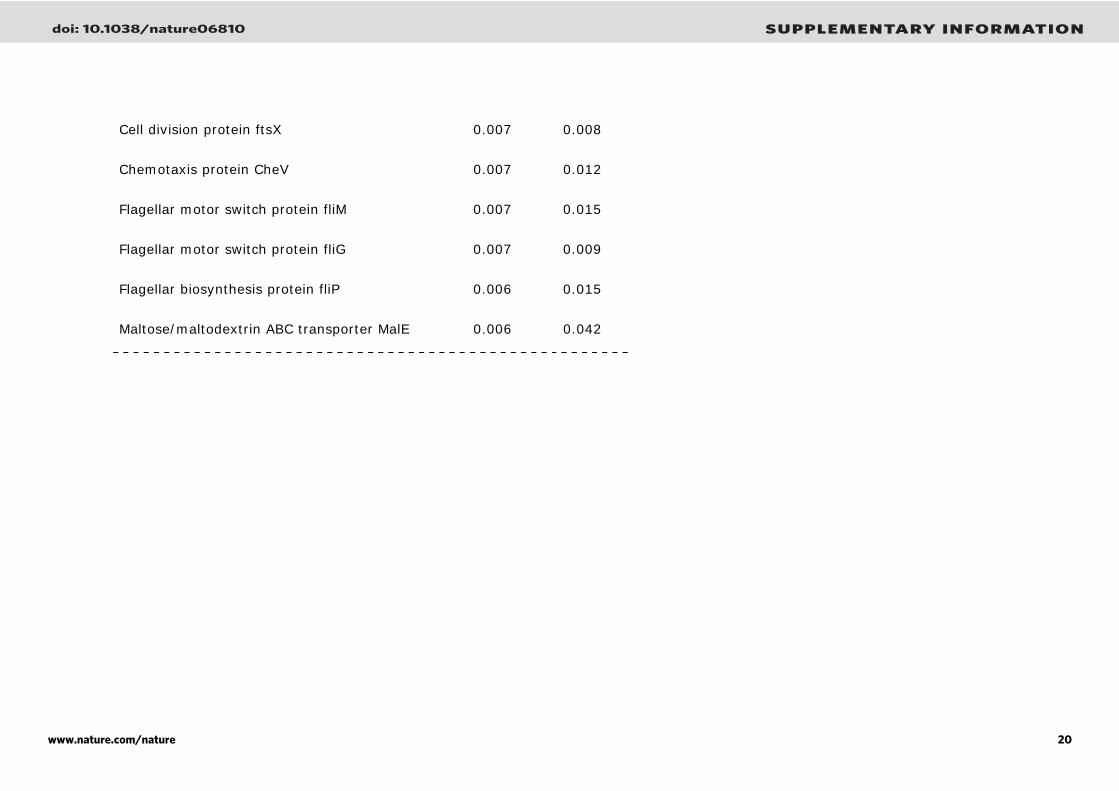
Cell division protein ftsX 0.007 0.008
Chemotaxis protein CheV 0.007 0.012
Flagellar motor switch protein fliM 0.007 0.015
Flagellar motor switch protein fliG 0.007 0.009
Flagellar biosynthesis protein fliP 0.006 0.015
Maltose/maltodextrin ABC transporter MalE 0.006 0.042
doi: 10.1038/nature06810 SUPPLEMENTARY INFORMATION
www.nature.com/nature 20
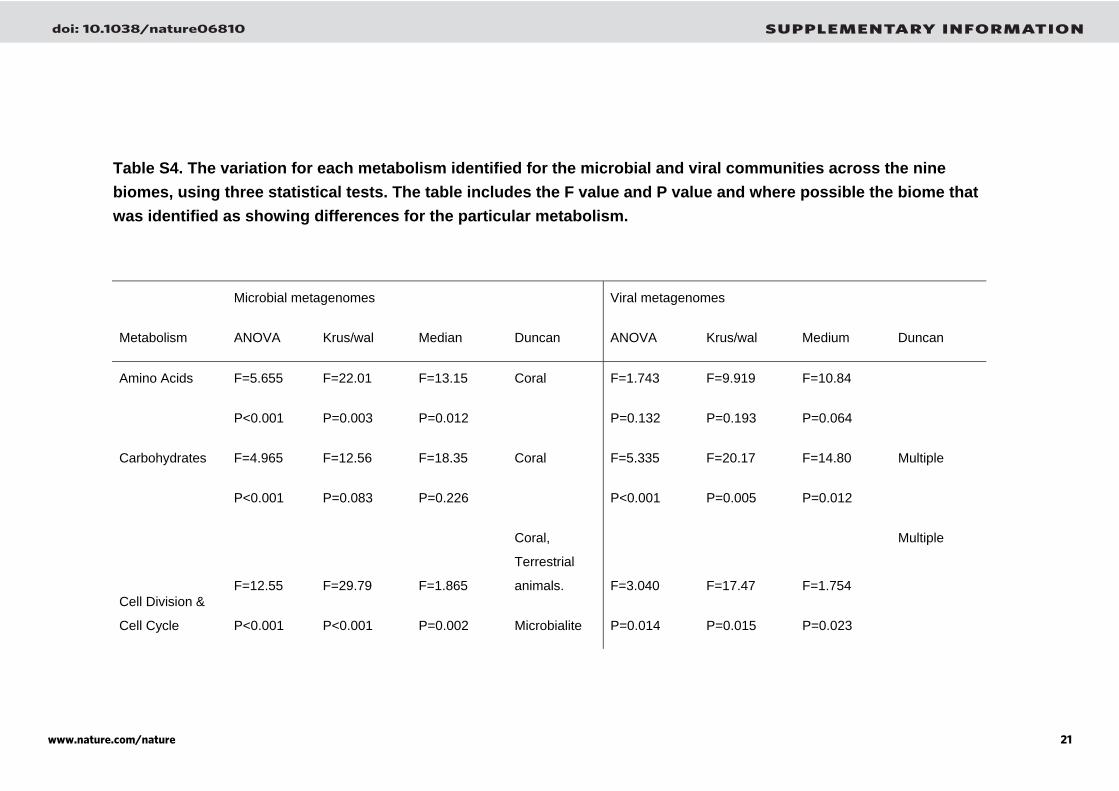
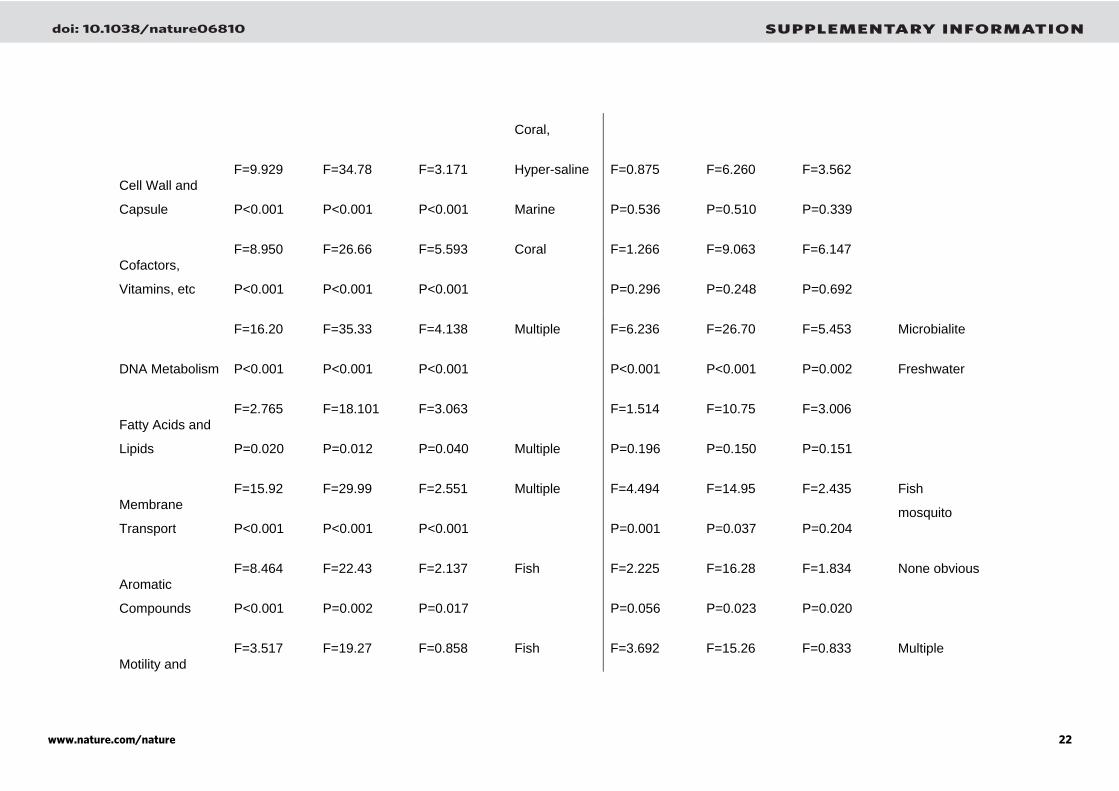
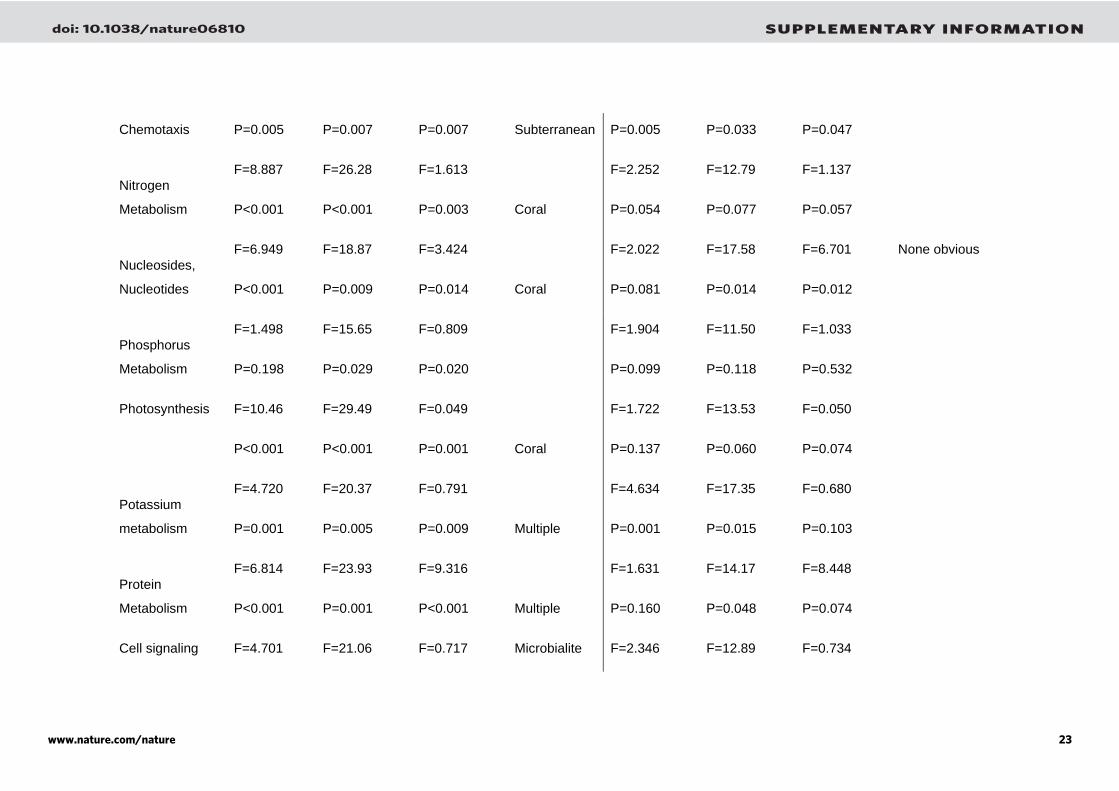
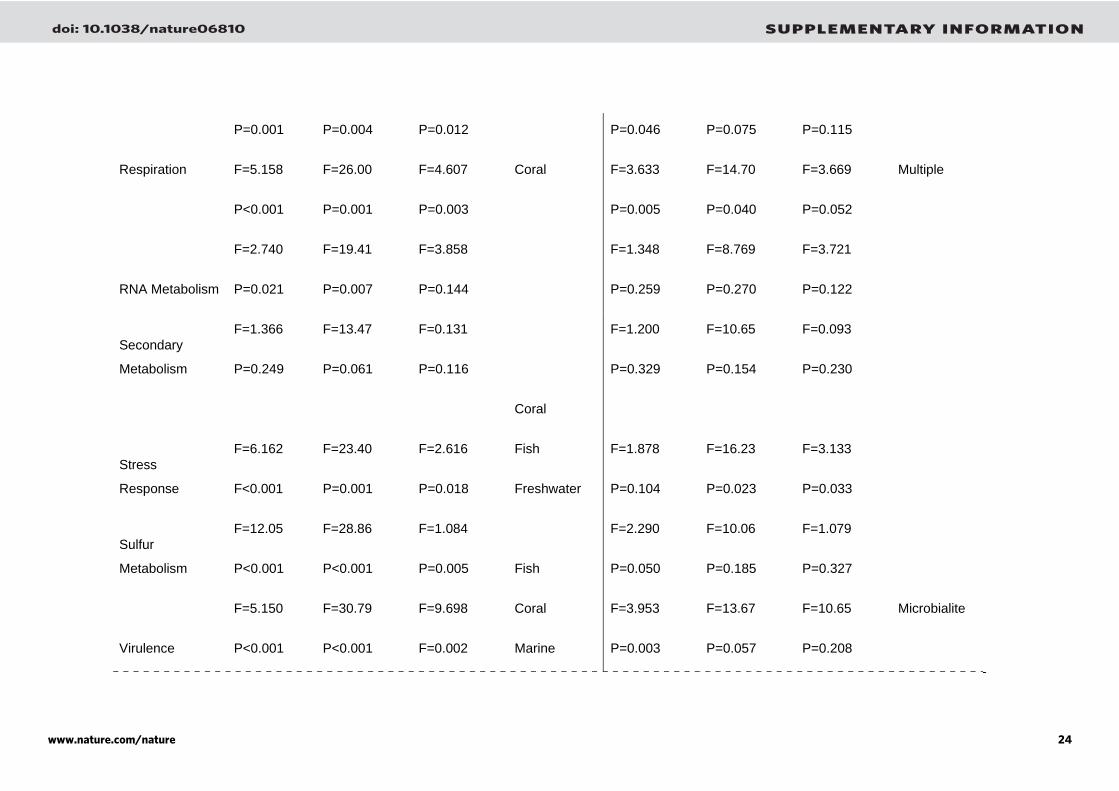
Table S4. The variation for each metabolism identified for the microbial and viral communities across the nine biomes, using three statistical tests. The table includes the F value and P value and where possible the biome that was identified as showing differences for the particular metabolism.
Microbial metagenomes Viral metagenomes
Metabolism ANOVA Krus/wal Median Duncan ANOVA Krus/wal Medium Duncan
Amino Acids
F=5.655
P<0.001
F=22.01
P=0.003
F=13.15
P=0.012
Coral
F=1.743
P=0.132
F=9.919
P=0.193
F=10.84
P=0.064
Carbohydrates
F=4.965
P<0.001
F=12.56
P=0.083
F=18.35
P=0.226
Coral
F=5.335
P<0.001
F=20.17
P=0.005
F=14.80
P=0.012
Multiple
Cell Division &
Cell Cycle
F=12.55
P<0.001
F=29.79
P<0.001
F=1.865
P=0.002
Coral,
Terrestrial
animals.
Microbialite
F=3.040
P=0.014
F=17.47
P=0.015
F=1.754
P=0.023
Multiple
doi: 10.1038/nature06810 SUPPLEMENTARY INFORMATION
www.nature.com/nature 21
Cell Wall and
Capsule
F=9.929
P<0.001
F=34.78
P<0.001
F=3.171
P<0.001
Coral,
Hyper-saline
Marine
F=0.875
P=0.536
F=6.260
P=0.510
F=3.562
P=0.339
Cofactors,
Vitamins, etc
F=8.950
P<0.001
F=26.66
P<0.001
F=5.593
P<0.001
Coral
F=1.266
P=0.296
F=9.063
P=0.248
F=6.147
P=0.692
DNA Metabolism
F=16.20
P<0.001
F=35.33
P<0.001
F=4.138
P<0.001
Multiple
F=6.236
P<0.001
F=26.70
P<0.001
F=5.453
P=0.002
Microbialite
Freshwater
Fatty Acids and
Lipids
F=2.765
P=0.020
F=18.101
P=0.012
F=3.063
P=0.040 Multiple
F=1.514
P=0.196
F=10.75
P=0.150
F=3.006
P=0.151
Membrane
Transport
F=15.92
P<0.001
F=29.99
P<0.001
F=2.551
P<0.001
Multiple
F=4.494
P=0.001
F=14.95
P=0.037
F=2.435
P=0.204
Fish
mosquito
Aromatic
Compounds
F=8.464
P<0.001
F=22.43
P=0.002
F=2.137
P=0.017
Fish
F=2.225
P=0.056
F=16.28
P=0.023
F=1.834
P=0.020
None obvious
Motility and F=3.517 F=19.27 F=0.858 Fish F=3.692 F=15.26 F=0.833 Multiple
doi: 10.1038/nature06810 SUPPLEMENTARY INFORMATION
www.nature.com/nature 22
Chemotaxis P=0.005 P=0.007 P=0.007 Subterranean P=0.005 P=0.033 P=0.047
Nitrogen
Metabolism
F=8.887
P<0.001
F=26.28
P<0.001
F=1.613
P=0.003 Coral
F=2.252
P=0.054
F=12.79
P=0.077
F=1.137
P=0.057
Nucleosides,
Nucleotides
F=6.949
P<0.001
F=18.87
P=0.009
F=3.424
P=0.014 Coral
F=2.022
P=0.081
F=17.58
P=0.014
F=6.701
P=0.012
None obvious
Phosphorus
Metabolism
F=1.498
P=0.198
F=15.65
P=0.029
F=0.809
P=0.020
F=1.904
P=0.099
F=11.50
P=0.118
F=1.033
P=0.532
Photosynthesis
F=10.46
P<0.001
F=29.49
P<0.001
F=0.049
P=0.001 Coral
F=1.722
P=0.137
F=13.53
P=0.060
F=0.050
P=0.074
Potassium
metabolism
F=4.720
P=0.001
F=20.37
P=0.005
F=0.791
P=0.009 Multiple
F=4.634
P=0.001
F=17.35
P=0.015
F=0.680
P=0.103
Protein
Metabolism
F=6.814
P<0.001
F=23.93
P=0.001
F=9.316
P<0.001 Multiple
F=1.631
P=0.160
F=14.17
P=0.048
F=8.448
P=0.074
Cell signaling F=4.701 F=21.06 F=0.717 Microbialite F=2.346 F=12.89 F=0.734
doi: 10.1038/nature06810 SUPPLEMENTARY INFORMATION
www.nature.com/nature 23
P=0.001 P=0.004 P=0.012 P=0.046 P=0.075 P=0.115
Respiration
F=5.158
P<0.001
F=26.00
P=0.001
F=4.607
P=0.003
Coral
F=3.633
P=0.005
F=14.70
P=0.040
F=3.669
P=0.052
Multiple
RNA Metabolism
F=2.740
P=0.021
F=19.41
P=0.007
F=3.858
P=0.144
F=1.348
P=0.259
F=8.769
P=0.270
F=3.721
P=0.122
Secondary
Metabolism
F=1.366
P=0.249
F=13.47
P=0.061
F=0.131
P=0.116
F=1.200
P=0.329
F=10.65
P=0.154
F=0.093
P=0.230
Stress
Response
F=6.162
F<0.001
F=23.40
P=0.001
F=2.616
P=0.018
Coral
Fish
Freshwater
F=1.878
P=0.104
F=16.23
P=0.023
F=3.133
P=0.033
Sulfur
Metabolism
F=12.05
P<0.001
F=28.86
P<0.001
F=1.084
P=0.005 Fish
F=2.290
P=0.050
F=10.06
P=0.185
F=1.079
P=0.327
Virulence
F=5.150
P<0.001
F=30.79
P<0.001
F=9.698
F=0.002
Coral
Marine
F=3.953
P=0.003
F=13.67
P=0.057
F=10.65
P=0.208
Microbialite
doi: 10.1038/nature06810 SUPPLEMENTARY INFORMATION
www.nature.com/nature 24
Equator
Tropic of Cancer
Arctic Circle
Pacific Ocean
Atlantic Ocean
2
0�
20�
40�
60�
80�
Subterranean MarineHyper-salineFreshwaterCoralMicrobialiteFishTerrestrial AnimalsMosquito
66
2
65
242
44
4912
3
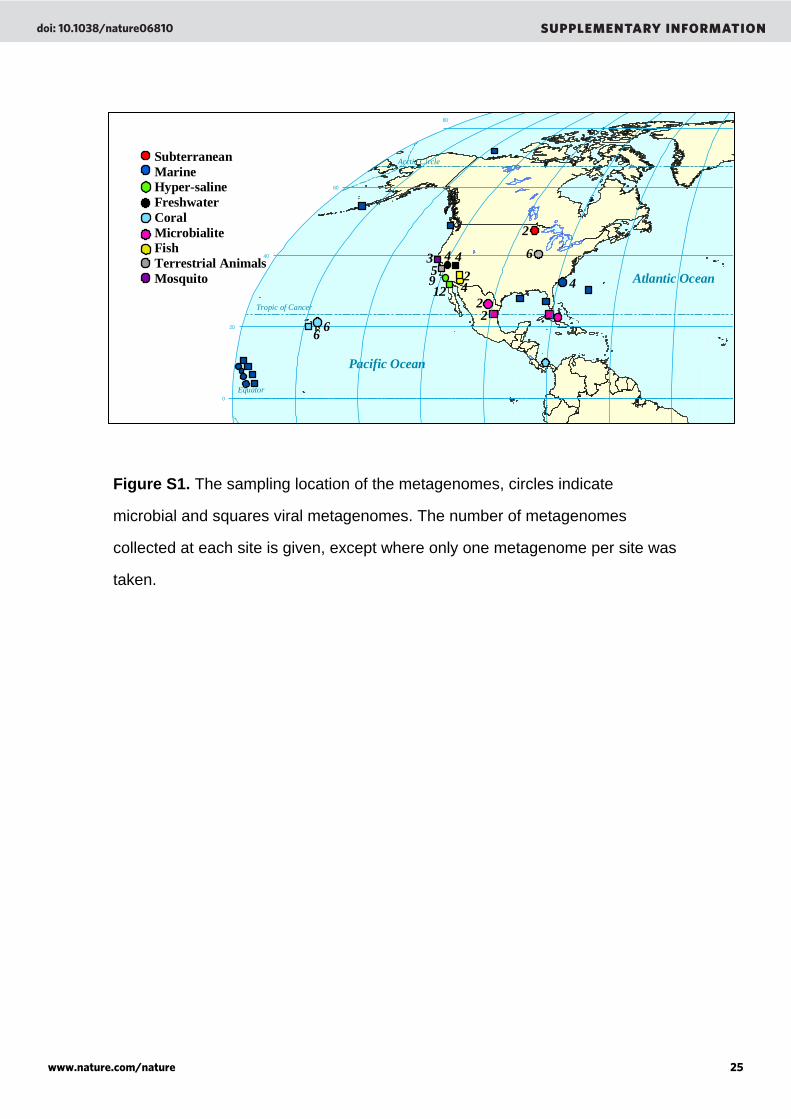
Figure S1. The sampling location of the metagenomes, circles indicate
microbial and squares viral metagenomes. The number of metagenomes
collected at each site is given, except where only one metagenome per site was
taken.
doi: 10.1038/nature06810 SUPPLEMENTARY INFORMATION
www.nature.com/nature 25
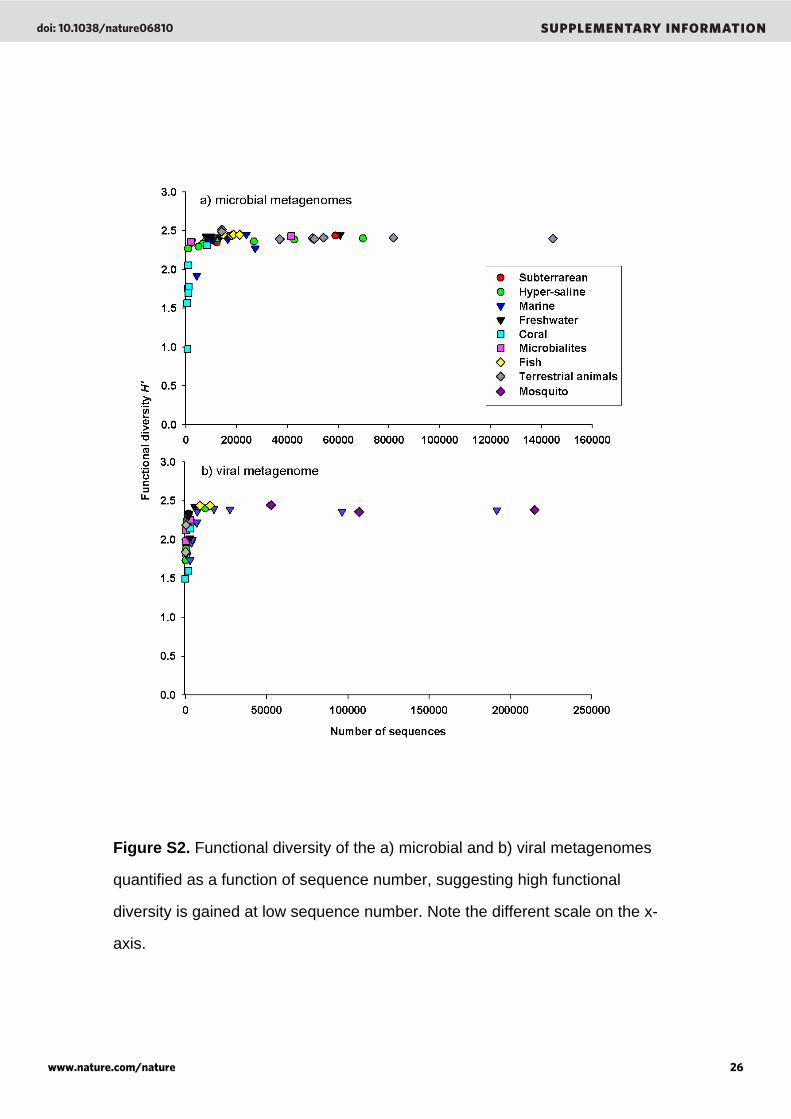
Figure S2. Functional diversity of the a) microbial and b) viral metagenomes
quantified as a function of sequence number, suggesting high functional
diversity is gained at low sequence number. Note the different scale on the x-
axis.
doi: 10.1038/nature06810 SUPPLEMENTARY INFORMATION
www.nature.com/nature 26
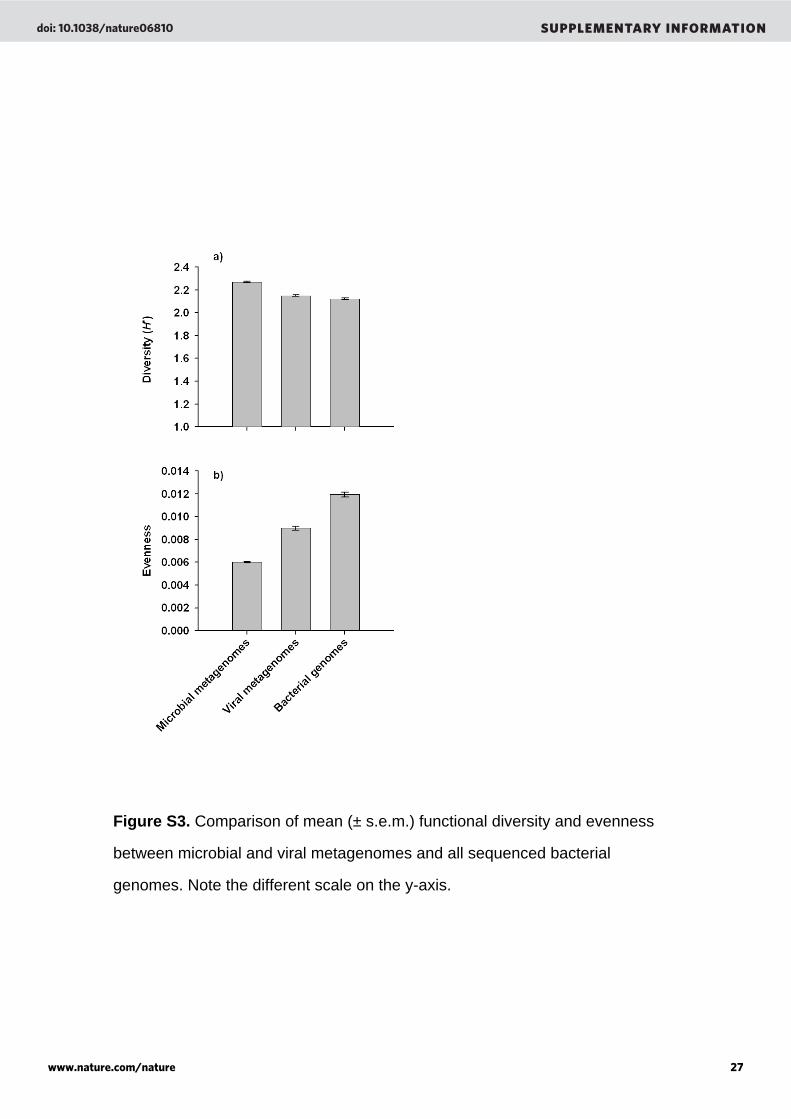
Figure S3. Comparison of mean (± s.e.m.) functional diversity and evenness
between microbial and viral metagenomes and all sequenced bacterial
genomes. Note the different scale on the y-axis.
doi: 10.1038/nature06810 SUPPLEMENTARY INFORMATION
www.nature.com/nature 27
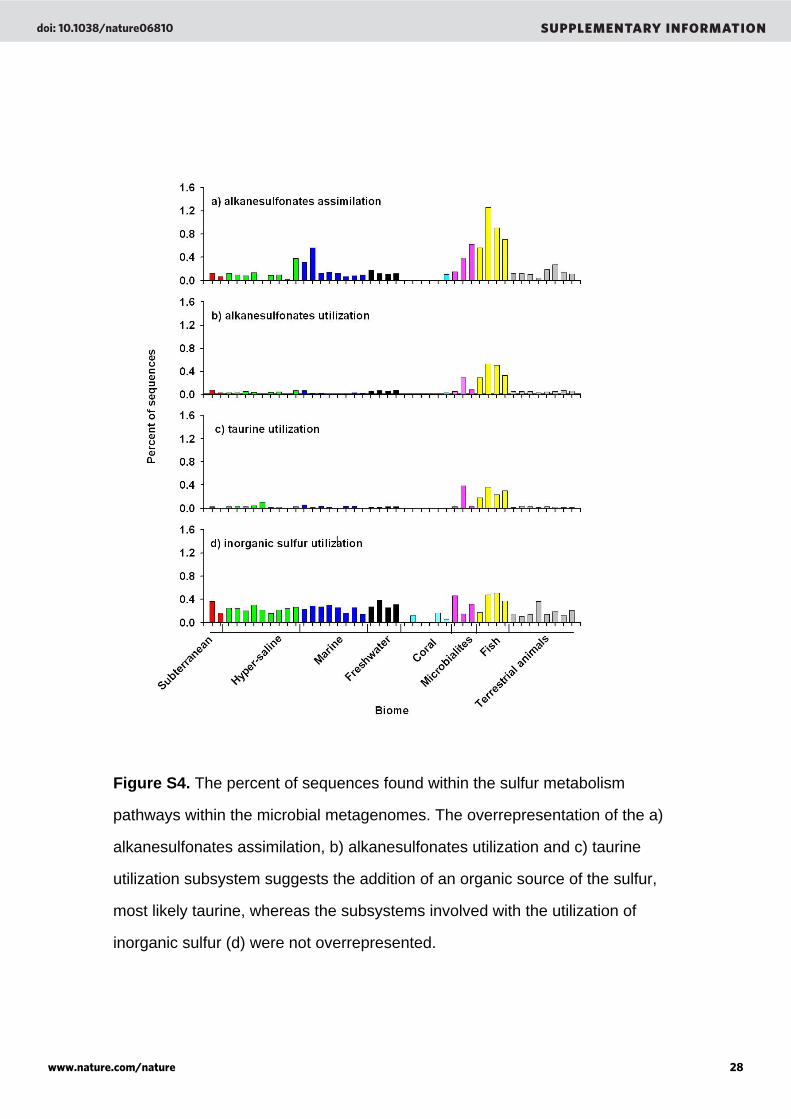
Figure S4. The percent of sequences found within the sulfur metabolism
pathways within the microbial metagenomes. The overrepresentation of the a)
alkanesulfonates assimilation, b) alkanesulfonates utilization and c) taurine
utilization subsystem suggests the addition of an organic source of the sulfur,
most likely taurine, whereas the subsystems involved with the utilization of
inorganic sulfur (d) were not overrepresented.
doi: 10.1038/nature06810 SUPPLEMENTARY INFORMATION
www.nature.com/nature 28
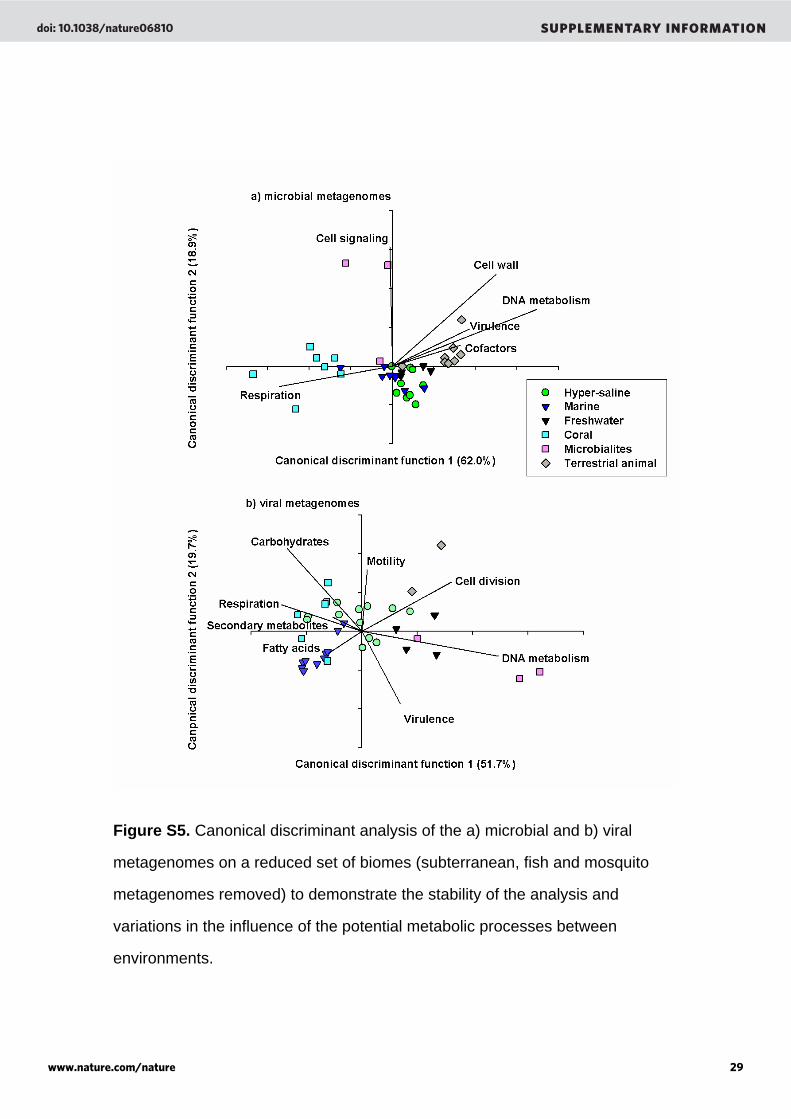
Figure S5. Canonical discriminant analysis of the a) microbial and b) viral
metagenomes on a reduced set of biomes (subterranean, fish and mosquito
metagenomes removed) to demonstrate the stability of the analysis and
variations in the influence of the potential metabolic processes between
environments.
doi: 10.1038/nature06810 SUPPLEMENTARY INFORMATION
www.nature.com/nature 29
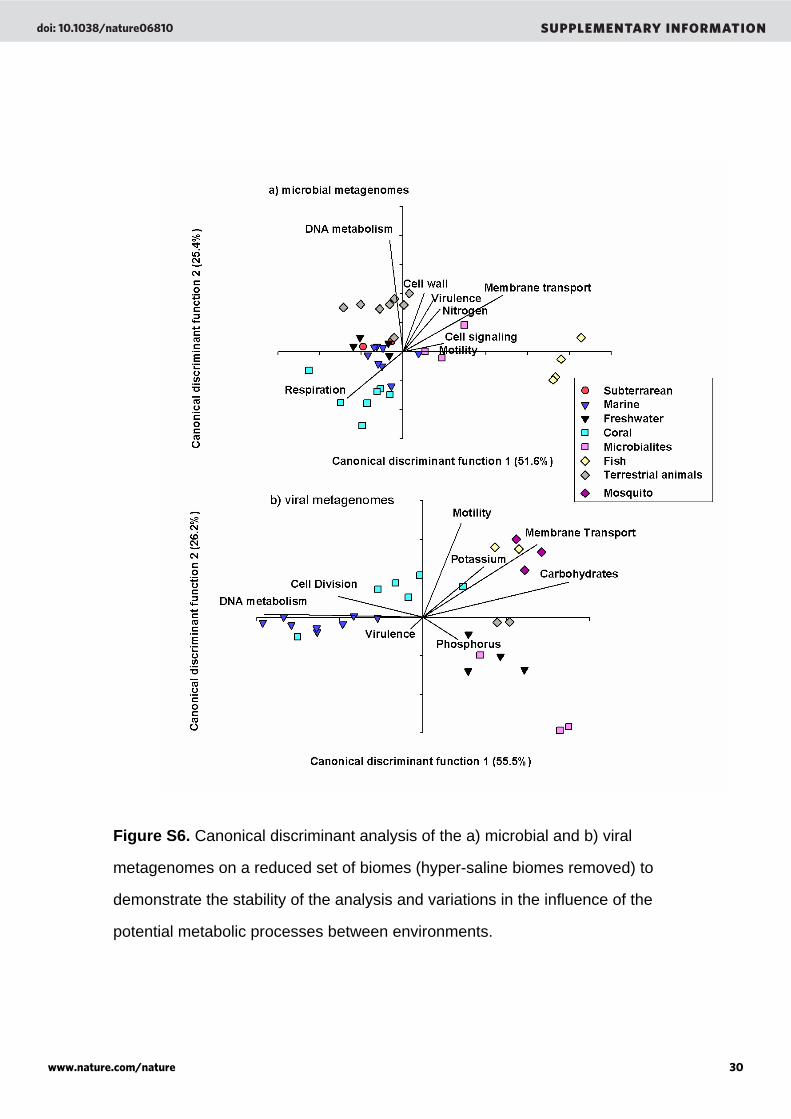
Figure S6. Canonical discriminant analysis of the a) microbial and b) viral
metagenomes on a reduced set of biomes (hyper-saline biomes removed) to
demonstrate the stability of the analysis and variations in the influence of the
potential metabolic processes between environments.
doi: 10.1038/nature06810 SUPPLEMENTARY INFORMATION
www.nature.com/nature 30


![[6810 - 17105]estatisticaI (1)](https://static.fdocuments.net/doc/165x107/5572016f4979599169a19437/6810-17105estatisticai-1.jpg)


