6791 GEN Streets Ahead, GHCI Mar 2013 Layout 1
20
Streets Ahead Genworth Homebuyer Confidence Index March 2013 Sixth Edition
Transcript of 6791 GEN Streets Ahead, GHCI Mar 2013 Layout 1

Streets AheadGenworth Homebuyer Confidence Index
March 2013 Sixth Edition

Contents
Key research findings .....................................................................1
About the Genworth Homebuyer Confidence Index ..............2
Main themes....................................................................................3
Economic indicators ......................................................................14
Future outlook................................................................................15
About Genworth and RFi .............................................................16
Charts
Chart 1: Genworth Homebuyer Confidence Index...............................2
Chart 2: Genworth Homebuyer Confidence Index—
by borrower segment .................................................................................3
Chart 3: First homebuyers in the property market...................................4
Chart 4: Percentage of potential first homebuyers who find each
property appealing.......................................................................................5
Chart 5: Percentage of first homebuyers who spent more than
five years saving for a deposit .....................................................................5
Chart 6: First homebuyer deposit size as a proportion of the
value of the property ...................................................................................6
Chart 7: Percentage experiencing difficulty meeting repayments
in some or all months ..................................................................................8
Chart 8: Top drivers of mortgage stress....................................................9
Chart 9: For those who found it difficult to meet mortgage
repayments, which of the following statements are true?.......................9
Chart 10: Genworth Homebuyer Confidence Index—by state ...........10
Chart 11: Reasons surveyed Australians are planning to invest
in property in the next 12 months..............................................................12
Chart 12: SMSFs by number of members................................................13
Tables
Changes to first homebuyer incentives......................................................7
Key economic indicators .............................................................................14genworth.com.au/streetsahead

Welcome to the sixth edition of the Genworth Homebuyer
Confidence Index (Genworth HCI) which measures the
sentiment of Australian mortgage holders and would-be
mortgage holders about their own mortgage and the overall
mortgage market.
In this March issue, the key findings include:
• National homebuyer confidence reaches post-GFC low:
TheGenworthHCIdecreased5.1%from98.4to93.4, its lowest
level since 2008, following a rise in September 2012 of 2.2%.
• Australians are continuing to focus on paying down debt:
The biggest change in Index factors between September
2012 and March 2013 related to mortgage stress, with the
proportion who had experienced difficulty increasing from
18% to 23%. The proportion of surveyed homebuyers who
would be comfortable borrowing more than 80% of the
value of a property also fell, from 32% in September 2012
to 28% in March 2013, reflecting many Australians’ growing
discomfort with debt.
• Changes to First Home Owners Grant in Queensland and
New South Wales hurt first homebuyer sentiment: After
rising to 54% in September 2012, the proportion of surveyed
first homebuyers (FHBs) who believe it is a good time to buy
fell to 49% in March 2013, following the removal of the First
Home Owners Grant (FHOG) on established dwellings in
some states late last year.
• First homebuyers see dramatic fall in confidence: Overall,
the FHB Index fell by 12.8%, from 98.5 to 85.9, between
September 2012 and March 2013, largely due to increases
in mortgage stress, driven by over commitment and concerns
about unemployment.
• Western Australia stays in front despite falls in confidence
across all states: Western Australia had a smaller than
average decrease in confidence and held on to its lead, with
surveyed Western Australian borrowers being the least
likely to have experienced, or expected, difficulty meeting
repayments in March 2013. New South Wales saw the
largest fall in confidence and the biggest decrease in the
proportion of FHBs who believe it is a good time to buy.
• Prospective investors well placed to invest: Between
September 2012 and January 2013 investment housing
lending outpaced owner-occupier lending, according to the
ABS, suggesting that sentiment is stronger among investors
than homebuyers. Surveyed prospective investors were in
a good position to buy property, as they had a higher
income than the national average, with 50% having an
annual household income of over $100,000, compared to
the average of 32% among all surveyed homebuyers.
Prospective investors are also less indebted than the
average surveyed Australian.
• Concerns about unemployment and underemployment
drive increase in stress: The drivers of mortgage stress
that saw the largest growth between September 2012 and
March2013wererelatedtoemployment,withunemployment/
redundancy, and underemployment (change of job from full-
time to part-time), increasing by 12% and 32%, respectively.
Unemployment (at 24%) overtook ‘other debt obligations’
to become the second largest driver of mortgage stress in
March 2013 behind higher cost of living (52%), and interest
rates was pushed out of the top five drivers.
• SMSFs are increasing their property exposure: Almost one
in five (18%) of surveyed SMSF holders have a mortgage
through their fund, with the majority of these mortgages
(75%) secured on residential property. Just over half (59%)
of all mortgages were held in multiple member funds.
Key research findings
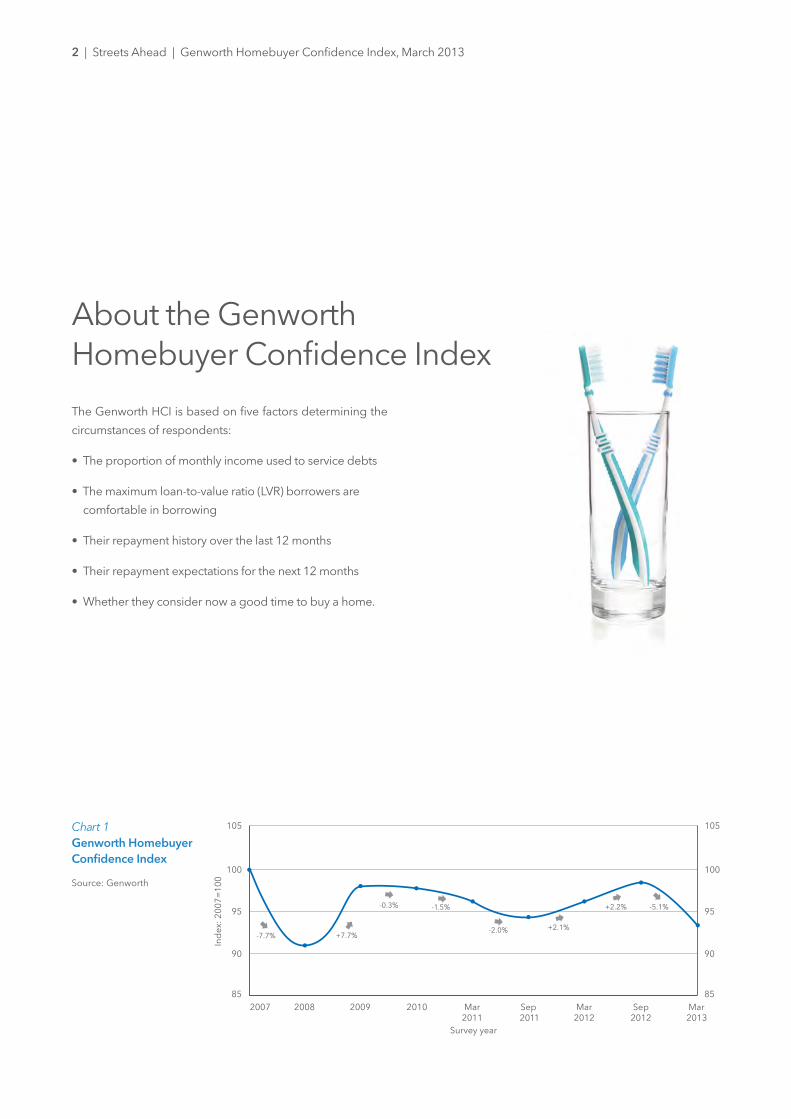
The Genworth HCI is based on five factors determining the
circumstances of respondents:
• The proportion of monthly income used to service debts
• The maximum loan-to-value ratio (LVR) borrowers are
comfortable in borrowing
• Their repayment history over the last 12 months
• Their repayment expectations for the next 12 months
• Whether they consider now a good time to buy a home.
2 | Streets Ahead | Genworth Homebuyer Confidence Index, March 2013
About the Genworth Homebuyer Confidence Index
2007 2008 2009 2010 Mar Sep Mar Sep Mar 2011 2011 2012 2012 2013
Survey year
Ind
ex: 2
007=
100
105
100
95
90
85
105
100
95
90
85
Æ-7.7%
Æ-5.1%
Æ
+7.7%
Æ-0.3%
Æ-1.5%
Æ-2.0%
Æ+2.1%
Æ+2.2%
Chart 1Genworth HomebuyerConfidence Index
Source: Genworth
Renewed uncertainty leads to focus on paying down debt
• The fall in the Genworth HCI (see Chart 1) was largely driven
by increases in both experience and expectation of mortgage
stress and a decrease in the proportion of surveyed people
comfortable borrowing more than 80% of the value of
their property.
• According to RBA data, the ratio of household debt to
disposable income has been falling since the GFC, with
borrowers focusing on paying off their liabilities faster. The
RBA has noted that in recent years Australians have been
overpaying on their mortgages, perhaps leaving their
repayment amounts unchanged despite the falls in interest
rates. Now, with increased pressure on households who
are concerned about future unemployment and under -
employment, households capacity to meet these higher
repayments may be shrinking, causing Australians to
become more concerned over the debt that they hold
despite the repayment ‘buffer’ reported by the RBA created
from past overpayments.
• Demand for credit has also been falling, with external
bureau data showing that mortgage applications have fallen
sharply since December 2009, with mortgage demand flat
in the past six months. As Australians look to deleverage,
they have become more wary about taking on new credit.
Focused on paying down existing debts, they are less likely
to borrow over 80% LVR. Concern about the potential for
capital growth may also be making Australians think twice
before taking out high LVR mortgages.
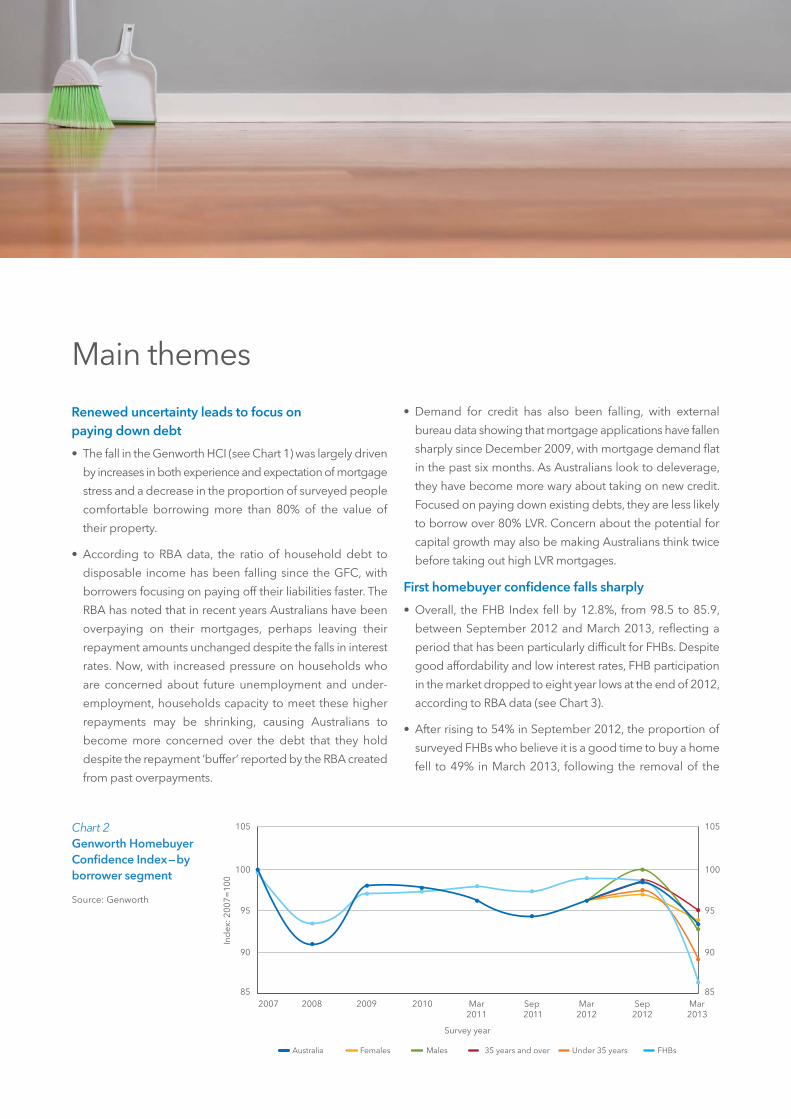
First homebuyer confidence falls sharply
• Overall, the FHB Index fell by 12.8%, from 98.5 to 85.9,
between September 2012 and March 2013, reflecting a
period that has been particularly difficult for FHBs. Despite
good affordability and low interest rates, FHB participation
in the market dropped to eight year lows at the end of 2012,
according to RBA data (see Chart 3).
• After rising to 54% in September 2012, the proportion of
surveyed FHBs who believe it is a good time to buy a home
fell to 49% in March 2013, following the removal of the
Main themes
Australia Females Males 35 years and over Under 35 years FHBs
Ind
ex: 2
007=
100
105
100
95
90
85
Survey year
2007 2008 2009 2010 Mar Sep Mar Sep Mar 2011 2011 2012 2012 2013
105
100
95
90
85
Chart 2Genworth HomebuyerConfidence Index—byborrower segment
Source: Genworth
FHOG on established homes in some states late last year.
New South Wales saw the largest fall in the proportion of
FHBs who believe it is a good time to buy, down from 50%
to 38%.
• The proportion of recent FHBs (those who bought their first
home in the past year) surveyed who had experienced
mortgage stress in the last 12 months rose from 13% to 29%
in March 2013. While a higher cost of living and interest
rates rises were again cited as the top two reasons for
difficulty amongst FHBs who struggled to meet repayments,
theydeclined—from75%to30%and42%to24%,respectively.
The decrease in these traditionally strong drivers of
mortgage stress was offset by a sharp increase in the
proportion of struggling FHBs who cited over commitment
(from 4% to 18%) and unemployment (from 8% to 15%) as
a cause of hardship. The proportion expecting difficulty in
the coming year rose from 18% to 41%. Recent FHBs have
traditionally been more pessimistic about their future ability
to meet repayments than their past ability to meet repayments,
suggesting that they overestimate future mortgage stress.
Prospective FHBs were also more concerned about their
ability to meet repayments, with 12% citing inability to meet
mortgage repayments as the reason they haven’t bought a
home yet, up from 5% in September 2012.
• The sharp rise in the proportion of surveyed FHBs
experiencing and anticipating hardship follows the removal
of FHB incentives on established dwellings in New South
Wales and Queensland, which went into effect in October
2012. Amongst FHBs in Queensland, over-commitment/
borrowing was cited as the main reason for expecting
mortgage stress. There was a large increase in the proportion
of FHBs who cited fixing interest rates when they were at their
highest as a reason for mortgage stress (from 0% to 6%),
suggesting that rather than alleviating mortgage stress,
FHBs may feel that they have missed out on the benefit of
recent rate cuts.
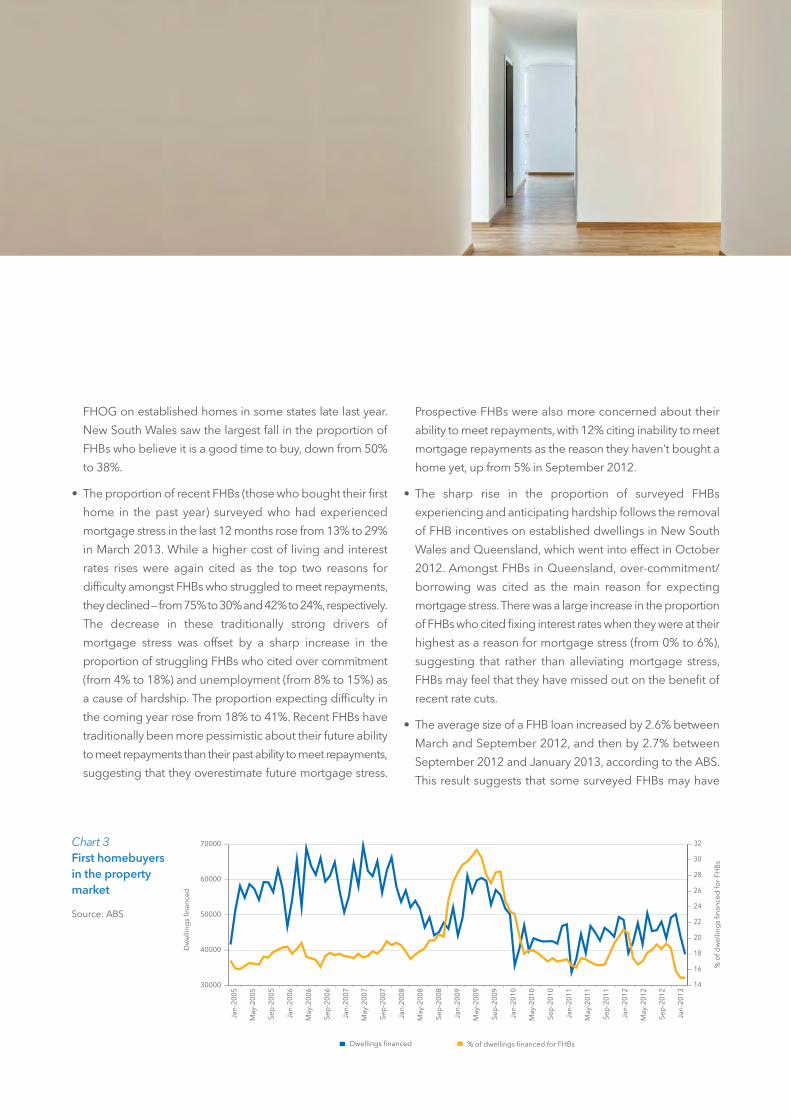
• The average size of a FHB loan increased by 2.6% between
March and September 2012, and then by 2.7% between
September 2012 and January 2013, according to the ABS.
This result suggests that some surveyed FHBs may have
Dw
ellin
gs
finan
ced
30000
40000
50000
60000
70000
Jan-
2005
May
-200
5
Sep
-200
5
Jan-
2006
May
-200
6
Sep
-200
6
Jan-
2007
May
-200
7
Sep
-200
7
Jan-
2008
May
-200
8
Sep
-200
8
Jan-
2009
May
-200
9
Sep
-200
9
Jan-
2010
May
-201
0
Sep
-201
0
Jan-
2011
May
-201
1
Sep
-201
1
Jan-
2012
May
-201
2
Sep
-201
2
Jan-
2013
% o
f dw
ellin
gs
finan
ced
for
FHB
s
14
32
30
28
26
24
22
20
18
16
Dwellings financed % of dwellings financed for FHBs
Chart 3First homebuyersin the propertymarket
Source: ABS

over-committed themselves financially in order to take
advantage of the grant before it was phased out, or that they
may need to take out larger loans to buy a home without
the added help of the FHOG leading to increased levels of
stress servicing the mortgage.
• The increase in mortgage stress comes despite FHBs
managing their debt better, as the proportion of surveyed
FHBs who were spending more than 50% of their income
on servicing debt fell from 28% to 25% between surveys,
and the proportion who were comfortable borrowing more
than 80% of the value of a property increased slightly, from
26% to 27%.
High aspirations lead mortgage stress for FHBs
• High aspirations in terms of property may be holding FHBs
back from entering the property market, and contributing
to affordability woes. The most popular property type
among surveyed respondents was a house, which 78% of
potential FHBs surveyed found appealing (up from 66% in
September 2012), followed by a coastal property (42%) and
a large property (38%) (see Chart 4). Potential FHBs were
slightly less likely to find an apartment or studio apartment
appealing in March 2013 than they were in September 2012.
• Compared to six months ago, potential FHBs surveyed in
March 2013 were more concerned about living in a desirable
area despite the cost. The proportion of prospective FHBs
surveyed saying they would buy in another area and hope
to buy in their desired area in a few years halved, down to
17%. On the other hand, the proportion of prospective
FHBs surveyed preferring to save longer so that they could
purchase in their desired area was up by 85%, to just over
one in five. Moreover, 77% of surveyed FHBs in March 2013
would be willing to pay more to stay in their desired area,
compared to 71% in September 2012.
• Forty per cent of prospective FHBs surveyed anticipate
needing less than 10% of the value of the property to put
towards a deposit, the lowest level since the 1990s (see
chart 6), while 26% expect to need a deposit of over 20% of
the value of the property. The move away from smaller
Streets Ahead | Genworth Homebuyer Confidence Index, March 2013 | 5
100%
90%
80%
70%
60%
50%
40%
30%
20%
10%
0%
100%
90%
80%
70%
60%
50%
40%
30%
20%
10%
0%House Large
propertyCoastal
propertySmall
propertyTownhouse Apartment VillaRural
propertyDuplex Studio
apartmentA fixer-upper
66%
78%
40% 38% 39%42%
36%
32% 34% 33% 33%29% 26% 27%
25% 23% 24% 25% 23% 24%18%
14%
Sep 2012 Mar 2013
Chart 4Percentage of potential first homebuyers who findeach property appealing
Source: Genworth
Potential FHBs—anticipated time
2013-2014
2010-2013
2005-2009
2000-2004
1995-1999
1990-1994
1985-1989
1980-1984
1975-1979
1970-1974
Pre-1
970
Year of purchase
0%
5%
10%
15%
20%
25%
Historic FHBs
Chart 5Percentage of firsthomebuyers who spentmore than five years saving for a deposit
Source: Genworth
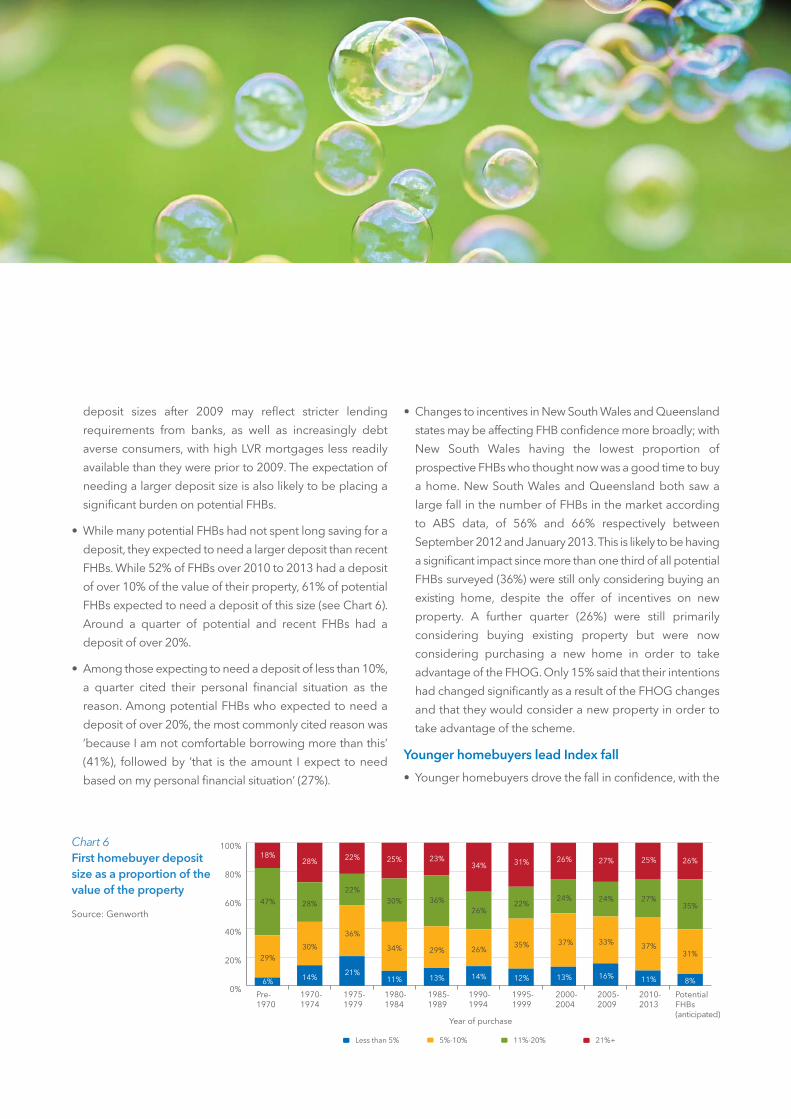
deposit sizes after 2009 may reflect stricter lending
requirements from banks, as well as increasingly debt
averse consumers, with high LVR mortgages less readily
available than they were prior to 2009. The expectation of
needing a larger deposit size is also likely to be placing a
significant burden on potential FHBs.
• While many potential FHBs had not spent long saving for a
deposit, they expected to need a larger deposit than recent
FHBs. While 52% of FHBs over 2010 to 2013 had a deposit
of over 10% of the value of their property, 61% of potential
FHBs expected to need a deposit of this size (see Chart 6).
Around a quarter of potential and recent FHBs had a
deposit of over 20%.
• Among those expecting to need a deposit of less than 10%,
a quarter cited their personal financial situation as the
reason. Among potential FHBs who expected to need a
deposit of over 20%, the most commonly cited reason was
’because I am not comfortable borrowing more than this’
(41%), followed by ’that is the amount I expect to need
based on my personal financial situation’ (27%).
• Changes to incentives in New South Wales and Queensland
states may be affecting FHB confidence more broadly; with
New South Wales having the lowest proportion of
prospective FHBs who thought now was a good time to buy
a home. New South Wales and Queensland both saw a
large fall in the number of FHBs in the market according
to ABS data, of 56% and 66% respectively between
September 2012 and January 2013. This is likely to be having
a significant impact since more than one third of all potential
FHBs surveyed (36%) were still only considering buying an
existing home, despite the offer of incentives on new
property. A further quarter (26%) were still primarily
considering buying existing property but were now
considering purchasing a new home in order to take
advantage of the FHOG. Only 15% said that their intentions
had changed significantly as a result of the FHOG changes
and that they would consider a new property in order to
take advantage of the scheme.
Younger homebuyers lead Index fall
• Younger homebuyers drove the fall in confidence, with the
0%
20%
40%
60%
80%
100%
Potential FHBs (anticipated)
2010-2013
2005-2009
2000-2004
1995-1999
1990-1994
1985-1989
1980-1984
1975-1979
1970-1974
Pre-1970
11%-20%5%-10% 21%+Less than 5%
Year of purchase
6%
18%
29%
47%
14%
28%
30%
28%
21%
22%
36%
22%
11%
25%
34%
30%
13%
23%
29%
36%
14%
34%
26%
26%
12%
31%
35%
22%
13%
26%
37%
24%
16%
27%
33%
24%
11%
25%
37%
27%
8%
26%
31%
35%
Chart 6First homebuyer depositsize as a proportion of thevalue of the property
Source: Genworth

Index falling 8.7% for those aged under 35, from 97.5 in
September 2012 to 89.0 in March 2013, while those aged
35 and over saw a 3.7% fall in confidence, from 98.7 to 95.0.
• Younger borrowers were more stressed than older
borrowers, with 26% of those surveyed aged under 35
having struggled to meet repayments over the last year
(compared to 22% of those aged 35 and over) and 33%
expecting difficulty meeting repayments in the coming year
(compared to 25% of those aged 45 and over). This may be
affected by the fact that younger homebuyers were more
heavily indebted, with almost a third (31%) of those aged
under 35 paying 50% of their income or more to service
debt, compared to just over a quarter (27%) of those aged
35 and over.
• Younger struggling borrowers were more likely to have
been impacted by fixing their rates when they were higher
(6%) than older struggling borrowers (2%), and 13% of those
aged under 35 were anticipating stress for this reason
compared to 4% of those aged 35 and over. Moreover, one
in five (20%) of those aged under 35 said they were likely to
be stressed because of interest rate rises in the coming year.
Younger borrowers may be used to a lower interest rate
environment, and may feel the impact of rates more keenly
than older borrowers. Younger borrowers were also more
likely to have been affected by maternity leave (7%) or a new
job with less pay (6%) than older struggling borrowers
(2% and 4% respectively).
• However, those surveyed who were aged under 35 were
more comfortable taking on debt, with 32% saying they would
be comfortable borrowing more than 80% of the value of a
property, compared to 26% of those aged 35 and over.
• Surveyed men saw a larger drop in homebuyer confidence
than surveyed women, having had higher confidence levels
in September 2012. Men were slightly less confident than
women in March 2012, due to their higher expectations of
mortgage stress (29% compared to 26%). However, surveyed
women reported higher levels of indebtedness than men,
with 30% of women spending more than 50% of their
income on debt, compared to 25% of surveyed men.
Streets Ahead | Genworth Homebuyer Confidence Index, March 2013 | 7
State Date Change
NSW Jan-12 Stamp duty waiver on existing homes removed.
Oct-12 $7000 grant for existing homes removed. Grant of $7000 increased to $15,000 for new homesvalued up to $650,000.
NT Dec-12 Grant increased from $7000 to $25,000, or $12,000 bonus for purchase of established urban property.
QLD Sep-12 $7000 grant for existing homes removed. Grant of $7000 increased to $15,000 for new homesvalued up to $750,000.
SA Nov-12 Grant on existing dwellings reduced from $7000 to $5000.
TAS Jan-13 $8000 bonus for new homes introduced.
VIC Jan-10 $7000 grant for new and established dwellings capped on properties valued up to $750,000.
Jan-10 Bonus for new homes increased to $13,000, and regional bonus increased to $6500. $2000 bonus for established dwellings removed.
Jan-11 Stamp duty reduced by 20% on new and existing dwellings.
Jan-12 Bonus of $13,000 for new homes and regional bonus of $6500 removed.
Jan-13 Stamp duty reduced further by 10% on new and existing dwellings. Will decrease by a further20% before 2015.
WA Dec-09 $7000 grant for new and established dwellings capped on properties valued up to $750,000.
Changes to first homebuyer incentives
Source: State and territory treasuries

Concerns about unemployment andunderemployment drive increase in stress
• In March 2013 mortgage stress rose for the first time since
September 2011, with the proportion of surveyed mortgage
borrowers who had experienced difficulty in meeting
repayments rising from 18% in September 2012 to 23% in
March 2013 (see Chart 7). The sharp increase in mortgage
stress was largely driven by younger borrowers, with 26%
of borrowers under the age of 35 struggling to meet
repayments, compared to 22% of borrowers over the age
of 35. Unsurprisingly, surveyed mortgage borrowers with
higher household incomes were less likely to have
experienced stress than those in lower income brackets,
with less than one in 10 of those with a household income
of over $150,000 having experienced stress, although more
than one in five middle income earners (those with a
household income of between $50,000 and $125,000)
reported struggling to meet mortgage repayments over the
last year, indicating that this is not just a problem for middle-
income households. Of those struggling to meet repayments,
39% had a child under the age of 12.
• The cost of living as a driver of mortgage stress trended
downwards for the third consecutive survey in March 2013
(see Chart 8). It did, however, remain the main cause of
stress, with interest rates falling from consideration as a
driver of stress, from 26% in September 2012 to just 11% in
March 2013. The drivers of actual mortgage stress that saw
the largest growth between surveys were related to concerns
about employment, with unemployment/ redundancy, and
‘change of job from full-time to part-time’ increasing 12%
and 32%, respectively. Unemployment overtook ‘other debt
obligations’ to become the second largest driver of mortgage
stress in March 2013 (see Chart 8). Struggling borrowers who
cited unemployment/ redundancy as a driver of mortgage
stress were most likely to be employed in the construction
industry (11%) or education (11%).
• While theunemploymentrateremainedunchangedbetween
September 2012 and March 2013, the number of full-time
jobs has also stalled, with growth coming from part-time
jobs, suggesting that underemployment is the key source
of concern. Borrowers who were concerned about
30%
25%
20%
15%
10%
5%
0%
2004- 2005- 2006- 2007- 2008- 2009- 2010- Sep 2011 Mar 2012 Sep 2012 Mar 2013 Sep 2013 2005 2006 2007 2008 2009 2010 2011
30%
25%
20%
15%
10%
5%
0%
Experience Expectation
Chart 7Percentage experiencingdifficulty meetingrepayments in some or all months
Source: Genworth

Streets Ahead | Genworth Homebuyer Confidence Index, March 2013 | 9
unemployment were much less likely to believe it was a
good time to buy, with just 29% agreeing with this sentiment.
• Between September 2012 and March 2013 the proportion
of borrowers expecting difficulty meeting repayments in the
coming year rose from 19% to 27%—the highest figure since
theGFC.Again,this increasewasdrivenbyyoungerborrowers,
with 33% of surveyed mortgage borrowers under the age
of 35 expecting to struggle, compared to 25% of borrowers
over the age of 35. This was most notable in Tasmania (31%)
and New South Wales (29%). Tasmania has the highest
unemployment rate among the states and territories, while
New South Wales has the lowest affordability. The sharp
increase in the proportion of mortgage borrowers expecting
to struggle with repayments may be partially explained by
borrowers seeking to increase payments in order to clear
their debt, as reflected in the decrease in the debt-to-
disposable income ratio.
• Many of the borrowers anticipating hardship in the coming
year may be expecting difficulty in meeting their own
financial budgets, which likely include over-repayments.
Ofthesurveyedborrowerswhostruggledtomeetrepayments
in March 2013, 83% said they were not behind in
repayments (up marginally from 82% in September 2012),
and only 13% were more than one month behind (down
from 17% last survey). The fact that these figures have
remained relatively stable over the past 18 months (see
Chart 9), while the number of borrowers experiencing and
expecting mortgage stress has grown, further suggests that
borrowers’ perception of a ‘standard repayment’ has
shifted, and they are not struggling to meet repayments, but
rather a desire to pay down debt more quickly. The January
announcement of the 2013 Federal Election, may also have
also added to household uncertainty.
• The proportion of borrowers expecting to struggle because
they fixed their interest rate when rates were high increased
from 3% to 7% between September and March 2013,
indicating borrowers are anticipating further cuts to interest
rates over 2013.
Mar 2011 Sep 2011 Mar 2013 Mar 2012 Sep 2012
61%69%
71%
62%
Higher cost of living
52%
Interest rate rises
44%50%
32%26%
11%
Other debtobligations
22%
33%28% 29%
22%
Fewer hours worked/ lower pay for same work
20%22% 22%
18%16%
Unemployment/Redundancy
18%
24%22% 21%
24%
Illness
9%11%18%19%
12%
Chart 8Top drivers of mortgage stress
Source: Genworth
85% 86%82% 83%
14% 12%
17%
13%
1% 2% 1%4%
My property is for sale or has been sold as I cannot
make my repayments
I struggled and I am more than one month behind with
my repayments
I struggled but I am not behind with my repayments
0%
20%
40%
60%
80%
100%
Mar 2013Sep 2012Mar 2012Sep 2011Chart 9For those who found itdifficult to meet mortgage repayments, which of thefollowing statements are true?
Source: Genworth
Dealing with mortgage stress
• Of the surveyed mortgage borrowers who had experienced
difficulty in meeting repayments, 63% dealt with the
mortgage stress by sacrificing other expenses—this accounted
for 75% of those who had struggled but were not behind
on repayments.
• Conversely, of the surveyed mortgage borrowers who were
more than one month behind in repayments, only 19% had
dealt with mortgage stress by sacrificing other expenses,
with 45% having contacted their lender to negotiate
mortgage conditions, and 16% contacting their broker.
Overall, 21% of struggling borrowers had contacted their
lender to negotiate mortgage conditions, while11% had
considered selling their home.
• These results suggest that mortgage borrowers are most
likely to turn to their lender when facing significant hardship,
rather than taking matters elsewhere. This is likely to help
prevent further hardship, as only 2% of those who had
contacted their lender reported their property was for sale
because of their inability to meet repayments.
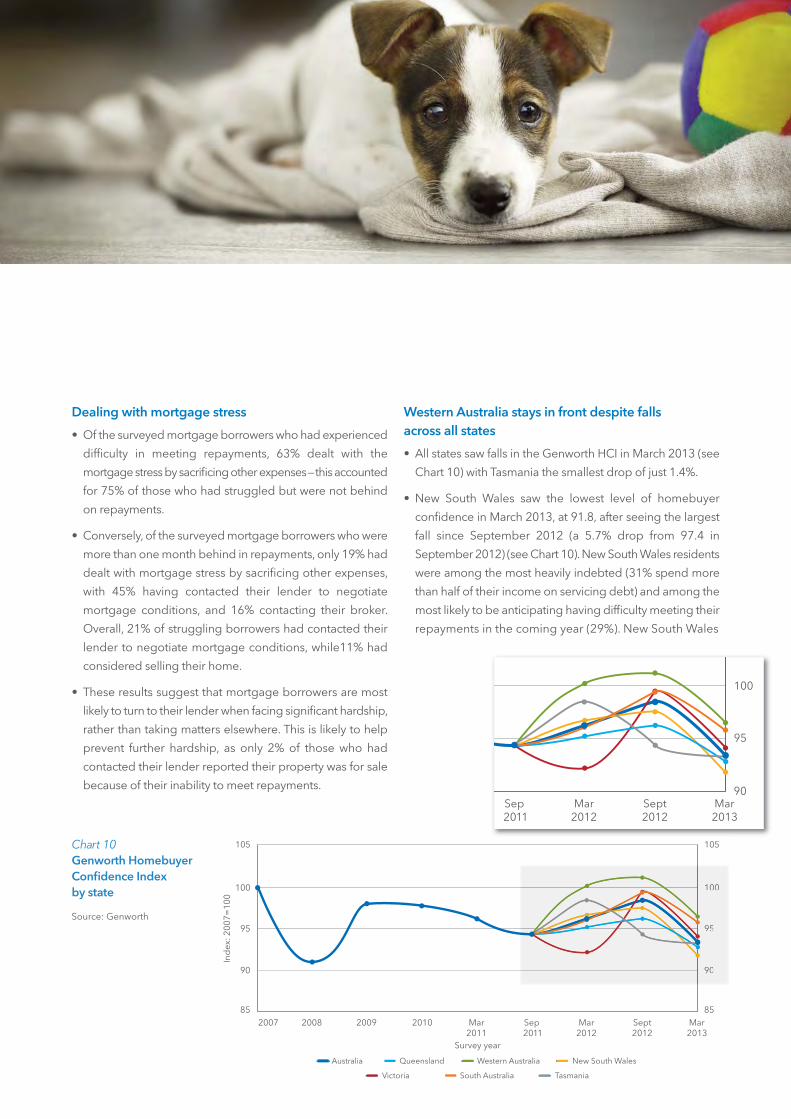
Western Australia stays in front despite falls across all states
• All states saw falls in the Genworth HCI in March 2013 (see
Chart 10) with Tasmania the smallest drop of just 1.4%.
• New South Wales saw the lowest level of homebuyer
confidence in March 2013, at 91.8, after seeing the largest
fall since September 2012 (a 5.7% drop from 97.4 in
September 2012) (see Chart 10). New South Wales residents
were among the most heavily indebted (31% spend more
than half of their income on servicing debt) and among the
most likely to be anticipating having difficulty meeting their
repayments in the coming year (29%). New South Wales
Australia Queensland Western Australia New South Wales
Victoria South Australia Tasmania
Survey year
Ind
ex: 2
007=
100
105
100
95
90
85
105
100
95
90
852007 2008 2009 2010 Mar Sep Mar Sept Mar 2011 2011 2012 2012 2013
100
95
90
100
95
90Sep Mar Sept Mar
2011 2012 2012 2013
Chart 10Genworth HomebuyerConfidence Index by state
Source: Genworth

had the lowest levels of affordability, and yet surveyed
FHBs in that state were most likely to expect to need a large
deposit (with one in four respondents thinking they need a
deposit of over 20%). Homebuyer sentiment in New South
Wales is likely to have been adversely affected by the
removal of the FHOG for the purchase of existing homes in
October 2012.
• Victoria saw the second largest decrease in the Genworth
HCI, down 5.3% to 94.1 from 99.4, which is still above the
low of 92.3 seen in March 2012 and ahead of Queensland,
New South Wales and Tasmania (see Chart 10). Victorian
borrowers are among the most likely to be comfortable
borrowing more than 80% of the value of their property (29%).
• Western Australia saw a 4.6% fall in confidence (from 101.1
to 96.5) but held on to its lead, with surveyed Western
Australianborrowersbeingtheleast likely tohaveexperienced
(17%), or expected, difficulty meeting repayments (23%) in
March 2013, as they were in September 2012. They were
also more likely than average to believe that now is a good
time to buy a home, at 49%. Western Australia has the
lowest level of unemployment across the states and
territories (excluding the Northern Territory), according to
ABS data, although unemployment did rise between
September 2012 and February 2013, from 4.0% to 4.5%.
• Queensland saw a smaller than average fall in confidence
to March 2013 (see Chart 10) but respondents from the
state were still less confident than average, falling 3.7% from
96.4 to 92.8. Surveyed Queenslanders have the highest
debt levels—with one third spending more than 50% of their
income on servicing debt—and the highest experience of
difficulty meeting repayments (25%). Despite this high level
of indebtedness, Queenslanders were optimistic about the
future, being the most likely to believe that now is a good
time to buy a home (53%), as they were in September 2012,
and in line with the average in their expectation of mortgage
stress. Queensland FHBs were the most likely to expect to
need a deposit of more than 20% (37%) despite having the
highest affordability, reflecting the fact that they are the least
comfortable borrowing more than 80% of the value of their
property at just 26%.
• South Australia saw the second smallest fall in the Genworth
HCI, by 3.6% to 95.8 (from 99.4), the second highest overall
(see Chart 10). South Australians are also the least indebted,
with just 22% spending more than half of their income to
service debt. Despite this high level of confidence, South
Australians are among the least likely to believe it is a good
time to buy a home, with just 40% agreeing to this sentiment,
down from 52% in September 2012. South Australia saw the
Streets Ahead | Genworth Homebuyer Confidence Index, March 2013 | 11
Struggling 21% of borrowers under
strain contacted theirlender to negotiate
mortgage conditions
Smallestconfidence in
Queensland fell lessthan the average
smallest affordability increase, and has also seen a reduction
in FHB incentives, which may be contributing to the
perception that it is not a good time to buy, dragging down
the national average.
Investment property increasingly popular for Australians
• Residential property has become an increasingly attractive
investment for Australians, as falling interest rates impact the
popularity of cash. The proportion of homebuyers who
found cash attractive slid from 40% to 32% between surveys,
while the proportion who found Australian shares attractive
increased slightly, from 21% to 23%. In March 2013, 42% of
homebuyers believed that it was a good time to buy an
investment property, down only slightly from 44% in
September 2012. Demand for investment property may
help counteract low homeowner sentiment, as the ABS
reported investment lending grew 4.4% between September
2012 and January 2013, while owner-occupier lending fell
by 0.8%.
• Low property prices, low interest rates and high rents are
making property an attractive investment, but the demand
for investment property is underpinned by a belief in the
stability and potential for long term growth of ‘bricks and
mortar’. This attitude is summed up in one homebuyer’s
response on why property was attractive, ‘bricks and
mortar—security plus growth’.
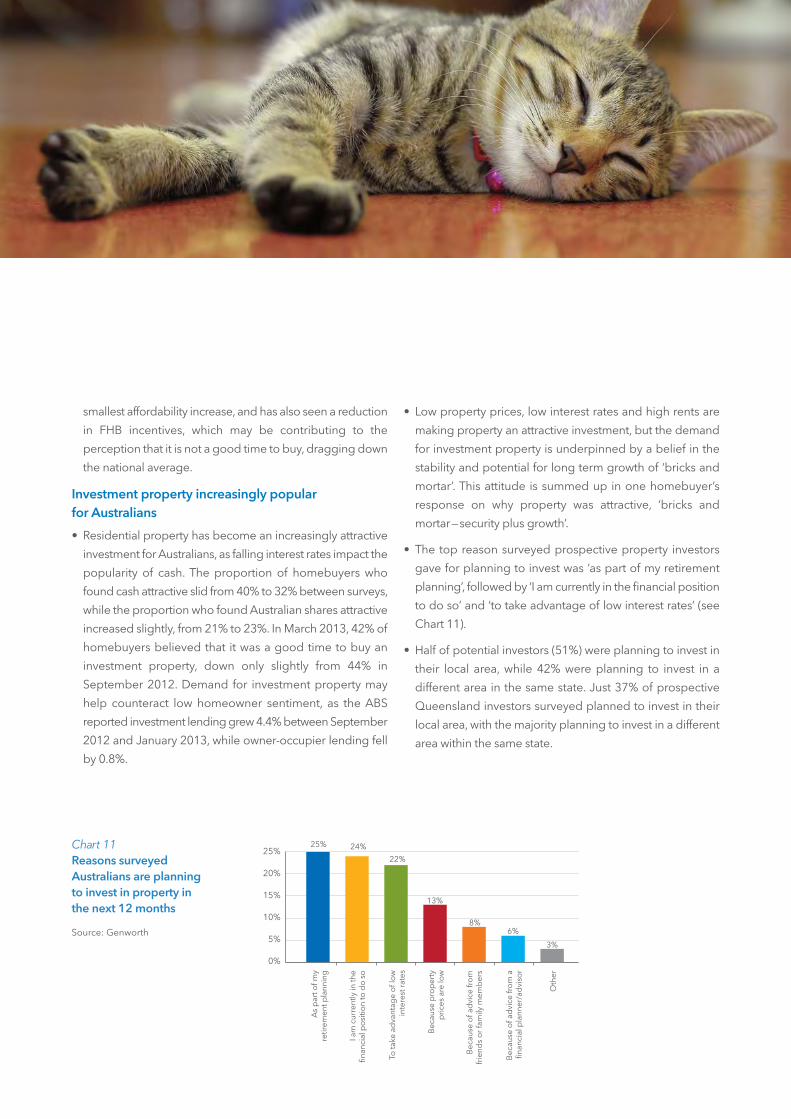
• The top reason surveyed prospective property investors
gave for planning to invest was ‘as part of my retirement
planning’, followed by ‘I am currently in the financial position
to do so’ and ‘to take advantage of low interest rates’ (see
Chart 11).
• Half of potential investors (51%) were planning to invest in
their local area, while 42% were planning to invest in a
different area in the same state. Just 37% of prospective
Queensland investors surveyed planned to invest in their
local area, with the majority planning to invest in a different
area within the same state.
25% 24%
22%
13%
8%6%
3%
As
par
t of m
yre
tirem
ent p
lann
ing
I am
cur
rent
ly in
the
finan
cial
po
sitio
n to
do
so
To ta
ke a
dva
ntag
e o
f lo
win
tere
st ra
tes
Bec
ause
pro
per
typ
rices
are
low
Bec
ause
of a
dvi
ce fr
om
frie
nds
or f
amily
mem
ber
s
Bec
ause
of a
dvi
ce fr
om
afin
anci
al p
lann
er/a
dvi
sor
Oth
er
25%
20%
15%
10%
5%
0%
Chart 11Reasons surveyedAustralians are planningto invest in property inthe next 12 months
Source: Genworth

Streets Ahead | Genworth Homebuyer Confidence Index, March 2013 | 13
0%
20%
40%
60%
80%
100% Four members
Three members
Two members
One member
2010-112009-102008-092007-08
23.7%
67.0%
4.7%
4.6%
23.0%
67.9%
4.6%
4.5%
22.4%
68.7%
4.6%
4.4%
22.5%
69.1%
4.3%
4.1%
Chart 12Self-managed superfunds by number of members
Source: ATO
• While familiarity with an area, its potential for growth, property
prices and rental returns was likely to drive prospective
investors’ choices, prospective investors were also likely to
consider where they would like to live in the future,
suggesting an investment property is not just a retirement
plan for returns, but also as a potential retirement home. This
is particularly true for those looking to purchase away from
their domiciled home, who cite reasons such as “I want to
retire close to the beach” for their choice of area.
Prospective investors well placed
• With investment property being the largest growth area at
the moment, as home lending remains stagnant, prospective
investors are in a strong financial position. Surveyed
prospective investors had a higher income than the national
average, with half having an annual household income of
over$100,000,comparedtolessthanathirdofallrespondents.
Almost two thirds (65%) of prospective investment property
owners had a tertiary qualification.
• While prospective investors are less heavily indebted than
the average surveyed Australian, one in five said they were
spending more than half their monthly income on debt
repayments. More than two thirds (69%) said they felt secure
in their current jobs, above the average of 63%. Surveyed
prospective investment property owners were also more
likely to be self-employed, at 23% compared to the national
average 19%.
• When considering the decision to invest in property,
prospective investment property owners did their research,
planning to consult around three different information
sources on average. The most common source of information
was a mortgage broker (40%), followed by financial
institution websites (38%) and comparison websites (38%).
A third of prospective investors were planning to talk to
friends or family members, while around one in ten weren’t
sure what sources of information they would use.
• Branches were less attractive to prospective investors, with
39% planning to apply through a branch, compared to the
45% of current investors who had applied through a branch.
The online channel is increasing in popularity for investors,
with 22% planning to apply online, compared to the 9%
who had applied online in the past. It remains to be seen
whether this will convert to a real increase in the online
channel, however, as borrowers have shown a tendency to
start applications online and abandon them in favour of a
more personal and user-friendly channel.
Self-managed super funds investing in property
• Self-managed super funds (SMSFs) are increasingly popular
in Australia. According to ATO data, 7000 new SMSFs were
established in the December 2012 quarter, and almost
950,000 Australians are now members of an SMSF.
• ATO statistics also show that property makes up about 15%
of the total value of assets held by Australian SMSFs, the
majority of which is made up of Australian property (less
than 1% was made up of overseas property). The value of
residential property held in SMSFs grew by 12.3% in the
year to December 2012.
• Almost one in five (18%) of surveyed SMSF holders have a
mortgage through their fund, with the majority of these
mortgages (75%) secured by residential property. Just over
half (59%) of all mortgages were held in multiple member
funds. These funds make up the majority of all SMSFs, with
most being two member funds, according to Australian Tax
Office (ATO) data (see Chart 12).
• Among those who don’t have a mortgage on a residential
property through their fund, a quarter would consider
taking one out, and a quarter of those without commercial
property would consider taking out a mortgage on a
commercial property through their fund.

• There was not much movement in economic indicators in
March 2013, with unemployment stable and inflation rising
slightly, while the cash rate fell.
• On the other hand, housing affordability improved despite
an increase in the average FHB loan size, helped by the
falling cash rate.
• Despite the low cash rate, consumer confidence has fallen
due to consumer uncertainty and high expectations of
mortgage stress, fuelled by negative economic stories in the
media, particularly around the potential for unemployment
to rise and demand for commodities to fall. The high savings
rate also means that many households will be negatively
affected by falls in interest rates.
• Altogether, economic factors have made Australians
cautious going into 2013, Australian consumers are now
unwilling to take on debt and more concerned about
paying off their existing debt.
Economic indicators
Economic indicators 2007 2008 2009 2010 Mar 2011 Sep 2011 Mar 2012 Sep 2012 Mar 2013
Official cash rate1 6.25% 7.25% 3.00% 4.50% 4.75% 4.75% 4.25% 3.50% 3.00%
Inflation2 2.40% 4.50% 2.50% 3.10% 3.30% 3.40% 1.60% 2.00% 2.20%
Unemployment3 4.30% 4.30% 5.80% 5.10% 5.00% 5.20% 5.20% 5.50% 5.40%
Oil prices per barrel US$4 $66.30 $127.76 $67.73 $75.69 $96.97 $91.96 $109.77 $96.47 $91.95
HIA Affordability Index5 52.9 48.7 69.5 52.5 55.7 57.2 61.8 65.8 –
Average FHB loan6 $239k $243k $270k $283k $281k $280k $283k $289k $294k
Genworth HCI 7 100 91.1 98.1 97.8 96.3 94.4 96.3 98.4 93.4
ChangeinGenworthHCI – -8.9% 7.7% -0.3% -1.5% -2.0% 2.0% 2.2% -5.1%
Key drivers in Genworth HCI –
Rising interest
ratesheading into the
GFC
Recovering from theGFC andinterest rate cuts
Rate rises,expected
stress
Disastersleading toincreasedstress, less
comfort with debt
Rise in costof living,
experienceand
expectationof mortgage
stress
Increasingcomfort withdebt, fallingmortgagestress dueto interestrate cuts
Increasinglysee now as
a good timeto buy due
to risingaffordability
Increasingfears of un-or under-
employmentand
mortgagestress
Key economic indicators
1Source: RBA. 2007–2010 as at June of that year. Mar 2011, Mar 2012 and Mar 2013 as at March of that year. Sep 2011 and Sep 2012 as of September that year. 2 Source: RBA. 2007 as atMar 2007. 2008 as at Jun 2008. 2009 as at Mar 2009. 2010 as at Jun 2010. Mar 2011, Sep 2011, Mar 2012 and Sep 2012 in seasonally adjusted terms as at Mar 2013. Mar 2013 representsthe latest figure available (Dec 2012) as at Mar 2013. 3Source: ABS. 2007-2010 as at June of that year. Mar 2011, Sep 2011, Mar 2012 and Sep 12 in seasonally adjusted terms as at Mar 2013.Mar 2013 represents the latest figure available (Feb 2012) as at Mar 2013. 4 Source: Nymex. 2007 as at Apr 2007. 2008 as at May 2008.2009 as at Aug 2009. 2010 as at Aug 2010(approximations only). Mar 2011 as at Feb 2011. Sep 2011 as at June 2011. Mar 2012 as at Feb 2012. Sep 2012 as at Aug 2012. Mar 2013 as at Mar 2013. 5Source: HIA-CommonwealthBank Affordability Report. 2007-2010 as at June of that year, figures based on figures published in Dec 2010. Mar 2011, Sep 2011, Mar 2012 and Sep 2012 figures based on figures publishedin Dec 2012 6 Source: ABS. 2007–2008 as at May of that year. 2009 as at Jun 2009. 2010 as at Aug 2010. Mar 2011 as at Dec 2010. Sep 2011 as at Jun 2011. Mar 2012 as at Dec 2011. Sep 2011 as at Jun 2012. Mar 2013 as at Dec 2012. 7 Source: Genworth. Analysis conducted by RFi.

Despite recent cuts to the cash rate boosting affordability,
consumer confidence has slumped in March 2013. Cuts to FHB
incentives in some states, and rising property prices, are
dampening FHB confidence, while concerns about unemploy -
ment places pressure on households. The announcement of
a Federal election scheduled for September this year has the
potential to add to consumer uncertainty.
While the low consumer confidence makes the future outlook
seem gloomy, there are other positive signs. RBA research
shows that most Australian households are ahead on their
mortgage repayments as they have been overpaying,
suggesting that expectations of stress may be linked to
difficulty meeting these higher than necessary repayments.
However, perception is a stronger driver of sentiment than the
actual economic landscape, so uncertainty may continue to
dictate lower homebuyer confidence. The RBA has indicated
that property recovery has been subdued, and is likely to
continue to be subdued in the near future. Amid slow
homebuyer sentiment, investment property has remained
relatively robust, with SMSFs a potential source of future
property demand.
Future outlook

Genworth Australia is a leading mortgage insurance expert
and thought leader in the Australian residential mortgage
market, actively engaging on residential mortgage policy
development with the key lending institutions, government
bodies, local and international regulators and industry bodies.
Genworth works in close partnership with over 100 lenders,
including three of the four major Australian banks, and has
been an important part of the Australian residential mortgage
market for many years. Genworth has A$3.6 billion of investments
under management in Australia.
For more information visit genworth.com.au
RFi is a global provider of business intelligence focusing
exclusively on financial services. We specialise in strategic
research, market intelligence, financial performance bench -
marking and risk management as well as management
consultancy and advisory services. Our aim is to combine our
global intelligence and local knowledge to provide insightful,
valuable and actionable recommendations, with a core focus
on the provision of exceptional client service.
Covering 25 key global markets with regional offices in Dubai,
Hong Kong, London, Singapore and Sydney, RFi consistently
provides clients with tailored advice and independent
intelligencerelevanttotheirspecificmarketsandbusinessneeds.
For more information visit rfintelligence.com.au
About Genworth About RFi
genworthaustralia
The report is based on a survey of 2000 adults within Australia
and while the information contained in this report is current as
at the date of publication, it may change without notice.
Genworth is under no obligation to update the information or
correct any inaccuracy which may become apparent at a later
date. Genworth does not take any responsibility for any
reliance on the information contained in this report or for its
accuracy and completeness.
Disclaimer

genworth.com.au/streetsahead

Head Office and New South WalesLevel 26, 101 Miller StreetNorth Sydney, NSW 2060Phone: 1300 655 422
Victoria and TasmaniaLevel 15, 500 Collins StreetMelbourne, VIC 3000Phone: 1300 655 528
QueenslandLevel 20, Central Plaza 266 Eagle Street Brisbane, QLD 4000Phone: 1300 652 864
South Australia and Northern TerritorySuite 6, 79 Pennington TerraceNorth Adelaide, SA 5006Phone: 1300 652 954
Western AustraliaLevel 2, Unit 3, 22 St George’s TerracePerth, WA 6000Phone: 1300 652 853
Genworth Financial Mortgage Insurance Pty Limited
ABN 60 106 974 305 • ® Registered Trade Mark of Genworth Financial, Inc.
genworth.com.au
GHCI0313
genworth.com.au/streetsahead
genworthaustralia