![[Albania] New Albania I.pdf](https://static.fdocuments.net/doc/165x107/544cfeb4b1af9f710c8b499e/albania-new-albania-ipdf.jpg)
67 SEE6 GDP growth (left) SEE6 unemployment 25 24 ... SUMMARY After two years of fragile recovery...
59
South East Europe Regular Economic Report No.3 From Double-Dip Recession to Accelerated Reforms Pre-launch copy; December 15, 2012 Launch: December 18, 2012 www.worldbank.org/eca/seerer 18 19 20 21 22 23 24 25 -3 -2 -1 0 1 2 3 4 5 6 7 2007 2008 2009 2010 2011 2012 Percentage points Percentage of labor force SEE6 GDP growth (left) SEE6 unemployment rate (right) Poverty Reduction and Economic Management Unit Europe and Central Asia Region
Transcript of 67 SEE6 GDP growth (left) SEE6 unemployment 25 24 ... SUMMARY After two years of fragile recovery...

South East Europe Regular
Economic Report
No.3
From Double-Dip Recession to
Accelerated Reforms
Pre-launch copy; December 15, 2012
Launch: December 18, 2012
www.worldbank.org/eca/seerer
18
19
20
21
22
23
24
25
-3
-2
-1
0
1
2
3
4
5
6
7
2007 2008 2009 2010 2011 2012
Percentage points Percentage of labor force
SEE6 GDP growth (left) SEE6 unemploymentrate (right)
Poverty Reduction and Economic Management Unit
Europe and Central Asia Region


SOUTH EAST EUROPE:
REGULAR ECONOMIC REPORT No. 3
From Double-Dip Recession
to Accelerated Reforms
December 18, 2012

i
TABLE OF CONTENTS
RECENT ECONOMIC DEVELOPMENTS, OUTLOOK, AND POLICY CHALLENGES
MANAGING VULNERABILITY TO NEW FOOD PRICE SHOCKS IN SEE6 COUNTRIES
1. RECENT DEVELOPMENTS, OUTLOOK, AND POLICY CHALLENGES ...................... 1
A. EUROZONE IN RECESSION, NEW GLOBAL RISKS ................................................................. 1
B. GROWTH IN SEE6—A DOUBLE-DIP RECESSION ................................................................... 3
C. LABOR MARKETS––A CONTINUING CRISIS ........................................................................... 6
D. TRADE AND EXTERNAL DEBT—WORSENING .................................................................... 15
E. FISCAL POLICY––RISING DEFICITS, DEBT, AND ARREARS ............................................. 20
F. FINANCIAL SECTOR––CONTINUED VULNERABILITY ...................................................... 25
G. STRUCTURAL ISSUES: THE SEE6 ENVIRONMENT FOR DOING BUSINESS ................... 28
H. STRUCTURAL ISSUES: THE SECOND WAVE OF PRIVATIZATION? ................................. 30
I. STRUCTURAL ISSUES: ENERGY INFRASTRUCTURE DEFICIT ......................................... 32
J. SEE6 OUTLOOK FOR 2012–13 ................................................................................................... 34
K. ACCELERATING REFORMS, MOBILIZING FINANCING ...................................................... 35
2. MANAGING VULNERABILITY TO FOOD PRICE SHOCKS IN THE SEE6 ................ 37
A. INTRODUCTION .......................................................................................................................... 37
REFERENCES ............................................................................................................................. 49
Figures
Figure 1: Financial Markets Developments .................................................................................................. 2
Figure 2: Global Industrial Production ......................................................................................................... 2
Figure 3: Global Growth Assumptions ......................................................................................................... 3
Figure 4: SEE6: Inflation––CPI and Food (Percent) .................................................................................... 6
Figure 5: Change in SEE6 Unemployment Rates, 2008 and 2012 (Percentage points)* ............................. 7
Figure 6: Unemployment Rates, SEE6 and EU10 ........................................................................................ 7
Figure 7: Registered Unemployed in 2011 (January 2011 = 100) ................................................................ 8
Figure 8: Employment Rates in SEE6 (2011–2012), in percent ................................................................... 9
Figure 9: Gross Average Nominal Wage Changes (January 2011 = 100) .................................................. 10
Figure 10: Employment and Real Wage Index (December 2010 = 100) .................................................... 10
Figure 11: SEE6 Difficulty of Hiring Workers ........................................................................................... 13
ii
Figure 12: SEE6 Premiums on Night Shift and Work on Rest Days .......................................................... 13
Figure 13: Redundancy Costs and Notification Requirements ................................................................... 14
Figure 14: The WEF Labor Efficiency Index, 2012–13 ............................................................................. 14
Figure 15: Exports (% of GDP) .................................................................................................................. 15
Figure 16: Growth in Exports to SEE6 (%) ................................................................................................ 16
Figure 17: Export Growth, SEE6 and EU (%) ............................................................................................ 16
Figure 18: Exports and Economic Growth (%)........................................................................................... 16
Figure 19: Import Growth (%) .................................................................................................................... 16
Figure 20: Export and Import Growth (% y-o-y) ........................................................................................ 17
Figure 21: CAD and Trade Balance (% of GDP) ....................................................................................... 17
Figure 22: CAD by Country (% of GDP) ................................................................................................... 17
Figure 23: Worker Remittances 2008–2011 (% of GDP) ........................................................................... 18
Figure 24: Foreign Direct Investment (net, % GDP) .................................................................................. 19
Figure 25: FDI per Capita (net, US$) ......................................................................................................... 19
Figure 26: SEE6 External Debt (Average, percent of GDP) ...................................................................... 19
Figure 27: Total International Bonds Outstanding, Select SEE6 Countries (US$ million) ........................ 19
Figure 28: Total Public and Private External Debt Through June 2012 (% of GDP) ................................. 20
Figure 29: Growth and Structural Balance (unweighted; percent of GDP) ................................................ 21
Figure 30: Structural Balance, 2005–11, (percent of GDP) ........................................................................ 21
Figure 31: SEE6 Real Revenues, 2008–12 ................................................................................................. 22
Figure 32: SEE6 Real Expenditures, 2008-12 ............................................................................................ 22
Figure 33: Public Debt and Guarantees (percent of GDP) .......................................................................... 24
Figure 34: International Claims (% of GDP, 2012Q2) ............................................................................... 25
Figure 35: Foreign Currency Loans (% of total, 2012Q3) .......................................................................... 25
Figure 36: Credit Growth (% change, Q-on-Q) .......................................................................................... 26
Figure 37: NPLs (% of Total Loans) and Provisioning (% of NPLs, 2012Q3) .......................................... 26
Figure 38: Capital Adequacy Ratios and Return ........................................................................................ 27
Figure 39: Loan-to-Deposit Ratios (%, 2012Q3) ........................................................................................ 27
Figure 40: SEE6 Ease of Doing Business, 2011-13 .................................................................................... 29
Figure 41: SEE6 Weak Areas in the Business Environment 2012 ............................................................. 30
Figure 42: Current and forecast power imports (GWh) .............................................................................. 33
Figure 43: EU Industrial Production and Trade .......................................................................................... 34
Figure 44: Grain and Edible Oil Prices, US$ Nominal and Real (2005=100) ............................................ 38
Figure 45: Price Volatility: Annual Coefficient of Variation and Theil Index of Food Prices, 1990–201239
Figure 46: Prices of Maize and Wheat Future (US cents per bushel) ......................................................... 40
Figure 47: Food price indices for SEE countries, y-o-y .............................................................................. 41
Figure 48: Household Vulnerability to Global Food Price Shocks, EU and Europe and Central Asia ...... 43
Figure 49: Food Budget Shares by Consumption Decile ............................................................................ 44
Figure 50: Change in the Budget Share of food due to a 5 percent Increase in the Food Price Index
(percentage points) ...................................................................................................................................... 46
Figure 51: Targeting, coverage and generosity of social assistance in the Western Balkans ..................... 47

iii
Tables
Table 1: South East Europe Six: Real Economic Growth, 2009–12 ............................................................. 4
Table 2: SEE6: Industrial Output Real Growth by Quarter (Percent, year-on-year) .................................... 5
Table 3: SEE6: Decline in Real Agricultural Output in 2012 ....................................................................... 5
Table 4: SEE6 Fiscal Balances, 2008–12 (% GDP) ................................................................................... 20
Table 5: SEE6: Sovereign Credit Ratings1.................................................................................................. 24
Table 6: Key Macro Indicators (2012 projections, % of GDP) and Financial Safety Net Issues ............... 27
Table 7: Announced Privatizations in the Western Balkans ....................................................................... 31
Table 8: Global and Regional Growth ........................................................................................................ 34
Table 9: SEE6 Growth Outlook for 2012–13 ............................................................................................. 35
Table 10: World and Domestic Food Price Changes (Percentage) and Pass-through estimates ................ 42
Table 11: Simulated Change in Poverty from a 5 Percent Increase in Food Prices (Percentage points) .... 45
Boxes
Box 1: FIAT in Serbia: The Auto Industry Returns to the Western Balkans ................................................ 5
Box 2: Soaring Unemployment in Serbia ..................................................................................................... 8
Box 3: World Development Report on Jobs: Implications for Labor Market Policies ............................... 12
Box 4: Tax and Expenditure Arrears: A Growing Cause for Concern ....................................................... 23
Box 5: Assumptions Underlying Estimated Poverty Impacts ..................................................................... 44
iv
This report is produced twice a year by staff economists at the World Bank Europe and Central Asia region Poverty
Reduction and Economic Management Department (ECA PREM). This and previous reports may be found at the
www.worldbank.org/eca/seerer website. The authors’ team is led by Željko Bogetić ([email protected]) and
includes the following team members with thematic assignments: Dilek Aykut (global developments and outlook);
Alexandru Cojocaru (special topic note on food prices); Damir Ćosić (financial sector; Bosnia and Herzegovina);
Simon Davies (fiscal and debt); Mike Edwards (financial sector); Agim Demukaj (external sector, Kosovo); Borko
Handjiski (labor markets, Bosnia and Herzegovina); Caterina Ruggeri Laderchi (special topic note on food prices);
Erjon Luci (SEE6 countries database manager, Albania); Sanja Madzarević-Sujster (Montenegro and SEE6
structural reforms); Lazar Sestović (real economy, Serbia); Bojan Shimbov (privatization, doing business, FYR
Macedonia); and Kenneth Simler (special topic on food prices). Carolina Sanchez-Paramo and Indhira Vanessa
Santos contributed to the section on labor markets. Arturo Rivera prepared the box on energy infrastructure and
Javier Suarez contributed to the box on lessons of privatizations. Maria Andreina Clower and Mismake Galatis
provided team assistance.
Dissemination of the report and external and media relations is managed by an EXR team including Lundrim Aliu,
Denis Boskovski, Ana Gjokutaj, Jasmina Hadzić, Andrew Kircher, Vesna Kostić, Mirjana Popovć, John Mackedon,
Krystin Schrader, and Dragana Varezić.
The team benefitted from guidance and advice from Satu Kähkönen (sector manager, ECA PREM2) and Yvonne
Tsikata (director, ECA PREM). Discussions with Abebe Adugna (ECSPE) and Juan Zalduendo (ECAVP) are
gratefully acknowledged.
In this report, “South East Europe” refers to the six countries of the Western Balkans (SEE6): Albania, Bosnia and
Herzegovina, Kosovo, FYR Macedonia, Montenegro, and Serbia.
v
SUMMARY
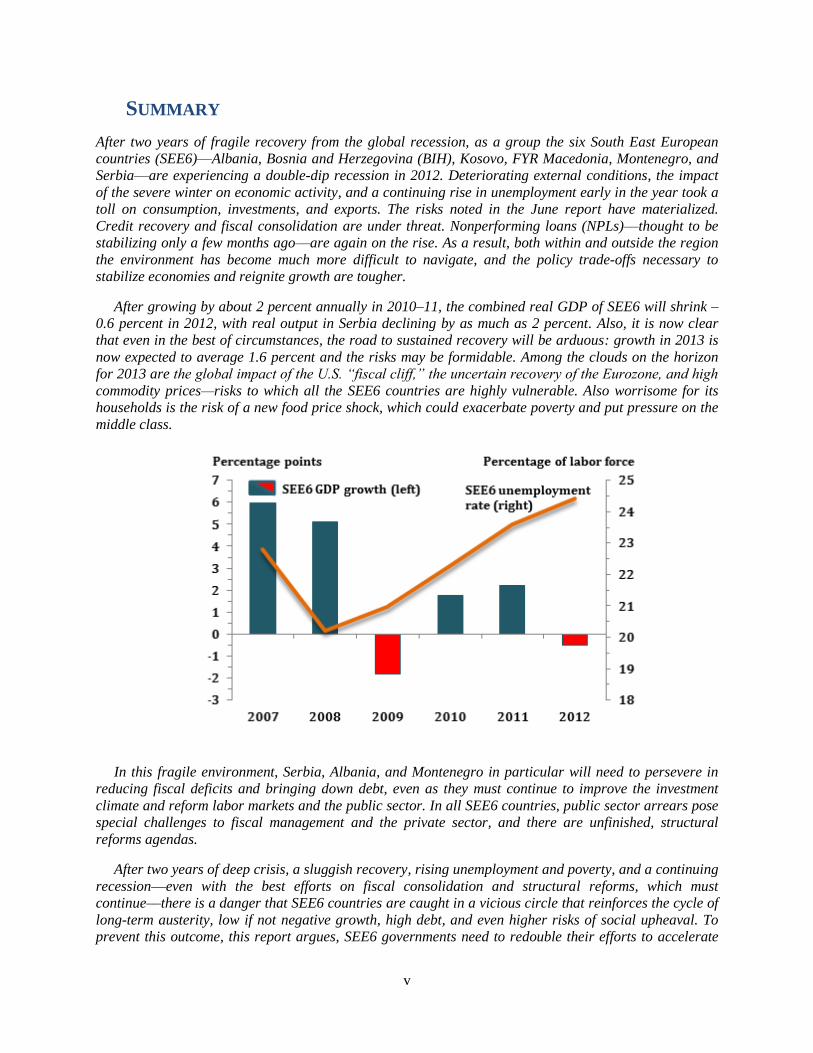
After two years of fragile recovery from the global recession, as a group the six South East European
countries (SEE6)––Albania, Bosnia and Herzegovina (BIH), Kosovo, FYR Macedonia, Montenegro, and
Serbia––are experiencing a double-dip recession in 2012. Deteriorating external conditions, the impact
of the severe winter on economic activity, and a continuing rise in unemployment early in the year took a
toll on consumption, investments, and exports. The risks noted in the June report have materialized.
Credit recovery and fiscal consolidation are under threat. Nonperforming loans (NPLs)––thought to be
stabilizing only a few months ago––are again on the rise. As a result, both within and outside the region
the environment has become much more difficult to navigate, and the policy trade-offs necessary to
stabilize economies and reignite growth are tougher.
After growing by about 2 percent annually in 2010–11, the combined real GDP of SEE6 will shrink –
0.6 percent in 2012, with real output in Serbia declining by as much as 2 percent. Also, it is now clear
that even in the best of circumstances, the road to sustained recovery will be arduous: growth in 2013 is
now expected to average 1.6 percent and the risks may be formidable. Among the clouds on the horizon
for 2013 are the global impact of the U.S. “fiscal cliff,” the uncertain recovery of the Eurozone, and high
commodity prices—risks to which all the SEE6 countries are highly vulnerable. Also worrisome for its
households is the risk of a new food price shock, which could exacerbate poverty and put pressure on the
middle class.
In this fragile environment, Serbia, Albania, and Montenegro in particular will need to persevere in
reducing fiscal deficits and bringing down debt, even as they must continue to improve the investment
climate and reform labor markets and the public sector. In all SEE6 countries, public sector arrears pose
special challenges to fiscal management and the private sector, and there are unfinished, structural
reforms agendas.
After two years of deep crisis, a sluggish recovery, rising unemployment and poverty, and a continuing
recession––even with the best efforts on fiscal consolidation and structural reforms, which must
continue––there is a danger that SEE6 countries are caught in a vicious circle that reinforces the cycle of
long-term austerity, low if not negative growth, high debt, and even higher risks of social upheaval. To
prevent this outcome, this report argues, SEE6 governments need to redouble their efforts to accelerate
vi
fiscal and structural reforms. These countries have largely exhausted their fiscal space and reduced
public investment (except Kosovo, an outlier) to a fraction of what is needed to maintain public capital
stock in critical infrastructure. Private investment is suppressed by the lack of productive, complementary
public investments, slow credit recovery, and depressed domestic demand. External demand is minimal,
and exports are not only too few, they are prevented from becoming an immediate, new engine of growth
by infrastructure, finance, and other deficiencies.
What is needed first and foremost, this report argues, is more intensive policy reform to reduce public
debt and accelerate structural reforms, especially in public sector governance, the investment climate,
and labor markets. Given their vulnerabilities, the SEE6 countries could also better prepare for new food
price shocks.
If such accelerated reforms materialize, external support—well-coordinated and targeting the region
as a whole, not just individual countries––from the EU and global international financial institutions
(IFIs) could help ease the transition to a more sustained growth in medium term.
In November 2012, the European Investment Bank, the European Bank for Reconstruction and
Development, and the World Bank announced €30 billion in financing for Central and South East
European countries over the next two years. In SEE6 countries, this timely initiative would likely be
delivered via the Western Balkans Investment Framework (WBIF) and other IFI resources. IPA resources
will also be important, especially in supporting institutional reform and rural development. By focusing
on major infrastructure of regional significance (rail, highways, energy, and gas) and on jobs and small
and medium enterprises, the efficiency of investments, growth, and employment could be substantially
heightened. However, additional financing for growth and jobs could prove effective only if accompanied
by intensified fiscal and structural reforms, especially in the areas of investment climate, labor markets,
and governance.

1
1. RECENT DEVELOPMENTS, OUTLOOK, AND POLICY
CHALLENGES
A. EUROZONE IN RECESSION, NEW GLOBAL RISKS
After months of decelerating economic activity following turbulence in financial markets in the second
quarter, global economic activity is slowly picking up once again — most notably in developing
countries. But the modest rebound is tenuous. The latest data show growth in industrial production in the
world’s two largest economies, USA and Japan, is on the decline. Due to mid-year weakness, calendar
year global GDP growth projections are tentatively being downgraded by about 0.2 percentage points to
2.3 percent in 2012 and by 0.6 percentage points in 2013 to 2.4 percent, mainly because of the recession
in the Eurozone. Threats to the recovery lie in the difficulties of implementing Eurozone fiscal
consolidation; remaining global uncertainty, and the risk of an uncontrolled unwinding of China’s high
investment rates. To further complicate the situation, low stocks of maize and wheat could result in even
higher food prices with serious consequences for the poor.
Since the highly volatile second quarter of 2012 ended, global financial market tensions have eased
significantly, thanks mainly to the announcement of European Central Bank (ECB) measures to
defend the Eurozone, but significant risks remain in the global economy. In early September, with the
actual launch of ECB’s bond-buying program and the favorable German Constitutional Court ruling on
the European Stability Mechanism (ESM), the risk of an acute crisis subsided considerably, and
borrowing costs for high-spread countries like Italy and Spain fell steeply (Figure 1). Emerging markets
bond spreads (EMBIG) have declined by 80 basis points (bps) since June to their long-term averages
(about 310 bps). Since early June global equity markets have also rebounded: stocks in high-income
countries are up 10.7 percent so far for 2012 and in developing countries by 8.1 percent.
Similarly, gross capital flows seem to be recovering. All capital flows to developing countries
(international bond issues, cross-border syndicated bank loans, and equity placements), which fell by 30–
40 percent toward the end of the second quarter in June, returned to first-quarter levels in the third
quarter. As the Eurozone deleveraging unwound, syndicated bank lending to developing countries nearly
doubled in August, though it is still more than 30 percent below 2011 levels. After capital flows eased in
August—a normal seasonal lull— gross flows in September outdid every other month since 2007 totaling
$408 billion, a slight increase over 2011. The surge in bond issues by developing countries compensated
for the declines in syndicated bank lending and equity issues.
Developing countries have been leading the upswing in economic activity (Figure 2). Industrial
production grew at a 5.8 percent annualized pace in Q3. China’s GDP expanded by 9.1 percent (q/q,
annualized), up from 8.2 percent in Q2, led by the services sector. Among high-income countries the
situation is more nuanced. There was an acceleration in the United States in Q2 (2.7 percent q/q
annualized ) supported by solid growth in residential investment, but it was followed by an abrupt
contraction in Q3 (-3 percent q/q annualized). In the Eurozone industrial production picked up in Q3 but
not enough to avert a contraction for the quarter in GDP (–0.1, q/q).
But leading indicators suggest a mixed picture for the last quarter of 2012. Recent Purchasing
Managers Indexes (PMIs) suggest that manufacturing is looking healthier in Q4 for the United States (but
note that the PMI was carried out before Hurricane Sandy) and for developing countries like China,
Brazil, Indonesia, India, Russia, and Turkey, many of which have benefitted from a recent easing of
policy rates. Although Eurozone industrial activity stabilized in Q3, PMI for both core and periphery Euro
2
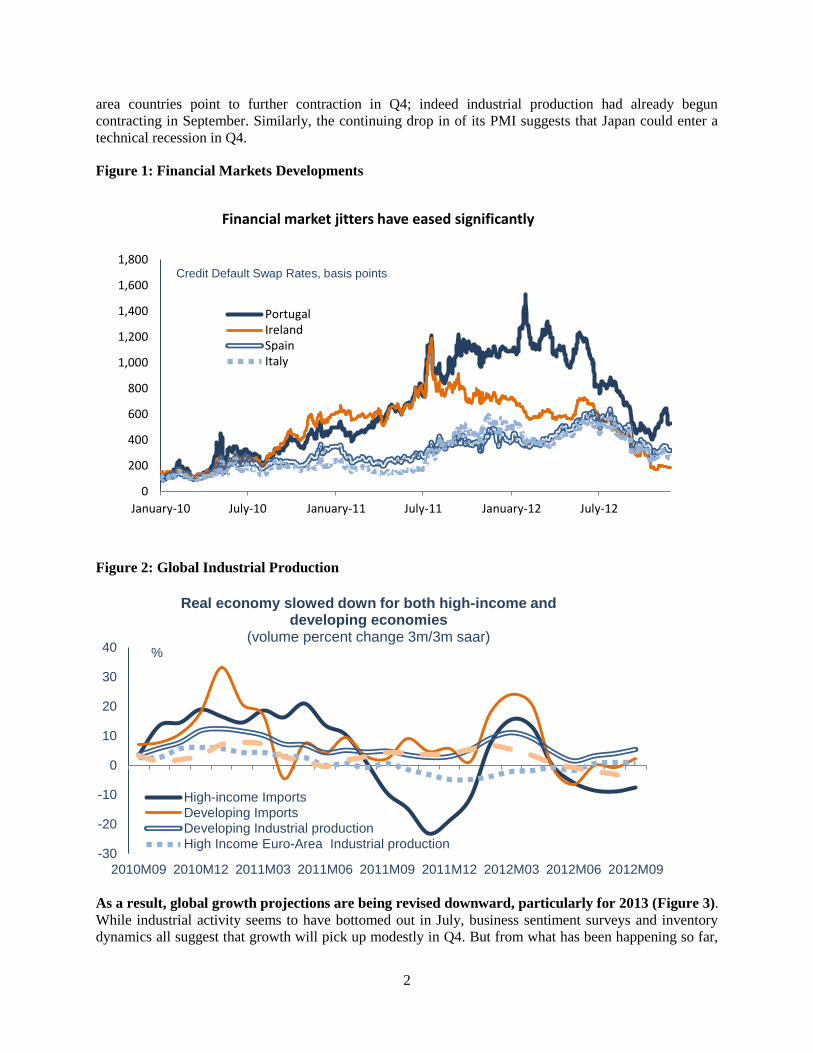
area countries point to further contraction in Q4; indeed industrial production had already begun
contracting in September. Similarly, the continuing drop in of its PMI suggests that Japan could enter a
technical recession in Q4.
Figure 1: Financial Markets Developments
Figure 2: Global Industrial Production
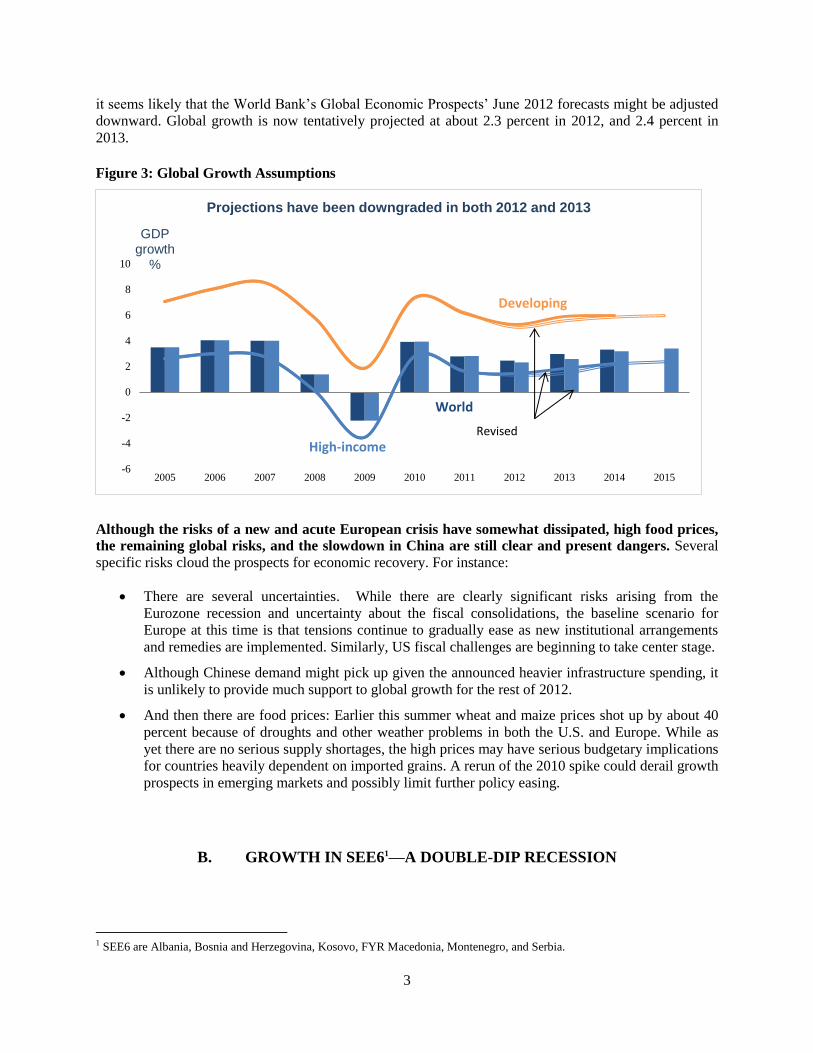
As a result, global growth projections are being revised downward, particularly for 2013 (Figure 3).
While industrial activity seems to have bottomed out in July, business sentiment surveys and inventory
dynamics all suggest that growth will pick up modestly in Q4. But from what has been happening so far,
0
200
400
600
800
1,000
1,200
1,400
1,600
1,800
January-10 July-10 January-11 July-11 January-12 July-12
Financial market jitters have eased significantly
PortugalIrelandSpainItaly
Credit Default Swap Rates, basis points
-30
-20
-10
0
10
20
30
40
2010M09 2010M12 2011M03 2011M06 2011M09 2011M12 2012M03 2012M06 2012M09
Real economy slowed down for both high-income and developing economies
(volume percent change 3m/3m saar)
High-income Imports
Developing Imports
Developing Industrial production
High Income Euro-Area Industrial production
%
3
it seems likely that the World Bank’s Global Economic Prospects’ June 2012 forecasts might be adjusted
downward. Global growth is now tentatively projected at about 2.3 percent in 2012, and 2.4 percent in
2013.
Figure 3: Global Growth Assumptions
Although the risks of a new and acute European crisis have somewhat dissipated, high food prices,
the remaining global risks, and the slowdown in China are still clear and present dangers. Several
specific risks cloud the prospects for economic recovery. For instance:
There are several uncertainties. While there are clearly significant risks arising from the
Eurozone recession and uncertainty about the fiscal consolidations, the baseline scenario for
Europe at this time is that tensions continue to gradually ease as new institutional arrangements
and remedies are implemented. Similarly, US fiscal challenges are beginning to take center stage.
Although Chinese demand might pick up given the announced heavier infrastructure spending, it
is unlikely to provide much support to global growth for the rest of 2012.
And then there are food prices: Earlier this summer wheat and maize prices shot up by about 40
percent because of droughts and other weather problems in both the U.S. and Europe. While as
yet there are no serious supply shortages, the high prices may have serious budgetary implications
for countries heavily dependent on imported grains. A rerun of the 2010 spike could derail growth
prospects in emerging markets and possibly limit further policy easing.
B. GROWTH IN SEE61—A DOUBLE-DIP RECESSION
1 SEE6 are Albania, Bosnia and Herzegovina, Kosovo, FYR Macedonia, Montenegro, and Serbia.
-6
-4
-2
0
2
4
6
8
10
2005 2006 2007 2008 2009 2010 2011 2012 2013 2014 2015
Projections have been downgraded in both 2012 and 2013
World
Developing
High-income Revised
GDP growth
%

4
After average annual growth of just 2 percent in 2010 and 2011, and mirroring Eurozone
developments, in the first half of 2012 SEE6 countries again entered recession. Led by Serbia, which
accounts for almost half of SEE6 GDP, regional economic activity faltered in part because of the severe
winter but also because of severely shrinking demand, both external and domestic (Table 1).
Table 1: South East Europe Six: Real Economic Growth, 2009–12
Source: SEE6 country statistics offices and World Bank staff (2013). Averages are GDP weighted.
General recession notwithstanding, growth in individual SEE6 countries varied widely. Serbia and
FYR Macedonia contracted most, by about 1.6 and 1.1 percent, respectively, in the first half of 2012.
Kosovo is an outlier whose real output continues to be propelled by remittances from the diaspora as well
as high public investments, and Albania’s economy grew 1 percent on the heels of domestic demand.
Lower exports and investments drove these developments; high unemployment keeps the lid on
consumption. Even with the expected gradual recovery in the second half of the year, the SEE6 as a group
will remain in recession for the year as a whole. Unemployment––the highest regional unemployment in
Europe, averaging about 25 percent (excluding Kosovo whose unemployment exceeds 40 percent, partly
offset by informal employment)––will keep rising.
The recovery was slowed by poor industrial performance. Across the region industrial output has been
sliding downhill for three consecutive quarters, from Q4 2011 through Q2 2012. The drop was most
severe in Q1 2012, when many factories had to shut down for weeks because of an unusually cold winter;
winter drought and associated hydropower shortages; and a drop in demand for industrial exports. As a
result, the weighted average growth of industrial output in the first quarter was –10.1 percent. The most
significant decline was in Albania (–20.3), followed by Montenegro (–14.7 percent) (Table 2)
2009 2010 2011 2012 H1 2012 H2
(proj.)
2012
(proj.)
ALB 3.3 3.5 3.0 1.0 0.6 0.8
BIH -2.9 0.7 1.3 -0.2 0.2 0.0
KOS 2.9 3.9 5.0 3.6 3.6 3.6
MKD -0.9 2.9 2.8 -1.1 1.0 0.0
MNE -5.7 2.5 3.2 -0.9 1.0 0.2
SRB -3.5 1.0 1.6 -1.6 -2.3 -2.0
SEE6 -1.8 1.8 2.2 -0.6 -0.5 -0.6
EU11 … 2.0 3.1 1.3 … 0.9
5
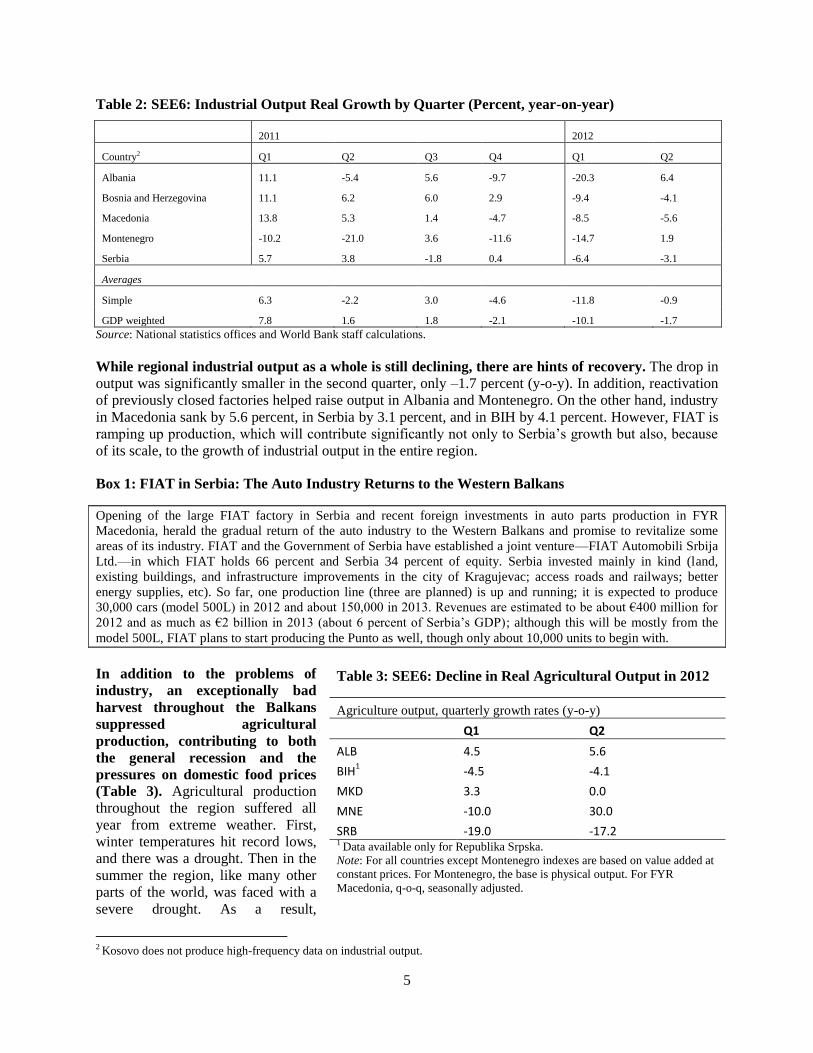
Table 2: SEE6: Industrial Output Real Growth by Quarter (Percent, year-on-year)
2011 2012
Country2 Q1 Q2 Q3 Q4 Q1 Q2
Albania 11.1 -5.4 5.6 -9.7 -20.3 6.4
Bosnia and Herzegovina 11.1 6.2 6.0 2.9 -9.4 -4.1
Macedonia 13.8 5.3 1.4 -4.7 -8.5 -5.6
Montenegro -10.2 -21.0 3.6 -11.6 -14.7 1.9
Serbia 5.7 3.8 -1.8 0.4 -6.4 -3.1
Averages
Simple 6.3 -2.2 3.0 -4.6 -11.8 -0.9
GDP weighted 7.8 1.6 1.8 -2.1 -10.1 -1.7
Source: National statistics offices and World Bank staff calculations.
While regional industrial output as a whole is still declining, there are hints of recovery. The drop in
output was significantly smaller in the second quarter, only –1.7 percent (y-o-y). In addition, reactivation
of previously closed factories helped raise output in Albania and Montenegro. On the other hand, industry
in Macedonia sank by 5.6 percent, in Serbia by 3.1 percent, and in BIH by 4.1 percent. However, FIAT is
ramping up production, which will contribute significantly not only to Serbia’s growth but also, because
of its scale, to the growth of industrial output in the entire region.
Box 1: FIAT in Serbia: The Auto Industry Returns to the Western Balkans
Opening of the large FIAT factory in Serbia and recent foreign investments in auto parts production in FYR
Macedonia, herald the gradual return of the auto industry to the Western Balkans and promise to revitalize some
areas of its industry. FIAT and the Government of Serbia have established a joint venture––FIAT Automobili Srbija
Ltd.––in which FIAT holds 66 percent and Serbia 34 percent of equity. Serbia invested mainly in kind (land,
existing buildings, and infrastructure improvements in the city of Kragujevac; access roads and railways; better
energy supplies, etc). So far, one production line (three are planned) is up and running; it is expected to produce
30,000 cars (model 500L) in 2012 and about 150,000 in 2013. Revenues are estimated to be about €400 million for
2012 and as much as €2 billion in 2013 (about 6 percent of Serbia’s GDP); although this will be mostly from the
model 500L, FIAT plans to start producing the Punto as well, though only about 10,000 units to begin with.
In addition to the problems of
industry, an exceptionally bad
harvest throughout the Balkans
suppressed agricultural
production, contributing to both
the general recession and the
pressures on domestic food prices
(Table 3). Agricultural production
throughout the region suffered all
year from extreme weather. First,
winter temperatures hit record lows,
and there was a drought. Then in the
summer the region, like many other
parts of the world, was faced with a
severe drought. As a result,
2 Kosovo does not produce high-frequency data on industrial output.
Table 3: SEE6: Decline in Real Agricultural Output in 2012
Agriculture output, quarterly growth rates (y-o-y)
Q1 Q2
ALB 4.5 5.6
BIH1 -4.5 -4.1
MKD 3.3 0.0
MNE -10.0 30.0
SRB -19.0 -17.2 1 Data available only for Republika Srpska.
Note: For all countries except Montenegro indexes are based on value added at
constant prices. For Montenegro, the base is physical output. For FYR
Macedonia, q-o-q, seasonally adjusted.

6
agricultural output plunged. And the results for the third quarter might be particularly bad for countries
that have concentrated their agricultural activities in cereals and fruit production. Serbia, and to some
extent BIH, were hit hardest. In the first half of the year alone Serbia saw value-added in agriculture drop
by 18 percent. As a result, food and general CPI inflation in SEE6 reversed the downward trend that had
begun in March 2012 (Figure 4).
Figure 4: SEE6: Inflation––CPI and Food (Percent)
Source: SEE6 national statistics offices.
C. LABOR MARKETS––A CONTINUING CRISIS
With a double-dip recession, unemployment in the SEE6 continues to rise. Three years after the
global crisis hit the region, labor markets in most of its economies are still deteriorating. Unemployment
in Serbia and BIH, is much higher in 2012 than it was in 2008 (Figure 5). Serbia’s unemployment rate
soared by 11 percentage points—an unprecedented loss of jobs (Box 2)—and in BIH the rate went up by
almost 5 percentage points. Among Europe and Central Asian developing countries only the three Baltic
States had seen unemployment rate hikes as high as 11–12 percentage points during the global crisis, but
by 2011 all three countries had pushed the rates down 2.5–4.5 percentage points. Moreover, the job losses
in the Baltics resulted from the sharp economic recession and double-digit declines in output. In contrast,
the output contraction in Serbia and BIH has been much milder, but the labor market deterioration has
been much more protracted. Montenegro’s unemployment rate is also higher than it was before the crisis,
though the impact has been less stark. Albania is probably in the same group, with a return of some
migrants from Greece, adding to the unemployment problem, but labor force survey data are not
available. FYR Macedonia and Kosovo performed better because these economies have been growing
moderately in recent years.
-4
-2
0
2
4
6
8
10
12
14
16
1 2 3 4 5 6 7 8 9 10 11 12 1 2 3 4 5 6 7 8 9 10 11 12 1 2 3 4 5 6 7 8 9 10 11
2010 2011 2012
Inflation (y-o-y)
Food inflation (y-o-y)

7
Figure 5: Change in SEE6 Unemployment Rates, 2008 and 2012 (Percentage points)*
Source: Labor force surveys (LFS) of national statistical offices.
* Latest 2011 LFS data not available for Kosovo and Albania.
High unemployment is still a major economic and social challenge for the region (Figure 6). Kosovo,
with unemployment at 43.5 percent, FYR Macedonia, 31 percent, and BIH and Serbia, at about 28
percent are outliers in Europe as a whole and also rank high globally. According to the World Bank’s
World Development Indicators, few countries in the world have unemployment rates higher than 25
percent. As mentioned in previous issues of this report, youth and long-term unemployment are
particularly daunting problems for the region. A prolonged economic downturn would add to the already
chronic problem of long-term unemployment.
Figure 6: Unemployment Rates, SEE6 and EU10
Source: Labor Force Surveys of National Statistical Offices.
Note: Data for Kosovo for 2010–11 are not available; data for Albania from administrative sources. EU10 countries
encompass Bulgaria, Czech Republic, Estonia, Hungary, Latvia, Lithuania, Poland, Romania, Slovak Republic, and
Slovenia. EU11 also includes Croatia.
-4.0
-2.0
0.0
2.0
4.0
6.0
8.0
10.0
12.0
Macedonia, FYR Montenegro BiH Serbia
8
Box 2: Soaring Unemployment in Serbia
Unemployment rocketed up in Serbia as a result of the 2008-9 economic crisis and continued to head upward
in 2010–2011 even though the economy returned to mildly positive growth; with return to recession in 2012, it
is likely to get worse before it gets better. Estimates from the Labor Force Survey (LFS) panel suggest that the
share of unemployed in the total active population (age 15+) increased from 15.8 percent in April 2009 to 19.5
percent in April 2010, 22.5 percent in April 2011, and 23.7 percent in November 2011.
Inactivity is also on the rise. In 2009–11 not only did the number of unemployed increase by more than 250,000
but the economically active population decreased by over 340,000. Estimates based on the LFS panel suggest that
labor inactivity was particularly high when the global crisis began, and a quarter of those employed informally
transitioned to inactivity between April 2008 and April 2009. Of those unemployed in April of 2008 more than 20
percent had dropped out of the labor market by April 2009.
Finding work for the unemployed is extremely difficult. Of those unemployed in April 2009, 85 percent still had
no jobs in April 2010, and only 9 percent had managed to transition into employment, most commonly in the formal
sector. Similarly, of those unemployed in April 2010, 83 percent were still unemployed in April 2011, while the
share of those moving to employment was still less than 10 percent.
Source: World Bank (2012c), based on Serbia Labor Force Survey panel data.
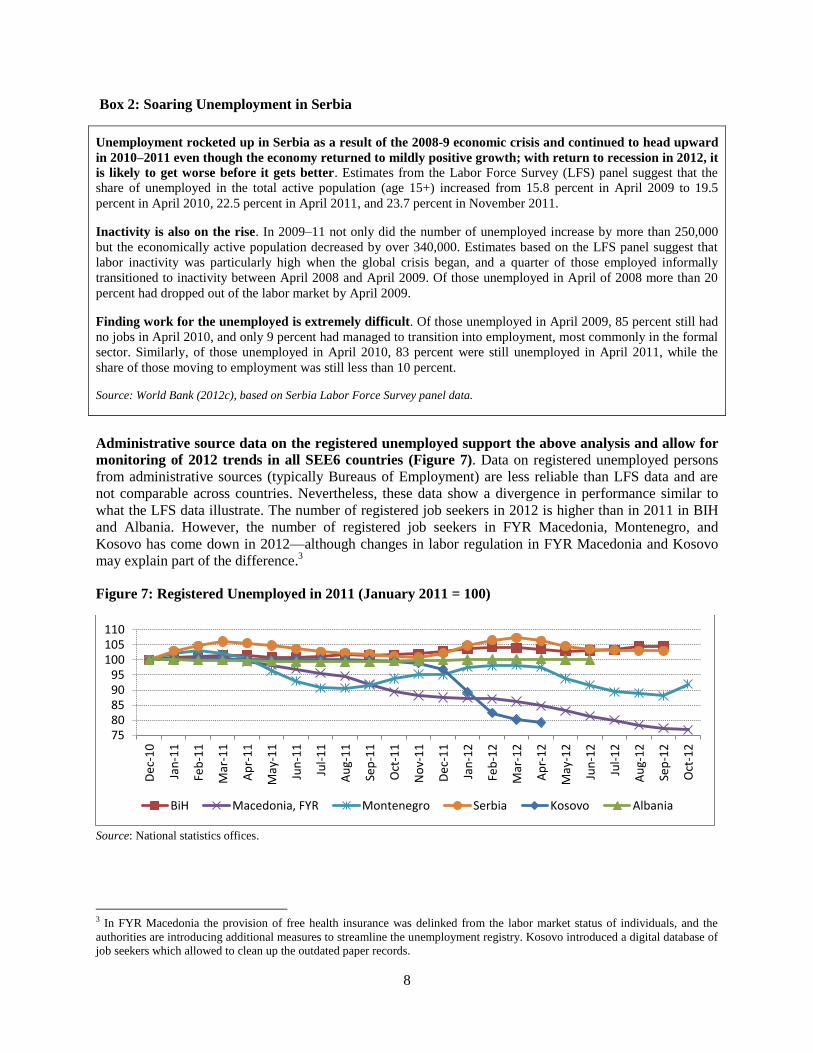
Administrative source data on the registered unemployed support the above analysis and allow for
monitoring of 2012 trends in all SEE6 countries (Figure 7). Data on registered unemployed persons
from administrative sources (typically Bureaus of Employment) are less reliable than LFS data and are
not comparable across countries. Nevertheless, these data show a divergence in performance similar to
what the LFS data illustrate. The number of registered job seekers in 2012 is higher than in 2011 in BIH
and Albania. However, the number of registered job seekers in FYR Macedonia, Montenegro, and
Kosovo has come down in 2012—although changes in labor regulation in FYR Macedonia and Kosovo
may explain part of the difference.3
Figure 7: Registered Unemployed in 2011 (January 2011 = 100)
Source: National statistics offices.
3 In FYR Macedonia the provision of free health insurance was delinked from the labor market status of individuals, and the
authorities are introducing additional measures to streamline the unemployment registry. Kosovo introduced a digital database of
job seekers which allowed to clean up the outdated paper records.
7580859095
100105110
De
c-1
0
Jan
-11
Feb
-11
Mar
-11
Ap
r-1
1
May
-11
Jun
-11
Jul-
11
Au
g-1
1
Sep
-11
Oct
-11
No
v-1
1
De
c-1
1
Jan
-12
Feb
-12
Mar
-12
Ap
r-1
2
May
-12
Jun
-12
Jul-
12
Au
g-1
2
Sep
-12
Oct
-12
BiH Macedonia, FYR Montenegro Serbia Kosovo Albania

9
The labor market participation rate in SEE6 countries has traditionally been lower than in EU
countries, ranging from 44 percent in BIH to 56 percent in FYR Macedonia.4 The participation rate held
relatively steady between 2011 and 2012. The largest change was in Montenegro: an increase of 0.5
percentage points, mirrored by the rise in the employment rate. Serbia, on the other hand, has seen labor
participation decrease over the last three years. This pull-out of the labor force represents additional,
“hidden unemployment” beyond the official figures.
The LFS employment data available for 2012 show a mixed picture at best (Figure 8). Regionally,
employment rates are highest in Montenegro and lowest in BIH. Employment continues to slide in Serbia
and in BIH. Serbia has lost about 680,000 jobs since 2008––a staggering 30 percent of total employment
in 2012. These losses seem to be concentrated in agriculture, finance, and construction—sectors that are
particularly hard hit by cyclical and structural factors. On the other hand, after losing jobs in the first
quarter of 2012 Montenegro made the biggest gain in employment in the second quarter, though this
comes partly from preparation for tourism, and annualized data show continued headwinds.
Figure 8: Employment Rates in SEE6 (2011–2012), in percent
Source: Labor force surveys of national statistical offices.
Wage movements in the region reflect labor market performance. With unemployment high, wages
in the SEE6 were mostly either stagnant (BIH) or declining (FYR Macedonia and Montenegro) with
inflation in the latter group causing an even greater drop in real wages (Figure 9 and Figure 10). The
exception is Serbia, where nominal wages have been on the rise (excluding the typical drop in January
after the hike in December caused by payment of the 13th month in salary).
4 Using “age 15 and above” to define the active population.
30
32
34
36
38
40
42
FYR Macedonia Montenegro Serbia BiH

10
Figure 9: Gross Average Nominal Wage Changes (January 2011 = 100)
Source: National statistics offices.
Figure 10: Employment and Real Wage Index (December 2010 = 100)
Source: National statistics offices and World Bank staff estimates.
The jobs challenge in the region is also a social inclusion challenge: Low labor force participation
masks huge inequalities to the disadvantage of women, youth, those who are less educated, and ethnic
minorities. The share of women employed or actively seeking a job is relatively low in SEE6, which
could be interpreted as hidden unemployment. For example, in Kosovo female employment stands at a
mere 9.2 percent, less than one fourth the employment of males. Labor market outcomes also vary
90
95
100
105
110
115
120
125
130Ja
n-1
1
Feb
-11
Mar
-11
Ap
r-1
1
May
-11
Jun
-11
Jul-
11
Au
g-1
1
Sep
-11
Oct
-11
No
v-1
1
De
c-1
1
Jan
-12
Feb
-12
Mar
-12
Ap
r-1
2
May
-12
Jun
-12
Jul-
12
Au
g-1
2
Sep
-12
Oct
-12
BiH Macedonia, FYR Montenegro Serbia

11
substantially across ethnic groups; for example, Roma are much more likely to be unemployed than
individuals from other ethnic groups, and the labor force participation rate among Albanian women is
almost negligible compared to that of other ethnicities.
Addressing the job creation challenge will require governments to move beyond reforms of labor
market institutions and active labor market policies. As discussed in the World Bank report Jobs in
Eastern Europe and Central Asia and the World Development Report 2013 on Jobs, poor labor market
and social inclusion outcomes are the result of multiple, highly interconnected factors, such as labor
demand patterns, skills mismatches, impediments to labor mobility, limited effectiveness of labor market
intermediation mechanisms, poorly aligned higher education systems. The economic crisis facing most of
the countries continues to compound pre-existing structural weaknesses, with labor force participation
falling and unemployment and poverty on the rise. Moreover, as populations in most countries in the
region age, the number of retirees in comparison to the working age population is rapidly growing, adding
stress to labor markets and the entire social model. Without swift policy action, the situation is likely to
deteriorate. Meeting these challenges through an array of measures for fostering growth, competitiveness,
and job creation could boost living standards, productivity, and social cohesion (Box 3). More productive
and well-paying jobs, as the World Development Report 2013 demonstrates, can improve living standards
by providing earnings, lift people out of poverty and raise their consumption; and raise productivity. They
can also strengthen social cohesion when economic opportunities open for all socio-economic and
demographic groups.
Are labor regulations to blame for the poor performance of SEE6 labor markets? The answer seems
to be: partly, yes. In countries where the majority of jobs are created by the private sector, labor
regulations can facilitate or impede job creation and wage earnings. Labor markets need to be regulated to
protect workers from unfair treatment and ensure efficient contracting between employers and workers.
Excessive regulations, however, may go beyond addressing market distortions and constrain job creation.
So where are the SEE6 countries on the regulatory spectrum? Two global indexes help answer this
question: the World Bank Doing Business “employing workers” index5 and the “labor efficiency” index
of the World Economic Forum (WEF). The Doing Business index looks at indicators that measure
flexibility in the regulation of hiring, working hours, and redundancy. These three aspects of labor
regulations are measured using 21 sub-indicators (Figure 11Figure 12: contains the 12 that have the most
heterogeneity in the SEE6).
5 www.doingbusiness.org.
12
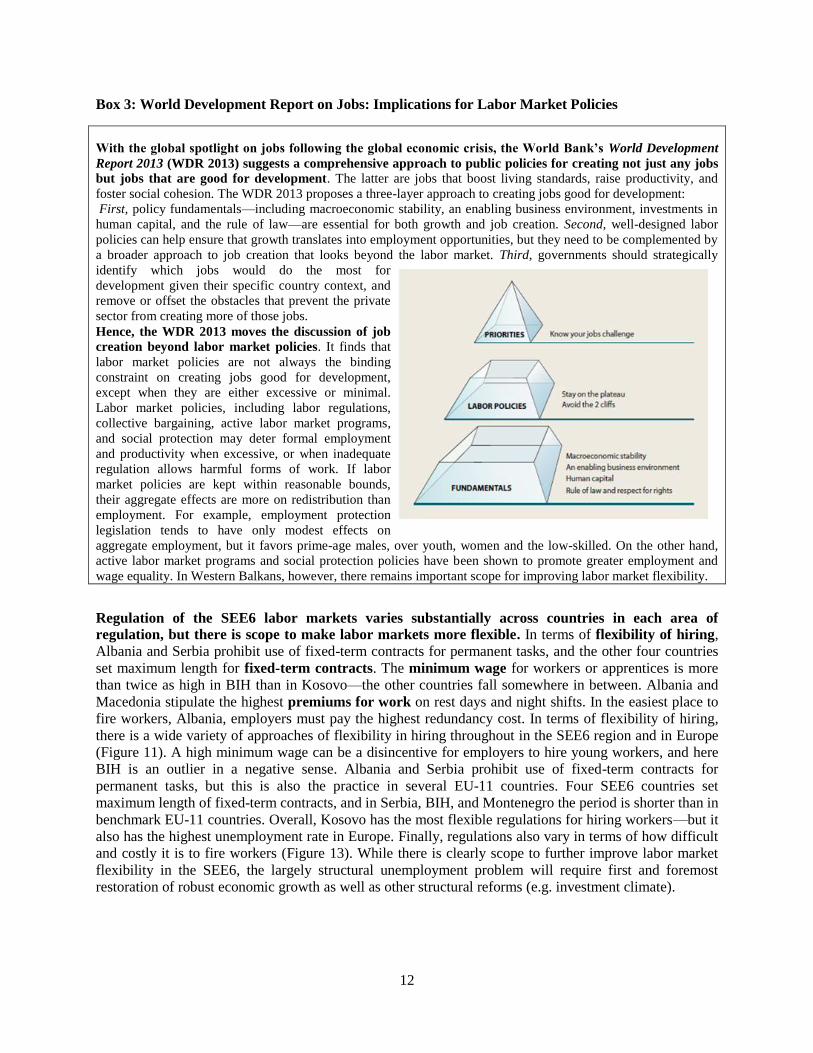
Box 3: World Development Report on Jobs: Implications for Labor Market Policies
With the global spotlight on jobs following the global economic crisis, the World Bank’s World Development
Report 2013 (WDR 2013) suggests a comprehensive approach to public policies for creating not just any jobs
but jobs that are good for development. The latter are jobs that boost living standards, raise productivity, and
foster social cohesion. The WDR 2013 proposes a three-layer approach to creating jobs good for development:
First, policy fundamentals—including macroeconomic stability, an enabling business environment, investments in
human capital, and the rule of law—are essential for both growth and job creation. Second, well-designed labor
policies can help ensure that growth translates into employment opportunities, but they need to be complemented by
a broader approach to job creation that looks beyond the labor market. Third, governments should strategically
identify which jobs would do the most for
development given their specific country context, and
remove or offset the obstacles that prevent the private
sector from creating more of those jobs.
Hence, the WDR 2013 moves the discussion of job
creation beyond labor market policies. It finds that
labor market policies are not always the binding
constraint on creating jobs good for development,
except when they are either excessive or minimal.
Labor market policies, including labor regulations,
collective bargaining, active labor market programs,
and social protection may deter formal employment
and productivity when excessive, or when inadequate
regulation allows harmful forms of work. If labor
market policies are kept within reasonable bounds,
their aggregate effects are more on redistribution than
employment. For example, employment protection
legislation tends to have only modest effects on
aggregate employment, but it favors prime-age males, over youth, women and the low-skilled. On the other hand,
active labor market programs and social protection policies have been shown to promote greater employment and
wage equality. In Western Balkans, however, there remains important scope for improving labor market flexibility.
Regulation of the SEE6 labor markets varies substantially across countries in each area of
regulation, but there is scope to make labor markets more flexible. In terms of flexibility of hiring,
Albania and Serbia prohibit use of fixed-term contracts for permanent tasks, and the other four countries
set maximum length for fixed-term contracts. The minimum wage for workers or apprentices is more
than twice as high in BIH than in Kosovo—the other countries fall somewhere in between. Albania and
Macedonia stipulate the highest premiums for work on rest days and night shifts. In the easiest place to
fire workers, Albania, employers must pay the highest redundancy cost. In terms of flexibility of hiring,
there is a wide variety of approaches of flexibility in hiring throughout in the SEE6 region and in Europe
(Figure 11). A high minimum wage can be a disincentive for employers to hire young workers, and here
BIH is an outlier in a negative sense. Albania and Serbia prohibit use of fixed-term contracts for
permanent tasks, but this is also the practice in several EU-11 countries. Four SEE6 countries set
maximum length of fixed-term contracts, and in Serbia, BIH, and Montenegro the period is shorter than in
benchmark EU-11 countries. Overall, Kosovo has the most flexible regulations for hiring workers—but it
also has the highest unemployment rate in Europe. Finally, regulations also vary in terms of how difficult
and costly it is to fire workers (Figure 13). While there is clearly scope to further improve labor market
flexibility in the SEE6, the largely structural unemployment problem will require first and foremost
restoration of robust economic growth as well as other structural reforms (e.g. investment climate).

13
Figure 11: SEE6 Difficulty of Hiring Workers
Source: Doing Business report 2013.
Notes: Size of bubble depicts minimum wage of a 19-year-old worker. Blue color countries allow the use of fixed-term contracts
for permanent tasks.
*Albania and Kosovo have no limit on the maximum length of fixed-term contracts.
Figure 12: SEE6 Premiums on Night Shift and Work on Rest Days
Source: World Bank’s Doing Business 2013.
Albania
Bulgaria
BIH
Croatia
Czech R. Estonia
Kosovo
Macedonia
Montenegro
Romania Serbia
0.00
0.10
0.20
0.30
0.40
0.50
0.60
0.70
0.80
0 20 40 60 80 100 120 140
Rat
io o
f m
inim
um
wag
e t
o v
alu
e a
dd
ed
pe
r w
ork
er
Maximum length of fixed-term contracts (months)*
0
20
40
60
80
100
120
Premium for night work (% of hourly pay)
Premium for work on weekly rest day (% of hourly pay)
14
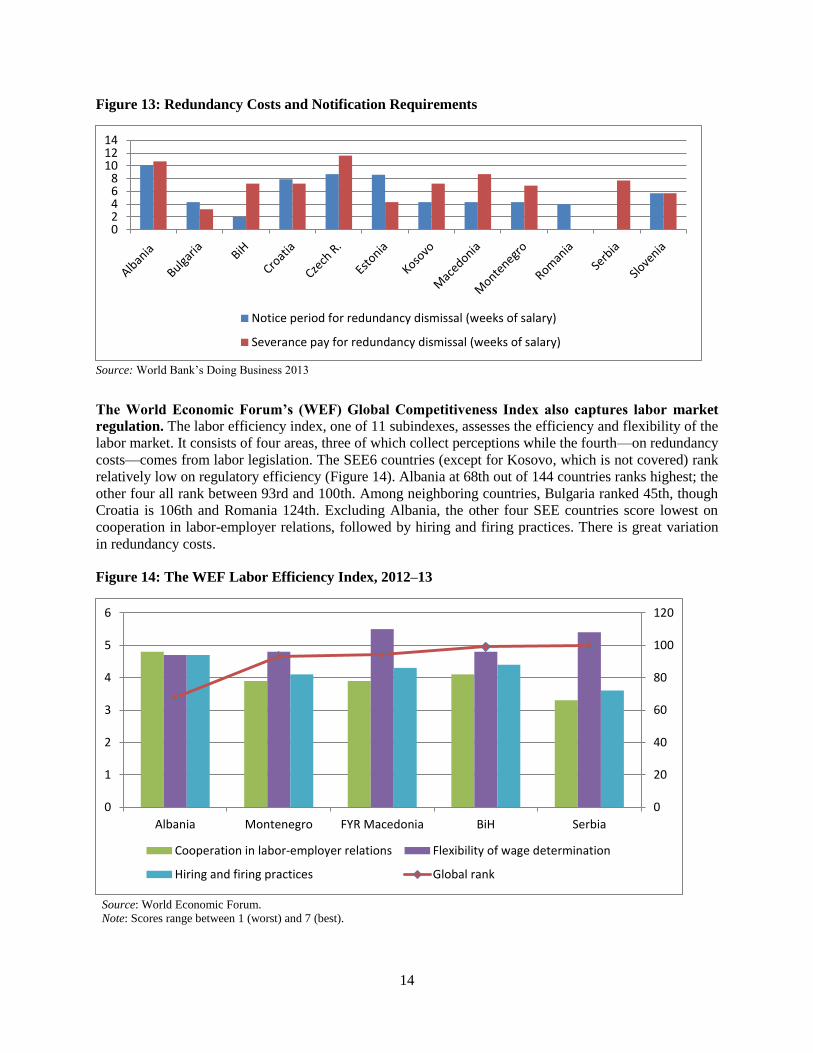
Figure 13: Redundancy Costs and Notification Requirements
Source: World Bank’s Doing Business 2013
The World Economic Forum’s (WEF) Global Competitiveness Index also captures labor market
regulation. The labor efficiency index, one of 11 subindexes, assesses the efficiency and flexibility of the
labor market. It consists of four areas, three of which collect perceptions while the fourth—on redundancy
costs—comes from labor legislation. The SEE6 countries (except for Kosovo, which is not covered) rank
relatively low on regulatory efficiency (Figure 14). Albania at 68th out of 144 countries ranks highest; the
other four all rank between 93rd and 100th. Among neighboring countries, Bulgaria ranked 45th, though
Croatia is 106th and Romania 124th. Excluding Albania, the other four SEE countries score lowest on
cooperation in labor-employer relations, followed by hiring and firing practices. There is great variation
in redundancy costs.
Figure 14: The WEF Labor Efficiency Index, 2012–13
Source: World Economic Forum.
Note: Scores range between 1 (worst) and 7 (best).
02468
101214
Notice period for redundancy dismissal (weeks of salary)
Severance pay for redundancy dismissal (weeks of salary)
0
20
40
60
80
100
120
0
1
2
3
4
5
6
Albania Montenegro FYR Macedonia BiH Serbia
Cooperation in labor-employer relations Flexibility of wage determination
Hiring and firing practices Global rank

15
In a nutshell, given high unemployment SEE6 countries still have a considerable distance to go to
improve labor market institutions and regulations. But it is true that factors outside labor market, such
as slow growth, weak investment and consumption, investment climate deficiencies, and economic
bottlenecks are also contributing to the exceptionally bad SEE6 labor market outcomes. Job creation is
determined by numerous factors, labor regulations being a major determinant. SEE6 countries suffer from
low levels of employment partly because of the legacy of economic transformation in the 1990s, when a
substantial share of capital was rendered obsolete. Labor regulations to promote job creation could to
some extent make up for the slack demand for workers. The above analysis shows that even though the
SEE6 are similar to the EU-11 countries, they have ample opportunities to promote job creation by
simplifying labor regulations. Areas for reform differ by country, but the results will likely depend on
factors such as the robustness and structure of economic growth and the quality of the investment climate,
especially for small and medium size businesses that are incubators of job creation.
D. TRADE AND EXTERNAL DEBT—WORSENING
The SEE6 countries are closely linked economically with the EU, so what happens in the SEE6
external sector is highly correlated to what is happening in the EU. The linkage was obvious in the
deterioration throughout the SEE6 in trade, current account deficits (CADs), FDI, and transfers in the first
half of 2012. The outlier this time was Albania, whose trade and external developments have
outperformed the rest of the region, partly because of higher oil and mineral exports.
Exports and Imports
Progressive integration of SEE6 economies into
the EU means that EU trade is central to SEE6
export performance and economic growth
generally. Even with demand subdued, the EU
still accounted for 58 percent of all SEE6 exports
in the first half of 2012 (down slightly from 58.8
percent in 2011). The lion’s share, 27.6 percent
(down from 28.7 percent in 2011), goes to Italy
and Germany (Figure 15).
Intraregional trade remains very important in
SEE6 countries. This is especially so for FYR
Macedonia, BIH, Serbia, Montenegro, and
Kosovo, while a large share of Albania’s exports
are directed toward Italy and other EU countries.
The share in GDP of intraregional exports
increased from 28.3 percent in 2011 to 30.6
percent in 2012, mainly because exports to other
countries fell. Albania had the largest real growth of exports to the SEE6 in 2012, followed by Kosovo
and Montenegro. The export shifts to the latter were also affected by a steep drop in their exports to EU
when prices of metals dropped (Figure 16 and Figure 17).
Figure 15: Exports (% of GDP)
Source: SEE6 central banks and UNCTAD.

16
Figure 16: Growth in Exports to SEE6 (%)
Figure 17: Export Growth, SEE6 and EU (%)
Source: SEE6 central banks and Eurostat.
Source: SEE6 central banks and Eurostat.
SEE6 exports slowed in the second half of 2011 and the first half of 2012 because of both weak
demand in the Eurozone and bad weather. In 2011 SEE6 exports grew by 14.0 percent, compared to
14.4 percent for the EU10, but they began to decline toward year-end. Besides an exceptionally harsh
winter, the main cause of falling exports across the region is the adverse economic climate in the EU,
which is resulting in lower import demand and especially lower metal prices. As a result, the weighted
average decline in the first half of 2012 was not marginal at –2.7 percent. Exports in some SEE6 countries
declined more than in others because EU demand fell (Figure 18 and Figure 19).
Figure 18: Exports and Economic Growth (%)
Figure 19: Import Growth (%)
Source: SEE6 central banks and Eurostat.
Note: Export growth is in bars, real GDP growth in lines.
Source: SEE6 central banks and Eurostat.
The dynamics of SEE6 imports reflected the recent weakening of domestic demand and the overall
economic activity. Imports strengthened in 2011 across the region, growing 13.8 percent thanks to
domestic demand and FDI. However, in the first half of 2012 imports moderated to about 1.6 percent
growth y-o-y as domestic demand weakened and industrial production declined (Figure 20). The value of
imports in Albania in the first half of 2012, for instance, declined by –1.8 percent, mainly because of
lower domestic demand for food and raw materials and lower imports of energy in the second quarter as
weather conditions eased.

17
Figure 20: Export and Import Growth (% y-o-y)
Source: SEE6 central banks.
Note: Data for 2012 are for the first half of the year
Current Account Deficits and Trade Balances
Although current account deficits (CAD) and trade balances improved significantly after the crisis,
both have since deteriorated across the region. The slide began in 2011 (Figure 21), most visibly in
Kosovo, where current account and trade balances are deeply affected by construction of the highway to
Albania and the associated imports. In the first half of 2012 the problem accelerated in Serbia, BIH, and
Montenegro, mainly because trade deficits widened with the decline in exports and only moderate growth
in imports. The negative trend in both current account and trade balances is a corollary of the decline in
EU demand for SEE6 commodities. The other negative impact on current account balance came from a
drop of net transfers in Serbia (Figure 22).
Figure 21: CAD and Trade Balance (% of GDP)
Figure 22: CAD by Country (% of GDP)
-30
-20
-10
0
10
20
30
40
Exp Imp Exp Imp Exp Imp Exp Imp Exp Imp Exp Imp
ALB BIH KOS MKD MNE SRB
2010 2011 H1:2012

18
Source: Central banks, IMF WEO, and World Bank
staff calculations.
Source: SEE6 Central Banks.
Remittances and FDI
Though remittances have declined somewhat in the past two years, overall, they remained relatively
resilient to the Eurozone crisis. Serbia’s remittances sank from 9.5 percent in 2009 to 6.8 percent in
2011 and then to 5.8 percent in 2012, but
those of other countries were relatively flat
in 2012 (Figure 23). Surprisingly,
remittances to Albania have not declined
even though most of their migrants went to
Greece and Italy (probably for cultural and
demographic reasons). Otherwise, the
decline in remittances in SEE6 countries
seems to have been mitigated because their
migrants are working in better-performing
countries, such as Germany, Switzerland,
and Sweden. Also, contributing factors
were the repatriation of savings of
returning migrants (Albania), and labor
policies in many EU countries which
protect well-established migrants from
SEE6 countries.
FDI––which is important to financing, investment, and growth in the SEE6––saw a robust increase
of 20 percent in 2011 but has since fallen off noticeably (Figure 24 and Figure 25). FDI more than
doubled in Serbia and FYR Macedonia in 2011; car parts for industry and finance (FYR Macedonia) were
among the most successful sectors. But in the first half of 2012 FDI moderated in FYR Macedonia,
Kosovo, and even declined in Montenegro and Serbia, mainly because of the negative impact of EU
crisis, the high 2011 base in Serbia and FYR Macedonia, and significant outflows from Serbia. But
Albania received 30 percent more FDI, concentrated in financial intermediation, services, and industry;
and privatization of four small hydropower plants could result in additional revenues. By September, FDI
in Montenegro well recovered, rising by almost 12 percent on annual basis.
Figure 23: Worker Remittances 2008–2011 (% of GDP)
Source: SEE6 Central Banks.
ALB and BIH define remittances as including compensation of
employees; KOS, SRB, MK and MNE use narrower definitions.

19
Figure 24: Foreign Direct Investment (net, %
GDP)
Figure 25: FDI per Capita (net, US$)
Source: SEE6 central banks. Source: SEE6 central banks.
External Debt
With rapid deleveraging of the private sector, in 2012 total external debt declined in SEE6, but
public external debt continued to head upward as a result of governments’ external borrowing in
the context of weak recovery and government revenues. After peaking at 64.1 percent of GDP in 2010,
external debt declined to 60.7 percent in 2011. From June 2009 to September 2012 four countries
accessed international commercial markets by issuing Eurobonds (FYR Macedonia in 2009, Albania in
2010, Montenegro in 2010 and 2011, and Serbia in 2011 and 2012 (Figure 27) or tapping loan markets
with an IBRD guarantee (Serbia, FYR Macedonia, Montenegro) (Figure 28). In the SEE6 total external
debt varies widely, with Montenegro and Serbia not only having the highest debt but well above the
regional average, and Kosovo6 having the lowest (Figure 26).
Figure 27: SEE6 External Debt (Average,
percent of GDP)
Figure 28: Total International Bonds
Outstanding, Select SEE6 Countries (US$
million)
Source: Central banks and Ministries of Finance (MoF)
of SEE6.
Source: MoFs of SEE6 countries.
6 Unlike other SEE6 countries, Kosovo has very limited access to international financial markets and consequently little external
debt.
869
341 284 285 232 225
77
0
200
400
600
800
1,000
1,200
1,400
MNE SRB KOS SEE6 ALB MKD BIH
2010 2011
20
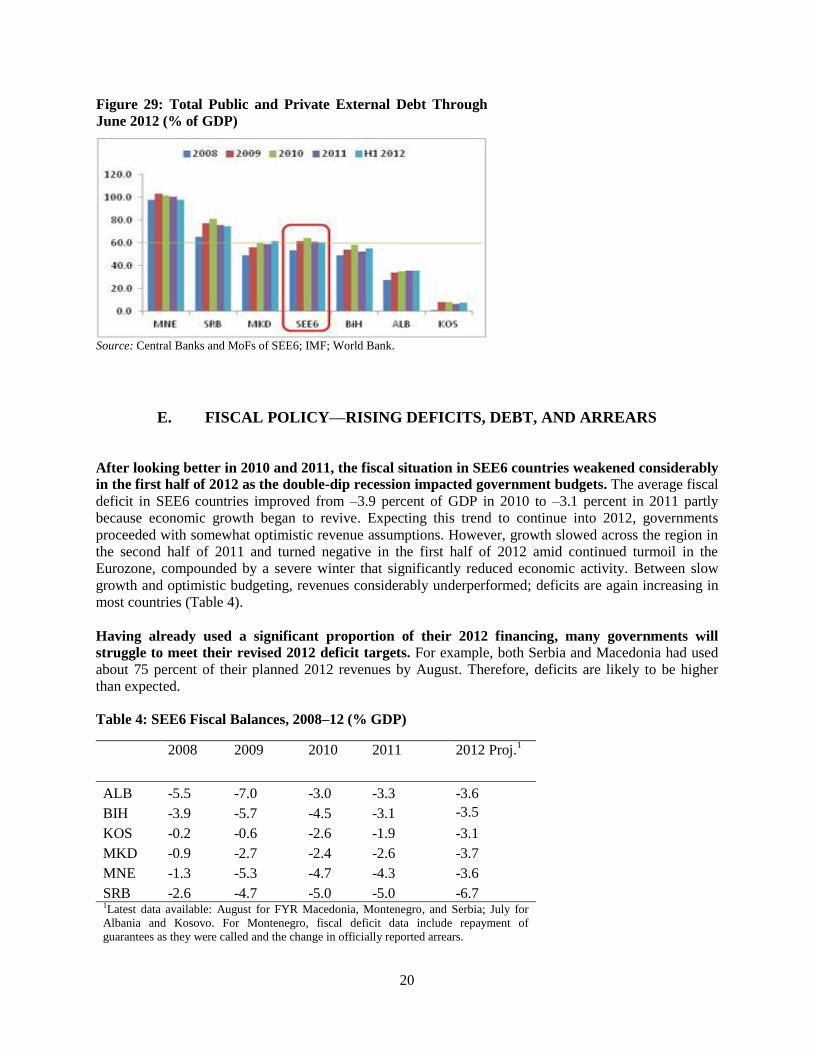
Figure 29: Total Public and Private External Debt Through
June 2012 (% of GDP)
Source: Central Banks and MoFs of SEE6; IMF; World Bank.
E. FISCAL POLICY––RISING DEFICITS, DEBT, AND ARREARS
After looking better in 2010 and 2011, the fiscal situation in SEE6 countries weakened considerably
in the first half of 2012 as the double-dip recession impacted government budgets. The average fiscal
deficit in SEE6 countries improved from –3.9 percent of GDP in 2010 to –3.1 percent in 2011 partly
because economic growth began to revive. Expecting this trend to continue into 2012, governments
proceeded with somewhat optimistic revenue assumptions. However, growth slowed across the region in
the second half of 2011 and turned negative in the first half of 2012 amid continued turmoil in the
Eurozone, compounded by a severe winter that significantly reduced economic activity. Between slow
growth and optimistic budgeting, revenues considerably underperformed; deficits are again increasing in
most countries (Table 4).
Having already used a significant proportion of their 2012 financing, many governments will
struggle to meet their revised 2012 deficit targets. For example, both Serbia and Macedonia had used
about 75 percent of their planned 2012 revenues by August. Therefore, deficits are likely to be higher
than expected.
Table 4: SEE6 Fiscal Balances, 2008–12 (% GDP)
2008 2009 2010 2011 2012 Proj.1
ALB -5.5 -7.0 -3.0 -3.3 -3.6
BIH -3.9 -5.7 -4.5 -3.1 -3.5
KOS -0.2 -0.6 -2.6 -1.9 -3.1
MKD -0.9 -2.7 -2.4 -2.6 -3.7
MNE -1.3 -5.3 -4.7 -4.3 -3.6
SRB
-2.6 -4.7 -5.0 -5.0 -6.7 1Latest data available: August for FYR Macedonia, Montenegro, and Serbia; July for
Albania and Kosovo. For Montenegro, fiscal deficit data include repayment of
guarantees as they were called and the change in officially reported arrears.
21
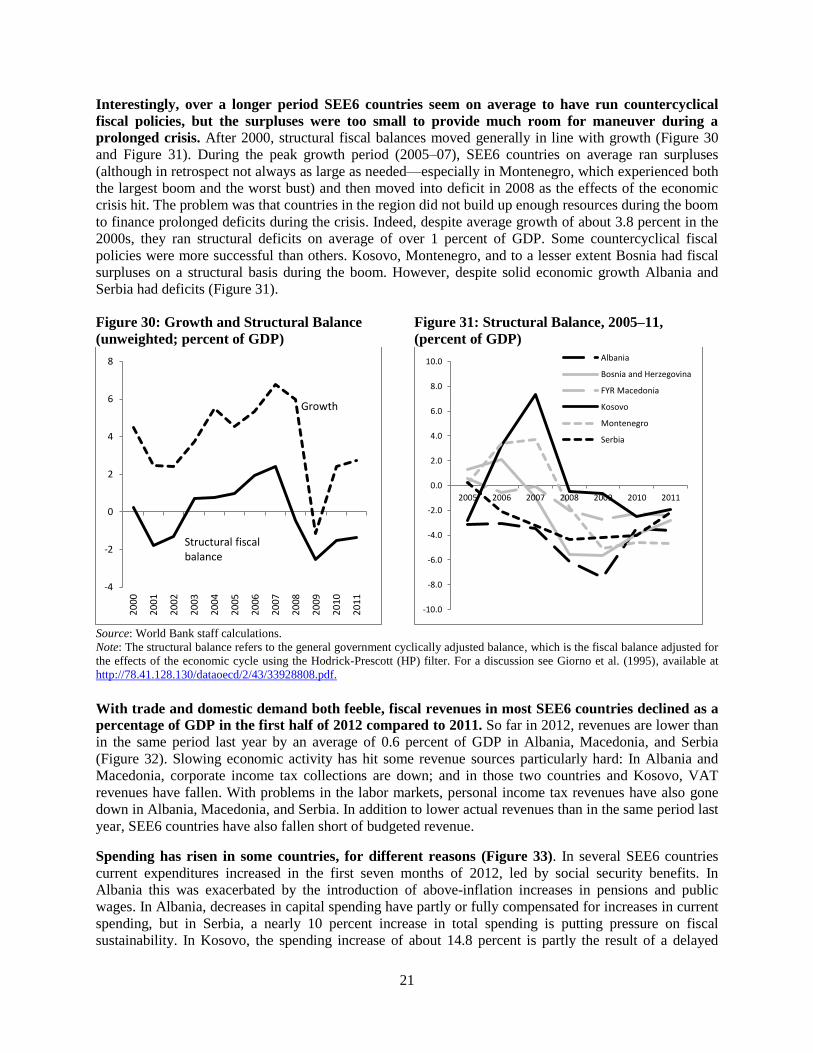
Interestingly, over a longer period SEE6 countries seem on average to have run countercyclical
fiscal policies, but the surpluses were too small to provide much room for maneuver during a
prolonged crisis. After 2000, structural fiscal balances moved generally in line with growth (Figure 30
and Figure 31). During the peak growth period (2005–07), SEE6 countries on average ran surpluses
(although in retrospect not always as large as needed—especially in Montenegro, which experienced both
the largest boom and the worst bust) and then moved into deficit in 2008 as the effects of the economic
crisis hit. The problem was that countries in the region did not build up enough resources during the boom
to finance prolonged deficits during the crisis. Indeed, despite average growth of about 3.8 percent in the
2000s, they ran structural deficits on average of over 1 percent of GDP. Some countercyclical fiscal
policies were more successful than others. Kosovo, Montenegro, and to a lesser extent Bosnia had fiscal
surpluses on a structural basis during the boom. However, despite solid economic growth Albania and
Serbia had deficits (Figure 31).
Figure 30: Growth and Structural Balance
(unweighted; percent of GDP)
Figure 31: Structural Balance, 2005–11,
(percent of GDP)
Source: World Bank staff calculations.
Note: The structural balance refers to the general government cyclically adjusted balance, which is the fiscal balance adjusted for
the effects of the economic cycle using the Hodrick-Prescott (HP) filter. For a discussion see Giorno et al. (1995), available at
http://78.41.128.130/dataoecd/2/43/33928808.pdf.
With trade and domestic demand both feeble, fiscal revenues in most SEE6 countries declined as a
percentage of GDP in the first half of 2012 compared to 2011. So far in 2012, revenues are lower than
in the same period last year by an average of 0.6 percent of GDP in Albania, Macedonia, and Serbia
(Figure 32). Slowing economic activity has hit some revenue sources particularly hard: In Albania and
Macedonia, corporate income tax collections are down; and in those two countries and Kosovo, VAT
revenues have fallen. With problems in the labor markets, personal income tax revenues have also gone
down in Albania, Macedonia, and Serbia. In addition to lower actual revenues than in the same period last
year, SEE6 countries have also fallen short of budgeted revenue.
Spending has risen in some countries, for different reasons (Figure 33). In several SEE6 countries
current expenditures increased in the first seven months of 2012, led by social security benefits. In
Albania this was exacerbated by the introduction of above-inflation increases in pensions and public
wages. In Albania, decreases in capital spending have partly or fully compensated for increases in current
spending, but in Serbia, a nearly 10 percent increase in total spending is putting pressure on fiscal
sustainability. In Kosovo, the spending increase of about 14.8 percent is partly the result of a delayed
-4
-2
0
2
4
6
8
20
00
20
01
20
02
20
03
20
04
20
05
20
06
20
07
20
08
20
09
20
10
20
11
Growth
Structural fiscal balance
-10.0
-8.0
-6.0
-4.0
-2.0
0.0
2.0
4.0
6.0
8.0
10.0
2005 2006 2007 2008 2009 2010 2011
Albania
Bosnia and Herzegovina
FYR Macedonia
Kosovo
Montenegro
Serbia

22
budget in 2011. However, unlike the other SEE6 countries, Kosovo’s capital spending also shot up, by
nearly 25 percent, mainly for transport projects to better connect with neighboring countries.
Figure 32: SEE6 Real Revenues, 2008–12
Figure 33: SEE6 Real Expenditures, 2008-12
Most SEE6 countries have, though at different paces, recognized the need to address the problems
head-on with attempts to increase revenues and curtail expenditures. Some SEE6 countries raised
excises (Montenegro) and VAT and the corporate income tax (Serbia) and moved to cut spending (FYR
Macedonia, Montenegro). But others, facing slow revenue collection combined with limited financing
options (BIH and Kosovo) sought financing from international financial institutions (IFIs). While other
SEE6 countries have been trying to control spending, despite the above-inflation raises in pensions and
salaries, Albania has chosen to wait to see if planned privatizations materialize first, an approach that
markets may penalize through higher yields if the expected revenues underperform.
50
60
70
80
90
100
110
120
130
140
150
2008 2009 2010 2011 2012
ALB BIH KOS
MKD MNE SRB50
60
70
80
90
100
110
120
130
140
2008 2009 2010 2011 2012
ALB BIH KOS
MKD MNE SRB

23
Box 4: Tax and Expenditure Arrears: A Growing Cause for Concern
With weak activity and budgets under pressure, most countries in the region have seen growth in arrears for
tax refunds and overdue government payments since 2008. Arrears are created when payments are not made
within a reasonable grace period after their due dates. However, the definition of arrears can change depending upon
the country and the type of bill. For example, in Montenegro, VAT refunds fall into arrears 60 days after the refund
request submission but wages do so if they are not paid on time. In Kosovo, for goods and services, any bill not paid
for 30 days after it has been entered into the treasury system is considered in arrears. The stock of arrears is difficult
to measure precisely but in the Western Balkans is estimated to average 1–3.5 percent of combined GDP.
The causes of arrears are complex and differ by country, but their impact on financial discipline, liquidity,
and economic activity can be detrimental. One of the main reasons for arrears has been overly optimistic revenue
forecasts that led to spending that cannot be covered by the revenue collected. This has been exacerbated by the
uncertainty about economic and trade conditions in Europe. Thus revenue shortfalls and tight cash flow have
prompted governments to extend payment periods and delay payments, which naturally sets in motion a chain
reaction of nonpayment by private suppliers and thus a major liquidity squeeze on an already struggling economy. In
some cases businesses have been encouraged to delay submission of invoices for work completed, or governments
have relaxed requirements for recording commitments, so that the full extent of payment obligations is obscured.
Incentives have been affected, too: some private companies that are owed by the public sector are forced to evade
taxes to stay afloat. In extreme cases, arrears can escalate into a total collapse of payment discipline, as happened,
for example, in the early 1990s in Ukraine and the former Yugoslavia in the run-up to hyperinflation in 1992.
The expansion of arrears may provide temporary cash flow relief for governments, but the impacts are far-
reaching and the payments will eventually have to be made. Delays in government payments have a direct
negative effect on consumption, employment, and investment because people who have supplied goods and services
are denied the funds they need to pay their bills and keep their businesses going. The economic situation makes it
even more difficult because businesses cannot borrow to get the cash needed to pay their own wages and suppliers.
Unpaid invoices also affect their willingness and ability to invest in growth and expansion. In the medium term,
suppliers to government will raise prices or demand payment in advance if they expect they will not be paid within a
reasonable time. Some firms will stop bidding for government contracts, which will reduce competition and value
for money.
It is vital that governments act quickly to address arrears while they are still manageable. If they are allowed
to grow unchecked, arrears can threaten fiscal sustainability and even national creditworthiness irreparably.
Concerted action on arrears requires careful revenue and cash flow management and firm procedures for controlling
expenditure commitments and processing tax refunds: accurate recording of invoices and tax refund requests,
monitoring the amount and timing of payments, and budgeting sufficient resources to pay obligations within a
defined period. A crucial element of the action plan is to prevent new arrears from being created while implementing
a schedule for eliminating the stock of arrears. Some increases in the deficit—if financeable—would be justified if
they include a time-bound plan for eliminating payment arrears. Ministries of Finance need to monitor commitments
and payments closely to ensure that budget units comply with payment deadlines and do not offset reduction in
arrears by incurring unmanageable new commitments.
In Serbia, Albania, and Montenegro public debt is too high (Figure 34). In August, Serbian public
debt stood at 57.6 percent, well above the 45 percent ceiling set by the Law on Fiscal Responsibility.
Albania also has breached its public debt threshold of 60 percent of GDP. Montenegro’s public debt has
risen significantly, above 59 percent of GDP, in large part because of the deficits during and after the
global crisis and state guarantees. These countries will need to make special efforts to implement fiscal
consolidation and ensure that they keep the confidence of lenders. BIH, Kosovo, and FYR Macedonia all
seem to be well within sustainable levels of public debt. BIH debt was about 40 percent of GDP at the end
of 2011, but given the vulnerabilities, BIH debt levels should also be reduced in medium term. Kosovar
public debt is now about 9 percent of GDP, although attempts to build up a domestic credit market may
push this up slightly in 2013. Public debt in Macedonia is moderate.

24
Figure 34: Public Debt and Guarantees (percent of GDP)
Source: National authorities and World Bank estimates based on the latest data available.
In several countries debt refinancing—especially of short-term issues—will contribute considerably
to gross financing requirements. So far, SEE6 countries have been able to roll over their debt, but
whether they can continue to do so depends on market confidence. Some countries also have large
amounts for long-term bonds due in late 2012 and early 2013.
Unfavorable public debt dynamics have resulted in sovereign debt rating downgrades in two SEE6
countries since June. In the face of increasingly unfavorable public debt dynamics, Standard and Poor
(S&P) has downgraded sovereign debt ratings of Montenegro and Serbia (Table 5). These downgrades
may hinder access to markets to fund deficits. Further downgrades may follow if current risks to fiscal
and debt sustainability are realized.
Table 5: SEE6: Sovereign Credit Ratings1
Dec
2010
Dec
2011
Mar
2012
Jun
2012
Sep
*2012
ALB B+ B+ B+ B+ B+
BIH B+ B B B B
MKD BB BB BB BB BB
MNE BB BB BB BB- BB-
SRB BB- BB BB BB BB- Source: Standard & Poor’s. * No change as of December 12, 2012. 1Long-term foreign currency debt as of October 19, 2012. Kosovo does not have a sovereign rating.
Finally, over the short to medium term SEE6 countries face major risks, both internal and external,
that could undermine fiscal sustainability. External risks are rooted in anemic growth in Europe and
financial sector uncertainty worldwide. Continued spillover (through export demand or erosion in
business confidence) from a poorly performing Eurozone economy will likely put further downward
pressure on revenues and require equivalent adjustments in spending. Financial market jitters could make
0%
10%
20%
30%
40%
50%
60%
70%
MNE ALB SRB BIH MKD KOS
External Domestic Guarantees

25
it difficult or costly for governments to raise the financing they need to fund their deficits. High debt-to-
GDP ratios put Serbia, Albania, and Montenegro most at risk, but a general loss of confidence in
emerging markets (a “flight to safety”) could affect all SEE6 countries. Internal (“homegrown”) risks are
largely political. They boil down to keeping control of spending during the election cycles in FYR
Macedonia and Albania.
F. FINANCIAL SECTOR––CONTINUED VULNERABILITY
The Western Balkans are highly integrated with Western Europe through trade, labor, and
finance—the last being the fastest transmitter of Eurozone troubles. Of the region’s exports, the
Eurozone accounts for about half, and remittances from the Eurozone contribute an average of 10 percent
of GDP. But the SEE6 have a lagged reaction in trade and remittances to adverse developments in the
Eurozone. Financial links, explored below, are likely to have the most immediate effects.
European subsidiaries have a heavy presence in SEE6 banking systems, and there is a high degree
of euroization.7 The region’s bank-driven financial systems are largely dominated by European-owned
banks, mostly from Austria, France, Italy, Greece, and Slovenia. The presence of banks from high-income
European countries, however, varies widely (Figure 35). Increased financial globalization has helped
foster deeper financial systems and has had other positive effects, such as lower borrowing costs, better-
quality financial services that are more widely available, diversification of risk across borders, and
technology and institutional spillovers. But they have also made the region more susceptible to external
shocks. Banking systems in several SEE6 countries have heavy exposure to foreign currency loans and
associated currency mismatches (Figure 36). Also, banks in the region have relative capital adequacy
ratios, but there is wide variation among individual country ratios and provisioning (Figure 37 and Figure
39).
Figure 35: International Claims (% of GDP,
2012Q2)
Figure 36: Foreign Currency Loans (% of
total, 2012Q3)
Source: BIS.
Note: GIIPS = Greek, Italian, Irish, Portuguese, and Spanish.
Source: Central banks.
7 Kosovo and Montenegro have adopted the euro; BIH and Macedonia peg to the euro; and Serbia has a managed floating and
Albania a floating exchange rate regime.
Serbia Albania
Macedonia
BiH
Montenegro
0
5
10
15
20
25
30
35
0.0 5.0 10.0 15.0 20.0 25.0 30.0Non
-GIIP
S B
IS b
anks
GIIPS banks
72
63
25
64
Serbia
Albania
Macedonia
BiH

26
Rapid credit growth up to 2008 came to a halt when the crisis began; banks in the region saw
foreign funding dry up and some runs on deposits.8 Annual domestic credit growth averaged 25
percent between 2006 and 2008, fuelled by foreign capital flows into the financial sector. The inflows
were motivated partly by plentiful global liquidity, partly by the region’s economic prospects and political
stability, and largely by prospects of eventual EU membership for Western Balkans countries.9 When
funding from abroad began to evaporate, banks were forced to adjust. BIH, Montenegro, and Serbia saw
deposits flow out. The credit crunch that followed is still severe, reflecting not only lower demand but
also rising problems of asset quality as some parent banks began to deleverage.
Although the Eurozone crisis has been contained to date, the SEE6 banking systems are still be
characterized by rising or already high nonperforming loans, low credit growth, eroding capital,
and minimal profitability. High levels of nonperforming loans (NPLs) mean that loan quality has
deteriorated, and banks have chronic difficulties in writing off NPLs because ineffective insolvency
regimes generally preclude rapid resolution of problem loans. The recent rise in NPLs has also limited the
appetite as well as the ability of banks to resume lending. Moreover, bank loan-to-deposit ratios are above
100 percent in BIH and Serbia, reflecting a small domestic deposit base and relatively high dependence
on wholesale funding (Figure 40). At the same time, the prevalence of foreign currency loans could point
to currency-induced risks arising from unhedged borrowers, an acute concern in some countries.
Figure 37: Credit Growth (% change, Q-on-Q)
Figure 38: NPLs (% of Total Loans) and
Provisioning (% of NPLs, 2012Q3)
Source: IFS. Source: IMF and central banks.
8 As a result of the crisis, some countries have entered into IMF programs. In July 2009 Bosnia and Herzegovina signed a Stand-
By Arrangement (SBA) for €1.1 billion that expired in July 2012; a new SBA (SDR338.2 million, about $500 million) was
approved in September 2012. Kosovo in April 2012 signed an SBA for €107 million through December 2013. Serbia in January
2009 signed an SDR2.619 billion SBA that ended in April 2011. Macedonia’s Precautionary Credit Line (PCL) is not expected to
be drawn down. 9 Serbia became an EU candidate in March 2012.
9
6
5
5
21
7
0.8
1.4
-1.0
-2.2
-3.4
2.0
Albania
BiH
Kosovo
Macedonia
Montenegro
Serbia
Q3-2007
Q3-2012 Albania
BiH
Macedonia Kosovo
Montenegro
Serbia
0
20
40
60
80
100
120
140
0.0 5.0 10.0 15.0 20.0 25.0
Pro
vis
ion
s to
NP
Ls
NPLs to Total Loans
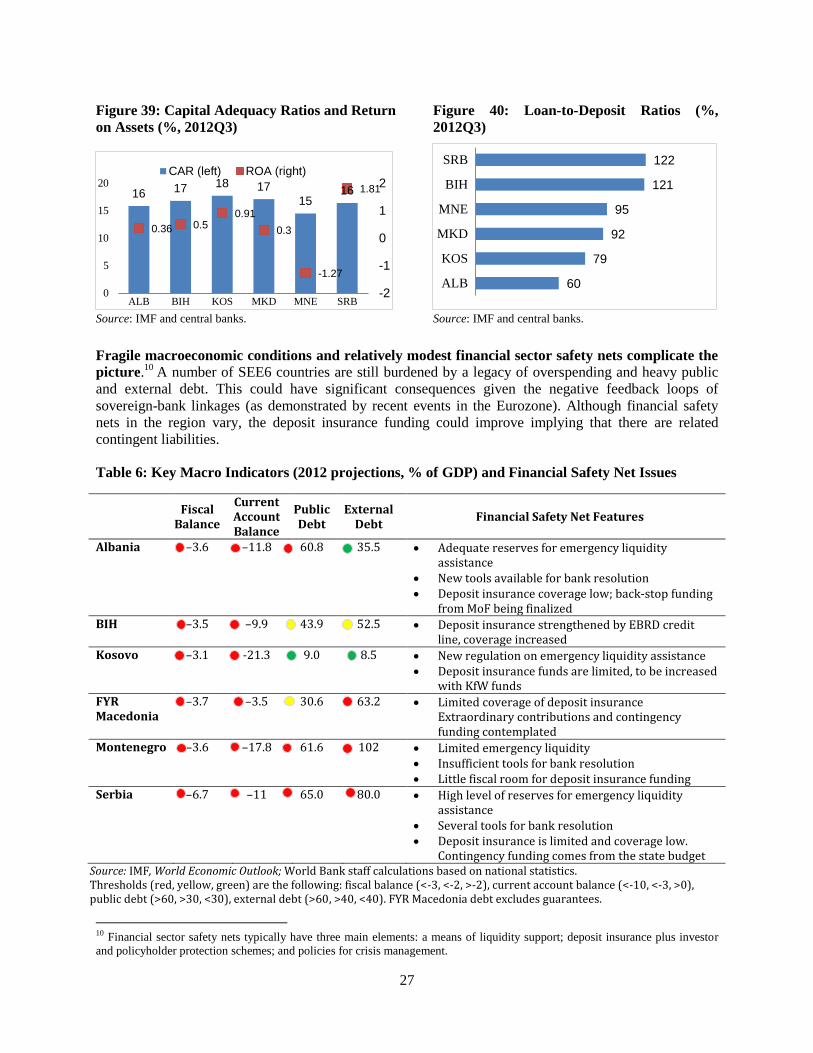
27
Figure 39: Capital Adequacy Ratios and Return
on Assets (%, 2012Q3)
Figure 40: Loan-to-Deposit Ratios (%,
2012Q3)
Source: IMF and central banks. Source: IMF and central banks.
Fragile macroeconomic conditions and relatively modest financial sector safety nets complicate the
picture.10
A number of SEE6 countries are still burdened by a legacy of overspending and heavy public
and external debt. This could have significant consequences given the negative feedback loops of
sovereign-bank linkages (as demonstrated by recent events in the Eurozone). Although financial safety
nets in the region vary, the deposit insurance funding could improve implying that there are related
contingent liabilities.
Table 6: Key Macro Indicators (2012 projections, % of GDP) and Financial Safety Net Issues
Fiscal
Balance
Current Account Balance
Public Debt
External Debt
Financial Safety Net Features
Albania –3.6 –11.8 60.8 35.5 Adequate reserves for emergency liquidity assistance
New tools available for bank resolution Deposit insurance coverage low; back-stop funding
from MoF being finalized BIH –3.5 –9.9 43.9 52.5 Deposit insurance strengthened by EBRD credit
line, coverage increased Kosovo –3.1 -21.3 9.0 8.5 New regulation on emergency liquidity assistance
Deposit insurance funds are limited, to be increased with KfW funds
FYR Macedonia
–3.7 –3.5 30.6 63.2 Limited coverage of deposit insurance Extraordinary contributions and contingency funding contemplated
Montenegro –3.6 –17.8 61.6 102 Limited emergency liquidity Insufficient tools for bank resolution Little fiscal room for deposit insurance funding
Serbia –6.7 –11 65.0 80.0 High level of reserves for emergency liquidity assistance
Several tools for bank resolution Deposit insurance is limited and coverage low.
Contingency funding comes from the state budget Source: IMF, World Economic Outlook; World Bank staff calculations based on national statistics. Thresholds (red, yellow, green) are the following: fiscal balance (<-3, <-2, >-2), current account balance (<-10, <-3, >0), public debt (>60, >30, <30), external debt (>60, >40, <40). FYR Macedonia debt excludes guarantees.
10 Financial sector safety nets typically have three main elements: a means of liquidity support; deposit insurance plus investor
and policyholder protection schemes; and policies for crisis management.
16 17 18 17
15 16
0.36 0.5 0.91
0.3
-1.27
1.81
-2
-1
0
1
2
0
5
10
15
20
ALB BIH KOS MKD MNE SRB
CAR (left) ROA (right)
60
79
92
95
121
122
ALB
KOS
MKD
MNE
BIH
SRB
28
Besides a fragile business environment and idiosyncratic country risks, Eurozone-related events
still threaten the whole region. Deposit withdrawals and parent bank funding freezes could cause
problems for foreign-owned banks. The widely adopted subsidiary model provides for Western Balkan
(host) banking authorities to respond to potential contagion by ring-fencing the banks affected, but there
could be spillovers to both domestically owned and other foreign banks from depositor withdrawals in
Eurozone countries and factors that limited spillovers in 2008–09 are less likely to be effective. The
extent of euroization in most Western Balkan countries diminishes the effectiveness of these measures.
Though each Western Balkan country has begun significant financial sector reforms in recent
years, significant work remains. Given their financial openness, high NPL levels, low credit growth,
and declining capitalization, all the SEE6 countries must focus on crisis preparedness and management as
well as dealing with their NPL resolution and insolvency procedures. Effective and rigorous financial
sector oversight and crisis management requires, among other dimensions, systems that allow early and
prompt intervention in problem banks; the ability to facilitate recapitalization by private shareholders as
needed; effective mechanisms for resolving failing institutions; emergency liquidity assistance; and
depositor protection to sustain confidence in the financial system. To jump-start credit growth, NPLs will
have to be reduced through such measures as removal of legal, regulatory, and tax impediments to debt
restructuring.11
In the following sections we highlight three structural issues of importance for the
region’s capacity to ensure sustained economic recovery and higher domestic and private investments: the
environment for doing business, prospects for privatization, and the emerging energy infrastructure
deficit.
G. STRUCTURAL ISSUES: THE SEE6 ENVIRONMENT FOR DOING BUSINESS
The difficult environment, both external and internal, in SEE6 suggests the need for these countries
to accelerate structural reforms so they will be more productive, competitive, and attractive for
doing business. The unfinished structural reform agenda was discussed in the November 2011 issue of
this report; if anything, completing the agenda became more urgent with the onset of the double-dip
recession. Still on the agenda are reforms to public sector governance, the investment climate, labor
markets, and social safety nets. In that issue, we highlighted recent progress and issues remaining in terms
of the climate for doing business and the prospects for privatization as governments seek to relax the
financing constraint and attract foreign investments under more difficult external conditions.
The latest Doing Business 2013 reports documents improvements in the SEE6 countries in some
areas, such as starting a business, dealing with construction permits, and ease of paying taxes. However, there is wide diversity in the rankings of the six countries and much work still needs to be done.
Also, the average ranking of SEE6 countries lags significantly behind that of the EU11, highlighting the
long unfinished agenda (Figure 40).
11 It is noteworthy that FinSAC (the Vienna-based Financial Sector Advisory Center) has reached a tentative agreement with
Montenegro and Albania to provide comprehensive technical assistance on reducing NPLs.
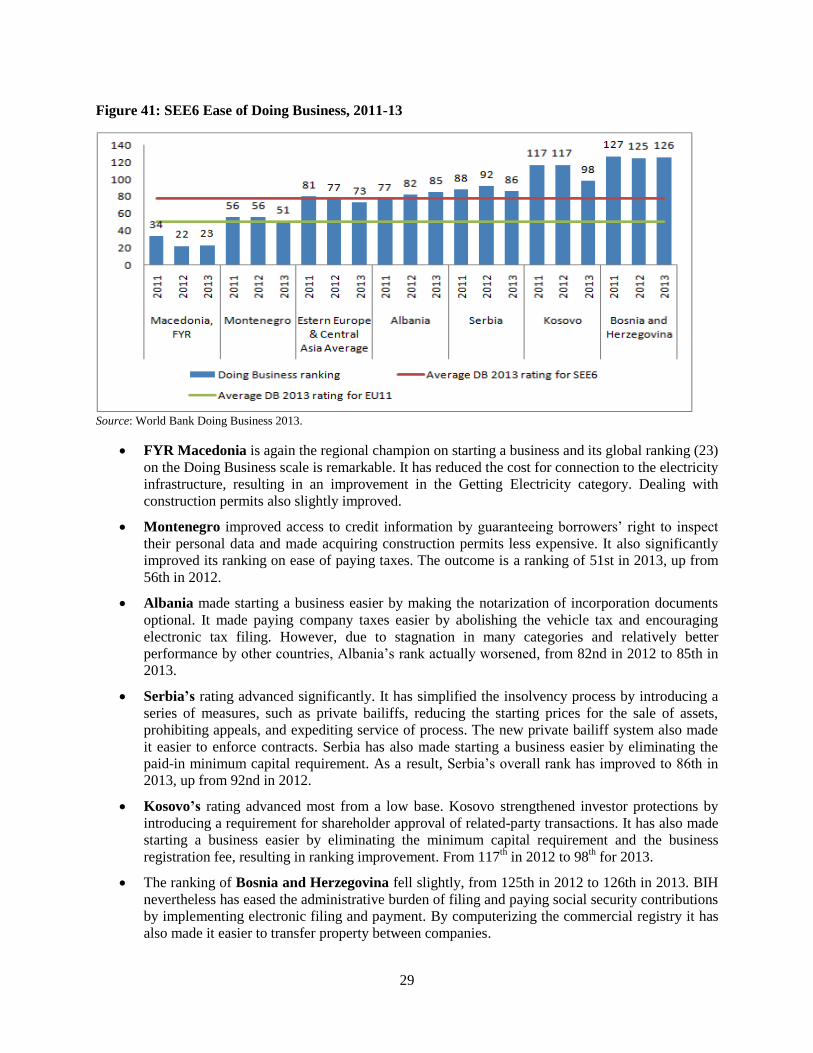
29
Figure 41: SEE6 Ease of Doing Business, 2011-13
Source: World Bank Doing Business 2013.
FYR Macedonia is again the regional champion on starting a business and its global ranking (23)
on the Doing Business scale is remarkable. It has reduced the cost for connection to the electricity
infrastructure, resulting in an improvement in the Getting Electricity category. Dealing with
construction permits also slightly improved.
Montenegro improved access to credit information by guaranteeing borrowers’ right to inspect
their personal data and made acquiring construction permits less expensive. It also significantly
improved its ranking on ease of paying taxes. The outcome is a ranking of 51st in 2013, up from
56th in 2012.
Albania made starting a business easier by making the notarization of incorporation documents
optional. It made paying company taxes easier by abolishing the vehicle tax and encouraging
electronic tax filing. However, due to stagnation in many categories and relatively better
performance by other countries, Albania’s rank actually worsened, from 82nd in 2012 to 85th in
2013.
Serbia’s rating advanced significantly. It has simplified the insolvency process by introducing a
series of measures, such as private bailiffs, reducing the starting prices for the sale of assets,
prohibiting appeals, and expediting service of process. The new private bailiff system also made
it easier to enforce contracts. Serbia has also made starting a business easier by eliminating the
paid-in minimum capital requirement. As a result, Serbia’s overall rank has improved to 86th in
2013, up from 92nd in 2012.
Kosovo’s rating advanced most from a low base. Kosovo strengthened investor protections by
introducing a requirement for shareholder approval of related-party transactions. It has also made
starting a business easier by eliminating the minimum capital requirement and the business
registration fee, resulting in ranking improvement. From 117th in 2012 to 98
th for 2013.
The ranking of Bosnia and Herzegovina fell slightly, from 125th in 2012 to 126th in 2013. BIH
nevertheless has eased the administrative burden of filing and paying social security contributions
by implementing electronic filing and payment. By computerizing the commercial registry it has
also made it easier to transfer property between companies.

30
Figure 42: SEE6 Weak Areas in the Business Environment 2012
Source: Doing Business Indicators 2013.
The unfinished agenda in the business environment is illustrated by the weak areas on the doing
business scale (Figure 41). Interestingly, those weak areas, largely common to the SEE6 countries relate
to business regulations governing the property transactions and housing and construction industry, and
enforcement of contracts. FYR Macedonia, however, has managed to improve many dimensions of its
business environment. Also, some countries in the region fare relatively well in terms of ease of paying
taxes. But it is important to stress that these indicators capture certain aspects of regulatory and legal
environment in ten policy areas but there are other aspects of investment climate and business practices
that can be important for investment and growth (e.g., quality of infrastructure and inequities in the tax
treatment of formal and informal firms), which can be significant impediment to domestic and foreign
investments. Countries in the region should interchange best practices in legal and regulatory environment
as well as other aspects of the investment climate so that ranking improvements can be comprehensive
and faster. This is important not only to attract foreign investors but also to serve as a benchmark for
reforms and promote growth.
H. STRUCTURAL ISSUES: THE SECOND WAVE OF PRIVATIZATION?
Pressured by the external environment and inadequate revenues, SEE6 governments are seeking
ways to improve efficiency, attract FDI, build up exports, and ensure financing. Intensifying the
privatization process is one option that governments are increasingly considering as part of a general
0
50
100
150
200
Albania Bosnia andHerzegovina
Kosovo Macedonia,FYR
Montenegro Serbia
Rank:1-185 (most restrictive) Average ranking in ECA (excl. Turkmenistan)
Dealing with Construction Permits
0
50
100
150
200
Albania Bosnia andHerzegovina
Kosovo Macedonia,FYR
Montenegro Serbia
Registering Property
0
50
100
150
200
Albania Bosnia andHerzegovina
Kosovo Macedonia,FYR
Montenegro Serbia
Enforcing Contracts
0
50
100
150
200
Albania Bosnia andHerzegovina
Kosovo Macedonia,FYR
Montenegro Serbia
Paying Taxes

31
effort to ease the financing constraint and improve competitiveness. SEE6 governments are therefore
looking for sources of capital not only in the OECD countries but also in such resource-rich and growing
middle-income countries as Turkey, Russia, China, and Azerbaijan.
Western Balkan countries somewhat missed out on the first wave of privatization in Eastern
Europe because the regional wars and the disruptions and dislocation they caused extended well
into the 1990s. Despite their late start, though, privatization there has since been considerable. Yet too
many enterprises, especially in infrastructure sectors, remain in state or predominantly state hands,
especially in Serbia. Now the global crisis is making governments think more deeply about the potential
fiscal, technological, investment, and jobs benefits of a second wave of privatizations. While the primary
pressure is fiscal, as governments try to implement deep consolidation and bring down public debt there
may be a new opportunity to use the lessons of past privatizations (good and bad) to build new export
capacity, increase competitiveness, and expand investment.
Despite the disruptions caused by the crisis, privatization transactions brought in more than US$1
billion to SEE6 in 2010–11—equivalent to 0.6% of combined GDP in the region. These transactions
were concentrated in air transport and the cement industry (Kosovo) and steel and tourism (Montenegro).
Most investors were from Turkey, but some came from Switzerland, Qatar, Greece, and France. Two
transactions in 2012 show increased interest in the energy sector. Moreover, there is significant potential
for privatizations in SEE6 countries, especially in transport, tourism, electronics, and metals, although
some have gone through some repeated attempts without attracting strong interest in the past (Table 7).
Table 7: Announced Privatizations in the Western Balkans
Country Company Sector/Industry
Albania Four small hydropower plants; Albpetrol Energy;
Kosovo Posta dhe Telekomi I Kosoves (PTK) Telecoms
Serbia
Telecom Serbia Telecoms
JAT Airways Air transport
Galenika Pharmaceuticals
Smederevo Steel Mill Steel
Bor Mining Company (partial) Mining
Macedonia
AD OHIS Chemical industry
EMO Ohrid Electronics industry
Tutunski Kombinat AD Prilep Tobacco industry
11 Oktomvri Eurokompozit Prilep Military industry
Montenegro
AD Montecargo Podgorica Transport and logistics
Montenegro Airlines AD Podgorica Transport
AD Kontejnerski terminal i generalni tereti Bar Transport and logistics
AD Zora Berane Food
Jadransko brodogradilište“ AD Bijela Shipyard
HG Budvanska rivijera AD Budva Tourism
HTP Ulcinjska rivijera AD Ulcinj, Tourism
Institut crne metalurgije AD Nikšić Metals
Fabrika elektroda Piva Electronics Source: World Bank staff, based on official government sources.
32
To make the most of new privatizations, SEE6 governments would be well-advised to pay
particular attention to some major lessons others have learned about the process:
The case-by-case approach has proven more successful: installing at the helm of the company a
core investor, which is more likely to restructure a company and significantly increase its
productivity.
Strong legal framework for the enforcement of contracts is critical to avoid disruptive investor
disputes, investor exits, and potentially high ex-post cost to the government.
Privatization to outsiders results in more restructuring than privatization to insiders (managers
and workers). Investment funds, foreigners, and others who hold large blocks of shares produce
more restructuring than diffuse individual ownership.
Competitive tenders for large companies and winner-take-all auctions for small and medium
enterprises, which would result in concentrated ownership, are recommended.
For companies for which there are no bids, even after repeated attempts at more flexible pricing
or restructuring, bankruptcy should be allowed.
For companies with heavy losses, the transaction-oriented approach—privatization through
restructuring—is likely to produce better results. For transactions to happen, though, what will be
critical will be a modest and temporary public intervention to reduce legacy issues and hardened
budget constraints to secure cooperation from managers and workers.
It would be important to ensure a careful cost-benefit analysis to avoid underestimation (and
under-budgeting) of the funding for social programs associated with privatization/restructuring.
Privatization receipts should not be used to finance current public spending but to retire expensive
public debt, clear any budgetary arrears, or, invest in critical public infrastructure within a
prudent macroeconomic and fiscal framework.
What is absolutely fundamental to successful privatization are a transparent process—a clear
legal framework, complemented by well-defined regulations and procedures that are published
and enforced—and ensuring the capacity of the privatization agency.
I. STRUCTURAL ISSUES: ENERGY INFRASTRUCTURE DEFICIT
Energy supply constraints are emerging as a key structural issue in the Western Balkans and
energy also is increasingly cited as an investment climate constraint in recent firm surveys. Chronic
under-investment and deteriorating infrastructure operating well beyond its design life, seriously threatens
energy security in the region. Severe weather during January and February of 2012 was a reminder of
things to come, as many countries were unable to satisfy local demand and curtailed exports to the
neighbors. The situation is likely to get worse as key projects are being delayed and excess power is
declining in countries which used to export. Temporary decline in energy demand due to the economic
crisis provides short-term relief, but as soon as the economies turn around, energy supply could be a
barrier to economic development.
Without significant investments in infrastructure, the region is expected to become a net power
importer by 2020 (Figure 42). According to the Energy Strategy of the Energy Community of South
East Europe (2012), under current trends of energy consumption, demand for electricity will not be fully

33
met by as much as about 10 percent in 2020 with the gap growing to potentially a much higher level in
2030 (perhaps as much as 30 percent). To maintain the supply-demand balance in the coming decade,
countries will need substantial investments, in the range of €44.6 billion in the energy sector, and even
more financial resources to manage the transition into a low-carbon economy. With the economic crisis,
the capacity of governments to finance investment on their own and attract private investment is likely to
become more difficult. Additional reforms elaborated below and external financing and PPPs could help
close the gap.
Developing modern and efficient energy infrastructure that supports economic growth will require
decisive reform actions to address the multiple challenges facing the energy sector:
Reinvigorating the reform agenda.
Countries will have to catch up with
other EU11 peers on key structural
reforms that create an improved
business climate to promote
investments, both public and private.
Key actions include the
implementation of cost-reflective
pricing and the removal of legislative
and regulatory barriers to energy
trade.
Creating a properly functioning
regional energy market. Regional
cooperation on electricity production and transit can boost supply security and yield huge
economic savings (by around 10 percent until 2020 in electricity generation). The challenge is to
develop suitable infrastructure to support energy trade, develop risk management arrangements
for private investors, and most importantly, strengthen nascent cooperation protocols enabling
competitive wholesale trading of electricity.
Tapping into the energy efficiency (EE) potential by reducing energy waste in the
consumption side. Economies in the region use twice more energy per dollar of GDP than
Western European countries. So far, governments committed to an energy saving indicative target
of 9 percent of the final energy consumption between 2009 and 2018, through their National
Energy Efficiency Action Plans. Yet, several obstacles will need to be addressed including: low
energy prices; insufficient information on technologies; too few contractors and service
companies; as well as financing constraints to implement their Action Plans.
Making progress on EU’s accession requirements with regard to the climate change agenda.
The region relies largely on domestic coal to meet its energy needs. This will not be easy to shift
because of cost and reliability considerations. At the same time, countries’ will need to comply
with EU’s climate change and environmental protection frameworks if they are to meet their
accession ambitions. The challenge is immense and costly and will require making best use of
carbon finance instruments and implement policy options to promote fuel switching options, and
to tap into the region’s renewable energy potential.
Figure 43: Current and forecast power imports
(GWh)
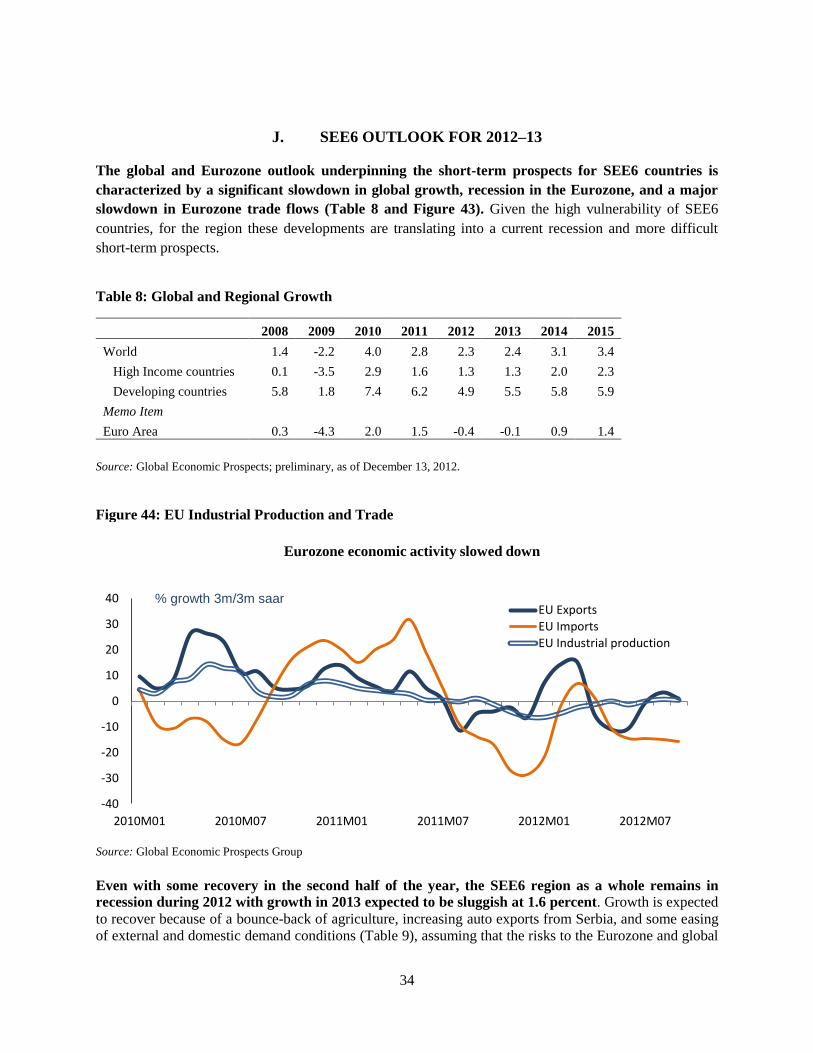
34
J. SEE6 OUTLOOK FOR 2012–13
The global and Eurozone outlook underpinning the short-term prospects for SEE6 countries is
characterized by a significant slowdown in global growth, recession in the Eurozone, and a major
slowdown in Eurozone trade flows (Table 8 and Figure 43). Given the high vulnerability of SEE6
countries, for the region these developments are translating into a current recession and more difficult
short-term prospects.
Table 8: Global and Regional Growth
2008 2009 2010 2011 2012 2013 2014 2015
World 1.4 -2.2 4.0 2.8 2.3 2.4 3.1 3.4
High Income countries 0.1 -3.5 2.9 1.6 1.3 1.3 2.0 2.3
Developing countries 5.8 1.8 7.4 6.2 4.9 5.5 5.8 5.9
Memo Item
Euro Area 0.3 -4.3 2.0 1.5 -0.4 -0.1 0.9 1.4
Source: Global Economic Prospects; preliminary, as of December 13, 2012.
Figure 44: EU Industrial Production and Trade
Source: Global Economic Prospects Group
Even with some recovery in the second half of the year, the SEE6 region as a whole remains in
recession during 2012 with growth in 2013 expected to be sluggish at 1.6 percent. Growth is expected
to recover because of a bounce-back of agriculture, increasing auto exports from Serbia, and some easing
of external and domestic demand conditions (Table 9), assuming that the risks to the Eurozone and global
-40
-30
-20
-10
0
10
20
30
40
2010M01 2010M07 2011M01 2011M07 2012M01 2012M07
Eurozone economic activity slowed down
EU Exports
EU Imports
EU Industrial production
% growth 3m/3m saar
35
economy do not materialize. Growth in 2013 is projected to be lowest in BIH (0.5 percent), and against
fastest in Kosovo (3.3 percent). Serbia’s economic growth is expected to reach about 2 percent in 2013,
driven mainly by accelerated exports and the value chain from the large FIAT factory and by a cyclical
agricultural bounce-back. But growth will not be enough to make a dent in unemployment, which may
even keep rising.
Table 9: SEE6 Growth Outlook for 2012–13
2011 2012 (proj.)
2013 (proj.)
ALB 3.0 0.8 1.6
BIH 1.3 0.0 0.5
KOS 5.0 3.6 3.3
MKD 2.8 0.0 1.0
MNE 3.2 0.2 0.8
SRB 1.6 –2.0 2.0
SEE6 2.2 –0.6 1.6
EU11 3.1 0.9 1.3
Euro area 1.5 –0.4 -0.1
Source: World Bank. For EU15, European Commission.
The short-term economic and social outlook for SEE6 is therefore difficult. The latest downgrade of
the Eurozone growth, which is reflected in this outlook suggests continued, tough external environment
for SEE6 countries. But their internal vulnerabilities will also weigh heavily on the short term prospects.
In the countries with high public debt that have relied most on external demand for recovery (BIH,
Montenegro, Serbia, and to some extent Albania), growth will be sluggish. Public finances will continue
to be under pressure across the SEE6 well into 2013. The unemployment problem has become a massive
social crisis, unlikely to abate until the return of more robust, labor-absorbing growth.
K. ACCELERATING REFORMS, MOBILIZING FINANCING
Given the difficult baseline outlook, the central short-term policy challenge for SEE6 countries is
how to balance the need for continued fiscal consolidation and structural reforms with the even
greater need to reignite growth and job creation. Finding this fine balance will be difficult given the
regional and Eurozone recession and low growth, limited financing for investments, high unemployment,
and weak external demand. Moreover, if the significant global (US fiscal cliff and commodity prices) and
regional (Eurozone uncertainties) risks materialize, they could push the SEE6 economies into a prolonged
recession with major economic and social consequences.
To weather this second-round recession and the slim short-term growth prospects, the SEE6 will
clearly need to step up fiscal and structural policy efforts: difficult times require greater and more
effective policy effort. Fiscal consolidation will need to continue. Labor market, investment climate, and
public sector reforms must accelerate. This recognized macroeconomic and structural agenda for the
Western Balkans (see SEE RER reports of November 2011 and June 2012) is gaining urgency even as the
conditions are more difficult. Moreover, delivering on this reform agenda—and ensuring monitorable
36
results––will be key to (and part of) any possible scale-up of external financing for growth and jobs that is
suggested below. The reform agenda might include:
Labor market reforms: Severe and persistent unemployment, especially among vulnerable groups,
calls for bold SEE6 labor market reforms. Making labor market conditions more flexible will help
these countries to address structural rigidities in their labor markets. Attracting women into the
labor force will be a major challenge, which can be eased by increasing the availability of early
childhood facilities.
Education reforms: Reforms to improve the quality of secondary and tertiary education, address skills
mismatches, and increase labor market “flexicurity” (the combination of flexibility and security) are
crucial for improving labor outcomes but will take time.
Trade integration, the business environment, and competition: Simplifying business regulation,
addressing governance issues, and enforcing contract and property rights are areas where the SEE6
countries could pursue reforms for quick results. The region could also benefit from harmonizing
regulation across borders and deepening trade and financial integration. Opening up markets and
opportunities for business development—e.g., through privatization and in traditionally regulated
monopolies like energy, electricity, and rail—– are among areas where concerted efforts are needed.
Social safety nets and social inclusion: Beyond providing a safety net for the unemployed in times of
crisis, social assistance can be made more efficient by better targeting vulnerable groups; it should
avoid creating a poverty trap. Activation policies in combination with targeted social assistance should
prevent temporary unemployment from evolving into becoming long-term dependency. Well-
designed and well-delivered social assistance can increase the incentives for people to work.
To support these intensified reforms, SEE6 countries could benefit from external finance for
growth, infrastructure, and jobs. On November 8, 2012, the EIB, the EBRD and the World Bank
announced an initiative “Joint Action Plan for Growth in Central and Eastern Europe” to provide €30
billion in financing for Central and Eastern Europe in support of growth and jobs. This financing may be
available for SEE6 countries through the Western Balkans Investment Framework and other IFIs as likely
channels. IPA funding will also very important in supporting SEE6 countries’ institutional reforms, cross-
border cooperation, economic, social development, and rural development.

37
2. MANAGING VULNERABILITY TO FOOD PRICE SHOCKS IN THE
SEE612
The rapid increase in food prices during the summer months of 2012 has drawn considerable attention
around the world, as the memory of rising poverty and political and social unrest during the 2007-08
food crisis remains fresh. A combination of adverse weather shocks and historically low commodity
stocks, coupled with limited fiscal space for mitigating measures, makes it harder to protect poor and
vulnerable households from the negative effects of food price spikes. While the SEE6 region has been
more insulated from the fluctuations in world prices in the past, consumption patterns, particularly
among the poor, could make even relatively small increases in food prices difficult to cope with. The
pass-through from world to local prices during the most recent (2011-2012) period continued to be low
for most SEE6 countries with the exception of Kosovo and Serbia where more than 50 percent of the
increase in world food prices was reflected in domestic prices. Given their higher share of food in
household budgets, households at the bottom of the welfare distribution are likely to be affected the most
by these increases. Simulations based on household survey data suggest that a 5 percent increase in food
prices (similar to levels experienced in SEE6 countries in 2011) could increase poverty by a full 2
percentage points in Kosovo and FYR Macedonia, with smaller impacts in other SEE6 countries. The
higher volatility of commodity prices will require a concerted policy response that should combine
continued strengthening of the capacity of social safety nets to respond to crises, and agricultural
programs aimed at enabling the supply response.
A. INTRODUCTION
Food prices are being closely watched around the world. Because their rapid increase in 2007–08 led
to rising poverty and even political and social unrest in a number of countries, this summer’s food price
hike revived concerns that not even an expected moderation in prices can dissipate. The summer of 2012
saw cereal prices rush up to 2008 levels because of unfavorable weather in major grain-exporting
countries. The failure of the Russian wheat crop caused wheat prices to reach a new 4 year high in
November 2012. This is the latest manifestation of the volatility that has characterized commodity
markets, particularly food, in the last decade and has made households much more vulnerable to food
price shocks. Beside the effects of the recent adverse weather, global grain stocks are now low because in
two of the last three years crops have been bad. Also, in many countries fiscal consolidation severely
limits the government’s room for adopting mitigating measures while some measures by major grain
producers (e.g., the export ban by Ukraine imposed in October) could contribute additional upward
pressure on prices. Since food prices are forecast to remain high throughout 2013, it is appropriate to
consider how ready countries might be to deal with a world of high and highly volatile food prices and to
address their likely impacts on poor and vulnerable households.
In 2007-08, the SEE6 region was affected less than other parts of Eastern Europe and Central Asia
by the rise in global food prices but that may not be as true in 2013. Food is a significant share of
household spending in SEE6 countries, particularly for some of the most vulnerable groups, so that even
small increases could make life difficult for large numbers of households—especially since after years of
sluggish growth SEE6 households may have exhausted their coping strategies. Also, other possible price
rises, such as for energy, might compound the strains on their budgets. Finally, this summer the SEE6
region was hit directly by adverse weather, making the global impact stronger than during the last crisis.
12 This chapter was written by Alexandru Cojocaru, Caterina Ruggeri Laderchi, and Ken Simler (Europe and Central Asia,
Poverty Reduction and Economic Management). John Baffes (Development Economics Prospects Group) contributed a
background note on global food price dynamics.
38
This note provides a global and a regional perspective on food price developments, highlighting
factors of vulnerability in SEE6 countries and measures to better manage food price volatility in the
future. To gauge the extent of the social impacts of food price volatility we simulate the impact of price
developments similar to those experienced in 2011. In this scenario, even if not all countries see large
increases in poverty, if there is a food shock vulnerable groups are likely to be under significant strain
during a food shock. Finally, we discuss how SEE6 countries might adapt to the new high food price
volatility environment. and ensure an appropriate response if the risks of further food prices hike
materialize.
A Global Perspective on Food Prices
Since the mid-2000s food prices have increased substantially throughout the world, and their
volatility has worsened after a period of relative stability,13
virtually all commodity prices began heading
up in the mid-2000s (Figure 454). By June 2008 the value of the World Bank Food Price Index increased
by 129 percent compared to January 2005. Most of the increase occurred in a brief period in the second
half of 2007 and the first half of 2008. While the onset of the global Great Recession pressures on their
prices, food stocks remained low, leaving countries vulnerable to new price increases.
Figure 45: Grain and Edible Oil Prices, US$ Nominal and Real (2005=100)
Source: World Bank DECPG.
Not only did prices rise, their variability also increased. Figure 465 illustrates the increasing
dispersion in recent years of the general food price index and the indexes for cereals and for oils. Both the
Theil index and the coefficient of variation14
for the three groups (but especially for oils and the general
food index) show higher volatility after 2005 not only in the run-up to the 2007/2008 food crisis but also
afterwards.15
13 This followed roughly three decades of commodity price declines, particularly for food: between their 1974 and 2000 lows,
world food prices declined by 70 percent in US$ real terms. 14 The coefficient of variation, defined as the ratio of the standard deviation to the mean, is a normalized measure of dispersion.
Note that for 2012 only the first eight months of the year are used. 15 Both indices report annual values based on monthly price data.

39
Figure 46: Price Volatility: Annual Coefficient of Variation and Theil Index of Food Prices, 1990–
2012
Source: World Bank staff estimates based on FAOSTAT data.
The causes of the commodity boom were numerous, ranging from macro and long-term to sector-
specific and short-term factors. In the first part of the 2000s most countries, especially developing ones,
experienced sustained and solid economic growth. The depreciation of the US dollar—the currency of
choice for most international commodity transactions—stimulated demand from and limited supply for
non-US$ commodity consumers and producers. Other contributing factors were low past investment,
especially in extractive commodities (a response to a prolonged period of low prices); unusually high
global liquidity; investment fund activity by financial institutions that chose to add commodities to their
portfolios; and geopolitical concerns, especially in energy markets.
Agricultural commodity prices were especially affected by higher energy costs, unexpectedly
frequent adverse weather conditions, and diversion of some food commodities to the production of
biofuels.16
Policy responses exacerbated the hike. Energy is, perhaps, the most important input to
agricultural commodities, both directly through fuel and indirectly through energy-intensive inputs such
as chemicals and fertilizers. As a result the global stock-to-use ratios of several agricultural commodities
dropped to levels not seen since the early 1970s. Many countries adopted export bans and prohibitive
taxes to offset the impact of increasing world prices on the domestic market. For example, the export
restrictions on wheat imposed by Ukraine, combined with drought-related poor production in Australia,
led to export restrictions in major producers like Russia, Kazakhstan, and Argentina. The effect was a 45
percent increase in wheat prices between October 2007 and February 2008 (Headey and Fan 2010: 48).
16 This involved maize in the US and edible oils in Europe, though crop displacement led to higher prices of other products such
as soybeans and wheat.
0
.05
.1
.15
.2
.25
Coe
ffic
ien
t of
vari
ation
1990 1995 2000 2005 2010year
Food Cereals Oils
0
.01
.02
.03
.04
The
il in
dex
1990 1995 2000 2005 2010year
Food Cereals Oils

40
Since 2010 global food prices have been high and in the summer of 2012 they spiked, followed by a
new shock in November 2012. Higher oil prices combined with weather shocks pushed up food prices in
the second half of 2010, and by February 2011 the World Bank Food Price index had exceeded its 2008
peak. Later in 2011 food prices did moderate as conditions looked promising for 2011/12 crops and
Russia lifted its export ban. But the outlook again turned negative in the summer of 2012 following news
of weather problems. Maize and wheat futures each gained 40 percent between mid-June and mid-July
(Figure 46). In July and August the World Bank’s Food Price Index and the indices for cereals and for
oils and fats were again at the 2008 peak. The surge was due to hot and dry conditions in the US (maize)
and adverse weather in Russia and to a lesser extent in Western Europe (wheat). After the large summer
downgrades in the global grain forecast, the October outlook remained unchanged. Although large
weather shocks that would have affected production in the Southern hemisphere have not yet
materialized, concerns about new market tightness based on expected consumption resulted in another
price uptick. The recent announcement of a crop failure in Russia resulted in a new increase in wheat
prices in November 2012.
Figure 47: Prices of Maize and Wheat Future (US cents per bushel)
Source: World Bank DECPG.
Since the latest surge in food prices, stock-to-use ratios for maize and wheat have declined to
historic lows. This means that even a small supply shock could trigger a large price spike, especially
since high oil prices could make maize-based ethanol an attractive alternative. For example, 2012/13
stocks for maize are expected to be at 13.7 percent, or 10.8 percent lower than last season (and 18.6
percent below the May 2012 assessment—the lowest level since the 1972/3 crop year, and almost 3
percentage points lower than in 2007/08). Although wheat stocks are expected to decline by almost 13
percent from last season, the wheat market appears to be better supplied; the stock-to-use ratio is
estimated at 25.4 percent, more than 5 percentage points higher than in 2007/08.
The current global forecast is for prices to decline from their 2012 peak but to stay well above 2010
levels throughout 2013, but there are still significant risks due to weather and especially oil prices.
Because some weather shocks previously expected have not yet materialized, the latest price forecasts see
a 16 percentage point decline in the World Bank food index—but that would still mean it would be 28
percentage points higher than in 2010, just before the current surge in prices. The dynamics of oil prices
are also a driver of volatility, though the slow-down in the global economy might temper some of its
effects.
500
600
700
800
900
1000
Jan-12 Feb-12 Mar-12 Apr-12 May-12 May-12 Jun-12 Jul-12 Aug-12 Sep-12
Wheat Maize
News on adverse weather
October 11 USDA outlook update

41
There are worrisome similarities between the 2007/2008 food crisis and the latest food price surge.
Both episodes were characterized by low grain stocks, rising oil prices, volatile exchange rates, and heavy
financial investments in agricultural commodities. The latest episode, however, differs from 2007/2008 in
some key respects. Current food price increases appear to be more widespread across agricultural
commodities than in 2007/2008; weather volatility is much more important today; and trade policy
responses are relatively less important. Finally, fare more grain exports today originate in more volatile
growing conditions outside of developed countries (World Bank 2011a).
Food Price Increases from an SEE Perspective
The SEE region might now be more vulnerable to food price increases than in the past (Figure 47).
Since January Serbia has experienced the largest increases in food prices during 2012. Between October
2011 and October 2012 nominal food prices increased by roughly 3 percent in Albania, BIH and Kosovo,
by 5.9 percent in FYR Macedonia, 6.8 percent in Montenegro, and by 17 percent in Serbia where October
prices were 9.3 percent higher than in June. Serbia’s situation was to some extent driven by the recent
drought: production of maize, the country’s large export, is expected to reach only 3.5–4 metric tons
(MT) this year—a massive shortfall from the Spring estimate of 7 MT or the 6.3 MT achieved in 2011.
Figure 48: Food price indices for SEE countries, y-o-y
Source: National Statistics Offices.
Food prices went up less in SEE6 than the global 16 percentage point increase between December
2011 and September 2012 (10 percent of that between June and September). This is partly because
food consumed in lower-income countries is mostly produced locally, so that the pass-through from world
to domestic prices tends to be less than for other goods.17
Table 10 shows estimates of the pass-through of
international prices for food based on data for two recent SEE6 price increase periods. The estimates
17 Baffes and Gardner (2003) estimate that world commodity price variability explains about 27 percent of the variation in
domestic prices.
-10
-5
0
5
10
15
20
25
1 2 3 4 5 6 7 8 9 101112 1 2 3 4 5 6 7 8 9 101112 1 2 3 4 5 6 7 8 9 1011
2010 2011 2012
Per
cen
t
ALB BIH KOS MKD MNE SRB
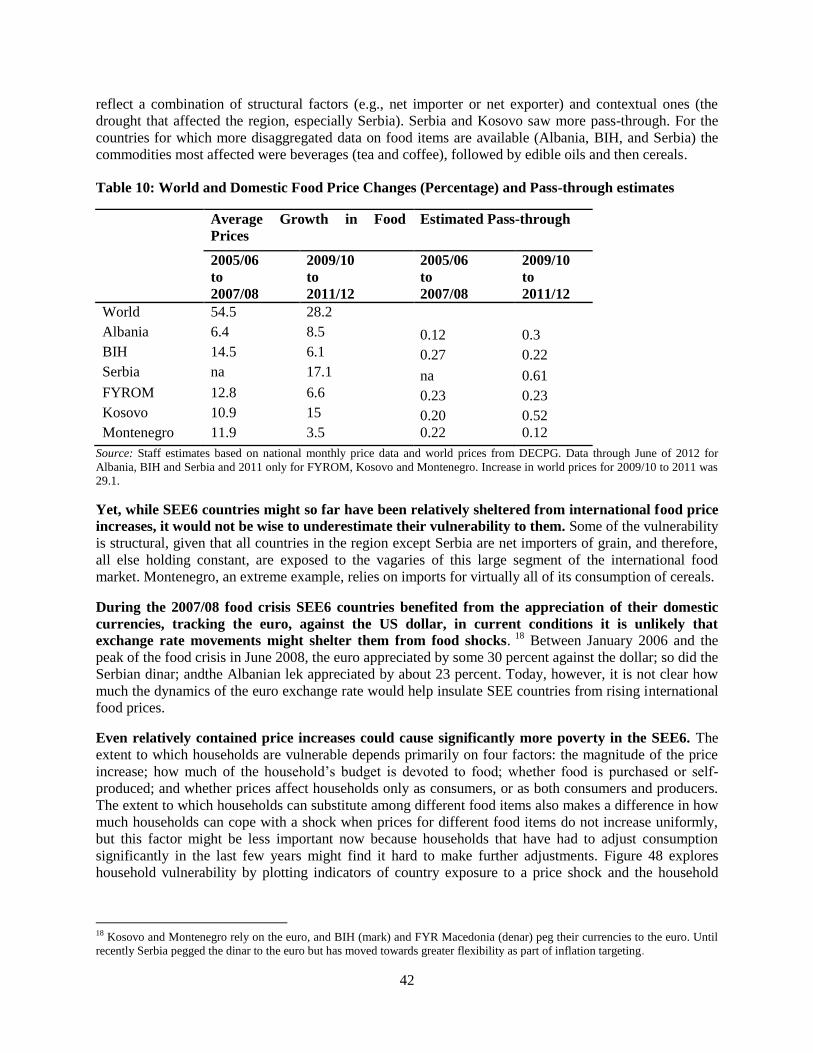
42
reflect a combination of structural factors (e.g., net importer or net exporter) and contextual ones (the
drought that affected the region, especially Serbia). Serbia and Kosovo saw more pass-through. For the
countries for which more disaggregated data on food items are available (Albania, BIH, and Serbia) the
commodities most affected were beverages (tea and coffee), followed by edible oils and then cereals.
Table 10: World and Domestic Food Price Changes (Percentage) and Pass-through estimates
Average Growth in Food
Prices
Estimated Pass-through
2005/06
to
2007/08
2009/10
to
2011/12
2005/06
to
2007/08
2009/10
to
2011/12
World 54.5 28.2
Albania 6.4 8.5 0.12 0.3
BIH 14.5 6.1 0.27 0.22
Serbia na 17.1 na 0.61
FYROM 12.8 6.6 0.23 0.23
Kosovo 10.9 15 0.20 0.52
Montenegro 11.9 3.5 0.22 0.12
Source: Staff estimates based on national monthly price data and world prices from DECPG. Data through June of 2012 for
Albania, BIH and Serbia and 2011 only for FYROM, Kosovo and Montenegro. Increase in world prices for 2009/10 to 2011 was
29.1.
Yet, while SEE6 countries might so far have been relatively sheltered from international food price
increases, it would not be wise to underestimate their vulnerability to them. Some of the vulnerability
is structural, given that all countries in the region except Serbia are net importers of grain, and therefore,
all else holding constant, are exposed to the vagaries of this large segment of the international food
market. Montenegro, an extreme example, relies on imports for virtually all of its consumption of cereals.
During the 2007/08 food crisis SEE6 countries benefited from the appreciation of their domestic
currencies, tracking the euro, against the US dollar, in current conditions it is unlikely that
exchange rate movements might shelter them from food shocks. 18
Between January 2006 and the
peak of the food crisis in June 2008, the euro appreciated by some 30 percent against the dollar; so did the
Serbian dinar; andthe Albanian lek appreciated by about 23 percent. Today, however, it is not clear how
much the dynamics of the euro exchange rate would help insulate SEE countries from rising international
food prices.
Even relatively contained price increases could cause significantly more poverty in the SEE6. The
extent to which households are vulnerable depends primarily on four factors: the magnitude of the price
increase; how much of the household’s budget is devoted to food; whether food is purchased or self-
produced; and whether prices affect households only as consumers, or as both consumers and producers.
The extent to which households can substitute among different food items also makes a difference in how
much households can cope with a shock when prices for different food items do not increase uniformly,
but this factor might be less important now because households that have had to adjust consumption
significantly in the last few years might find it hard to make further adjustments. Figure 48 explores
household vulnerability by plotting indicators of country exposure to a price shock and the household
18 Kosovo and Montenegro rely on the euro, and BIH (mark) and FYR Macedonia (denar) peg their currencies to the euro. Until
recently Serbia pegged the dinar to the euro but has moved towards greater flexibility as part of inflation targeting.

43
marginal food share19
for countries in the Eastern Europe and Central Asia (ECA) and the EU. These two
indicators capture vulnerability as (a) a higher share of net cereal imports over consumption for a country
implies, all else equal, a greater pass-through from global to domestic prices, and (b) the more households
spend on food out of a given unit of income the more their purchasing power will be eroded by a price
increase. In general, in ECA countries, households tend to spend proportionally more on food than in EU
members further west.
Figure 49: Household Vulnerability to Global Food Price Shocks, EU and Europe and Central Asia
Source: Adapted from Townsend, Zorya, Ceccacci, Bora and Delgado (2011).
Within the SEE6 region, from the data available, Albania and BIH are potentially highly
vulnerable because of higher shares of food in household budgets and greater reliance on grain
imports. Serbia, on the other hand, is a net exporter of grains and households there tend to spend less of
their budgets on food, so it may be less vulnerable. While Figure 49 focuses on the vulnerability of
average households, it is likely that different groups have very different levels of vulnerability. This is
explored in Figure 49, which plots actual food shares (i.e. the share of total consumption accounted for by
food) by decile of income distribution. As expected, the share of food in household budgets is even higher
at the bottom of the welfare distribution, so that even small movements in prices can exert significant
stress on poor households. Globally, households in SEE6 countries are not as vulnerable as in many
countries in Africa or Asia, but are generally more vulnerable than in the OECD countries or Latin
America.
19 The marginal food share represents the share of an additional US$1 of income allocated to food, beverages and tobacco in the
overall household budget.
High
vulnerability

44
Figure 50: Food Budget Shares by Consumption Decile
Source: World Bank staff estimates based on household survey data (Albania LSMS 2008; BIH HBS 2007; HBS 2010 data for
Kosovo, Montenegro, FYR Macedonia and Serbia).
Household vulnerability to price increases makes it likely that higher food prices will bring more
poverty. For example, Ivanic and Martin (2008) estimated that the poverty impact of the 2005–2007
increases in commodity prices was 2.5 percentage points in rural areas and 3.6 percentage points in urban
areas (though lower by 0.3–0.4 percentage points after accounting for households that produce
commodities).
Using the latest data available, we estimate the US$2.5/day and US$5/day poverty impact of a 5
percent increase in food prices in SEE countries, which is comparable to the increases experienced
in 2011 (see Box 5 for the assumptions made). Given the nature of our assumptions, the estimates in the
text are likely to be upper-bound estimates.
Box 5: Assumptions Underlying Estimated Poverty Impacts
1. We consider overall food expenditures rather than on individual commodities, partly because recent
increases in food prices are more broad-based than in 2007/2008 (World Bank 2011).
2. In line with previous studies, we consider the short-run impact of price changes so that we abstract from
any longer term substitution effects resulting from changes in relative prices. This is not a major limitation when
looking at changes for food in the aggregate rather than individual commodities.
3. Finally, data limitations do not allow us to consider household food production so that we do not account
for possible positive effects of rising food prices on net food producers. It is likely that households that produce food
for sale and not just for self-consumption and have adequate storage facilities to benefit from rising prices are not
located at the bottom of the welfare distribution. Wodon et al. (2008) find the difference between poverty estimates
with and without production to be minor. Simulations based on the Ivanic and Martin (2008) methodology, using a
detailed account of the household’s production side in LSMS 2005 data for Albania suggests that a 5 percent
increase in food prices leads to a 1 percentage point increase in the incidence of US$2.5/day poverty when the
household’s production side is not considered and 0.3 percentage points when it is taken into account, suggesting an
upward bias of the poverty impact of about 0.7 percentage points. At the US$5/day poverty threshold this upward
bias is estimated to be about 0.5 percentage points.
In Kosovo and FYR Macedonia the simulations suggest a full 2 percentage points increase in
poverty, whereas in Bosnia and Herzegovina, Montenegro and Serbia the simulations suggest only a
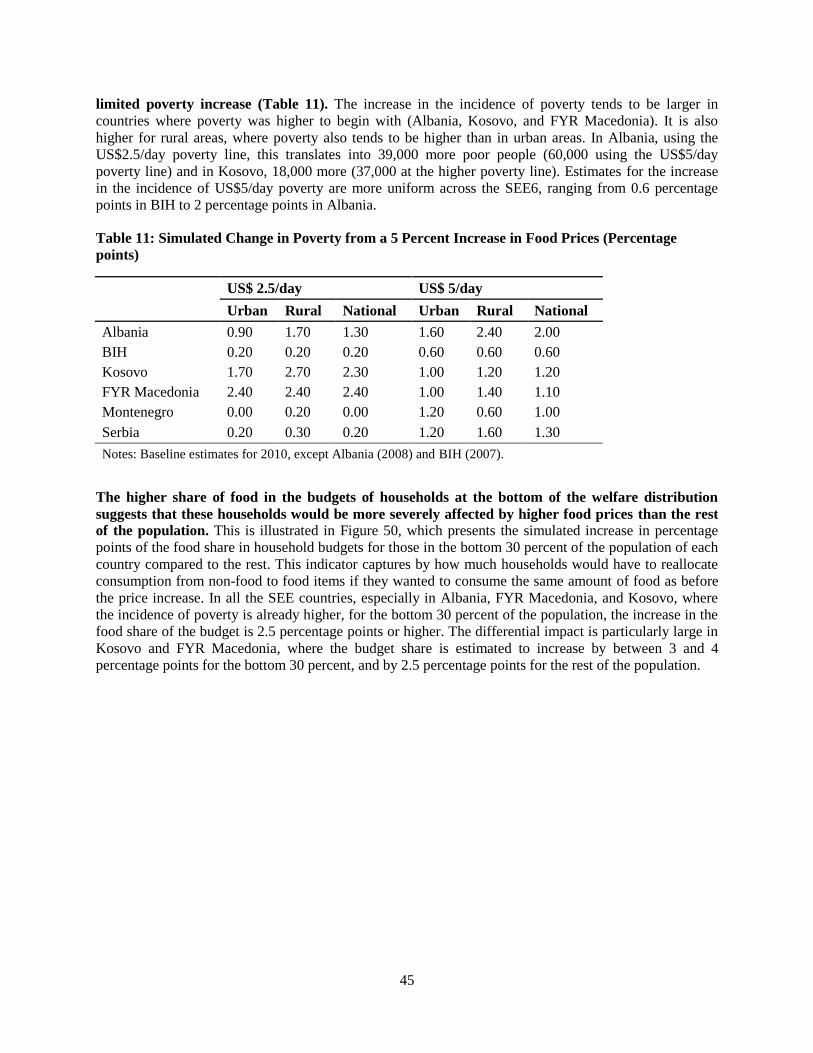
45
limited poverty increase (Table 11). The increase in the incidence of poverty tends to be larger in
countries where poverty was higher to begin with (Albania, Kosovo, and FYR Macedonia). It is also
higher for rural areas, where poverty also tends to be higher than in urban areas. In Albania, using the
US$2.5/day poverty line, this translates into 39,000 more poor people (60,000 using the US$5/day
poverty line) and in Kosovo, 18,000 more (37,000 at the higher poverty line). Estimates for the increase
in the incidence of US$5/day poverty are more uniform across the SEE6, ranging from 0.6 percentage
points in BIH to 2 percentage points in Albania.
Table 11: Simulated Change in Poverty from a 5 Percent Increase in Food Prices (Percentage
points)
US$ 2.5/day US$ 5/day
Urban Rural National Urban Rural National
Albania 0.90 1.70 1.30 1.60 2.40 2.00
BIH 0.20 0.20 0.20 0.60 0.60 0.60
Kosovo 1.70 2.70 2.30 1.00 1.20 1.20
FYR Macedonia 2.40 2.40 2.40 1.00 1.40 1.10
Montenegro 0.00 0.20 0.00 1.20 0.60 1.00
Serbia 0.20 0.30 0.20 1.20 1.60 1.30
Notes: Baseline estimates for 2010, except Albania (2008) and BIH (2007).
The higher share of food in the budgets of households at the bottom of the welfare distribution
suggests that these households would be more severely affected by higher food prices than the rest
of the population. This is illustrated in Figure 50, which presents the simulated increase in percentage
points of the food share in household budgets for those in the bottom 30 percent of the population of each
country compared to the rest. This indicator captures by how much households would have to reallocate
consumption from non-food to food items if they wanted to consume the same amount of food as before
the price increase. In all the SEE countries, especially in Albania, FYR Macedonia, and Kosovo, where
the incidence of poverty is already higher, for the bottom 30 percent of the population, the increase in the
food share of the budget is 2.5 percentage points or higher. The differential impact is particularly large in
Kosovo and FYR Macedonia, where the budget share is estimated to increase by between 3 and 4
percentage points for the bottom 30 percent, and by 2.5 percentage points for the rest of the population.

46
Figure 51: Change in the Budget Share of food due to a 5 percent Increase in the Food Price Index
(percentage points)
Source: World Bank staff estimates based on household survey data (Albania LSMS 2008; BIH HBS 2007; HBS 2010 data for
Kosovo, Montenegro, FYR Macedonia and Serbia).
In addition to increasing poverty, another food price spike would put significant strain on all
households, particularly when other prices are also rising. While in these simulations the poor are
always more affected than the non-poor (the poor in FYR Macedonia are expected to lose as much as 4.1
percent of total spending, in Serbia 3.3 percent, in Albania 3.2 percent, in Kosovo 3.1 percent, in
Montenegro 3.0 percent, and.in BIH 2.7), the loss of purchasing power for the non-poor are also not
negligible. It amounts to 2.7 of the household budget in Albania and FYR of Macedonia, 2.6 percent in
Kosovo, 2.3 percent in Serbia, and 2.1 percent in Bosnia. The impact of these increases would not be
trivial, in part because they would compound the effect of other increases: several SEE6 countries are
increasing the VAT and excises to smooth their budgets and energy prices are rising in several countries.
There seems to be a new reality of high volatility in food prices, and the price are spikes likely to put
significant strain on household budgets already weakened by years of sluggish growth. This will
particularly affect the most vulnerable, just when macroeconomic constraints may limit the scope for
policy responses.
Adapting to this new volatility will require both short and long-term measures. Short-term measures
include:
(a) Clarify emerging trends, by understanding how price trends affect consumer and producer
incomes, through consulting information provided through multinational efforts (e.g., the G20
Agricultural Markets Information System, AMIS) or regional initiatives (e.g. the Eurasian Center
for Food Security, ECFS).
(b) Provide support through safety nets, and agricultural programs (such as Global Food Price Crisis
Response Program (GFRP)-funded seed/fertilizer/fodder provision to enable supply response in
crop systems and to avoid destocking in livestock systems). Prudent use of commodity reserves
should also be considered.
(c) Avoid subsidies to non-food crops and export bans that amplify regional and global market
disruptions. Such bans are also not effective measures to lower domestic prices if countries are
net importers of the commodity subject to the export ban.

47
Medium-term measures would be directed to further investment in safety nets and the agricultural sector.
In the case of agriculture, despite differences across countries (such as the existence of an emerging
commercial agricultural sector in Serbia), a number of common challenges emerge. Those include land
fragmentation across a large number of small producers who can market their products either informally
or with relatively little bargaining power vis-à-vis traders and with limited access to credit, the scant
provision of public goods such as research and extension services, market infrastructure and natural
resource management, and the need to reform agricultural support for farmers to provide incentives to
modernize and become efficient. Subsidies alone are unlikely to help farmers overcome these challenges.
Most SEE6 countries are well-placed to implement such an agenda. Parts of their safety nets are
relatively well-targeted (social assistance of last resort, child allowances) and can expand in coverage or
in generosity to address the consequences of a food price shock. As shown in Figure 51, however, there is
significant variation across countries in terms of targeting, coverage and generosity
Figure 52: Targeting, coverage and generosity of social assistance in the Western Balkans
Source: World Bank Social Assistance Database and World Bank Staff estimates. Note: the size of the bubbles reflects the
generosity of the program (% of overall household consumption of recipients covered by the program)
Priorities to strengthen the system would be to:
Continue to consolidate programs through the integration of energy benefits, utility subsidies,
housing etc into a single last resort social assistance program (BIH, Montenegro and Serbia), or
Albania 2008 45.0 Kosovo 2006/07
43.4 Montenegro 2009 38.4
Serbia 2007 36.1
BiH 2007 33.6
FYR Macedonia 2006 24.3
0
10
20
30
40
50
60
70
80
90
100
0 5 10 15 20 25 30 35 40 45 50
Targ
etin
g A
ccu
racy
(%
of
Tota
l Ben
efit
s G
oin
g to
th
e P
oo
rest
Qu
inti
le)
Coverage (% of Individuals in the Poorest Quintile Receiving the Benefits)
Albania 2008 Kosovo 2006/07 Montenegro 2009
Serbia 2007 BiH 2007 FYR Macedonia 2006

48
merging different fragmented social assistance programs like multiple child allowances (FYR
Macedonia);
Increase the share of targeted programs within the overall social protection system as these
programs are well-targeted but small in terms of coverage and take-up;
Make targeted systems more flexible to better respond to the crisis. During the crisis years of
2009/10 targeted programs responded but not “automatically” (except in the case of Serbia) as
they typically have weak indexation rules and hence the income eligibility thresholds eroded over
time. To address this lack of responsiveness FYR Macedonia introduced temporary top-ups to its
social assistance program, and Montenegro increased benefit amounts by 10 percent.
Review national strategies for monitoring welfare and living conditions to ensure appropriate
monitoring in light of recent developments in the production of high-frequency poverty estimates
(rapid surveys, survey to survey imputation techniques, micro-simulation models).
Considering the experience of recent food shocks and the global crisis, here are some specific
recommendations by country for better preparing for crises:
Albania should continue its recent reforms to strengthen the eligibility for social assistance of last resort,
management information systems, and oversight. Regular monitoring of social impacts is undermined by
the lack of annual data on poverty and its distribution.
The two entities in BIH should continue their efforts to improve the targeting of their safety nets and
make benefit administration efficient and transparent. Regular monitoring of social impacts is hampered
by the lack of annual data on poverty and distribution.
Kosovo, which has a well-targeted program but with limited coverage of the poor, should continue
investing in increasing not only the generosity for large families with children but also in expanding the
coverage of the program.
FYR Macedonia, which was proactive stance during the last global crisis in extending the reach of its
safety nets, should continue its efforts to harmonize and consolidate benefits and build the capacity of the
safety net to protect poor households in times of crisis. The currently growing agricultural subsidies have
the goal to increase productivity in the sector and increase exports of agriculture products, but are likely
to be an inefficient way to protect the poorest households from the effects of food price increases.
Montenegro, which during the past crisis has increased the budget directed to social assistance but has a
rather rigid low-income eligibility threshold for the last resort program, should address the lack of
flexibility in the program (and of children benefits which are linked to the main program) at times of
crisis.
Serbia was proactive during recent food shocks by seeking to moderate food prices through export bans,
but these seem to have met with limited success,20
while its social assistance of last resort system
continued its longer term trend of expanding coverage. To make responses to a food shock more effective,
efforts to increase the flexibility of the social assistance system should seek to enhance both coverage of
the poor and the generosity of benefits, in line with recent reforms.
20 In 2007/2008 Serbia relied on a combination of export bans and strategic reserves to avoid a spike in food prices but the prices
for wheat flour, bread, and other processed wheat products surged anyway (Djuric et al. 2010). Similar measures were introduced
in 2011 and again in 2012. Given the summer drought, August 2012 measures also included a package of relief measures
(subsidies on fuel and credit, waiving of payments on irrigation).
49
REFERENCES
Baffes, John and Bruce Gardner. 2003. “The Transmission of World Commodity Prices to Domestic
Markets Under Policy Reforms in Developing Countries.” Journal of Policy Reform 6(3): 159–80.
Djuric, Ivan, Linde Gotz, and Thomas Glauben. 2011. “Influences of the Governmental Interventions on
Wheat Markets in Serbia during the Food Crisis 2007/2008.” Halle, Germany: Leibniz Institute of
Agricultural Development in Central and Eastern Europe (IAMO).
Headey, Derek, and Shenggen Fan. 2011. “Reflections on the Global Food Crisis: How Did It Happen?
How Has It Hurt? And How Can We Prevent the Next One?” IFPRI Research Monograph No. 165.
Washington, DC: International Food Policy Research Institute.
Ivanic, Maros, and Will Martin. 2008. “Implications of Higher Global Food Prices for Poverty in Low-
Income Countries.” Policy Research Working Paper No. 4594. Washington, DC: World Bank Group.
Townsend, Robert, Sergiy Zorya, Iride Ceccacci, Saswati Bora and Christopher Delgado 2011.
Responding to Higher and More Volatile World Food Prices. Washington, DC: Agriculture and Rural
Development, World Bank Group.
Wodon, Quentin, Clarence Tsimpo, Prospere Backiny-Yetna, George Joseph, Franck Adobo, and Harold
Coulombe. 2008. “Potential Impact of Higher Food Prices on Poverty: Summary Estimates for a Dozen
West and Central African Countries.” Policy Research Working Paper No. 4745. Washington, DC: The
World Bank Group.
World Bank. 2010. Lights out? The Outlook for Energy in Eastern Europe and the Former Soviet Union.
Washington, DC: World Bank Group.