Chatswood to Sydenham Environmental Impact Statement Summary
Suite 6, 20 Young Street, Neutral Bay NSW 2089 - PO Box 1868, Neutral Bay NSW 2089
Ph: 9904 3224
Planning Proposal for a
Proposed Mixed Use Development
629-639 Pacific Highway,
Chatswood
TRAFFIC AND PARKING ASSESSMENT REPORT
26 August 2020
Ref 17358

VARGA TRAFFIC PLANNING PTY LTD
TABLE OF CONTENTS
1. INTRODUCTION .............................................................................................. 1
2. PLANNING PROPOSAL .................................................................................. 5
3. TRAFFIC ASSESSMENT ................................................................................. 13
4. PARKING ASSESSMENT ................................................................................ 33
APPENDIX A TRAFFIC SURVEY DATA
LIST OF ILLUSTRATIONS
Figure 1 Location
Figure 2 Site
Figure 3 Road Hierarchy
Figure 4 Existing Traffic Controls
Figure 5 Existing Public Transport services
Figure 6 Existing Bicycle Routes
Figure 7 Projected Additional Traffic Flows
Figure 8 Existing Parking Restrictions

VARGA TRAFFIC PLANNING PTY LTD
1
1. INTRODUCTION
This report has been prepared to accompany a planning proposal for a mixed use
development to be located at 629-639 Pacific Highway, Chatswood (Figures 1 and 2).
The planning proposal involves the rezoning of the land from B5 – Business Development to
B4 – Mixed Use, increasing the permissible FSR from 2.5:1 up to 6:1 and the subsequent
increase of height controls from 20m up to 90m. The site is situated approximately 750m
walking distance south of Chatswood Railway Station & Bus Interchange and is within easy
walking distance to the Chatswood CBD.
The planning proposal envisages the construction of 81 new residential apartments above a
ground and first floor level commercial/retail component.
Off-street parking will be provided in a new basement car parking area located beneath the
building and will ultimately be designed to comply with Council and SEPP 65 requirements
as well as the relevant Australian Standards. Vehicular access to the site is to be provided via
a new entry/exit driveway located at the southern end of the Hammond Lane site frontage.
The purpose of this report is to assess the traffic and parking implications of the planning
proposal and to that end this report:
• describes the site and provides details of the planning proposal
• reviews the road network in the vicinity of the site, and the traffic conditions on that
road network
• reviews the public transport services available in the vicinity of the site
• estimates the traffic generation potential of the planning proposal and assigns that
traffic generation to the road network serving the site
• assesses the traffic implications of the planning proposal in terms of road network
capacity

VARGA TRAFFIC PLANNING PTY LTD
2
• reviews the geometric design features of the proposed car parking and loading facilities
for compliance with the relevant codes and standards
• assesses the adequacy and suitability of the quantum of off-street car parking and
loading provided on the site.
This planning proposal is consistent with the population growth envisaged by the Chatswood
CBD Planning and Urban Design Strategy (CCPUDS). It is noted in this regard that the
“Future Conditions Report” undertaken by Arup in collaboration with Willoughby City
Council and TfNSW compared the growth scenarios presented in the CCPUDS to the
TfNSW base forecast to ascertain the likely impact on the future transport network. The
“Future Conditions Report” found that:
• travel demand in Chatswood will increase significantly over the next 20 years
• Sydney Metro is a key driver for travel patterns in future years, leading to increased
public transport mode shares and a significant uplift in the number of passengers using
Chatswood Interchange
• despite the mode shift towards public transport, private vehicle trips will also increase
in the horizon years, however results suggest that the road network has the capacity to
accommodate the uplift
• the differences between the base and uplift scenarios on the road network occurred
predominantly on the internal road network within the CBD, and
• the base and uplift scenarios had similar impacts on the surrounding arterial roads, such
as the Pacific Highway and Mowbray Road.
In summary, the future conditions report found that the CCPUDS will have an impact in the
same order of magnitude as the current TfNSW base forecast, and that the future transport
network will be able to accommodate this demand.

VARGA TRAFFIC PLANNING PTY LTD
3

VARGA TRAFFIC PLANNING PTY LTD
4

VARGA TRAFFIC PLANNING PTY LTD
5
2. PLANNING PROPOSAL
Site
The subject site is located on the south-eastern corner of the Pacific Highway and Gordon
Avenue intersection, and extends through to Hammond Lane. The site has street frontages
approximately 37m in length to both the Pacific Highway and Hammond Lane and
approximately 36m in length to Gordon Avenue. The subject site occupies an area of
approximately 1,185m2.
The site is currently zoned B5 - Business Development and is situated approximately 750m
walking distance south of Chatswood Railway Station & Bus Interchange via a dedicated off-
road path parallel to the railway line.
The site is currently occupied by two commercial buildings operating as a car tyre retail /
auto-service workshop. A recent aerial image of the site and its surroundings is reproduced
below.
Source: Nearmap

VARGA TRAFFIC PLANNING PTY LTD
6
Off-street parking is provided at various locations throughout the site, with vehicular access
provided via two driveways located off the Pacific Highway, two driveways located off
Gordon Avenue and two driveways located off Hammond Lane.
Existing Planning Controls
The primary instrument that governs the mass and scale of the development on the site are
contained within the Willoughby Local Environment Plan 2012 (WLEP 2012).
The subject site is currently zoned B5 - Business Development and subject to a maximum
FSR of 2.5:1, with the scale of any development on the site currently limited to a building
height of 20m.
It is therefore envisaged that a six-storey commercial building comprising 2,963m2
retail/commercial floor space is achievable under the existing planning controls for the site,
resulting in an increase of approximately 2,500m2 GFA.
Notwithstanding the above, it is understood that the site may soon be rezoned to B4 – Mixed
Use Zone, which would potentially have a prospective yield of approximately 30 apartments
with a ground floor level commercial/retail component of approximately 600m2.
Planning Proposal
The planning proposal involves the rezoning of the land from B5 – Business Development to
B4 – Mixed Use, increasing the permissible FSR from 2.5:1 up to 6:1 and the subsequent
increase of height controls from 20m up to 90m. The proposed changes to the planning
controls have the potential to achieve approximately 81 apartments as follows:
1 bedroom apartments: 22
2 bedroom apartments: 55
3 bedroom apartments: 4
TOTAL APARTMENTS: 81
A number of commercial/retail tenancies are also proposed on the ground and first floor
levels of the new building with a cumulative floor area of approximately 705m2.

VARGA TRAFFIC PLANNING PTY LTD
7
Off-street parking will be provided in a new basement car parking area and will ultimately be
designed to comply with Council and SEPP requirements, as well as the relevant Australian
Standards. Vehicular access to the site is to be provided via a new entry/exit driveway located
at the southern end of the Hammond Lane site frontage.
State Environmental Planning Policy (Infrastructure) 2007 applies to the site, given its
frontage to the Pacific Highway. Clause 101(2) of the Infrastructure SEPP states the
following:
“The consent authority must not grant consent to development on land that has a frontage to a classified
road unless it is satisfied that:
• where practicable, vehicular access to the land is provided by a road other than the classified road,
and
• the safety, efficiency and ongoing operation of the classified road will not adversely be affected
by the development as a result of:
(i) the design of the vehicular access to the land, or
(ii) the emission of smoke or dust from the development, or
(iii) the nature, volume or frequency of vehicles using the classified road to gain access to the
land, and
• the development is of a type that is not sensitive to traffic noise or vehicle emissions, or is
appropriately located and designed, or includes measures, to ameliorate potential traffic noise or
vehicle emissions within the site of the development arising from the adjacent classified road.”
Consistent with the requirements of Clause 101(2), vehicular access to the site is to be
provided via Hammond Lane, rather than the Pacific Highway, and the proposed
development therefore complies with the requirements of the SEPP (Infrastructure) 2007.
Loading/servicing for the proposed development is expected to be undertaken by a variety of
commercial vehicles up to and including 8.8m long MRV medium rigid trucks. A dedicated
service area is to be provided on the ground floor level adjacent to the vehicular access
driveway which includes a large turntable, thereby allowing all service vehicles to enter and
exit the site in a forward direction at all times.

VARGA TRAFFIC PLANNING PTY LTD
8
Concept plans of the planning proposal have been prepared by DEM (Aust) Pty Ltd and are
reproduced in the following pages.

VARGA TRAFFIC PLANNING PTY LTD
9

VARGA TRAFFIC PLANNING PTY LTD
10

VARGA TRAFFIC PLANNING PTY LTD
11

VARGA TRAFFIC PLANNING PTY LTD
12

VARGA TRAFFIC PLANNING PTY LTD
13
3. TRAFFIC ASSESSMENT
Road Hierarchy
The road hierarchy allocated to the road network in the vicinity of the site by the Roads and
Maritime Services is illustrated on Figure 3.
The Pacific Highway is classified by the RMS as a State Road and provides the key north-
south road link in the area, linking North Sydney to Hornsby and beyond. It typically carries
three traffic lanes in each direction in the vicinity of the site, with opposing traffic flows
separated by a central median island. Clearway restrictions apply during commuter peak
periods.
The Gore Hill Freeway is also classified by the RMS as a State Road and provides the key
east-west road link in the area, linking the Warringah Freeway to the Lane Cove Tunnel. It
carries multiple traffic lanes in each direction in the vicinity of the site, with opposing traffic
flows separated by a central median island. All intersections with the Gore Hill Freeway are
grade-separated.
Mowbray Road is classified by the RMS as a Regional Road which provides another key
east-west road link in the local area. It typically carries two traffic lanes in each direction in
the vicinity of the site, with additional lanes provided at key locations.
Gordon Avenue is a local, unclassified road which is primarily used to provide vehicular and
pedestrian access to frontage properties. Kerbside parking is generally permitted on both
sides of the road.
Hammond Lane is a local, unclassified service lane which is primarily used to provide rear
vehicular and pedestrian access to properties fronting the Pacific Highway. Kerbside parking
is generally permitted along one side of the laneway only.

VARGA TRAFFIC PLANNING PTY LTD
14
VARGA TRAFFIC PLANNING PTY LTD
15
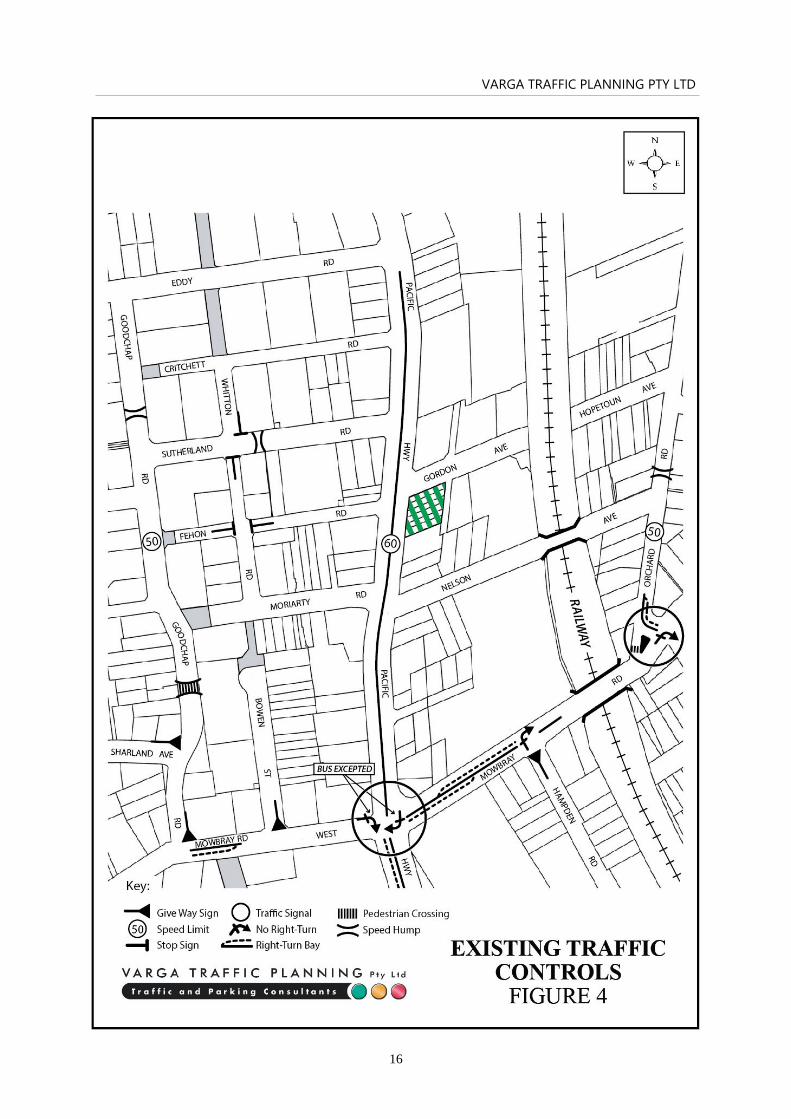
Existing Traffic Controls
The existing traffic controls which apply to the road network in the vicinity of the site are
illustrated on Figure 4. Key features of those traffic controls are:
▪ a 60 km/h SPEED LIMIT which applies to the Pacific Highway
▪ a 50 km/h SPEED LIMIT which applies to Gordon Avenue and all other local roads in
the area
▪ TRAFFIC SIGNALS in the Pacific Highway where it intersects with Mowbray Road
▪ a CENTRAL MEDIAN ISLAND in the Pacific Highway which precludes right-turn
movements into / out of Gordon Avenue
▪ a NO RIGHT TURN southbound restriction in the Pacific Highway for traffic turning
onto Mowbray Road (Buses Excepted)
▪ a NO RIGHT TURN eastbound restriction in Mowbray Road for traffic turning onto
the Pacific Highway (Buses Excepted).
Existing Public Transport Services
The existing public transport services available within the vicinity of the subject site are
illustrated on Figure 5.
The subject site is conveniently located within approximately 750m walking distance south of
Chatswood Railway Station via a dedicated off-road path parallel to the railway. Chatswood
Station lies on the T1 North Shore, Northern & Western Line, linking Berowra, Hornsby,
Epping, Richmond and Emu Plains.
In addition to the train services, a major bus interchange is available outside of the
Chatswood Railway Station servicing a number of bus routes, including the M40, 137, 257,
273, 136, L60, 267, 275, 143, 144 and 200 services.
VARGA TRAFFIC PLANNING PTY LTD
16

VARGA TRAFFIC PLANNING PTY LTD
17

VARGA TRAFFIC PLANNING PTY LTD
18
Notably, route M40 is part of the Sydney’s Metrobus network that provides high-frequency,
high-capacity intra-regional links between key employment and growth centres across
Sydney. The M40 links between Chatswood, Willoughby, Naremburn, Sydney City,
Darlinghurst, Paddington, Woollahra and Bondi Junction, operating at 10 minute intervals
during commuter peak periods, 15 minute intervals during the day and 20 minute intervals at
other times.
There is also an extensive range of bus services available within 50m walking distance north
of the site along the Pacific Highway. A summary of those bus services is provided in the
table below, revealing that there are more than 370 bus services per day travelling near the
site on weekdays, decreasing to approximately 200 bus services per day on Saturdays and
approximately 140 bus services per day on Sundays, as set out in the table below.
Bus Routes and Frequencies
Route No. Route Weekday Saturday Sunday
In Out In Out In Out
143 Manly to Chatswood
32 27 - - - -
144 31 32 32 32 32 32
258 Lane Cove Industrial to Chatswood 2 2 - - - -
261 Longueville & Northwood to City 24 25 11 11 - -
530 Burwood to Chatswood 42 42 32 32 27 27
533 Sydney Olympic Park to
Chatswood 8 10 - - - -
534 Ryde to Chatswood 31 27 20 20 10 10
536 Gladesville to Chatswood 21 20 - - - -
TOTAL 191 185 95 95 69 69
The site is also located within easy walking distance of the Chatswood City Centre which
includes a wide range of essential shops and services including licenced clubs, banks,
supermarkets, gymnasiums, restaurants and specialty stores.
On the above basis it is clear that the site is extremely well served by existing public transport
and essential services and is ideally located to encourage reduced private car usage and an
increased use of public transport and active forms of transport such as walking and cycling.
VARGA TRAFFIC PLANNING PTY LTD
19
Existing Pedestrian Paths
Existing pedestrian footpaths located in the vicinity of the site provide suitable links for
pedestrians accessing local facilities such as schools and shops in the local area. The site is
also located within easy walking distance of the Chatswood CBD located north of the subject
site.
In particular, a shared Off-Road Pedestrian and Bicycle Path running parallel to the railway
line is easily accessed directly from the eastern end of Gordon Avenue. This shared path
allows pedestrians and bicycles to travel safely along a 750m long off-road route which is
linked directly to the Chatswood CBD, giving direct access to the Chatswood Railway
Station.
Local Bicycle Routes
The existing bicycle routes located in the vicinity of the site are illustrated on Figure 6. The
bicycle routes are readily accessible from the subject site and provide a number of on-road
and off-road bicycle links through the local area, including the following routes:
• to Chatswood CBD from Gordon Avenue via the shared Off-Road Pedestrian & Bicycle
Route running parallel to the railway line
• to Chatswood Public School from Gordon Avenue via the abovementioned dedicated
shared Off-Road Pedestrian & Bicycle Route running parallel to the railway line
• to Willoughby via the dedicated shared Off-Road Pedestrian & Bicycle Route running
parallel to the railway line and the on-road bicycle route via Johnson Street, Laurel Street
& Edinburgh Road
• to Crows Nest dedicated shared Off-Road Pedestrian & Bicycle Route running parallel to
the railway line, and the on-road bicycle route via Johnson Street, Devonshire Street,
Shepherd Road & the shared Off-Road Pedestrian & Bicycle Route (starting along
Weedon Road

VARGA TRAFFIC PLANNING PTY LTD
20

VARGA TRAFFIC PLANNING PTY LTD
21
The proposed development makes provision for a bicycle parking area which is to be located
on the basement floor level, which can easily be accessible from Hammond Lane and will
enhance the active transport options available to future occupants of the site.
Chatswood to Sydenham
Sydney Metro is Australia’s biggest public transport project, delivering 31 stations and 66
kilometres of new metro rail, and revolutionising the way Australia’s biggest city travels.
Chatswood to Sydenham component of Sydney Metro City & Southwest was the subject of a
separate environmental assessment process in 2016 and was granted planning approval in
January 2017. This proposal included a new 15.5km twin railway tunnel, linking between the
end of the Sydney Metro Northwest at Chatswood and Sydenham. Tunnel construction is
currently underway, with tunnelling finished and construction progressing rapidly.
New, direct and fast services would be provided for key employment and education precincts
in particular, these services will connect to Martin Place, Barangaroo, North Sydney,
Chatswood and Macquarie Park, with interchanges to other rail services at Sydenham,
Central and Martin Place. An indicative timeline of the construction schedule is provided
below.
Two dive structures and tunnel portals are being built, including one located in Chatswood,
approximately 100m south of the subject site, on the eastern side of Pacific Highway, in
between Nelson Street and Mowbray Road.
Source: Transport for NSW, SydneyMetro

VARGA TRAFFIC PLANNING PTY LTD
22
Nelson Street Bridge will be permanently closed to traffic from the middle of 2018, with
motorists travelling north redirected via Mowbray Road, Orchard Road and Albert Avenue.
Whilst the ‘dive site’ will prohibit the redevelopment of that part of the Chatswood precinct
for several years it is not expected to result in any unacceptable traffic implications on the
proposed development.
In this regard, the construction access driveway for trucks exiting the dive site is to be located
towards the western end of Nelson Street, with the driveway estimated to be used for
construction until mid-2018. Light passenger vehicles will continue to use this access
driveway along with the access driveways located along Mowbray Road until mid-2020.
Services for the Metro rail are expected to start in 2019 using Sydney’s new-generation of
fully-automated metro trains, with a metro train every four minutes during peak periods.
Source: Sydney Metro Construction Notification 27th February 2018 – Location of out-of-
hours works at Chatswood Dive site, Pacific Highway, Mowbray Road and Nelson Street,
Chatswood

VARGA TRAFFIC PLANNING PTY LTD
23
Existing Traffic Conditions
An indication of the existing traffic conditions on the road network in the vicinity of the site
is provided by peak period traffic surveys undertaken as part of this traffic study.
The traffic surveys were undertaken at the Pacific Highway and Gordon Avenue intersection
as well as the Gordon Avenue and Hammond Lane intersection. The results of the traffic
surveys are reproduced in full in Appendix A and reveal that:
▪ southbound traffic flows in the Pacific Highway past the site frontage are typically in
the order of 1,700 vehicles per hour (vph) during the weekday commuter peak periods
▪ two-way traffic flows in Gordon Avenue and Hammond Lane are significantly lower,
typically in the order of 10 - 20 vph during the weekday commuter peak periods.
Projected Traffic Generation
An indication of the traffic generation potential of the planning proposal is provided by
reference to the Roads and Maritime Services publication Guide to Traffic Generating
Developments, Section 3 - Landuse Traffic Generation (October 2002) and the updated traffic
generation rates in the recently published RMS Technical Direction (TDT 2013/04a)
document.
The TDT 2013/04a document specifies that it replaces those sections of the RMS Guidelines
indicated, and that it must be followed when RMS is undertaken trip generation and/or
parking demand assessments.
The RMS Guidelines and the updated TDT 2013/04a are based on extensive surveys of a
wide range of land uses and nominate the following traffic generation rates which are
applicable to the development proposal:
High Density Residential Flat Dwellings
AM: 0.19 peak hour vehicle trips per unit
PM: 0.15 peak hour vehicle trips per unit
VARGA TRAFFIC PLANNING PTY LTD
24
Office Blocks
AM: 1.6 peak hour vehicle trips per 100m2 GFA
PM: 1.2 peak hour vehicle trips per 100m2 GFA
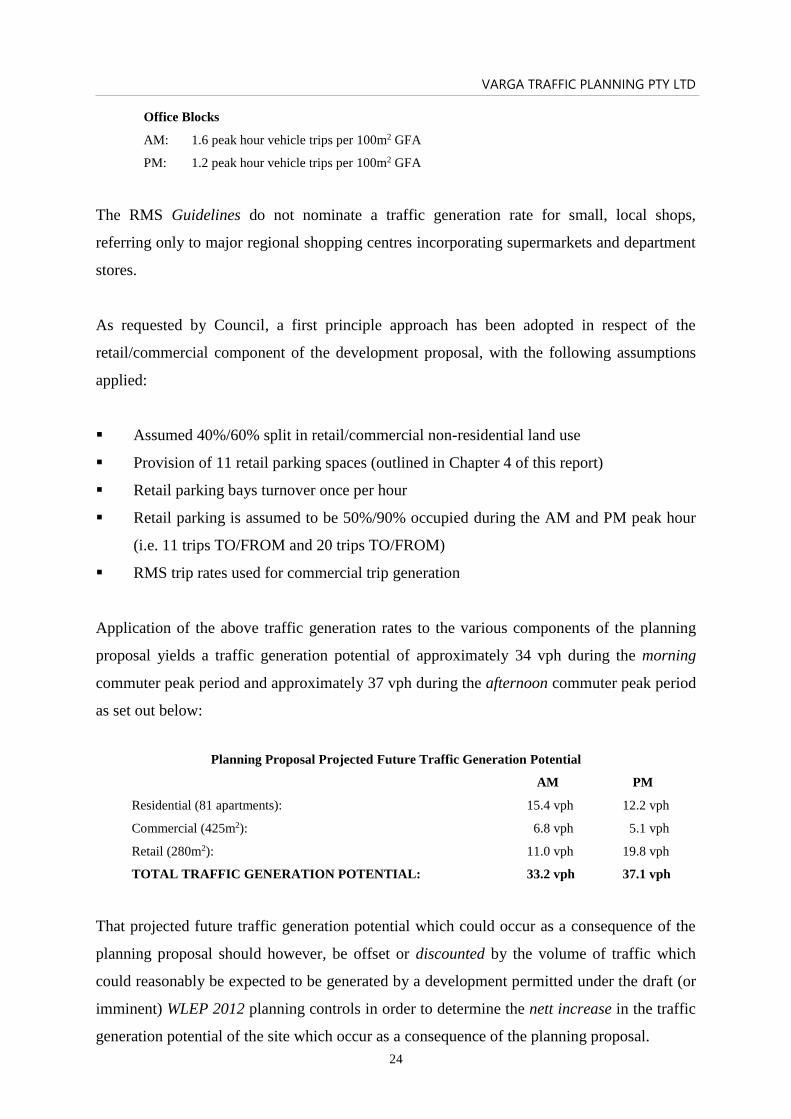
The RMS Guidelines do not nominate a traffic generation rate for small, local shops,
referring only to major regional shopping centres incorporating supermarkets and department
stores.
As requested by Council, a first principle approach has been adopted in respect of the
retail/commercial component of the development proposal, with the following assumptions
applied:
▪ Assumed 40%/60% split in retail/commercial non-residential land use
▪ Provision of 11 retail parking spaces (outlined in Chapter 4 of this report)
▪ Retail parking bays turnover once per hour
▪ Retail parking is assumed to be 50%/90% occupied during the AM and PM peak hour
(i.e. 11 trips TO/FROM and 20 trips TO/FROM)
▪ RMS trip rates used for commercial trip generation
Application of the above traffic generation rates to the various components of the planning
proposal yields a traffic generation potential of approximately 34 vph during the morning
commuter peak period and approximately 37 vph during the afternoon commuter peak period
as set out below:
Planning Proposal Projected Future Traffic Generation Potential
AM PM
Residential (81 apartments): 15.4 vph 12.2 vph
Commercial (425m2): 6.8 vph 5.1 vph
Retail (280m2): 11.0 vph 19.8 vph
TOTAL TRAFFIC GENERATION POTENTIAL: 33.2 vph 37.1 vph
That projected future traffic generation potential which could occur as a consequence of the
planning proposal should however, be offset or discounted by the volume of traffic which
could reasonably be expected to be generated by a development permitted under the draft (or
imminent) WLEP 2012 planning controls in order to determine the nett increase in the traffic
generation potential of the site which occur as a consequence of the planning proposal.
VARGA TRAFFIC PLANNING PTY LTD
25
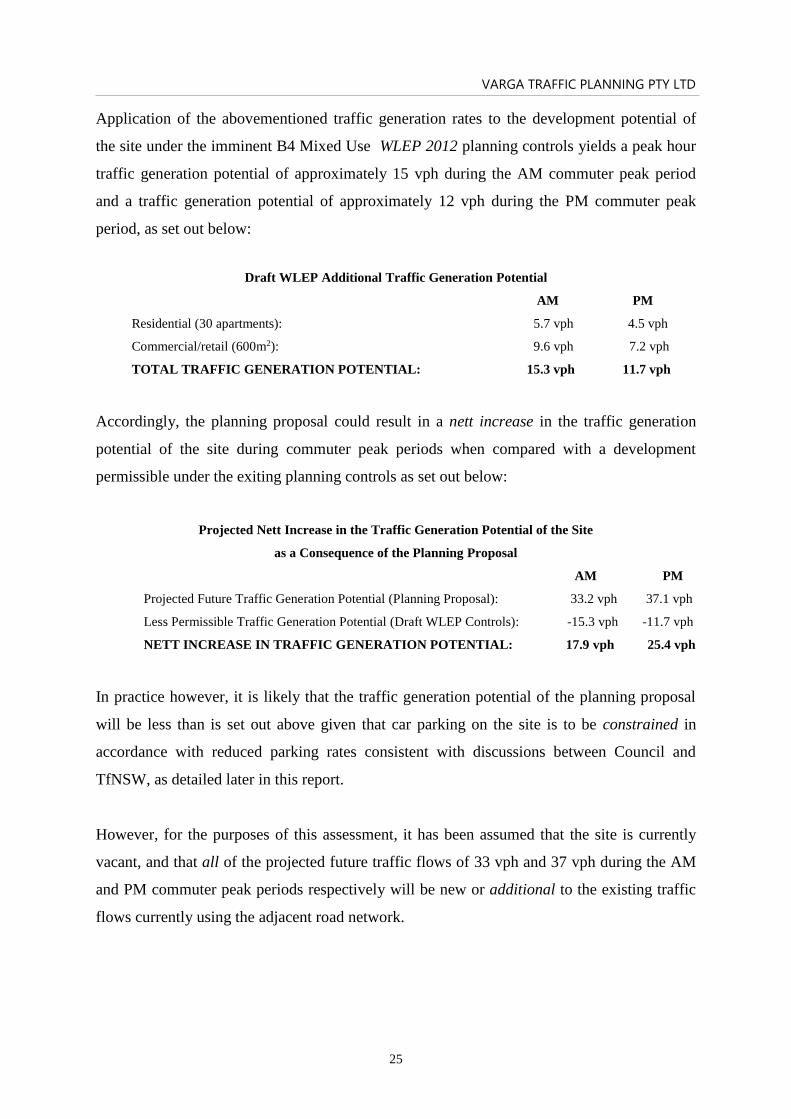
Application of the abovementioned traffic generation rates to the development potential of
the site under the imminent B4 Mixed Use WLEP 2012 planning controls yields a peak hour
traffic generation potential of approximately 15 vph during the AM commuter peak period
and a traffic generation potential of approximately 12 vph during the PM commuter peak
period, as set out below:
Draft WLEP Additional Traffic Generation Potential
AM PM
Residential (30 apartments): 5.7 vph 4.5 vph
Commercial/retail (600m2): 9.6 vph 7.2 vph
TOTAL TRAFFIC GENERATION POTENTIAL: 15.3 vph 11.7 vph
Accordingly, the planning proposal could result in a nett increase in the traffic generation
potential of the site during commuter peak periods when compared with a development
permissible under the exiting planning controls as set out below:
Projected Nett Increase in the Traffic Generation Potential of the Site
as a Consequence of the Planning Proposal
AM PM
Projected Future Traffic Generation Potential (Planning Proposal): 33.2 vph 37.1 vph
Less Permissible Traffic Generation Potential (Draft WLEP Controls): -15.3 vph -11.7 vph
NETT INCREASE IN TRAFFIC GENERATION POTENTIAL: 17.9 vph 25.4 vph
In practice however, it is likely that the traffic generation potential of the planning proposal
will be less than is set out above given that car parking on the site is to be constrained in
accordance with reduced parking rates consistent with discussions between Council and
TfNSW, as detailed later in this report.
However, for the purposes of this assessment, it has been assumed that the site is currently
vacant, and that all of the projected future traffic flows of 33 vph and 37 vph during the AM
and PM commuter peak periods respectively will be new or additional to the existing traffic
flows currently using the adjacent road network.

VARGA TRAFFIC PLANNING PTY LTD
26
Journey to Work Data Analysis
The directional distribution and assignment of traffic generated by the proposed development
will be influenced by a number of factors, however by analysing the behaviour of the existing
nearby residents and employees and how they travel, we can provide a guide to how the
future residents and employees of the development may travel. These are based on certain
characteristics that can be grouped depending on the:
▪ purpose for their journey
▪ the time period of their journey
▪ the mode or combination of modes of transport used from the origin to the destination
The study area is contained within Travel Zone 1807 (TZ1807) as defined in the 2011 Census
Journey to Work (JTW) data. An analysis of the data shows that around 31% of work trips for
those working and living in the Chatswood Precinct are undertaken by private transport – i.e.
147 people employed within the Chatswood Precinct area.
The modal share of work trips for employed residents in the TZ1807 shows that both public
transport (train and buses) and private transport (drivers and/or passengers) had a modal split
of 38% within the travel zone, as shown tabulated below.
Source: Bureau of Transport Statistics, JTW 2011

VARGA TRAFFIC PLANNING PTY LTD
27
Mode of Travel (Top 10 Destinations of Work)
Place of Work Number
of Trips
Private Transport Public
Transport
Walked
Only
Mode not
stated
Other
Total
Car Car
Passenger
Train Bus
Chatswood –
Lane Cove
475 31% 2% 11% 4% 40% 1% 11% 100%
Sydney Inner
City
351 17% 5% 65% 9% 2% 1% 1% 100%
North Sydney
– Mosman
103 40% 3% 44% 9% 4% 100%
Ryde –
Hunters Hill
71 54% 4% 28% 4% 10% 100%
Warringah 38 68% 16% 16% 100%
Ku-ring-gai 31 71% 10% 19% 100%
Eastern
Suburbs –
North
21 48% 38% 14% 100%
Botany 20 70% 15% 15% 100%
Auburn 16 81% 19% 100%
Strathfield –
Burwood –
Ashfield
16 81% 19% 100%
Grand Total 1251 38% 38% 18% 1% 5% 100
%
*Grand total includes all places of work
Source: Bureau of Transport Statistics, JTW 2011
Travel Mode Split for TZ1807 – Destination or place of work (SA3)

VARGA TRAFFIC PLANNING PTY LTD
28
In terms of travel modal split for residents residing in travel zone 1807, the figure below
shows that 62% of the people working in the study area use car (as driver and as passengers)
as the mode of travel, whilst 28% used public transport or other active forms of transport
within the area (i.e. – train, buses, bicycle, walking).
The statistics show that of the 632 people living within the Chatswood study area TZ1807,
60% were vehicle drivers, this rate is therefore reasonable to be applied to the proposed
development and will ultimately become re-distributed within the adjoining road network.
Notwithstanding the above, the assumed directional distribution of traffic has been adopted in
accordance with the JTW data for the destination or place of work in the table previously
mentioned. In order to provide a more rigorous assessment, it has been assumed that all of the
projected future traffic flows of 33 vph and 37 vph during the AM and PM commuter peak
periods respectively, has been assumed as vehicle drivers and has been applied to the road
network / intersections in the vicinity of the site as illustrated on Figure 7 below.
The proposed additional traffic generation potential of the site as a consequence of the
development proposal is statistically insignificant and will also clearly not have any
unacceptable traffic implications in terms of road network capacity and downstream traffic
issues, particularly when considered there are only 19 additional vehicles during the morning
peak period and approximately 16 additional vehicles during the afternoon peak period
Travel Mode Split for TZ1807 – Place of Residence

VARGA TRAFFIC PLANNING PTY LTD
29

VARGA TRAFFIC PLANNING PTY LTD
30
Traffic Implications - Road Network Capacity
The traffic implications of development proposals primarily concern the effects that any
additional traffic flows may have on the operational performance of the nearby road network.
Those effects can be assessed using the SIDRA program which is widely used by the RMS
and many LGA’s for this purpose. Criteria for evaluating the results of SIDRA analysis are
reproduced in the following pages.
The results of the SIDRA analysis of the Pacific Highway and Gordon Avenue intersection
are summarised on Table 3.1 below, revealing that:
▪ the Pacific Highway and Gordon Avenue intersection currently operates at Level of
Service “A” under the existing traffic demands with total average vehicle delays in
the order of less than 1 second/vehicle
▪ under the projected additional traffic demands which could be generated by a
commercial building development permitted under the existing planning controls, the
intersection would continue to operate at Level of Service “A” during the AM and PM
commuter peak periods, with increases in average vehicle delays of less than 1
second/vehicle.
▪ under the projected future traffic demands expected to be generated by the planning
proposal, the intersection would also continue to operate at Level of Service “A”
during the AM and PM commuter peak periods, with increases in average vehicle
delays of less than 1 second/vehicle.
In the circumstances, it is clear that the planning proposal will not have any unacceptable
traffic implications in terms of road network capacity.

VARGA TRAFFIC PLANNING PTY LTD
31
TABLE 3.1 - RESULTS OF SIDRA ANALYSIS OF
PACIFIC HIGHWAY & GORDON AVENUE
Key Indicators
Existing
Traffic Demand
Draft WLEP
Traffic Demands
(600m² & 30Apts)
Planning Proposal
Traffic Demands
(705m² & 81Apts)
AM PM AM PM AM PM
Level of Service
A
A
A
A
A
A
Degree of Saturation
0.303
0.297
0.304
0.298
0.305
0.301
Average Vehicle Delay (secs/veh)
Gordon Avenue (east) L
8.4
7.7
8.0
7.7
7.9
7.7
Pacific Highway (north) L
T
5.8
0.0
5.6
0.0
5.6
0.0
5.6
0.0
5.6
0.0
5.6
0.0
TOTAL AVERAGE VEHICLE DELAY
0.1
0.1
0.1
0.2
0.2
0.3
PAC_GORX PAC_GORPermissible PAC_GORP

VARGA TRAFFIC PLANNING PTY LTD
32
Criteria for Interpreting Results of Sidra Analysis
1. Level of Service (LOS)
LOS
Traffic Signals and Roundabouts
Give Way and Stop Signs
'A'
'B'
'C'
'D'
'E'
'F'
Good operation.
Good with acceptable delays and spare capacity.
Satisfactory.
Operating near capacity.
At capacity; at signals incidents will cause excessive
delays. Roundabouts require other control mode.
Unsatisfactory and requires additional capacity.
Good operation.
Acceptable delays and spare capacity.
Satisfactory but accident study required.
Near capacity and accident study required.
At capacity and requires other control mode.
Unsatisfactory and requires other control mode.
2. Average Vehicle Delay (AVD)
The AVD provides a measure of the operational performance of an intersection as indicated on the table below
which relates AVD to LOS. The AVD’s listed in the table should be taken as a guide only as longer delays
could be tolerated in some locations (ie inner city conditions) and on some roads (ie minor side street
intersecting with a major arterial route).
Level of
Service
Average Delay
per Vehicle
(secs/veh)
Traffic Signals, Roundabout
Give Way and Stop Signs
A less than 14 Good operation. Good operation.
B 15 to 28 Good with acceptable delays and spare
capacity.
Acceptable delays and spare capacity.
C 29 to 42 Satisfactory. Satisfactory but accident study
required.
D 43 to 56 Operating near capacity. Near capacity and accident study
required.
E 57 to 70 At capacity; at signals incidents will
cause excessive delays.
Roundabouts require other control
mode.
At capacity and requires other control
mode.
3. Degree of Saturation (DS)
The DS is another measure of the operational performance of individual intersections.
For intersections controlled by traffic signals1 both queue length and delay increase rapidly as DS approaches 1,
and it is usual to attempt to keep DS to less than 0.9. Values of DS in the order of 0.7 generally represent
satisfactory intersection operation. When DS exceeds 0.9 queues can be anticipated.
For intersections controlled by a roundabout or GIVE WAY or STOP signs, satisfactory intersection operation
is indicated by a DS of 0.8 or less.
1 The values of DS for intersections under traffic signal control are only valid for cycle length of 120 secs.

VARGA TRAFFIC PLANNING PTY LTD
33
4. PARKING IMPLICATIONS
Existing Kerbside Parking Restrictions
The existing kerbside parking restrictions which apply to the road network in the vicinity of
the site are illustrated on Figure 8. Key features of those parking restrictions are:
• CLEARWAY restrictions along both sides of the Pacific Highway during commuter
peak periods
• NO PARKING restrictions along the eastern side of the Pacific Highway in the vicinity
of the site at all other times, including along the entire length of the site frontage
• 1 HOUR PARKING restrictions along the southern side of Gordon Avenue, including
along the entire site frontage
• BUS ZONES located at regular intervals along both sides of the Pacific Highway,
including just south of the site
• NO PARKING restrictions along the eastern side of Hammond Lane, south of Gordon
Avenue intersection
• NO PARKING restrictions along the eastern side of Hammond Lane, south of Gordon
Avenue.
Off-Street Car Parking Provisions
Following discussions between Council and TfNSW, it is understood that an agreement has
been reached that the following constrained parking rates should be applied to new
developments in the Chatswood CBD:

VARGA TRAFFIC PLANNING PTY LTD
34

VARGA TRAFFIC PLANNING PTY LTD
35
Land use Parking rate
Residential Studio 0.5 spaces per dwelling
1-bed 0.5 spaces per dwelling
2+bed 1 space per dwelling
Visitor 1 space per 10 dwellings
Office 1 space per 400 sqm GFA
Retail (<1000 sqm) -
Retail (>1000 sqm) 1 space per 300 sqm GFA
Application of the above parking rates to the various components of the planning proposal
yields an off-street car parking requirement of 79 spaces as set out below:
Residents (81 apartments): 70.0 spaces
Visitors: 8.1 spaces
Retail (205m²): 0.0 spaces
Commercial/business (500m²): 1.3 spaces
TOTAL: 79.4 spaces
However, the subject site is located within 800 metres of a railway station in the Sydney
metropolitan area, and therefore the residential component of the Planning Proposal is also
subject to the parking requirements specified in State Environmental Planning Policy No 65 –
Design Quality of Residential Flat Development (Amendment No 3), 2015 in the following
terms:
30 Standards that cannot be used to refuse development consent or modification of development
consent
(1) If an application for the modification of a development consent or a development application
for the carrying out of development to which this Policy applies satisfies the following design
criteria, the consent authority must not refuse the application because of those matters:
a) if the car parking for the building will be equal to, or greater than, the recommended
minimum amount of car parking specified in Part 3J of the Apartment Design Guide.
VARGA TRAFFIC PLANNING PTY LTD
36
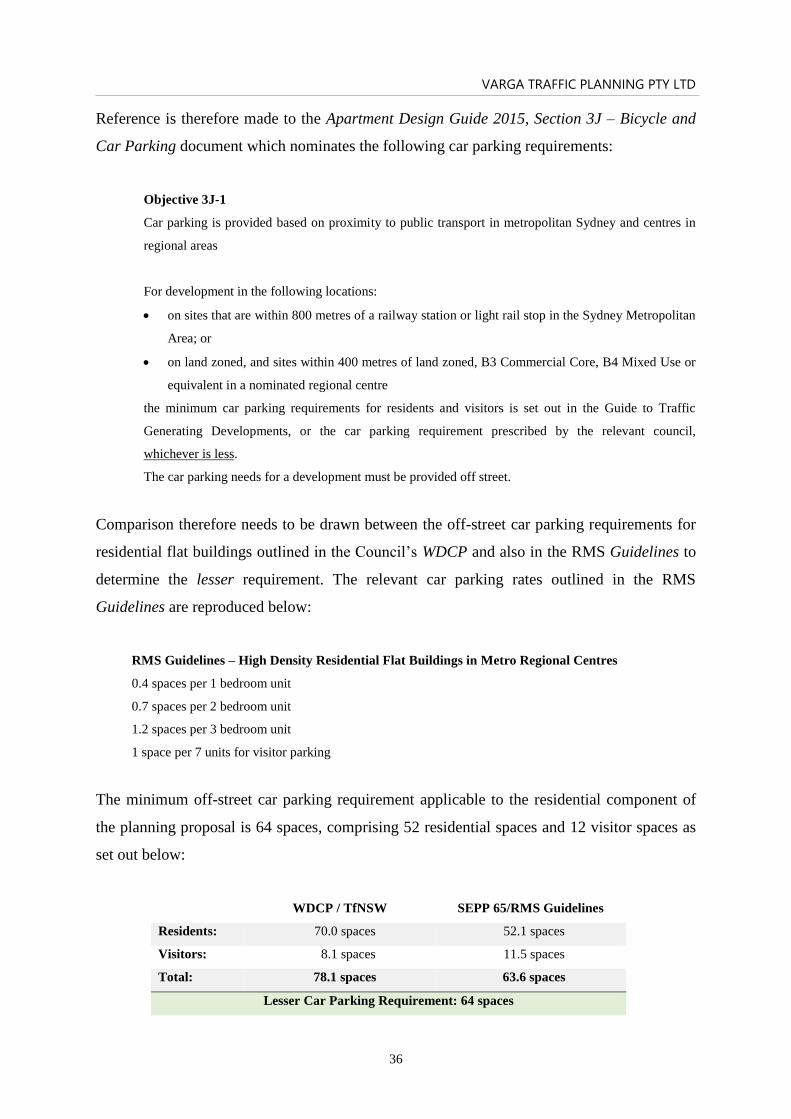
Reference is therefore made to the Apartment Design Guide 2015, Section 3J – Bicycle and
Car Parking document which nominates the following car parking requirements:
Objective 3J-1
Car parking is provided based on proximity to public transport in metropolitan Sydney and centres in
regional areas
For development in the following locations:
• on sites that are within 800 metres of a railway station or light rail stop in the Sydney Metropolitan
Area; or
• on land zoned, and sites within 400 metres of land zoned, B3 Commercial Core, B4 Mixed Use or
equivalent in a nominated regional centre
the minimum car parking requirements for residents and visitors is set out in the Guide to Traffic
Generating Developments, or the car parking requirement prescribed by the relevant council,
whichever is less.
The car parking needs for a development must be provided off street.
Comparison therefore needs to be drawn between the off-street car parking requirements for
residential flat buildings outlined in the Council’s WDCP and also in the RMS Guidelines to
determine the lesser requirement. The relevant car parking rates outlined in the RMS
Guidelines are reproduced below:
RMS Guidelines – High Density Residential Flat Buildings in Metro Regional Centres
0.4 spaces per 1 bedroom unit
0.7 spaces per 2 bedroom unit
1.2 spaces per 3 bedroom unit
1 space per 7 units for visitor parking
The minimum off-street car parking requirement applicable to the residential component of
the planning proposal is 64 spaces, comprising 52 residential spaces and 12 visitor spaces as
set out below:
WDCP / TfNSW SEPP 65/RMS Guidelines
Residents: 70.0 spaces 52.1 spaces
Visitors: 8.1 spaces 11.5 spaces
Total: 78.1 spaces 63.6 spaces
Lesser Car Parking Requirement: 64 spaces

VARGA TRAFFIC PLANNING PTY LTD
37
Accordingly, the minimum off-street car parking requirement applicable to the planning
proposal is therefore 65 spaces as set out below:
Residential (81 apartments): 52.1 spaces (SEPP 65/RMS)
Visitors: 11.5 spaces (SEPP 65/RMS)
Retail (205m²): 0.0 spaces (DCP/TfNSW)
Commercial/business (500m²): 1.3 spaces (DCP/TfNSW)
TOTAL: 64.9 spaces
Whilst the number of parking spaces to be provided as part of the planning proposal is not yet
known, it is clear that the above parking requirements can be satisfied within the provision of
basement parking area on the subject site.
The geometric design layout of the future car parking facilities will ultimately be designed to
comply with the relevant requirements specified in the Standards Australia publication
Parking Facilities Part 1 - Off-Street Car Parking AS2890.1:2004 and Parking Facilities
Part 6 - Off-Street Parking for People with Disabilities AS2890.6.
Off-Street Motorcycle and Bicycle Parking Provisions
The motorcycle and bicycle parking requirements applicable to the development proposal are
also specified in Willoughby Development Control Plan Part C.4 – Transport Requirements
for Development document in the following terms:
Motorcycle
1 motorcycle space per 25 car spaces
Bicycle
Residential (lockers): 1 space per 10 units plus
Residential (rail/racks): 1 space per 12 units
Commercial (lockers): 1 space per 600m2 plus
Commercial (rail/racks): 1 space per 2,500m2
Application of the above motorcycle and bicycle parking requirements to the various
components of the planning proposal yields an off-street parking requirement of 4 motorcycle
spaces, 9 bicycle lockers and 7 bicycle rails/racks.

VARGA TRAFFIC PLANNING PTY LTD
38
Whilst the number of parking spaces to be provided as part of the planning proposal is not yet
known, it is clear that the above parking requirements can be satisfied within the proposed of
basement parking area on the subject site.
Loading/Servicing Provisions
The proposed new mixed use building is expected to be serviced by a variety of commercial
vehicles up to and including 8.8m long MRV medium rigid trucks. A dedicated service area
is to be provided on the ground floor level adjacent to the vehicular access driveway which
includes a large turntable.
The manoeuvring area has been designed to accommodate the swept turning path
requirements of these 8.8m long rigid trucks, allowing them to enter and exit the site whilst
travelling in a forward direction at all times, as per the attached swept turning path diagrams.
The geometric design layout of the proposed loading facilities will also ultimately be
designed to comply with the relevant requirements specified in the Standards Australia
publication Parking Facilities Part 2 - Off-Street Commercial Vehicle Facilities AS2890.2 in
respect of loading dock dimensions and service area requirements for MRV trucks.
Conclusion
Based on the analysis and discussions presented within this report, the following conclusions
are made:
• the planning proposal seeks approval to increase the allowable FSR and height controls
for the site, resulting in the potential for approximately 81 apartments and
approximately 705m2 of retail/commercial floor space
• the SIDRA capacity analysis of the Pacific Highway and Gordon Avenue intersection
indicates that:

VARGA TRAFFIC PLANNING PTY LTD
39
- the projected additional traffic flows as a consequence of the planning proposal
will not have any adverse effects on the operational performance of the
intersection, and
- no road improvements or intersection upgrades would be required as a
consequence of the planning proposal
• retail/commercial and visitor peak parking demand periods generally occur at different
times – i.e. retail/commercial parking is typically busiest during the day whilst visitor
parking is typically busiest during the evenings. The potential therefore exists for the
retail/commercial customers and residential visitors to utilise the same non-residential
parking area
• the future car, motorcycle, bicycle and loading facilities will ultimately be provided and
designed in accordance with Council’s requirements, SEPP 65 and the relevant
Australian Standards
• the future vehicular access arrangements will be designed in accordance with Council
and RMS requirements.
It is therefore reasonable to conclude that the planning proposal will not have any
unacceptable implications in terms of road network capacity or off-street parking/loading
requirements.

1:4 1:20
GARBAGEROOM
LOADING DOCK
SERVICES
SERVICES
RETAIL
RETAIL
3000
RE
SID
EN
TIA
LL
OB
BY
SERV-ICES
LANDSCAPE
CO
MM
-E
RC
IAL
LO
BB
Y
1:8
RETAIL
Phone +61 2 9904 3224PO Box 1868
Neutral Bay, NSW 2089www.vargatraffic.com.au
Sydney, Australia
VARGA TRAFFIC PLANNING Pty LtdABN 88 071 762 537Suite 6, Level 120 Young StreetNeutral Bay, NSW 2089

VARGA TRAFFIC PLANNING PTY LTD
APPENDIX A
TRAFFIC SURVEY DATA

R.O.A.R. DATA
Reliable, Original & Authentic Results PEDS PEDS
Ph.88196847, Mob.0418-239019 Time Per TOT Peak Per TOT
0630 - 0645 0 0630 - 0730 4
0645 - 0700 1 0645 - 0745 6
: Varga Traffic Planning 0700 - 0715 1 0700 - 0800 7
: 6478 CHATSWOOD Gordon Ave 0715 - 0730 2 0715 - 0815 11
: Thursday 8th June 2017 0730 - 0745 2 0730 - 0830 9
0745 - 0800 2 0745 - 0845 10
0800 - 0815 5 0800 - 0900 8
0815 - 0830 0 0815 - 0915 11
0830 - 0845 3 0830 - 0930 16
0845 - 0900 0
0900 - 0915 8 PEAK HR 4 0915 - 0930 5
Per End 29
Lights Heavies
Time Per T L R L R T TOT Time Per T L R L R T TOT Time Per T L R L R T TOT
0630 - 0645 428 1 1 430 0630 - 0645 6 1 1 8 0630 - 0645 434 2 0 2 0 0 438
0645 - 0700 419 1 1 421 0645 - 0700 5 0 0 5 0645 - 0700 424 1 0 1 0 0 426
0700 - 0715 482 1 1 484 0700 - 0715 10 0 0 10 0700 - 0715 492 1 0 1 0 0 494
0715 - 0730 399 2 1 402 0715 - 0730 0 0 0 0 0715 - 0730 399 2 0 1 0 0 402
0730 - 0745 338 3 4 345 0730 - 0745 9 0 0 9 0730 - 0745 347 3 0 4 0 0 354
0745 - 0800 454 2 3 459 0745 - 0800 11 1 0 12 0745 - 0800 465 3 0 3 0 0 471
0800 - 0815 338 4 3 345 0800 - 0815 8 0 1 9 0800 - 0815 346 4 0 4 0 0 354
0815 - 0830 332 2 4 338 0815 - 0830 9 0 0 9 0815 - 0830 341 2 0 4 0 0 347
0830 - 0845 437 3 3 443 0830 - 0845 9 0 0 9 0830 - 0845 446 3 0 3 0 0 452
0845 - 0900 446 2 7 455 0845 - 0900 10 1 0 11 0845 - 0900 456 3 0 7 0 0 466
0900 - 0915 357 5 4 366 0900 - 0915 16 0 0 16 0900 - 0915 373 5 0 4 0 0 382
0915 - 0930 419 7 4 430 0915 - 0930 9 0 0 9 0915 - 0930 428 7 0 4 0 0 439
Per End 4849 33 0 36 0 0 4918 Per End 102 3 0 2 0 0 107 Per End 4951 36 0 38 0 0 5025
Lights Heavies
Peak Per T L R L R T TOT Peak Per T L R L R T TOT Peak Per T L R L R T TOT
0630 - 0730 1728 5 0 4 0 0 1737 0630 - 0730 21 1 0 1 0 0 23 0630 - 0730 1749 6 0 5 0 0 1760
0645 - 0745 1638 7 0 7 0 0 1652 0645 - 0745 24 0 0 0 0 0 24 0645 - 0745 1662 7 0 7 0 0 1676
0700 - 0800 1673 8 0 9 0 0 1690 0700 - 0800 30 1 0 0 0 0 31 0700 - 0800 1703 9 0 9 0 0 1721
0715 - 0815 1529 11 0 11 0 0 1551 0715 - 0815 28 1 0 1 0 0 30 0715 - 0815 1557 12 0 12 0 0 1581
0730 - 0830 1462 11 0 14 0 0 1487 0730 - 0830 37 1 0 1 0 0 39 0730 - 0830 1499 12 0 15 0 0 1526
0745 - 0845 1561 11 0 13 0 0 1585 0745 - 0845 37 1 0 1 0 0 39 0745 - 0845 1598 12 0 14 0 0 1624
0800 - 0900 1553 11 0 17 0 0 1581 0800 - 0900 36 1 0 1 0 0 38 0800 - 0900 1589 12 0 18 0 0 1619
0815 - 0915 1572 12 0 18 0 0 1602 0815 - 0915 44 1 0 0 0 0 45 0815 - 0915 1616 13 0 18 0 0 1647
0830 - 0930 1659 17 0 18 0 0 1694 0830 - 0930 44 1 0 0 0 0 45 0830 - 0930 1703 18 0 18 0 0 1739
PEAK HR 1728 5 0 4 0 0 1737 PEAK HR 21 1 0 1 0 0 23 PEAK HR 1749 6 0 5 0 0 1760
Client
Job No/Name
Day/Date0 2 0 0
Gordon Ave Pacific Hwy
NORTH EAST SOUTH NORTH EAST SOUTH
4 0
Pacific Hwy Gordon Ave
0 0 0 0
Pacific Hwy Pacific Hwy
0 1 0 0
11 0
0 1 0 0
6 0
7 0
9 0
0 2
0 2 0 0
0 0
11 0
0 5 0
10 0
0 8 0
16 0
0 0
0 3 0 0
0 0
0 0 0
0 8 0 0 4 00 5 0
0 29 0
NORTH EAST SOUTH NORTH EAST SOUTH
Pacific Hwy Gordon Ave Pacific Hwy Pacific Hwy Gordon Ave Pacific Hwy
SOUTH Combined
Combined NORTH EAST SOUTH
Pacific Hwy Pacific Hwy
Pacific Hwy Gordon Ave Pacific Hwy
NORTH EAST SOUTH NORTH EAST
Gordon Ave Pacific Hwy
NORTH EAST SOUTH
Pacific Hwy Gordon Ave Pacific Hwy Pacific Hwy Gordon Ave

R.O.A.R. DATA : Varga Traffic Planning
Reliable, Original & Authentic Results : 6478 CHATSWOOD Gordon Ave
Ph.88196847, Mob.0418-239019 : Thursday 8th June 2017
N
22 105
0 1733 0
0 21 1 1755 4882
0 1728 5 0
1749 6 4987
0
1 5 6
0 0 0 3 33 36
5 4 1 38 36 2
5 4 1 0
104
0 0 0
0 0 0 22 4885
0 0 0 1732 Copyright ROAR DATA 0
0 1754 4989
Client
Job No/Name
Day/Date
Gordon Ave
Gordon Ave
0630 - 0730
Pacific Hwy Pacific Hwy
AM PEAK TOTAL VOLUMES
FOR COUNT
PERIOD
Pacific Hwy Pacific Hwy
4
7
1 2
5
8
3
6
9

R.O.A.R. DATA
Reliable, Original & Authentic Results PEDS PEDS
Ph.88196847, Mob.0418-239019 Time Per TOT Peak Per TOT
1530 - 1545 7 1530 - 1630 13
1545 - 1600 2 1545 - 1645 12
: Varga Traffic Planning 1600 - 1615 2 1600 - 1700 13
: 6478 CHATSWOOD Gordon Ave 1615 - 1630 2 1615 - 1715 16
: Thursday 8th June 2017 1630 - 1645 6 1630 - 1730 21
1645 - 1700 3 1645 - 1745 23
1700 - 1715 5 1700 - 1800 23
1715 - 1730 7 1715 - 1815 23
1730 - 1745 8 1730 - 1830 18
1745 - 1800 3
1800 - 1815 5 PEAK HR 16 1815 - 1830 2
Per End 52
Lights Heavies
Time Per T L R L R T TOT Time Per T L R L R T TOT Time Per T L R L R T TOT
1530 - 1545 325 7 5 337 1530 - 1545 12 0 0 12 1530 - 1545 337 7 0 5 0 0 349
1545 - 1600 365 5 3 373 1545 - 1600 5 0 0 5 1545 - 1600 370 5 0 3 0 0 378
1600 - 1615 356 5 5 366 1600 - 1615 18 0 0 18 1600 - 1615 374 5 0 5 0 0 384
1615 - 1630 397 2 2 401 1615 - 1630 14 0 0 14 1615 - 1630 411 2 0 2 0 0 415
1630 - 1645 437 2 1 440 1630 - 1645 14 0 0 14 1630 - 1645 451 2 0 1 0 0 454
1645 - 1700 385 5 4 394 1645 - 1700 11 0 0 11 1645 - 1700 396 5 0 4 0 0 405
1700 - 1715 427 2 5 434 1700 - 1715 10 0 0 10 1700 - 1715 437 2 0 5 0 0 444
1715 - 1730 359 3 3 365 1715 - 1730 7 0 0 7 1715 - 1730 366 3 0 3 0 0 372
1730 - 1745 397 5 1 403 1730 - 1745 11 0 0 11 1730 - 1745 408 5 0 1 0 0 414
1745 - 1800 374 2 2 378 1745 - 1800 10 0 0 10 1745 - 1800 384 2 0 2 0 0 388
1800 - 1815 347 2 3 352 1800 - 1815 14 0 0 14 1800 - 1815 361 2 0 3 0 0 366
1815 - 1830 365 4 1 370 1815 - 1830 8 0 0 8 1815 - 1830 373 4 0 1 0 0 378
Per End 4534 44 0 35 0 0 4613 Per End 134 0 0 0 0 0 134 Per End 4668 44 0 35 0 0 4747
Lights Heavies
Peak Per T L R L R T TOT Peak Per T L R L R T TOT Peak Per T L R L R T TOT
1530 - 1630 1443 19 0 15 0 0 1477 1530 - 1630 49 0 0 0 0 0 49 1530 - 1630 1492 19 0 15 0 0 1526
1545 - 1645 1555 14 0 11 0 0 1580 1545 - 1645 51 0 0 0 0 0 51 1545 - 1645 1606 14 0 11 0 0 1631
1600 - 1700 1575 14 0 12 0 0 1601 1600 - 1700 57 0 0 0 0 0 57 1600 - 1700 1632 14 0 12 0 0 1658
1615 - 1715 1646 11 0 12 0 0 1669 1615 - 1715 49 0 0 0 0 0 49 1615 - 1715 1695 11 0 12 0 0 1718
1630 - 1730 1608 12 0 13 0 0 1633 1630 - 1730 42 0 0 0 0 0 42 1630 - 1730 1650 12 0 13 0 0 1675
1645 - 1745 1568 15 0 13 0 0 1596 1645 - 1745 39 0 0 0 0 0 39 1645 - 1745 1607 15 0 13 0 0 1635
1700 - 1800 1557 12 0 11 0 0 1580 1700 - 1800 38 0 0 0 0 0 38 1700 - 1800 1595 12 0 11 0 0 1618
1715 - 1815 1477 12 0 9 0 0 1498 1715 - 1815 42 0 0 0 0 0 42 1715 - 1815 1519 12 0 9 0 0 1540
1730 - 1830 1483 13 0 7 0 0 1503 1730 - 1830 43 0 0 0 0 0 43 1730 - 1830 1526 13 0 7 0 0 1546
PEAK HR 1646 11 0 12 0 0 1669 PEAK HR 49 0 0 0 0 0 49 PEAK HR 1695 11 0 12 0 0 1718
EAST SOUTH
Pacific Gordon Pacific
SOUTH NORTHNORTH
Gordon Pacific
EAST
0 7 0 0
0 0 12
Pacific
13 0
0
Client 0 2 0 0 13 0
0 2
Job No/Name 0 2 0 0 16 0
Day/Date 0 6 0 0 21 0
0 3 0 0
23 0
0 5 0 0
23 0
23 0
18 0
0 7
0 8 0 0
0 0
0 3 0
0 5 0 0 16 00 2 0
0 52 0
NORTH EAST SOUTH NORTH EAST SOUTH Combined NORTH EAST SOUTH
Pacific Gordon Pacific Pacific Gordon Pacific Pacific Gordon Pacific
NORTH EAST SOUTH NORTH EAST SOUTH Combined NORTH EAST SOUTH
Pacific Gordon Pacific Pacific Gordon Pacific Pacific Gordon Pacific

R.O.A.R. DATA : Varga Traffic Planning
Reliable, Original & Authentic Results : 6478 CHATSWOOD Gordon Ave
Ph.88196847, Mob.0418-239019 : Thursday 8th June 2017
N
49 134
0 1657 0
0 49 0 1706 4578
0 1646 11 0
1695 11 4712
0
0 11 11
0 0 0 0 44 44
12 12 0 35 35 0
12 12 0 0
134
0 0 0
0 0 0 49 4569
0 0 0 1658 Copyright ROAR DATA 0
0 1707 4703
Client
Job No/Name
Day/Date
PM PEAK TOTAL VOLUMES
1615 - 1715 FOR COUNT
PERIOD
Pacific Hwy Pacific Hwy
Gordon Ave
Gordon Ave
Pacific Hwy Pacific Hwy
4
7
1 2
5
8
3
6
9

R.O.A.R. DATA : Varga Traffic Planning
Reliable, Original & Authentic Results : 6478 CHATSWOOD Gordon Ave
Ph.88196847, Mob.0418-239019 : Thursday 8th June 2017
N
Intersection Details
Obtained via satellite
May be incorrect
T L
1749 6 AM
1695 11 PM
0 0
PM AM
L 12 5
0 0
0 0
Weather >>>
Client
Job No/Name
Day/Date
Pacific Hwy
AM PEAK HOUR
0630 - 0730
Combined figures only
Gordon Ave
PM PEAK HOUR
1615 - 1715
Pacific Hwy

R.O.A.R. DATA : Varga Traffic Planning
Reliable, Original & Authentic Results : 6478 CHATSWOOD Gordon AvePh.88196847, Mob.0418-239019 : Thursday 8th June 2017
Lights Lights
Time Per L T R L T R L T R L T R TOT Peak Time L T R L T R L T R L T R TOT
0630 - 0645 0 0 0 0 1 0 0 0 0 0 1 0 2 0630 - 0730 0 0 1 1 1 2 1 0 1 1 1 0 9
0645 - 0700 0 0 1 0 0 0 0 0 0 0 0 0 1 0645 - 0745 0 0 1 1 1 4 4 0 1 1 1 0 14
0700 - 0715 0 0 0 1 0 0 0 0 0 0 0 0 1 0700 - 0800 0 0 0 1 2 4 7 0 1 1 1 0 17
0715 - 0730 0 0 0 0 0 2 1 0 1 1 0 0 5 0715 - 0815 0 0 0 3 2 5 10 0 1 1 1 0 23
0730 - 0745 0 0 0 0 1 2 3 0 0 0 1 0 7 0730 - 0830 0 0 0 3 3 3 10 0 1 1 1 0 22
0745 - 0800 0 0 0 0 1 0 3 0 0 0 0 0 4 0745 - 0845 0 0 0 3 2 1 8 0 1 1 2 0 18
0800 - 0815 0 0 0 3 0 1 3 0 0 0 0 0 7 0800 - 0900 0 0 0 3 1 1 8 0 1 1 3 0 18
0815 - 0830 0 0 0 0 1 0 1 0 1 1 0 0 4 0815 - 0915 0 0 0 1 1 2 6 0 1 1 3 0 15
0830 - 0845 0 0 0 0 0 0 1 0 0 0 2 0 3 0830 - 0930 0 0 0 3 2 3 6 0 0 1 6 0 21
0845 - 0900 0 0 0 0 0 0 3 0 0 0 1 0 4
0900 - 0915 0 0 0 1 0 2 1 0 0 0 0 0 4 PEAK HOUR 0 0 0 3 2 5 10 0 1 1 1 0 23
0915 - 0930 0 0 0 2 2 1 1 0 0 1 3 0 10
Period End 0 0 1 7 6 8 17 0 2 3 8 0 52
Heavies Heavies
Time Per L T R L T R L T R L T R TOT Peak Per L T R L T R L T R L T R TOT
0630 - 0645 0 0 0 0 1 0 0 0 0 0 1 0 2 0630 - 0730 0 0 0 0 1 0 0 0 0 0 1 0 2
0645 - 0700 0 0 0 0 0 0 0 0 0 0 0 0 0 0645 - 0745 0 0 0 0 0 0 0 0 0 0 0 0 0
0700 - 0715 0 0 0 0 0 0 0 0 0 0 0 0 0 0700 - 0800 0 0 0 0 1 0 0 0 0 0 0 0 1
0715 - 0730 0 0 0 0 0 0 0 0 0 0 0 0 0 0715 - 0815 0 0 0 0 1 0 0 0 0 0 1 0 2
0730 - 0745 0 0 0 0 0 0 0 0 0 0 0 0 0 0730 - 0830 0 0 0 0 1 0 0 0 0 0 1 0 2
0745 - 0800 0 0 0 0 1 0 0 0 0 0 0 0 1 0745 - 0845 0 0 0 0 1 0 0 0 0 0 1 0 2
0800 - 0815 0 0 0 0 0 0 0 0 0 0 1 0 1 0800 - 0900 0 0 0 0 1 0 0 0 0 0 1 0 2
0815 - 0830 0 0 0 0 0 0 0 0 0 0 0 0 0 0815 - 0915 0 0 0 0 1 0 0 0 0 0 0 0 1
0830 - 0845 0 0 0 0 0 0 0 0 0 0 0 0 0 0830 - 0930 0 0 0 0 1 0 0 0 0 0 0 0 1
0845 - 0900 0 0 0 0 1 0 0 0 0 0 0 0 1
0900 - 0915 0 0 0 0 0 0 0 0 0 0 0 0 0 PEAK HOUR 0 0 0 0 1 0 0 0 0 0 1 0 2
0915 - 0930 0 0 0 0 0 0 0 0 0 0 0 0 0
Period End 0 0 0 0 3 0 0 0 0 0 2 0 5
Combined Combined
Time Per L T R L T R L T R L T R TOT Peak Per L T R L T R L T R L T R TOT
0630 - 0645 0 0 0 0 2 0 0 0 0 0 2 0 4 0630 - 0730 0 0 1 1 2 2 1 0 1 1 2 0 11
0645 - 0700 0 0 1 0 0 0 0 0 0 0 0 0 1 0645 - 0745 0 0 1 1 1 4 4 0 1 1 1 0 14
0700 - 0715 0 0 0 1 0 0 0 0 0 0 0 0 1 0700 - 0800 0 0 0 1 3 4 7 0 1 1 1 0 18
0715 - 0730 0 0 0 0 0 2 1 0 1 1 0 0 5 0715 - 0815 0 0 0 3 3 5 10 0 1 1 2 0 25
0730 - 0745 0 0 0 0 1 2 3 0 0 0 1 0 7 0730 - 0830 0 0 0 3 4 3 10 0 1 1 2 0 24
0745 - 0800 0 0 0 0 2 0 3 0 0 0 0 0 5 0745 - 0845 0 0 0 3 3 1 8 0 1 1 3 0 20
0800 - 0815 0 0 0 3 0 1 3 0 0 0 1 0 8 0800 - 0900 0 0 0 3 2 1 8 0 1 1 4 0 20
0815 - 0830 0 0 0 0 1 0 1 0 1 1 0 0 4 0815 - 0915 0 0 0 1 2 2 6 0 1 1 3 0 16
0830 - 0845 0 0 0 0 0 0 1 0 0 0 2 0 3 0830 - 0930 0 0 0 3 3 3 6 0 0 1 6 0 22
0845 - 0900 0 0 0 0 1 0 3 0 0 0 1 0 5
0900 - 0915 0 0 0 1 0 2 1 0 0 0 0 0 4 PEAK HOUR 0 0 0 3 3 5 10 0 1 1 2 0 25
0915 - 0930 0 0 0 2 2 1 1 0 0 1 3 0 10
Period End 0 0 1 7 9 8 17 0 2 3 10 0 57
Gordon AveHammond Lane Gordon Ave Hammond Lane Gordon Ave
EAST
Hammond Lane Gordon Ave Hammond Lane
NORTH WEST SOUTH EAST
WEST SOUTHWEST SOUTH EAST
WEST SOUTH
EAST
Hammond Lane Gordon Ave Hammond Lane Gordon AveHammond Lane Gordon Ave Hammond Lane Gordon Ave
NORTH
WEST SOUTH EAST
Hammond Lane Gordon Ave Hammond Lane Gordon Ave
NORTH WEST SOUTH EAST
Hammond Lane Gordon Ave Hammond Lane Gordon Ave
NORTH
ClientJob No/Name
Day/Date
NORTH
NORTH

R.O.A.R DATA
Reliable, Original & Authentic Results
Ph.88196847, Mob.0418-239019
: Varga Traffic Planning: 6478 CHATSWOOD Gordon Ave 3
: Thursday 8th June 2017 3 0 0 0 0 0 0 0 0 0
0 0 0 0
1 10 11 1 3 4
0 3 3 0 0 0
Peds 1 2 3 2 1 1
Time Per TOT 0 5 5 1 1 0
0630 - 0645 4 12 11 1 3 2 1
0645 - 0700 1
0700 - 0715 2
0715 - 0730 7 10 0 1
0730 - 0745 9 11 10 0 1 0
0745 - 0800 4 11 0 0 0 6
0800 - 0815 6 0 6 N0815 - 0830 4
0830 - 0845 60845 - 0900 0
0900 - 0915 10915 - 0930 1
Period End 45
0
Peds 7 1 7 1
Peak Per TOT 0
0630 - 0730 14
0645 - 0745 19
0700 - 0800 22 3 21 24 3 8 11
0715 - 0815 26
0730 - 0830 23
0745 - 0845 20 28 26 2 13 11 2
0800 - 0900 16
0815 - 0915 110830 - 0930 8 19 0
19 11
PEAK HR 26 0 11 Copyright ROAR DATA0 5 11 10
0 4 0 4
7
0 1 0 0
0 3 10 6
0
2 4
6
0 6 5 9
0 6 3
2 5 7
UNCLASSIFIED UNCLASSIFIED UNCLASSIFIED UNCLASSIFIED
Hammond Lane Gordon Ave Hammond Lane Gordon Ave
NORTH WEST SOUTH EAST
0 13 15 17
0 1 0 0
0 0 0 0
0 2 0 4
0 2 2 0
0 2 1 3
0 0 2 2
5 1
0 2 0 2
0 0 1 0
UNCLASSIFIED UNCLASSIFIED UNCLASSIFIED UNCLASSIFIED
Hammond Lane Gordon Ave Hammond Lane Gordon Ave
Gordon Ave Gordon Ave
0 3 11 8
Hammond Lane
0 5 11 10
0 7 10
0 5
Hammond Lane
TOTALVOLUMES Hammond Lane
0 0 3 4
0 3
0 0 1 1
Gordon Ave
AM PEAK
NORTH WEST SOUTH EAST
Job No/Name
Day/Date
Hammond Lane
0715 - 0815
Client
PERIOD
FOR COUNT
Gordon Ave
1 2 3

R.O.A.R. DATA : Varga Traffic Planning
Reliable, Original & Authentic Results : 6478 CHATSWOOD Gordon AvePh.88196847, Mob.0418-239019 : Thursday 8th June 2017
Lights Lights
Time Per L T R L T R L T R L T R TOT Peak Time L T R L T R L T R L T R TOT
1530 - 1545 0 0 0 1 1 0 2 0 0 0 0 0 4 1530 - 1630 0 0 0 5 4 2 3 0 0 0 5 0 19
1545 - 1600 0 0 0 1 2 2 0 0 0 0 2 0 7 1545 - 1645 0 0 0 5 3 2 1 0 0 0 5 0 16
1600 - 1615 0 0 0 2 1 0 1 0 0 0 2 0 6 1600 - 1700 0 0 1 4 1 1 1 0 1 0 3 1 13
1615 - 1630 0 0 0 1 0 0 0 0 0 0 1 0 2 1615 - 1715 0 0 1 2 1 1 1 0 1 0 2 1 10
1630 - 1645 0 0 0 1 0 0 0 0 0 0 0 0 1 1630 - 1730 0 0 1 2 1 1 2 0 2 0 1 1 11
1645 - 1700 0 0 1 0 0 1 0 0 1 0 0 1 4 1645 - 1745 0 1 1 2 1 4 3 0 2 1 1 1 17
1700 - 1715 0 0 0 0 1 0 1 0 0 0 1 0 3 1700 - 1800 0 1 0 3 1 4 3 0 1 1 1 0 15
1715 - 1730 0 0 0 1 0 0 1 0 1 0 0 0 3 1715 - 1815 0 1 0 4 1 4 4 0 1 1 1 0 17
1730 - 1745 0 1 0 1 0 3 1 0 0 1 0 0 7 1730 - 1830 0 1 0 3 3 5 3 0 0 1 2 0 18
1745 - 1800 0 0 0 1 0 1 0 0 0 0 0 0 2
1800 - 1815 0 0 0 1 1 0 2 0 0 0 1 0 5 PEAK HOUR 0 0 0 5 4 2 3 0 0 0 5 0 19
1815 - 1830 0 0 0 0 2 1 0 0 0 0 1 0 4
Period End 0 1 1 10 8 8 8 0 2 1 8 1 48
Heavies Heavies
Time Per L T R L T R L T R L T R TOT Peak Per L T R L T R L T R L T R TOT
1530 - 1545 0 0 0 0 0 0 0 0 0 0 0 0 0 1530 - 1630 0 0 0 0 0 0 0 0 0 0 0 0 0
1545 - 1600 0 0 0 0 0 0 0 0 0 0 0 0 0 1545 - 1645 0 0 0 0 0 0 0 0 0 0 0 0 0
1600 - 1615 0 0 0 0 0 0 0 0 0 0 0 0 0 1600 - 1700 0 0 0 0 0 0 0 0 0 0 0 0 0
1615 - 1630 0 0 0 0 0 0 0 0 0 0 0 0 0 1615 - 1715 0 0 0 0 0 0 0 0 0 0 0 0 0
1630 - 1645 0 0 0 0 0 0 0 0 0 0 0 0 0 1630 - 1730 0 0 0 0 0 0 0 0 0 0 0 0 0
1645 - 1700 0 0 0 0 0 0 0 0 0 0 0 0 0 1645 - 1745 0 0 0 0 0 0 0 0 0 0 0 0 0
1700 - 1715 0 0 0 0 0 0 0 0 0 0 0 0 0 1700 - 1800 0 0 0 0 0 0 0 0 0 0 0 0 0
1715 - 1730 0 0 0 0 0 0 0 0 0 0 0 0 0 1715 - 1815 0 0 0 0 0 0 0 0 0 0 0 0 0
1730 - 1745 0 0 0 0 0 0 0 0 0 0 0 0 0 1730 - 1830 0 0 0 0 0 0 0 0 0 0 0 0 0
1745 - 1800 0 0 0 0 0 0 0 0 0 0 0 0 0
1800 - 1815 0 0 0 0 0 0 0 0 0 0 0 0 0 PEAK HOUR 0 0 0 0 0 0 0 0 0 0 0 0 0
1815 - 1830 0 0 0 0 0 0 0 0 0 0 0 0 0
Period End 0 0 0 0 0 0 0 0 0 0 0 0 0
Combined Combined
Time Per L T R L T R L T R L T R TOT Peak Per L T R L T R L T R L T R TOT
1530 - 1545 0 0 0 1 1 0 2 0 0 0 0 0 4 1530 - 1630 0 0 0 5 4 2 3 0 0 0 5 0 19
1545 - 1600 0 0 0 1 2 2 0 0 0 0 2 0 7 1545 - 1645 0 0 0 5 3 2 1 0 0 0 5 0 16
1600 - 1615 0 0 0 2 1 0 1 0 0 0 2 0 6 1600 - 1700 0 0 1 4 1 1 1 0 1 0 3 1 13
1615 - 1630 0 0 0 1 0 0 0 0 0 0 1 0 2 1615 - 1715 0 0 1 2 1 1 1 0 1 0 2 1 10
1630 - 1645 0 0 0 1 0 0 0 0 0 0 0 0 1 1630 - 1730 0 0 1 2 1 1 2 0 2 0 1 1 11
1645 - 1700 0 0 1 0 0 1 0 0 1 0 0 1 4 1645 - 1745 0 1 1 2 1 4 3 0 2 1 1 1 17
1700 - 1715 0 0 0 0 1 0 1 0 0 0 1 0 3 1700 - 1800 0 1 0 3 1 4 3 0 1 1 1 0 15
1715 - 1730 0 0 0 1 0 0 1 0 1 0 0 0 3 1715 - 1815 0 1 0 4 1 4 4 0 1 1 1 0 17
1730 - 1745 0 1 0 1 0 3 1 0 0 1 0 0 7 1730 - 1830 0 1 0 3 3 5 3 0 0 1 2 0 18
1745 - 1800 0 0 0 1 0 1 0 0 0 0 0 0 2
1800 - 1815 0 0 0 1 1 0 2 0 0 0 1 0 5 PEAK HOUR 0 0 0 5 4 2 3 0 0 0 5 0 19
1815 - 1830 0 0 0 0 2 1 0 0 0 0 1 0 4
Period End 0 1 1 10 8 8 8 0 2 1 8 1 48
Hammond Lane Gordon Ave Hammond Lane Gordon AveHammond Lane Gordon Ave Hammond Lane Gordon Ave
NORTH WEST SOUTH EASTNORTH WEST SOUTH EAST
Hammond Lane Gordon Ave Hammond Lane Gordon AveHammond Lane Gordon Ave Hammond Lane Gordon Ave
Gordon Ave
NORTH WEST SOUTH EAST NORTH WEST SOUTH EAST
WEST SOUTH EAST
Hammond LaneHammond Lane Gordon Ave Hammond Lane Gordon Ave Hammond Lane Gordon Ave
ClientJob No/Name
Day/Date
NORTH WEST SOUTH EAST NORTH

R.O.A.R DATA
Reliable, Original & Authentic Results
Ph.88196847, Mob.0418-239019
: Varga Traffic Planning: 6478 CHATSWOOD Gordon Ave 5
: Thursday 8th June 2017 5 0 0 0 0 0 0 0 0 0
0 0 0 0
0 11 11 0 4 4
0 5 5 0 0 0
Peds 0 4 4 5 5 0
Time Per TOT 0 2 2 0 0 0
1530 - 1545 3 8 8 0 5 5 0
1545 - 1600 11
1600 - 1615 2
1615 - 1630 0 3 0 0
1630 - 1645 10 3 3 0 0 0
1645 - 1700 9 3 0 0 0 2
1700 - 1715 1 0 2 N1715 - 1730 0
1730 - 1745 2
1745 - 1800 2
1800 - 1815 4
1815 - 1830 7
Period End 51
0
Peds 11 2 11 2
Peak Per TOT 0
1530 - 1630 16
1545 - 1645 23
1600 - 1700 21 0 26 26 0 10 10
1615 - 1715 20
1630 - 1730 20
1645 - 1745 12 17 17 0 10 10 0
1700 - 1800 5
1715 - 1815 8
1730 - 1830 15 10 0
10 10
PEAK HR 16 0 10 Copyright ROAR DATA
Hammond Lane
1 9 2 4
2 6 6 1
1 3 4 0
1 1 2 1
Gordon Ave Gordon Ave
2 3 5 2
1 3 9 7
1 3 9 7
1 4 9 7
1 8 6 8
1 9 2 4
UNCLASSIFIED UNCLASSIFIED UNCLASSIFIED UNCLASSIFIED
Hammond Lane Gordon Ave Hammond Lane Gordon Ave
PERIOD
NORTH WEST SOUTH EAST
VOLUMES Hammond Lane
4 18 17 12 FOR COUNT1 3 2 1
Hammond Lane
0 2 2 0 TOTAL
0 0 2 0
1 1 0 0
0 0 0 0
0 0 0 1
1 2 5 1
0 1 4 5
0 0 0 0
Gordon Ave
0 1 0 1
1 6 2 2
0 2 0 1
UNCLASSIFIED UNCLASSIFIED UNCLASSIFIED UNCLASSIFIED
Hammond Lane Gordon Ave Hammond Lane Gordon Ave
1530 - 1630
Gordon Ave
NORTH WEST SOUTH EAST
Hammond Lane
ClientJob No/Name
Day/Date PM PEAK
1 2 3

R.O.A.R. DATA : Varga Traffic Planning
Reliable, Original & Authentic Results : 6478 CHATSWOOD Gordon Ave
Ph.88196847, Mob.0418-239019 : Thursday 8th June 2017
N
Intersection Details
Obtained via satellite
May be incorrect
No signage or line markings
R T L
0 0 0 AM
AM PM 0 0 0 PM
3 5 L
3 4 T
5 2 R
R 0 0
T 5 2
L 0 1
PM 3 0 0 PM AM
AM 10 0 1
L T R
Weather >>>
Client
Job No/Name
Day/Date
Hammond Lane
PM PEAK HOUR
1530 - 1630
Hammond Lane
AM PEAK HOUR
0715 - 0815
Gordon Ave
Gordon Ave
Combined figures only