601 Vancouver, BC V6C 3E1 - Fort Capital Partners BC V6C 3E1 March 23, 2015 ... v) the Fund’s and...
28
Fort Capital Corporation 601 – 999 Canada Place Vancouver, BC V6C 3E1 March 23, 2015 The Special Committee of the Board of Trustees Boston Pizza Royalties Income Fund 100 - 10760 Shellbridge Way Richmond, British Columbia V6X 3H1 To the Special Committee: Fort Capital Corporation (“Fort Capital”, and where used “we” or “us”) understands that Boston Pizza Royalties Income Fund (the “Fund” or “BPF”) intends to complete a transaction with Boston Pizza International Inc. (“BPI”), the effect of which will be that the Fund will be entitled to priority payments from BPI equal to 1.5% of Franchise Revenues (the “1.5% Revenue Share”). Franchise Revenues, as defined later herein, is the same measure against which the current 4.0% royalty payable by BPI to the Fund is determined. BPI and the Fund will form a limited partnership (Boston Pizza Canada Limited Partnership, or “BP Canada LP”), which will acquire franchise agreements, supplier contracts and other assets (the “Acquisition”) from BPI for consideration consisting of general partnership units in BP Canada LP (the “BP Canada GP Units”). The Fund will use cash to purchase limited partnership units in BP Canada LP (the “Investment”) and the proceeds received by BP Canada LP from the Investment will be distributed to BPI as a return of capital on BP Canada GP Units. The Fund will also provide BPI with the ability to exchange the BP Canada GP Units for units of the Fund (“ Units”) under certain circumstances in the future (the “Exchange Rights”). Together, the Acquisition, the Investment and the provision of Exchange Rights represent the “Transaction”. We also understand that BPI and related parties own securities currently exchangeable into 2,228,970, or approximately 12.6%, of the Units on a fully diluted basis, and that the balance of the Units are held by, collectively, unitholders other than BPI, any related party of BPI (within the meaning of Multilateral Instrument 61-101 – Protection of Minority Security Holders in Special Transactions (“MI 61-101”), and subject to the exceptions set out therein), any interested party to the Transaction (within the meaning of MI 61-101) or any person that is a joint actor with any of the foregoing (for the purposes of MI 61-101) (the “Public Unitholders”). We further understand that, after giving effect to the Transaction, BPI’s indirect ownership interest in the Fund will increase by 752,387 Units, and that, after giving effect to the issuance of Units that would be issued by the Fund to partially fund the Transaction, BPI would hold securities exchangeable into 12.7% of the Units on a fully diluted basis. A special committee comprised of the independent trustees of the Fund (the “Special Committee”) has been formed to, among other matters, review the Transaction and provide a recommendation with respect to the Transaction to unitholders of the Fund.
-
Upload
truongdieu -
Category
Documents
-
view
215 -
download
1
Transcript of 601 Vancouver, BC V6C 3E1 - Fort Capital Partners BC V6C 3E1 March 23, 2015 ... v) the Fund’s and...

Fort Capital Corporation
601 – 999 Canada Place Vancouver, BC V6C 3E1
March 23, 2015
The Special Committee of the Board of Trustees Boston Pizza Royalties Income Fund 100 - 10760 Shellbridge Way Richmond, British Columbia V6X 3H1
To the Special Committee:
Fort Capital Corporation (“Fort Capital”, and where used “we” or “us”) understands that Boston Pizza Royalties
Income Fund (the “Fund” or “BPF”) intends to complete a transaction with Boston Pizza International Inc. (“BPI”),
the effect of which will be that the Fund will be entitled to priority payments from BPI equal to 1.5% of Franchise
Revenues (the “1.5% Revenue Share”). Franchise Revenues, as defined later herein, is the same measure against
which the current 4.0% royalty payable by BPI to the Fund is determined.
BPI and the Fund will form a limited partnership (Boston Pizza Canada Limited Partnership, or “BP Canada LP”),
which will acquire franchise agreements, supplier contracts and other assets (the “Acquisition”) from BPI for
consideration consisting of general partnership units in BP Canada LP (the “BP Canada GP Units”). The Fund will
use cash to purchase limited partnership units in BP Canada LP (the “Investment”) and the proceeds received by
BP Canada LP from the Investment will be distributed to BPI as a return of capital on BP Canada GP Units. The
Fund will also provide BPI with the ability to exchange the BP Canada GP Units for units of the Fund (“Units”)
under certain circumstances in the future (the “Exchange Rights”). Together, the Acquisition, the Investment and
the provision of Exchange Rights represent the “Transaction”.
We also understand that BPI and related parties own securities currently exchangeable into 2,228,970, or
approximately 12.6%, of the Units on a fully diluted basis, and that the balance of the Units are held by, collectively,
unitholders other than BPI, any related party of BPI (within the meaning of Multilateral Instrument 61-101 –
Protection of Minority Security Holders in Special Transactions (“MI 61-101”), and subject to the exceptions set out
therein), any interested party to the Transaction (within the meaning of MI 61-101) or any person that is a joint
actor with any of the foregoing (for the purposes of MI 61-101) (the “Public Unitholders”). We further understand
that, after giving effect to the Transaction, BPI’s indirect ownership interest in the Fund will increase by 752,387
Units, and that, after giving effect to the issuance of Units that would be issued by the Fund to partially fund the
Transaction, BPI would hold securities exchangeable into 12.7% of the Units on a fully diluted basis.
A special committee comprised of the independent trustees of the Fund (the “Special Committee”) has been
formed to, among other matters, review the Transaction and provide a recommendation with respect to the
Transaction to unitholders of the Fund.
Page | 2
The Special Committee has determined that the Transaction is subject to MI 61-101, which will require the
approval of Public Unitholders, the preparation of a formal valuation (the “Valuation”, as defined in MI 61-101) of
the assets being acquired by the Fund, being, through the Investment and Exchange Rights, the 1.5% Revenue
Share (the “Acquired Asset”), and the inclusion of the Valuation or a summary thereof in the management
information circular (the “Information Circular”) to be sent by the Fund to its unitholders in connection with the
special meeting of unitholders to be held to consider the Transaction (the “Special Meeting”).
The Special Committee, on behalf of and for the benefit of the Fund, has retained Fort Capital to provide it with
advice in evaluating the Transaction, including the preparation and delivery of the Valuation and an opinion (the
“Fairness Opinion”) as to whether the cash and non-cash consideration payable to BPI pursuant to the Transaction
is fair, from a financial point of view, to the Public Unitholders.
We understand that all of the material terms and risks associated with the Transaction will be described in the
Information Circular, which will be prepared by the Fund in compliance with applicable laws, regulations, policies
and rules.
All dollar amounts herein are expressed in Canadian dollars.
Engagement of Fort Capital
Fort Capital was first contacted by BPF regarding a potential assignment on December 19, 2014. By letter
agreement dated December 30, 2014 (the “Engagement Agreement”), the Special Committee retained us to
provide advice with respect to the Transaction and to prepare and deliver the Valuation and the Fairness Opinion.
The Engagement Agreement provides for the payment to us of a retainer fee, monthly work fees and payment
upon the delivery of this Valuation and Fairness Opinion to the Special Committee. None of the fees payable to
us under the Engagement Agreement are contingent upon the conclusions reached by us in either the Valuation
or the Fairness Opinion, or upon the completion of the Transaction.
In addition, the Fund has agreed to reimburse us for our reasonable expenses and to indemnify us in respect of
certain liabilities that might arise out of our engagement. The fees payable to us pursuant to the Engagement
Agreement are not financially material to us. No understandings or agreements exist between us and either the
Fund or BPI with respect to future financial advisory or investment banking business.
Fort Capital consents to the inclusion of this Valuation and Fairness Opinion in its entirety and a summary thereof
in the Information Circular and to the filing thereof by the Fund with the securities commissions or similar
regulatory authorities in each province of Canada.
Credentials of Fort Capital
Fort Capital is an independent investment banking firm which provides financial advisory services to corporations,
business owners, and investors. Our professionals have experience in preparing valuations and fairness opinions,
and have a developed knowledge of the royalty restaurant model, generally, and the Fund, specifically, through
direct involvement in past transactions. The Valuation was prepared under the direction of a partner who is a

Page | 3
Chartered Business Valuator and the Valuation conforms to Practice Standard 110 of the Canadian Institute of
Chartered Business Valuators for Comprehensive Valuation Reports.
The opinions expressed herein are the opinions of Fort Capital, and the form and content hereof have been
approved for release.
Relationships with Interested Parties
We confirm that none of Fort Capital or any of our affiliated entities:
i) is an “associated or affiliated entity” or “issuer insider” (as such terms are used in MI 61-101) of BPI
(or any of its associates or affiliates);
ii) is acting as an advisor to BPI (or any of its associates or affiliates) in respect of the Transaction;
iii) is subject to any circumstance whereby our compensation depends in whole or in part on an
agreement, arrangement or understanding that gives us a financial incentive in respect of the conclusion
reached in the Valuation or the outcome of the Transaction;
iv) is or will be (i) a manager or co-manager of a soliciting dealer group for the Transaction, or (ii) a
member of a soliciting dealer group for the Transaction;
v) has any material financial interest in the completion of the Transaction;
vi) has a material financial interest in future business under any agreement, commitment or
understanding involving BPF, BPI, or any affiliate or associate of BPF or BPI;
vii) has in the past (i) had any material involvement in any evaluation, appraisal or review of the financial
condition of BPI (or any of its associates or affiliates); (ii) had any material involvement in an evaluation,
appraisal or review of the financial condition of BPF, or an associated or affiliated entity of BPF, where
such evaluation, appraisal or review was carried out at the direction or request of BPI (or any of its
associates or affiliates) or paid for by BPI (or any of its associates or affiliates); (iii) acted as a lead or co-
lead underwriter of a distribution of securities by BPI (or any of its associates or affiliates), or acted as a
lead or co-lead underwriter of a distribution of securities of BPF if the retention of the underwriter was
carried out at the direction or request of BPI (or any of its associates or affiliates) or paid for by BPI (or
any of its associates or affiliates); (iv) had a material financial interest in a transaction involving BPI (or
any of its associates or affiliates); or (v) had a material financial interest in a transaction involving BPF
other than by virtue of performing the services referred to in (ii) or (iii) above;
viii) will act as a lead or co-lead lender or manager of a lending syndicate in respect of the Transaction;
and/or
ix) is a lender of a material amount of indebtedness in a situation where BPI (or any of its associates or
affiliates) or BPF is in financial difficulty and the Transaction would reasonably be expected to have the
effect of materially enhancing the lender’s position.
Scope of Review
In connection with our preparation of this Valuation and Fairness Opinion, we have reviewed and, where we
deemed appropriate, relied upon, among other things, the following:

Page | 4
i) certain internal financial, operational, corporate and other information concerning BPI and the Fund,
including financial models and forecasts, prepared or provided by the management of BPI;
ii) supplemental information supplied by BPI, including other third party reports and analyses;
iii) discussions with the Special Committee and its advisors concerning the Transaction;
iv) the Fund’s annual reports and annual information forms for the fiscal years ending December 31, 2013,
2012, 2011, 2010 and 2009;
v) the Fund’s and BPI’s comparative audited financial statements and management’s discussion and
analysis for the fiscal years ending December 31, 2014, 2013, 2012, 2011, and 2010;
vi) the Fund’s and BPI’s interim unaudited financial statements and management’s discussion and analysis
for the quarters ending September 30, 2014, June 30, 2014, and March 31, 2014;
vii) the Fund’s annual information form dated February 6, 2015;
viii) a draft term sheet related to new credit facilities to be provided to subsidiaries of the Fund, issued by a
Canadian chartered bank on March 18, 2015;
ix) a draft of the Fund’s management information circular concerning the Transaction and related exhibits
dated March 17, 2015;
x) a draft of the BP Canada Limited Partnership Agreement between BPI and Boston Pizza Holdings Limited
Partnership (“Holdings LP”) dated March 21, 2015;
xi) a draft of the Investment Agreement, the Transfer Agreement and the Exchange Agreement (as defined
by each of same agreements) relating to the Transaction, in each case dated March 22, 2015;
xii) a draft tax memo prepared by KPMG for the Fund and BPI and reviewed by tax counsel for the Fund
dated March 20, 2015;
xiii) an executed letter from a syndicate of underwriters, offering to purchase 5,047,613 subscription
receipts (the “Subscription Receipts”) from the Fund on a “bought deal” basis dated March 23, 2015;
xiv) certain other press releases and material change reports prepared by BPF and issued to the public;
xv) a copy of the Boston Pizza Franchise Disclosure Document;
xvi) selected public market trading statistics and relevant business and financial information of BPF and other
publicly-traded entities;
xvii) selected reports published by equity research analysts and industry sources regarding BPF and other
publicly-traded entities;
xviii) certain industry reports pertaining to the restaurant industry generally, and in Canada specifically;
xix) a certificate addressed to us, dated as of the date hereof, from the Chief Executive Officer and Chief
Financial Officer of Boston Pizza GP Inc. (“BP GP”), general partner of Boston Pizza Royalties Limited
Partnership (the “Partnership”), the administrator of the Fund, as to the completeness and accuracy of
the information provided to us by the Fund and by BPI; and

Page | 5
xx) such other information, analyses, investigations and discussions as we considered necessary or
appropriate in the circumstances.
In addition to the material reviewed as set forth above, we have participated in discussions with members of BPF
and BPI senior management regarding the Transaction, BPI’s past and current business operations, and BPI’s
financial condition and business prospects, as well as the Fund’s past and current business operations and the
Fund’s financial condition and business prospects. We have also participated in discussions with members of
the Special Committee and its legal counsel regarding the Transaction, the Valuation, the Fairness Opinion, and
related matters.
To the best of our knowledge, we have not been denied access by the Fund or BPI to any information we have
requested.
Prior Valuations
The Fund has represented to us that no prior valuations, as defined in MI 61-101, of the Fund have been prepared
in the past 24 months.
Assumptions and Limitations
The Valuation and Fairness Opinion are subject to the assumptions, qualifications and limitations below.
We have relied upon, and have assumed the completeness, accuracy and fair presentation of, all financial and
other information, data, advice, opinions and representations obtained by us from public sources, or provided to
us by the Fund, BPI or their advisors, or otherwise obtained by us pursuant to our engagement, and our Valuation
and Fairness Opinion are conditional upon such completeness, accuracy and fair presentation. Without limiting
the generality of the foregoing, our descriptions in this Valuation and Fairness Opinion of the Fund and BPI and
their respective assets, businesses and operations are derived from information that we have obtained from
the Fund, BPI, or their advisors or from publicly available sources. Subject to the exercise of professional
judgment and except as expressly described herein, we have not been requested to or attempted to verify
independently the accuracy, completeness or fairness of presentation of any such information, data, advice,
opinions and representations. We have not met separately with the independent auditors of the Fund or BPI in
connection with preparing the Valuation and Fairness Opinion and we have assumed the accuracy and fair
presentation of, and relied upon, the audited financial statements and reports of the auditors therein, as well as
unaudited interim financial statements for the Fund and BPI.
With respect to the historical financial data, operating and financial forecasts and budgets provided to us and
relied upon in our financial analyses, we have assumed that they have been reasonably prepared on bases
reflecting the most reasonable assumptions, estimates and judgments of management of the Fund and BPI,
having regard to the business, plans, taxation levels, financial condition and prospects for the Fund and BPI.
We have also assumed that the Transaction will be completed substantially in accordance with the terms thereof
and in the manner described in the Information Circular and that the Information Circular will disclose all
material facts relating to the Transaction and will satisfy all applicable legal requirements.
The Fund and BPI have each represented to us, in a certificate of two senior officers of BP GP and of BPI, dated
the date hereof, among other things, that the information, data, and other material (financial or otherwise)

Page | 6
provided to us by or on behalf of the Fund and BPI, including the written information and discussions concerning
the Fund and BPI referred to above under the heading “Scope of Review” (collectively, the “Information”),
are complete and correct at the date the Information was provided to us, and that neither the Fund nor BPI has
any information or knowledge of any facts not public or otherwise specifically provided to us relating to the Fund
or BPI which would reasonably be expected to affect materially the Valuation and Fairness Opinion to be given
by us; that with the exception of forecasts, projections or estimates, the written information and written data
provided to us by or on behalf of the Fund or BPI in respect of the Fund or BPI in connection with the Transaction
is or, in the case of historical information or data, was, at the date of preparation, true and accurate in all material
respects and no additional material, data or information would be required to make the data provided to us by
the Fund or BPI not misleading in light of the circumstances in which it was prepared; and that to the extent that
any of the data referred to above is historical, there have been no changes in material facts or new material
facts since the respective dates thereof which have not been disclosed to us or updated by more current
information or data disclosed.
We are not legal, tax or accounting experts and we express no opinion concerning any legal, tax or accounting
matters concerning the Transaction or the sufficiency of this Valuation and Fairness Opinion for those purposes.
This Valuation and Fairness Opinion is rendered on the basis of securities markets, economic and general business
and financial conditions prevailing as at March 20, 2015 (the “Valuation Date”) and the conditions and prospects,
financial and otherwise, of the Fund and BPI as they are reflected in the Information and as they were represented
to us in our discussions with management of the Fund and of BPI and their respective advisors. In our analyses
and in connection with the preparation of this Valuation and Fairness Opinion, we made numerous assumptions
with respect to industry performance, general business, markets and economic conditions and other matters,
many of which are beyond the control of any party involved in the Transaction.
This Valuation and Fairness Opinion is being provided to the Special Committee for its use in considering the
Transaction and may not be relied upon by any person, other than the members of the Special Committee or
the Board of Trustees of the Fund or the Board of Directors of BP GP, or used for any other purpose, without
our prior written consent in each specific instance.
This Valuation and Fairness Opinion is not intended to be and does not constitute a recommendation to the
Special Committee as to whether they should approve the Transaction, nor as a recommendation to any
unitholder as to how to vote or act at any meeting of unitholders called for the purpose of considering the
Transaction, or as an opinion concerning the trading price or value of any securities of the Fund following the
announcement or completion of the Transaction. We do not assume any responsibility or liability for losses
incurred by any party as a result of the use this Valuation and Fairness Opinion contrary to its stated purpose and
the limitations described herein.
We believe that our financial analyses must be considered as a whole and that selecting portions of our analyses
and the factors we considered, without considering all factors and analyses together, could create a misleading
view of the process underlying the Valuation. The preparation of a valuation and fairness opinion is complex
and is not necessarily susceptible to partial analysis or summary description and any attempt to do so could lead
to undue emphasis on any particular factor or analysis.
The conclusions of our Valuation and Fairness Opinion are given as of the date hereof and, although we reserve
the right to change or withdraw the Valuation and Fairness Opinion if we learn that any of the information that

Page | 7
we relied upon in preparing the Valuation and Fairness Opinion was inaccurate, incomplete or misleading in any
material respect, we disclaim any obligation to change or withdraw the Valuation and Fairness Opinion, to advise
any person of any change that may come to our attention, or to update the Valuation and Fairness Opinion, after
the date hereof.
Overview of the Fund and Boston Pizza International
The following discussion does not purport to be a complete description of the Fund or BPI and should not be relied
upon as such. Other material information may be found in the public filings made by the Fund and BPI as part of
continuous disclosure obligations. The discussion below is intended to highlight some of the most relevant factors
pertaining to the Fund and BPI that we considered in the Valuation and Fairness Opinion.
Overview of the Fund
Boston Pizza Royalties Income Fund is a limited purpose open-ended trust established to acquire, indirectly, certain
trademarks (the “BP Rights”) and a loan to BPI. In addition to an 80% common share ownership of BP GP, the Fund indirectly
owns 100% of the Limited Partnership Units, Class A Units and Class D Units of the Partnership. The Fund does not have any
direct or indirect ownership interest in BPI.
Before the effect of the Transaction, the Fund’s sole business is carried on through the Partnership. The
Partnership is the owner of the BP Rights, which it licenses to BPI for use in BPI’s business as a franchisor of Boston
Pizza restaurants. Under the terms of the “License and Royalty Agreement” between BPI and the Partnership,
BPI pays a monthly royalty (the “4% Royalty”) to the Partnership equal to 4% of system-wide sales (net of sales
of alcohol and any discounts, the “Franchise Revenues”) from a defined pool of restaurants (the “Royalty Pool”).
The structure of the Fund effectively provides unitholders with exposure to “top-line” royalties from Boston Pizza
restaurants. All operating costs of Boston Pizza restaurants and capital investment in locations are funded by
franchisees or BPI. The Fund has no capital expenditures and incurs only administrative expenses and interest on
debt.
A key attribute of the Fund’s structure is the fact that it is a “top-line” fund. Royalty payments to the Partnership,
and therefore the Fund, are based on top-line revenue of Royalty Pool restaurants and not determined by the
profitability of either BPI or the Boston Pizza restaurants in the Royalty Pool. However, the royalty income is
based on BPI continuing to meet its obligations under the License and Royalty Agreement. Given this structure,
the ongoing success of the Fund is directly related to BPI’s ability to provide services to its franchisees.
Page | 8
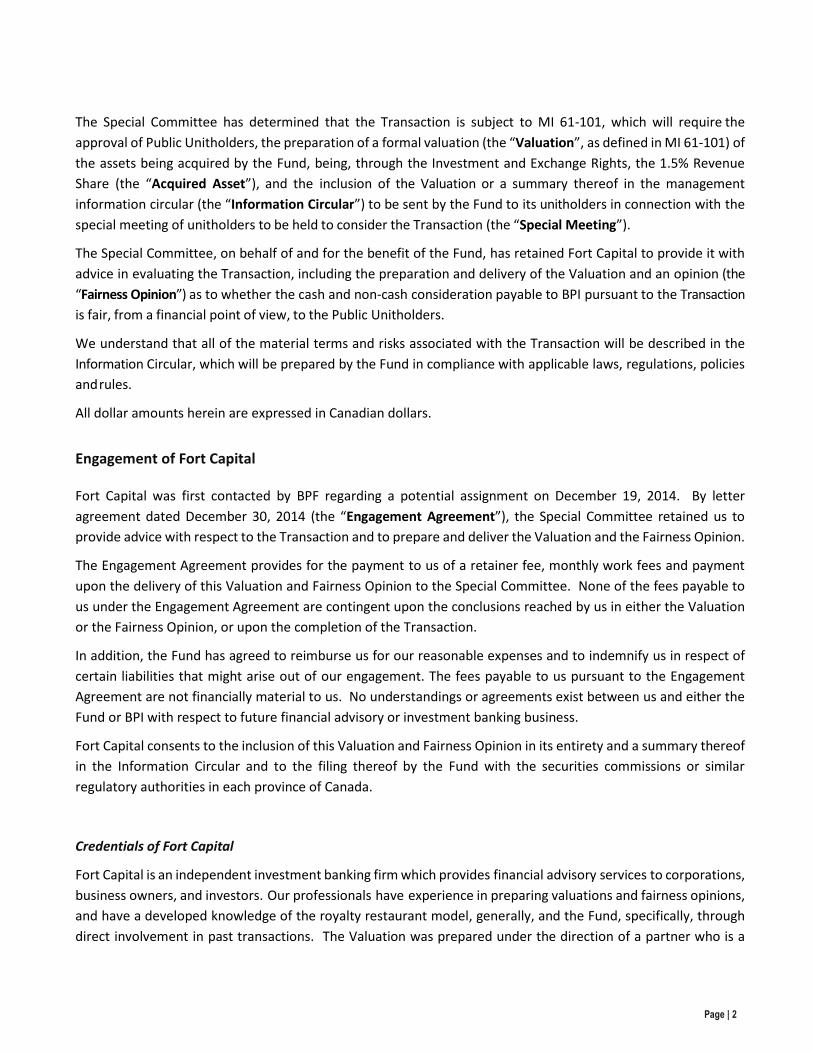
As described below, BPI’s primary revenue sources include (a) a 7% royalty paid by franchisees to BPI, the
calculation of which is based upon Franchise Revenues, and (b) supplier contributions, which are influenced by
the overall system-wide purchase volume. In addition to these revenues, BPI has the ability to earn increasing
indirect ownership of the Fund through the addition of net new stores to the Royalty Pool. BPI is entitled to
exchange its indirect interest in the Fund for Units, and is permitted to sell these Units, from time to time, which
has been a source of cash for BPI since inception of the Fund.
In turn, the Partnership’s royalty stream and growth is dependent upon BPI’s ability to (i) maintain and grow the
level of sales at restaurants within the Royalty Pool; (ii) maintain and grow the current store base, including
identifying attractive new locations; (iii) maintain the overall franchise system with regards to store level quality
and customer experience; and (iv) meet its obligations under the License and Royalty Agreement.
Figure 1- BPF Historical Financial Performance
Fiscal Year Ended and as at December 31,
(C$ thousands) 2012 2013 2014
Same Store Sales Growth 3.3% 1.5% 1.7%
Number of Restaurants Opened During the Year 7 12 14
Number of Restaurants Closed During the Year 2 2 6
Selected Income Statement Items
Royalty income $29,258 $30,217 $31,277
Interest income 1,814 1,811 1,811
Total revenue $31,072 $32,028 $33,088
Administrative expenses (1,126) (1,050) (1,022)
Interest expense on debt (941) (1,054) (1,301)
Interest expense on Class B Unit and Class C Unit liabilities (6,295) (5,525) (5,023)
Profit before fair value adjustments and income taxes $22,710 $24,399 $25,742
Fair value adjustment on Class B Unit liability (14,867) (3,424) (2,115)
Fair value adjustment on interest rate swaps 136 227 (401)
Current and deferred income tax expense (5,933) (6,389) (6,773)
Net income and comprehensive income for the year $2,046 $14,813 $16,453
Basic earnings per Unit $0.14 $0.97 $1.06
Diluted earnings per Unit $0.14 $0.97 $1.06
EBITDA
Royalty Income $29,258 $30,217 $31,277
Administrative Expenses (1,126) (1,050) (1,022)
EBITDA $28,132 $29,167 $30,255
% EBITDA Margin 96% 97% 97%
Distributions and Payout
Distributable Cash (to Public Unitholders) $17,372 $18,430 $19,072
Distributions Paid in Respect of the Year (to Public Unitholders) $17,244 $18,569 $19,055
Payout 99.3% 100.8% 99.9%
Distributable Cash Per Unit $1.184 $1.208 $1.229
Distributions Per Unit $1.170 $1.220 $1.224
Selected Balance Sheet Items
Cash $1,624 $1,493 $1,513
Debt $30,000 $42,304 $49,917
Source: BPF public disclosure

Page | 9
Trading Range and Volume of Shares
The Units are listed on the Toronto Stock Exchange (“TSX”) under the symbol BPF-UN. The following table
sets forth, for the periods indicated, the reported high and low closing prices and the aggregate volume of trading
of Units:
Source: BPF Public Disclosure and S&P Capital IQ
(1) Price and Trading Volume for the period ended March 20th, 2015
Overview of Boston Pizza International
BPI owns 100% of the Class B Units and 100% of the Class C Units of the Partnership. As of February 5, 2015, BPI’s ownership
of Class B Units represent an approximate indirect 12.6% interest in the Fund. BPI also holds voting rights through Special
Voting Units of the Fund which entitles BPI to one vote for each Unit of the Fund that BPI would be entitled to receive if it
exchanged all of its Class B Units of the Partnership for Units.
Boston Pizza International Inc. carries on business as the franchisor of casual dining pizza and pasta restaurants in
Canada, and licenses the BP Rights from the Partnership under the License and Royalty Agreement.
BPI franchises the “Boston Pizza”, “Boston Pizza Fast Casual” and the “Boston Pizza Quick Express” concepts.
Boston Pizza is a full service restaurant and sports bar concept competing in the casual dining segment. From its
start in 1964, Boston Pizza has grown to become Canada’s largest casual dining brand; with 366 restaurants as at
December 31, 2014, Boston Pizza has more locations and serves more customers annually than any other casual
dining concept in Canada.
BPI is a franchise-driven restaurant company, and operates only three Boston Pizza Restaurants as corporate
restaurants. These corporate restaurants also serve as franchisee training centres, and allow BPI to test-market
new menu items and programs before launching them throughout the BPI franchise system. BPI’s strategic focus
on the development of successful franchise operations has underpinned the success of the Boston Pizza franchise
system over the past 50 years.
The relationship between a franchisee and BPI is governed by a franchise agreement. In the standard franchise
agreement, BPI licenses a franchisee the right to operate a Boston Pizza restaurant and use the BP Rights in a
specific geographic location strictly in accordance with comprehensive standards and protocols mandated in the
franchise agreement. For this right, the franchisee is required to pay BPI a 7% royalty on Franchise Revenue,
together with other charges as specified in the franchise agreement. In addition to the 7% royalty, BPI also receives
Figure 2 - BPF Price and Trading Volume History
Boston Pizza Royalties Income Fund TSX:BPF.UN
Period High Low
Volume
(no. of Units) Period High Low
Volume
(no. of Units)
January, 2014 $21.75 $20.55 271,423 September, 2014 $21.10 $20.40 397,307
February, 2014 $21.70 $20.87 197,912 October, 2014 $21.06 $19.58 427,576
March, 2014 $21.54 $19.22 985,625 November, 2014 $22.05 $20.88 294,066
April, 2014 $20.48 $19.38 541,340 December, 2014 $21.75 $19.91 275,131
May, 2014 $20.75 $20.00 447,089 January, 2015 $22.25 $21.00 370,920
June, 2014 $20.84 $19.85 543,867 February, 2015 $23.10 $21.00 519,969
July, 2014 $20.88 $20.36 367,076 March, 2015 $23.49 $22.01 171,770
August, 2014 $21.04 $20.30 356,276
(1)

Page | 10
contributions from franchisee suppliers to be used for franchise activities. These supplier contributions are
contractual in nature and are typically dependent upon the level of purchases by franchisees (the “Supplier
Contracts”). The 7% royalty and the Supplier Contracts represent the significant majority of BPI’s total revenue;
accordingly, the overall size and scale of the franchise system is the primary determinant of revenue for BPI.
BPI provides franchisees a broad range of support services, from initial franchisee selection through real estate
advisory, finance advisory, construction and design, training, store opening support, purchasing, research and
development, corporate funded marketing initiatives, and ongoing field and IT support.
BPI works to provide its franchisees with a concept featuring low food costs, broad demographic appeal, the ability
to target multiple dayparts, the ability to provide customers take-out and delivery options, focus on a single brand
and franchise system, market flexibility, an average cheque advantage, timely concept updates, a national
marketing platform, and advantages of scale and scope. BPI maintains a significant support system, with 187
employees at December 31, 2014.
BPI’s primary revenue sources include the royalty paid by franchisees and supplier contributions. In addition to
these revenues, BPI benefits from an increase in the number of Boston Pizza restaurants and the corresponding
scale of the system, through increased royalties from franchisees (initially through retention of royalties before
inclusion into the Royalty Pool, and later through increased indirect ownership of the Fund) and the potential for
additional supplier contributions. BPI is entitled to exchange its indirect interest in the Fund for Units from time
to time, and is permitted to sell these Units, which has been a source of cash for BPI since inception of the Fund.
In five years ended January 1, 2015, BPI opened up a net 26 new stores, which were added to the Royalty Pool in
exchange for the equivalent of 1.4 million Units, worth an average of $5.4M per annum based on the trading value
of the Units on January 1st of each respective year.
Compensation and other expenses associated with the support system represents the largest expense of BPI.
Other than maintenance capital associated with the corporate owned restaurants, BPI does not have any material
ongoing capital expenditures.
The Restaurant Industry
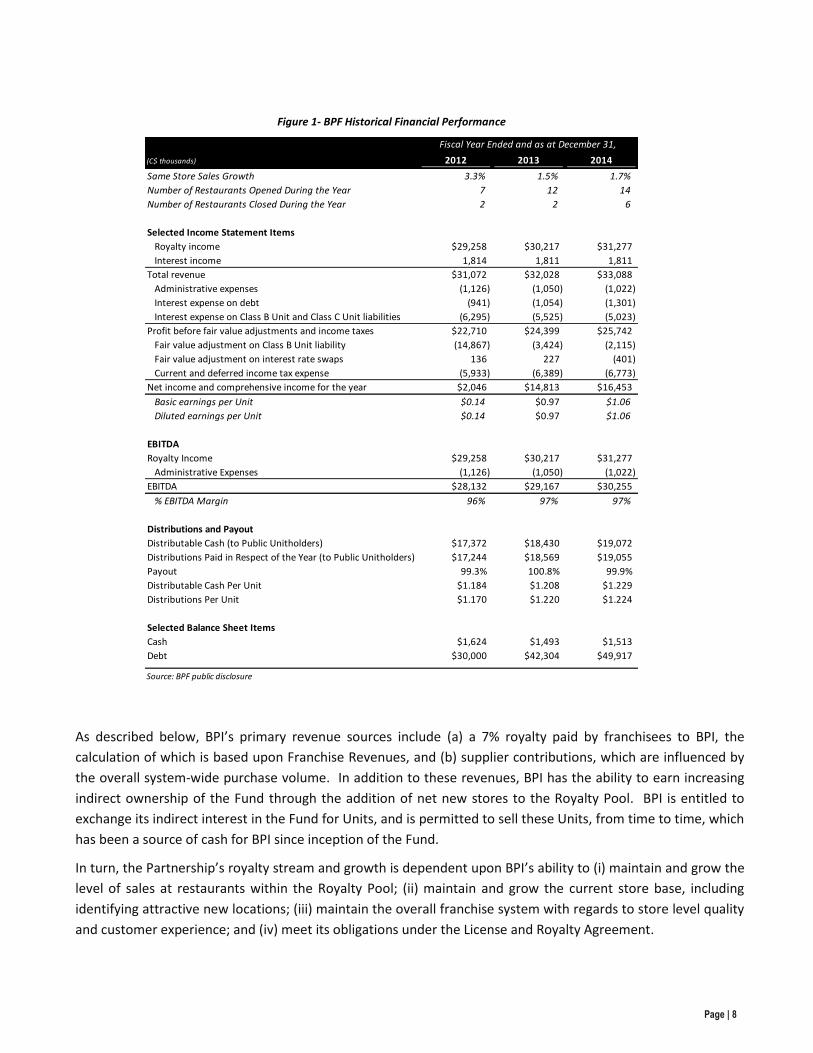
According to Restaurants Canada(1), commercial foodservice sales were projected to climb by almost 5% to $57.5
billion in 2014. Overall foodservice sales are forecast to increase by an average of 4% a year in the 2015-2018
period. Industry growth is expected to be led by caterers and quick-service restaurants (“QSRs”), although full
service restaurants will continue to see historically favourable levels of growth. Growth is expected to be led by
the Western provinces, although Ontario is expected to see a strong increase due to a rebound in exports and a
growing population.
(1) Restaurant Industry Forecast: 2014-2018, dated September 26, 2014
Page | 11
Figure 5 – Restaurant Segment Characteristics and Examples
The forecast of Restaurants Canada for 2015-2018 is based on a resumption on the long-run relationship between
foodservice sales and growth in disposable income, with foodservice sales lagging income growth slightly due to
factors including the growth experienced over the past three years and a relatively high level of household debt.
Foodservice share of the total food dollar is projected to climb to 38.1% in 2014 and, with the restaurant industry
slightly outpacing growth in the retail food sector, is forecast to climb further, to 38.6% by 2018.
The Boston Pizza chain competes in the full-service category, which can be further subdivided into three primary
segments: Family/Midscale Dining, Casual Dining, and Fine Dining.
Restaurant Segment Avg Cheque (1) Characteristics Examples
Quick Service
$24.1 billion
$5.27 Counter service
Usually specializes in one
type of food
Emphasis on take-out and
delivery
Some drive-through service
A&W
KFC
McDonald’s
Tim Horton’s
Family / Midscale Dining
$10.8 billion
$11.60 Table or self-service
Usually specializes in one
type of food
May be take-out service
Denny’s
Pizza Hut
Swiss Chalet
Casual Dining
$11.8 billion
$16.47 Full table service
Themed atmosphere
Generally limited take-out
Boston Pizza
Earl’s
East Side Mario’s
The Keg
Original Joe’s
Fine Dining
$2.2 billion
$42.77 Extensive table service
Formal table settings
Morton’s
Various independents
Figure 3 - Commercial Foodservice Sales Forecast Figure 4 - 2014-2018 Average Annual Nominal Change in Sales by Province
Source: Restaurant Industry Forecast, 2014-2018
Source: Restaurant Industry Forecast, 2014-2018
2.5%
2.6%
2.6%
2.6%
3.8%
4.0%
4.1%
4.2%
4.3%
4.3%
5.1%
- 1% 2% 3% 4% 5%
New Brunswick
P.E.I.
Quebec
Newfoundland & Labrador
Saskatchewan
Canada
Manitoba
Nova Scotia
Ontario
British Columbia
Alberta
$46.8 $47.1 $48.6 $50.0 $52.4
$54.8 $57.5 $59.8 $62.1 $64.4 $66.7
-
$10
$20
$30
$40
$50
$60
$70
2008 2009 2010 2011 2012 2013 2014F2015F2016F2017F2018F
Co
mm
erci
al F
oo
dse
rvic
e Sa
les
($B
n)
FORECAST
Source: Restaurants Canada’s Foodservice Facts 2014 Periodical and BPF public disclosure (1) Per person, 2013
Page | 12
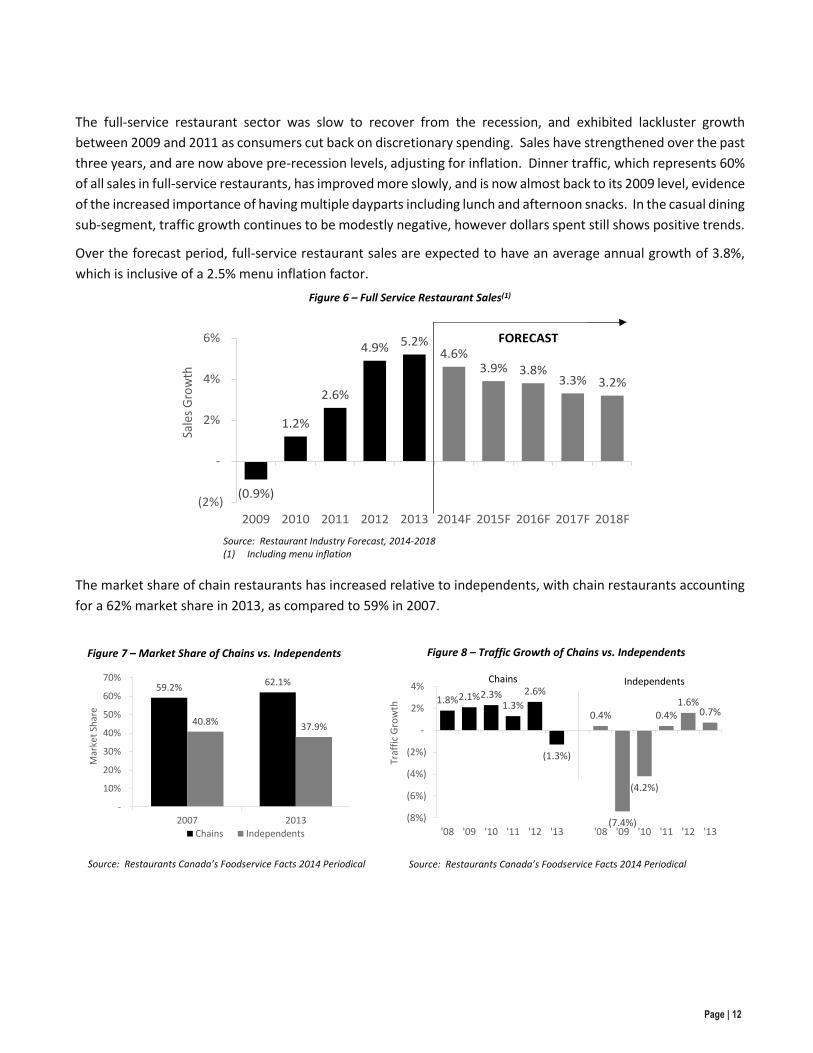
The full-service restaurant sector was slow to recover from the recession, and exhibited lackluster growth
between 2009 and 2011 as consumers cut back on discretionary spending. Sales have strengthened over the past
three years, and are now above pre-recession levels, adjusting for inflation. Dinner traffic, which represents 60%
of all sales in full-service restaurants, has improved more slowly, and is now almost back to its 2009 level, evidence
of the increased importance of having multiple dayparts including lunch and afternoon snacks. In the casual dining
sub-segment, traffic growth continues to be modestly negative, however dollars spent still shows positive trends.
Over the forecast period, full-service restaurant sales are expected to have an average annual growth of 3.8%,
which is inclusive of a 2.5% menu inflation factor.
The market share of chain restaurants has increased relative to independents, with chain restaurants accounting
for a 62% market share in 2013, as compared to 59% in 2007.
Source: Restaurant Industry Forecast, 2014-2018 (1) Including menu inflation
Figure 6 – Full Service Restaurant Sales(1)
(0.9%)
1.2%
2.6%
4.9% 5.2% 4.6%
3.9% 3.8% 3.3% 3.2%
(2%)
-
2%
4%
6%
2009 2010 2011 2012 2013 2014F 2015F 2016F 2017F 2018F
Sale
s G
row
th
FORECAST
Source: Restaurants Canada’s Foodservice Facts 2014 Periodical
Periodical
Source: Restaurants Canada’s Foodservice Facts 2014 Periodical
Figure 7 – Market Share of Chains vs. Independents Figure 8 – Traffic Growth of Chains vs. Independents
59.2% 62.1%
40.8% 37.9%
-
10%
20%
30%
40%
50%
60%
70%
2007 2013
Mar
ket
Shar
e
Chains Independents
1.8% 2.1% 2.3% 1.3%
2.6%
(1.3%)
0.4%
(7.4%)
(4.2%)
0.4% 1.6%
0.7%
(8%)
(6%)
(4%)
(2%)
-
2%
4%
'08 '09 '10 '11 '12 '13 '08 '09 '10 '11 '12 '13
Traf
fic
Gro
wth
IndependentsChains

Page | 13
The Transaction
We understand that the Fund intends to purchase, indirectly through Holdings LP, the 1.5% Revenue Share
through the purchase of Class 1 LP Units of BP Canada LP (“Class 1 LP Units”) and Class 2 LP Units of BP Canada
LP (“Class 2 LP Units”) and the provision of certain exchange rights for BP Canada GP units in BP Canada LP. BP
Canada LP will, in turn, acquire and own all of the Franchise Agreements and Supplier Contracts with respect to
the Boston Pizza system.
The Transaction will be accomplished through a series of steps:
1. BPI and Holdings LP will form BP Canada LP; BPI will initially own a single Class 6 GP Unit of BP Canada LP,
and Holdings LP will initially own a single Class 1 LP Unit.
2. BPI will transfer the Franchise Agreements, the Supplier Contracts and other assets to BP Canada LP in
exchange for BP Canada GP Units, including 100,000,000 of each of Class 2 GP Units, Class 3 GP Units, Class
4 GP Units and Class 5 GP Units, and 999 Class 6 GP Units.
3. Holdings LP will subscribe for (i) 999 Class 1 LP Units for an aggregate subscription price of $33,314,000 and
(ii) 5,047,613 Class 2 LP Units for an aggregate subscription price equal to (a) the gross proceeds of a
Subscription Receipt offering of the Fund, which we assume will be $111,552,247, less (b) $5,700,000 (the
fees and expenses relating to the Subscription Receipt offering and the Fund’s share of other expenses
related the Transaction), less (c) $514,857 (the estimated total of distribution entitlements payments
payable to holders of Subscription Receipts). The combined proceeds from the subscription of Class 1 LP
Units and Class 2 LP Units is estimated to be approximately $139M, and hereinafter referred to as the “Cash
Consideration”.
4. The Fund, BP Canada LP, and BPI, among others, will enter into an agreement (the “Exchange Agreement”)
pursuant to which the Fund will deliver, through Holdings LP, Units or cash and Units to BPI upon the
exchange of BP Canada GP Units, subject to and in accordance with the terms thereof. The Class 2 GP Units
held by BPI will be initially exchangeable into 752,387 Units upon completion of the Transaction.
5. Following completion of the Transaction, BP Canada LP will distribute returns of capital on the Class 2 GP
Units in an amount equal to the Cash Consideration.
6. From and after the date of the transfer of the Franchise Agreements and Supplier Contracts, all royalty and
other payments payable under the Franchise Agreements and all amounts payable under the Supplier
Contracts will be payable to BP Canada LP.
Assessment of Royalty Capacity
The current revenues of the Fund are dependent on the ability of BPI to meet its obligations under the License
and Royalty Agreement. We assessed the impact of the Transaction on BPI’s ability to maintain payment of the
4% Royalty on a pro forma basis, taking into consideration the following factors, among others:
1. The priority of distributions on Class 1 LP Units over all other units of BP Canada LP, as well as the priority
of Class 2 LP Units over the GP Units to be owned by BPI, the effect of which will be to reduce the cash
available to BPI to make payment of the 4% Royalty.
Page | 14
2. The new commitment of BPI to retain an indirect interest in the Fund of not less than 10% at all times
following completion of the Transaction (the “Committed Retained Interest”).
3. The potential organizational impact at BPI, as well as BPI’s opportunities to manage operating expenses,
investment or distributions.
4. The potential for any changes in the tax position of BPI following the Transaction.
We modelled the ability of BPI to make the 4% Royalty under a variety of scenarios, including downside scenarios
with respect to same store sales growth (“SSSG”) and the number of stores in the Royalty Pool. While the net
royalty payable by BPI relative to its cash generation would increase upon closing of the Transaction, we are of
the opinion that BPI will retain adequate financial capacity to service its future royalty obligations. In reaching this
conclusion, we considered the potential future cash requirements of BPI to maintain and grow the Boston Pizza
restaurant system and its ability to do so on a basis comparable to the status quo.
Formal Valuation
There is no existing market for the Class 1 LP Units and Class 2 LP Units, nor the BP Canada GP units to be issued to BPI. We
consider the relevant assets to be valued in the Transaction, and to be the subject of the Valuation, to be the interests in the
1.5% Revenue Share purchased by the Fund and retained by BPI, net of the rights of BPI to increase the Royalty Pool in the
future (the “Acquired Asset”). We believe that the Acquired Asset is directly comparable to the Fund’s current ownership in
the 4% Royalty, as discussed further below.
Definition of Fair Market Value
MI 61-101 requires the valuator to make a determination as to the fair market value (“Fair Market Value”) of the
non-cash assets involved in a related party transaction. For the purposes of the Valuation, Fair Market Value
means the monetary consideration that, in an open and unrestricted market, a prudent and informed buyer would
pay to a prudent and informed seller, each acting at arm’s length with the other, where neither party is under any
compulsion to act.
In accordance with MI 61-101, we have made no downward adjustments to the Fair Market Value of the Acquired
Asset or any non-cash consideration received by BPI to reflect liquidity, the effect of the Transaction, or the fact
that the interests do not form part of a controlling interest. A valuation prepared on the foregoing basis is referred
to as an “en bloc” valuation.
Our conclusions herein with respect to Fair Market Value are made as of the Valuation Date.
Potential Buyers
In conducting our review and analysis, we considered the likelihood of a sale of the Acquired Asset to a broader
range of potential buyers, including strategic buyers, competitors and financial or private equity buyers. We did
not identify any buyer that we believe has specific synergies or opportunities that could reasonably be expected
to result in the Acquired Asset having a higher value to such buyer.

Page | 15
Approach to Value
The Valuation is based on techniques and assumptions that we consider appropriate in the circumstances for the
purposes of arriving at an opinion as to the range of the Fair Market Value of the Acquired Asset and non-cash
consideration. The Fair Market Value of the Acquired Asset was analyzed on a going concern basis, as the Boston
Pizza franchise system is expected to continue as a going concern, and is expressed on an en bloc basis.
Valuation Methodologies
We considered the following methodologies in our valuation of the Acquired Asset:
i) discounted cash flow (“DCF”) analysis, including sensitivity to selected scenarios;
ii) comparable companies analysis; and
iii) precedent transactions analysis.
Given the direct comparability of the 4% Royalty to the 1.5% Revenue Share, including the method of calculation
(in each case referenced to Franchise Revenues within the Royalty Pool) and rights of BPI to add net growth in
restaurants and associated royalty to the Royalty Pool (with the same calculation used to determine the value and
number of Units to be associated with such increase), we believe that it is appropriate to apply a form of “with
and without” valuation, where possible, to assess the marginal impact of the Transaction on the value of assets
held by the Fund, and thus the value of the Acquired Asset.
We believe that the valuation of the Acquired Asset should consider the 1.5% Revenue Share to be subordinate
to the 4% Royalty. We come to this view despite the fact that the 1.5% Revenue Share will be distributed by BP
Canada LP (through distributions on Class 1 LP Units, Class 2 LP Units and Class 2 GP Units) in advance of
distributions of cash to BPI, and therefore before the 4% Royalty is then paid by BPI to the Fund. In this regard,
the 1.5% Revenue Share has a higher likelihood of full payment, and therefore should attract a relative valuation
that exceeds the 4% Royalty. However, it is important to recognize that the Fund’s approval is required for the
series of transactions that will give rise to the 1.5% Revenue Share, and the Fund would not approve such
transactions without creation of economic benefit for Public Unitholders. Accordingly, any negative impact of the
Transaction on the value of the 4% Royalty should be ascribed to the value, to the Fund, of the 1.5% Revenue
Share. It is for this reason that we believe that any valuation of the Acquired Asset must consider the 1.5%
Revenue Share to be subordinate to the 4% Royalty, supporting a with and without approach.
The essence of the with and without approach we have utilized is to compare the value that would be ascribed to
a combined 5.5% payment to the Fund by BP Canada LP and BPI (“with”) to the value of the 4% Royalty alone
(“without”), the difference between these values being considered to be the value of the 1.5% Revenue Share.
Discounted Cash Flow Methodology
The principal valuation methodology we have used is the DCF approach. Under this methodology, we considered
the range of value of the assets of the Fund, less the costs of the Fund, (a) with both the 4% Royalty and the 1.5%
Revenue Share, and (b) without the 1.5% Revenue Share. The difference of these two ranges of values is
considered to be the value of the 1.5% Revenue Share (including any associated increased expenses to the Fund).
The DCF approach reflects the growth prospects and risks inherent in the two related revenue streams by taking
Page | 16
into account the amount, timing, and relative certainty of the estimated future after-tax unlevered free cash flows
(“UFCF”) expected to be generated by the Fund.
The DCF approach requires that certain assumptions be made regarding, amongst other matters, UFCF, discount
rates and terminal values. The possibility that some of the assumptions will prove to be inaccurate is one factor
involved in the determination of discount rates to be used in establishing a range of values. Our DCF methodology
involved discounting the value of the UFCF for the model period through to December 31, 2024 and the terminal
value determined as of December 31, 2024.
As part of our DCF analysis, we prepared (a) a standalone model for the Fund on a status quo basis (the “Status
Quo” scenario or model, as applicable) in order to generate a range of DCF values with respect to a number of
key variables, including expected SSSG and additions to the Royalty Pool, and (b) a similar model taking into
account changes based on the Transaction (the “Pro Forma” scenario or model, as applicable), including the
impact on tax shield available to the Fund and potential incremental expenses as a result of the Transaction. We
considered a number of scenarios in arriving at our range of DCF values as described in more detail below.
Management Assumptions and Estimates
In connection with the Transaction, BPI management prepared a financial model for the purpose of reviewing the
impacts of the Transaction on both the Fund and BPI (the “BPI Model”). The BPI Model involves operating and
financial forecasts information for the ten years ending December 31, 2024.
We reviewed and considered the underlying assumptions in the BPI Model, including, but not limited to, SSSG,
net new store openings, operating expenditures of the Fund, and incremental operating expenditures associated
with the Acquired Asset. Forecasts and assumptions were compared to historical performance of the underlying
franchise system and other sources considered relevant including restaurant industry forecasts. Key assumptions
in our DCF analysis include the following:
1. We have assumed SSSG of 2.5% in each year during the 2015-2024 period. This assumption compares
with an historical ten-year SSSG average of 2.8%, and a forecast in the BPI Model of 3.0% for 2015-2018
and 2.8% for 2019-2024.
2. We have assumed an annual increase in restaurants in the Royalty Pool of nine stores, consisting of 14
store openings (with initial year sales of $2.1M per store) and 5 store closures (with sales of $1.7M per
store) in each year. This assumption compares with an historical ten-year average of 17 net store
openings, and to the addition of 10 restaurants each year in the BPI Model.
3. We have assumed operating expenses of the Fund remain at current levels in the Status Quo scenario,
and increase by $100,000 in the Pro Forma scenario; in each case we have projected that most operating
expenses increase at a rate of 2.0% per annum.
Interest Expense
Approximately $49.9M of debt is outstanding at the Partnership level. Upon completion of the Transaction, the
Fund’s credit facilities will be restructured, and the Partnership and Holdings LP will borrow a combined $83.2M.
We understand that the incremental borrowing will be at Holdings LP, and that debt outstanding at the
Partnership level will remain the same.

Page | 17
Our selected discount rates utilize the cost of borrowing identified in bank facilities that have been committed to
the Fund and available to complete the Transaction. We assume no debt for the purposes of calculating UFCF.
Income Taxes
Cash income taxes during the forecast period are based on attributable income and cash flow for each class of
units at the Partnership and BP Canada LP. The cash tax rate utilized is based on the 2015 combined federal and
blended provincial statutory rate of 26%, and our analyses reflect tax attributes including, but not limited to, usage
of cumulative eligible capital (or “CEC”) deductions generated through the purchase of the Acquired Asset and
deduction by the Fund of its expenses related to the Transaction. We have modelled the Cash Consideration as
an Eligible Capital Expenditure, and 50% of this amount is included in the CEC account of BP Canada LP; this reflects
the control BPI retains over BP Canada LP upon closing of the Transaction, which limits the balance of CEC. We
have modelled deduction of Transaction expenses over a five-year, straight line basis. Deductions in both cases
are assumed to be prorated for the number of days from closing of the Transaction to December 31, 2015.
Additional Assumptions
Given the structure and characteristics of the royalty streams, cash flows associated with the Status Quo and Pro
Forma scenarios are very similar, with notable differences including:
1. The Pro Forma model reflects higher combined revenue, equal to 5.5% of Franchise Revenues (vs. 4.0%
of Franchise Revenues in the Status Quo model).
2. Tax deductions available to the Fund differ between the scenarios as discussed above.
The resulting forecast financial performance and UFCF for the Status Quo and the Pro Forma scenarios are shown
below:
Figure 9 – Status Quo Cash Flow Forecast
Forecast Cash Flows for Valuation
(in C$ millions unless noted) 9M 2015E(1)
2016E 2017E 2018E 2019E 2020E 2021E 2022E 2023E 2024E
Same Store Sales Growth 2.5% 2.5% 2.5% 2.5% 2.5% 2.5% 2.5% 2.5% 2.5% 2.5%
Net New Store Additions 8 9 9 9 9 9 9 9 9 9
Unlevered Free Cash Flow
Royalty Income $25.8 $34.3 $36.0 $37.7 $39.5 $41.4 $43.2 $45.2 $47.1 $49.2
Less: Administrative Expenses ($0.9) ($1.2) ($1.2) ($1.2) ($1.2) ($1.2) ($1.2) ($1.2) ($1.3) ($1.3)
EBITDA $24.9 $33.1 $34.8 $36.5 $38.3 $40.1 $42.0 $43.9 $45.9 $47.9
Less: Tax ($6.2) ($8.3) ($8.8) ($9.3) ($9.7) ($10.2) ($10.7) ($11.2) ($11.8) ($12.3)
Unlevered Free Cash Flow $18.6 $24.8 $26.0 $27.3 $28.6 $29.9 $31.3 $32.7 $34.1 $35.6
% of UFCF to Current Unitholders (3) 100% 98% 96% 94% 92% 90% 88% 87% 85% 84%
Attributable UFCF $18.6 $24.2 $24.9 $25.5 $26.2 $26.9 $27.6 $28.4 $29.1 $29.9(1) Assumes transaction occurs on the Valuation Date
(2) Actual number of net new stores added to the royalty pool on Jan. 1, 2015
(3) Effective dilution from net new store additions; based on distributable cash increase due to additions assuming a 7.5% discount to the then implied value and a 26% tax rate
(2)
Page | 18
Other Adjustments to Determine UFCF
We considered the following further adjustments in the DCF approach:
1. Other than management of cash balances and the objective of the trustees of the Fund to manage a steady
level of increasing distributions, there are no significant working capital requirements at either the Fund,
Holdings LP or the Partnership level. We have not modelled a requirement to increase working capital as
operations grow.
2. Based on the structure of the Fund, Holdings LP and the Partnership, there are no expected future capital
expenditure requirements, and accordingly no capital expenditure is modelled in assessing UFCF.
Weighted Average Cost of Capital
The weighted average cost of capital (“WACC”) was calculated using our estimates of the cost of equity and after-
tax cost of debt, weighted on the basis of an assumed optimal capital structure. The assumed optimal capital
structure was determined using a review of the current and historical capital structures of publicly-traded
restaurant royalty companies/funds (or “Royalty Vehicles”(1)), proposals that the Fund has received from lenders,
and our assessment of the ability of the Fund to service debt while maintaining distributions to unitholders,
considering relative risks inherent in payment of the 4% Royalty in the Status Quo and Pro Forma scenarios. The
after-tax cost of debt was determined by estimating a 5-year rate, based on the Fund’s credit facilities and current
interest rate swap rates, and applying a combined federal and provincial tax rate of 26%.
We used two methodologies to determine the appropriate cost of equity for WACC: the “CAPM Approach” and
the “Build Up Approach”, as described below.
(1) We consider A&W Revenue Royalties Income Fund, The Keg Royalties Income Fund, Pizza Pizza Royalty Corp. and SIR Royalty Income Fund to be the royalty companies most comparable to the Fund (the “Royalty Vehicles”). Diversified Royalty Corp. is a publicly-traded company with investment in a restaurant royalty, but has a more limited history than the Royalty Vehicles and a stated business plan that includes buying multiple, uncorrelated royalties. Additionally, we considered Alaris Royalty Corp., another publicly-traded company that invests in royalties, however the nature of Alaris’ investments to date are not, in our opinion, comparable to the investments of the Fund.
Figure 10 – Pro Forma Cash Flow Forecast
Forecast Cash Flows for Valuation
(in C$ millions unless noted) 9M 2015E(1)
2016E 2017E 2018E 2019E 2020E 2021E 2022E 2023E 2024E
Same Store Sales Growth 2.5% 2.5% 2.5% 2.5% 2.5% 2.5% 2.5% 2.5% 2.5% 2.5%
Net New Store Additions 8 9 9 9 9 9 9 9 9 9
Unlevered Free Cash Flow
Royalty Income $35.2 $47.1 $49.5 $51.9 $54.3 $56.9 $59.4 $62.1 $64.8 $67.6
Less: Administrative Expenses ($1.0) ($1.3) ($1.3) ($1.3) ($1.3) ($1.3) ($1.3) ($1.4) ($1.4) ($1.4)
EBITDA $34.2 $45.9 $48.2 $50.6 $53.0 $55.5 $58.1 $60.7 $63.4 $66.2
Less: Tax ($7.5) ($10.2) ($10.9) ($11.6) ($12.3) ($13.3) ($14.1) ($14.8) ($15.6) ($16.4)
Unlevered Free Cash Flow $26.8 $35.7 $37.3 $39.0 $40.7 $42.2 $44.0 $45.9 $47.8 $49.8
% of UFCF to Current Unitholders (3) 100% 98% 96% 94% 92% 90% 89% 87% 86% 84%
Attributable UFCF $26.8 $34.9 $35.7 $36.6 $37.5 $38.2 $39.1 $40.0 $41.0 $42.1(1) Assumes transaction occurs on the Valuation Date
(2) Actual number of net new stores added to the royalty pool on Jan. 1, 2015
(3) Effective dilution from net new store additions; based on distributable cash increase due to additions assuming a 7.5% discount to the then implied value and a 26% tax rate
(2)
Page | 19
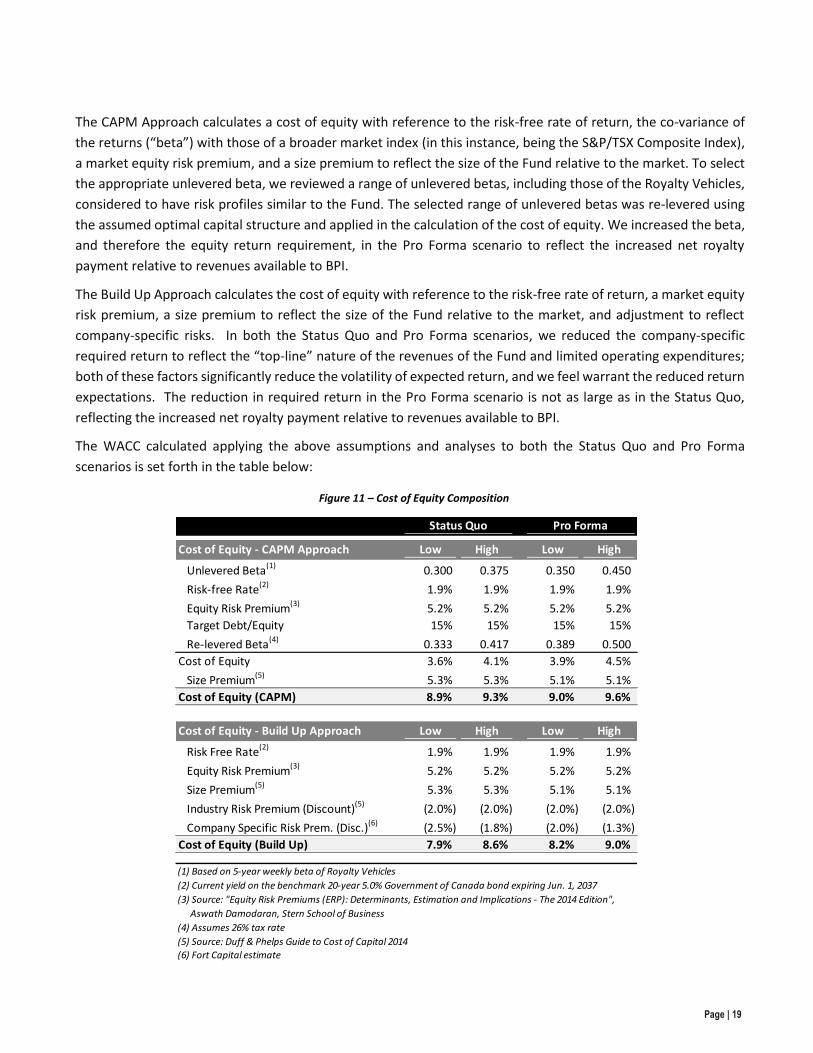
The CAPM Approach calculates a cost of equity with reference to the risk-free rate of return, the co-variance of
the returns (“beta”) with those of a broader market index (in this instance, being the S&P/TSX Composite Index),
a market equity risk premium, and a size premium to reflect the size of the Fund relative to the market. To select
the appropriate unlevered beta, we reviewed a range of unlevered betas, including those of the Royalty Vehicles,
considered to have risk profiles similar to the Fund. The selected range of unlevered betas was re-levered using
the assumed optimal capital structure and applied in the calculation of the cost of equity. We increased the beta,
and therefore the equity return requirement, in the Pro Forma scenario to reflect the increased net royalty
payment relative to revenues available to BPI.
The Build Up Approach calculates the cost of equity with reference to the risk-free rate of return, a market equity
risk premium, a size premium to reflect the size of the Fund relative to the market, and adjustment to reflect
company-specific risks. In both the Status Quo and Pro Forma scenarios, we reduced the company-specific
required return to reflect the “top-line” nature of the revenues of the Fund and limited operating expenditures;
both of these factors significantly reduce the volatility of expected return, and we feel warrant the reduced return
expectations. The reduction in required return in the Pro Forma scenario is not as large as in the Status Quo,
reflecting the increased net royalty payment relative to revenues available to BPI.
The WACC calculated applying the above assumptions and analyses to both the Status Quo and Pro Forma
scenarios is set forth in the table below:
Figure 11 – Cost of Equity Composition
Status Quo Pro Forma
Cost of Equity - CAPM Approach Low High Low High
Unlevered Beta(1) 0.300 0.375 0.350 0.450
Risk-free Rate(2) 1.9% 1.9% 1.9% 1.9%
Equity Risk Premium(3) 5.2% 5.2% 5.2% 5.2%
Target Debt/Equity 15% 15% 15% 15%
Re-levered Beta(4) 0.333 0.417 0.389 0.500
Cost of Equity 3.6% 4.1% 3.9% 4.5%
Size Premium(5) 5.3% 5.3% 5.1% 5.1%
Cost of Equity (CAPM) 8.9% 9.3% 9.0% 9.6%
Cost of Equity - Build Up Approach Low High Low High
Risk Free Rate(2) 1.9% 1.9% 1.9% 1.9%
Equity Risk Premium(3) 5.2% 5.2% 5.2% 5.2%
Size Premium(5) 5.3% 5.3% 5.1% 5.1%
Industry Risk Premium (Discount)(5) (2.0%) (2.0%) (2.0%) (2.0%)
Company Specific Risk Prem. (Disc.)(6) (2.5%) (1.8%) (2.0%) (1.3%)
Cost of Equity (Build Up) 7.9% 8.6% 8.2% 9.0%
(1) Based on 5-year weekly beta of Royalty Vehicles
(2) Current yield on the benchmark 20-year 5.0% Government of Canada bond expiring Jun. 1, 2037
(3) Source: "Equity Risk Premiums (ERP): Determinants, Estimation and Implications - The 2014 Edition",
Aswath Damodaran, Stern School of Business
(4) Assumes 26% tax rate
(5) Source: Duff & Phelps Guide to Cost of Capital 2014
(6) Fort Capital estimate
Page | 20
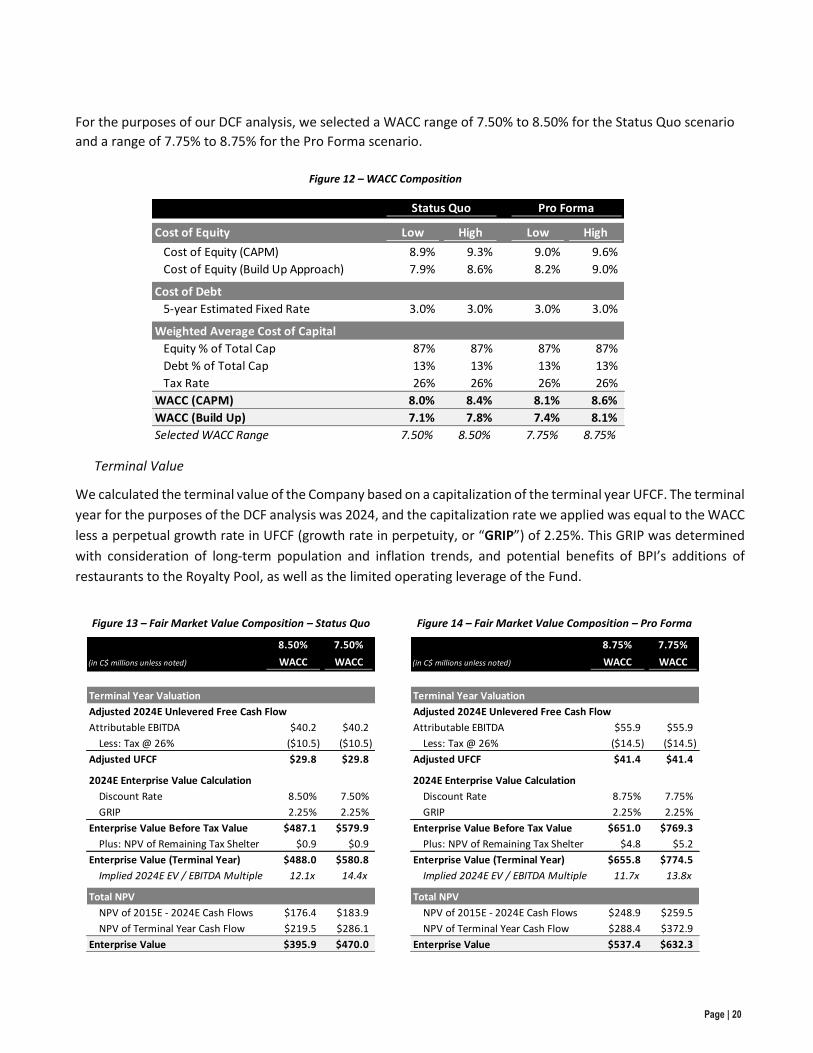
For the purposes of our DCF analysis, we selected a WACC range of 7.50% to 8.50% for the Status Quo scenario
and a range of 7.75% to 8.75% for the Pro Forma scenario.
Terminal Value
We calculated the terminal value of the Company based on a capitalization of the terminal year UFCF. The terminal
year for the purposes of the DCF analysis was 2024, and the capitalization rate we applied was equal to the WACC
less a perpetual growth rate in UFCF (growth rate in perpetuity, or “GRIP”) of 2.25%. This GRIP was determined
with consideration of long-term population and inflation trends, and potential benefits of BPI’s additions of
restaurants to the Royalty Pool, as well as the limited operating leverage of the Fund.
Figure 12 – WACC Composition
Status Quo Pro Forma
Cost of Equity Low High Low High
Cost of Equity (CAPM) 8.9% 9.3% 9.0% 9.6%
Cost of Equity (Build Up Approach) 7.9% 8.6% 8.2% 9.0%
Cost of Debt
5-year Estimated Fixed Rate 3.0% 3.0% 3.0% 3.0%
Weighted Average Cost of Capital
Equity % of Total Cap 87% 87% 87% 87%
Debt % of Total Cap 13% 13% 13% 13%
Tax Rate 26% 26% 26% 26%
WACC (CAPM) 8.0% 8.4% 8.1% 8.6%
WACC (Build Up) 7.1% 7.8% 7.4% 8.1%
Selected WACC Range 7.50% 8.50% 7.75% 8.75%
Figure 14 – Fair Market Value Composition – Pro Forma
(in C$ millions unless noted)
8.75%
WACC
7.75%
WACC
Terminal Year Valuation
Adjusted 2024E Unlevered Free Cash Flow
Attributable EBITDA $55.9 $55.9
Less: Tax @ 26% ($14.5) ($14.5)
Adjusted UFCF $41.4 $41.4
2024E Enterprise Value Calculation
Discount Rate 8.75% 7.75%
GRIP 2.25% 2.25%
Enterprise Value Before Tax Value $651.0 $769.3
Plus: NPV of Remaining Tax Shelter $4.8 $5.2
Enterprise Value (Terminal Year) $655.8 $774.5
Implied 2024E EV / EBITDA Multiple 11.7x 13.8x
Total NPV
NPV of 2015E - 2024E Cash Flows $248.9 $259.5
NPV of Terminal Year Cash Flow $288.4 $372.9
Enterprise Value $537.4 $632.3
Figure 13 – Fair Market Value Composition – Status Quo
(in C$ millions unless noted)
8.50%
WACC
7.50%
WACC
Terminal Year Valuation
Adjusted 2024E Unlevered Free Cash Flow
Attributable EBITDA $40.2 $40.2
Less: Tax @ 26% ($10.5) ($10.5)
Adjusted UFCF $29.8 $29.8
2024E Enterprise Value Calculation
Discount Rate 8.50% 7.50%
GRIP 2.25% 2.25%
Enterprise Value Before Tax Value $487.1 $579.9
Plus: NPV of Remaining Tax Shelter $0.9 $0.9
Enterprise Value (Terminal Year) $488.0 $580.8
Implied 2024E EV / EBITDA Multiple 12.1x 14.4x
Total NPV
NPV of 2015E - 2024E Cash Flows $176.4 $183.9
NPV of Terminal Year Cash Flow $219.5 $286.1
Enterprise Value $395.9 $470.0
Page | 21
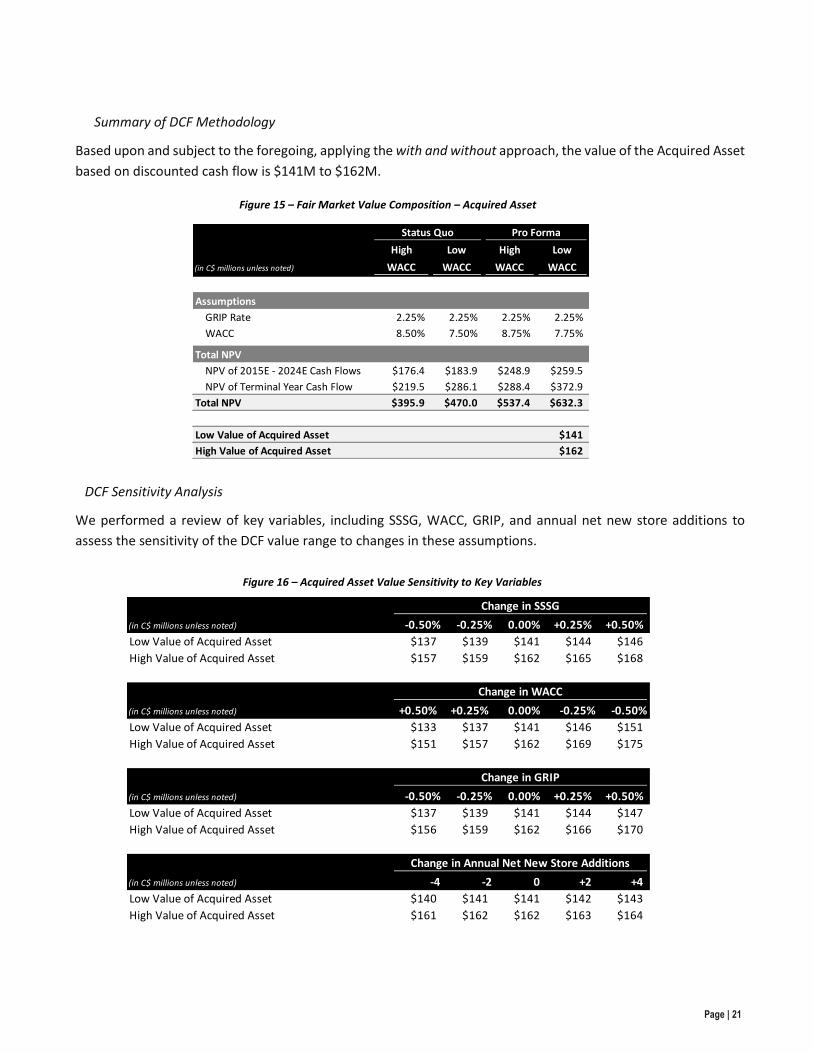
Summary of DCF Methodology
Based upon and subject to the foregoing, applying the with and without approach, the value of the Acquired Asset
based on discounted cash flow is $141M to $162M.
DCF Sensitivity Analysis
We performed a review of key variables, including SSSG, WACC, GRIP, and annual net new store additions to
assess the sensitivity of the DCF value range to changes in these assumptions.
Figure 15 – Fair Market Value Composition – Acquired Asset
Status Quo Pro Forma
(in C$ millions unless noted)
High
WACC
Low
WACC
High
WACC
Low
WACC
Assumptions
GRIP Rate 2.25% 2.25% 2.25% 2.25%
WACC 8.50% 7.50% 8.75% 7.75%
Total NPV
NPV of 2015E - 2024E Cash Flows $176.4 $183.9 $248.9 $259.5
NPV of Terminal Year Cash Flow $219.5 $286.1 $288.4 $372.9
Total NPV $395.9 $470.0 $537.4 $632.3
Low Value of Acquired Asset $141
High Value of Acquired Asset $162
Figure 16 – Acquired Asset Value Sensitivity to Key Variables
Change in SSSG
(in C$ millions unless noted) -0.50% -0.25% 0.00% +0.25% +0.50%
Low Value of Acquired Asset $137 $139 $141 $144 $146
High Value of Acquired Asset $157 $159 $162 $165 $168
Change in WACC
(in C$ millions unless noted) +0.50% +0.25% 0.00% -0.25% -0.50%
Low Value of Acquired Asset $133 $137 $141 $146 $151
High Value of Acquired Asset $151 $157 $162 $169 $175
Change in GRIP
(in C$ millions unless noted) -0.50% -0.25% 0.00% +0.25% +0.50%
Low Value of Acquired Asset $137 $139 $141 $144 $147
High Value of Acquired Asset $156 $159 $162 $166 $170
Change in Annual Net New Store Additions
(in C$ millions unless noted) -4 -2 0 +2 +4
Low Value of Acquired Asset $140 $141 $141 $142 $143
High Value of Acquired Asset $161 $162 $162 $163 $164

Page | 22
We also considered the implied internal rate of return on the marginal investment by the Fund, generated by
comparing the value range of $141M to $162M to incremental UFCF (the cash flows associated with the 1.5%
Revenue Share). We believe that the marginal return on invested capital, when reviewed in this manner, is
reasonable in the circumstances and supports the values produced applying the DCF methodology.
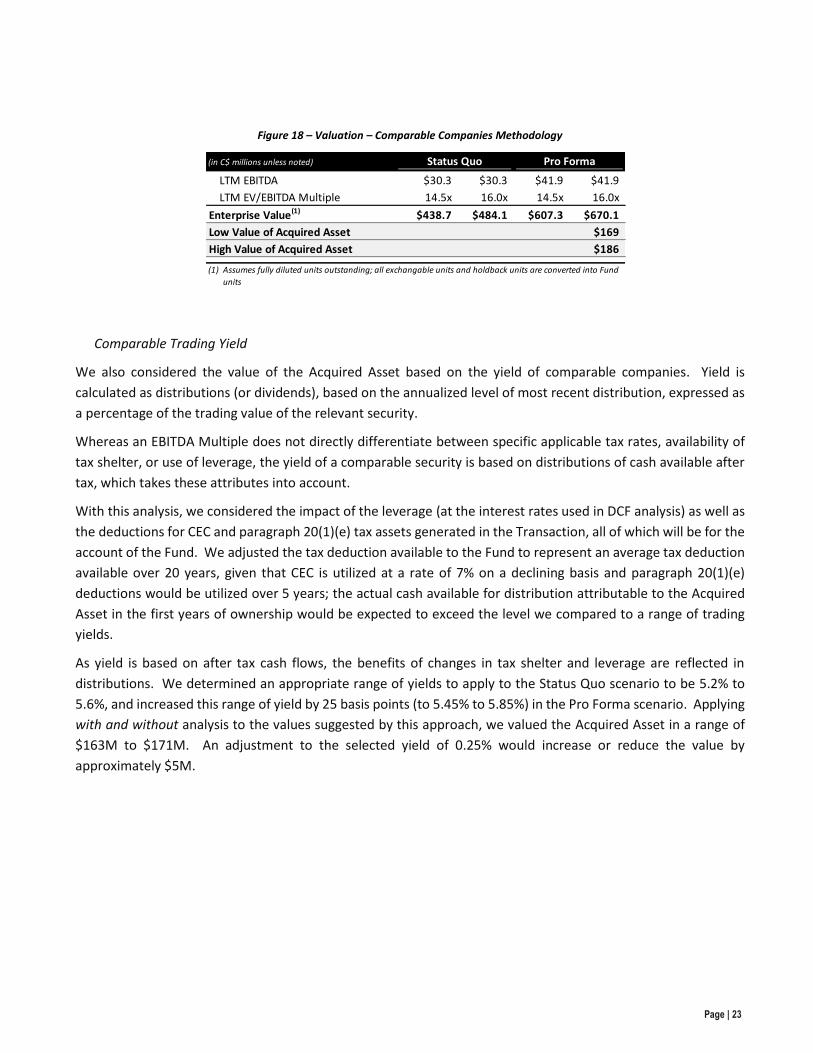
Market Trading Multiples Analysis
As a second method of determining Fair Market Value, we utilized market trading multiples analysis (also known
as comparable trading analysis) to review the Fair Market Value of the Acquired Asset. Under this approach,
financial metrics and trading multiples of select Royalty Vehicles were reviewed and applied to determine
appropriate trading multiples of the Fund. Size, market positioning, historical SSSG experience, effective tax rates
and trading yields were among the considerations in assessing relevance and comparability.
EBITDA Multiple
We reviewed the valuation of comparable companies on the basis of enterprise value (or “EV”, being the market
value of fully diluted common units or shares plus debt owed to third parties, net of cash balances) relative to
earnings before interest, taxes, depreciation and amortization (“EBITDA”). The ratio of EV to EBITDA, or “EBITDA
Multiple”, is a common basis for comparison and determination of value.
We selected a range of 14.5 to 16.0 for the EBITDA Multiple to apply to both the Status Quo and Pro Forma
scenarios, which considers differences in both the risk profile and tax assets pertaining to the scenarios, resulting
in range of value of $169M to $186M. An adjustment to EBITDA Multiple of +/-0.5 would increase or reduce the
value by approximately $6.0M.
Figure 17 – Comparable Company Trading Multiples
Unit Market Ent. EV/EBITDA P/DCPU Net Debt/ Net Debt/ Distribution & Payout
(in C$M unless otherwise noted) Price Cap.(1) Value LTM(2) 2015E LTM(2) 2015E Cap.(4) EBITDA(5) Yield(6) Payout(7) DC Yield(8)
Restaurant Royalty Companies
Boston Pizza Royalties Income Fund $22.99 $406 $455 15.0x 14.4x 18.7x 18.2x 11% 1.6x 5.3% 100% 5.3%
A&W Revenue Royalties Income Fund $28.35 $416 $476 17.0x 15.8x 19.5x 18.9x 12% 2.1x 5.0% 97% 5.1%
Pizza Pizza Royalty Corp. $14.59 $442 $485 15.0x 14.6x 18.0x n/a 9% 1.3x 5.5% 99% 5.5%
SIR Royalty Income Fund $13.44 $131 $131 8.9x 7.9x 12.3x 11.7x neg neg 8.5% 103% 8.3%
The Keg Royalties Income Fund $19.80 $290 $302 14.7x 14.2x 19.7x 19.0x 4% 0.6x 5.0% 95% 5.2%
Average 14.1x 13.4x 17.7x 17.0x 9% 1.4x 5.8% 99% 5.9%
Average Excl. SIR Royalty 15.4x 14.7x 19.0x 18.7x 9% 1.4x 5.2% 98% 5.3%
Source: Company disclosure and S&P Capital IQ; market data as at Mar. 20, 2015(1) Units/shares outstanding based on fully diluted units/shares outstanding, including exchangeable units/shares and holdback units/shares(2) Last twelve months (" LTM ") EBITDA and DCPU as at the date of the most recently reported financial statements(3) Estimates based on broker consensus average from S&P Capital IQ(4) Total equity capitalization using market value of equity(5) LTM EBITDA(6) Current yield based on most recently declared distribution(7) LTM Distributions Paid / Distributable Cash; Distributions Paid and Distributable Cash presented as reported(8) DC Yield = Distributable Cash Yield; represented by Distribution Yield / Payout
(3) (3)
Page | 23
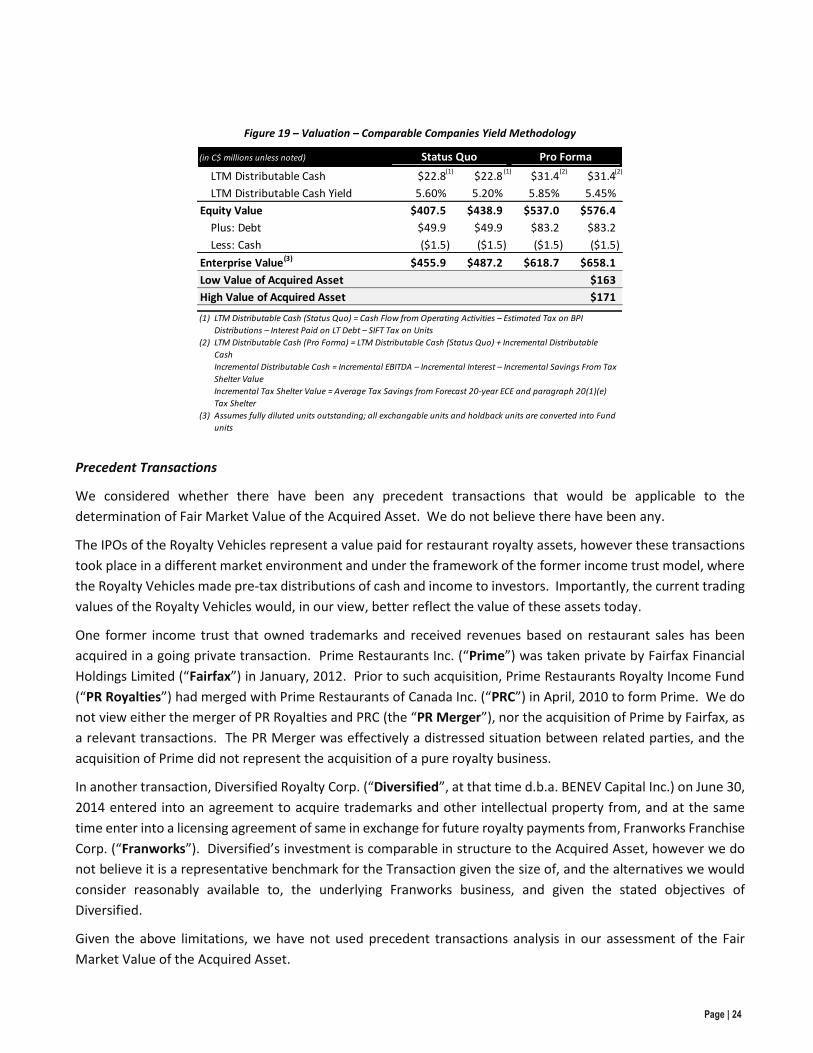
Comparable Trading Yield
We also considered the value of the Acquired Asset based on the yield of comparable companies. Yield is
calculated as distributions (or dividends), based on the annualized level of most recent distribution, expressed as
a percentage of the trading value of the relevant security.
Whereas an EBITDA Multiple does not directly differentiate between specific applicable tax rates, availability of
tax shelter, or use of leverage, the yield of a comparable security is based on distributions of cash available after
tax, which takes these attributes into account.
With this analysis, we considered the impact of the leverage (at the interest rates used in DCF analysis) as well as
the deductions for CEC and paragraph 20(1)(e) tax assets generated in the Transaction, all of which will be for the
account of the Fund. We adjusted the tax deduction available to the Fund to represent an average tax deduction
available over 20 years, given that CEC is utilized at a rate of 7% on a declining basis and paragraph 20(1)(e)
deductions would be utilized over 5 years; the actual cash available for distribution attributable to the Acquired
Asset in the first years of ownership would be expected to exceed the level we compared to a range of trading
yields.
As yield is based on after tax cash flows, the benefits of changes in tax shelter and leverage are reflected in
distributions. We determined an appropriate range of yields to apply to the Status Quo scenario to be 5.2% to
5.6%, and increased this range of yield by 25 basis points (to 5.45% to 5.85%) in the Pro Forma scenario. Applying
with and without analysis to the values suggested by this approach, we valued the Acquired Asset in a range of
$163M to $171M. An adjustment to the selected yield of 0.25% would increase or reduce the value by
approximately $5M.
Figure 18 – Valuation – Comparable Companies Methodology
(in C$ millions unless noted) Status Quo Pro Forma
LTM EBITDA $30.3 $30.3 $41.9 $41.9
LTM EV/EBITDA Multiple 14.5x 16.0x 14.5x 16.0x
Enterprise Value(1) $438.7 $484.1 $607.3 $670.1
Low Value of Acquired Asset $169
High Value of Acquired Asset $186
(1) Assumes fully diluted units outstanding; all exchangable units and holdback units are converted into Fund
units
Page | 24
Precedent Transactions
We considered whether there have been any precedent transactions that would be applicable to the
determination of Fair Market Value of the Acquired Asset. We do not believe there have been any.
The IPOs of the Royalty Vehicles represent a value paid for restaurant royalty assets, however these transactions
took place in a different market environment and under the framework of the former income trust model, where
the Royalty Vehicles made pre-tax distributions of cash and income to investors. Importantly, the current trading
values of the Royalty Vehicles would, in our view, better reflect the value of these assets today.
One former income trust that owned trademarks and received revenues based on restaurant sales has been
acquired in a going private transaction. Prime Restaurants Inc. (“Prime”) was taken private by Fairfax Financial
Holdings Limited (“Fairfax”) in January, 2012. Prior to such acquisition, Prime Restaurants Royalty Income Fund
(“PR Royalties”) had merged with Prime Restaurants of Canada Inc. (“PRC”) in April, 2010 to form Prime. We do
not view either the merger of PR Royalties and PRC (the “PR Merger”), nor the acquisition of Prime by Fairfax, as
a relevant transactions. The PR Merger was effectively a distressed situation between related parties, and the
acquisition of Prime did not represent the acquisition of a pure royalty business.
In another transaction, Diversified Royalty Corp. (“Diversified”, at that time d.b.a. BENEV Capital Inc.) on June 30,
2014 entered into an agreement to acquire trademarks and other intellectual property from, and at the same
time enter into a licensing agreement of same in exchange for future royalty payments from, Franworks Franchise
Corp. (“Franworks”). Diversified’s investment is comparable in structure to the Acquired Asset, however we do
not believe it is a representative benchmark for the Transaction given the size of, and the alternatives we would
consider reasonably available to, the underlying Franworks business, and given the stated objectives of
Diversified.
Given the above limitations, we have not used precedent transactions analysis in our assessment of the Fair
Market Value of the Acquired Asset.
Figure 19 – Valuation – Comparable Companies Yield Methodology
(in C$ millions unless noted) Status Quo Pro Forma
LTM Distributable Cash $22.8 $22.8 $31.4 $31.4
LTM Distributable Cash Yield 5.60% 5.20% 5.85% 5.45%
Equity Value $407.5 $438.9 $537.0 $576.4
Plus: Debt $49.9 $49.9 $83.2 $83.2
Less: Cash ($1.5) ($1.5) ($1.5) ($1.5)
Enterprise Value(3) $455.9 $487.2 $618.7 $658.1
Low Value of Acquired Asset $163
High Value of Acquired Asset $171
(1) LTM Distributable Cash (Status Quo) = Cash Flow from Operating Activities – Estimated Tax on BPI
Distributions – Interest Paid on LT Debt – SIFT Tax on Units
(2) LTM Distributable Cash (Pro Forma) = LTM Distributable Cash (Status Quo) + Incremental Distributable
Cash
Incremental Distributable Cash = Incremental EBITDA – Incremental Interest – Incremental Savings From Tax
Shelter Value
Incremental Tax Shelter Value = Average Tax Savings from Forecast 20-year ECE and paragraph 20(1)(e)
Tax Shelter
(3) Assumes fully diluted units outstanding; all exchangable units and holdback units are converted into Fund
units
(1) (1) (2) (2)

Page | 25
Non-Cash Consideration
BPI will receive BP Canada GP Units as consideration for the Franchise Agreements and Supplier Contracts. Upon
closing of the Transaction, BPI will receive the Cash Consideration as a return of capital on Class 2 GP Units.
In addition to the Cash Consideration, Class 2 GP Units will be granted an initial exchange right under the Exchange
Agreement entitling BPI to exchange Class 2 GP Units for 752,387 Units (the “Initial Exchange Units”) in the future.
A special voting right will provide BPI with the right to vote at meetings of the Fund as if the Initial Exchange Units
were exchanged for Units. We consider the Initial Exchange Units to be a form of non-cash consideration received
by BPI for the Acquired Asset (the “Non-Cash Consideration”).
As BPI adds net restaurants to the Royalty Pool, the distribution and exchange entitlements on Class 2 GP Units
will be increased, through a calculation that is consistent with adjustments to the Class B Units of the Partnership.
These adjustments are determined with reference to increases to the Royalty Pool, in a manner designed to
ensure such addition of royalty is of benefit to Public Unitholders. We do not consider these future adjustments
to be consideration for the Acquired Asset, and the impact of these adjustments are contemplated in our DCF and
comparable analyses.
There is no existing market for the Class 2 GP Units, however, there is a well-established and liquid market for the
Units that would be received by BPI on exchange of the Initial Exchange Units. We believe that the maximum
value of the Class 2 GP Units could be considered to be the traded value of Units on the TSX. As of the date of this
Valuation, the last trading price (“Last Trade”) for the Units was $22.99, the 20-day volume weighted average
trading price (“20-day VWAP”) of the Units was $22.78, and the Units had traded within a range of $19.22 and
$23.49 per unit over the last twelve months.
The BP Canada GP Units are entitled to distributions that may differ from the distributions on Units, however BPI
has agreed to hold BP Canada GP Units in a proportion consistent with ownership in Class B Units of the
Partnership, with the effect that the distributions to BPI on its combined retained interest will be the equivalent
to those to the Fund, on a pre-tax basis. Because the CEC deduction available to BP Canada LP will be for the
benefit of Holdings LP through its ownership of the Class 2 LP Units, we believe that the economic value of the
Initial Exchange Units will likely be lower than the proceeds that could be realized upon exchange, before
consideration of any taxes payable upon sale by BPI.
Under the terms of the Transaction, BPI has committed to retain not less than a 10% fully diluted interest in the
Fund. This commitment in itself limits the ability of BPI to realize the full potential market value of the Initial
Exchange Units; however, the Initial Exchange Units will provide an increased ability for BPI to realize value on
additional exchange entitlements in the future.
Based on the considerations above, we have valued the Non-Cash Consideration in a range of between $15.0M
and $17.7M (or $20.00 to $23.50 per Unit equivalent). This value is consistent with both the en bloc DCF value of
Units under the Status Quo and Pro Forma scenarios and trading values of the Units.

Page | 26
Distinctive Material Benefit to the Related Entity
In accordance with MI 61-101, we reviewed and considered whether any distinctive material value or benefits
would accrue to BPI as a consequence of the completion of the Transaction.
Beyond the value received as Cash Consideration and Non-Cash Consideration, if the Transaction is completed BPI
will have the opportunity to acquire additional Units through (a) increase in the net number of restaurants in the
Royalty Pool, and (b) the option to increase the effective royalty payable to the Fund through exercise of
“Incremental Revenue Options”, whereby BPI may increase cumulative proportionate payments to the Fund from
5.5% of Franchise Revenues to levels of 6.0%, 6.5% and 7.0% of Franchise Revenues.
BPI’s right to exercise an Incremental Revenue Option will be subject to financial tests designed to ensure that BPI
retains the financial capacity to make its net payments to the Fund in full. If BPI elects to exercise one or more of
these options, the Fund will at that time deliver to BPI consideration including Units and (if the parties agree at
the time) cash, and BPI will see an increase in its right to exchange BP Canada GP Units for Units. The
determination of consideration is based on a formula designed to ensure that the increased payments to the Fund
are accretive to distributable cash on per Unit, both on a basic and fully diluted basis.
The Incremental Revenue Options are difficult to value. On the one hand, there is uncertainty as to when the
option may become exercisable; there can be no assurance BPI will elect to exercise one or more Incremental
Revenue Options; and the value to be received by BPI would be a discount to then current market values (and
therefore accretive to unitholders other than BPI). On the other hand, there is value to BPI having the Incremental
Revenue Options as a path to monetize additional profitability, with lower transaction costs than incurred under
the Transaction, and on defined terms if it is able to meet the financial tests embedded in the option.
Given the discount to market embedded in the determination of consideration in the Incremental Revenue
Options, the shared benefit to the Fund and BPI (including avoided costs), and the option of the Fund to issue
Units or cash on exchange, we do not ascribe a value to the Incremental Revenue Options that would increase or
decrease our estimation of Fair Market Value of either the Acquired Asset or the Non-Cash Consideration.
Valuation Conclusion
In arriving at our opinion as to the Fair Market Value of the Acquired Asset, we have placed significant weight on
the discounted cash flow methodology, which incorporates forward estimates of management and addresses
specific attributes of the Acquired Asset, including tax shelter, that differ between comparable companies and
even the Fund on a status quo basis. We have also considered comparable trading analysis, including both EBITDA
Multiple and comparable yield analysis in arriving at our conclusion.
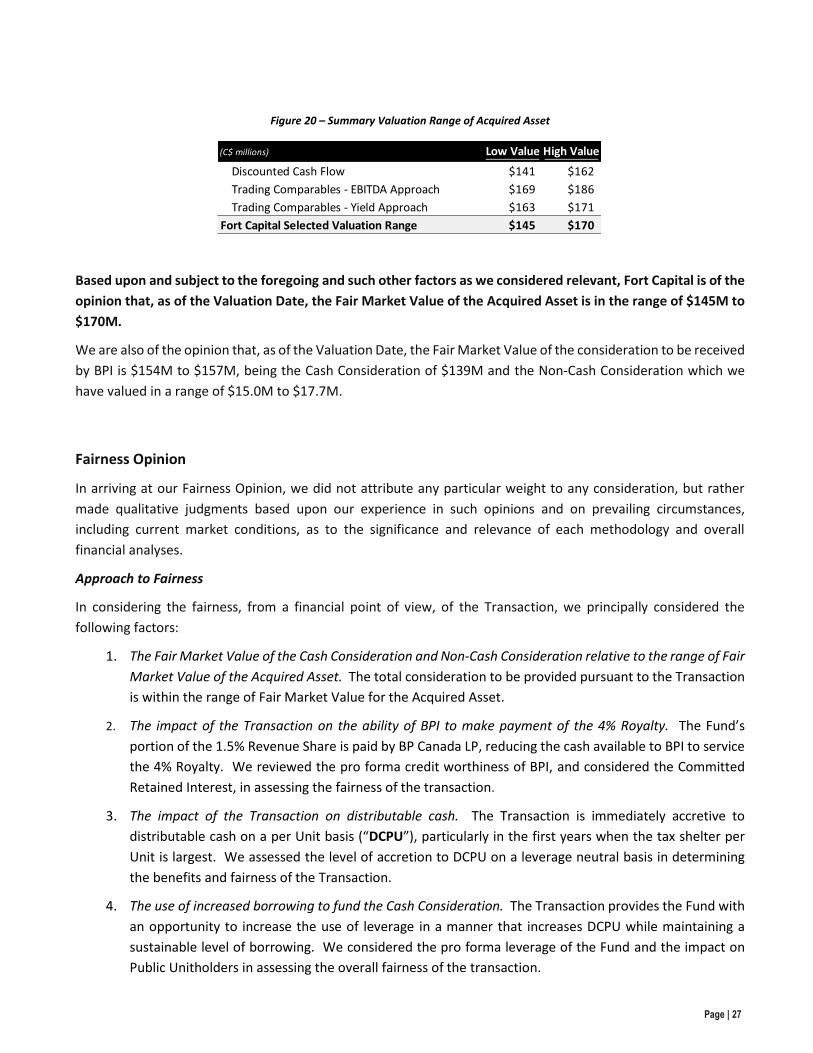
Page | 27
Based upon and subject to the foregoing and such other factors as we considered relevant, Fort Capital is of the
opinion that, as of the Valuation Date, the Fair Market Value of the Acquired Asset is in the range of $145M to
$170M.
We are also of the opinion that, as of the Valuation Date, the Fair Market Value of the consideration to be received
by BPI is $154M to $157M, being the Cash Consideration of $139M and the Non-Cash Consideration which we
have valued in a range of $15.0M to $17.7M.
Fairness Opinion
In arriving at our Fairness Opinion, we did not attribute any particular weight to any consideration, but rather
made qualitative judgments based upon our experience in such opinions and on prevailing circumstances,
including current market conditions, as to the significance and relevance of each methodology and overall
financial analyses.
Approach to Fairness
In considering the fairness, from a financial point of view, of the Transaction, we principally considered the
following factors:
1. The Fair Market Value of the Cash Consideration and Non-Cash Consideration relative to the range of Fair
Market Value of the Acquired Asset. The total consideration to be provided pursuant to the Transaction
is within the range of Fair Market Value for the Acquired Asset.
2. The impact of the Transaction on the ability of BPI to make payment of the 4% Royalty. The Fund’s
portion of the 1.5% Revenue Share is paid by BP Canada LP, reducing the cash available to BPI to service
the 4% Royalty. We reviewed the pro forma credit worthiness of BPI, and considered the Committed
Retained Interest, in assessing the fairness of the transaction.
3. The impact of the Transaction on distributable cash. The Transaction is immediately accretive to
distributable cash on a per Unit basis (“DCPU”), particularly in the first years when the tax shelter per
Unit is largest. We assessed the level of accretion to DCPU on a leverage neutral basis in determining
the benefits and fairness of the Transaction.
4. The use of increased borrowing to fund the Cash Consideration. The Transaction provides the Fund with
an opportunity to increase the use of leverage in a manner that increases DCPU while maintaining a
sustainable level of borrowing. We considered the pro forma leverage of the Fund and the impact on
Public Unitholders in assessing the overall fairness of the transaction.
Figure 20 – Summary Valuation Range of Acquired Asset
(C$ millions) Low Value High Value
Discounted Cash Flow $141 $162
Trading Comparables - EBITDA Approach $169 $186
Trading Comparables - Yield Approach $163 $171
Fort Capital Selected Valuation Range $145 $170

Page | 28
5. Potential trading benefits. We considered the potential benefit to the Fund and Public Unitholders
associated with a larger market capitalization and greater number of Units outstanding (“float”), which
could increase liquidity in the trading of Units.
In addition to the foregoing, we also considered the historical price range of the Fund and the Royalty Vehicles,
analyst target prices for the Fund and the Royalty Vehicles, as well as the impact of the Transaction on the
ownership and control on the Fund.
Fairness Opinion Conclusion
Based upon and subject to the foregoing, Fort Capital is of the opinion that, as of the date hereof, the total of
Cash Consideration and Non-Cash Consideration to be paid by the Fund, and to be received by BPI, pursuant to
the Transaction is fair, from a financial point of view, to Public Unitholders.
Yours very truly,
FORT CAPITAL CORPORATION